Embed Size (px)
Citation preview

Veterans Administration
Journal of Rehabilitation Research and Development Vol. 22 No. 3 BPR 10-42 Pages 25-41
Wheelchair tire rolling resistance and fatigue
JAMES J. KAUZLARICH, PH.13.; JOHN 6. THAGKER, PH.D. l)epal*tvl~e?~t of' Mechn~lical C L ~ Z ~ APY 'OS~~L~CP E~igi~lee'r- i~lg, u ~ d the Rehnbilitatiojl E'izgijvleer-i?lg Ce'irteq LT?/ ille~-sity qf K~girz ia , C/zarlottes tlille, Vi?gi?ria 62903
Abstract-The hysteresis loss theory of rolling resist- ance is developed for solid rubber wheelchair tires. The analysis is used to correlate test data for a clay- filled natural rubber and a polyurethane tire material. A discussion of tire rolling work, hysteresis loss factor measurement, and rolling loss measurement is pre- sented. An example calculation of rolling resistance for a polyurethane tire is given in detail. The subject of solid rubber tire design is developed on the basis of recommended fatigue life theory and practice. It is shown that polyurethane tires have a useful fatigue life due to a high shear modulus at useful values of hardness. This characteristic of polyurethane, if ex- ploited, is predicted to lead to a tire with a lower rolling resistance than other wheelchair tires availa- ble. The effect of surface roughness on rolling resist- ance is briefly discussed and some experimental results are listed. The purpose of this paper is to give the rehabilitation engineer the means for wheelchair tire rolling resistance and fatigue life design ancl the methods to assess the tire characteristics when a tire design is modified or a new tire material is eontem- plated. Other important design factors, such as wear and chemical degradation, are not discussed, but references are suggested for information on these topics. As in most research and clevelopment projects, this study raises problems which need further work. For example, the fatigue properties of the rubber compounds employed in this application are not com- pletely understood; this subject is planned for future investigation.
INTRODUCTION
The earliest recorded study of rolling devices is that of Leonardo da Vinci (16). In 1492, he
This work was supported by National Institute of Handi- capped Research Grant 600-8300-72.
investigated thrust ball and roller bearings and sliding frictional resistance usil~g an inclined plane. Da Vinci determined that his thrust bear- ing would work with low rolling resistance only If the rolling elements were kept from touching each other during operation by a separator. Prior to this date, ancient Greeks and Romans used crude rolling element bearings.
Almost 300 years latel; in 1785, Coulomb (1) experimented with cylinders made from lignurn vitae and elm rolling along oak guides. His research led to the concept that the coefficient of rolling resistance V) defined as the ratio of the driving force (F) to the normal load (P) is inversely proportional to the radius of the cylin- der (R) where k is a material constant, i.e.
Kragelsky e t al. (12) reviewed the extensive literature on rolling friction and divided the studies into those primarily concerned with 1 ) load and surface roughness, 2) microslip in the contact area that produces frictional forces, and 3) rolling resistance due to hysteresis losses associated with deformation of the material dur- ing rolling.
In a recent publication on contact mechanics, Johnson (11) developed the subject of rolling resistance. He found that the various sources of energy dissipation can be classified under the same headings as Kragelsky's (12). Johnson showed that for free rolling (i.e., no braking or tractive forces) and on flat or somewhat conform-
25

Journal of Rehabilitation Research and Development Vol. 22 No. 3 Ju ly 1985
ing surfaces, rnlcrosiip is negligible compared with the effect of inelastic deformation or hys- teresis of one or both bodies,
Roiling resistance is also a function of the sur-face roughness. The rolling resistance of a smooth, flat treadmill is significantly different than that of a typical concrete sidewalk. Mowev- enq surface rciughl~ess is neglected at first in the following analysis. Thus, it is the inelastic hys- ten-esis of the deformed material that is the main cause of rolling resistance in wheelchair tires on smooth surfaces.
Because hysteresis losses in the rubber ae- count for almost ail of the rolling losses, any surface films of oil or water will not affect these losses.
Kragelsky ('12) attributes the initial concept of hysteresis rolling loss to the French engineer, Dupuit, who developed it in 1837. However, it was the work of Tabor (69) in '6955 that produced the first analytical expressions for rolling resist- ance that were useful to the engineer. This work was further developed by Giles and Saeby (4) and Greenwood and Tabor (7): it was esseulLially completed in 1961 by Greenwood, Minshalf, and Tabor (6).
For a rigid sphere rolling on an elastic smooth surface, Greenwood et al. (6) show data that ean be correlated by the dimensionless groups
where G is the shear modulus, P is the load, Re is the equivalent radius, and ?; is the yield stress in shear. For a wheelchair tire with R the radius of the wheel and R ' the profile radius of the tire tread (see Fig. 101, an equivalent radius for Eq, 2 is given by Greenwood (5) as
Johnson (81) found "cat Eq. 2 is linear and proportional to the material loss factor for elastic materials Ghat have a yield stress up to a value of the contaet s t ress Johnson Number (6'Tr"i.q; RL) = 300. Above 90 = 300, the rolling elements are plastically deformed and the rolling resist- ance rises rapidly.
FIGURE I Top: Deflections during 'oiling of a flexible cylinder on a rigid surface. P = normal load; F = force; R = wheel radius; x, z = axes; 6 = loaded deflection, = initial deflection at center of eontaet; b = semieontact length. Boito.r?l: Wheel- chair tire footprint.
Tire materials can be elastic, where stress and strain are independent of time, or viscoelastic, where stress and strain are time dependent. To a certain extent, all tire tread materials are vis- eoeiaslie. However, a t low rolling speeds, the relaxation time constant of the material (7,) is short compared with the time (rr) for which the rolling contact is loaded; T, = d/V where d = Za, a is "ce semieontact width in the direction of rolling of the elliptical tire footprint, and V is the wheelchair velocity; Thus, when 1;, 4 7, a viseoel- astie material can be treated like an elastic material, whicf is a much simpler analysis. This is the ease for the usual wheelchair tires of compounded natural rubber or polyurethane. The ratio a,/% = Deborah Number, and De @ 1 is the ease above.
This paper studies the rolling resistance of wheelchair tires of the solid "airless" type. Pneumatic tires are more complicated to analyze since energy losses take place in the casing as well as the tread. There is extensive literature on pneumatic tires (see ref. IZa), and a comprehen- sive review is given by Schuring (17).
In this paper the equations for calculating the rolling resistance of solid tires are derived and theoretical results are compared with test data. Some design limitations for fatigue are reviewed, and the results are used to suggest improvements

KkUZLARlCH and THACKER: Tire rolling resistance
in existing wheelchair tires. Final15 the theory For small strains and smail hysteresis losses and calculations are laid out so that the wheel- during rolling, the pressure ciistribution over the chair tlre design engineer can apply them with contact region is given by the Hertz equations, ease. In the process of developing the analysis for e,g., the equation for a linear-elastic material (9, wheelchair tires, we derived several new equa- p. 377). tions following the hysteresis loss concepts of The analysis for Eq. 4 is given in AIY3ENIDIY A
Tabor and co-workers (5-7). and results in the foliotvinp equation for rolling resistance
THEORY
Rolling Work
When a solid elastic tiire is first compressed on a rigid surface due t o a normal load P: the initial deflec"con a t the center of contact is shown in Figure 1 as 6,,. The rubber is essentially bicorn- pressihle, and the tire bulges slightly and i s deflected so that &he treacl contacts the surpace between t b, as shown. Xow when the tlre rolls under the influence of the force I", each element of tread that comes into eontact with the surface carries the load over the contact region between t b. Work is done on the tread as it is defleetecl by the amount 6 between + b to 0. Between 0 to - b, the tread is unloaded and does work against the contacting surface, If the work done in compressing the front half of the contact ciuring rolling is equal to the work given up by the rear half uf the iontact surface, &e To!!& iesistmce (F) would be zero. However, the tire material is not perfectly elastic. There is a loss of energy* called hysteresis loss, in the deformecl material that must be compensated by the ~ - o r / i of roiling resistance. Hysteresis loss mainly appears as heat in the tire.
It is assumed that the hysteresis losses at the hub are negligible in comparisol~ to those at the contact with "ce rigid surface since the stress at the hub is low. Furthermore, in applying the theory, id will be assumed that the hysteresis losses in the tire material at the rim of the wheel are negligible in comparison to the losses in the tire a t the point of contact with the floor.
During rolling, the elastic work energy involv- ed in deforming the tire tread between b to zero is 4 per unit distance of travel s, and a represents the fraction of energy dissipated due to material hysteresis, where a = hysteresis loss faetol; then
In Eq. 5 v is Poisson9s radio, E is the rnodiillus of elasticity, R i s the wheel raclius, 13' i s the undehrmed tread radius (see Fig. %O), P i s the load. a, is the hysteresis Loss factor in sheai; and 7ii is a constant for a given tire geumeti-.y, as described next.
The caieulation of r i l IS based on the Hertz theory For a wheelchair tire with a tire geome- t ry factor ($1 of
the value of HZ can be found -from the following pofyl~omial fit of the Hertz equations
The followia-rg example calculation clemonstrates the use of these equations for finding the roiling resistance.
Let R = 0.3048 m (12 in), R ' = 0.0234 rn (1 in), P = 490 N (110 lbfi, v = "/t, and take typical values for poiyuredbane of E = 9.6 MPa and a, = 0,15, as shown in Figures 6; and 7. From Eq. 6, calculate
Then, from Eq. 7, lit = 2.563, and F from Eq, 5 is
I
0.3048~0.0254 (1-0.5) (0.3048 i- 0.0254) 9.6 x 10
= 3.2 N (0.12 lbfl per wheel
T h s , the rolling resistance of the two war.

Journal of Rehabilitation Research and Development Vol. 22 No. 3 July 1985
wheels is 6.4 N. Assuming the front caster load is 310 N per wheel, with R = 0.1016 m (4 in), F = 3.5 N per caster wheel, the rolling resist- ance of the wheelchair with a laden weight of 1300 N (292 ibf) is F = 13.4 N (3.0 lbf). This result is in reasonable agreement with experi- mental tests on a treadmill (20).
Loss Factor
The theory of Eq. 5 for the rolling resistance assumes that the hysteresis loss factor a is a material constant. Johnson ( I I ) , Freakley and Payne (3 ) and others show that the loss factor will vary with strain (stress) for metals and rubbers and with frequency of loading and temperature for rubbers.
The hysteresis loss factor appropriate to the complex cycle of stress experienced by the mate- rial in rolling contact is not identical to that measured in either a simple tension-compression cycle or a simple shear cycle. However, Green- wood et al. (6) have proposed a way in which they may be approximately related. With this in mind, measurement of a material loss factor must be related to the temperature, strains, anci frequen- cies encountered during rolling.
One of the oldest and most often used devices for measuring dynamic properties of a material is the torsional pendulum. By using the test mate- rial as the spring and varying the mass to control the frequency, the logarithmic decrement of the decaying amplitude can be related to the loss factor. Fi jpre 2 is a typical amplitucle plot from a torsional pendulum in which the damping is due to losses in the spring test material (other losses such as windage are negligible). The curve is similar to that from a hydraulically damped spring-mass system. I t is possible to apply the logarithmic decrement theory presented by Thompson (21, p. 30). Particularly, the definition of the logarithmic decrement applicable to Figure 2 is
where / O r , / represents the absolute value of amplitude after n cycles or half-cycles have elapsed.
FIGURE 2 Top: Torsional pendulum angular amplitude (8) versus time (t). Bottom: Relation between loss factor in rolling to torsion.
The angular strain energy stored in the test material spring is
where G is the modulus of rigidity, J is the polar moment of inertia, and L is the length of the test material spring.
A. static (fixed torque) torsional loss factor is measured by calculating the loss for a half-cycle and dividing by the input energy for that half- cycle. Greenwood (5) suggests that the dynamic loss factor can be measurecl in a similar manner, by letting
Substituting Eq. 11 into Eq. 12 gives
From Eq. 10 with n = M, Eq. 13 becomes

KAUZLARlCH and THACKER: Tire rolling resistance
.8 constant T, T,,, , and w
torsional logarithmic
FIGURE 3 Torsional hysteresis loss factor and loss tangent relation
Equation 14 is used to calculate the wheelchair tire material a, used in Eq. 5 with very good results. By using Eq. 13 over several half-cycles, one can measure cx, with respect to the maximum value of stress. By varying the mass of the torsional pendulum, one can study the effect of frequency on a,. The shear stress range of interest for wheelchair tires is from 0.1 to 0.5 MPa (see data in RESULTS), and frequency ranges from zero to 100 Hz (w = 1//2a, a = 0.02 112, and V = 4 mls).
The losses in the test material spring of a torsional pendulum can also be measured by considering the phase angle of the vibration, as shown by Young (25, p. 234). In this approach, the loss tangent is related to the logarithmic decrement as
A - Tr
tan 6 = 1151
Since Eqs. 14 and 15 are related through A, the relation between as and tan 6 is shown in the plots of Figure 3.
Rollling Losses
If only the shear loss factor is used in the calculation for rolling resistance, theoretical re-
sults are found t~ be too low in compariso~i with those from experiments. Greenwood et al. (6) postulated that the losses are proportional to the square of the length of the stress path of defor- mation of the material during a cycle of loading. For a cylinder under static loading, this plane strain case gives three independent stresses 011 any element in the deformed material. Of these stresses, the shear stress T~~ and the maximum shear stress S = ?h(q - uy) contribute to energy losses. The hydrostatic pressure component of stress does not contribute to energy losses. Greenwood et al. (6) calculated the total loss stress path squared in a cycle associatecl with rolling. They determined that the total loss factor in rolling for a cylinder was 3.5 times the loss factor in pure shear. Based on test data, he found the rolling loss factor for a sphere is 2.5 times the loss factor in pure shear. This result is further discussed in APPENDIX A, and a plot of the rolling1 shear ratio for all possible cases is shown in F i ~ r e 2A.
As a further demonstration of these observa- tions, the loss stresses under a cylinder and a sphere are plotted, along with that for a torsion test, in Figure 4. The plot shows the torsion stress path used to determine a,. It also shows half of the stress path of a cylinder and a sphere along the x axis of rolling and a t a depth x in the deformed material. The depth, x , corresponds to the depth of stress .r,, the maximum orthogonal

- - --
Journal of Rehabilitation Research and Development Vol. 22 No. 3 July 1985
shear stress amplitude, e.g., see Harris (9) for q,. The equations for stress clue to loaded cylinder were from Poritsky (Is), and those for loaded sphere were from Hamilton (8). Although the curves in Figure 4 do not represent the total loss stress path, the square of the stress path shown is roughly proportional to that determined by Greenwood e t al. (6) of ti2 (torsion) : L" (sphere) : biz (cylinder) = 1 : 2.5 : 3.5.
In the case of wheelchair tires, the results given in Figure 2A show that a constant factor of 2.5 times the loss factor in shear applies. This loss factor is used in Eq. 5 for caiculatilzg roiling resistance,
EXPERBMENWL RESULTS
rials with the ability to undergo large deforma- tions and to recover quickly In the application of rubber for solid wheelchair tires, two materials are now in common use. The older material, gray mbber, is cured natural rubber reinforced with about 50 percent (by weight) microparticle clay. The newer material is polyuretha~e. Freakley and Payne (3) give a state-of-the-art review of theory and practice using rubber.
Wheelchair tire materials have a modulus of rigidity G on the order of 3 XPa; Figure 5 shows a typical stressistrain curve for rubber in tension/ compression and in shear. Figure 5 shows that the rubber is essentially a linear-elastic material in shear.
In tensionicornpresslon for eonstrained load- ing, i.e., when the test block is bonded between metal grips, the material is nonlinear. When the
Tire Properties metal grips are not bonded and lubneated, ai- The word rubber is used for a group of mate- lowing free compression, the compression stress-
FIGURE 4 Shear stress path for rolling elements at depth (z) of maximum orthogonal shear stress amplitude.

FIGURE 5 Typical stress-strain curves for wheelchair tire material and recommended maximum design stress for long fatigue life.
strain curve is also approximately linear elastic for small strain. Thus, for tire loading during rolling, which is essentially free compression and shear, the material can be treated as linear elastic,
The maximum fatigue design stress in shear and the related maximum stress for a sphere is shown in Figure 5 and is discussed under tire design (see DESIGN ,~ALUSIS),
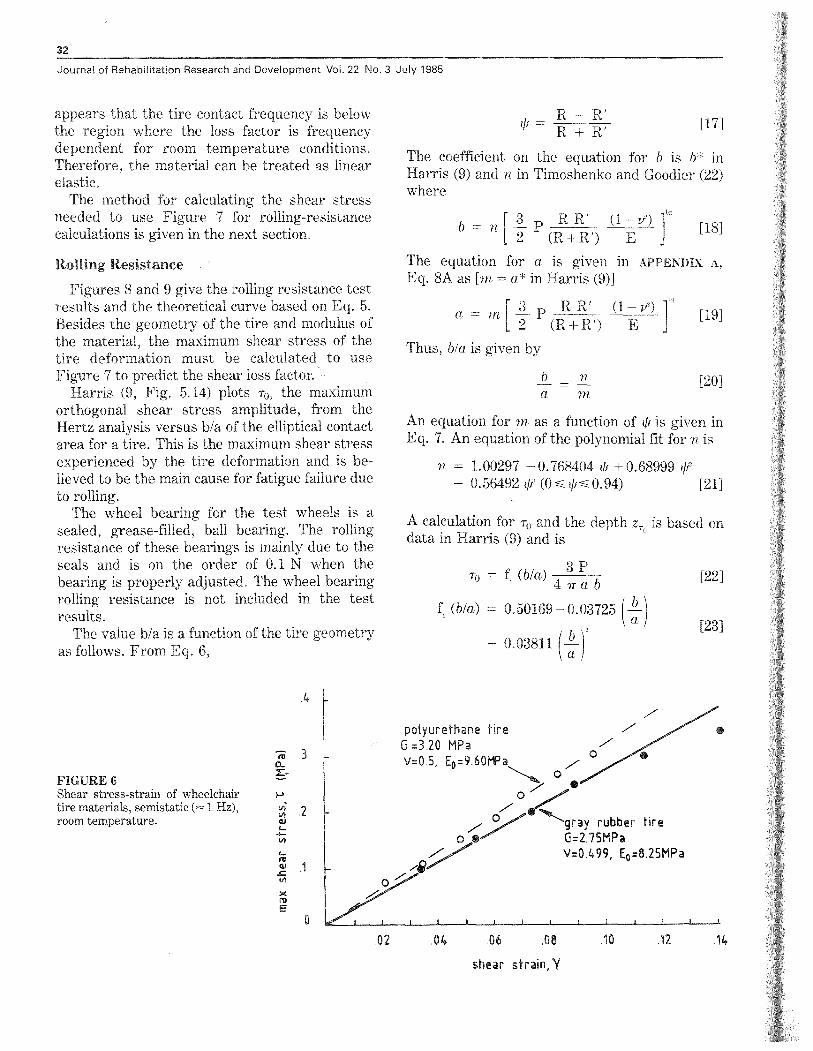
The two wheelchair tire materials tested \verse subjected to torsional stress, Tho test results are shown in the shear stress-strain plot in Figure 6 u.ith the values of G given. In general, rubber materials have a Poisson's ratio near the upper limit for materials of v = Y2. Freakley and Payne (3) give a working Poisson's ratio for cured and reinforced natural rubber of v = 0.499. The rela- tionship between G and E: for a linear-elastic matefial is
and when F' is calculated at the zero of the stress- strain curve it is noted as E,. Figure 6 shews that
the usual wheelchair tire materials have a G Z 3 MPa. Larger values of G and E would give a lower rolling resistance but make a stiffer tire.
Another property of the material r-ieecled for calculating rolling resistance is the hysteresis loss hetor in shear: A. torsional pendulum was used to measure the loss factor as outlined in the preceding section, The torslol-ial pendulum re- sults are shown in Figure 7 along -with data from the rolling resistance tests given in Figures 8 and 9. The general shape of the curves for a, is predicted by using data from Freakley and Payne (3, Fig. 3.16) and heavily weighting the rolling resistance measuremerrts indicated by a slash,
The frequency range of shear loss factor data is I to 30 Hz. Freakley and Payne give the tan 6 loss versus frequency for filled natural rubber (3, Fig, 3.3) and find that the loss factor is constant up to PO0 Hz at room temperature. Higher tern- peratures will shift the loss factor versus fre- quency curve t:, the left, reducing the range over which the loss factor is constant. Thus, at the relatively low rolling speeds of wheelchairs, it
Journal of Rehabilitation Research and Development Vol. 22 No. 3 July 1985
appears that the tire contact frequency is below the region where the loss factor is frequency dependent for room temperature conditions. The coefficient on the equation for is 6;" in Therefore, the material can be treated as linear Harris (9) and ,r in Timoshenko and Goodier (22) elastic. where
The method for calculating the shear stress needed to use Figure 7 for rolling-resistance calculations is given in the next section.
Rolling Resistance
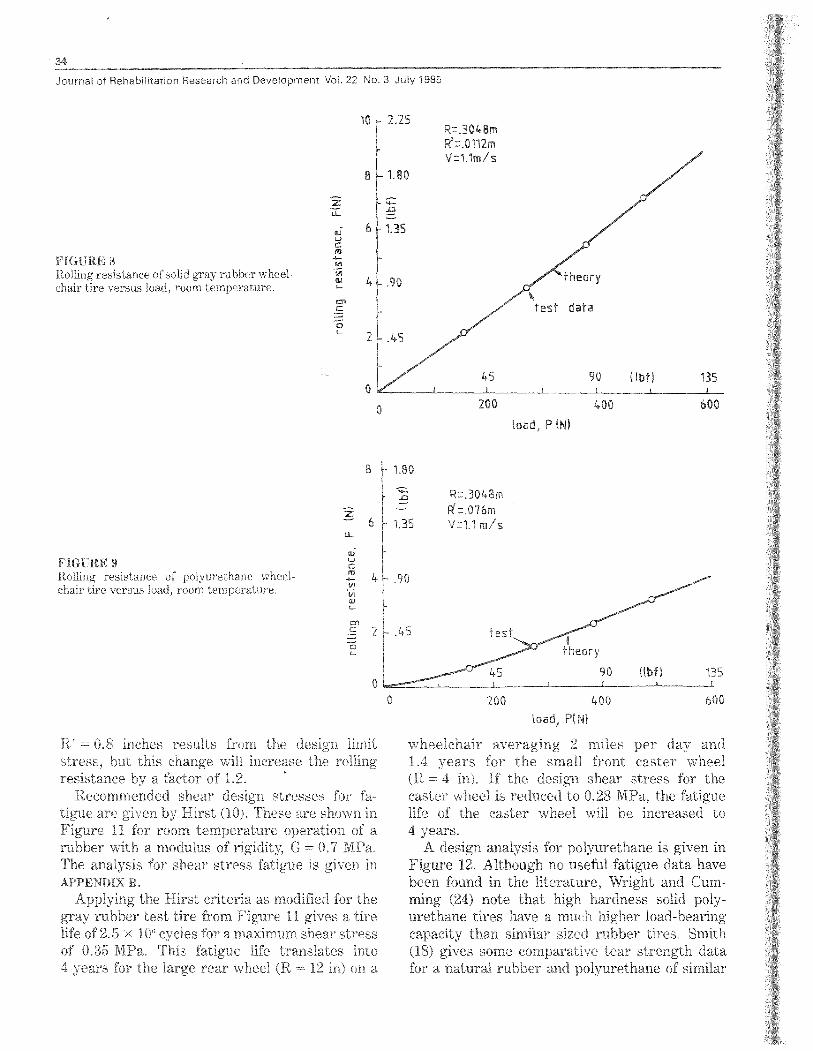
Figures 8 and 9 give the rolling resistanee test results and the theoretical curve based on Eq. 5. Besides the geometry of the tire and moclulus of the material, the maximum shear stress of the tire deformation must be calculated to use Figure 7 to predict the shear loss factor.
Harris (9, Fig. 5.14) plots TO, the maximum orthogonal shear stress amplitude, from the Hertz analysis versus bla of the elliptical contact area for a tire. This is the maximum shear stress experienced by the tire deformation and is be- lieved to be the main cause for fatigue failure due to rolling.
The wheel bearing for the test wheels is a sealed, grease-filled, ball bearing. The rolling resistance of these bearings is mainly due to the seals and is on the order of 0.1 N when the bearing is properly adjusted. The wheel bearing rolling resistance is not ineluded in the test results.
The value bia is a function of the tire geometry as follows. From Eq. 6,
FIGURE 6 Shear stress-strain of wheelchair tire materials, semistatic (= 1 Hz), room temperature.
The equation for a is given in APPEKI~IX A, Eq. 8A as [rn = a* in Harris (9)]
Thus, bla is given by
An equation for m as a function of tl, is given in Eq. 7. An equation of the polynomial fit for n is
n = 1.00297 - 0.768404 tl, + 0.68999 ir - 0.56492 $f (0 G tl, =S 0.94) i21l
A calculation for T, and the depth x;,, is based on data in Harris (9) and is
.02 .04 .06 .08 .10 .12 .1k
shear strain, Y

33
KAUZLARICH and THACKER: Tire rolling resistance
-gray rubber, \
shear s t ress (MPa)
FIGURE 7 Shear loss factor from rolling resistance and torsional pendulum tests of wheelchair tires, o = 1-30 Hz, room temperature.
and Design Analysis
The correlation of theoretical and experimental results in Figures 8 and 9 is based on predicting the shear loss factor correctly for the materials (Fig. 7). In theory, the torsional pendulum meth- od can be used to predict the shear loss factor, but based on the scatter of results by this method, a more refined torsional pendulum test than was used is needed. However, once the material is characterized for shear loss factor, the results are very valuable in predicting the effects of changes in the tire design geometry These results are discussed in the next section.
Applying the rolling resistance theory of Eq. 5 for the two materials tested, gray rubber and polyurethane, gives an insight into the effect of changes in geometry on tire performance. 111 the design of a tire tread, the tread radius (R') in the contact zone can be easily varied and will change the rolling resistance and the shear stress ( T ~ ) experienced by the tire.
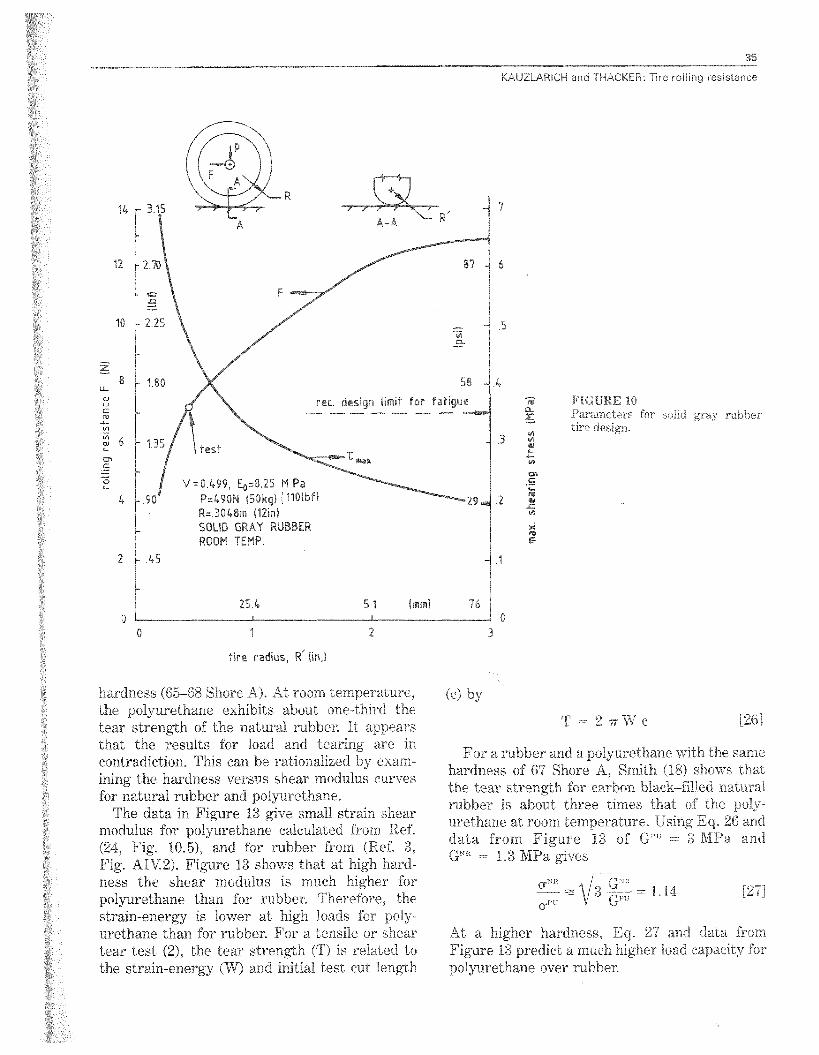
The calculation for gray rubber is given in Figure 10. The test data point is for a current wheelchair tire design. If the radius of tire profile is increased, an increase in rolling resistance is predicted. However, the shear stress will de- crease, which leads to a longer life before fat>igue cracking becomes significant. A recommended design limit for fatigue of 0.35 MPa is quoted by Freakley and Payne (3, p. 105). Based on this limit, the test tire is overstressed under the design conditions. A t i re profile radius of
34
Journal of Rehabilitation Research and Development Val. 22 No. 3 July 1985
FIGURE 8 Rolling resistance of solid gray rubber wheel- chair tire versus load. room temperature.
FIGURE 9 Railing resistance of polyurethane wheel- chair tire versus !oad, room temperature.
5
200 400 600 load, P(N1
R' = 0.8 inches results from the design limit stress, but this change will increase the rolling resistance by a facttor 06 1.2.
Recommended shear design stresses for fa- tigue are given by Hirst (10). These are shown in Figure fi for room temperature operation of a rubber with a modulus of rigidity, G = 0.7 MPa, The analysis for shear stress fatigue is given in APPENtPIX B.
Applying the Hirst criteria as modified for the gray rubber test tire from Figure 11 gives a tire life of 2.5 x 10'. cycles for a maximum shear stress of 0.35 MPa. This fatigue life translates into 4 years for the large rear wheel (R = 12 in) on a
wheelchair averaging 2 miles per day and 1.4 years for the small front caster wheel (R = 4 in). If the design shear stress for the caster wheel is reduced to 0.28 MPa, the fatigue life of the caster wheei will be increased to 4 years.
A design analysis for polyurethane is given in Fig-ure 42. Al"chsugh no useful fatigue data have been kund in the literature, Wright and Cum- rning (24) note that high hardness solid poly- urethane tires have a much higher load-bearing capacity than similar sized rubber tires. Smith (18) gives some comparative tear strength data for a natural rubber and polyurethane of similar
KAUZLARICW and THACKER: Tire rolling resistance
SOLID GRAY RUBBER x m ROOM TEMP E
f
0 1 2 3
tire radius, R' (in,)
hardness (69-68 Shore A). At room temperature, the polyurethane exhibits about one-third the tear strength of the natural rubber* It appears that the results for load and tearing are in eontradictlon. This can be rationalized by exam- ining the hardness versus shear lnodulus eurves for natural rubber and polyurethane.
The data in Figure 13 give small strain shear modulus for polyurethane calculated frorn Ref. (24, Fig. 10.5), and for rubber frorn (Ref. 3, Fig. AIV2). Figure 13 shows that at high hard- ness the shear modulus is much higher for polprethane than for rubber. Therefore, the strain-energy is lower at high Ioatls for poly- urethane than for rubber: For a tensile or shear tear test f2), the tear strength (TI is related to the strain-energy (W) and initial test cut length
FIGURE 10 Parameters for solid p a y tire design.
For a rubber and a polyurethane with the same hardness of 64 Shore A, Smith (18) shou~s that the tear strength for carbon black-filled natural rubber is about three times that of the poly- urethane at room temperature. Using Eq. 26 and data from Figure 13 of G"' = 3 MQa and 6"" = 1.3 MPa gives
At a higher hardness, Eq. 27 and data from Figure f 3 predict a much higher load capacity for polprethane over rubber*

Journal of Rehabilitation Research and Development Vol. 22 No. 3 July 1985
..'" 10" E gray rubber 8 \ polyure thane z - k
m m QJ L & V)
L ID
2 V) lo5
104 lo5 lo6 number o f cycles , N
FIGURE I1 Fatigue stress range in shear.
The data used in Eq. 21 closely corresponds to the polyurethane tire material and equivalent natural rubber used for the gray rubber tire material in the fatigue analysis in APPENDIX B. Thus, these results predict that the gray rubber and polyurethane tire materials tested should have the same fatigue characteristics as shown in Figure 11.
Applying the modified Hirst criteria in Fig- ure 11 for a four-year fatigue life, 2.5 x PO" cycles, the maximum shear stress on the large rear wheel of a wheelchair is 0.35 X Pa. For the same life the maximum shear stress for the small caster wheel is 0.28 MPa. Figure 12 shows that the tire design stress can be increased from 0.21 MPa to 0.35 MPa with a reduction in rolling resistance of 60 percent by reducing the tire cross-section radius from 3 to 1.1 in. Such an improvement in rolling resistance for the solid polprethane tire would compare very well with high-pressure pneumatic tires, which give the lowest rolling resistance measured [e.g., Thacker (20, Fig. 22)J.
Roughness
So far, the surface has been assumed to be smooth and level. Johnson (11) points out that surface irregularities increase the rolling resist- ance because 1) the roughness intensifies the real contact pressure and 2) because the rough- ness requires energy to surmount the irregu- larities.
Most of the rolling resistance tests of wheel- chairs reported used a treadmill device with a
hard belt sliding on a flat steel surface. Addi- tional tests were run to determine rolling resist- ance on other surfaces (20). The test results showed that there will be an increase in rolling resistance with respect to the treadmill by a factor of 1.55 for a relatively smooth-finishecl concrete floor and by a factor of 5.3 for a short- pile office carpet. The results clo not vary much with total laden weight up to the maximum test load of 200 Ibf (890 N) or speed up to 7 km/h (1.94 d s ) .
One needs to be aware that these mechanical losses sustained on concrete or carpet are not necessarily of the same nature as the hysteresis losses in bulk deformation of the solid tire.
DISCUSSION
One of the most important results of this analysis is that the hysteresis rolling loss theory of Tabor is found to predict the rolling resistance of solid rubber wheelchair tires. The theory and experiment are in very good agreement. The wheelchair design engineer has a tool that con- tains all of the equations and test measurements needed for optimizing solid rubber tire design with respect to rolling resistance. The subject is complicated and has a long history of contradic- tory but plausible theories. However, for linear- elastic tire materials, the hysteresis loss theory is a practical model for the rolling-resistance phe- nomenon. If the tire materials are viscoelastic, one must look at the viscoelastic rolling resist- ance theories [e.g., Moore (13)l. In most cases,

KAUZLARICH and TWACKER: Tire rolling resistance
solid polyurethane room temp.
0 1 2 3 t i re cross section radius, R' (in)
FIGURE 12 Parameters for polyurethane tire design.
highly viscoelastic materials are not favored for wheelchair tires. These materials tend to take on a deformation due to creep, which does not relax immediately and produces an audible thump on rolling.
Another important aspect of this analysis is the attempt to relate fatigue stress to tire desim. This part of the paper is based on fracture mechanics and the relations between tearing strength and fatigue of rubbers. Unfortunately, there is few experimental data available, and the fatigue behavior of the wheelchair tire materials must be inferred from the existing information on natural rubber reinforced with carbon black. This is an area in need of further analysis and testing.
An important result of the wheelchair tire design study is that theory predicts that solid polyurethane tires will give the least rolling
resistance of all current wheelchair tires. Advan- tage must be taken of the high load capacity of this material by reducing the radius of the tire profile in contact with the floor to an optimum value for the strain-energy density under load. The fatigue failure is due to shear stresses acting on flaws in the rubber. The maximum shear stress for a rolling tire occurs below the surface of the rubber, near both edges of contact. If the tire is sculptured in the area of the tread so that insufficient rubber is near the maximum shear stress regions, early failure due to crack growth may occur.
An area of tire material analysis not covered in this paper is abrasion resistance of the tire and resulting wear. Also, the effect of ozone and other chemicals is not considered. These additional topics of importance are reviewed extensively by

Journal of Rehabilitation Research and Development Vol. 22 No. 3 July 1985
FIGURE 13 Shear modulus versus hardness.
/ paly urethane /
/
hardness , shore A
Freakley and Payne (3) and Naunton (14), who Differentiating with respect to x, gives diseuss natural rubbers, and Wright and Gurn- rnings (241, who diseuss polyurethane. 6w - -- X - - -
6x R PA1
Changing sign to give the work done on the tire AIPPENDIX A material, and for a differential area dx cly as shown in
Figure IA, the work is pdx dy s x/R, where p is Rolling Resistance pressure, and the total work done in compressing the
rubber in the front half of the ellipse is Consider the elliptical tire footprint shown in
Figure 1A produced by a solid linear-elastic tire with wheel radius R, tread radius R', and a load P and
i.l-Al
rolling in the x-direction. Following the method of The pressure distribution [see Greenwood e t al. (6) or analysis in Greenwood et al. (6), consider the work
done on the tire tread when compressing the tire Harris (9, p. 124)] (note missing % in Harris) is
material in the front half of the cbntact ellipse. In moving forward a small distance s, *the change in
Y I - ( 1 - jhj [5Al
displacement w is s(6wi6x). Timoshenko and Goodier (22, p. 378) give the equation for the displacement for substituting E ~ . 5A into and integrating over the points on the surface of contact as limits from x = 0 to a, and y = - b dl - x'IaL
w = ~ - ~ x i - ~ y ~ CIA1 to b gives
By simultaneously solving the equations for (A + B) 3 P + = s - - a 16 R 26AI
and (B - A) given in Timoshenko and Goodier (22) with R, -= R' and R t R (all other radii are x ) , where he work that must be supplied is the work of G = f(v, E) Eq. 1A becomes hysteresis dissipation given by a$; thus

KAUZLARICH and THACKER: Tire rolling resistance
3 P F = a - - a 16 R i 7AI
From the Hertz theory [e.g., see Timoshenko and Goodier (22) or Harris (9)] the equation for n is
l8Al
Substituting Eq. 8A into 'iA results in
3 R R ' (1-vi) 2 ( R + R 1 ) E
where rn = f(R,R1) and is given by Eqs. 6 and 7 in THEORY.
En Eq. 9A, the hysteresis loss -factor a is impossible to rneasure for rolling elements. This problem is considered in more detail under Material Properties, However, it is fairly easy to measure the hysteresis loss factor in shear with a torsional pendulum. Greenwood e t al. (6, Fig. 16) compare their theoretical and test results and find that a in rolling is 3.4 a, for a cylinder and 2.5 a, for a sphere (6, p. 500). Ti-eating the test data (6, Fig. 16) for short cylinders as effectively giving elliptical footprints, a plot of the rollingltorsion loss factor ratio is fit to the data anci is shown in Figure 2A. Here it is shown that, for wheelchair tires, a factor of 2.5 will apply, and Eq. 9A can be reduced to the final form shown in Eq. 5 of
Equation IOA has been derived with wheelchair tires iil mind. If the tire is essentially a rolling cylinclel*, then the equation will be different from Eq. IOA. In the ease of cylinders, Greenwood e t ai. (6) have derived the appropriate equations, Howevel; as shown by Greenwood's test data, when the ratio of effective bla < 0.1 (see Fig. ZA), the test results agree with the ""long" cylinder theory; otherwise there is less agree- ment.
Rubber Fatigue
Davey and Payne (2) express the cut-growth charac- teristic of a rubber in terms of tearing energy T, the strain-energ~i per unit volume necessary to create new surfaces by tearing. Fatigue is shown to be a function of cut-growth per deformation cycle originating from
FIGURE IA Wheelchair tire footprint.
b
3 sphere 0
0 2 Ir 6 8 1 0
a
FIGURE 2A Relation between the loss factor in rolling to torsion.
small flaws in the rubber on the order of 10-" m long. Williams (23) presents an analysis for cut-growth (crack growth). He notes that crack growth takes place when the tensile andlor shear strain-energy exceeds a critical intensity in the stress field local to the crack. Crack growth is not promoted by com- pressive stresses; in fact it appears that compressive stresses inhibit crack growth (2).
In the case of solid rubber wheelchair tires, the deformation stress field only involves compression and shear stresses. Dependency on these components suggests that the fatigue failure mechanism must be a shear strain-energy effect. Following the method presented by Davey and Payne (2) for tensile fatigue failure, a shear fatigue failure equation is developed as discussed below;
After a conditioning period of cyclic loading in shear, the crack growth per cycle of loading is assumed to be a power law function of the shear strain-energy. The

40
Journal of Rehabilitation Research and Development Vol . 22 No . 3 July 1985
exponent p will be determined later. Thus,
doTT
Ko do
Williams (23) shows that the tearing energy in sheardepends on the length of the crack, c, and the shearstrain-energy per unit volume, WT, in the regionsurrounding the crack. Therefore,
T T se- 2TrWT c
[2B]
Using Eqs . (1B) and (2B), the crack growth rate is
do _ (2TIT T c) 0
do
Ko
Separating variables and integrating, gives
Ko/(p–l)n =
(2 7r WT)"
Since co is the initial crack length, co < c . The fatiguelife in terms of cycles to failure N is
K0 /(p–1)N = (2 WT)° c o p 1
A shear stress fatigue equation developed fromexperience is given by Hirst (10) . In S .I . units at roomtemperature operating conditions, the Hirst equationis
3 .7639 x 106T =
No .18
, (G = 0.69 MPa)
[6B]
Comparing Eq . 6B to 5R shows that the exponentp = 2 .78 . The theory of Eq . 5B supports the simpledesign equation suggested by Hirst where shearstress and life cycles are the significant variables.
To modify Eq. 6B for gray rubber requires someinterpretation. Naunton (14) observes that silicas areoften credited with natural rubber reinforcing abilitycomparable with carbon black . For the same percent-age of micron-size silicas, the rubber tear resistance is90 percent of that of high abrasive ' furnace (HAF)black. Abrasion resistance is only 60 percent -HAF black . The hardness and the tensile s h_
higher than that of HAF black . Gray rubber cc insabout 50 percent clay, and the corresponding naturalrubber with 50 percent carbon black would have ashear modulus on the order of 270 p .s .i . (1 .8 MPa) (2,Fig . 1 .6) . Hirst (10) gives a relative loading correctionfor G = 270 p .s .i . of 1 .3 . When applied to Eq . 6B, thisgives
4.893 x 10 6No1rs
where N is the number of cycles of loading and T is theshear stress in N/m'. Equation 7B applies to a naturalrubber reinforced with 50 percent carbon black havinga shear modulus of G = 270 p .s .i. (1 .8 MPa). It willalso be assumed to apply to gray rubber with50 percent clay having a higher shear modulus . InFigure 6, the shear data for the test gray rubber givesG = 2.75 MPa.
The gray rubber, with its higher shear modulus,should be able to carry a higher load . However, to beon the conservative side, we will assume that Eq . 7Bcan be applied to the test gray rubber material . Aprogram of testing is recommended to confirm the useof Eq. 7B for gray rubber containing 50 percent clay.
NOMENCLATURE
one-half contact length, mEquation IA, m-'contact length, mEquation 1A, mtear length, minitial tear or flaw length, mEquation 1A, m2a, mDeborah Numbermodulus of elasticity, hUm2modulus of elasticity at € = 0, N/m z
coefficient of rolling resistancerolling resistance, Nmodulus of rigidity (shear), N/m 2polar moment of inertia, m1Johnson Numberrolling resistance coefficient, mtearing coefficient, S .I . unitstorsional spring length, mcontact area coefficientcycles or contact area coefficientnumber of cyclespressure, N/m2load, Ntire radius, mequivalent radius, mtire tread profile radius at contact, mpath length, mtime, stearing strength, N/mtearing strength in shear, N/menergy, N–mvelocity, m/s
1
1c0p-1
el ..
[3B]
[4B]
[5R]
[7B]

41
KAUZLARICH and THACKER : Tire rolling resistance
w
contact displacement, mW
strain energy density, N—m/nrW,
strain energy density in shear, N-m/m`x
coordinate, my
coordinate, mz
coordinate, m
a
hysteresis loss factora~
hysteresis loss factor in sheary
shear strain8
deflection, m8o
deflection, mtan b
loss modulusstrain
0
torsional amplitude, radiansA
logarithmic decrement3 Poisson's ratioo
stress, N/m2T
shear stress, N/m"To
maximum orthogonal shear stress, N/m'Tr
d/V, sTm
relaxation time constant, sTy
yield shear stress, N/mz
T,x
shear stress, N/m'work per unit distance, N–m/mtire geometry factor
ACKNOWLEDGMENTS
We extend our appreciation to Peter J . Outzs and MehdiMostaghimi for their work in collecting and reducing muchof the experimental data.
Dr. Kauzlarich thanks the staff of the Tribology Centre,University College of Swansea, UK, for the t_2 of theirfacilities during the preparation of this pap( h alsoacknowledges with great appreciation the corr . - 3n_ oncewith James Greenwood and K.L. Johnson of
nbridgeUniversity on points of detail concerning this paper.
REFERENCES
1. COULOMB CA: Theorie des machines simples. Memoi-res de Mathematique et de Physique de l'Academie desSciences, t 10, 1785, pp . 161-331.
2. DAVEY AB, PAYNE AR : Rubber in Engineering Prac-tice, Englewood, NJ : Applied Science, 1964.
3. FREAKLEY PK, PAYNE AR : Theory and Practice of
En i>) ~ ~~y ui.th Rubber. Englewood, NJ: AppliedScienc , I
8.4. GILEs CG, S t I cY B: Rubber hysteresis and skidding
resistanc : . E n ~j ( ring 186 : 840-842, 1958.5. GREENWOOD,' A : Personal communication, Nov 1984.6. GREENWOOD JA, MINSHALL H, TABOR D : Hysteresis
losses in rolling and sliding friction . Proc Roy Soc 259-A: 480-507, 1961.
7. GREENWOOD JA, TABOR D : The friction of hard sliderson lubricated rubber : The importance of deformationlosses, Phys Soc London Proc 71 : 989-4001, 1958.
8. HAMILTON GM : Explicit equations for the stress be-neath a sliding spherical contact . Proc Inst Mc i197C: 53-54, 1983.
9 HARRIS TA : Rolling Bearing Analysis . New Y+ 'k:Wiley, 1966.
10. HIRST AJ : Practical applications of the dynamic prop-erties of rubber. In : The Applied Science of Rubber,WJS Naunton (ed .) . London : Arnold, 1961, pp . 587-708.
11. JOHNSON KL : Contact Mechanics . London : CambridgeUniversity Press, 1985.
12. KRAGELSKY IV, Doo ; `IIN MN, KoMBALOV VS : Fric-tion and Wear Culp (,ot ;3 ,, Methods . New York : Per-gamon, 1982.
12a . KYLE CR, VAN VALKLyBURG: Rolling resistance . Bicy-cling Mag . May, 1985, 140-152.
13. MOORE DF : The Friction and Lubrication of Elastorrr-ers . New York: Pergamon, 1972.
14. NAUNTON WJS(ed .) : The Applied Science of Rubber:London : Arnold, 1961.
15. PORITSKY H : Stresses and deflections of cylindricalbodies in contact with application to contact of gearsand of locomotive wheels . J Appl Mech 17 : 191-201,1950.
16. RETI L(ed .) : The Unknown Leonardo . New York:McGraw-Hill, 1974.
17. SCHURING DJ : The rolling loss of pneumatic tires.Rubber Chem Technol 53 : 600-727, 1980.
18. SMITH FM: Properties of elastomers up to 550°F.Rubber World 139 : 533-541, 1959.
19. TABOR D: Elastic work involved in rolling a sphere onanot'Uer surface Br J A, 1 ,l Phis 6 : 79-81, 1955.
20. T'A
JG : Merlon
of Wheelchair RollinResist(' we . University of Virginia Rehabilitation En ' .-neering Center Report L'nA-REC-107-83, Sept . 198
21. THOMPSON WT: Theory of 'Vibrations with Applications(2nd ed .) . Englewood Cliffs, NJ : Prentice-Hall, 1981.
22. TIMOSHENKO S, G00DIERJN : Theory of Elasticity (2nded .) . New York: McGraw-Hill, 1951.
23. WILLIAMS JG : Stress Analysis of Polymers (2nd ed .).Halstead, 1980 . (Ellis Horwood Series in EngineeringScience .)
24. WRIGHT P, CUVIMING APC : Solid Polyurethane Elas-towers . Maclaren, 1969.
25. YOUNG RJ : Introduction to Polymers . London : Chap-man & Hall, 1981 .


![Comparative Analysis of Pushrim-Activated, Power-Assisted ...d-scholarship.pitt.edu/8182/1/Thesis_Hsinyi_Liu...manual wheelchair users [4, 5]. A lighter wheelchair has lower rolling](https://img.pdfslide.net/doc/110x75/611ac9c30607cb199467ba2c/comparative-analysis-of-pushrim-activated-power-assisted-d-manual-wheelchair.jpg)