Embed Size (px)
Citation preview
8/4/2019 When Are Analyst Recommendation Changes Influential
http://slidepdf.com/reader/full/when-are-analyst-recommendation-changes-influential 1/35
When Are Analyst Recommendation
Changes Influential?
Roger K. LohLee Kong Chian School of Business, Singapore Management University
Rene M. Stulz
Fisher College of Business, Ohio State University, NBER, and ECGI
The existing literature measures the contribution of analyst recommendation changes us-
ing average stock-price reactions. With such an approach, recommendation changes can
have a significant impact even if no recommendation has a visible stock-price impact. In-stead, we call a recommendation change influential only if it affects the stock price of
the affected firm visibly. We show that only 12% of recommendation changes are influ-
ential. Recommendation changes are more likely to be influential if they are from leader,
star, previously influential analysts, issued away from consensus, accompanied by earn-
ings forecasts, and issued on growth, small, high institutional ownership, or high forecast
dispersion firms. ( JEL G14, G20, G24)
Market observers at times attribute large stock-price changes to analyst rec-
ommendation changes. For instance, according to The Wall Street Journal,Kenneth Bruce from Merrill Lynch issued a recommendation downgrade on
Countrywide Financial on August 15, 2007, questioning the giant mortgage
lender’s ability to cope with a worsening credit crunch. The report sparked a
sell-off in Countrywide’s shares, which fell 13% on that day. In another exam-
ple, when Meredith Whitney (CIBC World Markets) downgraded Citigroup on
November 1, 2007, the stock price dropped 6.9%, the CEO quit two days later,
and she apparently received death threats.1 Though the finance literature finds
that significant average abnormal returns are associated with recommendation
We thank an anonymous referee, Oya Altinkilic, Brad Barber, Francois Degeorge, Harrison Hong, Alexander
Ljungqvist (the editor), Siew Hong Teoh, Rong Wang, and Jay Ritter for many helpful comments and sug-gestions. We are also grateful to Gilbert Ho for research assistance, Thomson Financial for providing the
I/B/E/S broker translation file, and the Office of Research [Grant number C207/MSS8B010] at SingaporeManagement University for financial support. Send correspondence to Rene M Stulz, Department of Finance,806 Fisher Hall, 2100 Neil Avenue, Columbus, OH 43210, USA; telephone: (614) 292-1970. E-mails: Loh:
[email protected]; Stulz: [email protected].
1 The above examples are from the following articles: “Countrywide’s woes multiply,” by James R. Hagerty and
Ruth Simon, The Wall Street Journal, August 17, 2007, and “CIBC analyst got death threats on Citigroup,” byJonathan Stempel, Reuters, November 4, 2007.
c The Author 2010. Published by Oxford University Press on behalf of The Society for Financial Studies.All rights reserved. For Permissions, please e-mail: [email protected]:10.1093/rfs/hhq094 Advance Access publication October 15, 2010
a t E b s c o onA u g u s t 5 ,2 0 1 1
r f s . ox f or d j o ur
n al s . or g
D ownl o a d e d f r om
8/4/2019 When Are Analyst Recommendation Changes Influential
http://slidepdf.com/reader/full/when-are-analyst-recommendation-changes-influential 2/35
The Review of Financial Studies / v 24 n 2 2011
changes, the typical estimate associated with a recommendation change is too
small to be considered a significant abnormal return for the stock of a firm.
Consequently, with the typical recommendation change, investors following a
firm cannot distinguish the impact of the recommendation change from noise.
However, at times, a recommendation change, such as the Bruce call on Coun-trywide, is viewed by observers as having a large identifiable impact on the
stock price. In this article, we investigate how frequently recommendation
changes visibly impact stock prices, which we assess to be the case when a
recommendation change has a significant stock-price impact, and we try to un-
derstand better when and why analyst recommendation changes have such an
impact.
The existing literature that assesses the impact of recommendation changes
does not make it possible to answer the questions we are interested in. This
literature focuses on average effects in large samples and generally investi-gates whether some type of analyst recommendation change has a significant
average abnormal return. By averaging across a large number of announce-
ments, the researcher hopes to eliminate the influence of confounding effects
on the study and therefore to obtain an estimate of the “pure” recommendation
change effect. At the same time, however, such an approach is of little use to
evaluate claims about the ability of analysts to visibly impact stock prices of
individual firms. To wit, in our sample, the median abnormal return associated
with a downgrade is roughly −1%. For the typical firm, a −1% abnormal re-
turn is noise. However, an abnormal return of the magnitude associated withthe recommendation change of Bruce for Countrywide is a highly significant
abnormal return for the typical firm. The existing literature that focuses on
average abnormal returns does not make it possible to understand whether an-
alysts can visibly move prices or how often they do so. Such an understanding
is critical to assessing the role of analysts in generating information about firms
and in influencing investors and management. In particular, it would be hard to
argue that analysts influence investors and management systematically if they
do not visibly move prices.
Our contribution is to identify recommendation changes that are impactfulbased on stock-level abnormal returns. We define a recommendation change as
influential in returns if its associated abnormal return is in the same direction
as the recommendation change and is statistically significant. An analyst might
not affect the stock price, but she might lead investors to trade in response to
her analysis. Therefore, we also use an alternative definition of an influential
recommendation change based on turnover. With this definition, a recommen-
dation change is influential if it leads to a statistically significant increase in
turnover at the firm-level. These approaches ensure that the recommendation
changes that we eventually label as influential are indeed those that are noticedby investors following the firm.
An important component of our contribution is that we conduct our main
tests with recommendation changes that occur on days without firm-specific
594
a t E b s c o onA u g u s t 5 ,2 0 1 1
r f s . ox f or d j o ur n al s . or g
D ownl o a d e d f r om
8/4/2019 When Are Analyst Recommendation Changes Influential
http://slidepdf.com/reader/full/when-are-analyst-recommendation-changes-influential 3/35
When Are Analyst Recommendation Changes Influential?
news. Analysts often write reports on days of firm-specific news, and recom-
mendation changes on such days are more likely to be favorable if the firm
has positive news. Though the traditional event study method reduces or even
eliminates the impact of confounding news on the average abnormal return,
it does so only when news and the probability of occurrence of the event areuncorrelated. In the case of analysts, there is no reason to believe that this con-
dition holds. It is therefore important to construct a sample of recommendation
changes where the impact of confounding firm-specific news is minimized. Not
surprisingly, eliminating firm-specific news days reduces the stock-price reac-
tion to analyst recommendation changes, but the average stock-price reaction
remains statistically significant.
We find that about 12% of recommendation changes in our sample (that
minimizes the impact of firm-specific news) are influential in returns and about
13% are influential in turnover. However, about one out of four analysts neverhad any influential recommendation change. Conditional on an analyst having
an influential recommendation change, one in five of the analyst’s recommen-
dation changes are influential. This finding illustrates that influential recom-
mendation changes come only from a subset of skilled analysts and that these
influential recommendation changes are infrequent even for analysts within
this subset.
Meredith Whitney’s Citigroup downgrade on November 1, 2007, was asso-
ciated with a drop in Citigroup’s stock price of 6.9%. Yet, as a Wall Street Jour-
nalarticle recently reported, other analysts in the weeks before downgradedthe stock with reports that had similar content.2 Consequently, a recommen-
dation change is not influential simply because of its content—other factors
must affect whether the recommendation change is influential. We use a probit
model to investigate the factors that make it more likely that a recommendation
change will be influential. We consider a battery of analyst, recommendation,
and firm variables. We find that recommendations away from the consensus
and recommendations accompanied by any sort of earnings forecasts are more
likely to be influential. Influential recommendations are also more likely to be
fromInstitutional Investor
–ranked analysts and analysts who have a history of being ahead of the herd in issuing recommendations. Analysts have hot hands
in influential recommendations: An analyst who has had an influential recom-
mendation in the past is more likely to have one in the future. It is harder for
an analyst to have an influential recommendation when more analysts follow a
firm and when the firm is larger. However, greater diversity of opinion about a
firm makes it more likely that a recommendation change will be influential.
When analyst recommendation changes are influential, they should lead
to more analyst and investor activity in the stock as investors adjust their
2 “When Meredith Whitney calls, should you listen?” by David Weidner, The Wall Street Journal, April 9, 2009.
595
a t E b s c o onA u g u s t 5 ,2 0 1 1
r f s . ox f or d j o ur n al s . or g
D ownl o a d e d f r om
8/4/2019 When Are Analyst Recommendation Changes Influential
http://slidepdf.com/reader/full/when-are-analyst-recommendation-changes-influential 4/35
The Review of Financial Studies / v 24 n 2 2011
holdings to the new information produced by analysts. We find this to be the
case. Analyst activity increases after an influential analyst recommendation
change compared to before. Forecast revisions by analysts following such a
change are much larger than forecast revisions before such a change. Stock
volatility and turnover are much larger in the three months following an in-fluential analyst change than in the three months before. Finally, the firm’s
industry is also more likely to have a large return coinciding with the recom-
mendation event—consistent with the analyst research containing an industry
element affecting similar firms.
We are not the first to examine the differential impact of stock recommenda-
tion changes. For instance, Stickel (1995) finds that recommendation changes
of star analysts have more impact, and Fang and Yasuda (2008) show that
they are more profitable. Irvine (2004) provides evidence that the market re-
acts more strongly to initiations than to other recommendations. Ivkovic andJegadeesh (2004) demonstrate that the timing of recommendation changes in
relation to earnings announcements affects their impact. Asquith, Mikhail, and
Au (2005) provide evidence that the impact of recommendation changes is af-
fected by the content of analyst reports. Chen, Francis, and Schipper (2005)
find that the average analyst recommendation or earnings forecast produces
a price impact that is no different from the average stock-price movement
on non-recommendation days. Frankel, Kothari, and Weber (2006) examine
whether firm characteristics affect the impact of earnings forecast revisions,
but they do not consider analyst characteristics or stock recommendations. Akey distinguishing feature of our approach from this literature is that we do
not focus on average effects. Most authors find a significant effect of analyst
recommendations on average for certain samples, and some authors find no sig-
nificant effect. Our study is not about average effects, but rather about whether
individual recommendations are influential. We could find evidence that some
recommendations are influential even if the average recommendation in a sam-
ple has an insignificant stock-price reaction; alternatively, we could find that
no recommendations are influential even if the stock-price reaction to analyst
recommendations is significant on average.A related paper, Altinkilic and Hansen (2009), reports evidence that the av-
erage recommendation revision does not produce an economically meaning-
ful reaction after removing recommendations that piggyback on firm news,
such as earnings announcements. They go on to conclude that analyst recom-
mendations are therefore uninformative. Chen, Francis, and Schipper (2005)
find that the average analyst recommendation or earnings forecast produces
a price impact that does not differ from the average stock-price movement
on non-recommendation days. Because these papers focus on average effects,
they do not discuss or identify subsets of recommendations that are influential.Although our findings agree that the majority of recommendations are unin-
formative, we argue that analysts add value to financial markets by virtue of
the fact that they can produce influential recommendations (e.g., as anecdotally
596
a t E b s c o onA u g u s t 5 ,2 0 1 1
r f s . ox f or d j o ur n al s . or g
D ownl o a d e d f r om
8/4/2019 When Are Analyst Recommendation Changes Influential
http://slidepdf.com/reader/full/when-are-analyst-recommendation-changes-influential 5/35
When Are Analyst Recommendation Changes Influential?
illustrated in the Citigroup and Countrywide cases).3 Since our threshold for an
influential recommendation (ignoring the requirement of correct sign) corre-
sponds to the 5% probability level, we expect 5% of recommendation changes
to be significant by chance alone. We find that the percentage of influential
recommendation changes is more than twice the percentage we would ex-pect by chance alone. At the same time, our evidence shows that producing
an influential recommendation change requires a combination of skills and
circumstances that makes such recommendation changes infrequent.
Analysts also produce earnings forecast revisions. Prior work on the impact
of earnings forecast revisions has focused on differentiating reaction magni-
tudes according to firm and analyst characteristics, for example, in Clement
and Tse (2003) and Gleason and Lee (2003).4 Therefore, we estimate the frac-
tion of earnings forecast revisions that are influential. We find that roughly 5%
of earnings forecast revisions are influential. Earnings forecast revisions ac-companied by recommendations are twice as likely to be influential. Further, a
recommendation change is more likely to be influential if it is accompanied by
an earnings forecast. We conjecture that analyst research is more likely to be
influential (according to our definition) when conveyed through a recommen-
dation change, since it is a clear call to buy or sell a stock that can receive a
great deal of attention in the press.
The rest of the study is organized as follows. Section 1 details the data
and sample. Section 2 describes the average recommendation event abnormal
return. Section 3 identifies which recommendations are influential and theircharacteristics and consequences. Section 4 investigates predictive variables
for influential recommendations. Section 5 considers robustness tests, and
Section 6 concludes.
1. Data and Sample
1.1 Recommendations data
The stock recommendations sample is from Thomson Financial’s Institutional
Brokers Estimate (I/B/E/S) U.S. Detail File, augmented with dates from the
First Call Database. We build our sample starting from I/B/E/S ratings is-
sued by individual analysts from 1993 to 2006, with ratings ranging from 1
(strong buy) to 5 (sell). Ratings are reversed (e.g., strong buy now denoted
by 5) so that higher ratings correspond to more favorable recommendations.
We focus on recommendation changes issued from 1994 onward since 1993
3 Our research design also has more power to identify informational effects of analysts since we investigate each
recommendation change at the individual firm level. Average stock-price reactions disproportionately reflectrecommendations at firms with greater analyst coverage. For instance, a firm with 30 analysts will typically have
ten times more observations in a sample than a firm with three analysts. Yet the firm covered by 30 analystswould be one for which an individual recommendation is less likely to be informative.
4 These papers are different from our approach in that they do not examine recommendations, rely on our method
of identifying influential events, or examine volume reactions to the events.
597
a t E b s c o onA u g u s t 5 ,2 0 1 1
r f s . ox f or d j o ur n al s . or g
D ownl o a d e d f r om
8/4/2019 When Are Analyst Recommendation Changes Influential
http://slidepdf.com/reader/full/when-are-analyst-recommendation-changes-influential 6/35
The Review of Financial Studies / v 24 n 2 2011
observations are sparse (1993 data is used for prior ratings when available).
Ljungqvist, Malloy, and Marston (2009) report that matched records in the
I/B/E/S recommendations data were altered between downloads from 2000 to
2007. They also document that Thomson Financial, in response to their pa-
per, fixed the alterations in the recommendation history file as of February 12,2007. The dataset we use is dated March 15, 2007, and hence reflects these
recent corrections by Thomson.
We focus on recommendation revisions and not levels, since prior research
confirms that recommendation changes are more informative than mere levels
(e.g., Boni and Womack 2006; and Jegadeesh and Kim 2010). The recommen-
dation change (recchg) is computed as the current rating minus the prior rating
by the same analyst. By construction, recchg ranges between −4 and +4. A
rating is assumed to be outstanding according to the definition in Ljungqvist,
Malloy, and Marston (2009). Specifically, a rating is outstanding if it has beenconfirmed by the analyst (in the I/B/E/S review date field) in the last twelve
months and has not been stopped by the broker (in the I/B/E/S Stopped File).
We exclude observations where there is no outstanding prior rating from the
same analyst (i.e., analyst initiations or re-initiations are excluded). We remove
analysts coded as anonymous by I/B/E/S since it is not possible to track their
recommendation revisions. To ensure that our sample focuses on firms that are
of sufficient interest to investors, we also remove observations for which fewer
than three analysts have valid outstanding ratings.
We also deal with overall rating distribution changes due to the NationalAssociation of Securities Dealers (NASD) Rule 2711 in 2002. Many brokers
reissued stock recommendations in response to the rule, with many of them
changing to a three-point (buy, hold, sell) scale instead of a five-point (strong
buy, buy, hold, underperform, sell) scale (Kadan, Madureira, Wang, and Zach
2009). As a result, 2002 contains the largest number of recommendations in
I/B/E/S compared to any other sample year (Barber, Lehavy, McNichols, and
Trueman 2006). We account for this structural break by using the I/B/E/S
Stopped File to locate these rating distribution changes and adopt a three-point
rating scale for the affected brokers.
5
These adjustments code 40% of I/B/E/Sobservations after September 2002 on three-point rating scales so that the
recchg for these affected brokers would range between −2 and +2.
To ensure that our recommendation dates are reliable, we augment the I/B/
E/S sample with real-time recommendation dates from First Call. A wrong
date may result in us not capturing the true event date of the recommendation
change and understating the influence of analysts. To insert First Call dates
5 For 2002, we check for cases where a broker stopped all the recommendations in its coverage universe and
resumed coverage in the subsequent days using only a three-point rating. We check one year post-resumptionfor the new distribution of ratings. When the new distribution contains only three distinct ratings [∈(1,3,5)
or (2,3,4)], we assume this broker uses three-point ratings beginning with the resumption date. In the probitestimations, the rating change explanatory variable is based on three-point scales for the affected brokers. We
verified that removing all three-point scale-based observations does not affect our results in Table 4.
598
a t E b s c o onA u g u s t 5 ,2 0 1 1
r f s . ox f or d j o ur n al s . or g
D ownl o a d e d f r om
8/4/2019 When Are Analyst Recommendation Changes Influential
http://slidepdf.com/reader/full/when-are-analyst-recommendation-changes-influential 7/35
When Are Analyst Recommendation Changes Influential?
into matched observations in I/B/E/S, we do the following. The broker names
(bro name) on First Call are matched by hand to the I/B/E/S translation file
broker name (baname).6 We then look seven days on either side of the I/B/E/S
recommendation date to find a First Call observation that is matched on bro-
ker, firm, and recommendation level. When there are duplicate matches, theclosest date observation is chosen (earlier date for ties). We found matches for
52% of the I/B/E/S observations (Ljungqvist, Malloy, and Marston 2009 also
report a similar match rate of 46.8%). About 77% of these had recommenda-
tion dates unchanged, 21% had dates brought back by one day, and 2% had
dates brought forward by one day. We use this First Call augmented sample
from now on, although our results hold even when we use the I/B/E/S sample
alone.
We adopt a two-day event window to incorporate the daily return reflecting
the recommendation change.
7
To compute the two-day cumulative buy-and-hold abnormal return (CAR) for a recommendation change i , we define
CARi =1
t =0
(1+ Ri t )−1
t =0
1+ R DGTW
it
. (1)
Ri t is the raw return of the stock on day t , and R DGTW i t is the return on a
benchmark portfolio with the same size, book-to-market (B/M), and momen-
tum characteristics as the stock (Daniel, Grinblatt, Titman, and Wermers 1997,
thereafter DGTW).8 Day 0 is either the First Call augmented recommendationdate or the next trading day (for recommendations on non-trading days or rec-
ommendations between 4:30 PM and 11:59 PM on a trading day). We remove
observations where the lagged price is less than one dollar on day 0 to prevent
our results from being driven by low-priced stocks.
6 First Call has the practice of sometimes recycling broker codes and backfilling the new broker name onto old
recommendations. To mitigate this problem, we also rely on a file containing historical linkages between FirstCall broker codes and broker names in matching the broker names between First Call and I/B/E/S. This file is
also used in Ljungqvist, Marston, and Wilhelm (2009), and we thank Alexander Ljungqvist for providing thedata.
7 We find similar results with a three-day window from day −1 to +1. We also examine the average abnormalreturn around the event and find that days 0 and +1 account for almost all of the cumulative abnormal return inthe −5 to +5 period. Hence, we believe that our recommendation dates are accurately aligned with contempo-
raneous stock-price reactions.
8 The results are similar when we use the sum of abnormal returns rather than buy-and-hold abnormal returns.
The DGTW portfolios are computed as follows. Every July, firms are first sorted into quintiles based on theirsize (market cap on June 30 of each year) using break-points determined from NYSE stocks. Second, firms are
then sorted within each size quintile into quintiles based on their B/M ratios. B/M ratios are computed as in
Fama and French (2006). Third, firms within each size-B/M group are sorted into momentum quintiles everymonth based on the buy-and-hold return over the prior 12 months skipping the most recent month. Therefore,
the size and B/M rankings are updated every 12 months while the momentum rankings are updated monthly.Finally, the stocks within each characteristic portfolio are equally weighted at the beginning of each month and
the buy-and-hold average daily returns are computed.
599
a t E b s c o onA u g u s t 5 ,2 0 1 1
r f s . ox f or d j o ur n al s . or g
D ownl o a d e d f r om
8/4/2019 When Are Analyst Recommendation Changes Influential
http://slidepdf.com/reader/full/when-are-analyst-recommendation-changes-influential 8/35
The Review of Financial Studies / v 24 n 2 2011
1.2 Importance of removing recommendations made in response
to firm news
If a stock recommendation has an immediate impact on a firm’s stock price, it
does so because it reveals information about the firm. In determining whether
the analyst produced any material information, one should be careful to re-move recommendations that merely repeat the information contained in firm-
specific news releases. As already discussed, Altinkilic and Hansen (2009) go
so far as to argue that once the impact of other corporate news is removed,
analyst recommendation changes do not have a material impact. Malmendier
and Shanthikumar (2007) and Loh (2010) report that 12%–13% of stock rec-
ommendations occur in the three days around quarterly earnings announce-
ments. Since there are 252 trading days in a year, one would expect only 4.8%
of all recommendations to be issued around earnings announcements if the
likelihood of a recommendation is uniformly distributed throughout the year.Therefore, not removing recommendations associated with earnings announce-
ments falsely gives credit to the analyst recommendation for producing the
earnings announcement price impact (see also Frankel, Kothari, and Weber
2006). To apply this screen, we obtain quarterly earnings announcement dates
from Compustat.
Another type of firm-specific news release is earnings guidance issued by
firms. Chen, Francis, and Schipper (2005) suggest that such days should also
be taken out when determining the price impact of stock recommendations.
We obtain earnings guidance dates from the First Call Guidelines database.Finally, Bradley, Jordan, and Ritter (2008) contend that clustering in recom-
mendation changes usually occurs because of firm-specific news. Therefore,
we also identify days on which the I/B/E/S universe records multiple analysts
issuing recommendations for the firm as potential firm-specific news events.
2. The Average CAR of Recommendation Changes
In this section, we estimate the average CAR of recommendation changes
to provide a benchmark for our later analysis and to show how minimizing
the impact of firm-specific news affects the estimate of the average CAR of
recommendation changes.
2.1 Descriptive statistics of recommendation changes
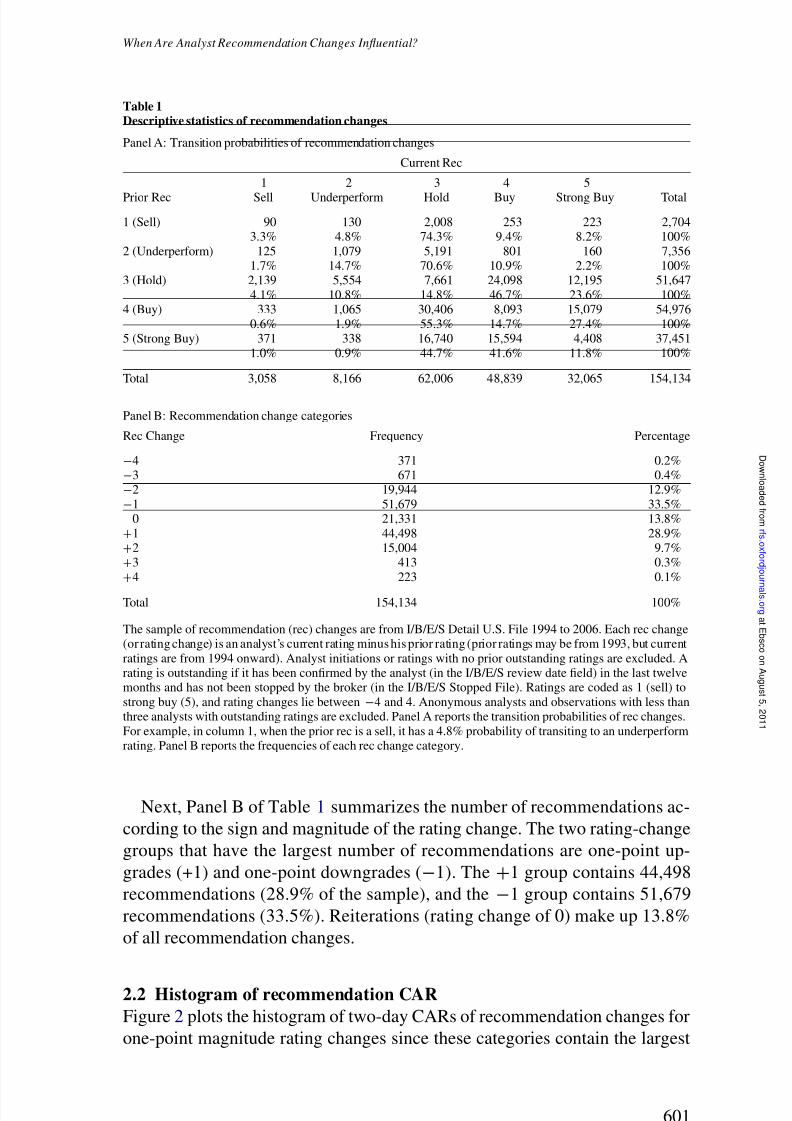
Our main sample contains 154,134 recommendation changes. Panel A of
Table 1 shows the transition probabilities of recommendation changes. We see
that recommendation levels are predominantly optimistic, with sell and under-
perform ratings making up only a small percentage of all recommendations.
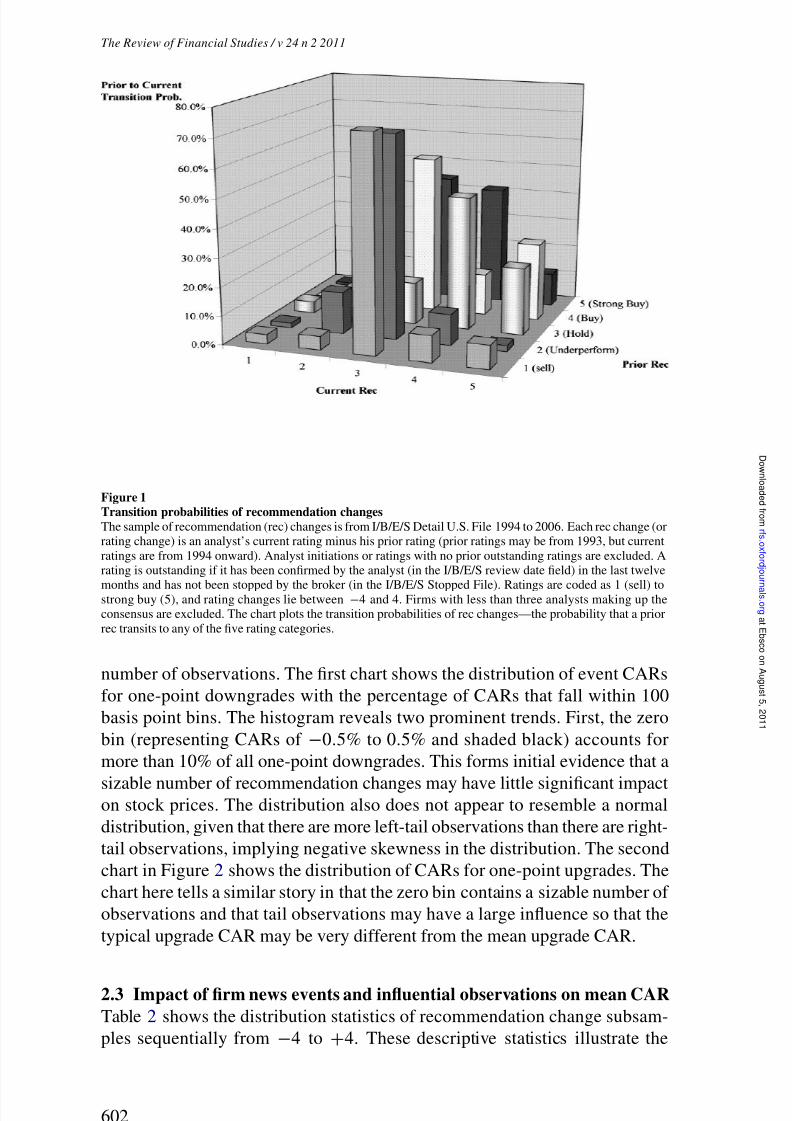
Figure 1 plots the transition probabilities in Panel A of Table 1. Looking at thebars in Figure 1, we see that there is a tendency for recommendations that are
not holds to get revised into holds, while hold ratings themselves tend to get
upgraded to buys.
600
a t E b s c o onA u g u s t 5 ,2 0 1 1
r f s . ox f or d j o ur n al s . or g
D ownl o a d e d f r om
8/4/2019 When Are Analyst Recommendation Changes Influential
http://slidepdf.com/reader/full/when-are-analyst-recommendation-changes-influential 9/35
When Are Analyst Recommendation Changes Influential?
Table 1Descriptive statistics of recommendation changes
Panel A: Transition probabilities of recommendation changes
Current Rec
1 2 3 4 5
Prior Rec Sell Underperform Hold Buy Strong Buy Total
1 (Sell) 90 130 2,008 253 223 2,7043.3% 4.8% 74.3% 9.4% 8.2% 100%
2 (Underperform) 125 1,079 5,191 801 160 7,3561.7% 14.7% 70.6% 10.9% 2.2% 100%
3 (Hold) 2,139 5,554 7,661 24,098 12,195 51,647
4.1% 10.8% 14.8% 46.7% 23.6% 100%4 (Buy) 333 1,065 30,406 8,093 15,079 54,976
0.6% 1.9% 55.3% 14.7% 27.4% 100%5 (Strong Buy) 371 338 16,740 15,594 4,408 37,451
1.0% 0.9% 44.7% 41.6% 11.8% 100%
Total 3,058 8,166 62,006 48,839 32,065 154,134
Panel B: Recommendation change categories
Rec Change Frequency Percentage
−4 371 0.2%−3 671 0.4%−2 19,944 12.9%−1 51,679 33.5%
0 21,331 13.8%+1 44,498 28.9%+2 15,004 9.7%+3 413 0.3%
+4 223 0.1%
Total 154,134 100%
The sample of recommendation (rec) changes are from I/B/E/S Detail U.S. File 1994 to 2006. Each rec change(or rating change) is an analyst’s current rating minus his prior rating (prior ratings may be from 1993, but current
ratings are from 1994 onward). Analyst initiations or ratings with no prior outstanding ratings are excluded. Arating is outstanding if it has been confirmed by the analyst (in the I/B/E/S review date field) in the last twelvemonths and has not been stopped by the broker (in the I/B/E/S Stopped File). Ratings are coded as 1 (sell) to
strong buy (5), and rating changes lie between −4 and 4. Anonymous analysts and observations with less thanthree analysts with outstanding ratings are excluded. Panel A reports the transition probabilities of rec changes.
For example, in column 1, when the prior rec is a sell, it has a 4.8% probability of transiting to an underperformrating. Panel B reports the frequencies of each rec change category.
Next, Panel B of Table 1 summarizes the number of recommendations ac-
cording to the sign and magnitude of the rating change. The two rating-change
groups that have the largest number of recommendations are one-point up-
grades (+1) and one-point downgrades (−1). The +1 group contains 44,498
recommendations (28.9% of the sample), and the −1 group contains 51,679
recommendations (33.5%). Reiterations (rating change of 0) make up 13.8%
of all recommendation changes.
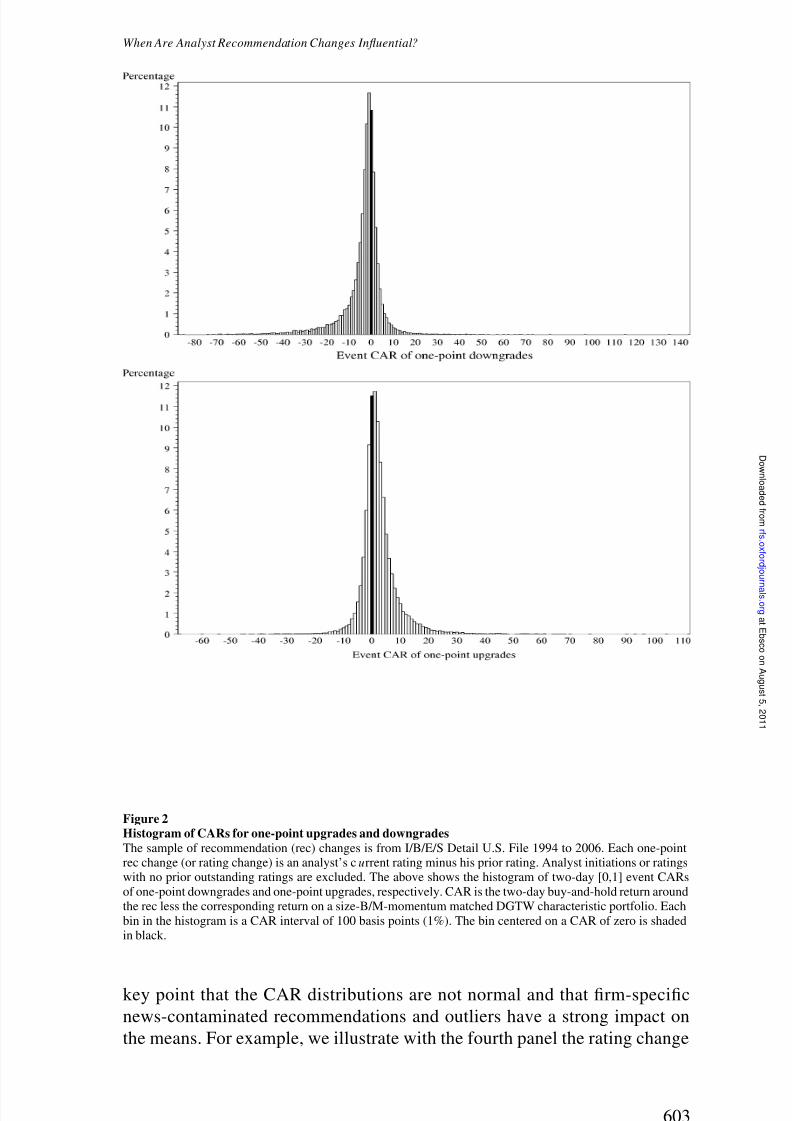
2.2 Histogram of recommendation CAR
Figure 2 plots the histogram of two-day CARs of recommendation changes for
one-point magnitude rating changes since these categories contain the largest
601
a t E b s c o onA u g u s t 5 ,2 0 1 1
r f s . ox f or d j o ur n al s . or g
D ownl o a d e d f r om
8/4/2019 When Are Analyst Recommendation Changes Influential
http://slidepdf.com/reader/full/when-are-analyst-recommendation-changes-influential 10/35
The Review of Financial Studies / v 24 n 2 2011
Figure 1Transition probabilities of recommendation changesThe sample of recommendation (rec) changes is from I/B/E/S Detail U.S. File 1994 to 2006. Each rec change (orrating change) is an analyst’s current rating minus his prior rating (prior ratings may be from 1993, but current
ratings are from 1994 onward). Analyst initiations or ratings with no prior outstanding ratings are excluded. Arating is outstanding if it has been confirmed by the analyst (in the I/B/E/S review date field) in the last twelve
months and has not been stopped by the broker (in the I/B/E/S Stopped File). Ratings are coded as 1 (sell) tostrong buy (5), and rating changes lie between −4 and 4. Firms with less than three analysts making up theconsensus are excluded. The chart plots the transition probabilities of rec changes—the probability that a prior
rec transits to any of the five rating categories.
number of observations. The first chart shows the distribution of event CARs
for one-point downgrades with the percentage of CARs that fall within 100
basis point bins. The histogram reveals two prominent trends. First, the zero
bin (representing CARs of −0.5% to 0.5% and shaded black) accounts for
more than 10% of all one-point downgrades. This forms initial evidence that a
sizable number of recommendation changes may have little significant impacton stock prices. The distribution also does not appear to resemble a normal
distribution, given that there are more left-tail observations than there are right-
tail observations, implying negative skewness in the distribution. The second
chart in Figure 2 shows the distribution of CARs for one-point upgrades. The
chart here tells a similar story in that the zero bin contains a sizable number of
observations and that tail observations may have a large influence so that the
typical upgrade CAR may be very different from the mean upgrade CAR.
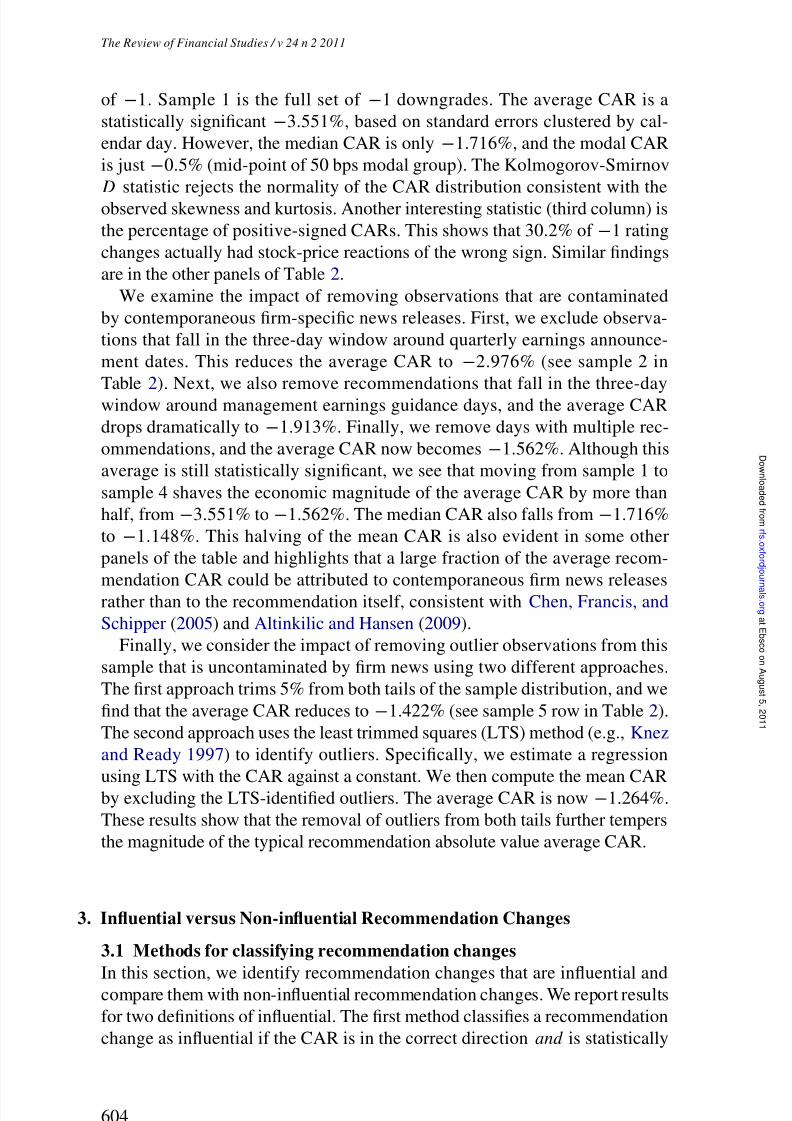
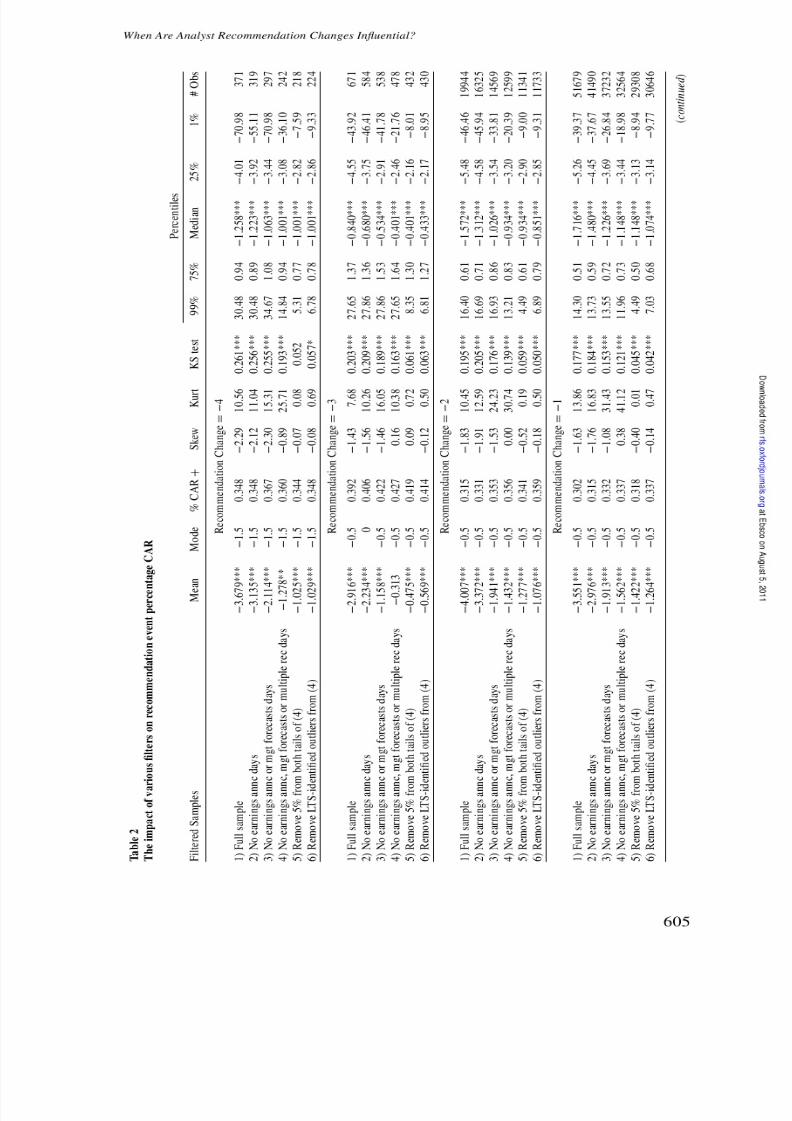
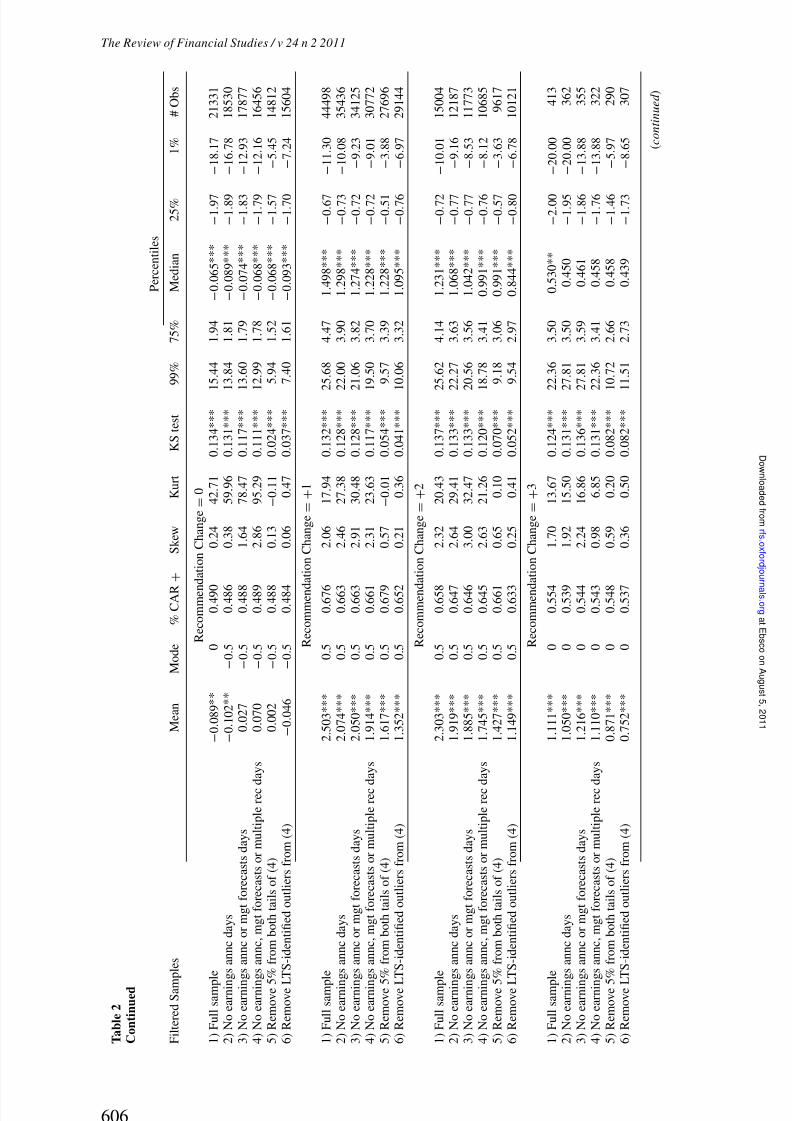
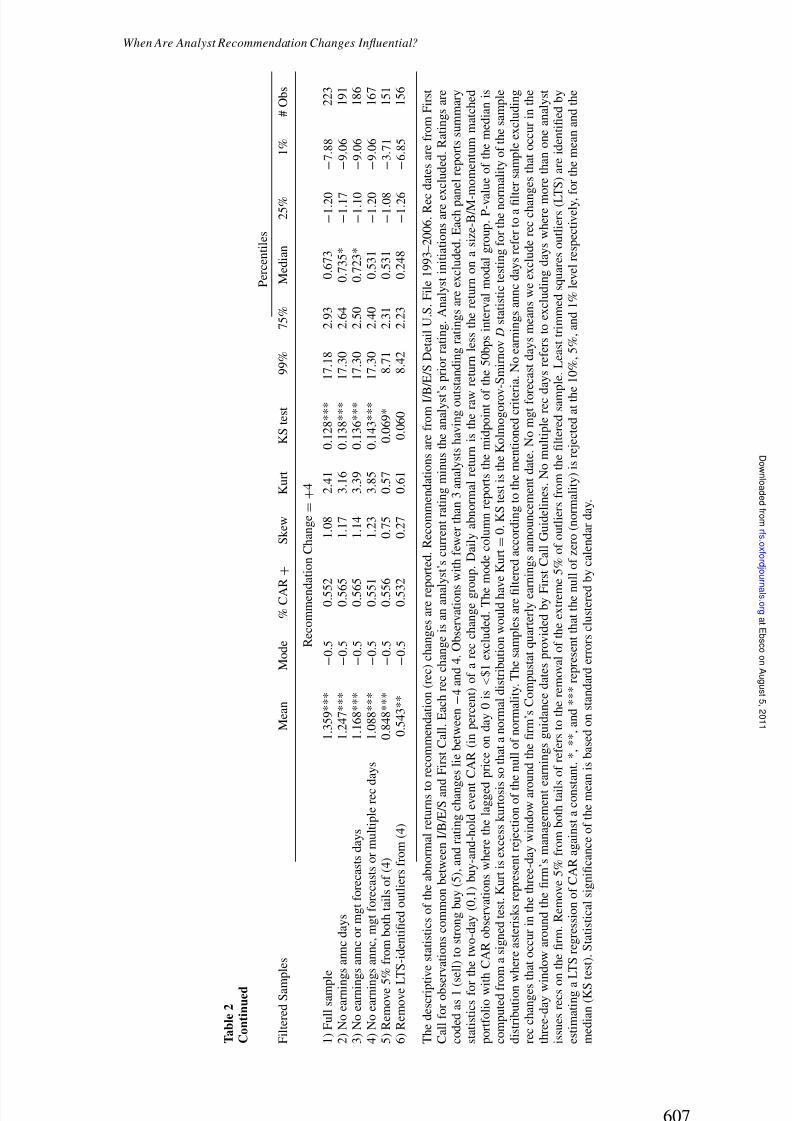
2.3 Impact of firm news events and influential observations on mean CAR
Table 2 shows the distribution statistics of recommendation change subsam-
ples sequentially from −4 to +4. These descriptive statistics illustrate the
602
a t E b s c o onA u g u s t 5 ,2 0 1 1
r f s . ox f or d j o ur n al s . or g
D ownl o a d e d f r om
8/4/2019 When Are Analyst Recommendation Changes Influential
http://slidepdf.com/reader/full/when-are-analyst-recommendation-changes-influential 11/35
When Are Analyst Recommendation Changes Influential?
Figure 2Histogram of CARs for one-point upgrades and downgradesThe sample of recommendation (rec) changes is from I/B/E/S Detail U.S. File 1994 to 2006. Each one-pointrec change (or rating change) is an analyst’s c urrent rating minus his prior rating. Analyst initiations or ratingswith no prior outstanding ratings are excluded. The above shows the histogram of two-day [0,1] event CARs
of one-point downgrades and one-point upgrades, respectively. CAR is the two-day buy-and-hold return aroundthe rec less the corresponding return on a size-B/M-momentum matched DGTW characteristic portfolio. Each
bin in the histogram is a CAR interval of 100 basis points (1%). The bin centered on a CAR of zero is shadedin black.
key point that the CAR distributions are not normal and that firm-specific
news-contaminated recommendations and outliers have a strong impact on
the means. For example, we illustrate with the fourth panel the rating change
603
a t E b s c o onA u g u s t 5 ,2 0 1 1
r f s . ox f or d j o ur n al s . or g
D ownl o a d e d f r om
8/4/2019 When Are Analyst Recommendation Changes Influential
http://slidepdf.com/reader/full/when-are-analyst-recommendation-changes-influential 12/35
The Review of Financial Studies / v 24 n 2 2011
of −1. Sample 1 is the full set of −1 downgrades. The average CAR is a
statistically significant −3.551%, based on standard errors clustered by cal-
endar day. However, the median CAR is only −1.716%, and the modal CAR
is just −0.5% (mid-point of 50 bps modal group). The Kolmogorov-Smirnov
Dstatistic rejects the normality of the CAR distribution consistent with theobserved skewness and kurtosis. Another interesting statistic (third column) is
the percentage of positive-signed CARs. This shows that 30.2% of −1 rating
changes actually had stock-price reactions of the wrong sign. Similar findings
are in the other panels of Table 2.
We examine the impact of removing observations that are contaminated
by contemporaneous firm-specific news releases. First, we exclude observa-
tions that fall in the three-day window around quarterly earnings announce-
ment dates. This reduces the average CAR to −2.976% (see sample 2 in
Table 2). Next, we also remove recommendations that fall in the three-daywindow around management earnings guidance days, and the average CAR
drops dramatically to −1.913%. Finally, we remove days with multiple rec-
ommendations, and the average CAR now becomes −1.562%. Although this
average is still statistically significant, we see that moving from sample 1 to
sample 4 shaves the economic magnitude of the average CAR by more than
half, from −3.551% to −1.562%. The median CAR also falls from −1.716%
to −1.148%. This halving of the mean CAR is also evident in some other
panels of the table and highlights that a large fraction of the average recom-
mendation CAR could be attributed to contemporaneous firm news releasesrather than to the recommendation itself, consistent with Chen, Francis, and
Schipper (2005) and Altinkilic and Hansen (2009).
Finally, we consider the impact of removing outlier observations from this
sample that is uncontaminated by firm news using two different approaches.
The first approach trims 5% from both tails of the sample distribution, and we
find that the average CAR reduces to −1.422% (see sample 5 row in Table 2).
The second approach uses the least trimmed squares (LTS) method (e.g., Knez
and Ready 1997) to identify outliers. Specifically, we estimate a regression
using LTS with the CAR against a constant. We then compute the mean CARby excluding the LTS-identified outliers. The average CAR is now −1.264%.
These results show that the removal of outliers from both tails further tempers
the magnitude of the typical recommendation absolute value average CAR.
3. Influential versus Non-influential Recommendation Changes
3.1 Methods for classifying recommendation changes
In this section, we identify recommendation changes that are influential andcompare them with non-influential recommendation changes. We report results
for two definitions of influential. The first method classifies a recommendation
change as influential if the CAR is in the correct direction and is statistically
604
a t E b s c o onA u g u s t 5 ,2 0 1 1
r f s . ox f or d j o ur n al s . or g
D ownl o a d e d f r om
8/4/2019 When Are Analyst Recommendation Changes Influential
http://slidepdf.com/reader/full/when-are-analyst-recommendation-changes-influential 13/35
8/4/2019 When Are Analyst Recommendation Changes Influential
http://slidepdf.com/reader/full/when-are-analyst-recommendation-changes-influential 14/35
The Review of Financial Studies / v 24 n 2 2011
T a
b l e 2
C o n
t i n u
e d
P e r c e n t i l e s
F i l t e r e d S a m p l e s
M e a n
M o d e
% C A R
+
S k e w
K u r t
K S t e s t
9 9 %
7 5 %
M e d i a n
2 5 %
1 %
# O b s
R e c o m m e n
d a t i o n C h a n g e =
0
1 ) F u l l s a m p l e
− 0 . 0 8 9 * *
0
0 . 4 9 0
0 . 2 4
4 2 . 7
1
0 . 1 3
4 * * *
1 5 . 4
4
1 . 9
4
− 0 . 0 6 5 * * *
− 1 . 9 7
− 1 8 . 1 7
2 1 3 3 1
2 ) N o e a r n i n g s a n n c d a y s
− 0 . 1 0 2 * *
− 0 . 5
0 . 4 8 6
0 . 3
8
5 9 . 9 6
0 . 1
3 1 * * *
1 3 . 8 4
1 . 8
1
− 0 . 0 8 9 * * *
− 1 . 8 9
− 1 6 . 7 8
1 8 5 3 0
3 ) N o e a r n i n g s a n n c o r m g t f o r e c a s t s d a y s
0 . 0 2
7
− 0 . 5
0 . 4 8 8
1 . 6
4
7 8 . 4 7
0 . 1
1 7 * * *
1 3 . 6 0
1 . 7
9
− 0 . 0 7 4 * * *
− 1 . 8 3
− 1 2 . 9 3
1 7 8 7 7
4 ) N o e a r n i n g s a n n c , m g t f o r e c a s t s o r m u l t i p l e r e c d
a y s
0 . 0 7
0
− 0 . 5
0 . 4 8 9
2 . 8
6
9 5 . 2 9
0 . 1
1 1 * * *
1 2 . 9 9
1 . 7
8
− 0 . 0 6 8 * * *
− 1 . 7 9
− 1 2 . 1 6
1 6 4 5 6
5 ) R e m o v e 5 % f r o m b o t h t a i l s o f ( 4 )
0 . 0 0
2
− 0 . 5
0 . 4 8 8
0 . 1
3
− 0 . 1
1
0 . 0
2 4 * * *
5 . 9 4
1 . 5 2
− 0 . 0 6 8 * * *
− 1 . 5 7
− 5 . 4 5
1 4 8 1 2
6 ) R e m o v e L T S - i d e n t i fi e d o u t l i e r s f r o m ( 4 )
− 0 . 0
4 6
− 0 . 5
0 . 4 8 4
0 . 0
6
0 . 4 7
0 . 0
3 7 * * *
7 . 4 0
1 . 6
1
− 0 . 0 9 3 * * *
− 1 . 7 0
− 7 . 2 4
1 5 6 0 4
R e c o m m e n d
a t i o n C h a n g e =
+ 1
1 ) F u l l s a m p l e
2 . 5
0 3 * * *
0 . 5
0 . 6 7 6
2 . 0 6
1 7 . 9
4
0 . 1 3
2 * * *
2 5 . 6
8
4 . 4 7
1 . 4 9
8 * * *
− 0 . 6 7
− 1 1 . 3 0
4 4 4 9 8
2 ) N o e a r n i n g s a n n c d a y s
2 . 0
7 4 * * *
0 . 5
0 . 6 6 3
2 . 4 6
2 7 . 3 8
0 . 1 2 8 * * *
2 2 . 0 0
3 . 9 0
1 . 2 9
8 * * *
− 0 . 7 3
− 1 0 . 0 8
3 5 4 3 6
3 ) N o e a r n i n g s a n n c o r m g t f o r e c a s t s d a y s
2 . 0
5 0 * * *
0 . 5
0 . 6 6 3
2 . 9 1
3 0 . 4 8
0 . 1 2 8 * * *
2 1 . 0 6
3 . 8 2
1 . 2 7
4 * * *
− 0 . 7 2
− 9 . 2 3
3 4 1 2 5
4 ) N o e a r n i n g s a n n c , m g t f o r e c a s t s o r m u l t i p l e r e c d
a y s
1 . 9
1 4 * * *
0 . 5
0 . 6 6 1
2 . 3 1
2 3 . 6 3
0 . 1 1 7 * * *
1 9 . 5 0
3 . 7 0
1 . 2 2
8 * * *
− 0 . 7 2
− 9 . 0 1
3 0 7 7 2
5 ) R e m o v e 5 % f r o m b o t h t a i l s o f ( 4 )
1 . 6
1 7 * * *
0 . 5
0 . 6 7 9
0 . 5 7
− 0 . 0
1
0 . 0
5 4 * * *
9 . 5 7
3 . 3 9
1 . 2 2 8 * * *
− 0 . 5 1
− 3 . 8 8
2 7 6 9 6
6 ) R e m o v e L T S - i d e n t i fi e d o u t l i e r s f r o m ( 4 )
1 . 3
5 2 * * *
0 . 5
0 . 6 5 2
0 . 2 1
0 . 3
6
0 . 0 4
1 * * *
1 0 . 0
6
3 . 3 2
1 . 0 9
5 * * *
− 0 . 7 6
− 6 . 9 7
2 9 1 4 4
R e c o m m e n d
a t i o n C h a n g e =
+ 2
1 ) F u l l s a m p l e
2 . 3
0 3 * * *
0 . 5
0 . 6 5 8
2 . 3 2
2 0 . 4
3
0 . 1 3
7 * * *
2 5 . 6
2
4 . 1 4
1 . 2 3
1 * * *
− 0 . 7 2
− 1 0 . 0 1
1 5 0 0 4
2 ) N o e a r n i n g s a n n c d a y s
1 . 9
1 9 * * *
0 . 5
0 . 6 4 7
2 . 6 4
2 9 . 4 1
0 . 1 3 3 * * *
2 2 . 2 7
3 . 6 3
1 . 0 6
8 * * *
− 0 . 7 7
− 9 . 1 6
1 2 1 8 7
3 ) N o e a r n i n g s a n n c o r m g t f o r e c a s t s d a y s
1 . 8 8
5 * * *
0 . 5
0 . 6 4 6
3 . 0 0
3 2 . 4 7
0 . 1 3 3 * * *
2 0 . 5 6
3 . 5 6
1 . 0 4 2 * * *
− 0 . 7 7
− 8 . 5 3
1 1 7 7 3
4 ) N o e a r n i n g s a n n c , m g t f o r e c a s t s o r m u l t i p l e r e c d
a y s
1 . 7 4
5 * * *
0 . 5
0 . 6 4 5
2 . 6 3
2 1 . 2 6
0 . 1 2 0 * * *
1 8 . 7 8
3 . 4 1
0 . 9 9 1 * * *
− 0 . 7 6
− 8 . 1 2
1 0 6 8 5
5 ) R e m o v e 5 % f r o m b o t h t a i l s o f ( 4 )
1 . 4
2 7 * * *
0 . 5
0 . 6 6 1
0 . 6 5
0 . 1 0
0 . 0 7 0 * * *
9 . 1 8
3 . 0 6
0 . 9 9
1 * * *
− 0 . 5 7
− 3 . 6 3
9 6 1 7
6 ) R e m o v e L T S - i d e n t i fi e d o u t l i e r s f r o m ( 4 )
1 . 1
4 9 * * *
0 . 5
0 . 6 3 3
0 . 2 5
0 . 4
1
0 . 0 5
2 * * *
9 . 5
4
2 . 9 7
0 . 8 4
4 * * *
− 0 . 8 0
− 6 . 7 8
1 0 1 2 1
R e c o m m e n d
a t i o n C h a n g e =
+ 3
1 ) F u l l s a m p l e
1 . 1
1 1 * * *
0
0 . 5 5 4
1 . 7 0
1 3 . 6
7
0 . 1 2
4 * * *
2 2 . 3
6
3 . 5 0
0 . 5
3 0 * *
− 2 . 0 0
− 2 0 . 0 0
4 1 3
2 ) N o e a r n i n g s a n n c d a y s
1 . 0
5 0 * * *
0
0 . 5 3 9
1 . 9 2
1 5 . 5 0
0 . 1 3 1 * * *
2 7 . 8 1
3 . 5 0
0 . 4 5 0
− 1 . 9 5
− 2 0 . 0 0
3 6 2
3 ) N o e a r n i n g s a n n c o r m g t f o r e c a s t s d a y s
1 . 2
1 6 * * *
0
0 . 5 4 4
2 . 2 4
1 6 . 8 6
0 . 1 3 6 * * *
2 7 . 8 1
3 . 5 9
0 . 4 6 1
− 1 . 8 6
− 1 3 . 8 8
3 5 5
4 ) N o e a r n i n g s a n n c , m g t f o r e c a s t s o r m u l t i p l e r e c d
a y s
1 . 1 1
0 * * *
0
0 . 5 4 3
0 . 9 8
6 . 8 5
0 . 1 3 1 * * *
2 2 . 3 6
3 . 4 1
0 . 4 5 8
− 1 . 7 6
− 1 3 . 8 8
3 2 2
5 ) R e m o v e 5 % f r o m b o t h t a i l s o f ( 4 )
0 . 8
7 1 * * *
0
0 . 5 4 8
0 . 5 9
0 . 2
0
0 . 0 8
2 * * *
1 0 . 7
2
2 . 6 6
0 . 4 5 8
− 1 . 4 6
− 5 . 9 7
2 9 0
6 ) R e m o v e L T S - i d e n t i fi e d o u t l i e r s f r o m ( 4 )
0 . 7
5 2 * * *
0
0 . 5 3 7
0 . 3 6
0 . 5
0
0 . 0 8
2 * * *
1 1 . 5
1
2 . 7 3
0 . 4 3 9
− 1 . 7 3
− 8 . 6 5
3 0 7
( c o n t i n u e d )
606
a t E b s c o onA u g u s t 5 ,2 0 1 1
r f s . ox f or d j o ur n al s . or g
D ownl o a d e d f r om
8/4/2019 When Are Analyst Recommendation Changes Influential
http://slidepdf.com/reader/full/when-are-analyst-recommendation-changes-influential 15/35
When Are Analyst Recommendation Changes Influential?
T a
b l e 2
C o n
t i n u
e d
P e r c e n t i l e s
F i l t e r e d S a m p l e s
M e a n
M o d e
% C A R +
S k e w
K u r t
K S t e s t
9 9 %
7 5 %
M e d i a n
2 5 %
1 %
# O b s
R e c o m m e n d
a t i o n C h a n g e =
+ 4
1 ) F u l l s a m p l e
1 . 3 5
9 * * *
− 0 . 5
0 . 5 5
2
1 . 0 8
2 . 4
1
0 . 1 2
8 * * *
1 7 . 1 8
2 . 9 3
0 . 6 7 3
− 1 . 2 0
− 7 . 8 8
2 2 3
2 ) N o e a r n i n g s a n n c d a y s
1 . 2 4
7 * * *
− 0 . 5
0 . 5 6
5
1 . 1 7
3 . 1
6
0 . 1 3
8 * * *
1 7 . 3 0
2 . 6 4
0 . 7 3 5 *
− 1 . 1 7
− 9 . 0 6
1 9 1
3 ) N o e a r n i n g s a n n c o r m g t f o r e c a s t s d a y s
1 . 1 6
8 * * *
− 0 . 5
0 . 5 6
5
1 . 1 4
3 . 3
9
0 . 1 3
6 * * *
1 7 . 3 0
2 . 5 0
0 . 7 2 3 *
− 1 . 1 0
− 9 . 0 6
1 8 6
4 ) N o e a r n i n g s a n n c , m g t f o r e c a s t s o r m u l t i p l e r e c d
a y s
1 . 0 8 8 * * *
− 0 . 5
0 . 5 5
1
1 . 2 3
3 . 8
5
0 . 1 4
3 * * *
1 7 . 3 0
2 . 4 0
0 . 5 3 1
− 1 . 2 0
− 9 . 0 6
1 6 7
5 ) R e m o v e 5 % f r o m b o t h t a i l s o f ( 4 )
0 . 8
4 8 * * *
− 0 . 5
0 . 5 5
6
0 . 7 5
0 . 5
7
0 . 0 6 9 *
8 . 7 1
2 . 3 1
0 . 5 3 1
− 1 . 0 8
− 3 . 7 1
1 5 1
6 ) R e m o v e L
T S - i d e n t i fi e d o u t l i e r s f r o m ( 4 )
0 . 5 4 3 * *
− 0 . 5
0 . 5 3
2
0 . 2 7
0 . 6
1
0 . 0 6 0
8 . 4 2
2 . 2 3
0 . 2 4 8
− 1 . 2 6
− 6 . 8 5
1 5 6
T h e d e s c r i p t i v e s t a t i s t i c s o f t h e a b n o r m a l r e t u r n s t o
r e c o m m e n d a t i o n ( r e c ) c h a n g e s a r e r e p o r t e d . R e c o m m e n d a t i o n s a r e f r o m I / B
/ E / S D e t a i l U . S .
F i l e 1 9 9 3 – 2 0 0 6 .
R e c
d a t e s a r e f r o m F i r s t
C a l l f o r o b s e
r v a t i o n s c o m m o n b e t w e e n I / B / E / S a n d
F i r s t C a l l . E a c h r e c c h a n g e i s a n a n a l y s t ’ s c u r r e n t r a t i n g m i n u s t h e a n a l y s t ’ s p r i o r r a t i n g . A n a l y s t i n i t i a t i o n s a r e e x c l u d e d .
R a t i n g s a r e
c o d e d a s 1 ( s
e l l ) t o s t r o n g b u y ( 5 ) , a n d r a t i n g c h a n g
e s l i e b e t w e e n −
4 a n d 4 . O b s e r v a t i o n s
w i t h f e w e r t h a n 3 a n a l y s t s h a v i n g o u t s t a n d i n g r a t i n g s a r e e x c l u d e d .
E a c h p a n e l r e p o r t s s u m m a r y
s t a t i s t i c s f o r
t h e t w o - d a y ( 0 , 1 )
b u y - a n d - h o
l d e v e n t
C A R ( i n p e r c e n t ) o f a r e c c h a n g e g r o u p . D a i l y a b n o r m a l r e t u r n i s t h e r a w
r e t u r n l e s s t h e r e t u r n o n a s i z e - B / M - m o m e n t u m m a t c h e d
p o r t f o l i o w i t h C A R o b s e r v a t i o n s w h e r e t h e l a g g e d
p r i c e o n d a y 0 i s < $ 1 e x c l u d e d .
T h e
m o d e c o l u m n r e p o r t s t h e m i d p o i n t o f
t h e 5 0 b p s i n t e r v a l m o d a l g r o u p .
P - v a
l u e o f t h e m e d i a n i s
c o m p u t e d f r o
m a s i g n e d t e s t . K u r t i s e x c e s s k u r t o s i s
s o t h a t a n o r m a l d i s t r i b u t i o n w o u l d h a v e K u r t =
0 . K
S t e s t i s t h e K o l m o g o r o v
- S m i r n o v D s t a t i s t i c t e s t i n g f o r t h e n o r m a l i t y o f t h e s a m p l e
d i s t r i b u t i o n w
h e r e a s t e r i s k s r e p r e s e n t r e j e c t i o n o f t h
e n u l l o f n o r m a l i t y . T h e s a m p l e s a r e fi l t e r e d a c c o r d i n g t o t h e m e n t i o n e d c r i t e r
i a . N o e a r n i n g s a n n c d a y s r e f e r t o a fi l t e r s a m p l e e x c l u d i n g
r e c c h a n g e s t h a t o c c u r i n t h e t h r e e - d a y w i n d o w a r o u n d t h e fi r m ’ s C o m p u s t a t q u a r t e r l y e a r n i n g s a n n o u n c e m e n t d a t e . N o m g t f o r e c a s t d a y s m e a n s w e e x c l u d e r e c c h a n g e s t h a t o c c u r i n t h e
t h r e e - d a y w i n d o w a r o u n d t h e fi r m ’ s m a n a g e m e n t e
a r n i n g s g u i d a n c e d a t e s p r o v i d e d b y F i r s t C a l l G u i d e l i n e s . N o m u l t i p l e r e c d
a y s r e f e r s t o e x c l u d i n g d a y s w h e r e m o r e t h a n o n e a n a l y s t
i s s u e s r e c s o n t h e fi r m .
R e m o v e 5 % f r o m b o t h t a i l s
o f r e f e r s t o t h e r e m o v a l o f t h e e x t r e m
e 5 % o f o u t l i e r s f r o m t h e fi l t e r e d s a m p l e . L e a s t t r i m m e d s q u a r e s o u t l i e r s ( L T
S ) a r e i d e n t i fi e d b y
e s t i m a t i n g a L T S r e g r e s s i o n o f C A R a g a i n s t a c o n s t a n t . * , * * , a n d
* * * r e p r e s e n t t h a t t h e n u l l o f z e r o ( n o r m a l i t y ) i s r e j e c t e d a t t h e
1 0 % , 5
% , a n
d 1 % l e v e l r e s p e c t i v e l y , f o r t h e m e a n a n d t h e
m e d i a n ( K S t e s t ) . S t a t i s t i c a l s i g n i fi c a n c e o f t h e m e a
n i s b a s e d o n s t a n d a r d e r r o r s c l u s t e r e d
b y c a l e n d a r d a y .
607
a t E b s c o onA u g u s t 5 ,2 0 1 1
r f s . ox f or d j o ur n al s . or g
D ownl o a d e d f r om
8/4/2019 When Are Analyst Recommendation Changes Influential
http://slidepdf.com/reader/full/when-are-analyst-recommendation-changes-influential 16/35
The Review of Financial Studies / v 24 n 2 2011
significant using the market model. Specifically, we check if the CAR is in the
same direction as the recommendation change and the absolute value CAR ex-
ceeds 1.96×√
2× σε. We multiply by√
2 since the CAR is a two-day CAR.
σε, the idiosyncratic volatility, is the standard deviation of residuals from a
daily time-series regression of past three-month (trading days −69 to−6) firmreturns against market returns and the Fama-French factors SMB and HML.
This measure roughly captures recommendation changes that observers would
judge to be influential, namely those that are associated with noticeable abnor-
mal returns that can be attributed to the recommendation changes.
The second approach classifies a recommendation change as influential when
the increase in abnormal turnover (abturn) is statistically significant. With this
measure, a recommendation change is influential because it leads investors
to trade. Following Llorente, Michaely, Saar, and Wang (2002), abturn =
logturnover
− logturnover
, where logturnover
is the average of daily logturnover over the past three months, and log turnover = log (turnover +0.00000255).9 Specifically, we check if the cumulative abturn is > 1.96 ×√
2 × σabturn, where σabturn is the standard deviation of the stock’s abturn in
the past three months (days −69 to −6 from the recommendation date).
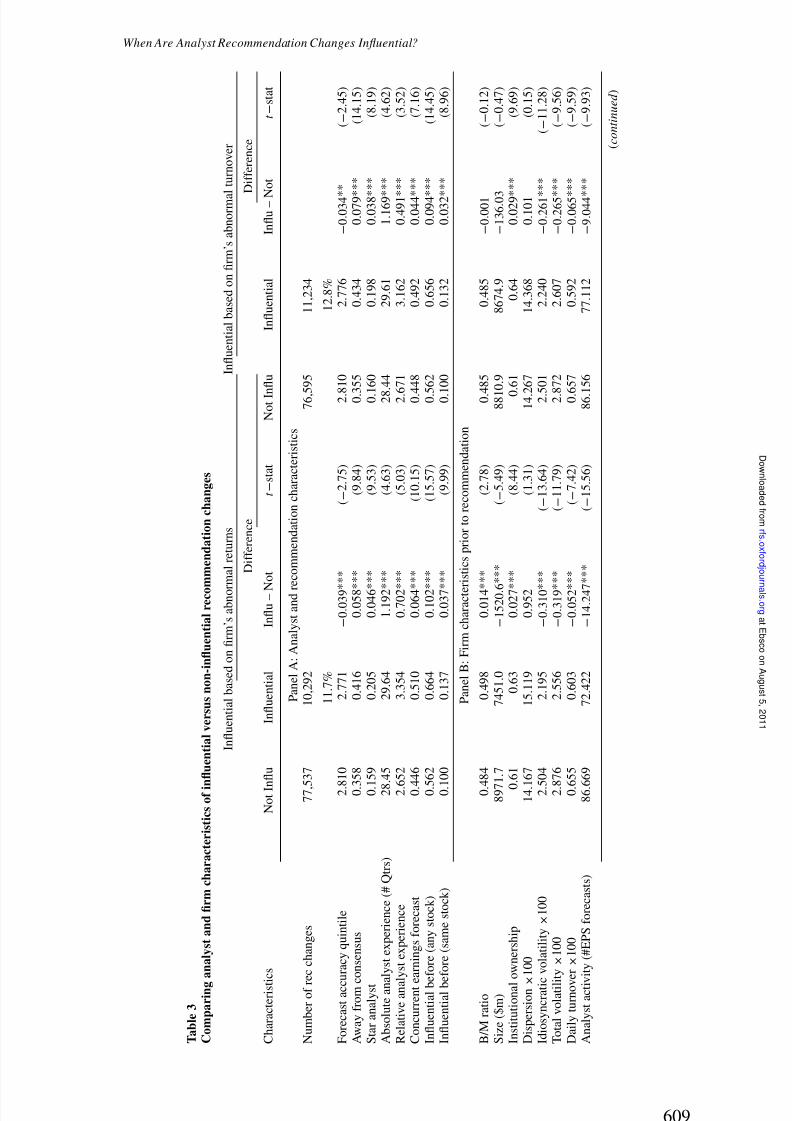
The first row of Table 3 reports the number of recommendation changes
(reiterations, i.e., recchg = 0, are excluded here) that are categorized into each
dimension of success. We see that 11.7% of all recommendation changes are
defined as influential in returns and 12.8% are defined as influential in turnover.
While the typical recommendation change is not influential, more than onerecommendation out of ten is influential; 4.8% of recommendation changes
are influential in both returns and turnover, 6.9% are influential in returns but
not turnover, and 8.0% are influential in turnover but not returns.
3.2 Analyst characteristics of influential recommendation changes
We characterize influential recommendation changes by examining several
analyst-, firm-, and recommendation-level characteristics. We start with ana-
lyst characteristics. We examine the relation between these variables and the
likelihood of an influential recommendation in both a univariate and a probitsetting.
1) Forecast accuracy: Loh and Mian (2006) show that analysts who pos-
sess more accurate earnings forecasts issue more profitable contempo-
raneous stock recommendations. It is possible that such analysts have
more impact. We compute the Forecast accuracy quintile of an ana-
lyst by sorting analysts within a firm-year into quintiles using the last
9 Daily turnover is from CRSP and defined as number of shares traded divided by the number of sharesoutstanding. Firms from NASDAQ have their shares traded divided by two to adjust for inter-dealer double
counting.
608
a t E b s c o onA u g u s t 5 ,2 0 1 1
r f s . ox f or d j o ur n al s . or g
D ownl o a d e d f r om
8/4/2019 When Are Analyst Recommendation Changes Influential
http://slidepdf.com/reader/full/when-are-analyst-recommendation-changes-influential 17/35
When Are Analyst Recommendation Changes Influential?
T a
b l e 3
C o m p a r
i n g
a n a
l y s t a n
d fi r m
c h a r a c
t e r
i s t i c s o
f i n
fl u
e n
t i a l
v e r s u s n o n
- i n fl
u e n
t i a l r e c o m m e n
d a
t i o n c
h a n g e s
I n fl u e n t i a l b a s e d o n fi r m ’ s a b n o r
m a l r e t u r n s
I n fl u e n t i a l b a s e d o n fi r m ’ s a b n o r m a l t u r n o v e r
D i f f e r e n c e
D i f f e r e n c e
C h a r a c t e r i s t i c s
N o t I n
fl u
I n fl u e n t i a l
I n fl u – N
o t
t − s t a t
N o t I n
fl u
I n fl u e n t i a l
I n fl u – N
o t
t − s t a t
P a n e l A : A n a l y s t a n d r e c o m m e n d a t i o n c h a r a c t e r i s t i c s
N u m b e r o f r e c c h a n g e s
7 7 , 5
3 7
1 0 , 2 9
2
7 6 , 5
9 5
1 1 , 2
3 4
1 1 . 7
%
1 2 . 8 %
F o r e c a s t a c c u r a c y q u i n t i l e
2 . 8
1 0
2 . 7
7 1
− 0 . 0 3 9 *
* *
( − 2 . 7 5 )
2 . 8
1 0
2 . 7
7 6
− 0 . 0
3 4 *
*
( − 2 . 4
5 )
A w a y f r o m c
o n s e n s u s
0 . 3
5 8
0 . 4 1
6
0 . 0 5 8 *
* *
( 9 . 8 4 )
0 . 3
5 5
0 . 4
3 4
0 . 0 7 9 *
* *
( 1 4 . 1 5 )
S t a r a n a l y s t
0 . 1
5 9
0 . 2 0
5
0 . 0 4 6 *
* *
( 9 . 5 3 )
0 . 1
6 0
0 . 1
9 8
0 . 0 3 8 *
* *
( 8 . 1 9 )
A b s o l u t e a n a
l y s t e x p e r i e n c e ( # Q t r s )
2 8 . 4
5
2 9 . 6 4
1 . 1 9 2 *
* *
( 4 . 6 3 )
2 8 . 4
4
2 9 . 6 1
1 . 1 6 9 *
* *
( 4 . 6 2 )
R e l a t i v e a n a l y s t e x p e r i e n c e
2 . 6
5 2
3 . 3
5 4
0 . 7 0 2 *
* *
( 5 . 0 3 )
2 . 6
7 1
3 . 1
6 2
0 . 4 9 1 *
* *
( 3 . 5 2
)
C o n c u r r e n t e
a r n i n g s f o r e c a s t
0 . 4
4 6
0 . 5 1
0
0 . 0 6 4 *
* *
( 1 0 . 1 5 )
0 . 4
4 8
0 . 4 9
2
0 . 0 4 4 *
* *
( 7 . 1 6 )
I n fl u e n t i a l b e
f o r e ( a n y s t o c k )
0 . 5
6 2
0 . 6 6
4
0 . 1 0 2 *
* *
( 1 5 . 5 7 )
0 . 5
6 2
0 . 6
5 6
0 . 0 9 4 *
* *
( 1 4 . 4 5 )
I n fl u e n t i a l b e
f o r e ( s a m e s t o c k )
0 . 1
0 0
0 . 1 3
7
0 . 0 3 7 *
* *
( 9 . 9 9 )
0 . 1
0 0
0 . 1 3
2
0 . 0 3 2 *
* *
( 8 . 9
6 )
P a n e l B : F i r m c h a r a c t e r i s t i c s p r i o r t o r e c o m m e n d a t i o n
B / M r a t i o
0 . 4
8 4
0 . 4 9
8
0 . 0 1 4 *
* *
( 2 . 7 8 )
0 . 4
8 5
0 . 4
8 5
− 0 . 0
0 1
( − 0 . 1
2 )
S i z e ( $ m )
8 9 7 1 . 7
7 4 5 1 . 0
− 1 5 2 0 . 6
* * *
( − 5 . 4 9 )
8 8 1 0 . 9
8 6 7 4 . 9
− 1 3 6 . 0 3
( − 0 . 4
7 )
I n s t i t u t i o n a l o w n e r s h i p
0 . 6
1
0 . 6 3
0 . 0 2 7 *
* *
( 8 . 4 4 )
0 . 6
1
0 . 6 4
0 . 0 2 9 *
* *
( 9 . 6 9 )
D i s p e r s i o n × 1 0 0
1 4 . 1
6 7
1 5 . 1 1
9
0 . 9 5 2
( 1 . 3 1 )
1 4 . 2
6 7
1 4 . 3
6 8
0 . 1 0 1
( 0 . 1 5 )
I d i o s y n c r a t i c
v o l a t i l i t y × 1 0 0
2 . 5
0 4
2 . 1 9
5
− 0 . 3 1 0 *
* *
( − 1 3 . 6 4 )
2 . 5
0 1
2 . 2
4 0
− 0 . 2
6 1 *
* *
( − 1 1 . 2
8 )
T o t a l v o l a t i l i t y × 1 0 0
2 . 8
7 6
2 . 5 5
6
− 0 . 3 1 9 *
* *
( − 1 1 . 7 9 )
2 . 8
7 2
2 . 6
0 7
− 0 . 2
6 5 *
* *
( − 9 . 5
6 )
D a i l y t u r n o v e r × 1 0 0
0 . 6
5 5
0 . 6 0
3
− 0 . 0 5 2 *
* *
( − 7 . 4 2 )
0 . 6
5 7
0 . 5
9 2
− 0 . 0
6 5 *
* *
( − 9 . 5
9 )
A n a l y s t a c t i v
i t y ( # E P S f o r e c a s t s )
8 6 . 6
6 9
7 2 . 4 2
2
− 1 4 . 2 4 7
* * *
( − 1 5 . 5 6 )
8 6 . 1
5 6
7 7 . 1
1 2
− 9 . 0
4 4 *
* *
( − 9 . 9
3 )
( c o n t i n u e d )
609
a t E b s c o onA u g u s t 5 ,2 0 1 1
r f s . ox f or d j o ur n al s . or g
D ownl o a d e d f r om
8/4/2019 When Are Analyst Recommendation Changes Influential
http://slidepdf.com/reader/full/when-are-analyst-recommendation-changes-influential 18/35
8/4/2019 When Are Analyst Recommendation Changes Influential
http://slidepdf.com/reader/full/when-are-analyst-recommendation-changes-influential 19/35
When Are Analyst Recommendation Changes Influential?
unrevised FY1 forecast of the analyst on the I/B/E/S Detail U.S. File.
Only firms with at least five analysts are included. The Forecast accu-
racy rank (1 being the most accurate) is assigned to the analyst for the
recommendations that the analyst issues during the 12-month window
that overlaps three months into the next fiscal year, following Loh andMian (2006). Overlapping the 12-month period into the next fiscal year
allows the accuracy rank to be applied during the months when the fis-
cal year’s actual earnings are announced. Note that this rank is a perfect
foresight rank and is not known at the time of the recommendation since
actual earnings have not yet been announced.
2) Away from consensus: Jegadeesh and Kim (2010) formulate a test for
herding and contend that if analysts herd, recommendations that go to-
ward the consensus would have a smaller price impact than those that
go away from the consensus. Following their paper, we define recom-mendations that go away from consensus as those where the absolute
deviation of the new recommendation from the consensus is larger than
the absolute deviation of the prior recommendation from the consensus.
The consensus recommendation is defined as the mean recommenda-
tion level that includes the most recent non-stale recommendation is-
sued by all analysts covering the firm (see Section 1.1 for the definition
of stale). This variable is defined based on three-point ratings to account
for rating distribution differences between brokers.
3) Star analyst : This is an indicator variable that equals one if the analystis ranked as an All-American (first, second, third, or runner-up teams) in
the annual polls in the Institutional Investor magazine. Analyst names
in I/B/E/S are matched to Institutional Investor polls (published in the
October issue), and an analyst maintains the star status for 12 months
beginning the November after the polls. The Star analyst indicator vari-
able proxies for the reputation of the analyst and the market’s attentive-
ness to the recommendation (the market could pay more attention to
calls from star analysts).
4) Analyst experience: Mikhail, Walther, and Willis (1997) show that ana-lysts improve their earnings forecast accuracy with experience. Hence,
it is possible that experience could be related to the impact of stock
recommendation changes. Analyst experience is measured as the number
of quarters since the analyst issued the first earnings forecasts or stock
recommendation on I/B/E/S. Two measures of experience are computed.
The first is Absolute analyst experience, which is the number of quarters
that he appeared on I/B/E/S. The second is the Relative analyst experi-
ence, which is the number of quarters theanalyst has covered that specific
firm minus the average experience for all analysts covering the firm.5) Concurrent earnings forecast : Kecskes, Michaely, and Womack (2009)
report that stock recommendations accompanied by earnings forecast
611
a t E b s c o onA u g u s t 5 ,2 0 1 1
r f s . ox f or d j o ur n al s . or g
D ownl o a d e d f r om
8/4/2019 When Are Analyst Recommendation Changes Influential
http://slidepdf.com/reader/full/when-are-analyst-recommendation-changes-influential 20/35
The Review of Financial Studies / v 24 n 2 2011
revisions are more profitable and have larger price reactions. Therefore,
we include a Concurrent earnings forecast indicator variable indicating
whether the same analyst issued any type of earnings forecast in the
three-day window around the recommendation change.
6) Influential before: If an influential recommendation is related to analystskill that is persistent, being influential in the past could be related to
the current likelihood of being influential.
We compute the average of these analyst-specific variables for the differ-
ent rating-change groups. Table 3 reports the averages for observations where
these variables can be computed. The average analyst Forecast accuracy quin-
tile of influential recommendation changes is 2.771, versus 2.810 for non-
influential recommendations. The difference is statistically significant, but its
economic importance is small; 41.6% of influential recommendation changesmove away from the consensus, while only 35.8% of non-influential recom-
mendation changes move away from the consensus—the difference is signif-
icant and sizable. Also, star analysts are responsible for 20.5% of influential
recommendation changes and 15.9% of non-influential recommendations. In-
fluential recommendations are also associated with higher Absolute and Rel-
ative analyst experience. A larger proportion of influential recommendation
changes have concurrent earnings forecasts issued together with the recom-
mendation change. Finally, being influential in the past for the same stock, as
well as for any stock, appears to be positively related to the current recommen-dation becoming influential. Using the second definition of influential (based
on increases in abnormal turnover) yields similar patterns of differences. Of
the many variables we report, those associated with economically larger dif-
ferences are Away from consensus, Star analyst , Concurrent earnings forecast ,
and Influential before variables.
Many of the variables we consider are correlated. To assess more precisely
the relation between these variables and the probability that an analyst makes
an influential recommendation, we estimate a probit model. This model allows
us to estimate not only the incremental contribution of each variable, but alsoits economic significance. We cluster the standard errors in the probits by an-
alyst as well as by firm (two-way clustering suggested by Thompson 2010).
Although some of these variables have been examined in the literature assess-
ing the determinants of the stock-price reaction to analyst recommendation
changes, they have not been considered in a unified fashion, nor have they been
examined in the context of identifying an influential recommendation change
in the manner we defined.
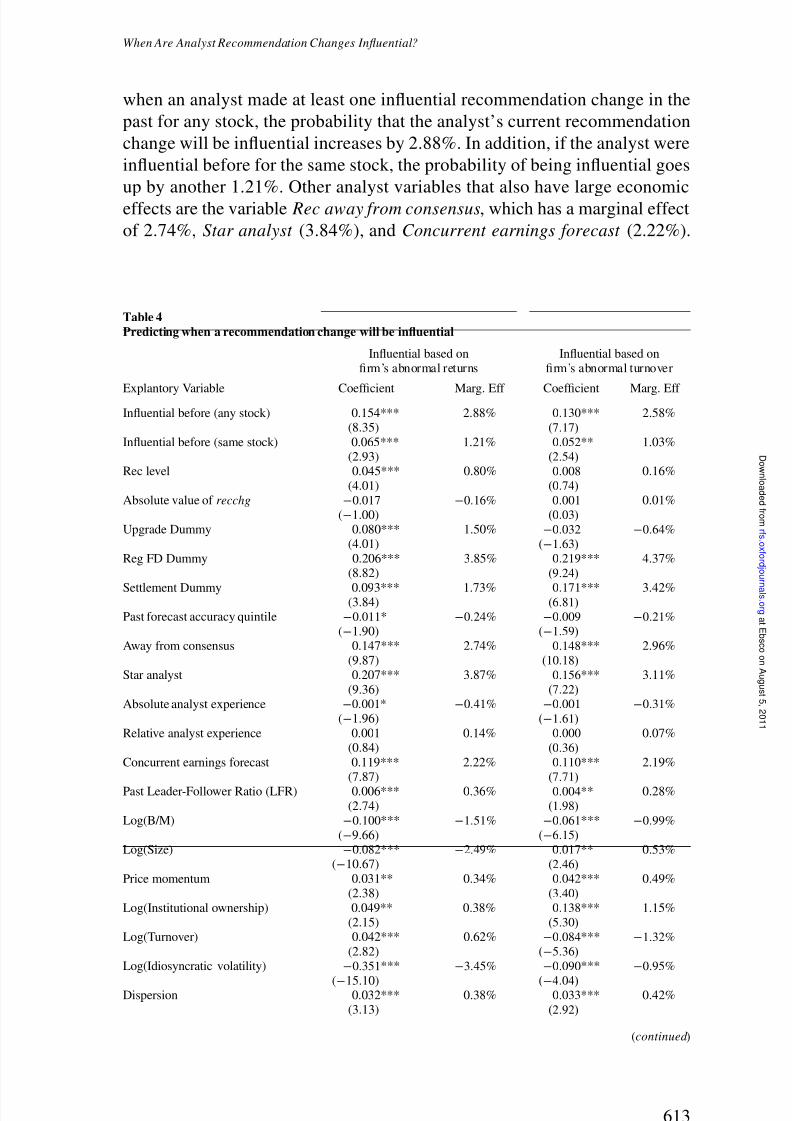
The probit estimates in Table 4 show that a recommendation change is sig-
nificantly more likely to be influential if it is by an analyst who has made aninfluential recommendation before. The marginal effect of Influential before
(any stock) is 2.88%. Such an effect is large, since the unconditional probabil-
ity of a recommendation change being significant is 11.70%. This means that
612
a t E b s c o onA u g u s t 5 ,2 0 1 1
r f s . ox f or d j o ur n al s . or g
D ownl o a d e d f r om
8/4/2019 When Are Analyst Recommendation Changes Influential
http://slidepdf.com/reader/full/when-are-analyst-recommendation-changes-influential 21/35
When Are Analyst Recommendation Changes Influential?
when an analyst made at least one influential recommendation change in the
past for any stock, the probability that the analyst’s current recommendation
change will be influential increases by 2.88%. In addition, if the analyst were
influential before for the same stock, the probability of being influential goes
up by another 1.21%. Other analyst variables that also have large economiceffects are the variable Rec away from consensus, which has a marginal effect
of 2.74%, Star analyst (3.84%), and Concurrent earnings forecast (2.22%).
Table 4Predicting when a recommendation change will be influential
Influential based on Influential based onfirm’s abnormal returns firm’s abnormal turnover
Explantory Variable Coefficient Marg. Eff Coefficient Marg. Eff
Influential before (any stock) 0.154*** 2.88% 0.130*** 2.58%(8.35) (7.17)
Influential before (same stock) 0.065*** 1.21% 0.052** 1.03%(2.93) (2.54)
Rec level 0.045*** 0.80% 0.008 0.16%
(4.01) (0.74)
Absolute value of recchg −0.017 −0.16% 0.001 0.01%
(−1.00) (0.03)
Upgrade Dummy 0.080*** 1.50% −0.032 −0.64%
(4.01) (−1.63)
Reg FD Dummy 0.206*** 3.85% 0.219*** 4.37%(8.82) (9.24)
Settlement Dummy 0.093*** 1.73% 0.171*** 3.42%(3.84) (6.81)
Past forecast accuracy quintile −0.011* −0.24% −0.009 −0.21%
(−1.90) (−1.59)
Away from consensus 0.147*** 2.74% 0.148*** 2.96%
(9.87) (10.18)
Star analyst 0.207*** 3.87% 0.156*** 3.11%
(9.36) (7.22)
Absolute analyst experience −0.001* −0.41% −0.001 −0.31%
(−1.96) (−1.61)
Relative analyst experience 0.001 0.14% 0.000 0.07%(0.84) (0.36)
Concurrent earnings forecast 0.119*** 2.22% 0.110*** 2.19%(7.87) (7.71)
Past Leader-Follower Ratio (LFR) 0.006*** 0.36% 0.004** 0.28%
(2.74) (1.98)
Log(B/M) −0.100*** −1.51% −0.061*** −0.99%
(−9.66) (−6.15)
Log(Size) −0.082*** −2.49% 0.017** 0.53%(−10.67) (2.46)
Price momentum 0.031** 0.34% 0.042*** 0.49%(2.38) (3.40)
Log(Institutional ownership) 0.049** 0.38% 0.138*** 1.15%(2.15) (5.30)
Log(Turnover) 0.042*** 0.62% −0.084*** −1.32%
(2.82) (−5.36)
Log(Idiosyncratic volatility) −0.351*** −3.45% −0.090*** −0.95%
(−15.10) (−4.04)Dispersion 0.032*** 0.38% 0.033*** 0.42%
(3.13) (2.92)
(continued )
613
a t E b s c o onA u g u s t 5 ,2 0 1 1
r f s . ox f or d j o ur n al s . or g
D ownl o a d e d f r om
8/4/2019 When Are Analyst Recommendation Changes Influential
http://slidepdf.com/reader/full/when-are-analyst-recommendation-changes-influential 22/35
The Review of Financial Studies / v 24 n 2 2011
Table 4Continued
Influential based on Influential based onfirm’s abnormal returns firm’s abnormal turnover
Explantory Variable Coefficient Marg. Eff Coefficient Marg. Eff
Log(Analyst activity) −0.138*** −2.17% −0.148*** −2.48%(−11.49) (−12.86)
Pseudo R-sq 0.04745 0.03654# Observations 58384 58384
Chi-Sq test 1485.68*** 1323.57***
The binary dependent variable is whether a recommendation (rec) is influential and the sample is sample 4 from
Table 2 with reiterations excluded and firm and analyst characteristics required. Marginal effects are reported be-low the coefficient estimates. The marginal effect for continuous (dummy) explanatory variables represents the
change in the predicted probability when the independent variable changes by one standard deviation (changesfrom 0 to 1). There are two definitions of influential. First, influential recs are those when a correct-signed CAR
is 1.96 standard deviations greater than expected based on the firm’s prior three-month Idiosyncratic volatility of daily returns. The second uses an abnormal turnover greater than 1.96 standard deviations of that expected from
the abnormal daily turnover in the stock’s prior three-month history. The Rec Level is the rating level after the recchange (recchg) (1= sell to 5= strong buy). The absolute value of the recchg, Upgrade dummy, Reg FD dummy(=1 after Aug 2000), and Settlement dummy (=1 in 2003 and after) are also included. Past Forecast accuracy
quintile is the average quintile rank of the analyst (smaller ranks denote greater accuracy). Away from consensus
= 1 when the absolute deviation of the new rec from the consensus is larger than the absolute deviation of theprior rec from the consensus. Star analysts= 1 for ranked analysts in the most recent Institutional Investor polls.
Absolute analyst experience is measured as the # of quarters in I/B/E/S. Relative analyst experience subtractsthe average experience of other covering analysts. Concurrent earnings forecast = 1 when the same analyst
issued any earnings forecast in the three-day window around the rec. Leader-Follower Ratios larger than onedenote leader analysts. Turnover , Idiosyncratic volatility, and Dispersion are based on prior three-month aver-ages. Analyst activity is total number forecasts issued by all analysts in the prior three months. *,**, and ***
denote significance levels of 10%, 5%, and 1%, respectively, using standard errors clustered in two dimensions(by analyst and firm) with z statistics in parentheses.
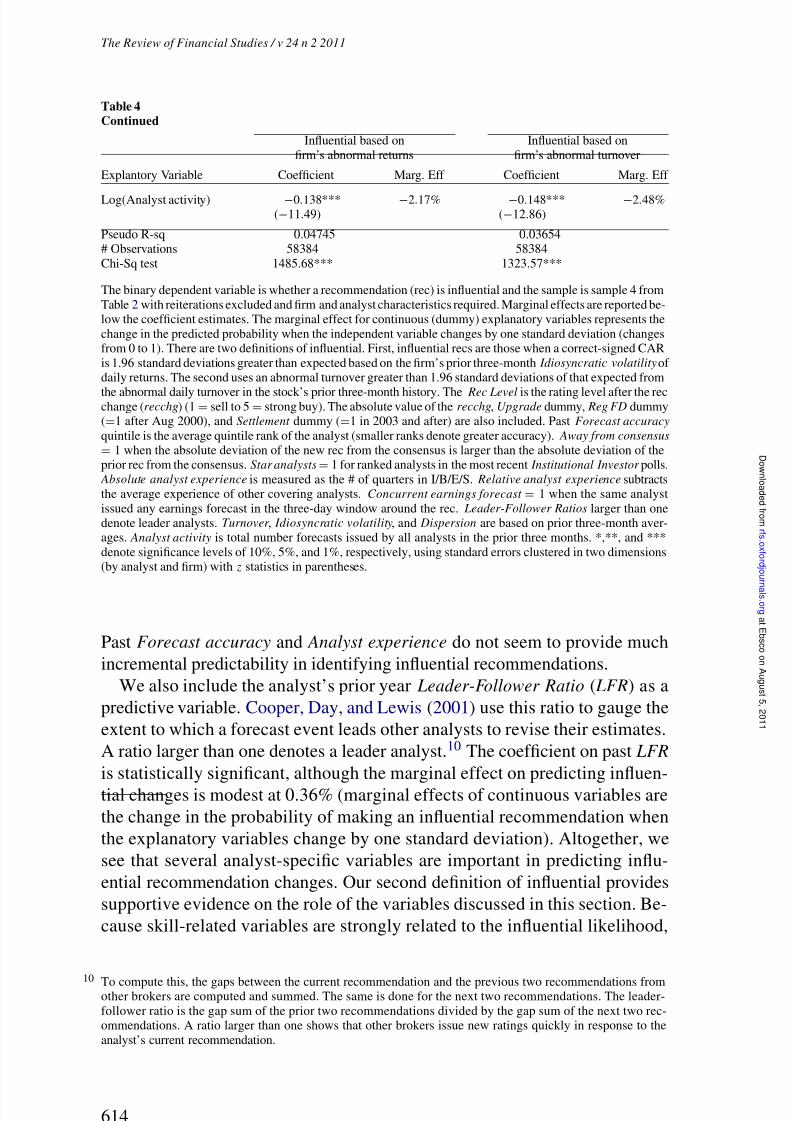
Past Forecast accuracy and Analyst experience do not seem to provide much
incremental predictability in identifying influential recommendations.
We also include the analyst’s prior year Leader-Follower Ratio ( LFR) as a
predictive variable. Cooper, Day, and Lewis (2001) use this ratio to gauge the
extent to which a forecast event leads other analysts to revise their estimates.
A ratio larger than one denotes a leader analyst.10 The coefficient on past LFR
is statistically significant, although the marginal effect on predicting influen-
tial changes is modest at 0.36% (marginal effects of continuous variables are
the change in the probability of making an influential recommendation when
the explanatory variables change by one standard deviation). Altogether, we
see that several analyst-specific variables are important in predicting influ-
ential recommendation changes. Our second definition of influential provides
supportive evidence on the role of the variables discussed in this section. Be-
cause skill-related variables are strongly related to the influential likelihood,
10 To compute this, the gaps between the current recommendation and the previous two recommendations fromother brokers are computed and summed. The same is done for the next two recommendations. The leader-
follower ratio is the gap sum of the prior two recommendations divided by the gap sum of the next two rec-ommendations. A ratio larger than one shows that other brokers issue new ratings quickly in response to the
analyst’s current recommendation.
614
a t E b s c o onA u g u s t 5 ,2 0 1 1
r f s . ox f or d j o ur n al s . or g
D ownl o a d e d f r om
8/4/2019 When Are Analyst Recommendation Changes Influential
http://slidepdf.com/reader/full/when-are-analyst-recommendation-changes-influential 23/35
When Are Analyst Recommendation Changes Influential?
we believe that it is analyst ability rather than chance that allows for the
generation of influential recommendation changes.
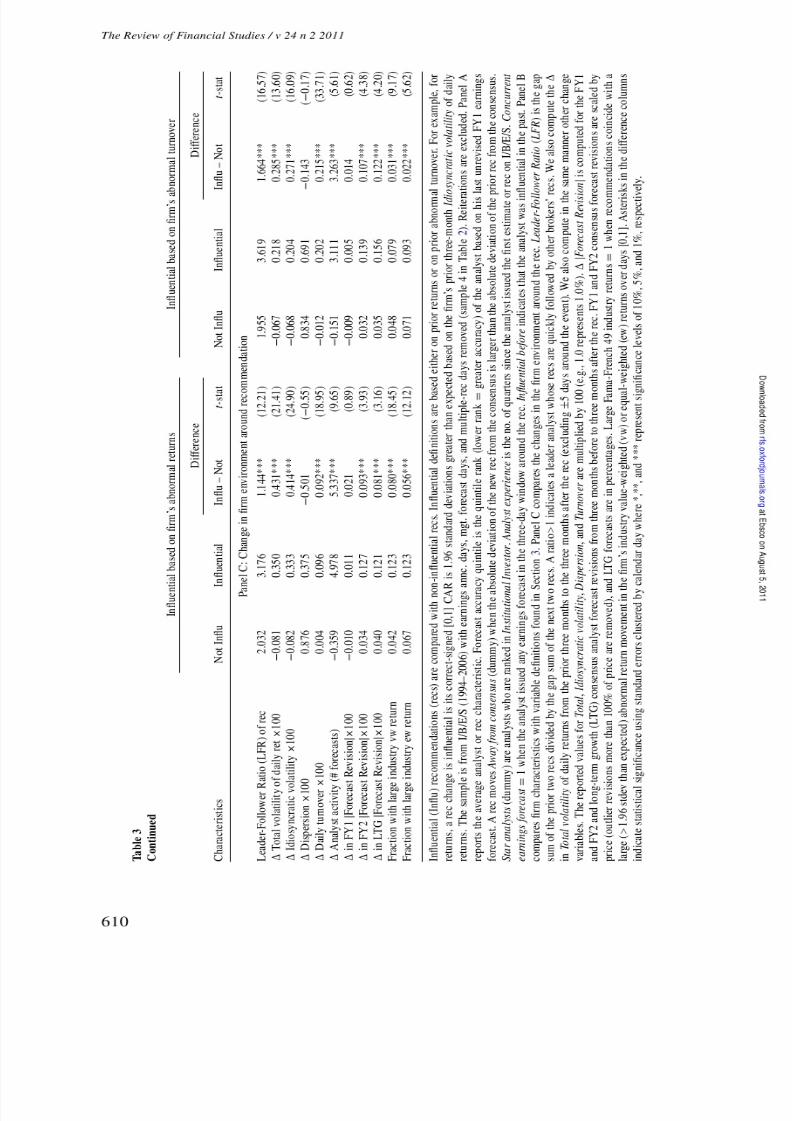
3.3 Firm characteristics of influential recommendations
We consider how firm characteristics differ between the influential and non-influential subsamples of Panel B of Table 3. Certain firm characteristics could
create conditions that make it more likely for analysts to make significant rec-
ommendation changes. For example, analysts may have more influence when
the value of the firm depends more on growth options that are harder to value
than assets-in-place. We see that influential recommendation changes tend to
be issued on firms that have a lower B/M ratio and are therefore more likely
to be growth firms. Also, the influential subsample is associated with smaller
size, higher Institutional ownership, lower Total volatility and Idiosyncratic
volatility, lower Turnover , and lower level of Analyst activity as proxied by thenumber of earnings forecasts during the prior three months. The results sug-
gest that analysts can more easily affect investors’ beliefs about a firm when
they are speaking in a smaller crowd. However, institutional investors are the
main consumers of analyst reports, so it is not surprising that analysts are more
likely to have a significant impact for high Institutional ownership firms. The
second definition of influential recommendation changes yields similar results.
The probit estimation in Table 4 provides supplementary results. In the inf-
luential in returns column, the firms that are more likely to receive impactful
recommendation changes are growth firms, small firms, high Institutionalownership firms, high prior Turnover firms, low Idiosyncratic volatility firms,
higher earnings forecast Dispersion firms,andlowprior Analyst activity (number
of forecasts issued) firms. Some firm variables have large marginal effects on
the probability of a recommendation change being influential. A one-standard-
deviation change in size has a −2.49% impact on being influential. The effect
for B/M is also high, at −1.51%. The impact of Analyst activity is −2.17%.
These results are generally consistent with the idea that an analyst is able to
contribute the most when the information environment surrounding the firm is
uncertain (e.g., small size, low B/M, and high Dispersion). Similar results areobtained in the probit estimation using the influential in turnover definition.
3.4 Changes to firm characteristics in response to influential reco-
mmendations
Since an influential recommendation change by definition causes a significant
stock-price or volume reaction, it must impact the way that investors view or
value the firm. The LFR provides some insight from the perspective of other
analysts (see Panel C of Table 3). If other analysts begin to issue recommen-dations quickly in response to the influential event, the LFR computed based
on the influential recommendation would be large. Indeed, this is the case.
The LFR of influential recommendations is 3.176, about 57% larger than the
615
a t E b s c o onA u g u s t 5 ,2 0 1 1
r f s . ox f or d j o ur n al s . or g
D ownl o a d e d f r om
8/4/2019 When Are Analyst Recommendation Changes Influential
http://slidepdf.com/reader/full/when-are-analyst-recommendation-changes-influential 24/35
The Review of Financial Studies / v 24 n 2 2011
average LFR of 2.032 in the non-influential subsample. The difference is even
starker in the influential in turnover definition, where the average LFR of in-
fluential recommendation changes is about 85% larger than the average LFR
of the non-influential subsample. Analyst activity also increases by 4.978 fore-
casts three months after the event. This increase is about 7% of the originallevel of analyst activity (Panel B of Table 3 shows there are 72.422 forecasts
in the three months prior to recommendation). Finally, average daily Turnover
goes up by 0.096 from a benchmark of 0.603% prior to the recommendation—
about a 15% increase. We also compare the change in average absolute magni-
tudes of monthly consensus earnings forecast revisions (scaled by price, with
outlier observations larger than 100% of price removed) three months after
the event to three months before. This change is higher for the influential sub-
samples compared to the non-influential subsample (e.g., for FY2 revisions,
0.127% is more than three times 0.034%).Volatility also increases after an influential recommendation change. We
compare volatility three months before and three months after the event, skip-
ping the ten days around the event. The change in daily Idiosyncratic volatil-
ity of returns is 0.333% for influential recommendations, while it is slightly
negative or close to zero for non-influential changes. Based on the average Id-
iosyncratic volatility of 2.195% (in Panel B of Table 3), a 0.333% increase
represents a sizable increase of about 15% from the prior level.
Finally, we investigate whether influential recommendations have an impact
on other firms in the same industry as the firm on which the recommendationis made. If the analyst’s influential recommendation contains industry infor-
mation, similar firms could also be impacted by the revision. For example,
banking stocks were also negatively affected by Meredith Whitney’s down-
grade of Citigroup. Evidence of such positive spillover is also consistent with
the theoretical work of Veldkamp (2006) on information markets that predict
that agents have incentives to produce information with implications for a sub-
set of assets. To allow a reasonable number of firms in the industry, we use
the Fama and French (1997) 49 industry groups and show both value-weighted
and equal-weighted industry returns. The industry’s return is considered largewhen its two-day (0,1) market-adjusted return is in the same direction as the
recommendation change and is greater than 1.96 ×√
2 × σi , where σi is the
standard deviation of residuals from a time-series regression of the industry’s
daily returns against market returns for the past three months. We show that
influential recommendations are associated with a larger fraction of large-
impact industry returns. In Table 3, Panel C, about 12.3% of the influential
recommendation changes are influential for the industry as well.
3.5 Post regulation probability of being influential
Our sample period straddles the pre- and post-regulation periods governing se-
curity analysis. Increased regulation can either stifle analysts’ ability to produce
616
a t E b s c o onA u g u s t 5 ,2 0 1 1
r f s . ox f or d j o ur n al s . or g
D ownl o a d e d f r om
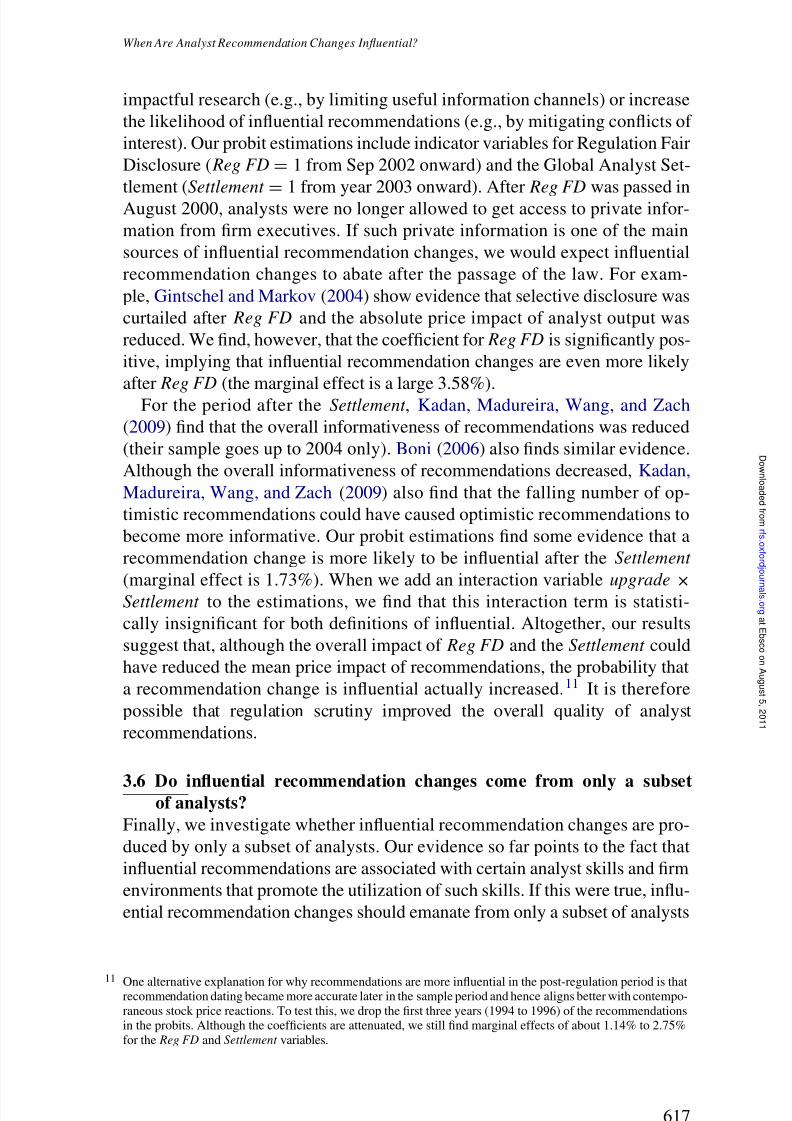
8/4/2019 When Are Analyst Recommendation Changes Influential
http://slidepdf.com/reader/full/when-are-analyst-recommendation-changes-influential 25/35
When Are Analyst Recommendation Changes Influential?
impactful research (e.g., by limiting useful information channels) or increase
the likelihood of influential recommendations (e.g., by mitigating conflicts of
interest). Our probit estimations include indicator variables for Regulation Fair
Disclosure ( Reg FD= 1 from Sep 2002 onward) and the Global Analyst Set-
tlement (Settlement
= 1 from year 2003 onward). AfterReg FD
was passed inAugust 2000, analysts were no longer allowed to get access to private infor-
mation from firm executives. If such private information is one of the main
sources of influential recommendation changes, we would expect influential
recommendation changes to abate after the passage of the law. For exam-
ple, Gintschel and Markov (2004) show evidence that selective disclosure was
curtailed after Reg FD and the absolute price impact of analyst output was
reduced. We find, however, that the coefficient for Reg FD is significantly pos-
itive, implying that influential recommendation changes are even more likely
afterReg FD
(the marginal effect is a large 3.58%).For the period after the Settlement , Kadan, Madureira, Wang, and Zach
(2009) find that the overall informativeness of recommendations was reduced
(their sample goes up to 2004 only). Boni (2006) also finds similar evidence.
Although the overall informativeness of recommendations decreased, Kadan,
Madureira, Wang, and Zach (2009) also find that the falling number of op-
timistic recommendations could have caused optimistic recommendations to
become more informative. Our probit estimations find some evidence that a
recommendation change is more likely to be influential after the Settlement
(marginal effect is 1.73%). When we add an interaction variableupgrade
×Settlement to the estimations, we find that this interaction term is statisti-
cally insignificant for both definitions of influential. Altogether, our results
suggest that, although the overall impact of Reg FD and the Settlement could
have reduced the mean price impact of recommendations, the probability that
a recommendation change is influential actually increased.11 It is therefore
possible that regulation scrutiny improved the overall quality of analyst
recommendations.
3.6 Do influential recommendation changes come from only a subsetof analysts?
Finally, we investigate whether influential recommendation changes are pro-
duced by only a subset of analysts. Our evidence so far points to the fact that
influential recommendations are associated with certain analyst skills and firm
environments that promote the utilization of such skills. If this were true, influ-
ential recommendation changes should emanate from only a subset of analysts
11 One alternative explanation for why recommendations are more influential in the post-regulation period is thatrecommendation dating became more accurate later in the sample period and hence aligns better with contempo-
raneous stock price reactions. To test this, we drop the first three years (1994 to 1996) of the recommendationsin the probits. Although the coefficients are attenuated, we still find marginal effects of about 1.14% to 2.75%
for the Reg FD and Settlement variables.
617
a t E b s c o onA u g u s t 5 ,2 0 1 1
r f s . ox f or d j o ur n al s . or g
D ownl o a d e d f r om
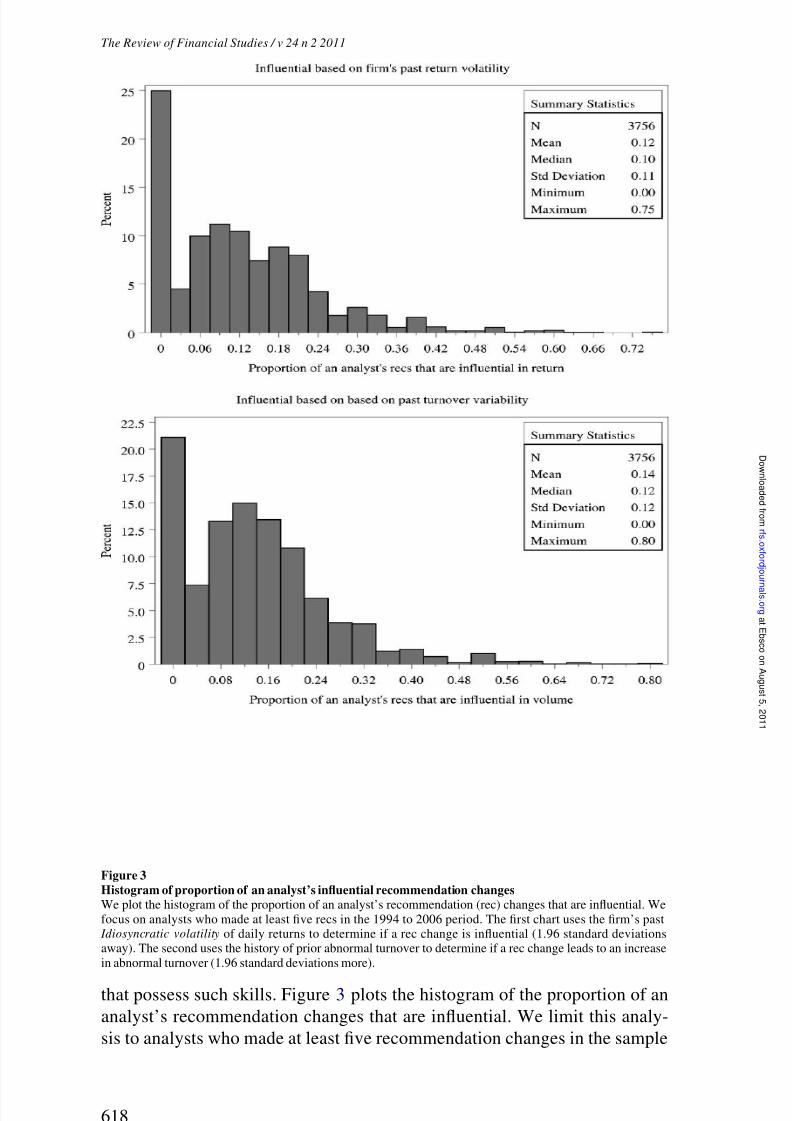
8/4/2019 When Are Analyst Recommendation Changes Influential
http://slidepdf.com/reader/full/when-are-analyst-recommendation-changes-influential 26/35
The Review of Financial Studies / v 24 n 2 2011
Figure 3Histogram of proportion of an analyst’s influential recommendation changesWe plot the histogram of the proportion of an analyst’s recommendation (rec) changes that are influential. We
focus on analysts who made at least five recs in the 1994 to 2006 period. The first chart uses the firm’s past Idiosyncratic volatility of daily returns to determine if a rec change is influential (1.96 standard deviationsaway). The second uses the history of prior abnormal turnover to determine if a rec change leads to an increase
in abnormal turnover (1.96 standard deviations more).
that possess such skills. Figure 3 plots the histogram of the proportion of an
analyst’s recommendation changes that are influential. We limit this analy-
sis to analysts who made at least five recommendation changes in the sample
618
a t E b s c o onA u g u s t 5 ,2 0 1 1
r f s . ox f or d j o ur n al s . or g
D ownl o a d e d f r om
8/4/2019 When Are Analyst Recommendation Changes Influential
http://slidepdf.com/reader/full/when-are-analyst-recommendation-changes-influential 27/35
When Are Analyst Recommendation Changes Influential?
period. If all analysts were equally capable of making influential recommen-
dation changes, we would expect the distribution to peak around the average
proportion of influential recommendation changes in the entire sample. The
figure shows otherwise. The first chart uses the returns definition of influential.
Although the unconditional proportion of influential recommendation changesis 11.7% in the sample, 24.9% of all analysts never issue a single influential
recommendation change in their recommendation histories (in our sample).
For the turnover definition of influential, about 20.8% of analysts have never
issued an influential recommendation change. This skewed distribution indi-
cates that only some analysts are influential and that there is a sizable pro-
portion of analysts whose recommendation changes never have a noticeable
stock-price impact, consistent with the skill story. These distribution statistics
tell a consistent story with our analyst characteristics analysis.
Table 5 shows that, if an analyst has ever been influential, about 22.1% of the analyst’s recommendations are influential. This number is 23.5% for the
turnover definition of influential. Table 5 also compares the characteristics of
analysts who issue at least one influential recommendation change ( Ever influ-
ential) in the sample versus the other ( Never influential) analysts. One would
expect the Ever influential group to dominate the Never influential group in
terms of skill, experience, star status, etc. Indeed, this is the case. Ever in-
fluential analysts have better average analyst earnings forecast accuracy ranks.
They are also more likely to have once been a Star analyst and have greater ab-
solute and relativeAnalyst experience
compared toNever influential
analysts.The difference in the Star analyst proportion is especially large, with 25.3%
stars for the Ever influential group versus 9.2% for the Never group. It is pos-
sible, however, that an analyst is more likely to be selected as a Star analyst
because he or she has had influential recommendations. There is only mixed
evidence that analysts in the Ever influential group issue more recommenda-
tions Away from consensus and issue Concurrent earnings forecasts with their
recommendations.
4. Robustness Tests and Different Samples
4.1 Other definitions of influential
We also use other methods of classifying recommendation changes as influ-
ential and use different samples with generally similar results (results not re-
ported here are in the online appendix of this article). We summarize those
methods here.
First, we are sensitive to potential issues arising from the usage of an an-
alyst’s own prior recommendation in the computation of recchg. If the prior
recommendation is stale, recchg could contain stale information and we could
understate the fraction of influential recommendations. However, we are carefulto use the review date in I/B/E/S and the stopped date so that we have confi-
dence that the prior rating is still outstanding whenever we compute a recchg
value.
619
a t E b s c o onA u g u s t 5 ,2 0 1 1
r f s . ox f or d j o ur n al s . or g
D ownl o a d e d f r om
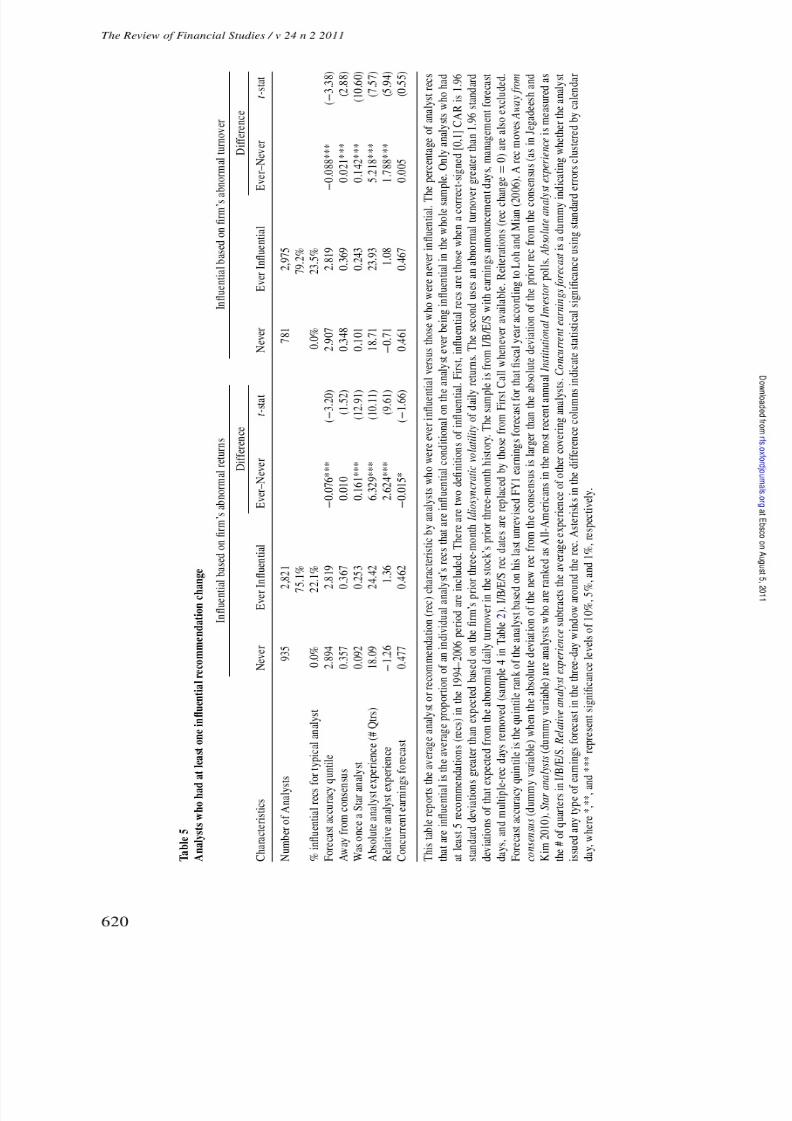
8/4/2019 When Are Analyst Recommendation Changes Influential
http://slidepdf.com/reader/full/when-are-analyst-recommendation-changes-influential 28/35
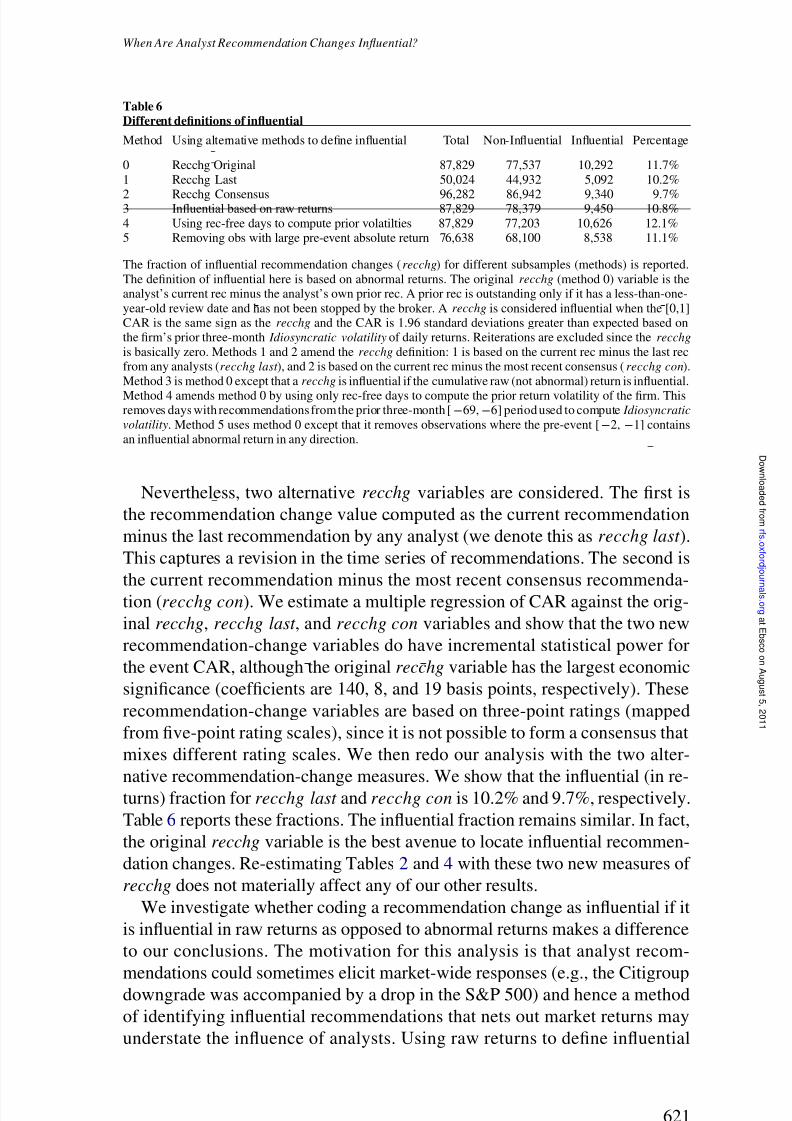
8/4/2019 When Are Analyst Recommendation Changes Influential
http://slidepdf.com/reader/full/when-are-analyst-recommendation-changes-influential 29/35
When Are Analyst Recommendation Changes Influential?
Table 6Different definitions of influential
Method Using alternative methods to define influential Total Non-Influential Influential Percentage
0 Recchg Original 87,829 77,537 10,292 11.7%
1 Recchg Last 50,024 44,932 5,092 10.2%
2 Recchg Consensus 96,282 86,942 9,340 9.7%3 Influential based on raw returns 87,829 78,379 9,450 10.8%
4 Using rec-free days to compute prior volatilties 87,829 77,203 10,626 12.1%5 Removing obs with large pre-event absolute return 76,638 68,100 8,538 11.1%
The fraction of influential recommendation changes (recchg) for different subsamples (methods) is reported.
The definition of influential here is based on abnormal returns. The original recchg (method 0) variable is theanalyst’s current rec minus the analyst’s own prior rec. A prior rec is outstanding only if it has a less-than-one-
year-old review date and has not been stopped by the broker. A recchg is considered influential when the [0,1]CAR is the same sign as the recchg and the CAR is 1.96 standard deviations greater than expected based onthe firm’s prior three-month Idiosyncratic volatility of daily returns. Reiterations are excluded since the recchg
is basically zero. Methods 1 and 2 amend the recchg definition: 1 is based on the current rec minus the last recfrom any analysts (recchg last ), and 2 is based on the current rec minus the most recent consensus (recchg con).
Method 3 is method 0 except that a recchg is influential if the cumulative raw (not abnormal) return is influential.
Method 4 amends method 0 by using only rec-free days to compute the prior return volatility of the firm. Thisremoves days with recommendations from the prior three-month [−69,−6] period used to compute Idiosyncratic
volatility. Method 5 uses method 0 except that it removes observations where the pre-event [−2, −1] containsan influential abnormal return in any direction.
Nevertheless, two alternative recchg variables are considered. The first is
the recommendation change value computed as the current recommendation
minus the last recommendation by any analyst (we denote this as recchg last ).
This captures a revision in the time series of recommendations. The second is
the current recommendation minus the most recent consensus recommenda-tion (recchg con). We estimate a multiple regression of CAR against the orig-
inal recchg, recchg last , and recchg con variables and show that the two new
recommendation-change variables do have incremental statistical power for
the event CAR, although the original recchg variable has the largest economic
significance (coefficients are 140, 8, and 19 basis points, respectively). These
recommendation-change variables are based on three-point ratings (mapped
from five-point rating scales), since it is not possible to form a consensus that
mixes different rating scales. We then redo our analysis with the two alter-
native recommendation-change measures. We show that the influential (in re-turns) fraction for recchg last and recchg con is 10.2% and 9.7%, respectively.
Table 6 reports these fractions. The influential fraction remains similar. In fact,
the original recchg variable is the best avenue to locate influential recommen-
dation changes. Re-estimating Tables 2 and 4 with these two new measures of
recchg does not materially affect any of our other results.
We investigate whether coding a recommendation change as influential if it
is influential in raw returns as opposed to abnormal returns makes a difference
to our conclusions. The motivation for this analysis is that analyst recom-
mendations could sometimes elicit market-wide responses (e.g., the Citigroupdowngrade was accompanied by a drop in the S&P 500) and hence a method
of identifying influential recommendations that nets out market returns may
understate the influence of analysts. Using raw returns to define influential
621
a t E b s c o onA u g u s t 5 ,2 0 1 1
r f s . ox f or d j o ur n al s . or g
D ownl o a d e d f r om
8/4/2019 When Are Analyst Recommendation Changes Influential
http://slidepdf.com/reader/full/when-are-analyst-recommendation-changes-influential 30/35
The Review of Financial Studies / v 24 n 2 2011
eliminates this problem. We show that the raw return-based measure of in-
fluential obtains a 10.8% fraction of influential observations, not higher but
lower than our original 11.7%. Therefore, we are confident that our baseline
approach to identify influential recommendations based on abnormal returns is
not biased.Fourth, one might argue that our approach is too conservative because the
significance of the stock-price impact of recommendation changes does not
depend on a benchmark, which itself might include influential recommen-
dation changes. To evaluate this issue, we repeat our analysis by removing
non-corporate event recommendation days from the computation of prior Id-
iosyncratic volatility of stock returns. This slightly increases the fraction of
recommendation changes that are influential. The fraction is now 12.1%. This
could be due to the fact that only a small fraction of recommendations are
influential. Therefore, the typical estimate of Idiosyncratic volatility
using allobservations is not an overly high hurdle under our main influential definition.
Fifth, one potential concern is that influential recommendations have a large
reaction because they piggyback on some firm-related event not captured by
our screens. Because it is difficult to mount an exhaustive news wire search for
corporate events in our large sample, we proxy for a contaminating event using
the pre-recommendation stock returns. We impose this additional screen of re-
moving recommendations if the absolute value of the day [−2, −1] pre-event
return is more than 1.96 ×√
2 standard deviations of the firm’s prior Idiosyn-
cratic volatilityof returns. About 13% of observations are removed using thisscreen. However, none of our results are changed with this new sample. With
this reduced sample, 11.1% of the recommendation changes are still classified
as influential in returns.12
In sum, our results are robust to alternative definitions of recommendation
changes, influential definitions, and different samples.13
12 An additional concern is that there could be more important company-specific news events on or immediately
before days that influential recommendations are made than on other days, so our identification of analyst rec-ommendation changes as influential might be spurious. To investigate whether news events are more likely on
days with influential recommendations, we select 100 influential and 100 non-influential observations randomlyand use Factiva to search for corporate news in Dow Jones and Reuters newswires from day −2 to the recom-mendation date. We limit our search to corporate news relating to mergers and acquisitions, lawsuits, security
issuance, dividend changes, debt rating news, and earnings guidance or announcements. We find 19 observa-tions with such events in the influential sample and 25 in the non-influential sample. Hence, there is no evidence
that the influential subsample contains more corporate news-motivated recommendation changes. Of the 44 ob-servations, most do not elicit any large stock-price reaction. Our pre-event screen is hence especially useful forremoving large reaction observations. The pre-event price screen removes 10 observations. The average absolute
value of pre-event returns for these 10 is 17.9%. For the remaining 34 observations, the average absolute value of pre-event returns is only 1.9%. This provides evidence that most of the corporate events our screens miss do not
exert a large impact on the stock price. We believe that using returns to identify pre-events is a better approachthan searching for news articles because news articles may not always elicit discernible stock-price reactions.
13 One other test we do relates to addressing the concern that I/B/E/S provides only an incomplete record of the
universe of stock recommendations (e.g., Ljungqvist, Malloy, and Marston 2009). We include broker-matchedrecommendations from First Call not found on I/B/E/S. We let these observations inherit an I/B/E/S analyst
identifier if the closest prior and future (two-year window centered on the First Call observation) I/B/E/Srecommendations have the same analyst identifier. With this combined sample, the percentage of influential
recommendation changes remains similar, at 11.5%. Probit estimations also yield similar results.
622
a t E b s c o onA u g u s t 5 ,2 0 1 1
r f s . ox f or d j o ur n al s . or g
D ownl o a d e d f r om
8/4/2019 When Are Analyst Recommendation Changes Influential
http://slidepdf.com/reader/full/when-are-analyst-recommendation-changes-influential 31/35
When Are Analyst Recommendation Changes Influential?
4.2 Comparing influential fraction in earnings forecasts versus reco-
mmendation samples
Our article focuses on stock recommendations. However, analyst reports also
contain another important output—revisions of earnings forecasts. Our prior
is that stock recommendations are more likely to be influential. A recommen-dation is an explicit statement on whether an investor should buy or sell the
stock, while an earnings forecast revision is not. Recommendations can re-
ceive a great deal of attention in the press, as evidenced by the examples at
the start of this article; the same attention is rarely given to earnings forecast
changes. Finally, a recommendation can encompass the joint impact of cash
flow and discount rate news on the stock price, while standalone earnings fore-
casts contain only cash flow news. However, we now investigate whether the
evidence is consistent with our prior.
We consider three forecast horizons: one-quarter-ahead, one-year-ahead, andlong-term-growth (LTG) forecasts from I/B/E/S. We conduct a similar exercise
in hand-matching broker names between I/B/E/S and First Call (FC) and uti-
lize First Call dates whenever possible. For each forecast horizon, we classify
earnings forecasts into upward and downward revisions based on three meth-
ods: revision own, revision last , and revision con, in a manner akin to our three
recommendation-change measures. We then remove firm news-contaminated
observations using the sample 2 to 4 screens as in Table 2. The replication
of Table 2 using earnings forecasts shows that revisions elicit statistically sig-
nificant stock-price reactions, although their reaction magnitudes are smallerthan those of recommendation changes (the online appendix contains these
results).
We then report the influential fraction in Table 7. Interestingly, the fraction
hovers around 5%. This is close to the percentage of influential observations
that we would have expected by chance alone. However, whenever the earnings
forecast revision is accompanied by a stock recommendation in the three-day
window around the revision, the influential fraction goes up to about 10%,
consistent with the results from our recommendation change sample. We also
show evidence from the flip side—if the current recommendation change isaccompanied by an earnings forecast in the three-day window, the influential
fraction increases from 11.7% to 13.2%. This is in line with the findings of
Kecskes, Michaely, and Womack (2009).
5. Conclusion
Recommendation changes are sometimes associated with extremely large ab-
normal returns, and these changes are typically the ones that the press focuses
on. Such changes are associated with stock-price reactions that are quite differ-ent from the stock-price reaction of the typical recommendation change. The
existing literature on analyst recommendation changes focuses on the average
stock-price reaction. We show that when proper care is taken to account for
623
a t E b s c o onA u g u s t 5 ,2 0 1 1
r f s . ox f or d j o ur n al s . or g
D ownl o a d e d f r om
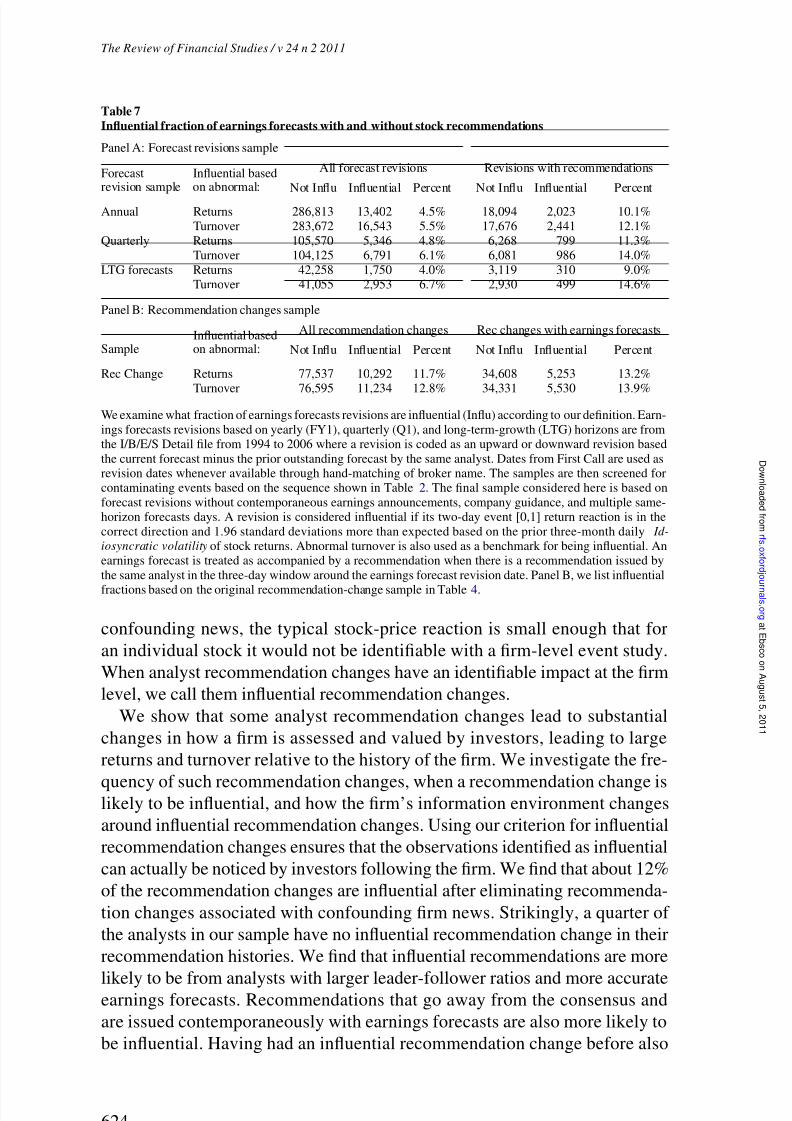
8/4/2019 When Are Analyst Recommendation Changes Influential
http://slidepdf.com/reader/full/when-are-analyst-recommendation-changes-influential 32/35
The Review of Financial Studies / v 24 n 2 2011
Table 7Influential fraction of earnings forecasts with and without stock recommendations
Panel A: Forecast revisions sample
All forecast revisions Revisions with recommendations
Not Influ Influential Percent Not Influ Influential PercentForecast Influential basedrevision sample on abnormal:
Annual Returns 286,813 13,402 4.5% 18,094 2,023 10.1%Turnover 283,672 16,543 5.5% 17,676 2,441 12.1%
Quarterly Returns 105,570 5,346 4.8% 6,268 799 11.3%Turnover 104,125 6,791 6.1% 6,081 986 14.0%
LTG forecasts Returns 42,258 1,750 4.0% 3,119 310 9.0%Turnover 41,055 2,953 6.7% 2,930 499 14.6%
Panel B: Recommendation changes sample
All recommendation changes Rec changes with earnings forecasts
Not Influ Influential Percent Not Influ Influential PercentInfluential based
Sample on abnormal:
Rec Change Returns 77,537 10,292 11.7% 34,608 5,253 13.2%Turnover 76,595 11,234 12.8% 34,331 5,530 13.9%
We examine what fraction of earnings forecasts revisions are influential (Influ) according to our definition. Earn-
ings forecasts revisions based on yearly (FY1), quarterly (Q1), and long-term-growth (LTG) horizons are fromthe I/B/E/S Detail file from 1994 to 2006 where a revision is coded as an upward or downward revision based
the current forecast minus the prior outstanding forecast by the same analyst. Dates from First Call are used asrevision dates whenever available through hand-matching of broker name. The samples are then screened forcontaminating events based on the sequence shown in Table 2. The final sample considered here is based on
forecast revisions without contemporaneous earnings announcements, company guidance, and multiple same-horizon forecasts days. A revision is considered influential if its two-day event [0,1] return reaction is in the
correct direction and 1.96 standard deviations more than expected based on the prior three-month daily Id-
iosyncratic volatility of stock returns. Abnormal turnover is also used as a benchmark for being influential. Anearnings forecast is treated as accompanied by a recommendation when there is a recommendation issued by
the same analyst in the three-day window around the earnings forecast revision date. Panel B, we list influential
fractions based on the original recommendation-change sample in Table 4.
confounding news, the typical stock-price reaction is small enough that for
an individual stock it would not be identifiable with a firm-level event study.
When analyst recommendation changes have an identifiable impact at the firm
level, we call them influential recommendation changes.
We show that some analyst recommendation changes lead to substantial
changes in how a firm is assessed and valued by investors, leading to large
returns and turnover relative to the history of the firm. We investigate the fre-
quency of such recommendation changes, when a recommendation change islikely to be influential, and how the firm’s information environment changes
around influential recommendation changes. Using our criterion for influential
recommendation changes ensures that the observations identified as influential
can actually be noticed by investors following the firm. We find that about 12%
of the recommendation changes are influential after eliminating recommenda-
tion changes associated with confounding firm news. Strikingly, a quarter of
the analysts in our sample have no influential recommendation change in their
recommendation histories. We find that influential recommendations are more
likely to be from analysts with larger leader-follower ratios and more accurateearnings forecasts. Recommendations that go away from the consensus and
are issued contemporaneously with earnings forecasts are also more likely to
be influential. Having had an influential recommendation change before also
624
a t E b s c o onA u g u s t 5 ,2 0 1 1
r f s . ox f or d j o ur n al s . or g
D ownl o a d e d f r om
8/4/2019 When Are Analyst Recommendation Changes Influential
http://slidepdf.com/reader/full/when-are-analyst-recommendation-changes-influential 33/35
When Are Analyst Recommendation Changes Influential?
improves the likelihood of having an impactful recommendation change, giv-
ing credit to the view that analyst skill is an important determinant of impactful
research. Further, growth firms, small firms, high institutional ownership firms,
and low analyst activity firms are more likely to be associated with influential
recommendations.Why is it that an analyst at times can make recommendations that are asso-
ciated with a significant firm-level abnormal return or turnover? We conjecture
that at times analysts can change how a corporation is viewed and that such
“paradigm shifts” are responsible for the large impact of some of the recom-
mendation changes. This perspective is related to Hong, Stein, and Yu (2007),
who study the implications of learning in an environment in which the true
model of the world is a multivariate one, but agents update only over the class
of simple univariate models. When sufficient evidence accumulates against the
incumbent simple model, agents switch to another simple model, and pricesin the underlying stock move to reflect this paradigm shift. While our analy-
sis does not amount to a test of their model, our evidence is consistent with
an influential analyst recommendation change being able to precipitate such a
paradigm shift. It is not surprising, therefore, that firms experiencing influential
recommendation changes see their stock turnover increase, their volatility in-
crease, and analysts make more and bigger earnings forecast changes. Further,
industry returns are also impacted around the recommendation event.
Our evidence shows that focusing on the average stock-price reaction to
changes in analyst recommendations leads to an incomplete assessment of the value of the information produced by analysts. The size of the average
stock-price reaction to recommendation changes is small enough that investors
would not notice how a recommendation affects a stock, if it does at all. This
is because many analysts do not make influential recommendations and not all
recommendations are influential. However, our evidence suggests that some
analysts do make recommendation changes that change how a firm is assessed
by investors.
Supplementary DataSupplementary data are available online at http://www.sfsrfs.org/addenda/ .
References
Altinkilic, O., and R. S. Hansen. 2009. On the Information Role of Stock Recommendation Revisions. Journal
of Accounting and Economics 48:17–36.
Asquith, P., M. B. Mikhail, and A. Au. 2005. Information Content of Equity Analyst Reports. Journal of
Financial Economics 75:245–82.
Barber, B. M., R. Lehavy, M. McNichols, and B. Trueman. 2006. Buys, Holds, and Sells: The Distributionof Investment Banks’ Stock Ratings and the Implications for the Profitability of Analysts’ Recommendations.
Journal of Accounting and Economics41:87–117.
Boni, L. 2006. Analyzing the Analysts after the Global Settlement. In Y. Fuchita and R. E. Litan (eds.), Finan-
cial Gatekeepers: Can They Protect Investors? Brookings Institution Press and the Nomura Institute of CapitalMarkets Research.
625
a t E b s c o onA u g u s t 5 ,2 0 1 1
r f s . ox f or d j o ur n al s . or g
D ownl o a d e d f r om
8/4/2019 When Are Analyst Recommendation Changes Influential
http://slidepdf.com/reader/full/when-are-analyst-recommendation-changes-influential 34/35
The Review of Financial Studies / v 24 n 2 2011
Boni, L., and K. L. Womack. 2006. Analysts, Industries, and Price Momentum. Journal of Financial & Quanti-
tative Analysis 41:85–109.
Bradley, D. J., B. D. Jordan, and J. R. Ritter. 2008. Analyst Behavior Following IPOs: The “Bubble Period”
Evidence. Review of Financial Studies 21:101–33.
Chen, Q., J. Francis, and K. Schipper. 2005. The Applicability of the Fraud on the Market Presumption to
Analysts’ Forecasts. Working Paper, Duke University.
Clement, M. B., and S. Y. Tse. 2003. Do Investors Respond to Analysts’ Forecast Revisions as If Forecast
Accuracy Is All That Matters? Accounting Review 78:227–49.
Cooper, R. A., T. E. Day, and C. M. Lewis. 2001. Following the Leader: A Study of Individual Analysts’ Earnings
Forecasts. Journal of Financial Economics 61:383–416.
Daniel, K., M. Grinblatt, S. Titman, and R. Wermers. 1997. Measuring Mutual Fund Performance withCharacteristic-based Benchmarks. Journal of Finance 52:1035–58.
Fama, E. F., and K. R. French. 1997. Industry Costs of Equity. Journal of Financial Economics 43:153–93.
. 2006. The Value Premium and the CAPM. Journal of Finance 61:2163–85.
Fang, L., and A. Yasuda. 2008. Are Stars’ Opinions Worth More? The Relation between Analyst Reputation andRecommendation Values. Working Paper, University of Pennsylvania.
Frankel, R., S. P. Kothari, and J. Weber. 2006. Determinants of the Informativeness of Analyst Research. Journal
of Accounting and Economics41:29–54.
Gintschel, A., and S. Markov. 2004. The Effectiveness of Regulation FD. Journal of Accounting and Economics
37:293–314.
Gleason, C. A., and C. M. C. Lee. 2003. Analyst Forecast Revisions and Market Price Discovery. Accounting
Review 78:193–225.
Hong, H., J. C. Stein, and J. Yu. 2007. Simple Forecasts and Paradigm Shifts. Journal of Finance 62:1207–42.
Irvine, P. J. 2004. Analysts’ Forecasts and Brokerage-firm Trading. Accounting Review 79:125–49.
Ivkovic, Z., and N. Jegadeesh. 2004. The Timing and Value of Forecast and Recommendation Revisions. Journal
of Financial Economics 73:433–63.
Jegadeesh, N., and W. Kim. 2010. Do Analysts Herd? An Analysis of Recommendations and Market Reactions. Review of Financial Studies 23:901–37.
Kadan, O., L. Madureira, R. Wang, and T. Zach. 2009. Conflicts of Interest and Stock Recommendations: TheEffects of the Global Settlement and Related Regulations. Review of Financial Studies 22:4189–217.
Kecskes, A., R. Michaely, and K. L. Womack. 2009. What Drives the Value of Analysts’ Recommendations:
Earnings Estimates or Discount Rate Estimates? Working Paper, Darthmouth College.
Knez, P. J., and M. J. Ready. 1997. On the Robustness of Size and Book-to-market in Cross-sectional Regres-
sions. Journal of Finance 52:1355–82.
Ljungqvist, A., C. J. Malloy, and F. C. Marston. 2009. Rewriting History. Journal of Finance 64:1935–60.
Ljungqvist, A., F. Marston, and W. J. Wilhelm. 2009. Scaling the Hierarchy: How and Why Investment Banks
Compete for Syndicate Co-management Appointments. Review of Financial Studies 22:3977–4007.
Llorente, G., R. Michaely, G. Saar, and J. Wang. 2002. Dynamic Volume-return Relation of Individual Stocks. Review of Financial Studies 15:1005–47.
Loh, R. K. 2010. Investor Inattention and the Underreaction to Stock Recommendations. Financial Management 39:1223–51.
Loh, R. K., and G. M. Mian. 2006. Do Accurate Earnings Forecasts Facilitate Superior Investment Recommen-dations? Journal of Financial Economics80:455–83.
626
a t E b s c o onA u g u s t 5 ,2 0 1 1
r f s . ox f or d j o ur n al s . or g
D ownl o a d e d f r om

8/4/2019 When Are Analyst Recommendation Changes Influential
http://slidepdf.com/reader/full/when-are-analyst-recommendation-changes-influential 35/35
When Are Analyst Recommendation Changes Influential?
Malmendier, U., and D. Shanthikumar. 2007. Are Investors Naıve About Incentives? Journal of Financial
Economics 85:457–89.
Mikhail, M. B., B. R. Walther, and R. H. Willis. 1997. Do Security Analysts Improve Their Performance with
Experience? Journal of Accounting Research 35:131–57.
Stickel, S. E. 1995. The Anatomy of Buy and Sell Recommendations. Financial Analysts Journal 51:25–39.
Thompson, S. 2010. Simple Formulas for Standard Errors That Cluster by Both Firm and Time. Journal of
Financial Economics, forthcoming.
Veldkamp, L. L. 2006. Information Markets and the Comovement of Asset Prices. Review of Economic Studies
73:823–45.
a t E b s c o onA u g u s t 5 ,2 0 1 1
r f s . ox f or d j o ur n al s . or g
D ownl o a d e d f r om