Embed Size (px)
Citation preview
A PAPER PRESENTED
AT
THE ASCE—PORTLAND CONVENTION
PORTLAND, OREGON
JUNE 23.21, 1958
HYDRAULICS BRANCH OFFICIAL FILE COPY
urri'vt FILE COPY
WHEN BORROWED RETURN PROMPTLY
LABORATORY STUDY TO DETERMINE COVER BLANKET FOR KENNEWICK
MAIN CANAL, WASHINGTON
by
Enos J. Carlson
Supervising Hydraulic Engineer
Division of Engineering laboratories
Bureau of Reclamation
Denver, Colorado
CD
.9

LABORATORY STUDY TO DETERMINE COVER BLANKET FOR KENNEWICK MAIN CANAL, WASHINGTON
by Enos J. Carlson*
Member, ASCE
SYNOPSIS
Surface wave erosion tests were performed in a hydraulic wave flume on materials shipped from Yakima Project, Washington. The tests were made to determine the cover blanket needed to prevent leaching of fine base material. Angular talus and rounded gravel materials were shipped to the laboratory from the field,together with fine base material to make the tests.
The most stable cover blanket was formed by.screening the talus material on a 3/4-inch screen. The minus 3/4-inch material being placed over the base material with the plus 3/4-inch material on the surface. Motion pictures were taken for a record of the 14 tests.
INTRODUCTION
Some factors which must be considered in the design of unlined and earth lined canals are those which may cause erosion and, consequently, develop into an extensive maintenance problem. They include: excessive tractive forces which are caused by high velocities and, consequently, result in erosion over a large part of the wetted perimeter; and those forces caused by surface waves which produce erosion on the banks at the water surface. The extent and rate of erosion produced by these forces which exist in many unlined and earth lined canals designed and constructed by the Bureau of Reclamation, depend upon the type and gradation of the soil material through which the canals are constructed.
The Kennewick Main Canal, a feature of the Bureau of Reclamation's Yakima Project in the state of Washington, was constructed in an area where the material is fine and silty and has little cohesion. It is described as a highly compressible micaceous, nonplastic silt which had its origin in old lake beds. When dry, it is easily crumbled into a powdery dust. Over 70 percent of the silty material passes the No. 200 United States standard screen. This type of material, combined with the prevalent wind in the area., provided the conditions for possible erosion on the canal banks due to waves created by the wind. The prevailing direction of the wind is generally west to northwest and is in the same general direction as a large part of the canal. The many curves which were necessary on the canal, constructed in hilly topography, are especially vulnerable to erosion caused by surface waves. It was decided that some type of protective cover over the fine material for the Kennewick Main Canal was essential,
*Head, Sediment Investigations Unit, Hydraulic Laboratory, Bureau of Reclamation, Denver, Colorado.
particularly on the curves. A hydraulic model study was made to help determine the adequacy of the available materials to be used as a cover blanket, and determine the method of placement that would give the best protection for the least amount of material and cost.
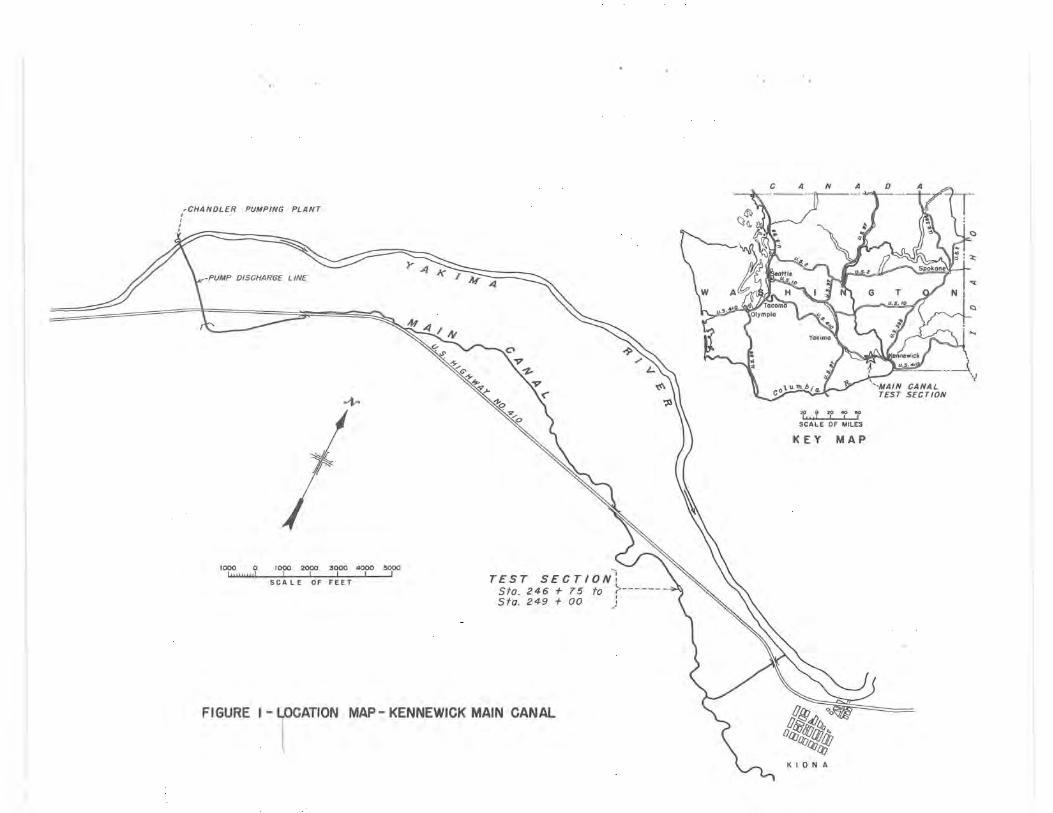
The Kennewick Main Canal is located in Benton County, Washington, near the Yakima River, between the towns of Prosser and Kennewick (Figure 1). The canal is approximately 42.3 miles in length and is designed to carry a discharge of from 500 to 275 efs. The unlined and earth lined sections have a 14-foot bottom width and side slopes of 2:1. The depth varies from 7.61 feet to 5.66 feet, corresponding to the discharges cited above. Construction of the canal provides irrigation for approximately 14,500 irrigable acres of new land and additional irrigation for approximately 4,600 acres of land in the area that had been under irrigation. The design capacity of the canal will permit eventual irrigation of approximately 6,100 acres of additional land.
HYJORAULIC MOTEL
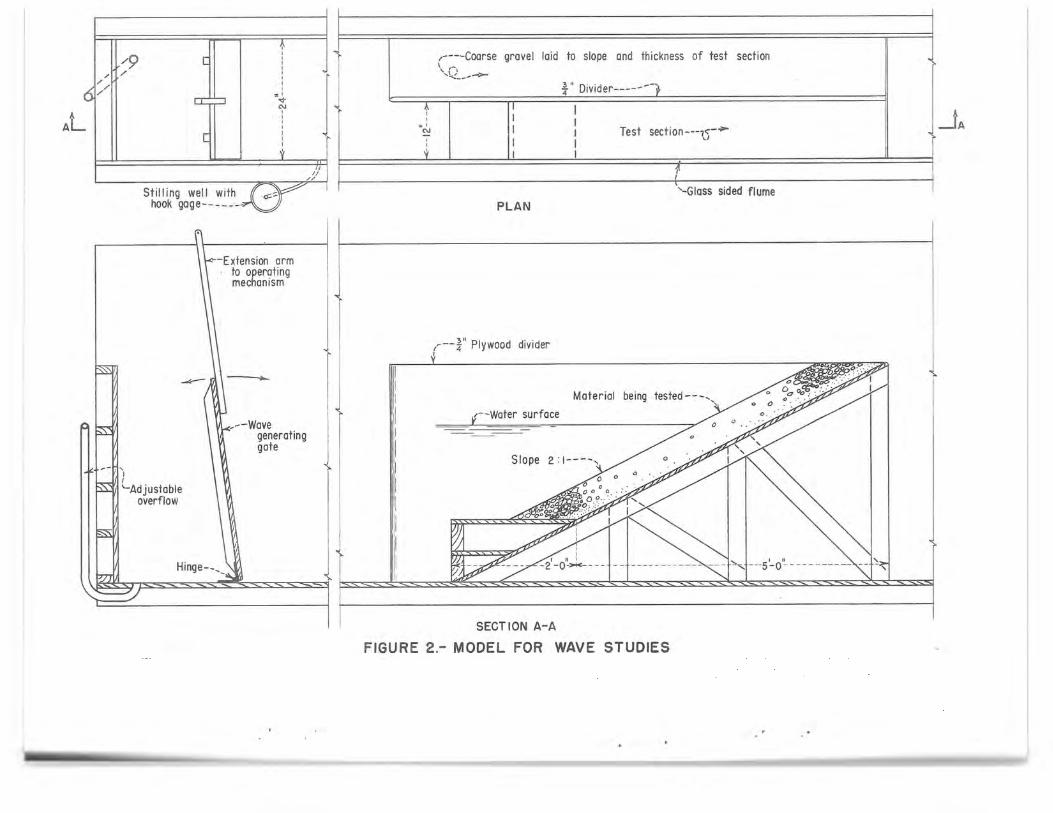
As shown in Figure 2, a 2:1 slope of plywood was built in an existing flume which was 2 feet wide, 6 feet deep, and approximately 24 feet in length. To make a maximum number of tests with the material which had been shipped from the field to the Bureau's hydraulic Laboratory in Denver, a plywood divider was placed on the slope, dividing it into two sections. The 1-foot-wide area on the side of the plywood divider next to the glass observation window was used for placing the test section. 0n the other side of the divider, a gravel wave absorber was placed to reduce reflections from this area.
A wave machine, Figure 3, consisted of a bulkhead hinged at the bottom of the flume and moved back and forth about the hinge by an arm connected to a large pulley wheel. The pulley wheel had holes drilled at various radii from the center, thus giving a stroke to the wave-making bulkhead which could be varied from 2-1/8 to 11 inches. A 3/4-hp motor connected to a set of variable speed pulleys completed the wave-making apparatus. With this setup, it was possible to change the frequency of waves from 6 to 315 waves per minute.
In these model tests, the waves were made to move at right angles to the canal slope, and resulting beaching action was more severe than the same height of wave would have been in a prototype canal where the waves would move longitudinally along the side slopes. However, it was possible to compare the various test setups with this condition and thereby select the beat test arrangement. With the various setups on the wave-producing machine, it was possible to obtain
4
2
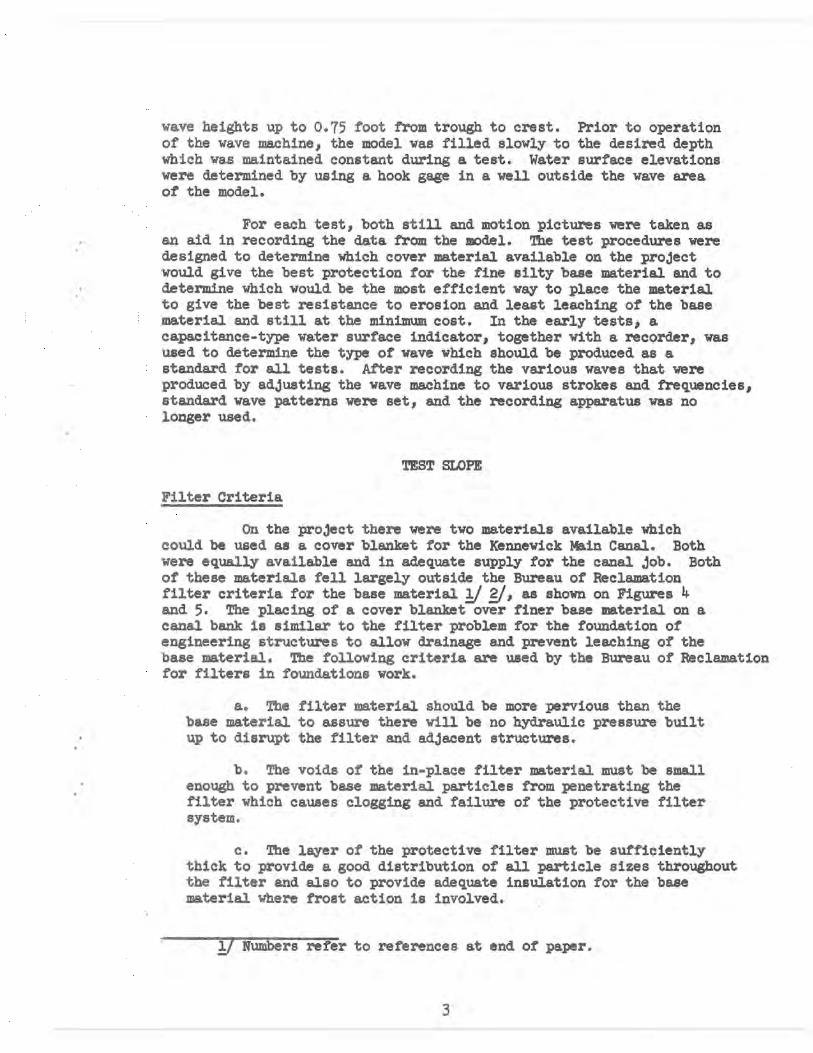
wave heights up to 0.75 foot from trough to crest. Prior to operation of the wave machine, the model was filled slowly to the desired depth which was maintained constant during a test. Water surface elevations were determined by using a hook gage in a well outside the wave area of the model.
For each test, both still and motion pictures were taken as an aid in recording the data from the model. The test procedures were designed to determine which cover material available on the project would give the best protection for the fine silty base material and to determine which would be the most efficient way to place the material to give the best resistance to erosion and least leaching of the base material and still at the minimum cost. In the early tests, a capacitance-type water surface indicator, together with a recorder, was used to determine the type of wave which should be produced as a standard for all tests. After recording the various waves that were produced by adjusting the wave machine to various strokes and frequencies, standard wave patterns were set, and the recording apparatus was no longer used.
TEST SLOPE
Filter Criteria
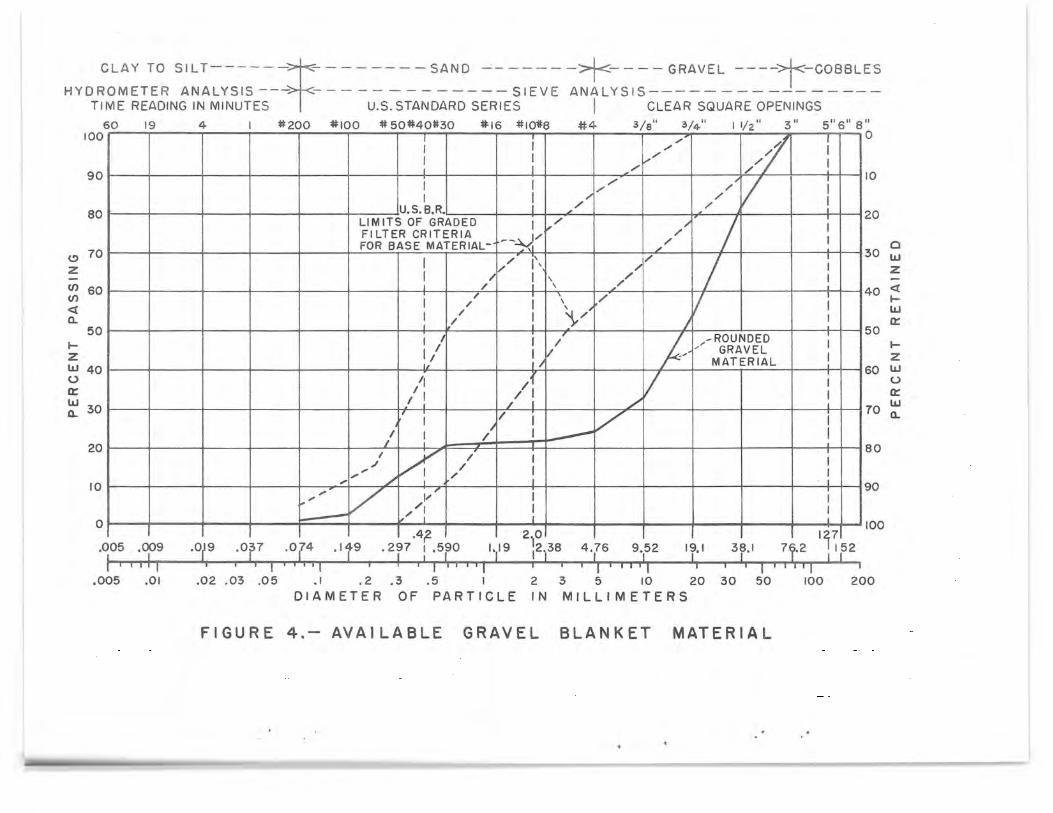
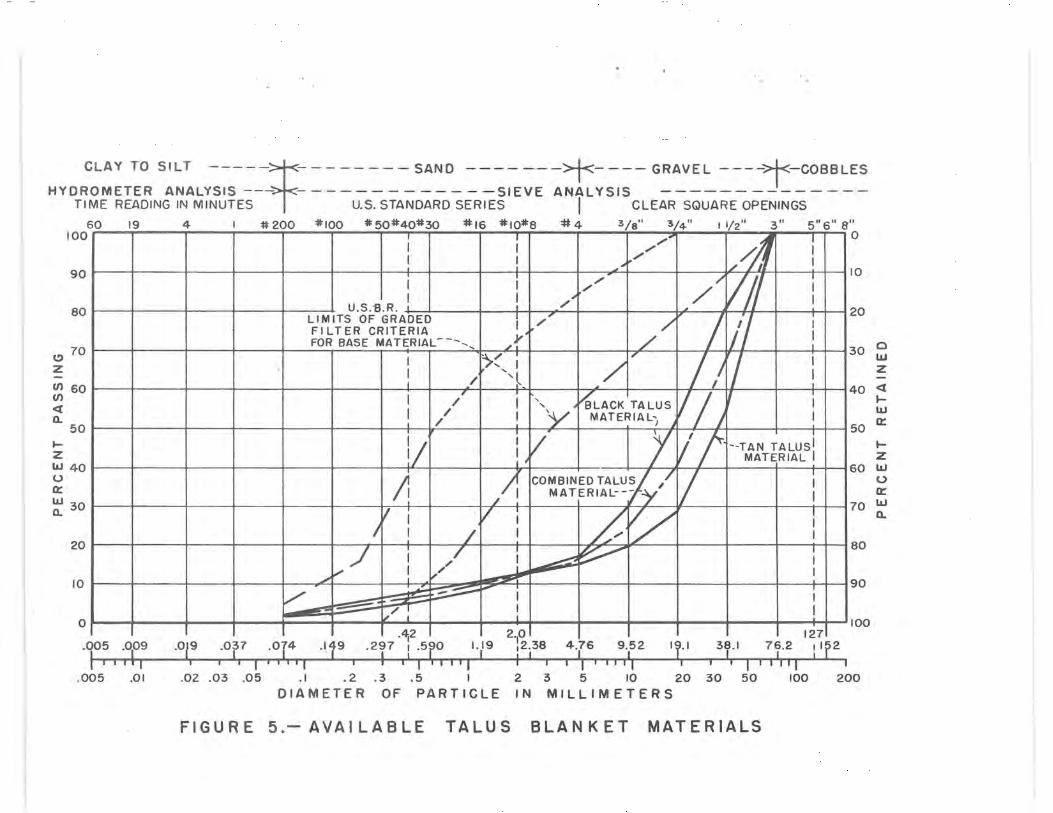
On the project there were two materials available which could be used as a cover blanket for the Kennewick Main Canal. Both were equally available and in adequate supply for the canal job. Both of these materials fell largely outside the Bureau of Reclamation filter criteria for the base material J 2/, as shown on Figures 4 and 5. The placing of a cover blanket over finer base material on a canal bank is similar to the filter problem for the foundation of engineering structures to allow drainage and prevent leaching of the base material. The following criteria are used by the Bureau of Reclamation for filters in foundations work.
a. The filter material should be more pervious than the base material to assure there will be no hydraulic pressure built
• up to disrupt the filter and adjacent structures.
b. The voids of the in-place filter material must be small enough to prevent base material particles from penetrating the filter which causes clogging and failure of the protective filter system.
e. The layer of the protective filter must be sufficiently thick to provide a good distribution of all particle sizes throughout the filter and also to provide adequate insulation for the base material where frost action is involved.
1 Numbers refer to references at end of paper.
3
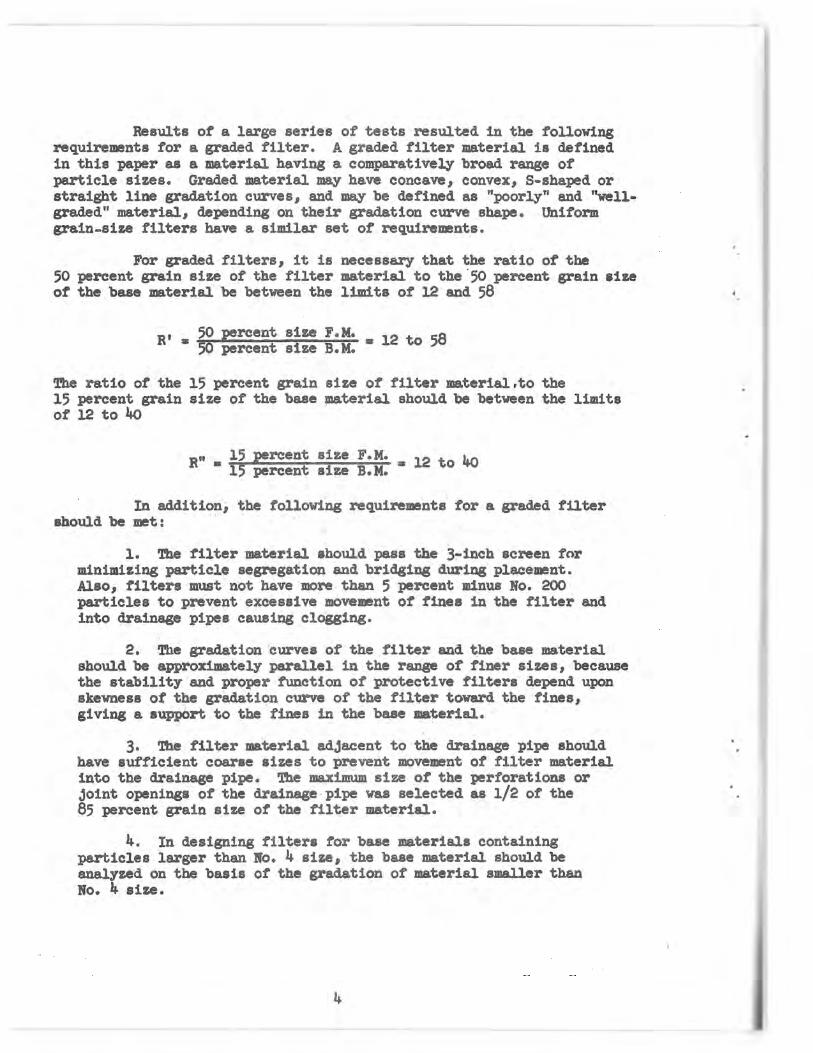
Results of a large series of tests resulted in the following requirements for a graded filter. A graded filter material is defined in this paper as a material having a comparatively broad range of particle sizes. Graded material may have concave, convex, 8-shaped or straight line gradation curves, and may be defined as "poorly" and "well-graded" material, depending on their gradation curve shape. Uniform grain-size filters have a similar set of requirements.
For graded filters, it is necessary that the ratio of the 50 percent grain size of the filter material to the 50 percent grain size of the base material be between the limits of 12 and 58
R' 50 percent size F.M. : 12 to 58 50 percent size B. M.
The ratio of the 15 percent grain size of filter material.to the 15 percent grain size of the base material should be between the limits of 12 to 40
R„ s 15 percent size F.M.: 12 to 40 15 percent afze -B.M.
In addition., the following requirements for a graded filter should be met:
1. The filter material should pass the 3-inch screen for minimizing particle segregation and bridging during placement. Also, filters must not have more than 5 percent minus No. 200 particles to prevent excessive movement of fines in the filter and into drainage pipes causing clogging.
2. The gradation curves of the filter and the base material should be approximately parallel in the range of finer sizes, because the stability and proper function of protective filters depend upon skewness of the gradation curve of the filter toward the fines, giving a support to the fines in the base material.
3. The filter material adjacent to the drainage pipe should have sufficient coarse sizes to prevent movement of filter material into the drainage pipe. The maximum size of the perforations or joint openings of the drainage pipe was selected as 1/2 of the 85 percent grain size of the filter material.
4. In designing filters for base materials containing particles larger than No. 4 size, the base material should be analyzed on the basis of the gradation of material smaller than No. 4 size.
4
4
Materials Tested
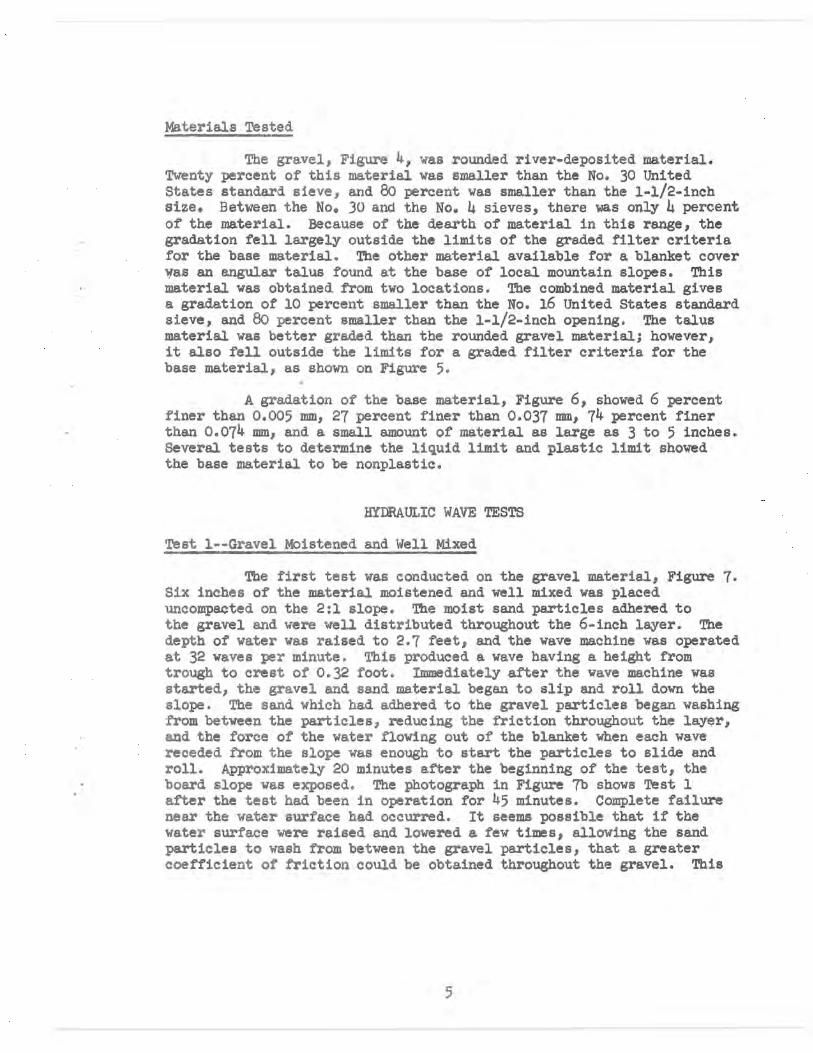
The gravel, Figure 4, was rounded river-deposited material. Twenty percent of this material was smaller than the No. 30 United States standard sieve, and 80 percent was smaller than the 1-1/2-inch size. Between the No. 30 and the No. 4 sieves, there was only 4 percent of the material. Because of the dearth of material in this range, the gradation fell largely outside the limits of the graded filter criteria for the base material. The other material available for a blanket cover was an angular talus found at the base of local mountain slopes. This material was obtained from two locations. The combined material gives a gradation of 10 percent smaller than the No. 16 United States standard sieve, and 80 percent smaller than the 1-1/2-inch opening. The talus material was better graded than the rounded gravel material; however, it also fell outside the limits for a graded filter criteria for the base material, as shown on Figure 5.
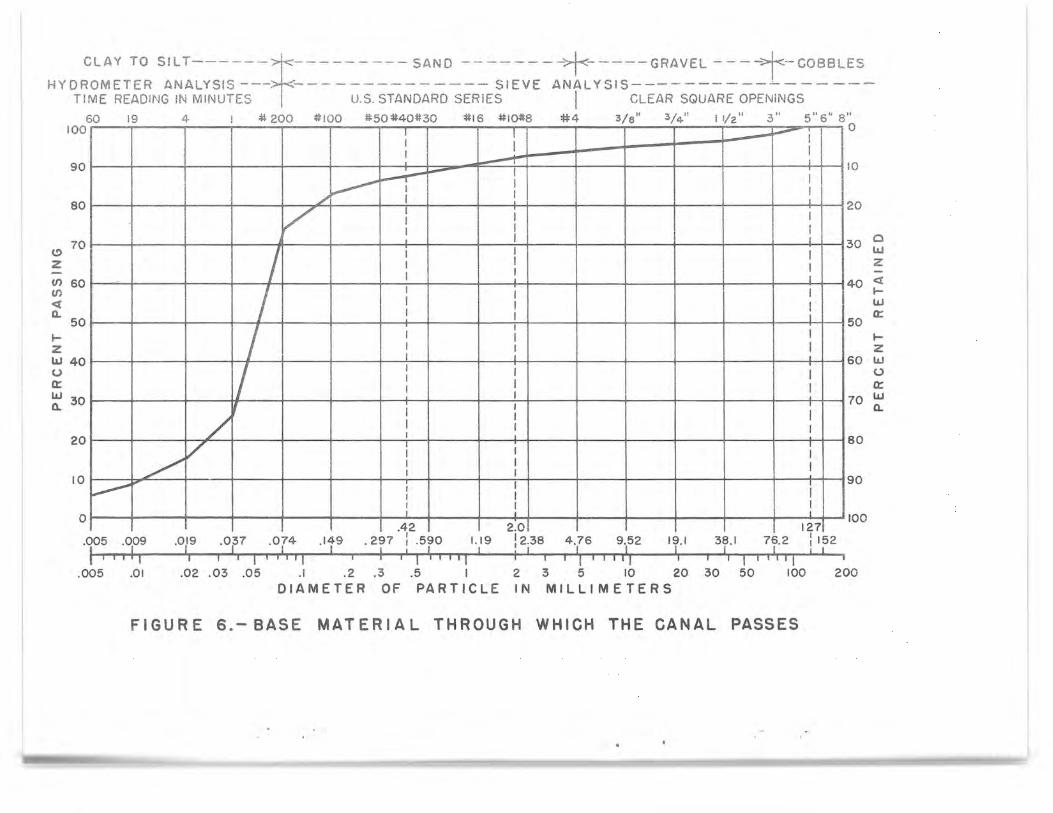
A. gradation of the base material, Figure 6, showed 6 percent finer than 0.005 mm, 27 percent finer than 0.037 mm, 74 percent finer than 0.074 mm, and a small amount of material as large as 3 to 5 inches. Several tests to determine the liquid limit and plastic limit showed the base material to be nonplastic.
HYDRAULIC WAVE TESTS
Test 1--Gravel Moistened and Well Mixed
The first test was conducted on the gravel material, Figure 7. Six inches of the material moistened and well mixed was placed uncompacted on the 2:1 slope. The moist sand particles adhered to the gravel and were well distributed throughout the 6-inch layer. The depth of water was raised to 2.7 feet, and the wave machine was operated at 32 waves per minute. This produced a wave having a height from trough to crest of 0.32 foot. Immediately after the wave machine was started, the gravel and sand material began to slip and roll down the slope. The sand which had adhered to the gravel particles began washing from between the particles, reducing the friction throughout the layer, and the force of the water flowing out of the blanket when each wave receded from the slope was enough to start the particles to slide and roll. Approximately 20 minutes after the beginning of the test, the
• board slope was exposed. The photograph in Figure 7b shows 'Pest 1 after the test had been in operation for 45 minutes. Complete failure near the water surface had occurred. It seems possible that if the water surface were raised and lowered a few times, allowing the sand particles to wash from between the gravel particles, that a greater coefficient of friction could be obtained throughout the gravel. This
9
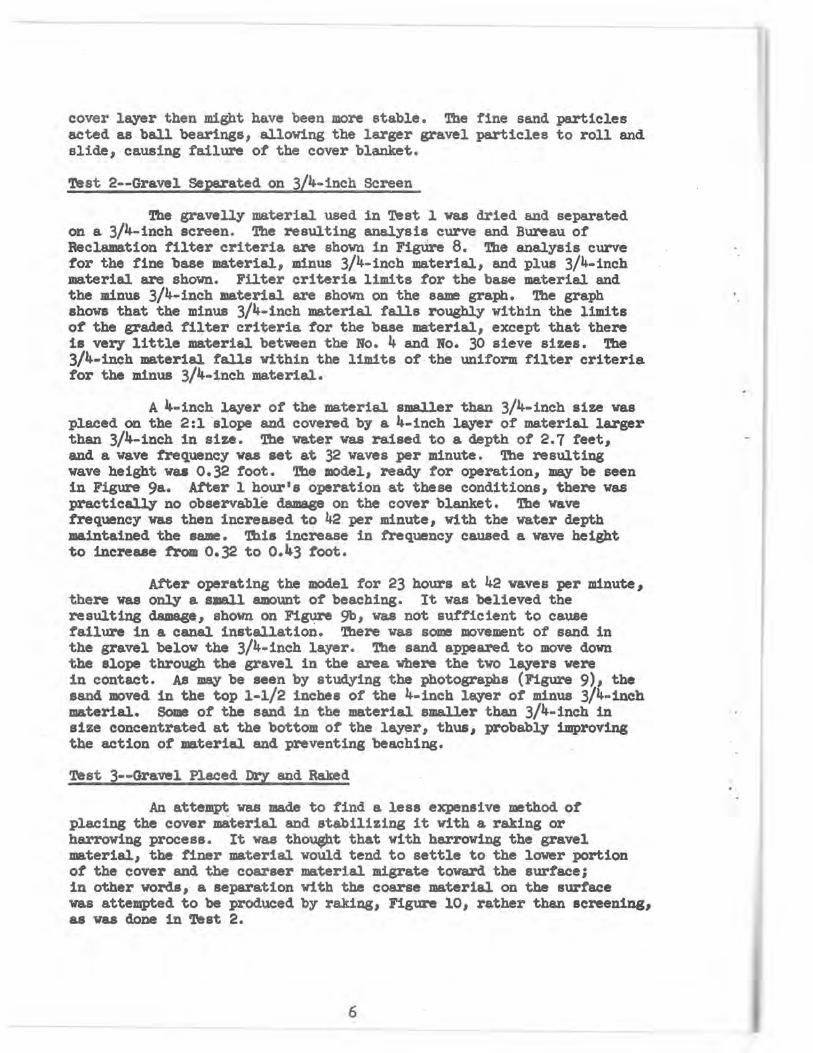
cover layer then might have been more stable. The fine sand particles acted as ball bearings, allowing the larger gravel particles to roll and slide, causing failure of the cover blanket.
'best 2--Gravel Separated on 3/4-inch Screen
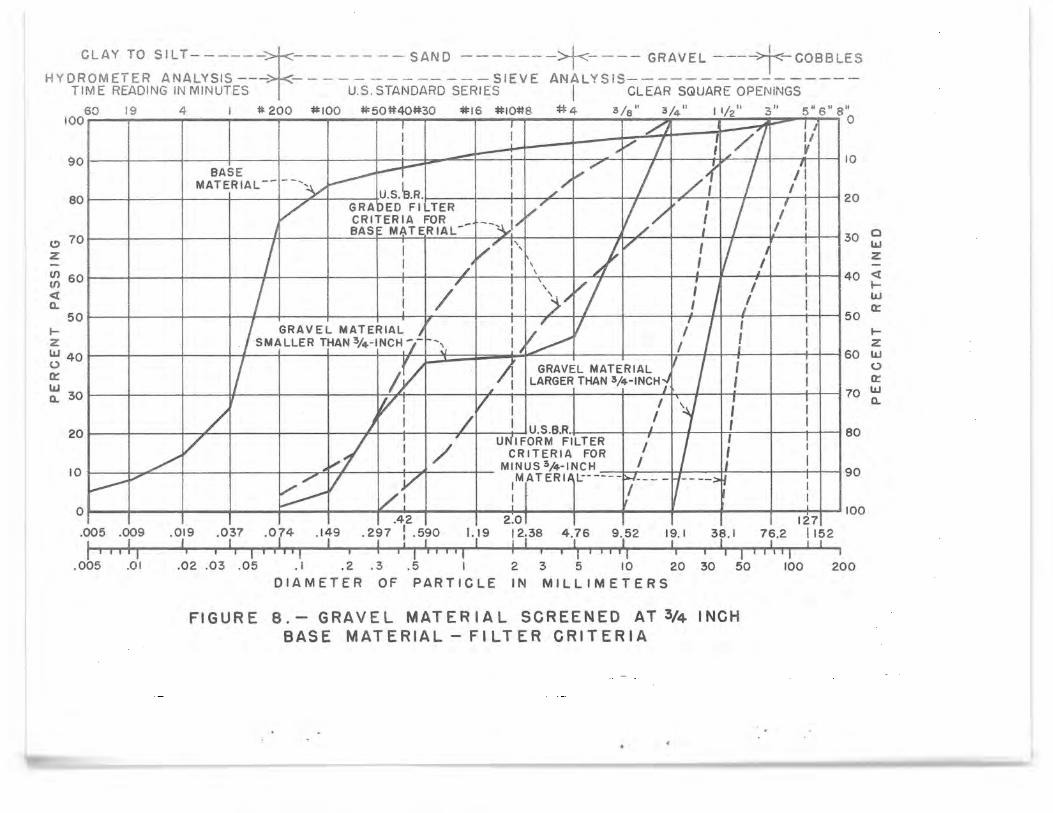
The gravelly material used in Test 1 was dried and separated on a 3/4-inch screen. The resulting analysis curve and Bureau of Reclamation filter criteria are shown in Figure 8. The analysis curve for the fine base material, minus 3/4-inch material, and plus 3/4-inch material are shown. Filter criteria limits for the base material and the minus 3/4-inch material are shown on the same graph. The graph shows that the minus 3/4-inch material falls roughly within the limits of the graded filter criteria for the base material, except that there is very little material between the No. 4 and No. 30 sieve sizes. The 3/4-inch material falls within the limits of the uniform filter criteria for the minus 3/4-inch material.
A 4-inch layer of the material smaller than 3/4-inch size was placed on the 2:1 slope and covered by a 4-inch layer of material larger than 3/4-inch in size. The water was raised to a depth of 2.7 feet, and a wave frequency was set at 32 waves per minute. The resulting wave height was 0.32 foot. The model, ready for operation, may be seen in Figure 9a. After 1 hour's operation at these conditions, there was practically no observable damage on the cover blanket. The wave frequency was then increased to 42 per minute, with the water depth maintained the same. This increase in frequency caused a wave height to increase from 0.32 to 0.43 foot.
After operating the model for 23 hours at 42 waves per minute, there was only a small amount of beaching. It was believed the resulting damage, shown on Figure 9b, was not sufficient to cause failure in a canal installation. There was some movement of sand in the gravel below the 3/4-inch layer. The sand appeared to move down the slope through the gravel in the area where the two layers were in contact. As may be seen by studying the photographs (Figure 9), the sand moved in the top 1-1/2 inches of the 4-inch layer of minus 3/4-inch material. Some of the sand in the material smaller than 3/4-inch in size concentrated at the bottom of the layer, thusp probably improving the action of material and preventing beaching.
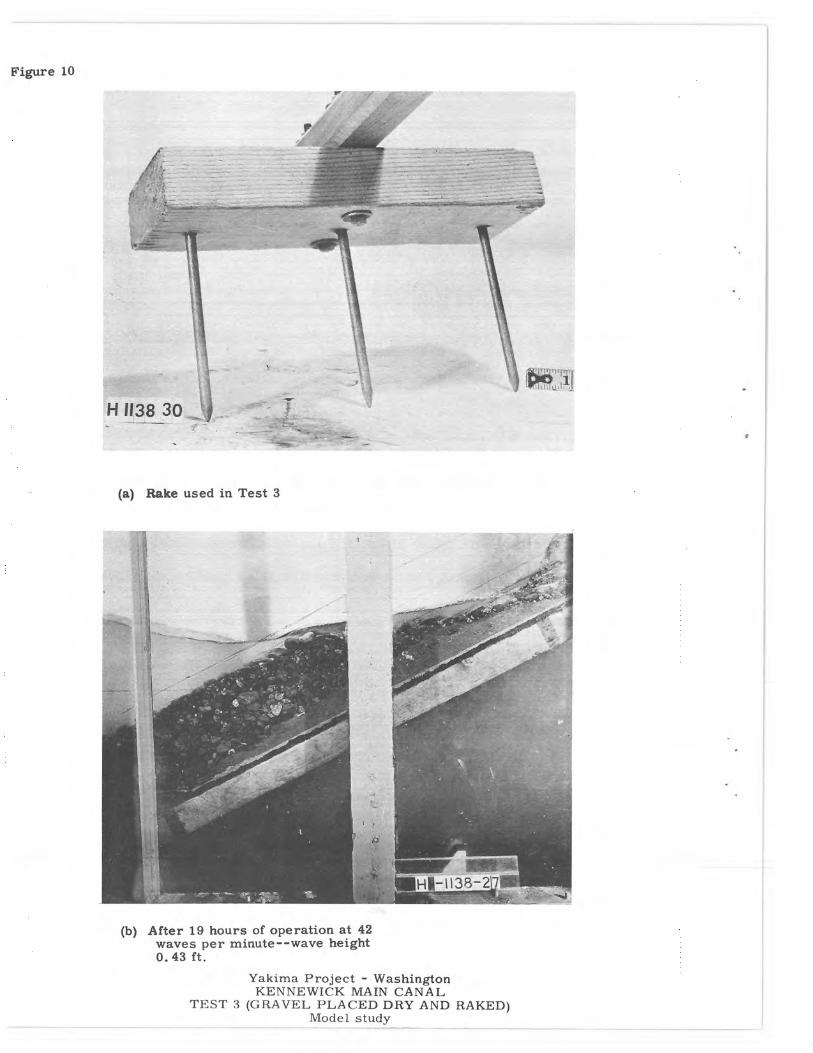
Test 3--Gravel Placed Dry and Raked
An attempt was made to find a less expensive method of placing the cover material and stabilizing it with a raking or harrowing process. It was thought that with harrowing the gravel material, the finer material would tend to settle to the lower portion of the cover and the coarser material migrate toward the surface; in other words, a separation with the coarse material on the surface was attempted to be produced by raking, Figure 100 rather than screening, as was done in Test 2.
E.
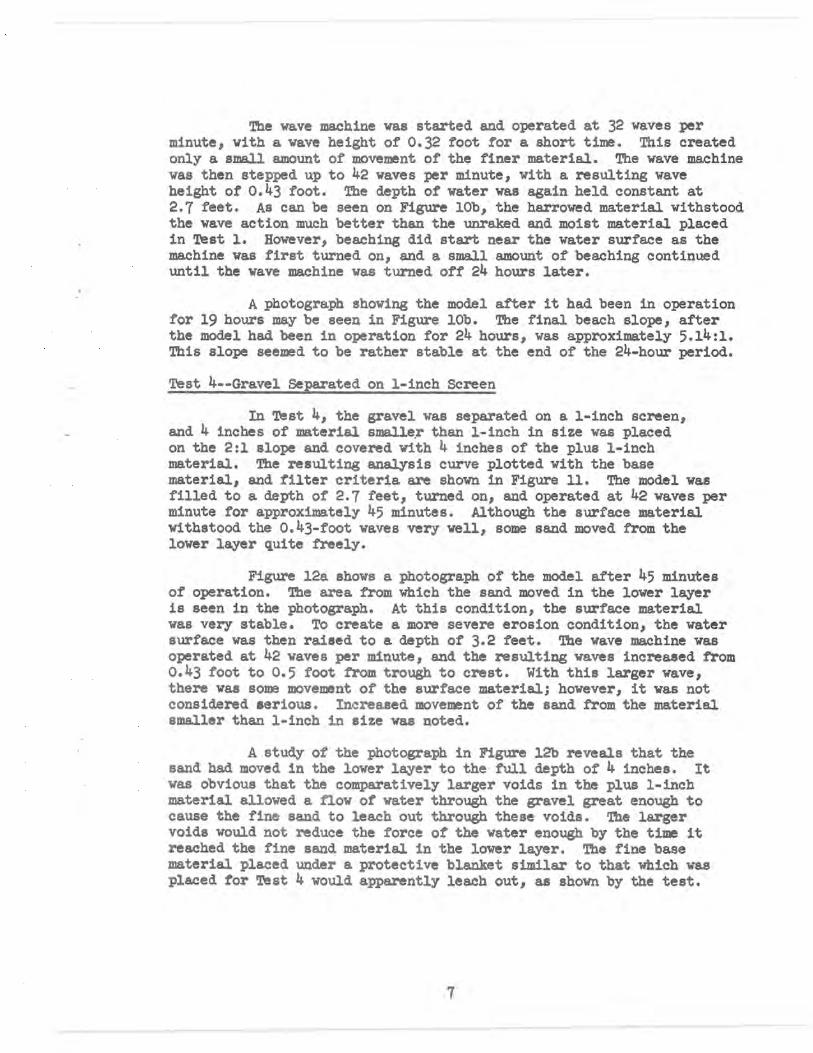
The wave machine was started and operated at 32 waves per minute, with a wave height of 0.32 foot for a short time. This created only a small amount of movement of the finer material. The wave machine was then stepped up to 42 waves per minute, with a resulting wave height of 0.43 foot. The depth of water was again held constant at 2.7 feet. As can be seen on Figure 10b, the harrowed material withstood the wave action much better than the unraked and moist material placed in Test 1. However, beaching did start near the water surface as the machine was first turned on, and a small amount of beaching continued until the wave machine was turned off 24 hours later.
A photograph showing the model after it had been in operation for 19 hours may be seen in Figure 10b. The final beach slope, after the model had been in operation for 24 hours, was approximately 5.14:1. This slope seemed to be rather stable at the end of the 24-hour period.
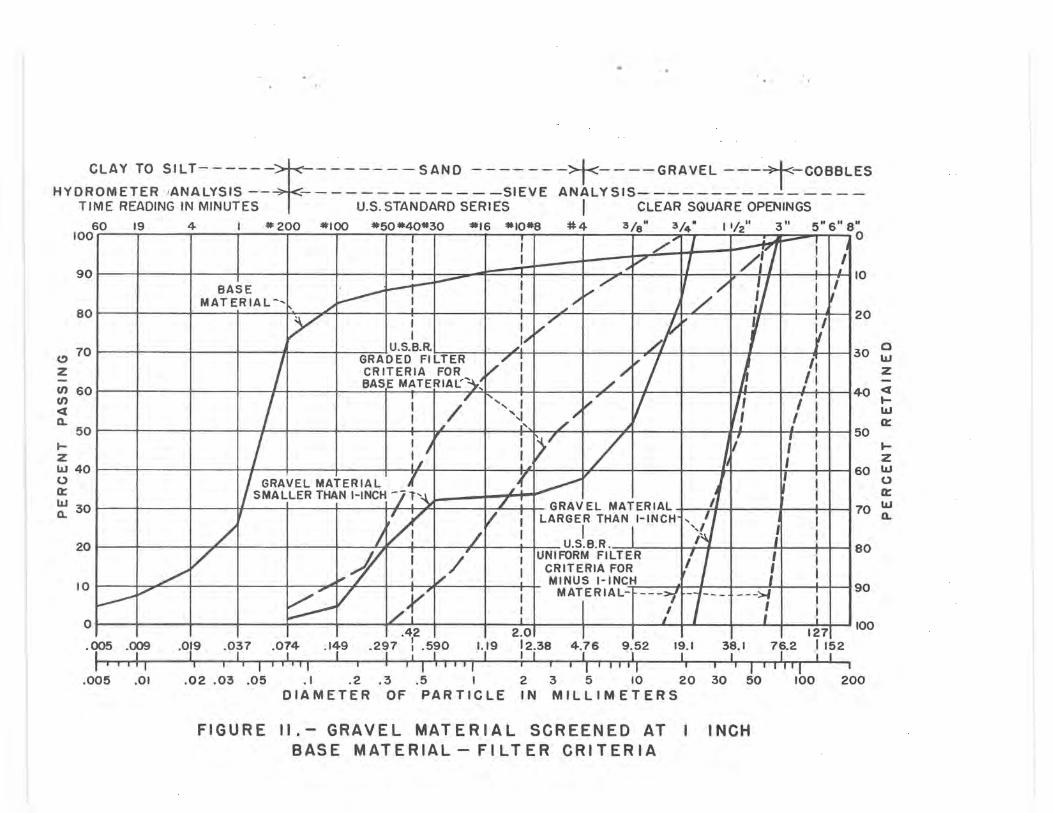
Test 4--Gravel Separated on 1-inch Screen
In Test 40 the gravel was separated on a 1-inch screen, and 4 inches of material smaller than 1-inch in size was placed on the 2:1 slope and covered with 4 inches of the plus 1-inch material. The resulting analysis curve plotted with the base material, and filter criteria are shown in Figure 11. The model was filled to a depth of 2.7 feet, turned on, and operated at 42 waves per minute for approximately 45 minutes. Although the surface material withstood the 0.43-foot waves very well, some sand moved from the lower layer quite freely.
Figure 12a shows a photograph of the model after 45 minutes of operation. The area from which the sand moved in the lower layer is seen in the photograph. At this condition, the surface material was very stable. To create a more severe erosion condition, the water surface was then raised to a depth of 3.2 feet. The wave machine was operated at 42 waves per minute, and the resulting waves increased from 0.43 foot to 0.5 foot from trough to crest. With this larger wave, there was some movement of the surface material; however, it was not considered serious. Increased movement of the sand from the material smaller than 1-inch in size was noted.
A study of the photograph in Figure 12b reveals that the sand had moved in the lower layer to the full depth of 4 inches. It was obvious that the comparatively larger voids in the plus 1-inch material allowed a flow of water through the gravel great enough to cause the fine sand to leach out through these voids. The larger voids would not reduce the force of the water enough by the time it reached the fine sand material in the lower layer. The fine base material placed under a protective blanket similar to that which was placed for Test 4 would apparently leach out, as shown by the test.
7
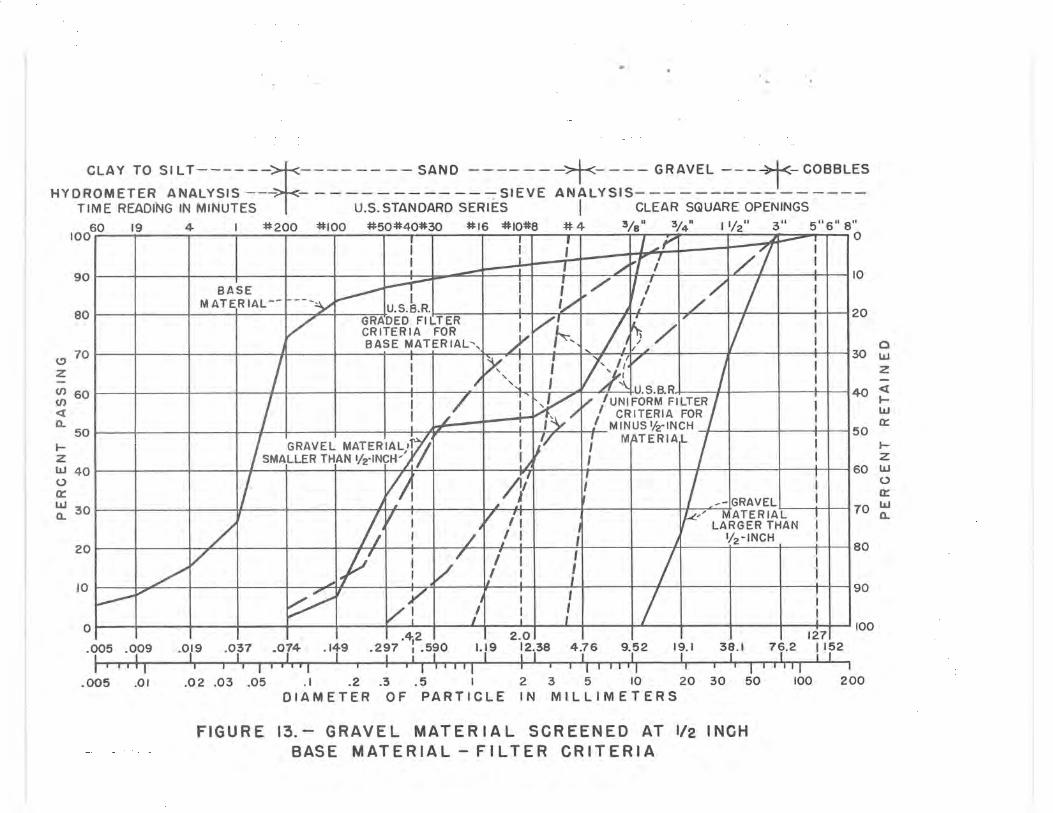
Tests 5 and 6--Gravel Separated on 1/2-inch Screen
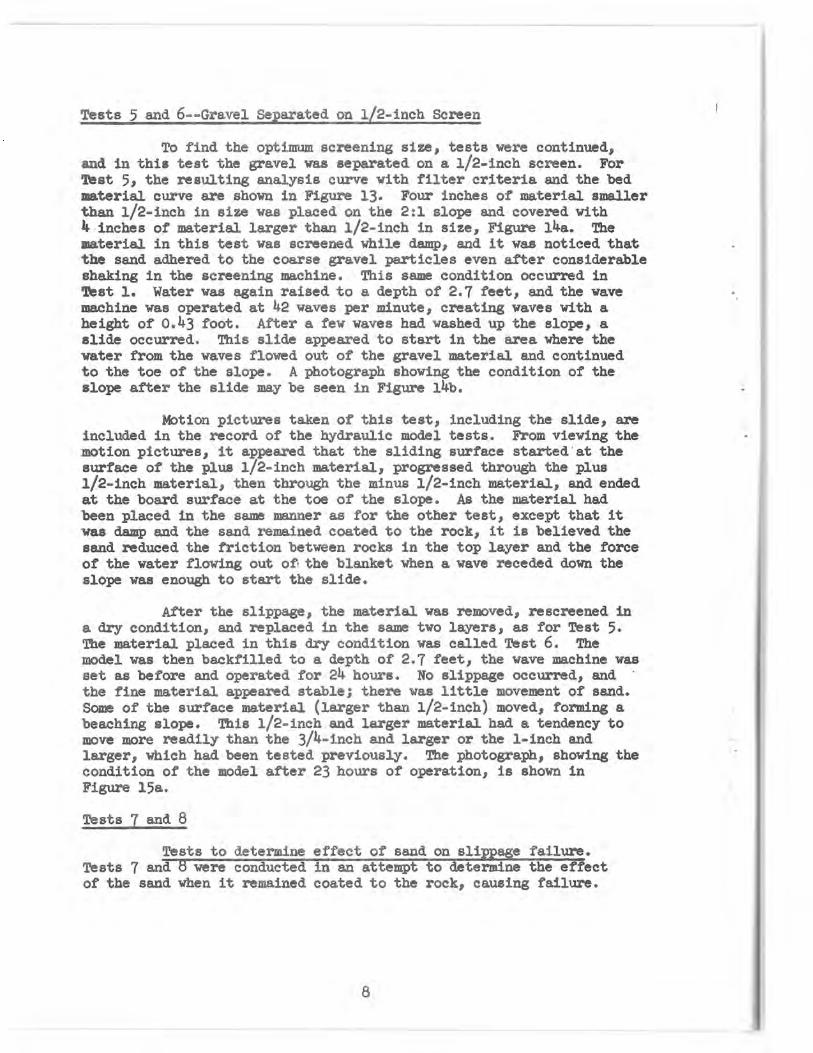
To find the optimum screening size, tests were continued, and in this test the gravel was separated on a 1/2-inch screen. For Test 5, the resulting analysis curve with filter criteria and the bed material curve are shown in Figure 13. Four inches of material smaller than 1/2-inch in size was placed on the 2:1 slope and covered with 4-inches of material larger than 1/2-inch in size, Figure 14a. The material in this test was screened while damp, and it was noticed that the sand adhered to the coarse gravel particles even after considerable shaking in the screening machine. This same condition occurred in Test 1. Water was again raised to a depth of 2.7 feet, and the wave machine was operated at 42 waves per minute, creating waves with a height of 0.43 foot. After a few waves had washed up the slope, a slide occurred. This slide appeared to start in the area where the water from the waves flowed out of the gravel material and continued to the toe of the slope. A photograph showing the condition of the slope after the slide may be seen in Figure 14b.
Motion pictures taken of this test, including the slide, are included in the record of the hydraulic model tests. From viewing the motion pictures, it appeared that the sliding surface started at the surface of the plus 1/2-inch material, progressed through the plus 1/2-inch material, then through the minus 1/2-inch material, and ended at the board surface at the toe of the slope. As the material had been placed in the same manner as for the other test, except that it was damp and the sand remained coated to the rock, it is believed the sand reduced the friction between rocks in the top layer and the force of the water flowing out ofthe blanket when a wave receded down the slope was enough to start the slide.
After the slippage, the material was removed, rescreened in a dry condition, and replaced in the same two layers, as for Test 5. The material placed in this dry condition was called Test 6. The model was then backfilled to a depth of 2.7 feet, the wave machine was set as before and operated for 24 hours. No slippage occurred, and the fine material appeared stable; there was little movement of sand. Some of the surface material (larger than 1/2-inch) moved, forming a beaching slope. This 1/2-inch and larger material had a tendency to move more readily than the 3/4-inch and larger or the 1-inch and larger, which had been tested previously. The photograph, showing the condition of the model after 23 hours of operation, is shown in Figure 15a.
Tests 7 and 8
Tests to determine effect of sand on slippage failure. Tests 7 and 6 were conducted in an attempt to determine the effect of the sand when it remained coated to the rock, causing failure.
For Test 7, the gravel material was screened while damp on the 3/4-inch screen and placed,as in Test 2. A 4-inch layer of material smaller than 3/4-inch in size was covered by a 4-inch layer of material larger than 3/4-inch in size. The only difference between Tests 2 and 7 was that the material in Test 7 was screened damp, thereby leaving a coating of sand particles on the larger gravel particles. The flume was filled to a depth of 2.7 feet, and the wave machine was started at 42 waves per minute, resulting in a wave height of 0.43 foot.
Immediately on starting the wave action, considerable slippage occurred. The slippage was less pronounced, however, than when the material was separated on the 1/2-inch screen. The coarse material slipped near the surface until it had decreased in thickness by approximately 1 inch. After approximately 1 minute of operation, the material then became stable. Further operation produced little change. The test appeared to confirm the fact that the sand coated
t to large material contributed largely to the slippage failure in Test 5.
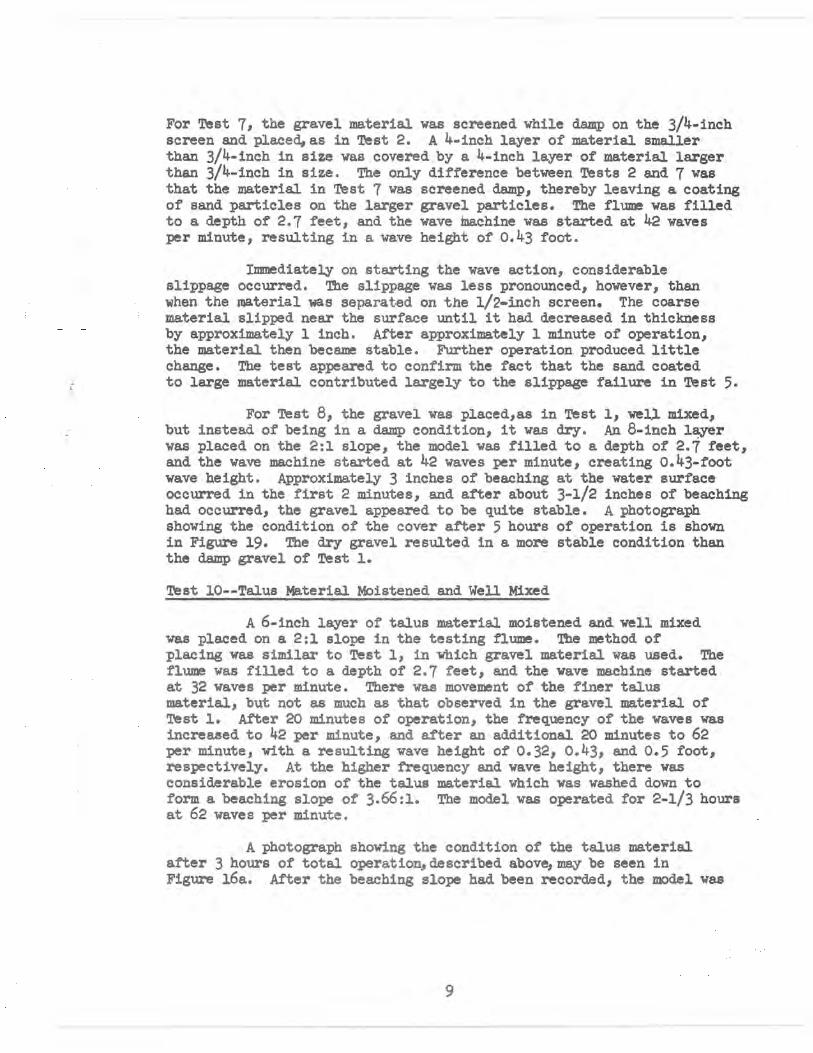
For Test 8, the gravel was placed,as in Test 1, well mixed, but instead of being in a damp condition, it was dry. An 8-inch layer was placed on the 2:1 slope, the model was filled to a depth of 2.7 feet, and the wave machine started at 42 waves per minute, creating 0.43-foot wave height. Approximately 3 inches of beaching at the water surface occurred in the first 2 minutes, and after about 3-1/2 inches of beaching had occurred, the gravel appeared to be quite stable. A photograph showing the condition of the cover after 5 hours of operation is shown in Figure 19. The dry gravel resulted in a more stable condition than the damp gravel of Test 1.
Test 10--Talus Material Moistened and Well Mixed
A 6-inch layer of talus material moistened and well mixed was placed on a 2:1 slope in the testing flume. The method of placing was similar to Test 1, in which gravel material was used. The flume was filled to a depth of 2.7 feet, and the wave machine started at 32 waves per minute. There was movement of the finer talus material, but not as much as that observed in the gravel material of Test 1. After 20 minutes of operation, the frequency of the waves was increased to 42 per minute, and after an additional 20 minutes to 62 per minute, with a resulting wave height of 0.32, 0.43, and 0.5 foot, respectively. At the higher frequency and wave height, there was considerable erosion of the talus material which was washed down to form a beaching slope of 3.66:1. The model was operated for 2-1/3 hours at 62 waves per minute.
A photograph showing the condition of the talus material after 3 hours of total operation,described above,may be seen in Figure 16a. After the beaching slope had been recorded, the model was
left running at 62 waves per minute, and the water was raised slowly to a depth of 3.2 feet., then lowered to a depth of 2.2 feet. Raising and lowering the water surface caused various wave heights for 62 waves per minute. The scour observed showed considerable material had moved down the slope., but at no point was the 2:1 slope exposed. A photograph showing the condition of the model after raising and lowering the water surface is shown in Figure 16b. The model was operated for a total of 5 hours. Test 10 indicated that the angular talus material was considerably more stable than the rounded gravel material placed in the same manner.
Test 11--Talus Separated on 1/2-inch Screen
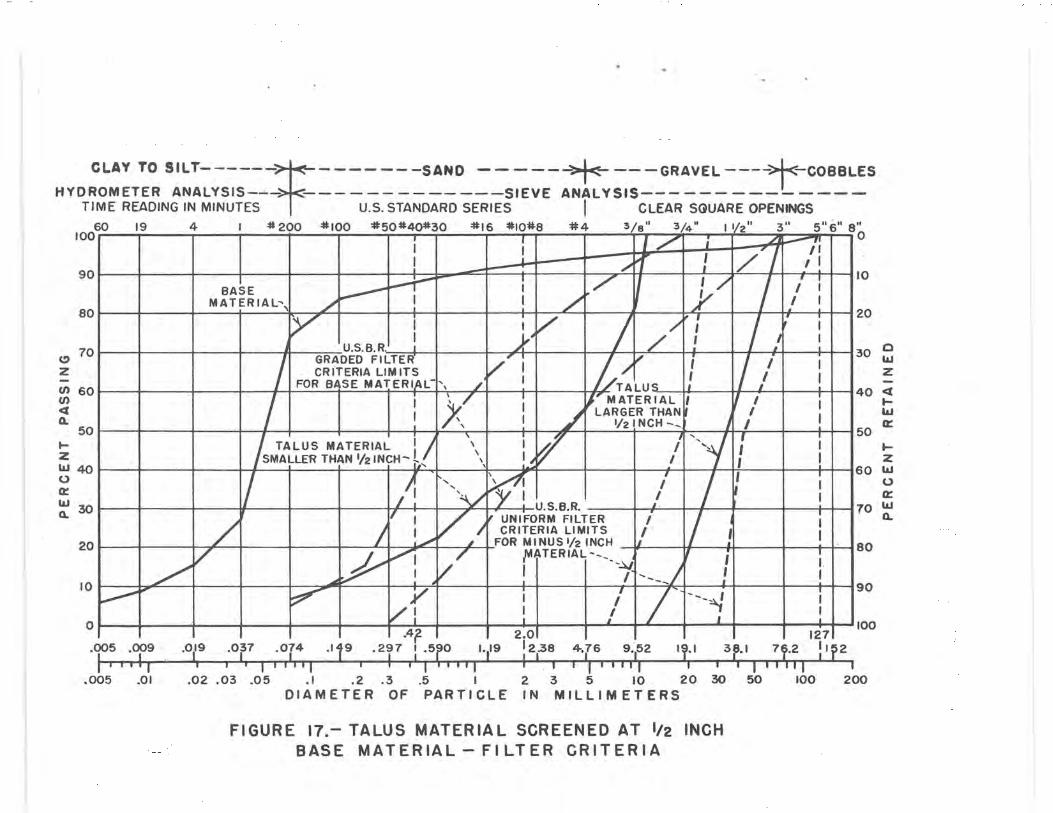
The talus material was dried and screened on the 1/2-inch screen, resulting in the analysis curve shown in Figure 17. Four inches of the material smaller than 1/2-inch in size was placed on the 2:1 slope and covered by 4 inches of material larger than 1/2-inch in size. The model was filled to a depth of 2.7 feet, and the wave machine was started at 32 waves per minute, giving a wave height of 0.32 foot. At 32 waves per minute., there was very little movement of the surface materiel. The material in the bottom layers smaller than 1/2-inch in size also appeared very stable.
As no damage occurred at 32 waves per minute, the frequency of the waves was increased to 42 and then to 62 waves per minute, and the model was operated for a 2-hour period. The resulting wave height was 0.43 and 0.5 foot, respectively. At the higher wave frequencies, the surface material moved more freely., and approximately 1-inch was eroded in forming the beaching slope. However, the material in the bottom layer below the 1/2-inch in size still appeared very stable and very little movement occurred.
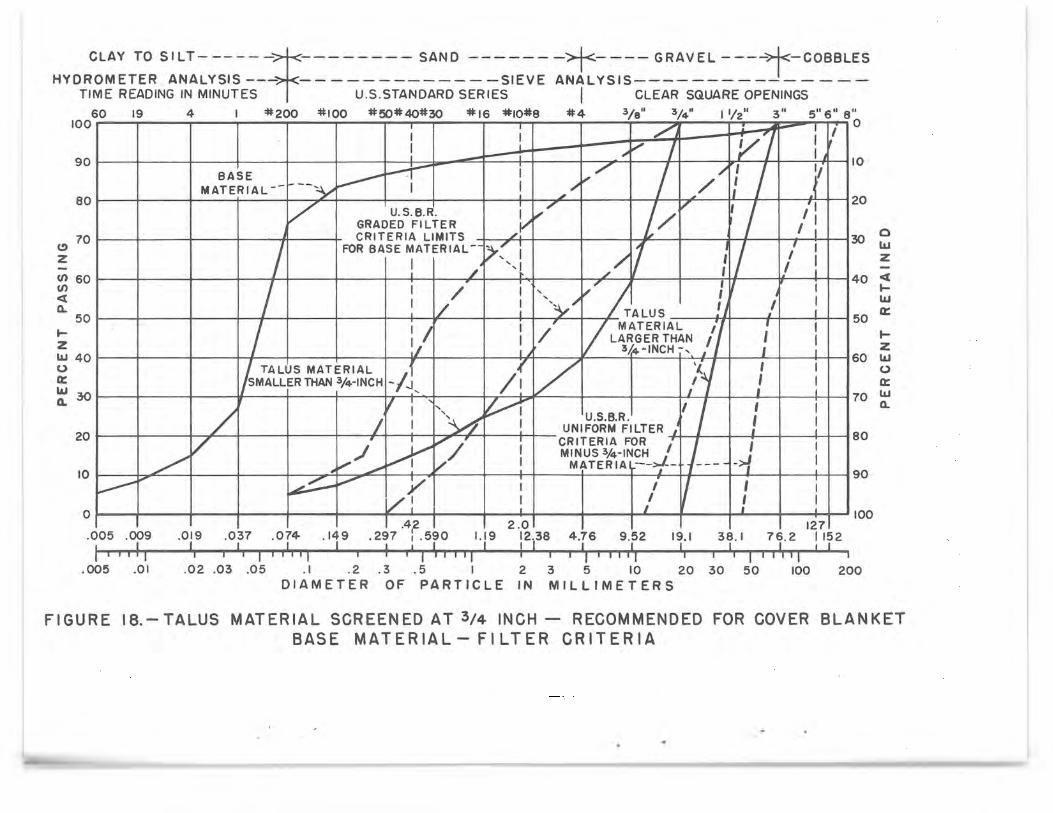
Test 9--Recommended Cover--Talus Separated on 3/4-inch Screen The mixed talus material was screened on the 3/4-inch screen,
together with the base material analysis curve and the Bureau of Reclamation filter criteria. The resulting analysis curve is shown in Figure 18. Before placing the talus material on the 2:1 slope, 3.6 percent moisture, by dry weight, was added to the material smaller than 3/4-inch in size to simulate field conditions. Four inches of the material smaller than 3/4-inch in size was placed on the 2:1 slope and covered by 4 inches of material larger than the 3/4-inch size, Figure 15b. The model was filled to a depth of 2.7 feet, and the wave machine was started. The model was operated at a frequency of 32 waves per minute., creating 0.32-foot waves for 15 minutes. As the material appeared to be very stable, the frequency of the wave machine was increased to 42 waves per minute. The model at this frequency and wave height (0.43 foot) was operated for 30 minutes.
10
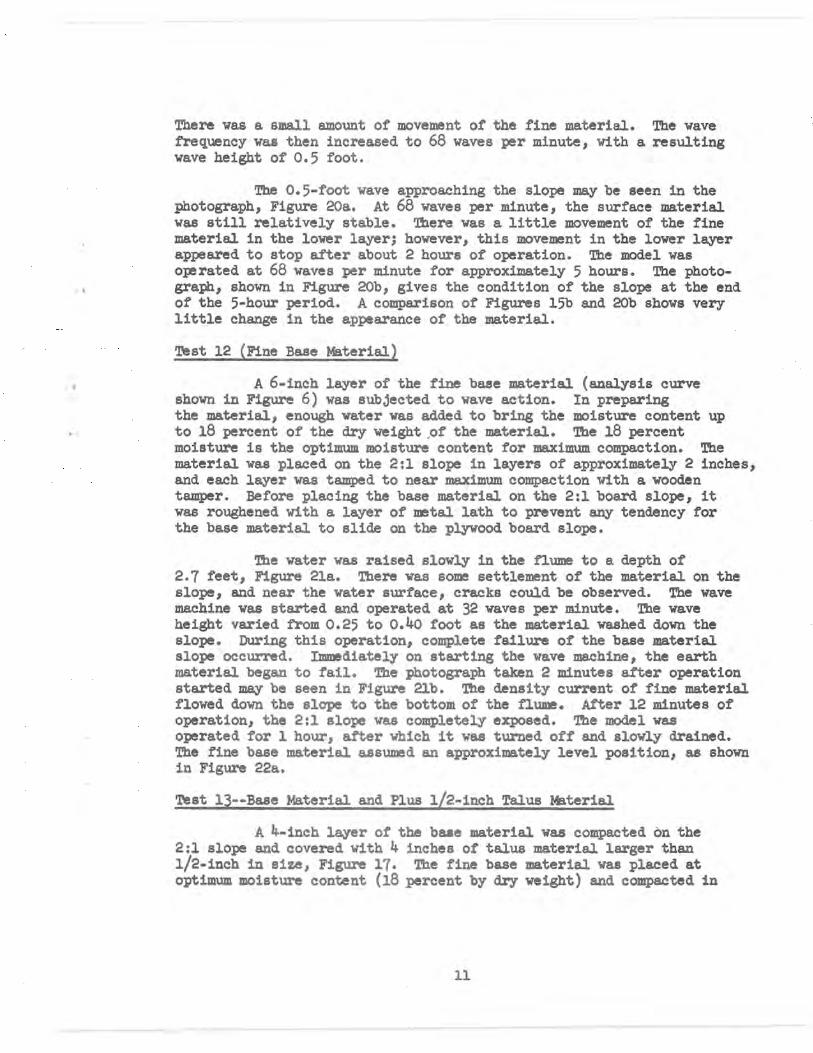
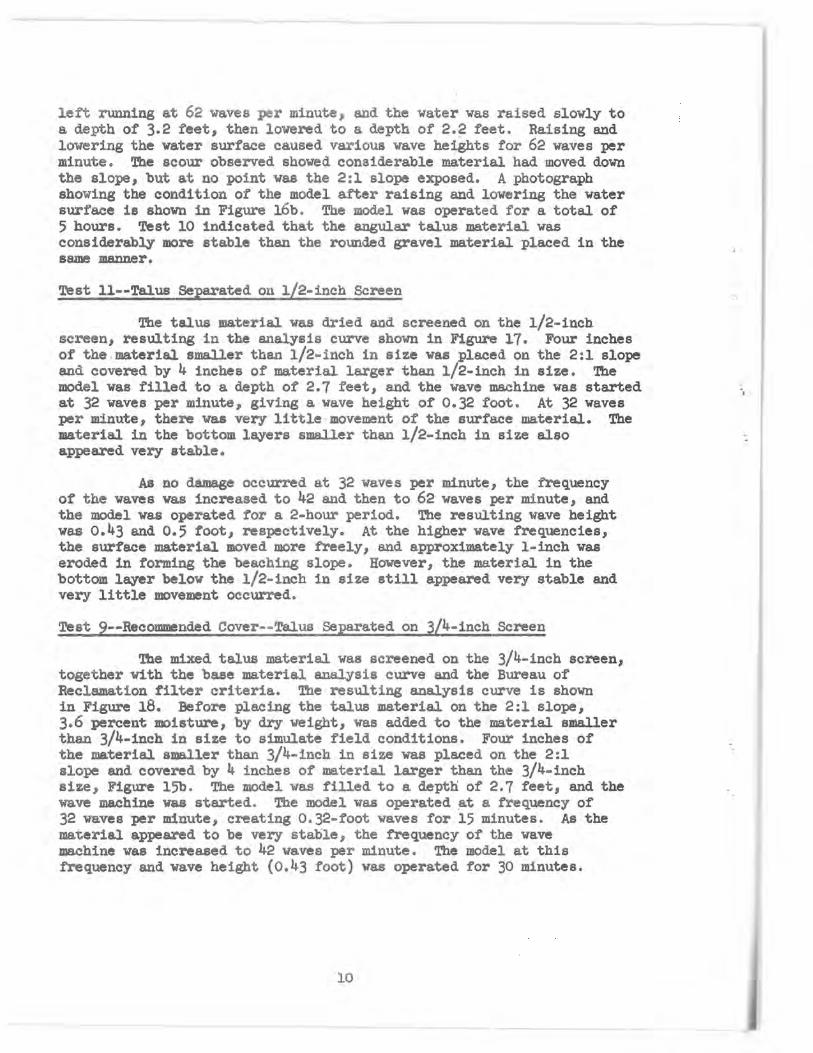
There was a small amount of movement of the fine material. The wave frequency was then increased to 68 waves per minute, with a resulting wave height of 0.5 foot.
The 0.5-foot wave approaching the slope may be seen in the photograph, Figure 20a. At 68 waves per minute, the surface material was still relatively stable. There was a little movement of the fine material in the lower layer; however, this movement in the lower layer appeared to stop after about 2 hours of operation. The model was operated at 68 waves per minute for approximately 5 hours. The photo-graph, shown in Figure 20b, gives the condition of the slope at the end of the 5-hour period. A comparison of Figures 15b and 20b shows very little change in the appearance of the material.
Test 12 (Fine Base Material)
A 6-inch layer of the fine base material (analysis curve shown in Figure 6) was subjected to wave action. In preparing the material, enough water was added to bring the moisture content up to 18 percent of the dry weight of the material. The 18 percent moisture is the optimum moisture content for maximum compaction. The material was placed on the 2:1 slope in layers of approximately 2 inches, and each layer was tamped to near maximum compaction with a wooden tamper. Before placing the base material on the 2:1 board slope, it was roughened with a layer of metal lath to prevent any tendency for the base material to slide on the plywood board slope.
The water was raised slowly in the flume to a depth of 2.7 feet, Figure 21a. There was some settlement of the material on the slope, and near the water surface, cracks could be observed. The wave machine was started and operated at 32 waves per minute. The wave height varied from 0.25 to 0.40 foot as the material washed down the slope. During this operation, complete failure of the base material slope occurred. Immediately on starting the wave machine, the earth material began to fail. The photograph taken 2 minutes after operation started may be seen in Figure 21b. The density current of fine material flowed down the slope to the bottom of the flume. After 12 minutes of operation, the 2:1 slope was completely exposed. The model was operated for 1 hour, after which it was turned off and slowly drained. The fine base material assumed an approximately level position, as shown in Figure 22a.
Test 13--Base Material and Plus 1/2-inch Talus Material
A 4-inch layer of the base material was compacted on the 2:1 slope and covered with 4 inches of talus material larger than 1/2-inch in size, Figure 17. The fine base material was placed at optimum moisture content (18 percent by dry weight) and compacted in
11
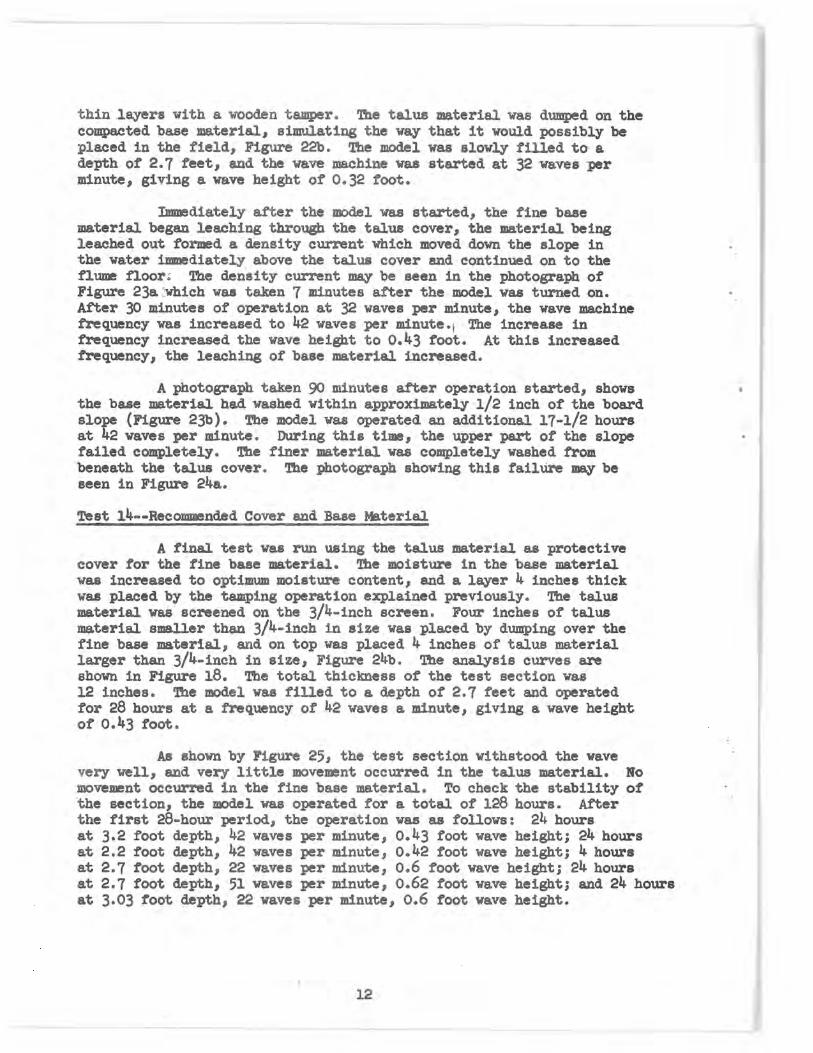
thin layers with a wooden tamper. The talus material was dumped on the compacted base material, simulating the way that it would possibly be placed in the field, Figure 22b. The model was slowly filled to a depth of 2.7 feet, and the wave machine was started at 32 waves per minute, giving a wave height of 0.32 foot.
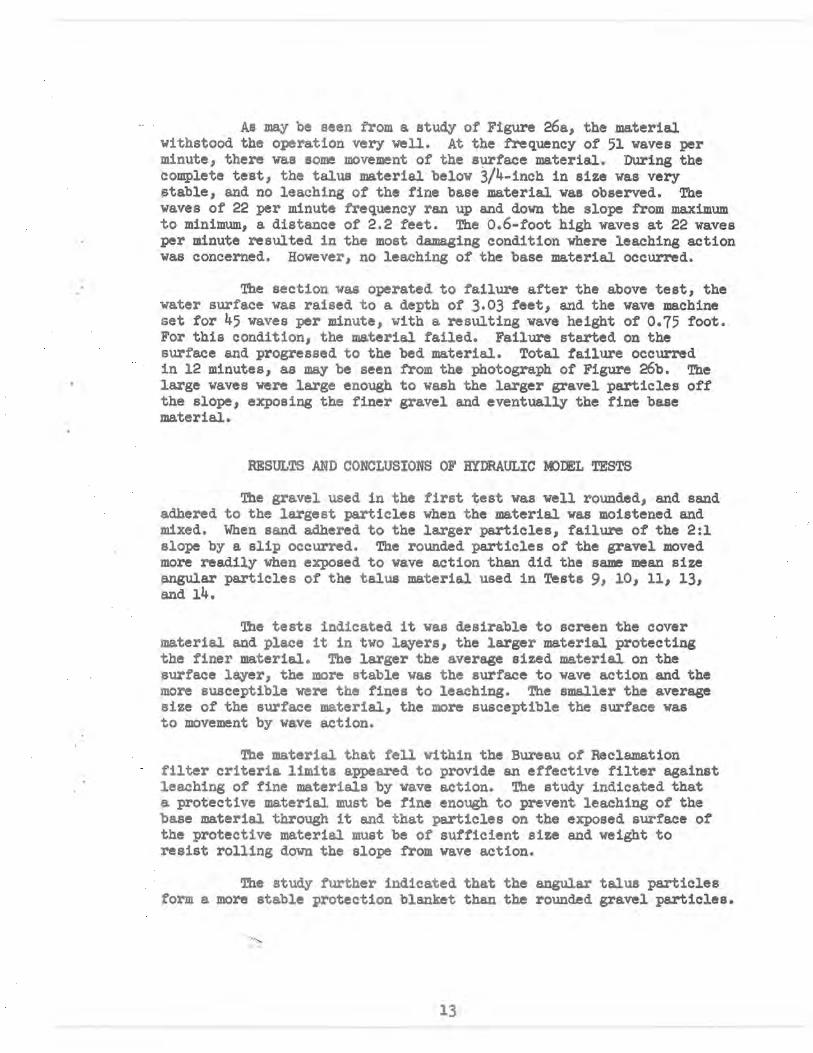
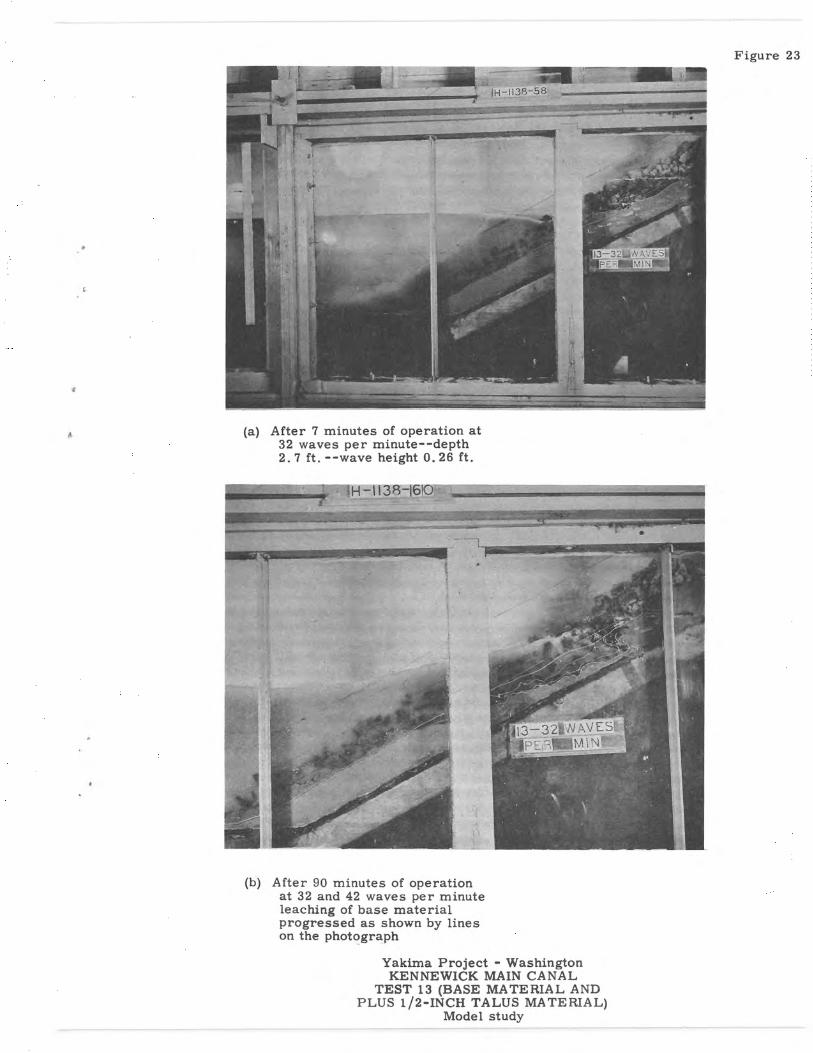
Immediately after the model was started, the fine base material began leaching through the talus cover, the material being leached out formed a density current which moved down the slope in the water immediately above the talus cover and continued on to the flume floor.- The density current may be seen in the photograph of Figure 23a"which was taken 7 minutes after the model was turned on. After 30 minutes of operation at 32 waves per minute, the wave machine frequency was increased to 42 waves per minute., The increase in frequency increased the wave height to 0.43 foot. At this increased frequency, the leaching of base material increased.
A photograph taken 90 minutes after operation started, shows the base material had washed within approximately 1/2 inch of the board slope (Figure 23b). The model was operated an additional 17-1/2 hours at 42 waves per minute. During this time, the upper part of the slope failed completely. The finer material was completely washed from beneath the talus cover. The photograph showing this failure may be seen in Figure 24a.
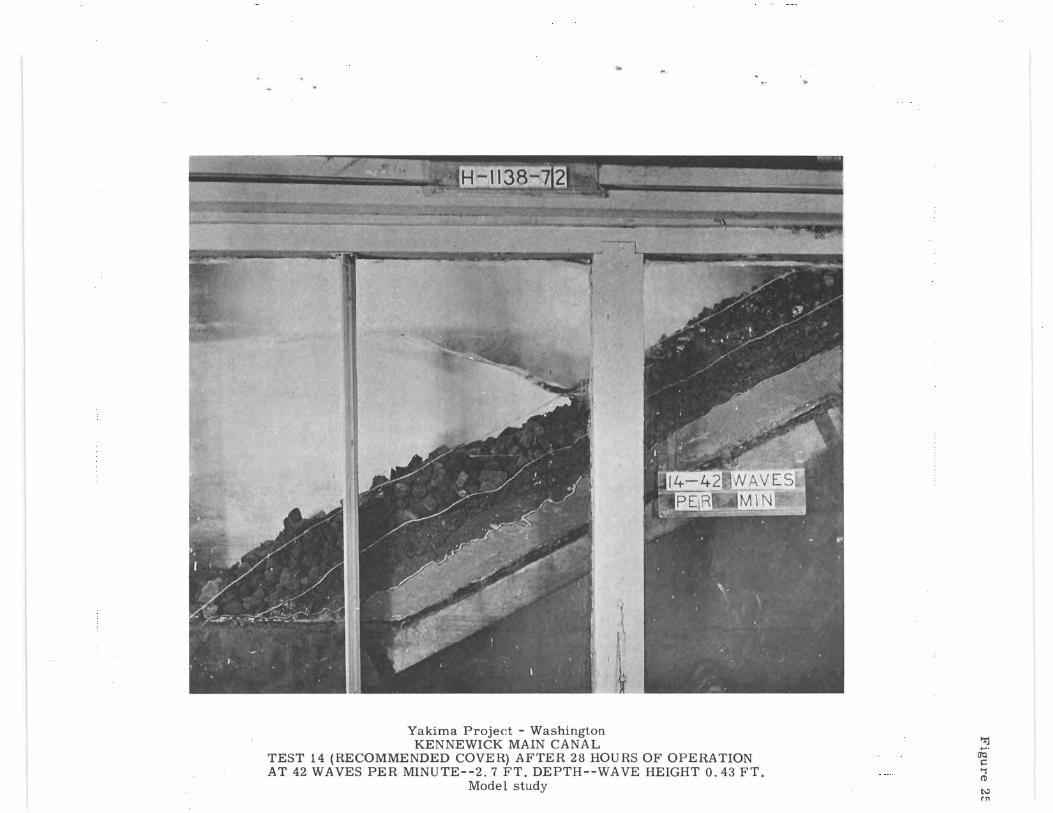
'Pest 14--Recommended Cover and Base Material A final test was run using the talus material as protective
cover for the fine base material. The moisture in the base material was increased to optimum moisture content, and a layer 4 inches thick was placed by the tamping operation explained previously. The talus material was screened on the 3/4-inch screen. Four inches of talus material smaller than 3/4-inch in size was placed by dumping over the fine base material, and on top was placed 4 inches of talus material larger than 3/4-inch in size, Figure 24b. The analysis curves are shown in Figure 18. The total thickness of the test section was 12 inches. The model was filled to a depth of 2.7 feet and operated for 28 hours at a frequency of 42 waves a minute, giving a wave height of 0.43 foot.
As shown by Figure 25, the test section withstood the wave very well, and very little movement occurred in the talus material. No movement occurred in the fine base material. To check the stability of the section, the model was operated for a total of 128 hours. After the first 28-hour period, the operation was as follows; 24 hours at 3.2 foot depth, 42 waves per minute, 0.43 foot wave height; 24 hours at 2.2 foot depth, 42 waves per minute, 0.42 foot wave height; 4 hours at 2.7 foot depth, 22 waves per minute, 0.6 foot wave height; 24 hours at 2.7 foot depth, 51 waves per minute, 0.62 foot wave height; and 24 hours at 3.03 foot depth, 22 waves per minute, 0.6 foot wave height.
12
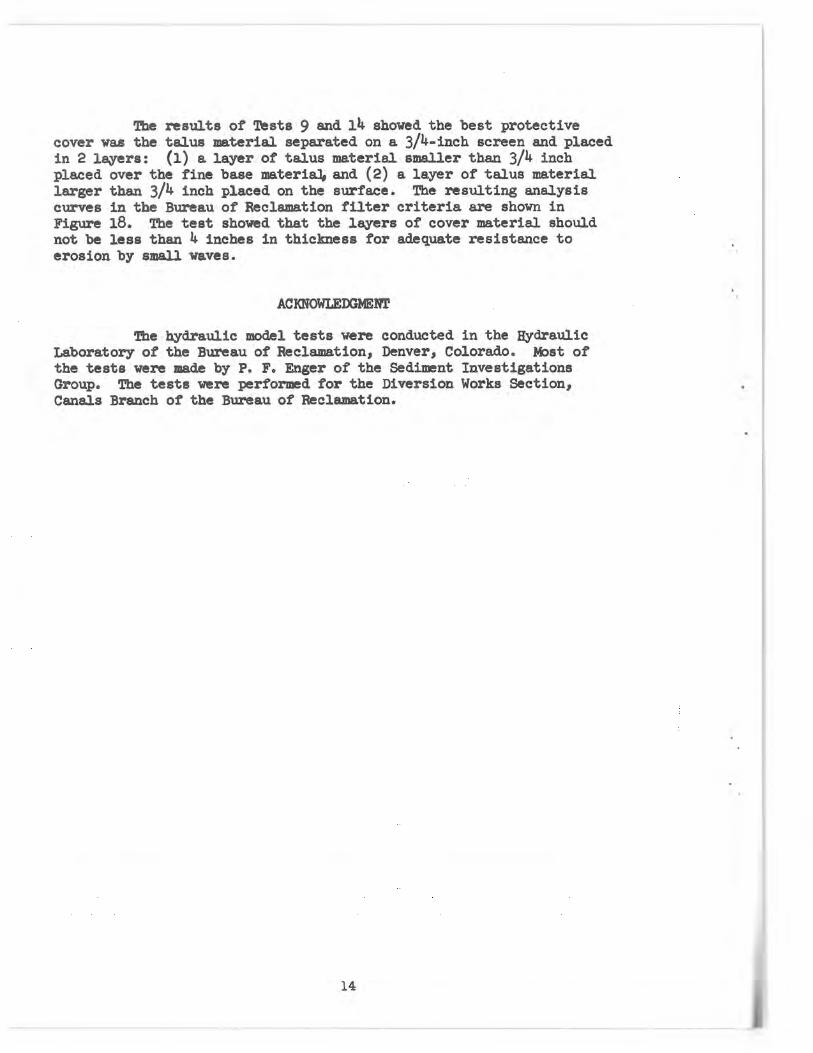
As may be seen from a study of Figure 26a, the material withstood the operation very well. At the frequency of 51 waves per minute, there was some movement of the surface material. During the complete test, the talus material below 3/4-inch in size was very stable, and no leaching of the fine base material was observed. The waves of 22 per minute frequency ran up and down the slope from maximum to minimum, a distance of 2.2 feet. The 0.6-foot high waves at 22 waves per minute resulted in the most damaging condition where leaching action was concerned. However, no leaching of the base material occurred.
The section was operated to failure after the above test, the water surface was raised to a depth of 3.03 feet, and the wave machine set for 45 waves per minute, with a resulting wave height of 0.75 foot. For this condition, the material failed. Failure started on the surface and progressed to the bed material. Total failure occurred in 12 minutes, as may be seen from the photograph of Figure 26b. The large waves were large enough to wash the larger gravel particles off the slope, exposing the finer gravel and eventually the fine base material.
RESULTS AND CONCLUSIONS OF HYDRAULIC MODEL TESTS
The gravel used in the first test was well rounded, and sand adhered to the largest particles when the material was moistened and mixed. When sand adhered to the larger particles, failure of the 2:1 slope by a slip occurred. The rounded particles of the gravel moved more readily when exposed to wave action than did the same mean size angular particles of the talus material used in Tests 9, 10, 11, 13, and 14.
The tests indicated it was desirable to screen the cover material and place it in two layers, the larger material protecting the finer material. The larger the average sized material on the surface layer, the more stable was the surface to wave action and the more susceptible were the fines to leaching. The smaller the average size of the surface material, the more susceptible the surface was to movement by wave action.
The material that fell within the Bureau of Reclamation filter criteria limits appeared to provide an effective filter against leaching of fine materials by wave action. The study indicated that a protective material must be fine enough to prevent leaching of the base material through it and that particles on the exposed surface of the protective material must be of sufficient size and weight to resist rolling down the slope from wave action.
The study further indicated that the angular talus particles form a more stable protection blanket than the rounded gravel particles.
13
The results of Tests 9 and 14 showed the best protective cover was the talus material separated on a 3/4-inch screen and placed in 2 layers: (1) a layer of talus material smaller than 3/4 inch placed over the fine base material, and (2) a layer of talus material larger than 3/4 inch placed on the surface. The resulting analysis curves in the Bureau of Reclamation filter criteria are shown in Figure 18. The test showed that the layers of cover material should not be less than 4 inches in thickness for adequate resistance to erosion by small waves.
ACKNOWLEDGMENT
The hydraulic model tests were conducted in the Hydraulic Laboratory of the Bureau of Reclamation, Denver, Colorado. Most of the tests were made by P. F. Enger of the Sediment Investigations Group. The tests were performed for the Diversion Works Section, Canals Branch of the Bureau of Reclamation.
14
REFERENCES
1. "The Use of Laboratory Tests to Develop Design Criteria For Protective Filters" by K. P. Karpoff, Proceedings ASTM, Volume 55, 1955• Also issued as Bureau of Reclamation Earth Laboratory Report No. EM-425.
2. "Soil Mechanics in Engineering Practice" by Karl Terzaghi and Ralph B. Peck, John Wiley and Sons, Incorporated, 1948.
3. "Land Drainage and Flood Protection" by Bernard A. Etcheverry, McGraw-Hill Book Company, 1931.
4. "Ground Water, Its Development, Uses and Conservation" by E. W. Bennison, Edward E. Johnson Company, Incorporated, 1947.
5. "Flood-Erosion Protection For Highway Fills" by C. J. Posey, Member ASCE, Paper No. 783, Volume 81, Proceedings ASCE, August 1955•

~y I
N
----Coarse gravel laid to slope and thickness of test section
4 " Divider-- --"'t
I I N I I Test section ---;~—~
I I I I I
l
6
AL_ A
Stilling well with 6" hook gage-----=- PLAN
-Glass sided flume
I --4" Plywood divider
Material being tested---.
r-Water surface
Slope 2 I----, I
I °
1 it I
! I I
I
eFrrinni n-n
FIGURE 2.- MODEL FOR WAVE STUDIES

Screw for wave frequency control-
Fixed support--->-
2 Groove variable speed pulleys - - - - - - - - f _ (Speed varied by __---- ,---Pivot for pulleys changing tilt with frequency control)
-----j--Fixed support
Pulley wheel--
Alternate driving rod anchor holes to vary length of stroke -,\
Gate driving rod 0- ~o ``-Motor
-Top of test flume v o`
Extension arm from ot;'o
wave generating gate------ I (D
~ 1 _-`- .--Optional extension to increase length of driving rod stroke.
FIGURE 3.- WAVE MACHINE DRIVE AND CONTROL MECHANISM
CLAY TO SILT------ --------SAND ------ GRAVEL ----t—COBBLES
HYDROMETER ANALYSIS — — — --- — — --- -----SIEVE ANALYSIS----------------- TIME READING IN MINUTES U.S.STANDARD SERIES I CLEAR SQUARE OPENINGS
60 19 4 1 #200 #100 #50#40#30 #16 #10#8 #4 3/8" 3/4" 1 1/2" 3" 5"6"8 100 1 0
90
80
cD 70 z N 60 a a
50 H z U 40 Ir a 30
20
E
oe
i
U. S. B. R, / / I
LIMITS OF GRADED FILTER CRITERIA i FOR BASE MATERIAL— /
-ROUNDED i I I
GRAVEL MATERIAL
100
~ I I
I le
I/ I I /I I I
I I I 1 1 .4~ 1 1 201 I 1 1 1 J19 .0 7 .074 .149
I .297 I ,590 1.19 12.38 4.76 9.52 19,1 38,1
I ~~ ITI .02 .03 .05 ,I .2 .3 .5 .02 .03 .05 .2 .3 .5 1 2 3 5 10 20 30 503 5 10 20 30 50
DIAMETER OF PARTICLE IN MILLIMETERS
FIGURE 4.— AVAILABLE GRAVEL BLANKET MATERIAL
0
.005 .001
.005 .01
X
20
30 w z
40 w er
50 t—z
60 w U cr
70 wa
80
90
t 00 I27
7T.2 152
100 200
30 0 w Z
40 Q H W
50
2 60 W
V cr
70 W 0-
80
90
CLAY TO SILT ----- --------SAND ----- GRAVEL --- t—COBBLES HYDROMETER ANALYSIS --- -------------SIEVE ANALYSIS --------------
TIME READING IN MINUTES U.S. STANDARD SERIES I CLEAR SQUARE OPENINGS 60 19 4 1 # 200 #100 # 50#40#30 #16 #10#8 #4 3/8 3/4" 1 1/2 3" 5'. 6'1 8.1
100 0
90
80
0 70
Z
N 60 N Q
a 50
Z W 40 U
a 30
20
I7
woe—
/oo ~ I
LIMITS OF GRADED ol
FILTER CRITERIA 1 FOR BASE MATERIAL--~~ Y
I ~el I i
10 00, BLACK TALUS I MATERIAL, I
'-TAN TALUSI I MATERIAL I
COMBINED TALUS MATERIAL---
I I I
ool I Iool
i i I I
I I
I I I I 1 1 .42 1 1 2.01 1 1 1 1 109 .019
I ~ .037 .074 .149 .297 j 590 1.19 12.38 4.76 9.52 11.1 38.1 l I I I I I ~ TAT I .01 .02 .03 .05 .1 .2 .3 .5 1 2 3 5 10 20 30 50
DIAMETER OF PARTICLE IN MILLIMETERS
FIGURE 5.—AVAILABLE TALUS BLANKET MATERIALS
0
005
.005
Rol
100 127
76.2 1 T2
100 200
CLAY TO SILT------ - -------- SAND -------->A-----GRAVEL --- t -̀COBBLES
HYDROMETER ANALYSIS --- --- _--- -- ---- SIEVE ANALYSIS------------------- TIME READING IN MINUTES U.S. STANDARD SERIES ! CLEAR SQUARE OPENINGS
V2" " 3 5"6" 8" 100 1 1 0
60 19 4 200 100 # # #50#40#30 I i 3/e # 6 # 0#8 #4 ° 3/41,I 1
O 70
z
N 60
Q a-
50 F z W 40 U IY
CL 30
90
80
20
109
.42 2.0 127 0 10 0
005 .009 .019 .037 .074 .149 .297 i .590 I.19 2.38 4,76 9.52 19.1 38.1 76.2 i 152
005 .01 .02 .03 .05 i .2 .3 .5 1 2 3 5 10 20 30 50 100 200 DIAMETER OF PARTICLE IN MILLIMETERS
i I I I
l I
iC
2( I I I 1 I I I
I 3(
I I
I I I I 1 I
1 i I I I I
41
I I I I 1 i 1 61
1 51
I I I I I ~ I
71 I i I I l I 1 81 1
I
I I I 1 I I
1 i I
1 1 91 t I
O W z
FIGURE 6.- BASE MATERIAL THROUGH WHICH THE CANAL PASSES
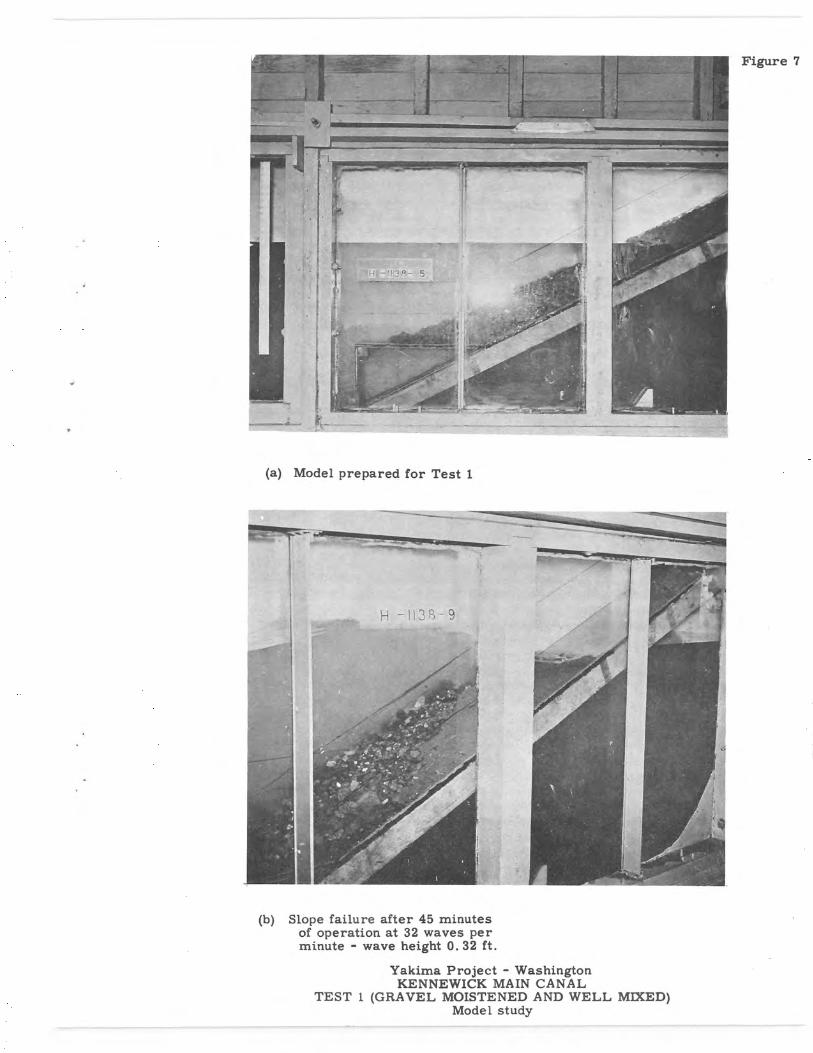
Figure 7
(a) Model prepared for Test 1
(b) Slope failure after 45 minutes of operation at 32 waves per minute - wave height 0. 32 ft.
Yakima Project - Washington KENNEWICK MAIN CANAL
TEST 1 (GRAVEL MOISTENED AND WELL MIXED) Model study
20
30 a w z_
40 Q I-w er
50 H z
60 W U
70 a..
80
90
CLAY TO SILT- - ---- I ---- -- -- SAND ----- GRAVEL ---- COBBLES HYDROMETER ANALYSIS--- -------------SIEVE ANALYSIS----------------
TIME READING IN MINUTES U.S. STANDARD SERIES I CLEAR SQUARE OPENINGS
60 19 4 1 #200 #100 #50#40#30 #16 #10#8 #4 3/8" 3/4 " 1 1/Z" 3" '5116 " 8'
100 O
90
80
0 70 z
60 Q a
50 H Z
v 40
1Y
a 30
20
u
I r v
BASE I 000, /) MATERIAL- --
UI.S. B.R. GRADED FILTER ( 1 CRITERIA FOR _ __, ( 1 I BAS MATERIAL
GRAVEL MATERIAL I r SMALLER THAN 3/4-INCH" -
/ A I
GRAVEL LARGER
MATERIAL THAN 3/4 -INCH
I I (
I / I I U.S.B.R. U IFORM FILTER
CRITERIA FOR
f r
/ / / 3/4 MINUS -INCH L"-'_- IMATERI ----
I
----Ole
I I 0
.005 .009
,005 .01
E
42 i i 2.01 1 7 127 100
019 .037 .074 .149 .297 1 .590 1.19 12.38 4.76 9.52 19.1 38.1 76.2 1152
.02 .03 .05 .1 .2 .3 .5 1 2 3 5 10 20 30 50 100 200 DIAMETER OF PARTICLE IN MILLIMETERS
FIGURE 6.- GRAVEL MATERIAL SCREENED AT 3/4 INCH BASE MATERIAL - FILTER CRITERIA
4
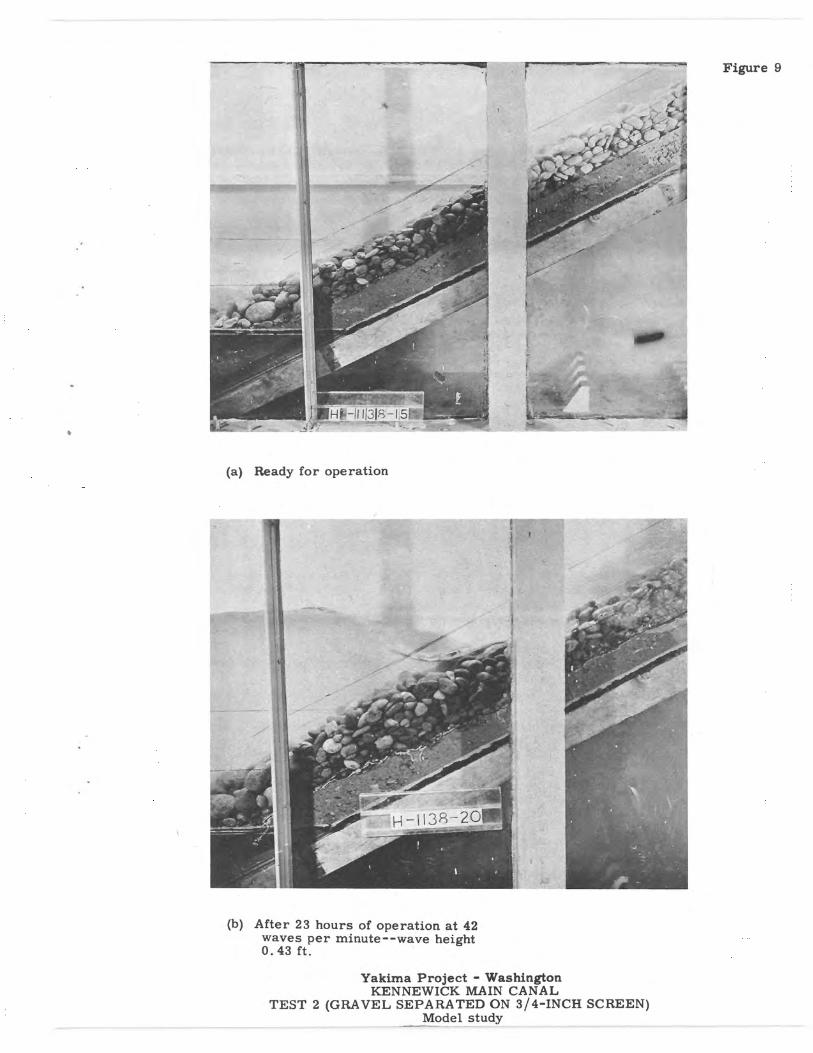
Figure 9
[ i
(a) Ready for operation
(b) After 23 hours of operation at 42 waves per minute--wave height 0. 43 ft.
Yakima Project - Washington KENNEWICK MAIN CANAL
TEST 2 (GRAVEL SEPARATED ON 3/4-INCH SCREEN) Model study
11
HI
(a) Rake used in Test 3
Figure 10
(b) After 19 hours of operation at 42 waves per minute--wave height 0.43 ft.
Yakima Project - Washington KENNEWICK MAIN CANAL
TEST 3 (GRAVEL PLACED DRY AND RAKED) Model study
E
3•]
30 a w z
40
w
50 r z
60 w U Ir
70 aW
80
90
CLAY TO SILT------ --------SAND ----- GRAVEL ---->f-COBBLES
HYDROMETER ANALYSIS - ------------SIEVE ANALYSIS--------------- TIME READING IN MINUTES-
- U.S. STANDARD SERIES ( CLEAR SQUARE OPENINGS
100 O 19 4 1 *200 *100 *50*40*30 *16 *10*8 #4 3/8'1 3/4y 1 1/2" " 3" 560. 80
M
80
70 z
N 60 N Q CL
50 r z w 40 V cr d 30
20
E
I I ~ I I I 17 I /
BASE 1 10000' 00, 0, 1 I
MATERIAL -- I I 1 I
I I
I Ile
I 1/
U.S.B.I GRADED FILTER / CRITERIA FOR
k BASE MATERIAL''
`. 1 000, I / 1
I I
I I 'V
1 I 1 I
GRAVEL MATERIAL I I SMALLER THAN I-INCH __T,
GRAVEL MATERIAL LARGER THAN I-INCH I I
I I U.S!B.R.
UNIFORM FILTER 1
/ I I I I CRITERIA FOR 000, MINUS I-INCH
MATERIAL- --- / I ----_ __-~ 1 I / I
.42 2.0 1271 100
.019 .037 .074 .149 .297 .590 1.19 12.38 4.76 9.52 19.1 38.1 76.2 1 152
.02 .03 .05 I .2 .3 .5 1 2 3 5 10 20 30 50 100 200 DIAMETER OF PARTICLE IN MILLIMETERS
FIGURE II.- GRAVEL MATERIAL SCREENED AT I INCH BASE MATERIAL- FILTER CRITERIA
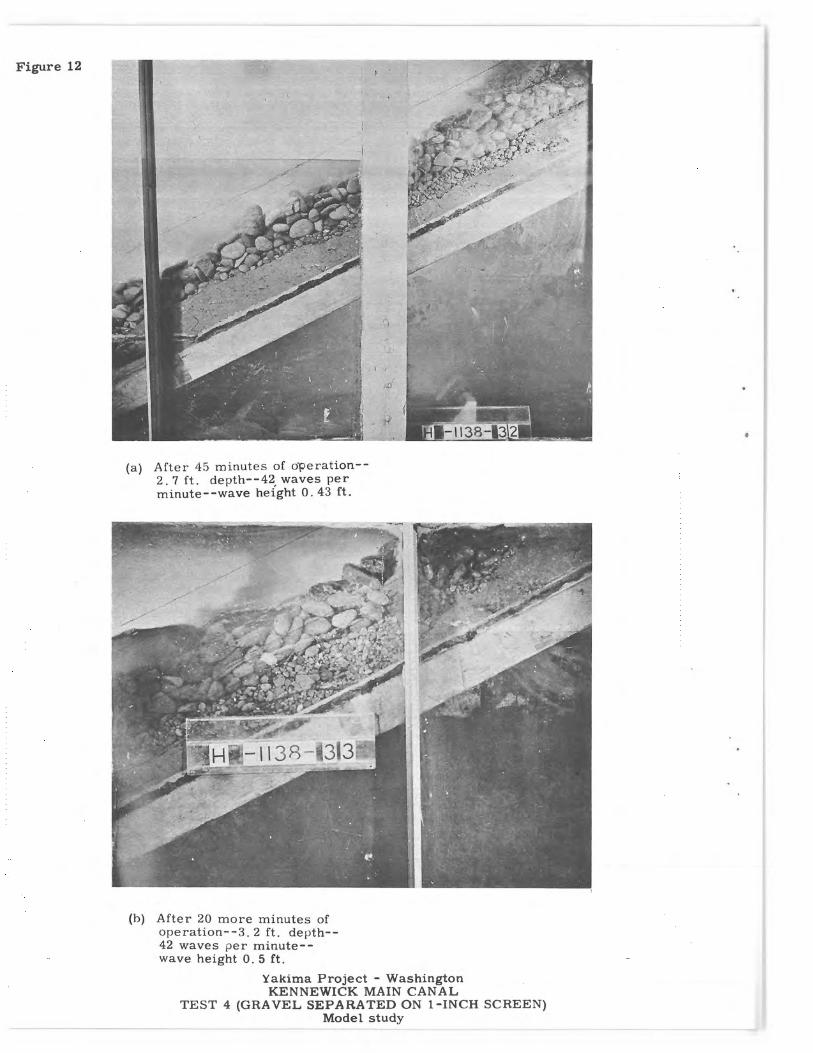
Figure 12
(a) After 45 minutes of operation-- 2. 7 ft. depth--42 waves per minute--wave height 0. 43 ft.
(b) After 20 more minutes of operation--3. 2 ft. depth-- 42 waves per minute-- wave height 0. 5 ft.
Yakima Project - Washington KENNEWICK MAIN CANAL
TEST 4 (GRAVEL SEPARATED ON 1-INCH SCREEN) Model study
CLAY TO SILT------ --------SAND ----- GRAVEL --- t
COBBLES
HYDROMETER ANALYSIS - -- -------------SIEVE ANALYSIS---------------- TIME READING IN MINUTES U.S.STANDARD SERIES I CLEAR SQUARE OPENINGS
60 19 4 1 #200 #100 #50#40#30 #16 #10#8 #4 3/s" 3/411 1 1/211 3" 5'1 6° 8 100
0
90
80
cD 70 z N 60 Q 0-
50 F-Z w 40 U cr a 30
20
119
W-0 J.W MINI BASE m. wom M ATERIAL— A~F
GRX ED FILTER 0;,IllEWAWMEFAEl
CRITERIA FOR BASE MATERIAL-,
t ~I MEN MEN
0 J .005 .0O~
.005 .01
17
20
30 W Z
'w w
50 F—Z
60 w U
70 a
80
90
100 21 1 2.01 1 1 1 1 1 I27
.019 .037 _074 .149 .297 i .590 1.19 12.38 4.76 9.52 19.1 38.1 76.2 1 152 If
.02 .03 .05 .I .2 .3 .5 1 2 3 5 10 20 30 50 100 200 DIAMETER OF PARTICLE IN MILLIMETERS
FIGURE 13.- GRAVEL MATERIAL SCREENED AT 1/2 INCH BASE MATERIAL -FILTER CRITERIA
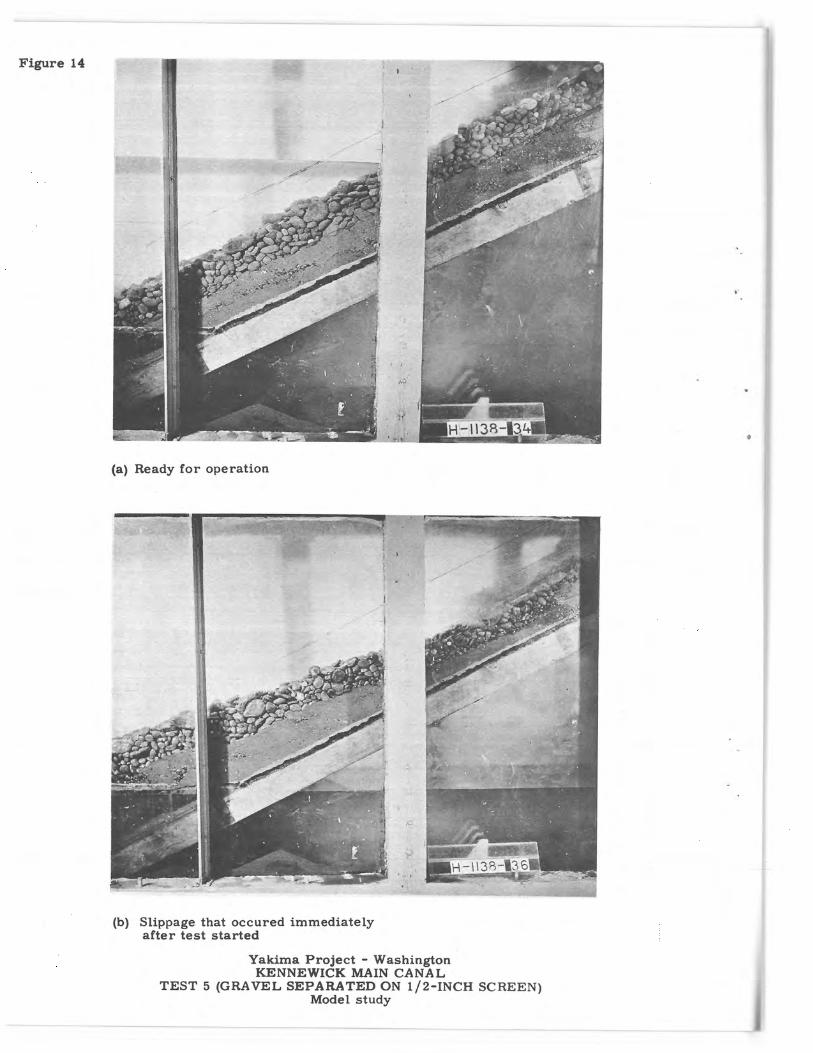
Figure 14
(a) Ready for operation
(b) Slippage that occured immediately after test started
Yakima Project - Washington KENNEWICK MAIN CANAL
TEST 5 (GRAVEL SEPARATED ON 1/2-INCH SCREEN) Model study
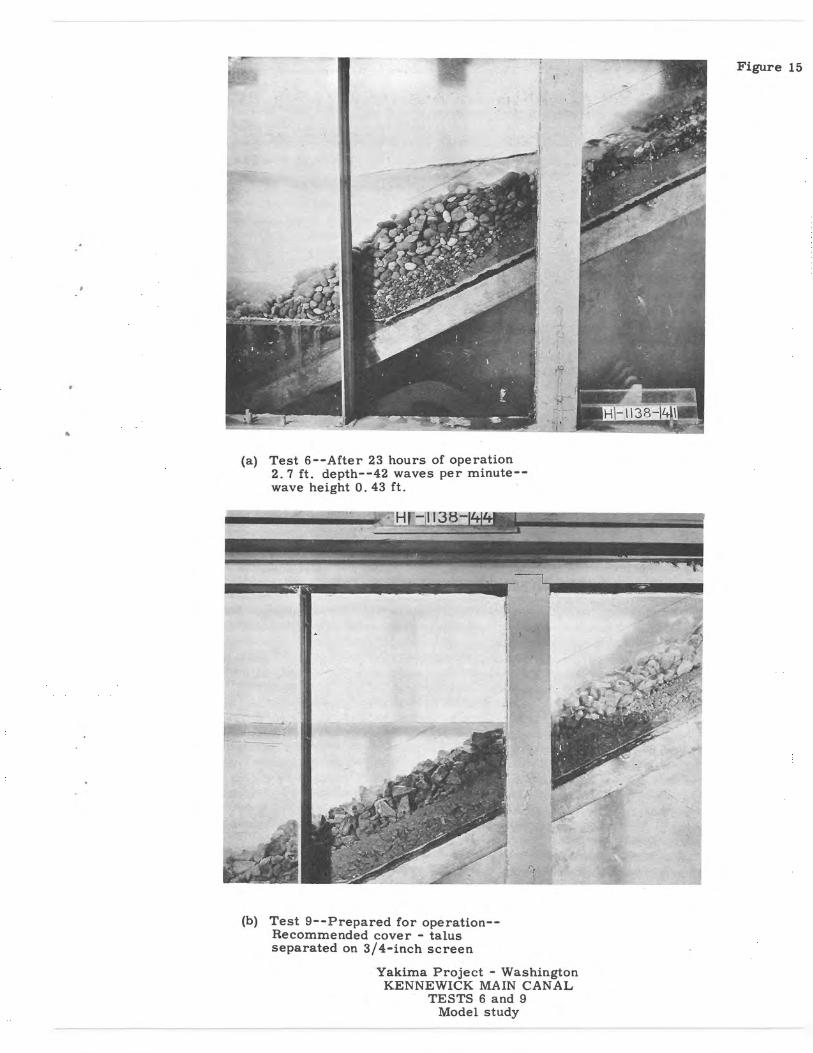
(a) Test 6--After 23 hours of operation 2. 7 ft. depth--42 waves per minute-- wave height 0. 43 ft.
000900000 low- --- H►.. _,113~3-1'414 .
H~
ti t~
(b) Test 9--Prepared for operation-- Recommended cover - talus separated on 3/4-inch screen
Yakima Project - Washington KENNEWICK MAIN CANAL
TESTS 6 and 9 Model study
Figure 15
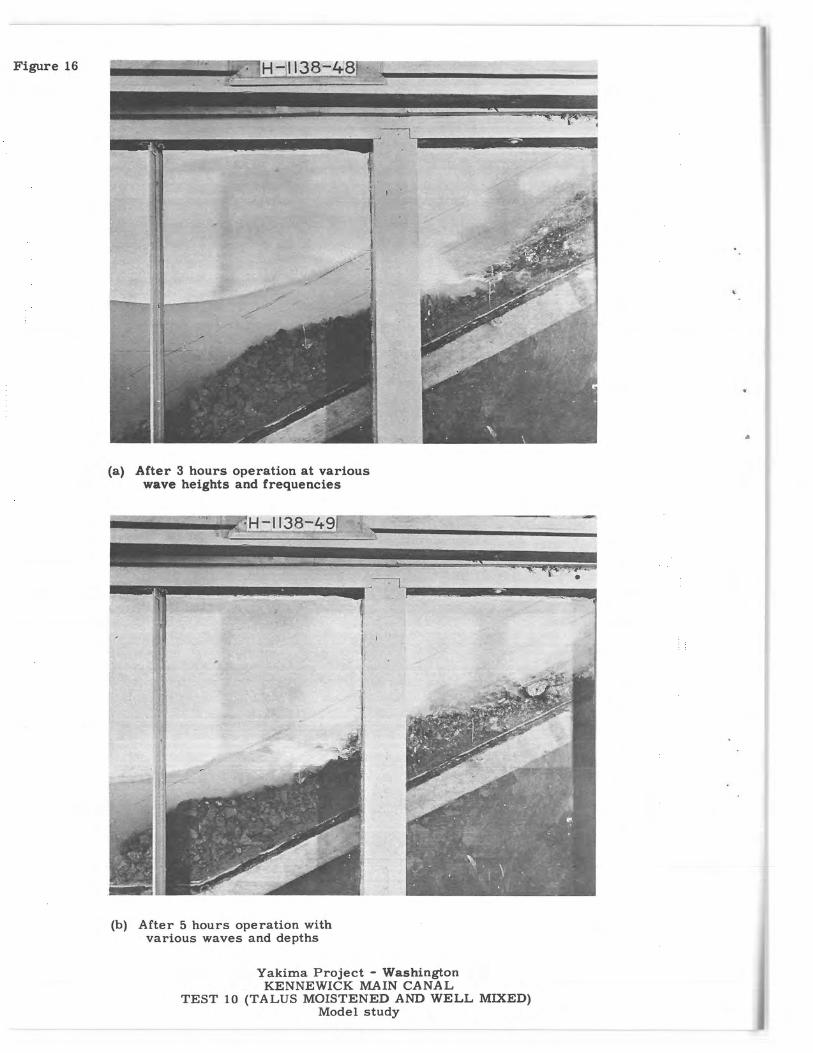
Figure 16
(a) After 3 hours operation at various wave heights and frequencies
38-491
111 111 ills
(b) After 5 hours operation with various waves and depths
Yakima Project - Washington KENNEWICK MAIN CANAL
TEST 10 (TALUS MOISTENED AND WELL MIXED) Model study
CLAY TO SILT------ -------SAND ----- } ----GRAVEL --- -t—
COBBLES HYDROMETER ANALYSIS--- -------------SIEVE ANALYSIS--------------
TIME READING IN MINUTES U.S. STANDARD SERIES I CLEAR SQUARE OPENINGS
0 0 19 4 1 #200 #100 #50#40#30 #16 #10#8 #4 3/8 .1
3/4" 1 I/2" 3" 5"6" 8'0 10
ael
80
0 70
Z
N 60 (A Q 0.
50 H 2 W 40 U IY
aW. 30
20
El
BASE MAT ERIAL-~
i i
U.S. B. R. FILTER
1 /
I I
I I
GRADED I If / I CRITERIA LIMITS I / I FOR BASE MATERIAL -1-1 TALU I / , ( MATERIAL
LARGER THAN / I/2 I N C H
TALUS MATERIAL SMALLER THAN 1/2 INCH'
U.S.S.R. UNIFORM FILTER iof / I CRITERIA LIMITS
FOR MINUSI/21NCH MATERIAL—,,
I I/
10
IN
20
30 0 W Z
40 Q I— W 1r
50 H Z
60 W U
70 a
80
m
0 .4~ 2.0 127
100
.005 .009 .019 .037 .074 .I g9 .297 1 .590 1.19 12.38 4.76 9.52 I 1 3.1 76.2 I Ir,1 1 I T~ 18 1 I f, .005 .01 .02 .03 .05 I .2 .3 .5 1 2 3 5 10 20 30 50 100 200
DIAMETER OF PARTICLE IN MILLIMETERS
FIGURE 17.- TALUS MATERIAL SCREENED AT 1/2 INCH BASE MATERIAL- FILTER CRITERIA
CLAY TO SILT------ -------- SAND GRAVEL.- - - - RAVEL---- COBBLES HYDROMETER ANALYSIS--- -------------SIEVE ANALYSIS---------------
TIME READING IN MINUTES U.S.STANDARD SERIES I CLEAR SQUARE OPENINGS
100 0 19 4 1 #200 #100 #50#40#30 #16 #10#8 #4 3/8" 3/4" 1'/2" 3" 5"6" 8'0
90
80
70 Z
N 60
Q a
50 H 2 w 40 U
a 30
20
IR
r I
I r I/
BASE __ I I
r MATERIAL--
U. S. B. R. I 00, oe r / I
GRADED FILTER I / CRITERIA LIMITS
FOR BASE MATERIAL-'' I / I `.I
00,
1
TALUS MATERIAL /
THAN I
1 I LARGER / 3/4 -iNCH -.
TALUS MATERIAL SMALLER THAN 3/4-INCH -
/ i I U.S.B.R.
1 I I I UNIFORM FILTER CRITERIA FOR 1 MINUS 3/4-INCH
10 -~ 101 ---0000 ~- MATERIA ---
oue
20
30 0 w Z
40 Q w
50 H Z
60 W U
70 U' 0-
80
90
0 100 42 1 1 127
.005 .009 .019 .037 .074 .149 .297 i .590 1.19 12.38 4.76 9.52 19.1 38.1 76.2 1 152 I
.005 .01 .02 .03 .05 .1 .2 .3 .5 1 2 3 5 10 20 30 50 100 200 DIAMETER OF PARTICLE IN MILLIMETERS
FIGURE 18.-TALUS MATERIAL SCREENED AT 3/4 INCH - RECOMMENDED FOR COVER BLANKET BASE MATERIAL- FILTER CRITERIA
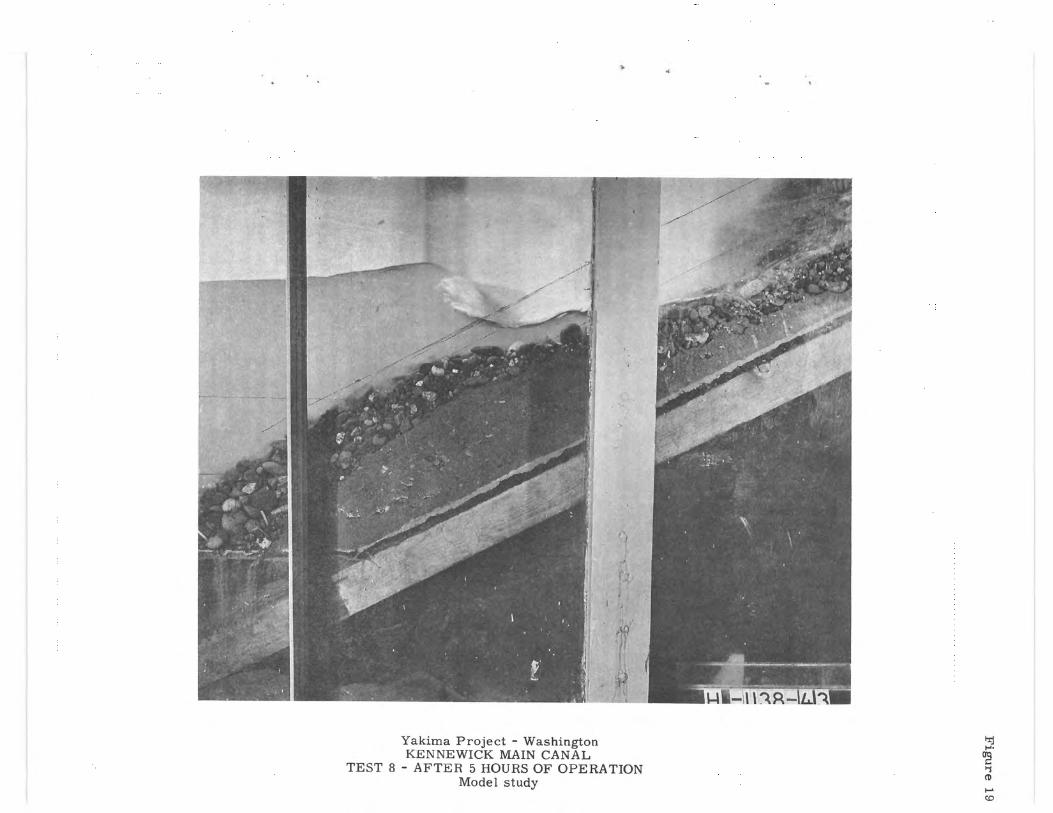
Yakima Project - Washington KENNEWICK MAIN CANAL
TEST 8 - AFTER 5 HOURS OF OPERATION Model study
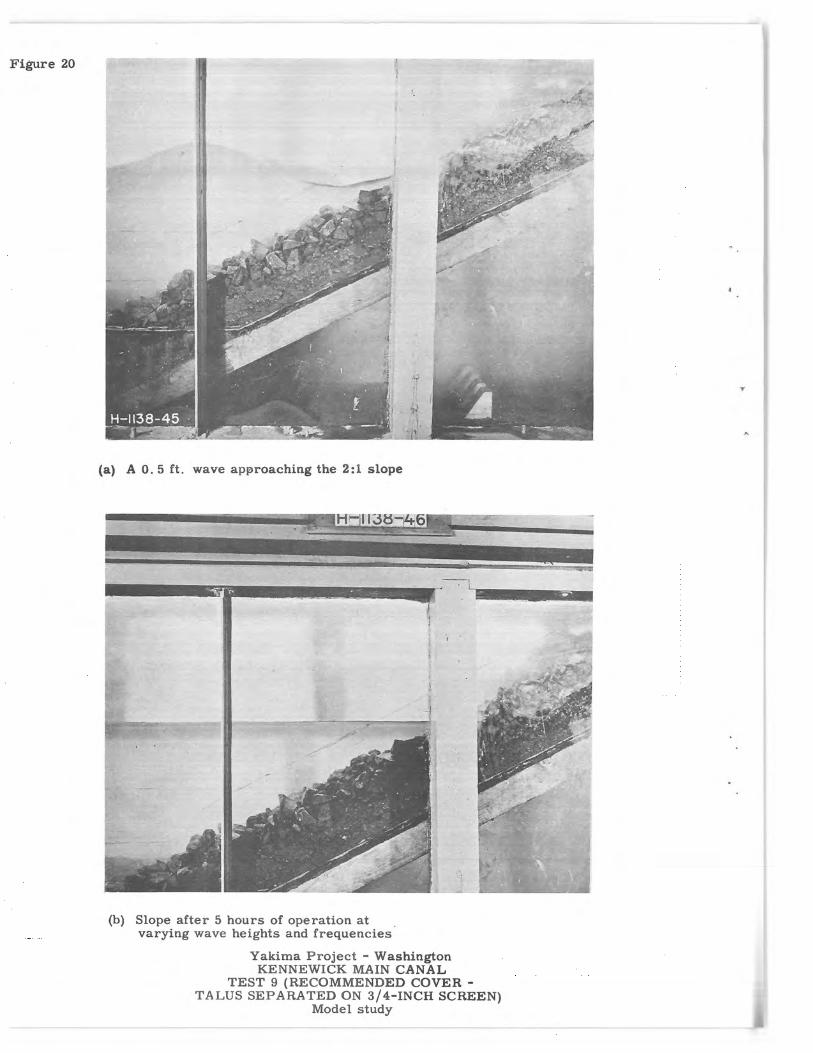
Figure 20
-
w-. f ;4
I i
s3
w Y
(a) A 0. 5 ft. wave approaching the 2:1 slope
(b) Slope after 5 hours of operation at varying wave heights and frequencies
Yakima Project - Washington KENNEWICK MAIN CANAL
TEST 9 (RECOMMENDED COVER - TALUS SEPARATED ON 3/4-INCH SCREEN)
Model study
Y
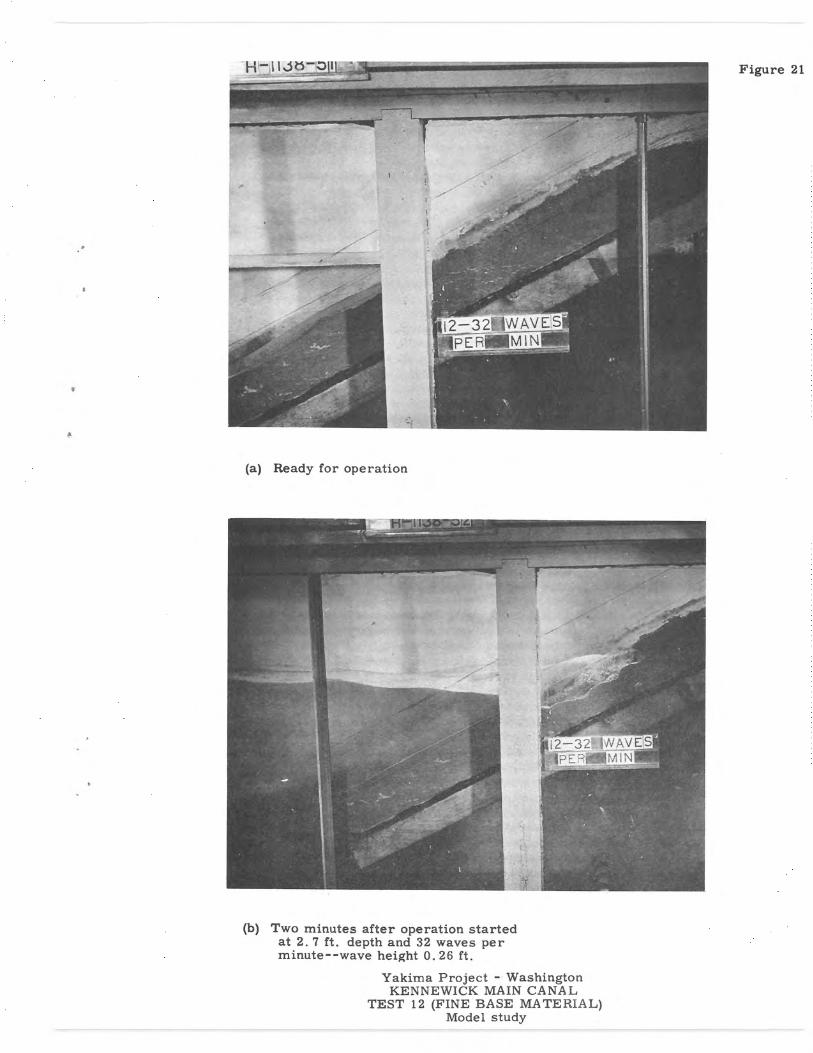
Figure 21
r
(a) Ready for operation
(b) Two minutes after operation started at 2. 7 ft. depth and 32 waves per minute--wave height 0. 26 ft.
Yakima Project - Washington KENNEWICK MAIN CANAL
TEST 12 (FINE BASE MATERIAL) Model study
T
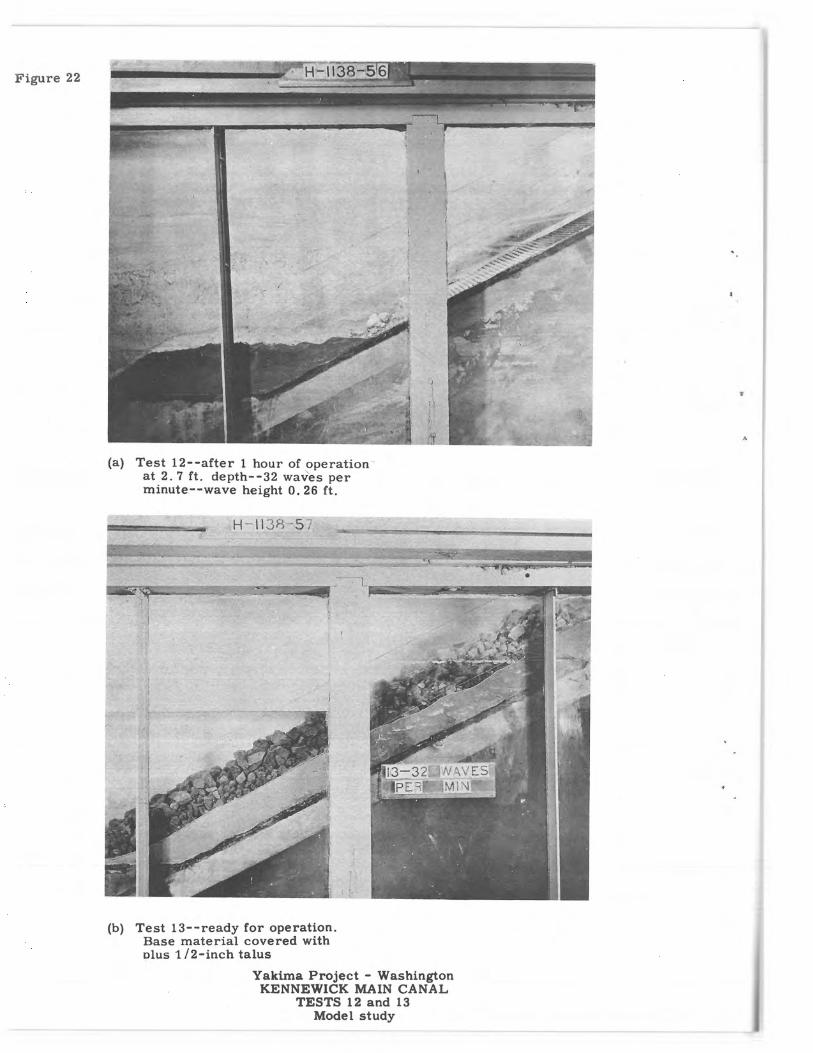
Figure 22 H-113>3`-56
0
I
A
(a) Test 12--after 1 hour of operation at 2. 7 ft. depth--32 waves per minute--wave height 0.26 ft.
H 1138 -5
V for fro
j
a
(b) Test 13--ready for operation. Base material covered with plus 1/2-inch talus
Yakima Project - Washington KENNEWICK MAIN CANAL
TESTS 12 and 13 Model study
c
11
Figure 23
0 (a) After 7 minutes of operation at 32 waves per minute--depth 2. 7 ft. --wave height 0. 26 ft.
(b) After 90 minutes of operation at 32 and 42 waves per minute leaching of base material progressed as shown by lines on the photograph
Yakima Project - Washington KENNEWICK MAIN CANAL
TEST 13 (BASE MATERIAL AND PLUS 1/2-INCH TALUS MATERIAL)
Model study
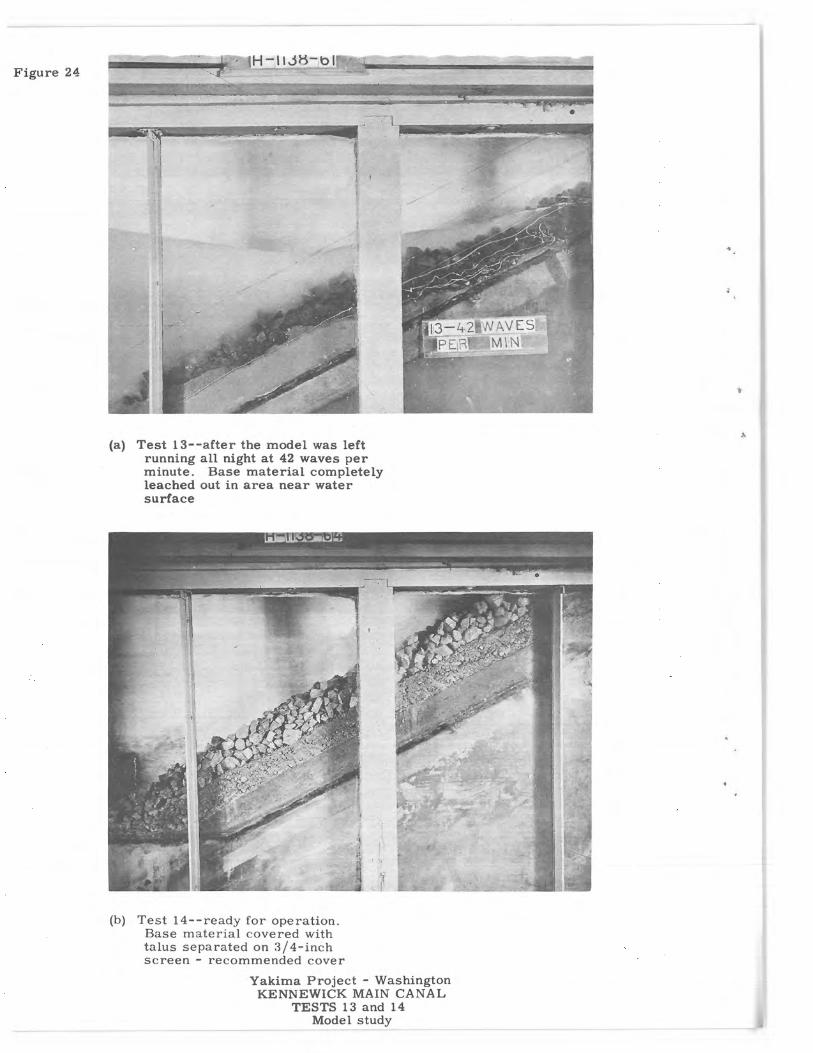
Figure 24 H — II J,'i—b1#4'
1
f
dy
r ~j J~
(a) Test 13--after the model was left running all night at 42 waves per minute. Base material completely leached out in area near water surface
A
(b) Test 14--ready for operation. Base material covered with talus separated on 3/ 4-inch screen - recommended cover
Yakima Project - Washington KENNEWICK MAIN CANAL
TESTS 13 and 14 Model study
, 1 1 %3' _.~...
Yakima Project - Washington KENNEWICK MAIN CANAL
TEST 14 (RECOMMENDED COVER) AFTER 28 HOURS OF OPERATION AT 42 WAVES PER MINUTE--2. 7 FT. DEPTH--WAVE HEIGHT 0.43 FT.
Model study
Ili
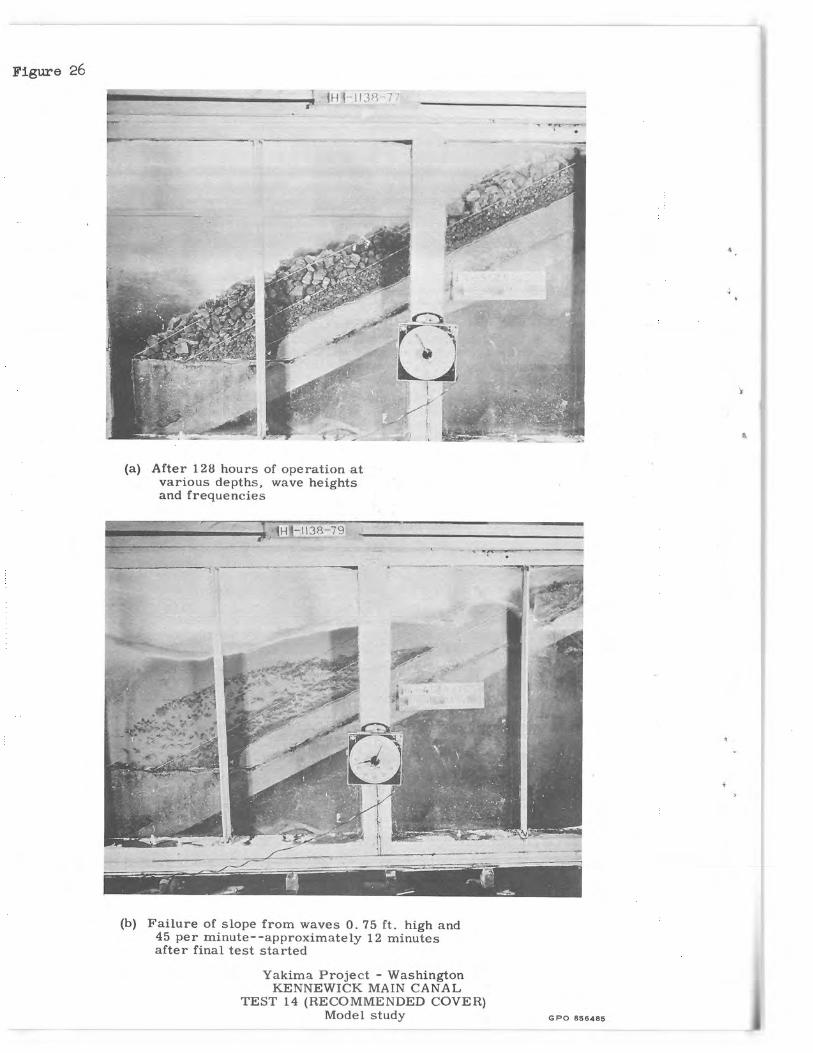
Figure 26
77,
It
v r- ^
s
r 4.
(a) After 128 hours of operation at various depths, wave heights and frequencies
-1H I-I I38-i9
77 .,r......»..-. ~... r art.--.~.ny..,-,.r..w.
!jt
(b) Failure of slope from waves 0. 75 ft. high and 45 per minute--approximately 12 minutes after final test started
Yakima Project - Washington KENNEWICK MAIN CANAL
TEST 14 (RECOMMENDED COVER) Model study GPO 856485
Y
A

s'

! r