Embed Size (px)
Citation preview
When More Power Makes Actors Worse Off:Turning a Profi t in the American Economy
Mikołaj Jan Piskorski, Harvard UniversityTiziana Casciaro, Harvard University
We propose a theory which predicts that an increase in an actor’s relative power reduces the actor’s rewards in high mutual dependence dyads. Our argument is based on the premise that higher relative power gives the more powerful actor a greater share of surplus, but it also reduces dyadic exchange frequency, which lowers the expected magnitude of that surplus. As mutual dependence increases, fairness issues associated with power imbalances reduce exchange frequency and expected surplus at an increasingly higher rate. Thus, at a certain level of mutual dependence, the more powerful actor obtains a greater share of a much smaller exchange surplus leading him or her to be worse off than he would be in an equal-power dyad. We support this prediction with data on profi t rates in American industries from 1977 through 1992.
Introduction
Research in social exchange theory has long been concerned with the theoretical link between power capability and inequality in rewards (Cook, Emerson and Gillmore 1983; Marsden 1983; Yamagishi, Gillmore and Cook 1988; Coleman 1990; Friedkin 1995). Perhaps the most basic finding in this stream of literature is that, following an increase in power capability, the power-advantaged actor will be better off by virtue of receiving a greater proportion of benefits from the exchange. However, the causal link between greater power capability and greater rewards holds only if the acquisition of power does not decrease the magnitude of rewards available in the exchange. If, under certain conditions, the acquisition of power capability were to substantially reduce the magnitude of rewards available, the power-advantaged actor would obtain a greater share of a smaller pool of rewards instead of a smaller share of a larger one. If the reduction in the pool of available rewards is substantial enough, the increase in power capability can make the power-advantaged worse off. This article identifies one important condition under which this is likely to occur.
We develop our argument within the power-dependence framework (Emerson 1962) which characterizes power capabilities in terms of relative power and total power. Relative power captures the difference in power capability between actors in a dyad (Lawler 1992; Lawler and Yoon 1996). Total power captures the actors’ mutual dependence on each other – the extent to which the dyad as a
We would like to thank Glenn Carroll, Kathleen McGinn, Mark Mizruchi, Joel Podolny and Martin Ruef for their helpful comments. Financial support by the Division of Research at Harvard Business School and the Stanford Graduate School of Business is gratefully acknowledged. Direct correspondence to Mikołaj Jan Piskorski, Harvard Business School, Harvard University, Boston, MA 02163, (617) 495-6099. E-mail: [email protected].
© The University of North Carolina Press Social Forces, Volume 85, Number 2, December 2006
1012 • Social Forces Volume 85, Number 2 • December 2006
whole will be better off if the actors exchange with each other rather than with their alternatives (Bacharach and Lawler 1981; Molm 1987, 1990).
Our argument stems from the notion that an increase in relative power has two opposing effects. On the one hand, it allows the power-advantaged actor to obtain a greater share of the rewards from the exchange than he would in an equal-power exchange. On the other hand, the increase in relative power introduces issues of fairness and legitimacy that reduce the frequency of exchange between the actors. This reduction in exchange frequency in turn decreases the expected magnitude of exchange rewards available to the power-imbalanced dyad as compared to a power-balanced one. Under conditions of high total power, power inequalities complicate the bargaining agenda even further, such that an equivalent increase in relative power leads to a greater decline in the frequency of exchange (Lawler and Bacharach 1987; Lawler and Yoon 1993, 1996). Thus, as relative power increases, the expected magnitude of rewards available to the dyad becomes smaller at a faster rate in a high-total-power exchange than in a low-total-power one. At a certain level of total power, the reduction in the magnitude of exchange rewards will be so large that even though the power-advantaged actor obtains a greater share of exchange benefits, he will be worse off than if he received a smaller share of a greater pool of resources in equal-power exchanges.
We support our predictions with data from a study of industry profit rates in the American economy in the period 1977-1992. With this choice of setting, the paper departs from most empirical research in social exchange theory, which has traditionally hinged on experimental studies of individuals or small groups. An important difference between these studies and ours is that we draw on advances in network theory, particularly on the notion of constraint (Burt 1982) to construct the measures of relative power and total power. Cook and Whitmeyer (1992) argued that social exchange theory and network theory are generally compatible approaches to mapping social structures and understanding their effects. Nonetheless, these theoretical traditions are still developing largely in isolation from one another. By providing a model of profit differences derived from social exchange theory and implementing it using advances in network theory, we hope to show how the two approaches complement each other and to contribute to their integration. Testing our propositions in the context of economic exchanges outside the laboratory also offers the benefit of exploring the micro-to-macro generalizability of exchange theoretic explanations of inequality.
Theory
Exchange Structure
We implement the power-dependence model in the context of an exchange in which actors i and j bargain over a fixed set of rewards, r. Both actors have outside options given by ai and aj, respectively. The sum of these outside options is lower than the total amount of benefits available from the focal exchange. Relative power is determined by the ratio of the outside options which actors i and j receive if they fail to conclude the exchange with each other (ai/aj) Thus, if
Power and Profi t • 1013
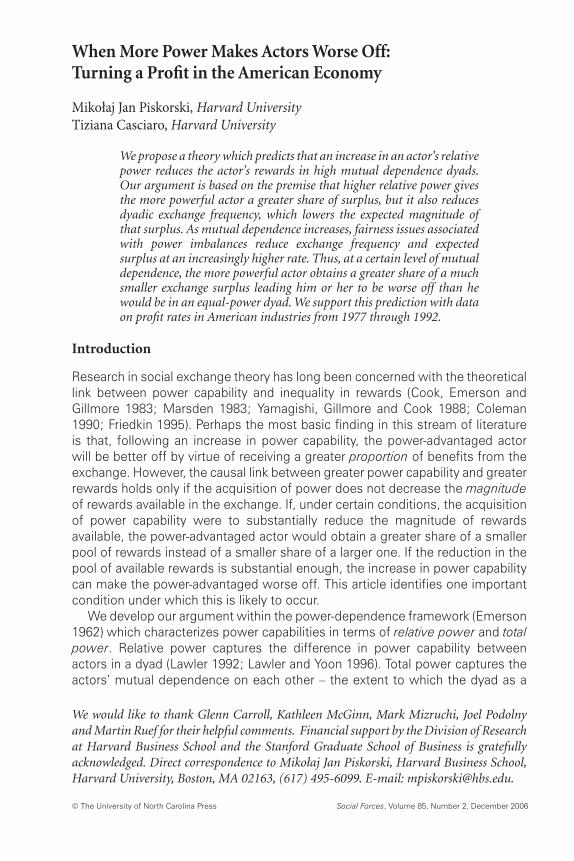
actors have equal outside options, as illustrated in Configuration 1 in Figure 1, relative power in this dyad is balanced. However, if the more powerful actor’s outside option is 1.5 times the value of the outside option of the less powerful actor, as illustrated in Configuration 2 in Figure 1, relative power is imbalanced by a factor of 1.5.
The values of the outside options not only determine i’s and j’s profits if they fail to exchange with each other, but also have a direct effect on the distribution of rewards if i and j do exchange with each other. This is because, when actors i and j bargain over the distribution of rewards, they both have to receive at least the value of their outside option in order to have the incentive to participate in the exchange. Subsequently, i and j bargain over the distribution of the remaining benefits from the exchange – the exchange surplus, s, defined as r a ai j− − . If actors agree on the distribution of the exchange surplus and exchange with each other, they will be jointly better off by the value of the exchange surplus. The concept of total power, defined as s a ai j/ +( ), captures the extent to which actors will be better off by exchanging with each other rather than with their alternatives.
To illustrate this concept, consider Configuration 1 again, assuming that the actors bargain over 240 units of profit. In order for actors i and j to have the incentive to participate in the exchange, both actors must receive 80 units of profit each. This leaves 240 - 80 - 80 = 80 units of profit to distribute between them through bargaining. Because the value of surplus is 80 units over and above the 160 units received from the outside options, the total power in this dyad is .5. In contrast, if the outside options for both actors are only 60 units of profit, as illustrated in Configuration 3, the actors will distribute 240 - 60 - 60 = 120 units
Figure 1. Confi gurations of Relative Power and Total Power
Low total power (.5) High total power (1)
Configuration 1 Configuration 3
Rel
ativ
e po
wer
ba
lanc
ed (1
)
8080 80i j↔ → ↔ 12060 60i j↔ → ↔
Configuration 2 Configuration 4
Rel
ativ
e po
wer
im
bala
nced
(1.5
)
12072 48i j↔ → ↔
8096 64i j↔ → ↔
In all confi gurations actors bargain over 240 units of profi t
1014 • Social Forces Volume 85, Number 2 • December 2006
of exchange surplus through bargaining. Because the surplus in this case is 120 units of profit over and above the 120 units they jointly receive from their outside options, the total power in this dyad is 1.
Relative and total power can vary independently of each other. Two dyads can have equal total power, but differ in their relative power, as illustrated in Configurations 3 and 4 in Figure 1. Similarly, two dyads can have equal relative power, but differ in their total power, as illustrated in Configurations 2 and 4 in Figure 1.
Profi t Rates
The concepts of relative power and total power allow us to draw a conceptual distinction between the rewards that i and j receive with certainty and those that they receive only when they exchange with each other rather than with their alternatives. Because actors obtain the value of their outside options if they agree to exchange with each other, but also when they do not, relative power characterizes rewards that actors i and j are certain to obtain. Total power characterizes the exchange surplus that the actors can receive over and above their outside options. This surplus can be obtained only if the actors agree to exchange with each other.
Thus, if the two actors agree to exchange with each other with frequency f, the expected surplus from exchanges between i and j is given by f * s. If actor i receives a proportion of the expected surplus given by p, then the expected surplus that accrues to actor i is given by p * f * s. The expected surplus that accrues to j is (1-p) * f * s. As the total profit accruing to each actor is composed of (a) the outside option that the actor receives regardless of whether the exchange between i and j occurs and (b) the share of expected surplus, then profits for actors i and j are given by:
πi a p f s= +i * *
π j p f s= + −( )a j 1 * *
Exchange Frequency
The profit equations contain two unknown variables, the exchange frequency and the proportions of expected surplus that accrue to the actors. One of the fundamental insights of social exchange theory is that relative power and total power determine the dynamics of bargaining between actors i and j. These dynamics allow us to predict both the frequency with which actors i and j agree to exchange with each other and the division of the surplus between the actors, should they agree to exchange. As a consequence, we can derive predictions regarding the relative magnitudes of the actors’ rewards under different configurations of relative and total power.
Dyads characterized by high total power are likely to exchange more frequently than those characterized by low total power (Granovetter 1985; Uzzi 1996). This
Power and Profi t • 1015
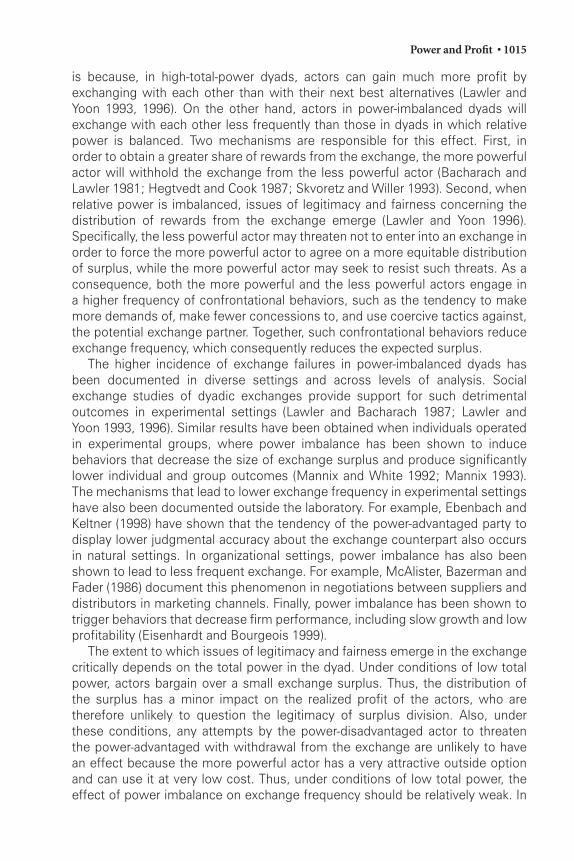
is because, in high-total-power dyads, actors can gain much more profit by exchanging with each other than with their next best alternatives (Lawler and Yoon 1993, 1996). On the other hand, actors in power-imbalanced dyads will exchange with each other less frequently than those in dyads in which relative power is balanced. Two mechanisms are responsible for this effect. First, in order to obtain a greater share of rewards from the exchange, the more powerful actor will withhold the exchange from the less powerful actor (Bacharach and Lawler 1981; Hegtvedt and Cook 1987; Skvoretz and Willer 1993). Second, when relative power is imbalanced, issues of legitimacy and fairness concerning the distribution of rewards from the exchange emerge (Lawler and Yoon 1996). Specifically, the less powerful actor may threaten not to enter into an exchange in order to force the more powerful actor to agree on a more equitable distribution of surplus, while the more powerful actor may seek to resist such threats. As a consequence, both the more powerful and the less powerful actors engage in a higher frequency of confrontational behaviors, such as the tendency to make more demands of, make fewer concessions to, and use coercive tactics against, the potential exchange partner. Together, such confrontational behaviors reduce exchange frequency, which consequently reduces the expected surplus.
The higher incidence of exchange failures in power-imbalanced dyads has been documented in diverse settings and across levels of analysis. Social exchange studies of dyadic exchanges provide support for such detrimental outcomes in experimental settings (Lawler and Bacharach 1987; Lawler and Yoon 1993, 1996). Similar results have been obtained when individuals operated in experimental groups, where power imbalance has been shown to induce behaviors that decrease the size of exchange surplus and produce significantly lower individual and group outcomes (Mannix and White 1992; Mannix 1993). The mechanisms that lead to lower exchange frequency in experimental settings have also been documented outside the laboratory. For example, Ebenbach and Keltner (1998) have shown that the tendency of the power-advantaged party to display lower judgmental accuracy about the exchange counterpart also occurs in natural settings. In organizational settings, power imbalance has also been shown to lead to less frequent exchange. For example, McAlister, Bazerman and Fader (1986) document this phenomenon in negotiations between suppliers and distributors in marketing channels. Finally, power imbalance has been shown to trigger behaviors that decrease firm performance, including slow growth and low profitability (Eisenhardt and Bourgeois 1999).
The extent to which issues of legitimacy and fairness emerge in the exchange critically depends on the total power in the dyad. Under conditions of low total power, actors bargain over a small exchange surplus. Thus, the distribution of the surplus has a minor impact on the realized profit of the actors, who are therefore unlikely to question the legitimacy of surplus division. Also, under these conditions, any attempts by the power-disadvantaged actor to threaten the power-advantaged with withdrawal from the exchange are unlikely to have an effect because the more powerful actor has a very attractive outside option and can use it at very low cost. Thus, under conditions of low total power, the effect of power imbalance on exchange frequency should be relatively weak. In
1016 • Social Forces Volume 85, Number 2 • December 2006
contrast, when total power is high, actors bargain over a significant exchange surplus, and therefore the agreement over the distribution of the surplus has great impact on the actors’ realized profit. This is particularly important for the less powerful actor, whose threats to withhold the exchange are more likely to be effective under conditions of high total power. Under these circumstances, a failure to exchange would be costly to the power-advantaged actor. Although withholding the exchange is even more costly to the power-disadvantaged actor, doing so signals the less powerful actor’s determination to impose costs on the more powerful actor in order to get a more equal distribution of the rewards (Lawler and Bacharach 1987). For these reasons, an increase in relative power has a larger negative impact on exchange frequency under conditions of high total power than under conditions of low total power.
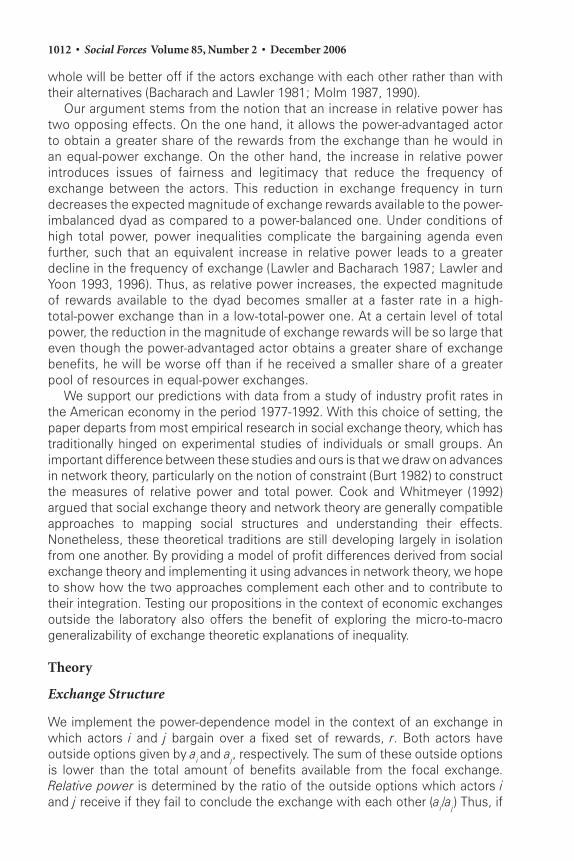
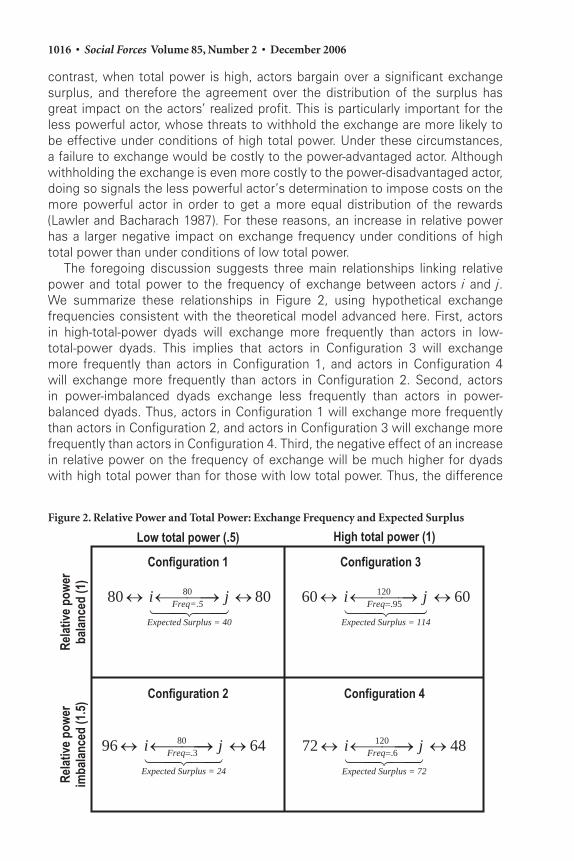
The foregoing discussion suggests three main relationships linking relative power and total power to the frequency of exchange between actors i and j. We summarize these relationships in Figure 2, using hypothetical exchange frequencies consistent with the theoretical model advanced here. First, actors in high-total-power dyads will exchange more frequently than actors in low-total-power dyads. This implies that actors in Configuration 3 will exchange more frequently than actors in Configuration 1, and actors in Configuration 4 will exchange more frequently than actors in Configuration 2. Second, actors in power-imbalanced dyads exchange less frequently than actors in power-balanced dyads. Thus, actors in Configuration 1 will exchange more frequently than actors in Configuration 2, and actors in Configuration 3 will exchange more frequently than actors in Configuration 4. Third, the negative effect of an increase in relative power on the frequency of exchange will be much higher for dyads with high total power than for those with low total power. Thus, the difference
Figure 2. Relative Power and Total Power: Exchange Frequency and Expected Surplus
High total power (1)Low total power (.5)
Configuration 1 Configuration 3
Rel
ativ
e po
wer
ba
lanc
ed (1
)
8080 80Freq=.5
Expected Surplus = 40
i j↔ → ↔
120.95
60 60Freq
Expected Surplus = 114
i j=↔ → ↔
Configuration 2 Configuration 4
Rel
ativ
e po
wer
im
bala
nced
(1.5
)
80
.396 64
Freq
Expected Surplus = 24
i j=↔ → ↔ 120.6
72 48Freq
Expected Surplus = 72
i j=↔ → ↔
Power and Profi t • 1017
in the frequency of exchange between Configuration 4 and Configuration 3 is greater than the difference in the frequency of exchange between Configuration 2 and Configuration 1.
Expected Surplus
The differences in the frequency of exchange across the four different conditions have important implications for the expected value of surplus that the actors realize from the exchange. Consider, for example, a power-balanced and a power-imbalanced dyad with the same total power. If actors in the unequal-power dyad are less likely to exchange with each other, the expected surplus in the dyad will be lower than in the power-balanced dyad. Thus, even though the potential to obtain surplus from the exchange is the same in both dyads, the expected surplus will be different due to the different frequencies with which the actors exchange. For example, in Configuration 1 in Figure 2, where the surplus is 80 units of profit, and the actors exchange with a hypothetical frequency of .5, the expected surplus is 40. In Configuration 2, where actors also obtain 80 units of profit over and above their outside options for every completed exchange, but exchange with a hypothetical frequency of 0.3, the expected surplus is only 24. The change in relative power has, therefore, decreased the expected surplus by 16.
Furthermore, the magnitude of the difference in expected surplus between a power-balanced and power-imbalanced dyad increases with total power. This is a direct consequence of our assertion that an increase in relative power under conditions of high total power should lead to a greater decrease in the frequency of exchange than under conditions of low total power. For example, in Configuration 3, actors obtain 120 units of surplus for every completed exchange and exchange with frequency 0.95, so the expected surplus is 114. In Configuration 4, where actors exchange with frequency 0.6, the expected surplus is 72. In this case, the change in relative power has decreased the expected surplus by 42. This decline in expected surplus is much larger than the decline that would occur under conditions of low total power. Thus,
Hypothesis 1: In an exchange dyad, an increase in relative power leads to a greater reduction in the magnitude of expected surplus under conditions of high total power than under conditions of low total power.
Surplus Distribution
The expected surplus from the exchange is the amount that actors are likely to obtain jointly over and above the sum of the outside options. To determine how different levels of relative and total power affect actors’ total rewards, we need to examine how this surplus is divided between the exchange partners. Sociological research has provided a number of theories that predict the allocation of exchange surplus. The most prominent among these are equidependence theory (Cook and Yamagishi 1992) and exchange resistance theory (Skvoretz and Willer 1993; Lovaglia, Skvoretz, Willer and Markovsky 1995). Both trace their roots
1018 • Social Forces Volume 85, Number 2 • December 2006
to equiresistance theory (Willer 1981; Heckathorn 1983), which assumes that negotiating actors have profit expectations, termed best hope outcomes. Actors will never resist exchanges in which they obtain their best hope outcome. They will be increasingly resistant to lower profits from the exchange, with the value of the next best alternative exchange moderating that resistance. The theory predicts that actors will divide the surplus at the point where they are equally resistant to the exchange.
Beyond these similarities, equidependence theory and exchange resistance theory make different assumptions on how best hope outcomes are determined, which in turn leads them to make different predictions regarding surplus allocation. Equidependence theory (Cook and Yamagishi 1992) assumes that both actors’ best hope outcomes are always equal. Given this assumption, the theory predicts that, in exchanging with each other, the actors always get the value of their outside option and then split the surplus in half, independently of their relative power. In contrast, exchange resistance theory suggests that actors’ best hopes are related to the dyad’s power configuration (Skvoretz and Willer 1993; Lovaglia, Skvoretz, Willer and Markovsky 1995). Underlying this claim is an argument that the experience of exclusion is likely to reduce the less powerful actor’s best hope, because “the only course of action sure to get excluded actors ‘back in the game’ is raising their offers in hopes of providing partners with their best offers.” (Thye, Lovaglia and Markovsky 1997:1036) Consequently, the less powerful actor is more willing to offer the more powerful actor a greater share of the surplus. The existing evidence supports the prediction of exchange resistance theory (Skvoretz and Willer 1993), while equidependence theory has received only limited empirical support. If we follow the predictions of exchange resistance theory, then actors should split the exchange surplus equally, when relative power in the dyad is balanced. However, in power-imbalanced dyads, the less powerful actor should develop lower aspirations with regard to surplus distribution, which would allow the more powerful actor to receive a greater share of the exchange surplus.1
Total power, unlike relative power, does not have a direct effect on the distribution of rewards. However, as implied by our earlier argument, total power reduces the extent to which relative power leads to unequal rewards in the dyad. This is because total power allows the less powerful actor to withhold the exchange to counteract the claims of the more powerful actor. Under conditions of low total power, such a threat is unlikely to have an effect. However, when total power is high, the less powerful actor’s threat to withhold the exchange is more likely to be effective, because a failure to exchange would be costly to the power-advantaged actor. Because the less powerful actor can now impose significant costs on the more powerful actor, the less powerful actor does not scale back its best-hope outcome. Thus, if the actors manage to come to an agreement, the more powerful actor will not receive as great a proportion of the rewards from the exchange under conditions of high total power as he would under conditions of low total power. Hence,
Hypothesis 2: In an exchange dyad, an increase in relative power yields a smaller increase in the share of expected surplus for the more powerful actor under conditions of high total power than under conditions of low total power.
Power and Profi t • 1019
When More Power Makes Actors Worse Off
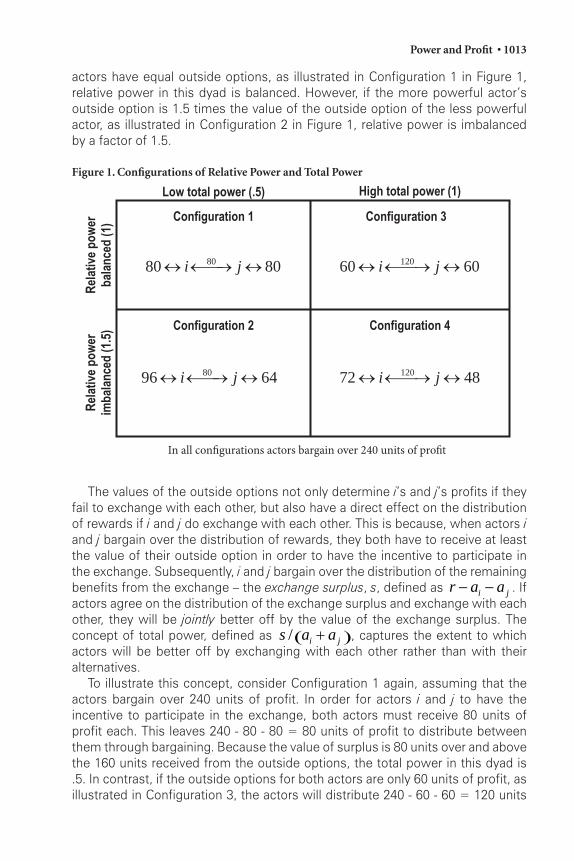
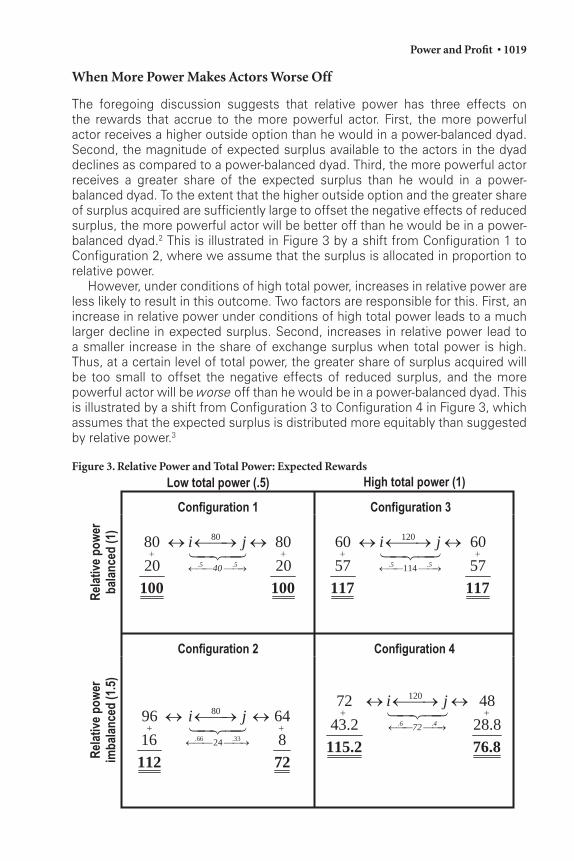
The foregoing discussion suggests that relative power has three effects on the rewards that accrue to the more powerful actor. First, the more powerful actor receives a higher outside option than he would in a power-balanced dyad. Second, the magnitude of expected surplus available to the actors in the dyad declines as compared to a power-balanced dyad. Third, the more powerful actor receives a greater share of the expected surplus than he would in a power-balanced dyad. To the extent that the higher outside option and the greater share of surplus acquired are sufficiently large to offset the negative effects of reduced surplus, the more powerful actor will be better off than he would be in a power-balanced dyad.2 This is illustrated in Figure 3 by a shift from Configuration 1 to Configuration 2, where we assume that the surplus is allocated in proportion to relative power.
However, under conditions of high total power, increases in relative power are less likely to result in this outcome. Two factors are responsible for this. First, an increase in relative power under conditions of high total power leads to a much larger decline in expected surplus. Second, increases in relative power lead to a smaller increase in the share of exchange surplus when total power is high. Thus, at a certain level of total power, the greater share of surplus acquired will be too small to offset the negative effects of reduced surplus, and the more powerful actor will be worse off than he would be in a power-balanced dyad. This is illustrated by a shift from Configuration 3 to Configuration 4 in Figure 3, which assumes that the expected surplus is distributed more equitably than suggested by relative power.3
Figure 3. Relative Power and Total Power: Expected Rewards
Low total power (.5) High total power (1)
Configuration 1 Configuration 3
Rel
ativ
e po
wer
ba
lanc
ed (1
)
8080 80
20 20.5 .5
40
i j
100 100
+ +
→
↔ → ↔
120
114
60 60
57 57.5 .5
i j
117 117
+ +
→
↔ → ↔
Configuration 2 Configuration 4
Rel
ativ
e po
wer
im
bala
nced
(1.5
)
.66 .33
80
24
96 64
16 8
i j+ +
→
↔ → ↔
112 72
12072 48
43.2 28.8.6 .4
72
i j
115.2 76.8
+ +
→
↔ → ↔
1020 • Social Forces Volume 85, Number 2 • December 2006
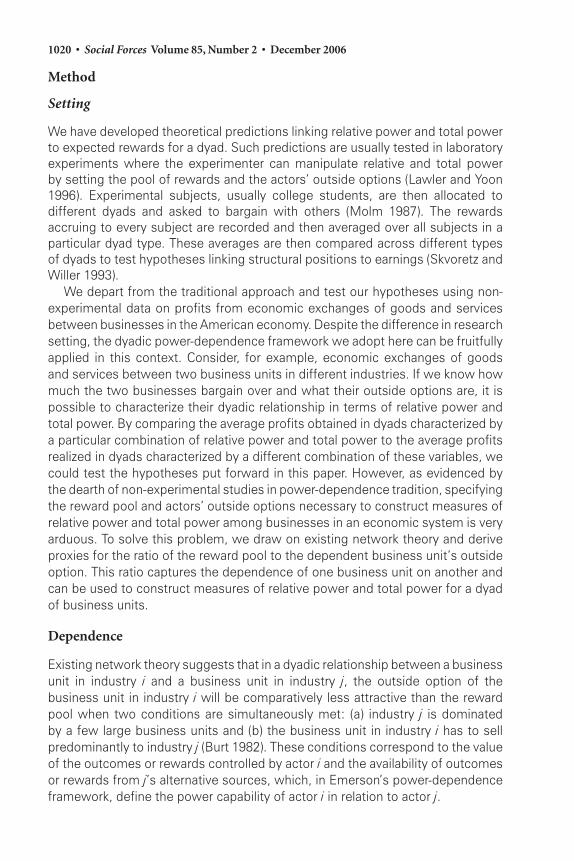
Method
Setting
We have developed theoretical predictions linking relative power and total power to expected rewards for a dyad. Such predictions are usually tested in laboratory experiments where the experimenter can manipulate relative and total power by setting the pool of rewards and the actors’ outside options (Lawler and Yoon 1996). Experimental subjects, usually college students, are then allocated to different dyads and asked to bargain with others (Molm 1987). The rewards accruing to every subject are recorded and then averaged over all subjects in a particular dyad type. These averages are then compared across different types of dyads to test hypotheses linking structural positions to earnings (Skvoretz and Willer 1993).
We depart from the traditional approach and test our hypotheses using non-experimental data on profits from economic exchanges of goods and services between businesses in the American economy. Despite the difference in research setting, the dyadic power-dependence framework we adopt here can be fruitfully applied in this context. Consider, for example, economic exchanges of goods and services between two business units in different industries. If we know how much the two businesses bargain over and what their outside options are, it is possible to characterize their dyadic relationship in terms of relative power and total power. By comparing the average profits obtained in dyads characterized by a particular combination of relative power and total power to the average profits realized in dyads characterized by a different combination of these variables, we could test the hypotheses put forward in this paper. However, as evidenced by the dearth of non-experimental studies in power-dependence tradition, specifying the reward pool and actors’ outside options necessary to construct measures of relative power and total power among businesses in an economic system is very arduous. To solve this problem, we draw on existing network theory and derive proxies for the ratio of the reward pool to the dependent business unit’s outside option. This ratio captures the dependence of one business unit on another and can be used to construct measures of relative power and total power for a dyad of business units.
Dependence
Existing network theory suggests that in a dyadic relationship between a business unit in industry i and a business unit in industry j, the outside option of the business unit in industry i will be comparatively less attractive than the reward pool when two conditions are simultaneously met: (a) industry j is dominated by a few large business units and (b) the business unit in industry i has to sell predominantly to industry j (Burt 1982). These conditions correspond to the value of the outcomes or rewards controlled by actor i and the availability of outcomes or rewards from j’s alternative sources, which, in Emerson’s power-dependence framework, define the power capability of actor i in relation to actor j.
Power and Profi t • 1021
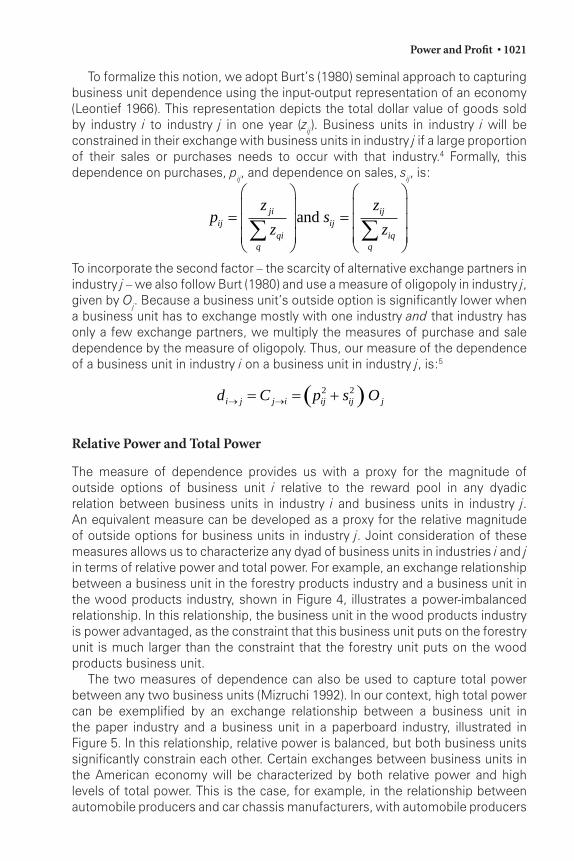
To formalize this notion, we adopt Burt’s (1980) seminal approach to capturing business unit dependence using the input-output representation of an economy (Leontief 1966). This representation depicts the total dollar value of goods sold by industry i to industry j in one year (zij). Business units in industry i will be constrained in their exchange with business units in industry j if a large proportion of their sales or purchases needs to occur with that industry.4 Formally, this dependence on purchases, pij, and dependence on sales, sij, is:
pz
zs
z
zijji
qiq
ijij
iqq
=⎛
⎝
⎜⎜⎜
⎞
⎠
⎟⎟⎟
=⎛
⎝
⎜⎜⎜
⎞
⎠
⎟⎟⎟∑ ∑
and
To incorporate the second factor – the scarcity of alternative exchange partners in industry j – we also follow Burt (1980) and use a measure of oligopoly in industry j, given by Oj. Because a business unit’s outside option is significantly lower when a business unit has to exchange mostly with one industry and that industry has only a few exchange partners, we multiply the measures of purchase and sale dependence by the measure of oligopoly. Thus, our measure of the dependence of a business unit in industry i on a business unit in industry j, is:5
( )2 2 i j j i ij ij jd C p s O→ →= = +
Relative Power and Total Power
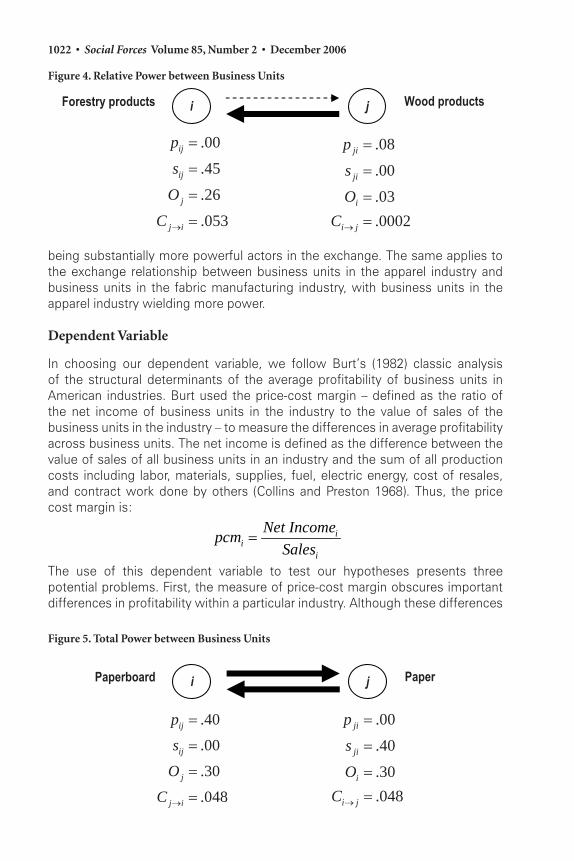
The measure of dependence provides us with a proxy for the magnitude of outside options of business unit i relative to the reward pool in any dyadic relation between business units in industry i and business units in industry j. An equivalent measure can be developed as a proxy for the relative magnitude of outside options for business units in industry j. Joint consideration of these measures allows us to characterize any dyad of business units in industries i and j in terms of relative power and total power. For example, an exchange relationship between a business unit in the forestry products industry and a business unit in the wood products industry, shown in Figure 4, illustrates a power-imbalanced relationship. In this relationship, the business unit in the wood products industry is power advantaged, as the constraint that this business unit puts on the forestry unit is much larger than the constraint that the forestry unit puts on the wood products business unit.
The two measures of dependence can also be used to capture total power between any two business units (Mizruchi 1992). In our context, high total power can be exemplified by an exchange relationship between a business unit in the paper industry and a business unit in a paperboard industry, illustrated in Figure 5. In this relationship, relative power is balanced, but both business units significantly constrain each other. Certain exchanges between business units in the American economy will be characterized by both relative power and high levels of total power. This is the case, for example, in the relationship between automobile producers and car chassis manufacturers, with automobile producers
1022 • Social Forces Volume 85, Number 2 • December 2006
being substantially more powerful actors in the exchange. The same applies to the exchange relationship between business units in the apparel industry and business units in the fabric manufacturing industry, with business units in the apparel industry wielding more power.
Dependent Variable
In choosing our dependent variable, we follow Burt’s (1982) classic analysis of the structural determinants of the average profitability of business units in American industries. Burt used the price-cost margin – defined as the ratio of the net income of business units in the industry to the value of sales of the business units in the industry – to measure the differences in average profitability across business units. The net income is defined as the difference between the value of sales of all business units in an industry and the sum of all production costs including labor, materials, supplies, fuel, electric energy, cost of resales, and contract work done by others (Collins and Preston 1968). Thus, the price cost margin is:
= i
ii
Net Incomepcm
SalesThe use of this dependent variable to test our hypotheses presents three potential problems. First, the measure of price-cost margin obscures important differences in profitability within a particular industry. Although these differences
Figure 4. Relative Power between Business Units
.08
.00
.03
.0002
ji
ji
i
i j
p
s
O
C →
=
=
==
.00
.45
.26
.053
ij
ij
j
j i
p
s
O
C →
=
=
=
=
Forestry products j i Wood products
Figure 5. Total Power between Business Units
Paperboard j i Paper
.40
.00
.30
.048
ij
ij
j
j i
p
s
O
C →
=
=
=
=
.00
.40
.30
.048
ji
ji
i
i j
p
s
O
C →
=
=
==
Power and Profi t • 1023
are interesting, we cannot shed light on them as our measures of dependence capture the minimal level of dependence common to all business units in the industry. Consequently, the focus on the average industry price-cost margin is more appropriate. This approach is also consistent with previous studies that have tested power dependence theories in the lab. These studies usually assign subjects to a number of dyads characterized by the same levels of relative power and total power. Subsequently, they examine rewards obtained by the actors averaged across all the dyads of the same characteristics and ignoring between-dyad differences. In our case, all dyads of business units in two different industries are characterized by the same levels of relative power and total power. Much like the lab studies, we then examine rewards obtained by the business units averaged across all the dyads of the same characteristics and ignoring between-dyad differences.
Second, the price-cost margin does not capture the average profits of business units in industry i realized in exchanges with business units in industry j. Instead, the measure captures the weighted average of profits that business units in industry i realized in exchanges with all industries with which industry i exchanges. The weights are given by the percentage of inputs and outputs exchanged between business units in industry i and every other industry. Consequently, there is a mismatch between the dependent variable (defined at the level of business units in a particular industry) and the measures of relative power and total power (defined at the level of business units in two industries). Prior research has addressed this problem by adding the dyadic dependence scores across all relations in which an actor is involved to derive a summary measure for that actor which can then be compared to the profitability measure (Burt 1982). Following the same approach, we add the dyadic relative power and total power scores across all industries with which business units in industry i exchange to construct a measure of relative power and total power for business units in industry i.
However, this approach ignores hierarchy (Burt 1992:70-71): the distribution of relative power and total power across the dyadic relationships. Hierarchy implies that a business unit facing, say, a total power of 0.2 in two separate transactions is assumed to experience the same effect of total power as a business unit facing total power of 0.4 in a single transaction. Although we cannot directly test this assumption, we test it indirectly with analyses of a sub-sample of industries in which business units face most of their relative power or total power in one or two exchanges. In these cases, the measures of relative power and total power approximate dyadic measures. Thus, the observed profit rates can be more clearly attributed to specific dyadic exchanges. If the results from the analysis using the restricted sample mirror those from the entire sample, we can be more confident that the use of the weighted average of profits of business units in industry i realized in exchanges with all industries with which industry i exchanges does not pose significant problems.
The final issue arises because our dependent variable cannot distinguish directly between changes in the expected surplus and changes in the proportion of that surplus that accrues to each actor. Consequently, we cannot examine
1024 • Social Forces Volume 85, Number 2 • December 2006
directly whether dyadic exchange frequency and surplus allocation change with relative power and total power as suggested by our hypotheses. However, because exchange frequencies and surplus allocations manifest themselves directly in profit rates, it is possible to recover these relationships using an econometric model which uses only profit data as the dependent variable. To do so, we rely on our earlier discussion suggesting that an increase in relative power has two effects: (a) it reduces the frequency of exchange between actors i and j and (b) it allows the more powerful actor to obtain a greater share of the benefits. Reducing exchange frequency affects both actors in the same way, by reducing the amount of surplus available from the exchange. Thus, starting from the baseline condition in which both actors are equally powerful and receive the same amount of surplus, a reduction in expected surplus will reduce both actors’ surplus equally. On the other hand, the more powerful actor obtains a greater share of surplus in the exchanges that actually occur. Here, the gains of the more powerful actor are exactly the losses of the less powerful actor. 6
To capture the changes in exchange surplus, we use a power imbalance variable, defined as the absolute value of relative power. As the value of this variable is the same for both actors in a dyad, regardless of who holds the power in the relationship, the measure of power imbalance is ideally suited to capture the extent of the identical losses of exchange surplus of both actors. On the other hand, an increase in relative power imposes symmetrical, but opposite effects on the actors’ abilities to appropriate the exchange surplus. Thus, the relative power variable captures the differential ability to capture surplus.
To test our two hypotheses, we interact each of the two variables, power imbalance and relative power, with total power. Thus, the final model we estimate is:
π β β ββ
i i i i= + + ++
1 2 3
4
Relative Power Total Power Power Imbalance
PPower Imbalance Total Power Relative Power Total Powi i i* *+ β5 eeri
In Hypothesis 1, we predict that the presence of power inequalities under conditions of high total power leads to increasingly larger reductions in expected surplus. Thus, we expect that an increase in power imbalance under conditions of high total power will have a greater negative effect on price-cost margins (�4 < 0). In Hypothesis 2, we predict that, under conditions of high total power, the effect of relative power on the power-holder’s ability to appropriate the exchange surplus will be weaker. Consequently, we expect that an increase in relative power under conditions of high total power will have a smaller effect on profit (�5 � 0).
Data and Variables
The data for the analysis come from the Survey of Current Business published by the U.S. Department of Commerce. We construct the dependent variable, price-cost margin, for 77 industries in 1977, 1982, 1987 and 1992. To ensure the normality of the dependent variable, we use the log of the price-cost margin in our regressions (also see Burt 1982).7
To construct the independent variables, we convert the total dollar values of flows between industries into proportions of sales and purchases of all dyads of
Power and Profi t • 1025
industries. We use these proportions, together with the four-firm concentration ratios in industry j, as the measure of Oj to construct Burt’s measure of the dependence of business units in industry i on business units in industry j. The concentration data are not published for input-output table markets and they are not available from a single source. To ensure consistency with Burt’s (1982) analyses on constraint relations, we use the concentration data compiled by Burt.
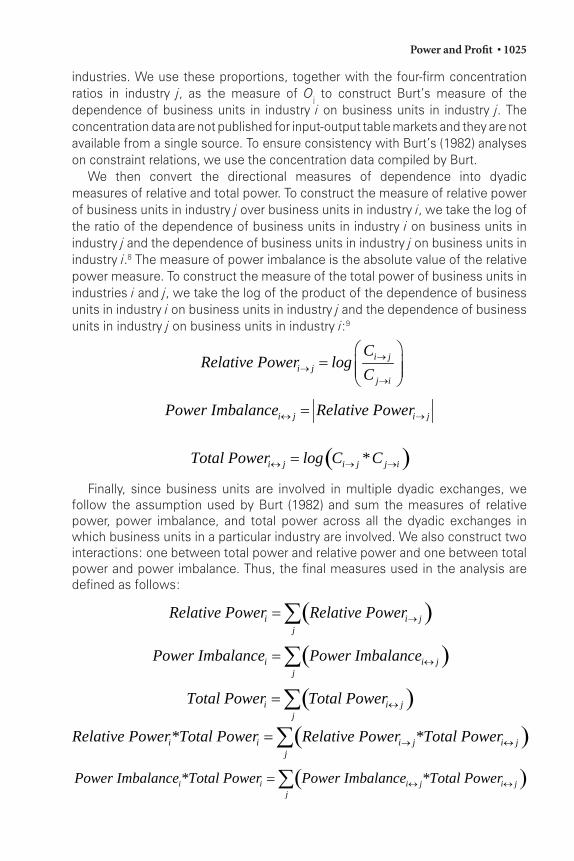
We then convert the directional measures of dependence into dyadic measures of relative and total power. To construct the measure of relative power of business units in industry j over business units in industry i, we take the log of the ratio of the dependence of business units in industry i on business units in industry j and the dependence of business units in industry j on business units in industry i.8 The measure of power imbalance is the absolute value of the relative power measure. To construct the measure of the total power of business units in industries i and j, we take the log of the product of the dependence of business units in industry i on business units in industry j and the dependence of business units in industry j on business units in industry i:9
i ji j
j i
CRelative Power log
C→
→→
⎛ ⎞= ⎜ ⎟⎜ ⎟
⎝ ⎠
i j i jPower Imbalance Relative Power↔ →=
( )i j i j j iTotal Power log C * C↔ → →=
Finally, since business units are involved in multiple dyadic exchanges, we follow the assumption used by Burt (1982) and sum the measures of relative power, power imbalance, and total power across all the dyadic exchanges in which business units in a particular industry are involved. We also construct two interactions: one between total power and relative power and one between total power and power imbalance. Thus, the final measures used in the analysis are defined as follows:
( )i i jj
Relative Power Relative Power→=∑
( )i i jj
Power Imbalance Power Imbalance ↔=∑
( )i i jj
Total Power Total Power↔=∑( )i i i j i j
j
Relative Power*Total Power Relative Power *Total Power→ ↔=∑
( )i i i j i jj
Power Imbalance *Total Power Power Imbalance *Total Power↔ ↔=∑
1026 • Social Forces Volume 85, Number 2 • December 2006
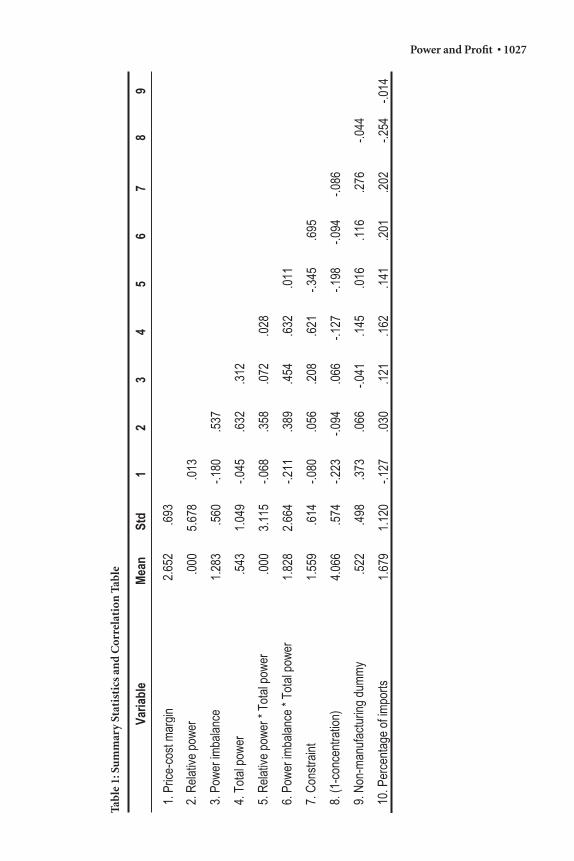
Consistent with Burt (1980, 1982, 1992), we also introduce three control variables: a dummy variable for non-manufacturing industries, the concentration ratio in industry i, and the percentage of imports in the industry’s total sales. Table 1 provides summary statistics and correlations for all variables used in the models.
Results
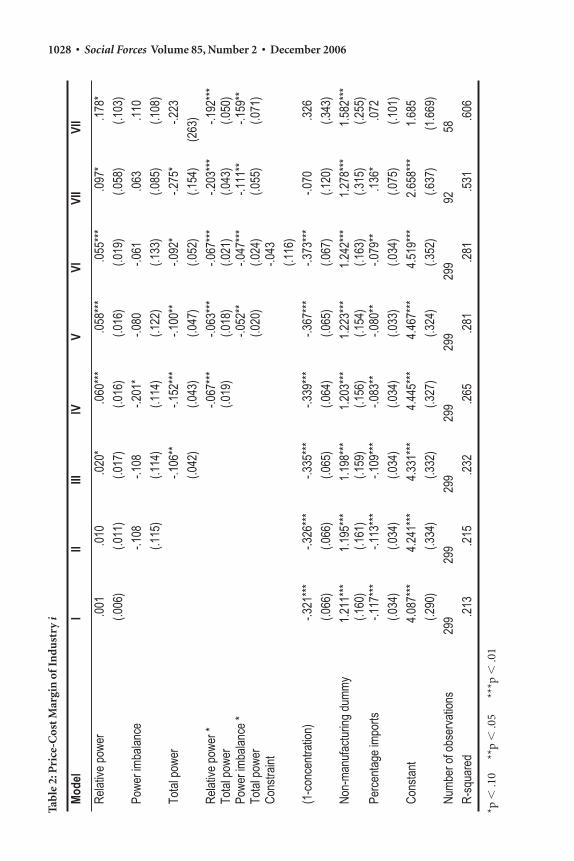
Table 2 summarizes the findings of regressions with robust standard errors with industry i’s price-cost margin as the dependent variable. Model I is the baseline model with three control variables and relative power. Consistent with Burt’s results (Burt 1982), the control variables are statistically significant and in the expected direction. Industries with a low concentration ratio suffer lower profits, non-manufacturing industries enjoy higher profits, and industries in which imports make up a significant part of the total industry output have lower profits. The estimated coefficient of relative power, while in the expected direction, is not statistically significant. Although this may seem surprising in the light of our predictions, our theory predicts that relative power will only contribute to rewards if accompanied by low total power. In Model II, we introduce the power imbalance measure, which is also insignificant. Model III includes the total power variable; the coefficient estimate is negative and significant. Once total power is introduced, the coefficient of relative power increases and becomes significant at the 10 percent level.
In Model IV, we introduce the interaction between relative power and total power. The coefficient estimate is negative and is significant at the 1 percent level, consistent with Hypothesis 2. It is also noteworthy that the introduction of this interaction substantially increases the size of the estimate coefficient for relative power and makes it statistically significant at the 1 percent level. Such an increase in coefficient size and statistical significance yields further credence to the suggestion that the effect of relative power will vary depending on the level of total power. As indicated by the main effect of relative power in Model IV, when total power is zero, the relationship between relative power and an actor’s ability to appropriate exchange surplus is positive. Yet, as total power increases, this relationship is significantly attenuated, as indicated by the negative sign on the interaction term between relative power and total power in Model IV. In Model V we introduce the interaction between power imbalance and total power. The coefficient is negative and statistically significant. This is consistent with Hypothesis 1, according to which the presence of power imbalance under conditions of high total power reduces the benefits accruing to both actors.
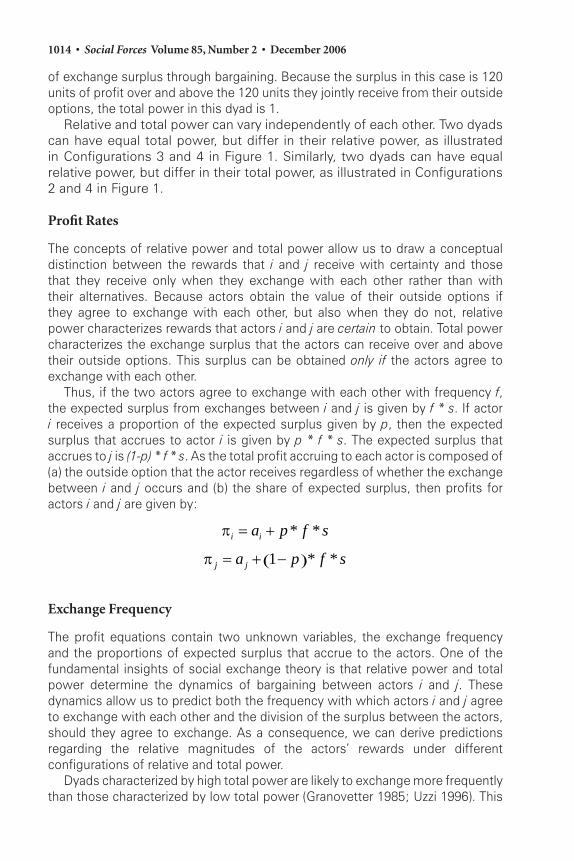
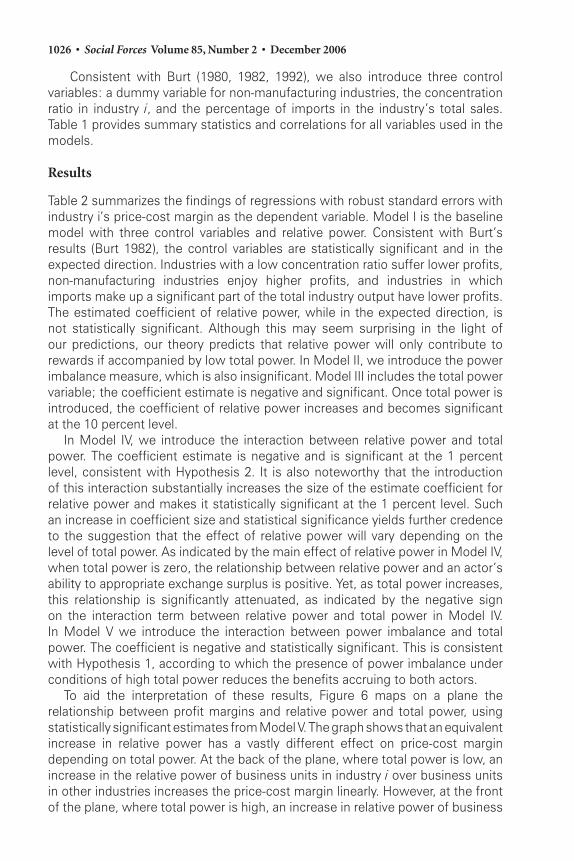
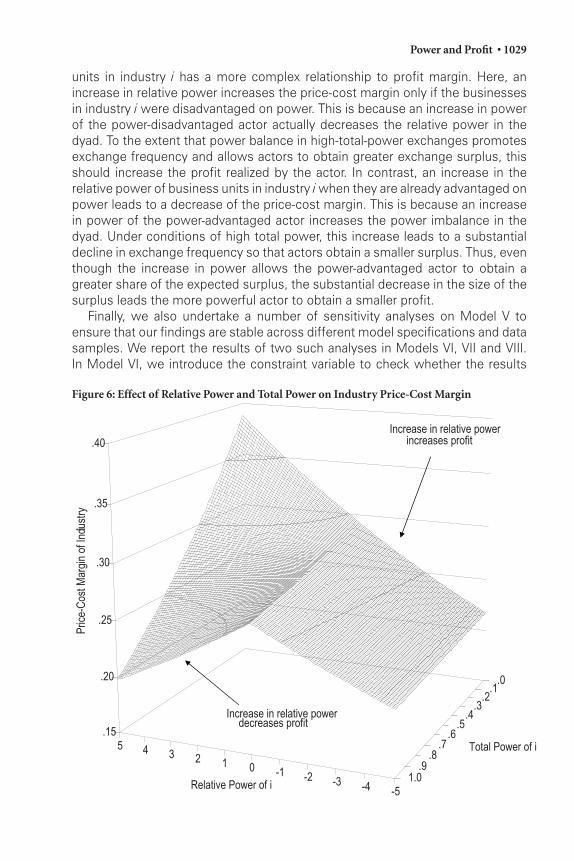
To aid the interpretation of these results, Figure 6 maps on a plane the relationship between profit margins and relative power and total power, using statistically significant estimates from Model V. The graph shows that an equivalent increase in relative power has a vastly different effect on price-cost margin depending on total power. At the back of the plane, where total power is low, an increase in the relative power of business units in industry i over business units in other industries increases the price-cost margin linearly. However, at the front of the plane, where total power is high, an increase in relative power of business
Power and Profi t • 1027
Tab
le 1
: Su
mm
ary
Stat
isti
cs a
nd
Cor
rela
tion
Tab
le
Varia
ble
Mea
nSt
d1
23
45
67
89
1. P
rice-
cost
mar
gin
2.65
2 .6
93
2. R
elat
ive
pow
er
.000
5.
678
.013
3. P
ower
imba
lanc
e 1.
283
.560
-.1
80
.537
4. T
otal
pow
er
.543
1.
049
-.045
.6
32
.312
5. R
elat
ive
pow
er *
Tota
l pow
er
.000
3.
115
-.068
.3
58
.072
.0
28
6. P
ower
imba
lanc
e * T
otal
pow
er
1.82
8 2.
664
-.211
.3
89
.454
.6
32
.011
7. C
onst
rain
t 1.
559
.614
-.0
80
.056
.2
08
.621
-.3
45
.695
8. (1
-con
cent
ratio
n)
4.06
6 .5
74
-.223
-.0
94
.066
-.1
27
-.198
-.0
94
-.086
9. N
on-m
anuf
actu
ring
dum
my
.522
.4
98
.373
.0
66
-.041
.1
45
.016
.1
16
.276
-.0
44
10. P
erce
ntag
e of
impo
rts
1.67
9 1.
120
-.127
.0
30
.121
.1
62
.141
.2
01
.202
-.2
54
-.014
1028 • Social Forces Volume 85, Number 2 • December 2006Ta
ble
2: P
rice
-Cos
t Mar
gin
of
Ind
ust
ry i
Mod
elI
IIIII
IV
VVI
VII
VII
Rel
ativ
e po
wer
.0
01
.010
.0
20*
.060
***
.058
***
.055
***
.097
* .1
78*
(.0
06)
(.011
) (.0
17)
(.016
) (.0
16)
(.019
) (.0
58)
(.103
)
Pow
er im
bala
nce
-.1
08
-.108
-.2
01*
-.080
-.0
61
.063
.1
10
(.115
) (.1
14)
(.114
) (.1
22)
(.133
) (.0
85)
(.108
)
Tota
l pow
er
-.106
**
-.152
***
-.100
**
-.092
* -.2
75*
-.223
(.0
42)
(.043
) (.0
47)
(.052
) (.1
54)
(263
)
Rel
ativ
e po
wer
*
Tota
l pow
er
-.0
67**
* (.0
19)
-.063
***
(.018
) -.0
67**
* (.0
21)
-.203
***
(.043
) -.1
92**
* (.0
50)
Pow
er im
bala
nce
* To
tal p
ower
-.0
52**
(.0
20)
-.047
***
(.024
) -.1
11**
(.0
55)
-.159
**
(.071
) C
onst
rain
t
-.043
(.116
)
(1-c
once
ntra
tion)
-.3
21**
* -.3
26**
* -.3
35**
* -.3
39**
* -.3
67**
* -.3
73**
* -.0
70
.326
(.0
66)
(.066
) (.0
65)
(.064
) (.0
65)
(.067
) (.1
20)
(.343
)
Non
-man
ufac
turin
g du
mm
y 1.
211*
**
(.160
) 1.
195*
**
(.161
) 1.
198*
**
(.159
) 1.
203*
**
(.156
) 1.
223*
**
(.154
) 1.
242*
**
(.163
) 1.
278*
**
(.315
) 1.
582*
**
(.255
) Pe
rcen
tage
impo
rts
-.117
***
-.113
***
-.109
***
-.083
**
-.080
**
-.079
**
.136
* .0
72
(.0
34)
(.034
) (.0
34)
(.034
) (.0
33)
(.034
) (.0
75)
(.101
)
Con
stan
t 4.
087*
**
4.24
1***
4.
331*
**
4.44
5***
4.
467*
**
4.51
9***
2.
658*
**
1.68
5
(.2
90)
(.334
) (.3
32)
(.327
) (.3
24)
(.352
) (.6
37)
(1.6
69)
Num
ber o
f obs
erva
tions
29
9 29
9 29
9 29
9 29
9 29
9 92
58
R-s
quar
ed
.213
.2
15
.232
.2
65
.281
.2
81
.531
.6
06
��
�*p
� .1
0
**p
� .0
5
***
p �
.01
Power and Profi t • 1029
units in industry i has a more complex relationship to profit margin. Here, an increase in relative power increases the price-cost margin only if the businesses in industry i were disadvantaged on power. This is because an increase in power of the power-disadvantaged actor actually decreases the relative power in the dyad. To the extent that power balance in high-total-power exchanges promotes exchange frequency and allows actors to obtain greater exchange surplus, this should increase the profit realized by the actor. In contrast, an increase in the relative power of business units in industry i when they are already advantaged on power leads to a decrease of the price-cost margin. This is because an increase in power of the power-advantaged actor increases the power imbalance in the dyad. Under conditions of high total power, this increase leads to a substantial decline in exchange frequency so that actors obtain a smaller surplus. Thus, even though the increase in power allows the power-advantaged actor to obtain a greater share of the expected surplus, the substantial decrease in the size of the surplus leads the more powerful actor to obtain a smaller profit.
Finally, we also undertake a number of sensitivity analyses on Model V to ensure that our findings are stable across different model specifications and data samples. We report the results of two such analyses in Models VI, VII and VIII. In Model VI, we introduce the constraint variable to check whether the results
Figure 6: Effect of Relative Power and Total Power on Industry Price-Cost Margin
.0.1
.2.3
.4.5
.6.7
.8.9
1.0
5 4 3 2 1 0 -1 -2 -3 -4 -5
.15
.20
.25
.30
.35
.40
Total Power of i
Relative Power of i
Pric
e-C
ostM
argi
nof
Indu
stry
i
Increase in relative powerincreases profit
Increase in relative powerdecreases profit
1030 • Social Forces Volume 85, Number 2 • December 2006
presented in Model V are stable with respect to earlier network models that sought to explain differences in industrial profitability (Burt 1983). The constraint variable is insignificant and no parameter estimates from Model V are materially changed. In Model VII, we restrict our sample to industries in which the largest power imbalance in any dyadic relationship in which business units in industry i are engaged makes up at least 50 percent of the summarized power imbalance score for business units in industry i. The objective of this exercise is to make sure that the results of Model V are not an artifact of summing across a large number of dyadic transactions. The restriction severely reduces the sample size down to 92. However, it does not affect the main results. The fact that these results mirror those from the unrestricted sample makes us more confident that the findings presented in Model V are not an artifact of summing our independent variables across numerous dyadic transactions. In Model VIII, we repeat the exercise but restrict our sample to industries in which the two largest dyadic power imbalance scores make up 90 percent of the summarized power imbalance score. As before, the results are not affected by the sample restriction.10
Discussion
In this paper we proposed a set of conditions under which an increase in relative power decreases the benefits that accrue to the power-advantaged actor in an exchange dyad. Specifically, we hypothesized that as exchange partners grow mutually dependent, increases in relative power progressively reduce the ability to garner exchange benefits, to the point that the more powerful actor’s rewards may actually decrease after a power increase. According to our argument, changes in exchange frequency, expected surplus and surplus distribution are jointly responsible for making the power-advantaged actor worse off after an increase in relative power under conditions of high total power. As for exchange frequency, we built on existing exchange-theoretic research showing that actors in high-total-power dyads exchange more frequently than in low-total-power dyads, while equal-power dyads exchange more frequently than unequal-power dyads (Lawler and Yoon 1993, 1996). Furthermore, we argued that an increase in relative power decreases the frequency of exchange more under conditions of high total power, because fairness concerns complicate the bargaining agenda. The higher failure rate induced by an increase in relative power leads to greater losses of expected surplus under conditions of high total power. As for surplus distribution in successful exchanges, we posited that the power-advantaged actor does not receive as great a proportion of exchange rewards under conditions of high total power when the power-disadvantaged actor can pose a credible enough threat to induce the power-advantaged actor to accept a more equitable allocation of exchange benefits. We proposed two hypotheses from these joint effects. First, we hypothesized that an increase in relative power would lead to a greater reduction in the magnitude of expected surplus under conditions of high total power than under conditions of low total power. Second, we predicted that an increase in relative power gives the power-advantaged actor a smaller increase in the share of surplus under conditions of high total power than under conditions of low total power. A study of price-cost margins of American industries supported these hypotheses.
Power and Profi t • 1031
Our findings indicate that an equivalent increase in relative power has vastly different effects on industry price-cost margins depending on total power, with price-cost margins decreasing when relative power increases occur in the context of high levels of mutual dependence among business units. In addition to the theoretical developments and substantive results presented here, this paper illuminates the benefits of tight integration of exchange theories, which are tested largely in lab settings with network theories that are tested using macro level phenomena (Burt 1983, 1992). Prior analyses of the link between industry performance and dependence did not leverage the exchange-theoretic distinction between relative power and total power. By bringing the analysis of joint configurations of relative and total power to this area of inquiry, this investigation significantly increases the explanatory power of traditional models of inequality among industries in an economic system. This increase in explained variance brings us closer to realizing the potential of the exchange-theoretic framework to illuminate macro-level behavior and outcomes. At the same time, documenting the macro-level manifestation of exchange processes that have traditionally been investigated in the laboratory at the interpersonal level of analysis substantially enhances the generalizability of exchange-theoretic accounts of power and inequality. As an inherently cross-level theory, the power-dependence framework has indeed spurred both micro and macro investigations. However, few studies have offered a direct account of the relevance of micro exchange processes to macro behavior. The results of the present work help position exchange theory and structural sociology to bridge micro and macro levels of analysis and to apply the power-dependence framework across a wide variety of exchange settings.
Despite its contributions, this paper is not without shortcomings that need to be addressed in future research. Testing predictions in the context of transaction patterns in the American economy prevents full control over variables of interest that experimental studies are best suited to provide. Instead of using direct measures of relative power and total power, we utilize proxies. Similarly, we only use an aggregate measure of profit instead of data on individual exchanges, exchange frequencies and surplus allocations. Future research needs to test the extent to which the assumptions made in this study are actually valid.
Future research can also enhance the theoretical model by elaborating on the impact of different forms of power on the allocation of exchange rewards. Lawler and Bacharach (1987) highlighted the distinction between dependence power and coercive power, where coercive power comes from the ability to impose damage on the exchange partner above and beyond the opportunity cost of withdrawing from the exchange. Similarly, a conceptual distinction can be drawn between reward power and punishment power, which are related to an actor’s capacity to produce positive and negative outcomes, respectively (Molm 1997). Because we do not discriminate between these forms of power, we cannot fully account for contexts in which the bases for the exchange relationship are primarily punitive in nature. While one can subsume all forms of power under the same overarching construct, the existing evidence suggests that this approach may oversimplify a rather complex theoretical scenario in which different forms of power are linked to exchange outcomes through distinct mechanisms.
1032 • Social Forces Volume 85, Number 2 • December 2006
Another potentially fruitful line of future research could extend the findings of the present study beyond dyads to networks of exchange relations. Indeed, Friedkin (1995) found that, in Kite networks, unbalanced exchanges lower an actor’s net receipts as the disadvantaged trading partners turn elsewhere for exchange. While Friedkin’s analysis focuses exclusively on configurations of relative power – to the exclusion of total power – and on a very specific network form, its findings are largely consistent with ours and suggest that the ideas we advance in the context of dyads should also be pursued in the context of exchange networks.
Overall, the results of this study challenge the conventional wisdom that greater power yields greater rewards for the power-advantaged actor. The association between power and rewards is strictly contingent on the nature of the relationship linking exchange partners. In highly interdependent relationships, the heavy costs of exchange failures induced by power imbalance will pressure exchange partners to equalize power. This tendency toward balance in mutually dependent relationships may manifest itself as clearly in interpersonal relationships as in inter-organizational ties. In this sense, the results of this study of industry profit point to a general social process: the closer the social bond between two actors, the more power asymmetries will be incongruous to that relationship. Explicit recognition of the interactive effects of mutual dependence and power imbalance enhances exchange theoretic explanations of structural sources of inequality.
Notes
1. While focused primarily on predicting exchange frequency, Friedkin’s (1986, 1995) expected value theory also produces predictions concerning surplus allocation. In contrast with equidependence and exchange resistance theories, which assume that actors are motivated by their best hope outcomes (moderated by the threat of not concluding the exchange), expected value theory assumes that actors develop aspirations depending on ego’s dependency on alter. If ego’s dependency on alter is low, ego’s aspirations are high, and vice versa. This process leads the more powerful actor to appropriate a greater share of the surplus. Thus, even though Friedkin begins with a different assumption regarding the distribution of surplus, the final predictions regarding surplus distribution are directionally consistent with exchange resistance theory.
2. Assuming that the surplus is allocated in proportion to relative power, rather than split equally, makes it more arduous to establish that power imbalance makes actors worse off under conditions of high total power. If the surplus were split equally, it would be sufficient to show that increases in relative power lead to increasingly greater declines in expected surplus under conditions of high total power (H1) to establish our result.
3. It is important to note that a decrease in actors’ rewards following an increase in power imbalance under conditions of high total power (shift from Configuration 3 to 4) does not necessarily imply a decrease the actors’ rewards following an increase in total power under conditions of power imbalance (shift from Configuration 2 to 4).
Power and Profi t • 1033
4. In deriving the measures of dependence between business units, the use of industry-level data is theoretically advantageous over the use of actual data on transactions between these business units, as explained by Casciaro and Piskorski (2005:184)
5. We square pij and sij to ensure consistency with Burt’s (1982) constraint measure. However, our results are equally robust to specifying the measure as ( ) → = +j i ij ij jC p s O
6. For example, consider changes in the actors’ rewards following increases in relative power illustrated by a shift from Configuration 1 to Configuration 2 in Figure 3. First, the increase in relative power increases actor i’s outside option by 16 and decreases the outside option of actor j by the same amount. Second, the increase in relative power reduces the frequency with which actors appropriate the surplus of 80 by 0.2. Thus, both actors forego 16 units of surplus. Since power was originally equal in this relationship, then each of them loses 8 units of surplus. Third, the increase in relative power allows the more powerful actor to obtain 0.16 more of the 24 units of surplus. This amounts to 4 units. Taken together, the more powerful actor gains 16 units, loses 8 units and gains 4 units, which amounts to 12. The less powerful actor loses 16, loses 8 and loses 4, which amounts to 28. Thus, both actors face a symmetric change in profitability due to the loss of expected exchange surplus. However, both actors face opposing changes in profitability due to changes in outside options and share of surplus.
7. There are eight negative observations in the dataset; the log transformation is not possible for these. One strategy to deal with these observations is to add a constant to ensure that there are no negative observations. Unfortunately, such a transformation also results in a skewed dependent variable. Consequently, we examine our models both with and without the eight observations. Although, the results without the eight observations are statistically weaker, we report them here as they provide a more conservative test of the hypotheses.
8. Because the measure of Cj i is bound between 0 and 1, we add 1 to the measure of constraint to ensure that the value of the denominator is always greater than zero (Mizruchi 1992). We experiment with a number of different constants, such as 0.01, to ensure that the results are not an artifact of the selection of the constant, and find no significant differences. For simplicity of exposition, we do not include the constant in the equations in the text.
9. We also experiment with different functional specifications of this variable, such as the log of the geometric mean and the log of the sum of the dependence measures. We obtain similar results, but our results are most robust with the measure described in the text.
10. In an unreported model, we also restrict the sample by excluding all observations for which the value of relative power or total power is above the 75th percentile. This exclusion reduces the sample size by approximately 36 percent and significantly lowers both the range of the two variables and the range of
1034 • Social Forces Volume 85, Number 2 • December 2006
interactions between them. We do this to ensure that outliers in the sample do not drive our estimates of interaction term coefficients. The parameter estimates remain significant and do not change direction, suggesting that the results in Model V are not driven by the outliers in the sample.
References
Bacharach, Samuel B., and Edward J. Lawler. 1981. Bargaining: Power, Tactics and Outcomes. Jossey-Bass.
Burt, Ronald S. 1980. “Autonomy in Social Topology.” American Journal of Sociology 85:892-925.
______. 1982. Toward a Structural Theory of Action: Network Models of Social Structure, Perception, and Action. Academic Press.
______. 1983. Corporate Profits and Cooptation: Networks of Market Constraints and Directorate Ties in the American Economy. Academic Press.
______. 1992. Structural Holes: The Social Structure of Competition. Harvard University Press.
Casciaro, Tiziana, and Mikołaj Jan Piskorski. 2005. “Power Imbalance, Mutual Dependence, and Constraint Absorption: A Closer Look at Resource Dependence Theory.” Administrative Science Quarterly 50:167-99.
Coleman, James S. 1990. Foundations of Social Theory. Harvard University Press.
Collins, Norman R., and Lee E. Preston. 1968. Concentration and Price-Cost Margins in Manufacturing Industries. University of California Press.
Cook, Karen S., Richard M. Emerson and Mary R. Gillmore. 1983. “The Distribution of Power in Exchange Networks: Theory and Experimental Results.” American Journal of Sociology 89:275-305.
Cook, Karen S., and J. M. Whitmeyer. 1992. “Two Approaches to Social-Structure - Exchange Theory and Network Analysis.” Annual Review of Sociology 18:109-27.
Cook, Karen S., and Toshio Yamagishi. 1992. “Power in Exchange Networks: A Power-Dependence Formulation.” Social Networks 14:245-65.
Ebenbach, David H., and Dacher K. Keltner. 1998. “Power, Emotion and Judgmental Accuracy in Social Conflict: Motivating the Cognitive Miser.” Basic and Applied Social Psychology 20:7-21.
Eisenhardt, Kathleen M., and L. J. III Bourgeois. 1999. “Politics of Strategic Decision Making in High-Velocity Environments: Toward a Mid-Range Theory.” Academy of Management Journal 31:737-70.
Power and Profi t • 1035
Emerson, Richard M. 1962. “Power Dependence Relations.” American Sociological Review 27:31-41.
Friedkin, Noah E. 1986. “A Formal Theory of Social Power.” Journal of Mathematical Sociology 12:103-26.
______. 1995. “The Incidence of Exchange Networks.” Social Psychology Quarterly 58:213-21.
Granovetter, Mark. 1985. “Economic Action and Social Structure: A Theory of Embeddedness.” American Journal of Sociology 91:481-510.
Heckathorn, Douglas D. 1983. “Extensions of Power-Dependence Theory: The Concept of Resistance.” Social Forces 61:1206-31.
Hegtvedt, Karen A., and Karen S. Cook. 1987. “The Role of Justice in Conflict Situations.” Pp. 109-36. Advances in Group Processes. Edward J. Lawler and Barry Markovsky, editors. JAI Press.
Lawler, Edward J. 1992. “Power Processes in Bargaining.” The Sociological Quarterly 33:17-34.
Lawler, Edward J., and Samuel B. Bacharach. 1987. “Comparison of Dependence and Punitive Forms of Power.” Social Forces 66:446-62.
Lawler, Edward J., and Jeongkoo Yoon. 1993. “Power and the Emergence of Commitment Behavior in Negotiated Exchange.” American Sociological Review 58:465-81.
______. 1996. “Commitment in Exchange Relations: Test of a Theory of Relational Cohesion.” American Sociological Review 61:89-108.
Leontief, Wassily W. 1966. Input-Output Economics. Oxford University Press.
Lovaglia, Michael J., John Skvoretz, David Willer and Barry Markovsky. 1995. “Negotiated Exchanges in Social Networks.” Social Forces 74:123-55.
Mannix, Elizabeth A. 1993. “Organizations as Resource Dilemmas: The Effects of Power Balance on Coalition Formation in Small Groups.” Organizational Behavior and Human Decision Process 55:1-22.
Mannix, Elizabeth A., and Sally B. White. 1992. “The Effect of Distributive Uncertainty on Coalition Formation in Organizations.” Organizational Behavior and Human Decision Process 51:198-219.
Marsden, Peter V. 1983. “Restricted Access in Networks and Models of Power.” American Journal of Sociology 88:686-717.
McAlister, Leigh, Max H. Bazerman and Peter S. Fader. 1986. “Power and Goal Setting in Channel Negotiations.” Journal of Marketing Research 23:238-63.
1036 • Social Forces Volume 85, Number 2 • December 2006
Mizruchi, Mark S. 1992. The Structure of Corporate Political Action. Harvard University Press.
Molm, Linda D. 1987. “Extending Power Dependence Theory: Power Processes and Negative Outcomes.” Pp. 178-98. Advances in Group Processes. Edward J. Lawler and Barry Markovsky, editors. JAI Press.
______. 1990. “Structure, Action, and Outcomes: The Dynamics of Power in Social Exchange.” American Sociological Review 55:427-47.
______. 1997. Coercive Power in Social Exchange. University of Cambridge Press.
Skvoretz, John, and David Willer. 1993. “Exclusion and Power: A Test of Four Theories of Power in Exchange Networks.” American Sociological Review 58:801-18.
Thye, Shane R., Michael J. Lovaglia and Barry Markovsky. 1997. “Response to Social Exchange and Social Exclusion in Networks.” Social Forces 75:1031-47.
Uzzi, Brian. 1996. “The Sources and Consequences of Embeddedness for the Economic Performance of Organizations: The Network Effect.” American Sociological Review 61:674-98.
Willer, David. 1981. “Quantity and Network Structure.” Pp. 108-27. Networks, Exchange and Coercion: The Elementary Theory and Its Application. David Willer and Bo Anderson, editors. Elsevier.
Yamagishi, Toshio, Mary R. Gillmore and Karen S. Cook. 1988. “Network Connections and the Distribution of Power in Exchange Networks.” American Journal of Sociology 93:833-51.