Embed Size (px)
Citation preview

Molecular Ecology (2010) 19, 2364–2379 doi: 10.1111/j.1365-294X.2010.04638.x
When North and South don’t mix: genetic connectivity ofa recently endangered oceanic cycad, Cycas micronesica,in Guam using EST-microsatellites
ANGELICA CIBRIAN-JARAMILLO,*†– A. C. DALY,† E. BRENNER,‡ R. DESALLE† and
T. E . MARLER§
*The New York Botanical Garden, Genomics Laboratory, Bronx River Parkway at Fordham Road, Bronx, NY 10458, USA,
†American Museum of Natural History, Sackler Institute for Comparative Genomics, Central Park West at 79th Street, New
York, NY 10024, USA, ‡New York University, Department of Biology, 100 Washington Square East, New York, NY 10003,
USA, §CNAS-WPTRC, University of Guam, UOG Station, Mangilao, Guam, 96923 USA, –Present address: Harvard
University, Department of organismic and Evolutionary Biology, 26 Oxford Street, Cambridge, MA 02138, USA
Corresponde
4012; E-mail:
Abstract
Subject to environmental changes and recurrent isolation in the last ca. 250 Ma, cycads are
often described as relicts of a previously common lineage, with populations characterized
by low genetic variation and restricted gene flow. We found that on the island of Guam,
the endemic Cycas micronesica has most of the genetic variation of 14 EST-microsatellites
distributed within each of 18 genetic populations, from 24 original sampling sites. There
were high levels of genetic variation in terms of total number of alleles and private alleles,
and moderate levels of inbreeding. Restricted but ongoing gene flow among populations
within Guam reveals a genetic mosaic, probably more typical of cycads than previously
assumed. Contiguous cycad populations in the north of Guam had higher self-
recruitment rates compared to fragmented populations in the south, with no substantial
connection between them except for one population. Guam’s genetic mosaic may be
explained by the influence of forest continuity, seed size, edaphic differences, and human
transport of cycads. Also important are the extent of synchrony among flushes of
reproductive female seed-bearing sporophylls and restricted pollen movement by an
obligate mutualist and generalist insects. An NADH EST-locus under positive selection
may reflect pressure from edaphic differences across Guam. This and three other loci are
ideal candidates for ecological genomic studies. Given this species’ vulnerability due to
the recent introduction of the cycad aulacaspis scale, we also identify priority populations
for ex situ conservation, and provide a genetic baseline for understanding the effects of
invasive species on cycads in the Western Pacific, and islands in general.
Keywords: cycad, EST-microsatellites, Guam, invasive species, islands, oceanic islands
Received 4 November 2009; revision received 14 March 2010; accepted 26 March 2010
Introduction
Oceanic islands are amongst the most biodiverse and
evolutionary intricate ecosystems (MacArthur & Wilson
2001; Caujape-Castells et al. 2010). They are also more
susceptible than their continental counterparts to
human-induced habitat changes, including the introduc-
nce: Angelica Cibrian-Jaramillo, Tel: +1617 495
tion of invasive species (Frankham 1998; Francisco-Orte-
ga et al. 2000; Parmesan 2006; Reaser et al. 2007;
Hellmann et al. 2008; Kueffer et al. 2009). The island of
Guam is one of the most transformed island ecosys-
tems, mostly due to invasive species (Rogers 1995). In
recent years the introduction of invasive insects in
Guam have impacted the island’s flora and triggered a
cascade of invasive species interactions (Marler et al.
2006). In particular, the introduction of the cycad aul-
acaspis scale (Aulacaspis yasumatsui Takagi; Hemiptera:
� 2010 Blackwell Publishing Ltd

POPULATION GENETI CS OF CYCAS MICRONESICA 2365
Diaspididae) into Guam in 2003 has caused extensive
damage to natural populations of the cycad C. microne-
sica K.D. Hill (Cycadaceae), one of the few remaining
endemic plants in Guam (Marler & Muniappan 2006).
Here, we describe the extent of standing genetic varia-
tion and gene flow in natural populations of C. microne-
sica and their interplay with putative historical and
contemporary geographic barriers in this island.
The genus Cycas is one of the oldest living lineages of
gymnosperms (ca. 250 my) with ca. 90 species distrib-
uted from the Western Pacific to coastal regions of
Madagascar (Hill 2004; Hill et al. 2004). Phylogeneti-
cally sister to all other cycads (Nixon et al. 1994), Cycas
has provided critical insights into the evolution of basic
developmental and functional traits in early seed plants
(Norstog & Nicholls 1997). C. micronesica is a plant up
to 12 m tall, with megasporophylls not gathered in
cones, usually spine-free petiole, and one of the nine
Cycas species with a seed flotation layer that allows
them to disperse and survive through ocean currents
(Dehgan 1983; Hill 1994; Hill 2004; Hill et al. 2004). Its
name is derived from the endemic occurrence of this
species in Rota, Guam, Yap and Palau in Micronesia
(Hill 2004; Hill et al. 2004).
Since its introduction into Guam 2003, the cycad aul-
acaspis scale has spread throughout all of Guam’s for-
ests and recently into the nearby islands of Rota, Yap
and Palau, threatening C. micronesica regionally and all
other Pacific Cycas species (Marler & Muniappan 2006).
In a few months after it arrives at a site, the cycad aul-
acaspis scale (phloem-feeder) causes mortality of cycad
adults by triggering repeated leaf flushes (Marler 2009).
Non-native cycad blue butterflies (Chilades pandava
Horsfield), yellow crazy ants (Anoplolepis gracilipes), and
feral pigs (Sus scrofa) cause secondary structural dam-
age to plants already injured by the insect scale, elevat-
ing mortality up to 90% (Marler 2009).
Local extinction of C. micronesica populations could
lead to the erosion of genetic diversity in other organ-
isms. Cycads are adapted to long-term turnovers of
pathogens and symbionts (Whiting 1963; Mamay 1969;
Stevenson 1990; Taylor & Taylor 1993; Norstog & Nich-
olls 1997; Jones 2002; Schneider et al. 2002). They are
the oldest known living gymnosperms with true root
structures that house nitrogen-fixing symbionts as part
of a tripartite symbiotic system inclusive of mycorrhizae
and nitrogen-fixing cyanobacteria (Norstog & Nicholls
1997) which maintain soil communities via rhizosphere
modification (El-Shatnawi & Makhadmeh 2001).
C. micronesica interacts with a range of newly discov-
ered specialist insect pollinators in cycads, which offers
insights into previously unexplored pollinator com-
plexes (Terry et al. 2009). It is also a suspected cause of
the neurodegenerative disease ALS-PDC (Spencer et al.
� 2010 Blackwell Publishing Ltd
1987; Cox & Sacks 2002; Borenstein et al. 2007) although
this remains controversial (Duncan et al. 1988; Steele &
McGeer 2008). These intimate associations between cyc-
ads and other organisms add to the urgency of conserv-
ing cycads in general. Cycads are currently restricted to
areas in the tropics and subtropics, with 82% of the
species considered threatened (Donaldson 2003; Nors-
tog 2003). Cycas micronesica’s dire conservation status,
coupled with its ecological, evolutionary, and potential
medical importance, makes the study of its current
population genetic structure critical.
Given the longevity of adult cycads on Guam (up to
ca. 100 years of age) (Hirsh & Marler 2002) and the
recent introduction of the cycad aulacaspsis scale, it is
unlikely to detect a genetic signature correlated to pat-
terns of infection in the island. However, a description
of standing variation of remaining populations is criti-
cal for management, and important to understand the
evolutionary history of C. micronesica in Micronesia. Pre-
vious to the invasion of the scale, C. micronesica was
present throughout most of Guam’s native habitats. Dif-
ferent environments within Guam have likely shaped
patterns of genetic variation of C. micronesica by acting
as barriers or facilitators to seed and pollen dispersal.
Most of the island is a mosaic of patches of secondary
forests with grasslands shaped by humans over the past
ca. 3000 years (Spoehr 1955; Rogers 1995). The presence
of human settlements, an east and west gradient of salt
spray and wind exposure along the coasts, and the
north and south differences in forest extent and water-
availability within Guam, could translate into popula-
tions with unique levels of genetic variation and
varying degrees of genetic connectivity. Furthermore,
most of the north of Guam is comprised of limestone
substrates of marine origin, while volcanic substrates of
the south are highly acidic, poorly drained, and vulner-
able to erosion (Young 1988). C. micronesica is one of
very few plant native species common to these highly
contrasting substrates (Marler 2002). Such native plants
must have the genetic resources to contend with cal-
cium deficiency and aluminum toxicity, as these are the
main chemical pressures in these substrates (e.g. Marler
and Lawrence 2004).
In this study we describe the genetic connectivity of
natural populations of C. micronesica throughout Guam
using microsatellites developed from Expressed
Sequence Tags (EST-STRs). This is the first study to
apply genomic tools to enable rapid characterization of
genetic variation in natural populations of an endan-
gered cycad. We focus on the impact of potential barri-
ers to gene flow throughout Guam, as well as discuss
the implications of genetic patterns in the context of the
reproductive biology of this species. We provide a basic
guideline for management and identify sites that are
2366 A. CI BRIAN - JARAMI LLO ET AL.
priorities for conservation. Overall, we seek to add to
the general understanding of the combined historical
and contemporary effects of geography, the environ-
ment, and human-induced habitat changes on the life
history and genetic patterns of cycad populations, and
of oceanic plants in general.
Materials and methods
Sampling
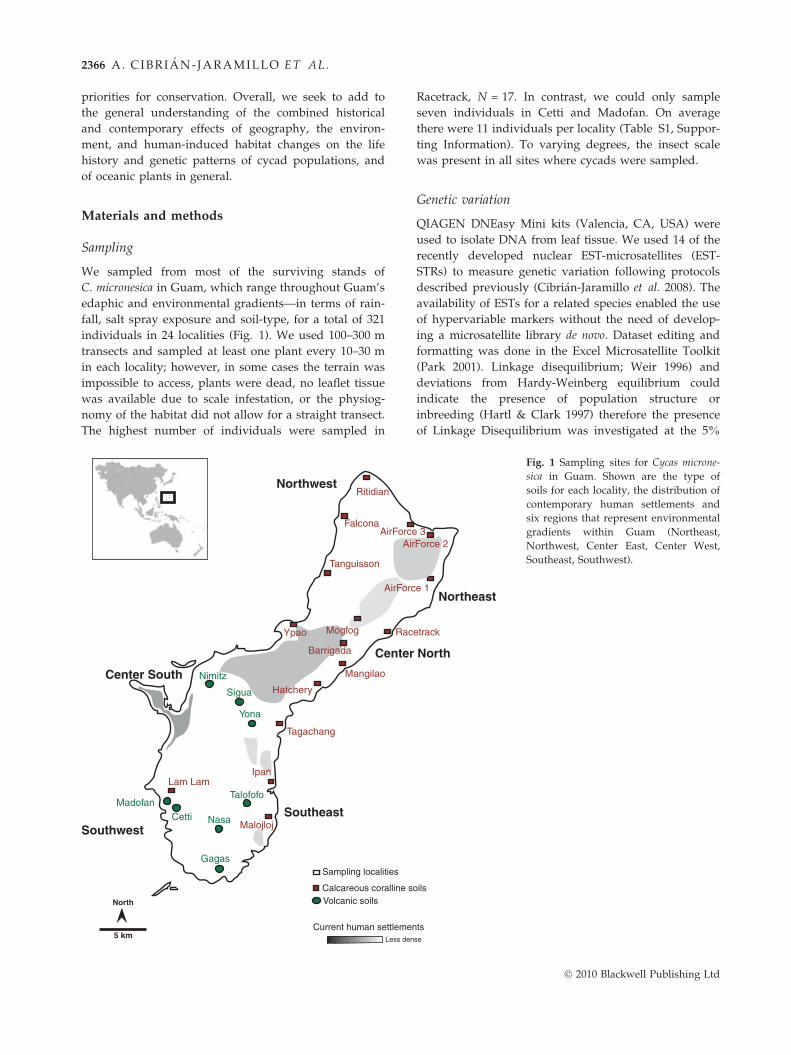
We sampled from most of the surviving stands of
C. micronesica in Guam, which range throughout Guam’s
edaphic and environmental gradients—in terms of rain-
fall, salt spray exposure and soil-type, for a total of 321
individuals in 24 localities (Fig. 1). We used 100–300 m
transects and sampled at least one plant every 10–30 m
in each locality; however, in some cases the terrain was
impossible to access, plants were dead, no leaflet tissue
was available due to scale infestation, or the physiog-
nomy of the habitat did not allow for a straight transect.
The highest number of individuals were sampled in
Northwest
Center
Southeast
Ritidian
Falcona AirForce
Rac
Mangilao
Tagachang
Yona
Nimitz
Talofofo
NasaSouthwest
North
5 km
Tanguisson
Sigua
Ypao
Barrigada
Hatchery
Air
AirForc
Mogfog
Ipan
Sampling localities
Calcareous coralline sVolcanic soils
Current human settlemenLess den
Center South
Gagas
MadofanCetti
Lam Lam
Malojloj
Racetrack, N = 17. In contrast, we could only sample
seven individuals in Cetti and Madofan. On average
there were 11 individuals per locality (Table S1, Suppor-
ting Information). To varying degrees, the insect scale
was present in all sites where cycads were sampled.
Genetic variation
QIAGEN DNEasy Mini kits (Valencia, CA, USA) were
used to isolate DNA from leaf tissue. We used 14 of the
recently developed nuclear EST-microsatellites (EST-
STRs) to measure genetic variation following protocols
described previously (Cibrian-Jaramillo et al. 2008). The
availability of ESTs for a related species enabled the use
of hypervariable markers without the need of develop-
ing a microsatellite library de novo. Dataset editing and
formatting was done in the Excel Microsatellite Toolkit
(Park 2001). Linkage disequilibrium; Weir 1996) and
deviations from Hardy-Weinberg equilibrium could
indicate the presence of population structure or
inbreeding (Hartl & Clark 1997) therefore the presence
of Linkage Disequilibrium was investigated at the 5%
Northeast
North
3
etrack
Force 2
e 1
oils
tsse
Fig. 1 Sampling sites for Cycas microne-
sica in Guam. Shown are the type of
soils for each locality, the distribution of
contemporary human settlements and
six regions that represent environmental
gradients within Guam (Northeast,
Northwest, Center East, Center West,
Southeast, Southwest).
� 2010 Blackwell Publishing Ltd

POPULATION GENETI CS OF CYCAS MICRONESICA 2367
statistical significance level among loci per population
based on sampling sites with 10 000 permutations.
Departure from Hardy-Weinberg equilibrium expecta-
tions was tested for each locus with default parameters;
both analyses were carried out in Arlequin V3.11 (Excof-
fier et al. 2005).
Estimates of mean number of alleles per locality,
number of private alleles, information index (I), Fixation
index (F), were calculated with GenAlEx v6 (Peakall &
Smouse 2006). Heterozygosity was measured as the
unbiased expected heterozygosity (HE), and observed
heterozygosity (HO) corrected for sample size (Nei
1978) using Genetix v4.05 (Belkhir et al. 2004). We used
rarefaction statistics implemented in HP-Rare to test the
influence of different sample sizes across localities (Ka-
linowski 2005). The presence of null alleles and allelic
dropout was tested using Micro-checker V2.2.1 (Van Oo-
sterhout et al. 2004) within each subregion. This imple-
mentation calculates the probabilities for the observed
number of homozygotes within homozygote classes
using a cumulative binomial distribution (Weir 1996).
Given that our microsatellites were developed from
expressed sequence tags (derived from expressed genes)
we tested for evidence of selection on each locus. We
tested for signs of positive and balancing selection
using the Fst-outlier approach (Beaumont & Nichols
1996; Beaumont 2005) implemented in LOSITAN (Antao
et al. 2008). This method uses the expected distribution
of Wright’s inbreeding coefficient Fst vs. HE to identify
outlier loci that have excessively high or low Fst com-
pared to neutral expectations, under an island model of
migration and with neutral markers. As recommended
by Antao et al. (2008) we ran LOSITAN once to identify
the set of loci under selection. All loci outside a 99%
confidence interval were removed and the mean Fst
was calculated again. A final run included all loci. We
used the infinite alleles model and 10, 000 simulations.
Regional differentiation
We estimated an overall measure of differentiation
across all sampling localities using hST (Weir and Cocker-
ham 1984) and pairwise frequence based estimates of
Fst, the inbreeding coefficient within subpopulations, rel-
ative to the total (Wright 1951; Hartl & Clark 1997) using
Arlequin V3.11. We compared estimates of Fst to Gst (Nei
1973) to the actual differentiation D and the estimator of
actual differentiation (Jost 2008) using SMOGD v2.6 (Craw-
ford 2009). We used a locus-by-locus AMOVA (Excoffier
et al. 1992) to measure the extent of hierarchical genetic
differentiation among and within six regions, Northeast,
Northwest, Center North, Center South, Southeast, and
Southwest, which represent different environments
(Fig. 1). AMOVA was calculated using Arlequin v3.11.
� 2010 Blackwell Publishing Ltd
Genetic differences between populations based on
genetic distance were estimated with Nei’s chord dis-
tance Da, with no assumptions of a Stepwise Mutation
Model for microsatellite evolution (Nei et al. 1983). A
Neighbor Joining phenogram was created in Neighbor
of the Phylip v3.6 package (Felsenstein 2006). Bootstraps
were calculated using POPULATIONS (Langella, Popula-
tions 1.2.30).
Limited dispersal can result in a pattern of genetic
differentiation that increases with geographic distance.
Isolation by distance was tested with a Mantel test for
matrix correspondence (Smouse et al. 1986; Smouse &
Long 1992). GenAlEx v6 (Peakall & Smouse 2006) was
used to produce a geographic and genetic distance
matrix using pairwise individual comparisons, follow-
ing Peakall et al. (1995) and Smouse & Peakall (1999).
Given the varying environmental conditions, we first
tested sampling localities from North to South followed
by localities along each coast, separately.
Genetic assignments
Bayesian methods have provided tools for different lev-
els of spatial and temporal resolution to population-
level analyses without pre-assumptions of population
structure (Storz & Beaumont 2002; Heuertz et al. 2003;
Coulon et al. 2004; Rowe & Beebee 2007). The Bayesian
clustering approach in BAPS v4.14 was used to infer
the number of genetic groups using individual assign-
ments and spatial clustering of individuals using geo-
graphic coordinates based on sampling sites (Corander
et al. 2008). Five independent runs were carried out to
test for congruence among runs. STRUCTURE v3.1 (Prit-
chard et al. 2000) was used for comparison with BAPS.
All individuals were clustered with and without pro-
viding a priori information on their population of ori-
gin. Ten independent runs were performed for each set,
with values of K ranging from 1 to 20, a burn-in of
200 000 generations and a subsequent 300 000 MCMC
steps. We assumed that allele frequencies were corre-
lated among populations (prior mean = 0.01, prior
SD = 0.05, k = 1.0) and that each individual draws a
fraction of its genome from each of the K clusters, and
we thus set a uniform prior on admixture and a (initial
value = 1.0, max = 10.0, SD = 0.025). The second-order
rate of change of the log probability of the data with
respect to the number of clusters (DK) was used as an
additional estimator of the most likely number of
genetic clusters (Evanno et al. 2005).
Genetic signature of a population decline
We tested for evidence of historical human invasions in
Guam that have transformed the island’s landscape.
2368 A. CI BRIAN - JARAMI LLO ET AL.
The last major human-induced transformation occurred
400 years ago (Rogers 1995) after an initial human set-
tlement 3 kya (Spoehr 1955). If the effective population
size of C. micronesica was significantly reduced in size,
alleles at low frequency (<0.1) should be less abundant,
and few rare alleles should be present, often resulting
in an excess of heterozygosity (Cornuet & Luikart 1996;
Luikart & Cornuet 1998). Allelic richness was measured
based on the number of alleles per locus and popula-
tion (AT), the number of alleles with a frequency greater
than 5% (A5%), less than 50% (A < 50%) (Maguire et al.
2002), and the number of private alleles (AP). The distri-
bution of allele frequencies was estimated following the
graphical method of Luikart et al. (1998). The program
BOTTLENECK (Cornuet & Luikart 1996) was used to calcu-
late significant deviations of the distribution of the het-
erozygosity expected from the observed number of
alleles (k), given the sample size (n), under the assump-
tion of mutation-drift equilibrium. We calculated these
distributions for each sampling locality (N = 24) and for
each locus using the IAM model with 10, 000 replicates.
Recent immigration among regions
We tested the hypothesis of an abrupt, recent popula-
tion subdivision possibly caused by human influence
on Guam’s forest landscape, as well as the impact of
edaphic substrates between north and south of the
island on genetic structure, using BayesAss+ v1.3 (Wil-
son & Rannala 2003). This method estimates a matrix of
pairwise recent immigration rates (m) among popula-
tions using a coalescent approach. The default settings
for burn-in and number of MCMC iterations were
enough to reach convergence based on visual inspection
of likelihood scores. We employed the genetic clusters
identified with BAPS as our populations, as these are
the areas we are interested in evaluating for conserva-
tion purposes. Five independent runs were performed
to test for congruence, and a likelihood ratio test was
then employed to determine whether the prior and pos-
terior probabilities of migration rates are significantly
different from each other (Wilson & Rannala 2003).
Identifying key populations for conservation
Given the conservation status of C. micronesica, we were
interested in identifying critical populations for manage-
ment. Small populations are typically considered the
most vulnerable to detrimental impacts of high inbreed-
ing and low genetic variation (DeSalle & Amato 2004;
Kramer & Havens 2009). The extent of gene flow is also
important factor in determining vulnerability, especially
when there is rapid local extinction as it is the case
for C. micronesica in Guam (Allendorf & Leary 1986;
Bohonak 1999; Epperson 2003; Manel et al. 2003). Criti-
cal populations in this context are those that are small
and that are mostly self-seeding and are effectively iso-
lated from the rest of the island. Equally important are
populations that disproportionally contribute with
migrants to other populations (via pollen or seed) main-
taining gene flow at a regional scale (‘sources’ sensu lato;
Sork et al. 1999). Collection for ex situ conservation
should include seeds from both of these outliers in order
to represent the spectrum of genetic patterns of C. micro-
nesica. In particular, seeds from ‘source populations’ can
be used to re-establish natural populations from nurser-
ies, minimizing changes in assortative mating that could
lead to outbreeding depression (Epinat et al. 2009).
We estimated the influence of each population on
recent immigration rates throughout the island. As sug-
gested by Baums et al. (2005), we sequentially omitted
each of the sampling localities from the immigration
matrix estimated by BayesAss (for a total of 24 matri-
ces). This approach is based on the notion that each
population can have a different effect on the immigra-
tion rates of the rest of the localities (Wilson & Rannala
2003; Baums et al. 2005). If a population contributes
with migrants, its exclusion will increase its mean self-
recruitment rates. In contrast, if its contribution is mini-
mal for the rest of the populations, its exclusion will
decrease mean self-recruitment rates. We did three
independent BayesAss runs using the same matrix, and
another run excluding loci under positive selection
(224, 250, 268) to test for congruence and reliability of
this method. We developed a series of three Java scripts
(available at http://genomics.amnh.org or by the
authors upon request) to produce the ‘jackknifed self-
recruitment’ matrix, and the difference between the
overall self-recruitment rate and each of the jackknifed
self-recruitment estimates.
Results
We used 14 EST-microsatellites to describe the levels of
genetic variation and genetic connectivity of 321 indi-
viduals of C. micronesica in 24 localities in Guam. We
detected balancing selection on locus 270 (with no
known protein function), and positive selection on three
others—loci 224 and 250, which correspond to a sugar
transporter and NADH dehydrogenase subunit 5
respectively, and locus 268, which has no known pro-
tein function (Cibrian-Jaramillo et al. 2008; Fig. 2).
There were no differences in estimates of heterozygosity
or average number of alleles, or estimates of population
structure (BAPS) if these loci were removed or main-
tained and thus they were kept in all of the analyses
(Fig. S1, Supporting Information). Locus 280 exceeded
the allowed number of alleles for BayesAss (max. 40
� 2010 Blackwell Publishing Ltd

Fig. 2 Test for selection on EST-STR loci. Four loci were
detected as subject to selection –270, subject to balancing selec-
tion (green points), in which multiple alleles can be maintained
in the gene pool of a population by selection favoring hetero-
zygotes; 224, 250, 268 subject to positive selection (red points),
where new alleles are fixed following selective sweeps. The
remaining loci were within neutral expectations (blue circles).
Neutral Fst with 15 000 runs and a confidence interval of 99%.
POPULATION GENETI CS OF CYCAS MICRONESICA 2369
alleles) and was removed from those calculations.
Given that microsatellites were developed from Cycas
rumphii, there is a possibility of null alleles accounting
for the lack of heterozygosity. There was no evidence
for large allele dropout, but the general excess of homo-
zygotes in some allele size classes suggested that null
alleles might be present, albeit with no significant pat-
tern specific to a site. Likewise, significant deviations
from Hardy–Weinberg equilibrium expectations and
Linkage disequilibrium (P < 0.01) were detected but
showed no consistent patterns across loci or across pop-
ulations.
Overall, there is an average of 4.2 alleles per locality
across Guam (Table S1, Supporting Information and
Fig. 3). The minimum average number of alleles per
site was found in Madofan (Na = 3.5) and the maxi-
mum in Talofofo (Na = 5.8; Fig. 3). Private alleles, or
alleles found only within a particular locality, were
found throughout Guam in low frequency. Talofofo had
the highest number of private alleles (AP = 2.1). The
average expected and observed heterozygosity across
sites were HE = 0.545 (SD = 0.014) and HO = 0.349
(SD = 0.015), respectively. The highest unbiased
expected heterozygosity was found in Sigua HE = 0.68
(SD = 0.077) and the lowest in Ritidian HE = 0.45
(SD = 0.08). In terms of observed heterozygosity, Falc-
ona HO = 0.268 (SD = 0.03) and Airforce 3 HO = 0.437
(SD = 0.05) had the lowest and highest, respectively.
We found a weak correlation between sample size and
expected heterozygosity (Spearman’s rank correlation
� 2010 Blackwell Publishing Ltd
corrected coefficient = )0.12, P = 0.6) and observed het-
erozygosity ()0.37, P = 0.08; Table S1, Supporting Infor-
mation). Fixation indices suggest that there is moderate
to high levels of inbreeding, with the variation within
individuals relative to the subpopulations as FIS = 0.370
(P < 0.01) and within individuals relative to the total as
FIT = 0.525 (P < 0.01; Table S1, Supporting Information).
Using all 24 sampling localities as putative popula-
tions, genetic differentiation (hST = 0.245) was signifi-
cantly different from zero (P < 0.01), indicating low
gene flow among localities. Pairwise Fst estimates show
that most of the variation is indeed found within locali-
ties (Table S2, Supporting Information). D estimates
(D = 0.55, Dest = 0.52) are higher than Fst, which is clo-
ser to Gst = 0.287. This was expected given that Gst and
Fst are sensitive to gene diversity and to subpopulation
differentiation (Jost 2008). However, all three estimates
unequivocally suggest low (historical) genetic connec-
tivity Cycas micronesica.
We measured hierarchical genetic differentiation
among and within six regions, Northeast, Northwest,
Center North, Center South, Southeast and Southwest
(from Fig. 1). AMOVA showed that overall, 41% of the
variation is found within populations, 33% is distrib-
uted among individuals within populations, 26% is dis-
tributed among populations either within the north
region or within the south region, and almost none of
the variation is distributed among the six different
regions in the island.
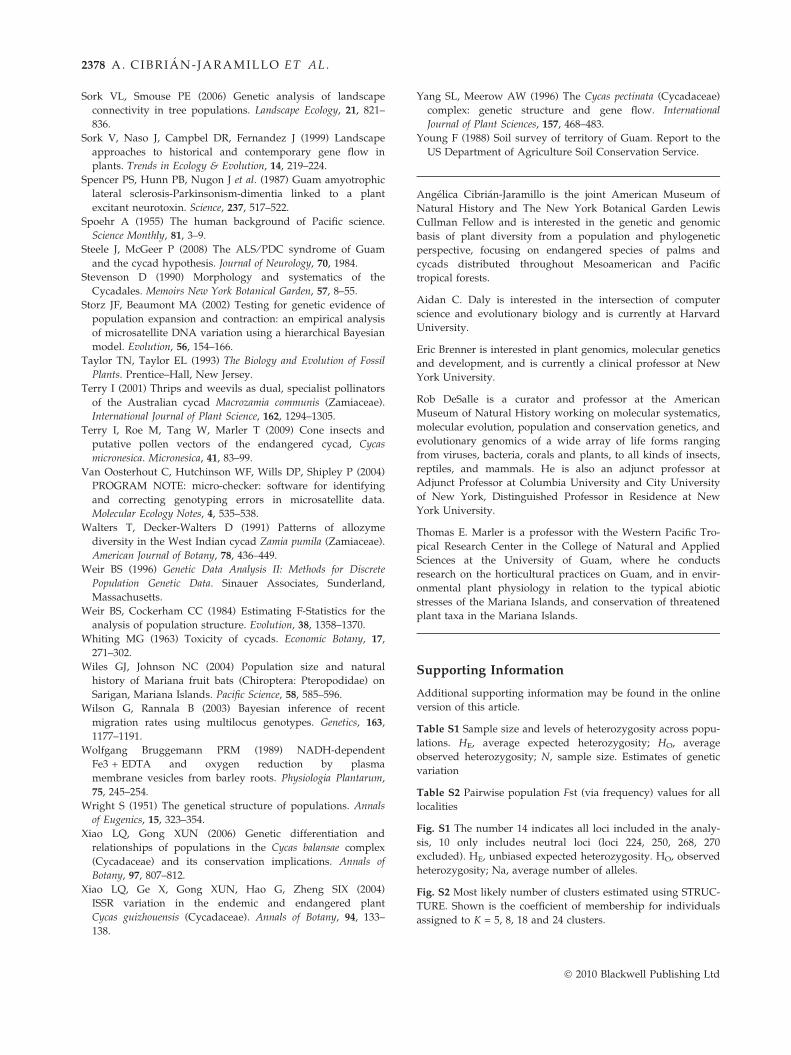
Most localities are genetically different based on Nei’s
chord distance (Da) but there is no clear pattern of dif-
ferentiation among the six subregions nor in areas with
various degrees of insect scale abundance (Fig. 4). Boot-
strap values were low (<50) for all nodes except for
(Ritidian, Racetrack) which had high support (>80). This
was expected from the topology and congruent with the
Mantel test. In the latter, the null hypothesis of no corre-
lation between geographic and genetic distance through-
out the island and along the coasts was not rejected.
BAPS showed that the optimal partitioning was
K = 18, revealing the highest gene flow in the center
north of the island (Fig. 5). This was similar to the esti-
mate from STRUCTURE of K = 15 when a priori information
is provided on the geographic origin of each population
using the DK method (Evanno et al. 2005). STRUCTURE
also estimated K = 5 if no information was provided on
the origin of populations (Fig. S2, Supporting Informa-
tion). In the north of the island, Ritidian is the most iso-
lated population geographically, with almost no
estimates of immigrants from nearby populations in
any direction. Talofofo and Nasa are among the most
diverse sites in the south.
We estimated the proportion of migrants among
the inferred BAPS genetic clusters using BayesAss. The
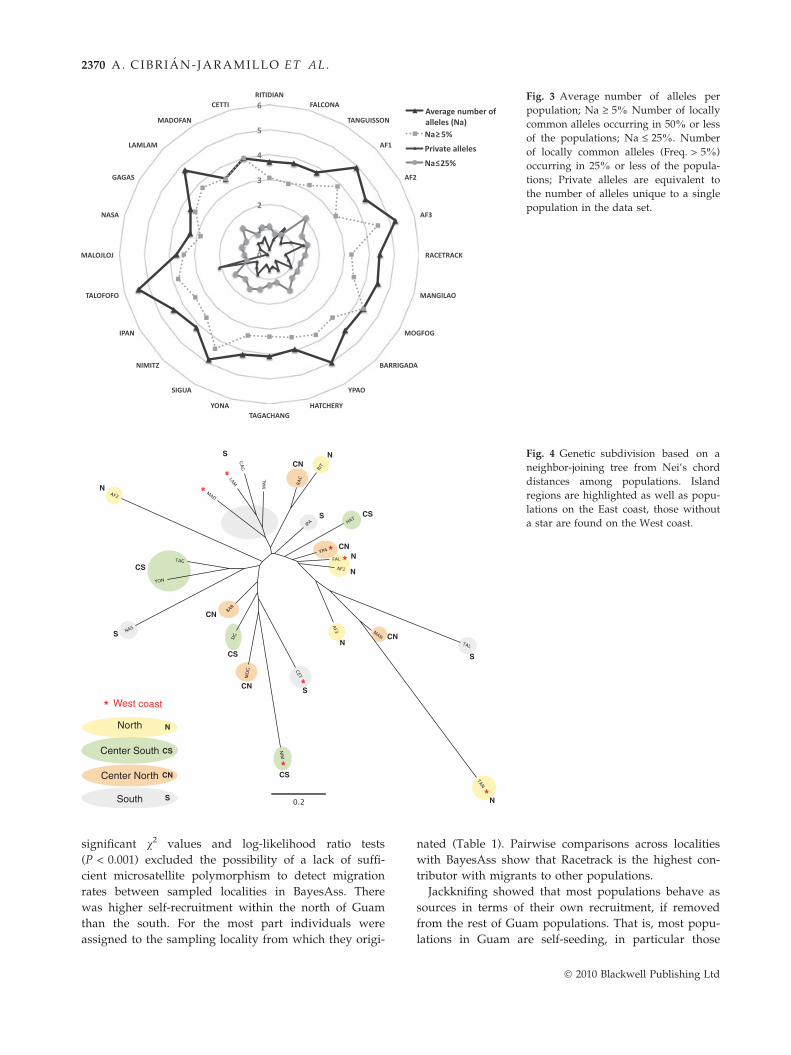
Fig. 3 Average number of alleles per
population; Na ‡ 5% Number of locally
common alleles occurring in 50% or less
of the populations; Na £ 25%. Number
of locally common alleles (Freq. > 5%)
occurring in 25% or less of the popula-
tions; Private alleles are equivalent to
the number of alleles unique to a single
population in the data set.
South
Center South
North
Center North
**
*
*
*
*
*
* West coast
N
N
N
N
N
CS
CS
CS
CS
CSCN
CN
CN
CN
CN
S
S
S
S
S
S
CN
N
N
Fig. 4 Genetic subdivision based on a
neighbor-joining tree from Nei’s chord
distances among populations. Island
regions are highlighted as well as popu-
lations on the East coast, those without
a star are found on the West coast.
2370 A. CI BRIAN - JARAMI LLO ET AL.
significant v2 values and log-likelihood ratio tests
(P < 0.001) excluded the possibility of a lack of suffi-
cient microsatellite polymorphism to detect migration
rates between sampled localities in BayesAss. There
was higher self-recruitment within the north of Guam
than the south. For the most part individuals were
assigned to the sampling locality from which they origi-
nated (Table 1). Pairwise comparisons across localities
with BayesAss show that Racetrack is the highest con-
tributor with migrants to other populations.
Jackknifing showed that most populations behave as
sources in terms of their own recruitment, if removed
from the rest of Guam populations. That is, most popu-
lations in Guam are self-seeding, in particular those
� 2010 Blackwell Publishing Ltd

144.6 144.65 144.7 144.75 144.8 144.85 144.9 144.95 145
13.25
13.3
13.35
13.4
13.45
13.5
13.55
13.6
13.65
Ritidian
FalconaAirForce 3
AirForce 2
AirForce 1
Racetrack
Barrigada
Ypao
MangilaoHatchery
Tagachang
YonaSigua
Nimitz
Ipan
Malojloj
Talofofo
Nasa
Madofan
Cetti
Gagas
Lam Lam
North
5 km
Tanguisson Mogfog
1
22
33
4
55
5
5
6
1
7
89 10
1113
12
15
16
14
15
1718
1917
Fig. 5 Genetic subdivision among local-
ities based on Bayesian clustering using
BAPS. The most likely number of K
given 321 individuals collected from 24
localities is 18. Shown are the propor-
tions of individual multilocus genotypes
attributable to genetic clusters, or popu-
lations (K). Each color denotes a genetic
cluster (similar colors do not necessarily
reflect genetic similarity). A polygon
surrounds GPS-based records of indi-
vidual samples (name of locality also
shown).
POPULATION GENETI CS OF CYCAS MICRONESICA 2371
found in the north. This is congruent with the patterns
of high differentiation observed throughout Guam, as
seed and pollen donors are more likely to originate
from the source population, rather than from other pop-
ulations, diminishing gene flow among geographically
distant localities. Tanguisson, the Northeastern cluster
(AF1 and AF2), Tagachang, Sigua, and the Southeastern
cluster (Gagas and Nasa) behave more like sinks—when
removed there is an increase in mean self-recruitment
for the remaining populations (Fig. S3, Supporting
Information). When a population is near zero, then they
are neither sources nor sinks they are near the average
for all populations (e.g. Southeast cluster).
We tested the effects of human-induced forest frag-
mentation in Guam. There was no detectable evidence of
a recent bottleneck according to the graphical method
(Luikart & Cornuet 1998; Fig. 4). There were no signifi-
cant P-values for any of the tests of deviations from
mutation-drift equilibrium (Cornuet & Luikart 1996; Lu-
ikart & Cornuet 1998; Luikart et al. 1998) for any sam-
pling locality using BOTTLENECK. We did not detect
changes in mode-shift that would distinguish bottlenec-
ked populations from stable populations except for local-
ities Madofan and Cetti but this was due to their small
sample size (N = 7) rather than evidence of a bottleneck.
� 2010 Blackwell Publishing Ltd
Discussion
Guam cycads: moderate genetic variation, restrictedand asymmetrical gene flow
Population genetics theory predicts that genetic varia-
tion in small and isolated populations will erode over
time (mostly due to genetic drift), resulting in an isola-
tion-by-distance pattern where individuals at closer
geographic distance will have higher chances of being
identical by descent (Slatkin 1993; Hedrick 2000; Rous-
set 2000). Indeed, with only a few exceptions (Xiao &
Gong 2006) most cycad species have a highly structured
distribution of low genetic variation, with low levels of
gene flow and a pattern of isolation by distance even at
small geographic distances (Ellstrand et al. 1990;
Walters & Decker-Walters 1991; Yang & Meerow 1996;
Sharma et al. 1999, 2004; Lin et al. 2000; Keppel 2002;
Huang et al. 2004; Xiao et al. 2004; Jianguang et al.
2005). It is thus not entirely surprising that similar
to other cycads and in contrast to genetic patterns in
most long-lived dioecious gymnosperms (Hamrick
et al. 1992; Hardy et al. 2006; Sork & Smouse 2006),
C. micronesica has low levels of gene flow among popu-
lations, with most recruitment restricted to small

Table 1 Bayesian assessment of migration within and among sampling localities implemented in BayesAss+. For each sampling
locality, numbers are the mean proportion of individuals from each source locality. Bold face terms along the diagonal are proportion
of non-migrants (self-recruitment). Empty cells represent mean proportions <0.05
Genetic cluster RIT NW TAN NE RAC CN HAT TAG YON SIG NIM IPA TAL SE NAS LAM MAD CET
RIT 0.981
NW 0.679 0.264
TAN 0.970
NE 0.683 0.055 0.150
RAC NORTH
continuous forests
no surface water
calcareous soils
0.982
CN 0.991
HAT 0.211 0.688
TAG 0.221 0.686
YON 0.041 0.112 0.774
SIG 0.206 0.687
NIM 0.193 0.688
IPA 0.175 0.687
TAL 0.058 0.866
SE 0.268 0.679
NAS 0.095 0.122 0.687
LAM 0.175 0.046 SOUTH
fragmented forests surface water volcanic soils
0.686
MAD 0.109 0.702
CET 0.099 0.705
2372 A. CI BRIAN - JARAMI LLO ET AL.
geographic areas, and most of the variation found
within populations.
In contrast to most population genetic studies in cyc-
ads however (mostly conducted with allozymes; Yang
& Meerow 1996; Lin et al. 2000; Keppel 2002; Huang
et al. 2004; Xiao et al. 2004; Xiao & Gong 2006) we
found that wild populations of C. micronesica in Guam
have moderate levels of inbreeding among individuals
within populations and high levels of genetic variation
in terms of number and distribution of alleles, including
private alleles. This is congruent with expectations for
long-lived outcrossing tropical species, and similar to
other estimates of genetic variation in cycads using hy-
pervariable molecular markers: Macrozamia riedlei (By-
rne & James 1991), Cycas debaoensis (Jianguang et al.
2005), Zamia pumila (Meerow & Nakamura 2007), and
Dioon edule (Moynihan et al. 2007). Often-cited estimates
of the extent of gene flow in cycads are from 2 to 7 km
(Ellstrand et al. 1990; Walters & Decker-Walters 1991;
Yang & Meerow 1996; Lin et al. 2000; Huang et al.
2001, 2004). This is the case for some populations of C.
micronesica, such as Ritidian and Tanguisson but our
results suggest that to assume restricted gene flow up
to 7 km as an a priori for cycads may be premature.
Guam cycad populations are genetically structured
(Fst and BAPS, STRUCTURE) but their genetic relationships
with other populations vary (BAYESASS, IBD, NJ). Envi-
ronmental and geological conditions on Guam have
imparted pressures that can promote genetic disjunc-
tion of populations of C. micronesica plants (Marler
2002). Despite no clear isolation by distance patterns
within the island, there is a genetic division between
north and south of Guam in terms of recent immigra-
tion rates among populations. In the north, most popu-
lations are self-seeding, with the exception of
Racetrack, which is common to north and south. In
the south all populations contribute with migrants to
other populations to a greater extent. Together, our
results suggest asymmetrical gene flow where popula-
tions can contribute with genetic migrants only to
themselves, unidirectionally to only a few others, or to
many others. These patterns reveal a more complex
population dynamics than previous studies in cycads,
and to some extent the influence of human transport
in Guam’s cycad populations. The north and south
immigration rates in Guam can be associated to three
main factors: largely contiguous forests in coastal
regions in contrast to fragmented forests, seed size dif-
ferences, and differences in edaphic conditions. The
influence of biological, geographic and environmental
factors on the genetic connectivity of C. micronesica are
discussed below.
� 2010 Blackwell Publishing Ltd

POPULATION GENETI CS OF CYCAS MICRONESICA 2373
Most variation found within populations driven bysporadic reproduction and local pollinators
Local assortative mating is a key biological factor that
maintains genetic variation within populations in plants
(Epperson 2003; Fortuna et al. 2008). Given most of the
genetic variation concentrated within localities, this fac-
tor may play an important role in C. micronesica popula-
tions. Cycads have many sporadic reproductive events
throughout their life but as diecious species, they are
restricted by the number of reproductive females and the
availability of pollen donors every year (Terry 2001). On
average, female C. micronesica plants in natural popula-
tions have reproductive events every 63 weeks, while
males cone every 44 weeks. Within populations in Guam,
only some individuals cone regularly, every several years
(T. Marler, University of Guam, Guam). Habitat condi-
tions in the island, and most recently the cycad aulaca-
spis scale, also affect the amount and regularity of coning
episodes in C. micronesica, and a low number of seeds
produced when plants are under stress (T. Marler, Uni-
versity of Guam, Guam). These patterns could effectively
decrease the probability of reproductive events, increas-
ing genetic differentiation among populations and
decreasing the effective population size within popula-
tions (e.g. Shapcott & Playford 1996; Luna et al. 2007).
Within populations and among spatially structured
populations, the availability and origin of pollen and
seed donors are critical for determining genetic structure
(Sork & Smouse 2006; Fortuna et al. 2008; Nathan et al.
2008). Most cycad pollination is mediated by specialist
insects that are dependent on male cones for food and
larval development (Terry et al. 2009). Possible
pollinators of C. micronesica are the microlepidopteran
Anatrachyntis sp. (Lepidpoptera: Cosmopterygidae) and
several species of Carpophilus sp. (Coleoptera: Nitiduli-
dae) (Terry et al. 2009), which have low vagility. The
leptokurtic curve for the pollen kernel in this species
should have a long tail, contributing to most variation
found within rather than among populations. In terms
of seed-mediated gene flow, bats have been suggested as
seed dispersers of cycads, but there is no empirical evi-
dence of this assertion (Pijl 1957; Jones & Lloyd 1993). In
Guam the Little Mariana bat (Pteropus tokudae) is
believed to be extinct, and the Mariana fruit bat Pteropus
mariannus has declined in the last 50 years (Wiles &
Johnson 2004), including colonies that were thought to
be stable in the northwest, with only one colony persist-
ing near Air Force 2 in the northeast. If indeed bats
played a historical role in seed dispersal, the limited
gene flow across Guam supports the notion that popula-
tions of P. mariannus in the northern Marianas tend to
remain close to their colonies, and consume seeds on-site
(Wiles & Johnson 2004). It is more likely that rivers and
� 2010 Blackwell Publishing Ltd
seed size differences are more important for C. micronesica’s
seed dispersal within Guam (discussed below).
Higher recent self-recruitment in contiguous (north)than in isolated (south) forests
In Guam, most of the northern populations are self-
recruiting, while in the south, a higher number of immi-
grants from populations other than the one sampled,
are required to maintain the observed allele frequencies.
The north of Guam has the largest extent of conserved
forests (Fosberg 1960). Previous to the cycad aulacapsis
scale, densities of 3000 or more plants per hectare were
not uncommon in the north of the island, with popula-
tions covering up to 15 km along the west coast and
36 km along the east coast (T. Marler, University of
Guam, Guam). Cycad populations in a few mixed for-
ests of ravines in southern Guam are considerably smal-
ler. Most of the south is composed of old volcanic
material and a complex mosaic of grassland with early
succession stages of the forest (Fosberg 1960). It is likely
that within contiguous forest in the north, pollinators
may have a higher chance of finding synchronized
reproductive male and females that are also close geo-
graphically (Sork & Smouse 2006; Fortuna et al. 2008).
An outlier in the north and south patterns is Racetrack.
This locality has high levels of self-recruitment, but it is
the only population that acts as an important source of
migrants towards many other populations. Although
the specific role of human movement is difficult to dis-
cern, it is possible that seeds from this region may be
have been transported more frequently by humans than
other sites in Guam. Cycas micronesica was one of the
most common garden plants on Guam in the early 19th
century (Barratt 2003) and there was a historical reli-
ance on cycad seeds as food source by the Chamorro
people, who made use of the starch-rich gametophyte
tissue (Whiting 1963). The history and genetic connec-
tivity of the entire range of C. micronesica will help
enlighten the role of humans in Guam’s cycads.
Smaller seeds in the south associated with highergenetic connectivity
Seed size is an important biological factor in the extent
of genetic connectivity (Sork & Smouse 2006). With a
few exceptions (Rossetto et al. 2009) species with larger
seeds tend to be dispersed shorter distances than spe-
cies with smaller seeds (Muller-Landau et al. 2008).
Large or heavy seeded plants tend to be clumped
(Snow & Walter 2007). In previous work we had
observed that seed size is smaller in southern popula-
tions in Guam. We measured seed size from a random
sample of 100 seeds collected from areas between Air

2374 A. CI BRIAN - JARAMI LLO ET AL.
Force 3 and Ritidian (north), versus areas between Lam
Lam and Gagas (south). Fresh weight of these samples
was on average 87 g (range from 67 to 128 kg,
SD = 12.3) for north populations versus 56 g (range
from 47 to 64 kg, SD = 4.3) for south populations. While
seed dispersal does not guarantee survival and recruit-
ment, smaller seeds in the south of Guam probably dis-
perse further distances than larger seeds from the
north. The presence of rivers in the south also enables
them to move more than seeds in the north. Previous to
the invasion of the cycad aulacaspis scale, cycad seeds
were commonly seen floating in rivers and streams,
which are unique to the south. Higher clumping in the
north would more often favor mating among available
nearby plants, increasing the probability that seeds orig-
inate from related mothers, and that pollen donors are
also related (Seidler & Plotkin 2006; Fortuna et al. 2008).
This would result in higher mean self-recruitment rates
in the north, when compared to the more open south.
Edaphic stress as a driving force for different north-south genetic patterns
Positive selection detected in locus 250, which encodes
NADH dehydrogenase, suggests that the genetic dis-
junction observed in Guam’s cycad populations is, at
least in part, directly associated with edaphic pressure.
Limestone soils impose extreme iron deficiency in
plants that do not have the genetic capability to cope
with calcareous substrates that hinder iron availability
(e.g. Marler et al. 2002). NADH-dependent metabolic
activity (e.g. Fe3-citrate reduction) is important in plants
exposed to iron-poor soils (Buckhout et al. 1989; Wolf-
gang Bruggemann 1989; Marler et al. 2002; Durrett et al.
2007). Most of the north of Guam is comprised of lime-
stone substrates of marine origin while volcanic soils of
the south are highly acidic, poorly drained, and vulner-
able to erosion (Young 1988). Soil composition may also
be an important component of seed germination and
recruitment in cycads (Snow & Walter 2007). Further-
more, differences in edaphic conditions also correlate to
cycad chemistry. Sterols and derived glucosides vary
among locations throughout Guam (Marler et al. 2005,
2007; Marler & Shaw 2010). In particular, cycads on
sandy soils from the littoral habitat have higher seed
concentrations of steryl glucosides than plants on
upland regions of Guam (Marler 2002). The large
genetic cluster detected in the center-south of the island
connecting Ypao, Mogfog, Barrigada and Mangilao may
be associated to the distinct terrain in this part of the
island, composed of old karst (argillaceous limestone),
rounded hills and marshy sinks. The correlations of
edaphic differences in north and south of Guam with
standing and adaptive genetic variation, and their rela-
tionship to cycad chemistry are worth investigating in
this system. Locus 250 is a good a particularly good
candidate for future ecological genetic studies in
C. micronesica.
Critical populations for conservation
We have focused on an oceanic island species recently
endangered by an invasive insect, first to elucidate the
evolutionary history of its wild populations, and second
to contribute with basic guidelines for its management
and conservation. As with all comprehensive conserva-
tion strategies, use of genetic guidelines should be taken
in context with ecological and demographic observations
when available. Guam cycads are a clear example of the
rapid decline of oceanic species when invasive species
are introduced, including the detrimental repercussions
to the island’s ecology, and to the plant’s economic
value in the ornamental market. For C. micronesica it is
important to conserve as many plants originating from
the genetic populations (clusters) identified here (Fig. 5).
North and south populations could be kept separate, as
well as Ritidian and Tanguisson, in which most of the
individuals are assigned to the population of origin, and
have high pairwise differentiation values (Fst). Ritidian
is one of the best-conserved forest regions in Guam, yet
its population of C. micronesica has among the lowest
levels of variation and is the most genetically and geo-
graphically isolated, making it a valuable and fragile
resource. Seeds from this locality should be maintained
for future reintroductions, as habitat availability would
ensure its long-term survival despite its low variation. In
addition to Ritidian and Tanguisson, and based on pair-
wise differentiation (Fst) alone, Talofofo and Nimitz, are
probably best if managed as separate genetic entities.
Talofofo with the highest number of private alleles
should also be prioritized and could be used as a source
for seeds. Nasa, although not as variable, could be an
additional seed source, given its proximity to Talofofo
and the fact that they are located on the same river. If
needed, seeds could be moved among the two smaller
clusters identified with BAPS concomitant with lower
pairwise differentiation when compared to all other pop-
ulations: Gagas-Malojloj, and Air Force 3-Falcona. Popu-
lations from the south could be mixed within nurseries
if required, rather than populations from the north,
which showed higher self-recruitment rates.
Conclusions
As with most cycads, C. micronesica has high-genetic
structure, with most of the variation found within pop-
ulations. This species has moderate to high genetic vari-
ation, different recruitment rates across populations,
� 2010 Blackwell Publishing Ltd

POPULATION GENETI CS OF CYCAS MICRONESICA 2375
and varying degrees of genetic connectivity, in some
instances beyond the 2–7 km limit to gene flow pro-
posed previously for the cycads. We identified a total of
18 genetic populations from 24 sampling localities in
Guam. Patterns of genetic connectivity in C. micronesica
are partially a result of mating system and geographic
and environmental differences within Guam. Genetic
patterns within populations are probably a result of
localized pollination and a low availability of males and
female donors from distant areas within Guam. Human
transport and pollinator availability probably contribute
to the maintenance of genetic variation within and
among populations. Interestingly, there is higher recent
self-recruitment in the north than the south of Guam,
associated to the extent of forest fragmentation, seed
size, and to contrasting soil types. Our study identified
an EST-microsatellite coding for NADH dehydrogenase
under positive selection in Guam cycad populations,
which is probably associated to edaphic stress induced
by the iron-deficient soils in the north. Any loss of
cycad genetic diversity carries the risk of exponential
ecological consequences both from recent adaptations in
oceanic islands and from older interactions with other
organisms (Schneider et al. 2002). Given the current
endangerment of C. micronesica by an invasive scale, we
recommend maintaining separate populations when
establishing nurseries or reintroducing seeds, particu-
larly in the north, but we have also identified areas that
have local gene flow and thus could be mixed if
needed. We identified Ritidian and Talofofo among the
highest priority populations for conservation. We are
currently investigating the use of these and other EST-
microsatellite loci for exploring the ecological genomics
of this species within Guam, and extending the study
of its populations throughout its purported distribution
in Rota, Yap, and Palau.
Acknowledgements
We thank Irene Terry, Sergios-Orestis Kolokotronis and Dennis
Stevenson for their helpful comments on the manuscript. We
are grateful for the assistance of Michael Calonje in field collec-
tions. Thanks to Helen Ma, Rachel Engstrand and Alexandra
Cantley for their help in the lab. ACJ also acknowledges the
Montgomery Botanical Center for support. This research was
supported by the U.S. Department of Agriculture CSREES
Award 2006-34135-17141 to TM, and the Lewis B. and Dorothy
Cullman Program in Molecular Systematics at the AMNH and
the NYBG to RD and ACJ.
References
Allendorf F, Leary R (1986) Heterozygosity and fitness in natural
populations of animals. In: Conservation Biology (ed. Soule ME),
pp. 57–76. Sinauer Associates, Sunderland, Massachusetts.
� 2010 Blackwell Publishing Ltd
Antao T, Lopes A, Lopes RJ, Beja-Pereira A, Luikart G (2008)
LOSITAN: a workbench to detect molecular adaptation
based on a Fst-outlier method. BMC Bioinformatics, 9, 323.
Barratt G (2003) An account of the Corvette L ‘Uraine‘s sojourn
at the Mariana Islands, 1819. Occasional Historical Papers
No. 13. Saipan, Commonwealth of the Northern Mariana
Islands, Division of Historic Preservation.
Baums IB, Miller MW, Hellberg ME (2005) Regionally isolated
populations of an imperiled Caribbean coral, Acropora
palmata. Molecular Ecology, 14, 1377–1390.
Beaumont MA (2005) Adaptation and speciation: what can Fst
tell us? Trends in Ecology & Evolution, 20, 435–440.
Beaumont MA, Nichols R (1996) Evaluating loci for use in the
genetic analysis of population structure. Proceedings of the
Royal Society of London B Biological Sciences, 263, 1619–1626.
Belkhir K, Borsa P, Chikhi L, Raufaste N, Bonhomme F (2004)
GENETIX, logiciel sous WindowsTM pour la genetique des
populations. Laboratoire Genome, Populations, Interactions.
CNRS UMR 5000, Universite de Montpellier II, Montpellier,
France.
Bohonak AJ (1999) Dispersal, gene flow, and population
structure. Quarterly Review of Biology, 74, 21–45.
Borenstein A, Mortimer A, Schofield E et al. (2007) Cycad
exposure and risk of dementia, MCI, and PDC in the
Chamorro population. Neurology, 68, 1764–1771.
Buckhout TJ, Bell PF, Luster DG, Chaney RL (1989) Iron-Stress
induced redox activity in tomato (Lycopersicum esculentum
Mill.) is localized on the plasma membrane 1. Plant
Physiology, 90, 151–156.
Byrne M, James SH (1991) Genetic diversity in the cycad
Macrozamia riedliei. Heredity, 67, 35–39.
Caujape-Castells J, Tye A, Crawford D et al. (2010)
Conservation of oceanic island floras: present and future
global challenges. Perspectives in Plant Ecology, Evolution and
Systematics, 12, 107–129.
Cibrian-Jaramillo A, Marler TE, Desalle R, Brenner ED (2008)
Development of EST-microsatellites from the cycad Cycas
rumphii, and their use in the recently endangered Cycas
micronesica. Conservation Genetics, 9, 1051–1054.
Corander J, SirEn J, Arjas E (2008) Bayesian spatial modeling
of genetic population structure. Computational Statistics, 23,
111–129.
Cornuet JM, Luikart G (1996) Description and power analysis
of two tests for detecting recent population bottlenecks from
allele frequency data. Genetics, 144, 2001–2014.
Coulon A, Cosson JF, Angibault JM et al. (2004) Landscape
connectivity influences gene flow in a roe deer population
inhabiting a fragmented landscape: An individual-based
approach. Molecular Ecology, 13, 2841–2850.
Cox PA, Sacks OW (2002) Cycad neurotoxins, consumption of
flying foxes, and ALS-PDC disease in Guam. Neurology, 58,
956–959.
Crawford NG (2009) Smogd: Software for the measurement of
genetic diversity. Molecular Ecology Resources, 10, 556–557.
Dehgan BCY (1983) Seed morphology in relation to dispersal,
evolution, and propagation of Cycas L. Botanical Gazette, 144,
412–418.
DeSalle R, Amato G (2004) The expansion of conservation
genetics. Nature Reviews Genetics, 5, 702–712.
Donaldson JS (2003) Cycads: status survey and conservation action
plan. World Conservation Union.

2376 A. CI BRIAN - JARAMI LLO ET AL.
Duncan MW, Kopin IJ, Lavine L, Garruto R, Markey SP (1988)
The putative neurotoxin BMAA in cycad-derived foods is an
unlikely cause of ALS-PD. Lancet, 2, 631–632.
Durrett TP, Gassmann W, Rogers EE (2007) The FRD3-mediated
efflux of citrate into the root vasculature is necessary for
efficient iron translocation. Plant Physiology, 144, 197.
Ellstrand N, Ornduff R, Clegg JM (1990) Genetic structure of
the Australian cycad, Macrozamia communis (Zamiaceace).
American Journal of Botany, 77, 677–681.
El-Shatnawi M, Makhadmeh I (2001) Ecophysiology of the
plant-rhizosphere system. Journal of Agronomics and Crop
Science, 187, 1–9.
Epinat G, Lenormand T, Servedio M (2009) The evolution of
assortative mating and selfing with in-and outbreeding
depression. Evolution, 63, 2047–2060.
Epperson B (2003) Geographical Genetics. Princeton University
Press, Princeton.
Evanno G, Regnaut S, Goudet J (2005) Detecting the number of
clusters of individuals using the software structure: a
simulation study. Molecular Ecology, 14, 2611–2620.
Excoffier L, Smouse PE, Quattro JM (1992) Analysis of
molecular variance inferred from metric distances among
DNA haplotypes: application to human mitochondrial DNA
restriction data. Genetics, 131, 479–491.
Excoffier L, Laval G, Schneider S (2005) Arlequin ver. 3.0: An
integrated software package for population genetics data
analysis. Evolutionary Bioinformatics Online, 1, 47–50.
Felsenstein J (2006) PHYLIP (Phylogeny Inference Package) version
3.66. Department of Genome Sciences, University of
Washington, Seattle.
Fortuna A, Garcia C, Guimaraes P, Bascompte J (2008) Spatial
mating networks in insect-pollinated plants. Ecology Letters,
11, 490–498.
Fosberg FR (1960) Vegetation of the Marianas Islands. Bulletin
of the American Museum of Natural History, 119, 1–75.
Francisco-Ortega J, Santos-Guerra A, Kim SC, Crawford DJ
(2000) Plant genetic diversity in the Canary Islands: a
conservation perspective. American Journal of Botany, 87,
909.
Frankham R (1998) Inbreeding and extinction: Island
populations. Conservation Biology, 12, 665–675.
Hamrick JL, Godt MJW, Sherman-Broyles SL (1992) Factors
influencing levels of genetic diversity in woody plant
species. 6: 95 ± 124. New Forests, 6, 95–124.
Hardy O, Maggia L, Bandou E et al. (2006) Fine-scale genetic
structure and gene dispersal inferences in 10 Neotropical
tree species. Molecular Ecology, 15, 559–571.
Hartl DL, Clark AG (1997) Principles of population genetics, 3rd
edn. Sinauer Associates, Sunderland, Massachusetts.
Hedrick PW (2000) Genetics of Populations, 2nd edn. Jones and
Barlett, Boston.
Hellmann JJ, Byers JE, Bierwagen BG, Dukes JS (2008) Five
potential consequences of climate change for invasive
species. Conservation Biology, 22, 534–543.
Heuertz M, Vekemans X, Hausman JF, Paladas M, Hardy J
(2003) Estimating seed vs. pollen dispersal from spatial
structure in the common ash. Molecular Ecology, 12, 2483–
2495.
Hill KD (1994) The Cycas rumphii complex (Cycadaceae) in
New Guinea and the Western Pacific. Australian Systematic
Botany, 7, 543–567.
Hill KD (2004) Character evolution, species recognition and
classification concepts in the Cycadaceae. In: Cycad
Classification: concepts and Recommendations (eds, Walters TW,
Osborne R), pp. 22–44. CABI Publishing, Wallingford,
Oxford.
Hill KD, Stevenson DW, Osborne R (2004) The world list of
cycads. In: Cycad classification: concepts and recommendation
(ed. Walters TWRO), pp. 219–235. CABI Publishing,
Wallingford, Oxon.
Hirsh H, Marler T (2002) Damage and recovery of Cycas
micronesica after Typhoon Paka. Biotropica, 34, 598–602.
Huang S, Hsieh HT, Fang K, Chiang YC (2004) Patterns of
genetic variation and demography of Cycas taitungensis in
Taiwan. The Botanical Review, 70, 86–92.
Jianguang X, Shuguang J, Nian L (2005) Genetic variation in
the endemic plant Cycas debaoensis on the basis of ISSR
analysis. Australian Journal of Botany, 53, 141–146.
Jones D (2002) Cycads of the World: Ancient Plants in Today’s
Landscape. Reed New Holland, Sidney.
Jones DL, Lloyd D (1993) Cycads of the World. Smithsonian
Institution Press, Washington, DC.
Jost L (2008) GST and its relatives do not measure
differentiation. Molecular Ecology, 17, 4015–4026.
Kalinowski S (2005) Hp-rare 1.0: A computer program for
performing rarefaction on measures of allelic richness.
Molecular Ecology Notes, 5, 187–189.
Keppel G (2002) Low genetic variation in a Pacific cycad:
conservation concerns for Cycas seemannii (Cycadaceae), pp. 41–
49. Cambridge University Press, Cambridge.
Kramer AT, Havens K (2009) Plant conservation genetics in a
changing world. Trends in Plant Science, 14, 599–607.
Kueffer C, Daehler CC, Torres-Santana CW et al. (2009) A
global comparison of plant invasions on oceanic islands.
Perspectives in Plant Ecology, Evolution and Systematics, 12,
145–161.
Langella O (Populations 1.2.30) http://bioinformatics.org/
~tryphon/populations.
Lin TP, Sun YC, Cheng YP (2000) Low genetic diversity Cycas
taitungensis (Cycadaceae), and endemic species in Taiwan,
revealed by allozyme analysis. Taiwan Journal of Forest
Science, 15, 13–19.
Luikart G, Cornuet JM (1998) Empirical evaluation of a test for
identifying recently bottlenecked populations from allele
frequency data. Conservation Biology, 12, 228–237.
Luikart G, Allendorf FW, Cornuet JM, Sherwin WB (1998)
Distortion of allele frequency distributions provides a test
for recent population bottlenecks. Journal of Heredity, 89, 238.
Luna R, Epperson BK, Oyama K (2007) High levels of genetic
variability and inbreeding in two Neotropical dioecious
palms with contrasting life histories. Heredity, 99, 466–476.
MacArthur RH, Wilson EO (2001) The Theory of Island
Biogeography. Princeton University Press, Princeton, NJ.
Maguire TL, Peakall R, Saenger P (2002) Comparative analysis
of genetic diversity in the mangrove species Avicennia marina
(Forsk.) Vierh. (Avicenniaceae) detected by AFLPs and SSRs.
TAG Theoretical and Applied Genetics, 104, 388–398.
Mamay SH (1969) Cycads: fossil evidence of late paleozoic
origin. Science, 164, 295–296.
Manel S, Schwarts MK, Luikart G, Taberlet P (2003) Landscape
genetics: combining landscape ecology and population
genetics. Trends in Ecology and Evolution, 18, 189–197.
� 2010 Blackwell Publishing Ltd

POPULATION GENETI CS OF CYCAS MICRONESICA 2377
Marler T (2002) Conservation of local genotypes when planting
native plants on Guam. Micronesia Suppl, 6, 55–60.
Marler TE, Lawrence JH (2004) Chemical Limitations of Yoga
Root Growth in an Acid Soil. Micronesica, 37, 157–161.
Marler T, Muniappan R (2006) Pests of Cycas micronesica leaf,
stem, and male reproductive tissues with notes on current
threat status. MICRONESICA-AGANA- 39, 1.
Marler T, Shaw C (2010) Distribution of free and glycosylated
sterols within Cycas micronesica plants. Scientia Horticulturae,
123, 537–542.
Marler TE, dela Cruz R, Blas AL (2002) Iron deficiency
induced changes in iron reductase activity in papaya roots.
J. Amer. Soc. Hort. Sci, 127, 184–187.
Marler TE, Lee V, Shaw CA (2005) Spatial variation of steryl
glucosides in Cycas micronesica plants: within-and among-plant
sampling procedures, pp. 1607–1611. American Society for
Horticultural Science Alexandria, USA.
Marler T, Haynes J, Lindstrom A (2006) Cycas micronesica. In:
IUCN 2006. 2006 IUCN Red List of Threatened Species.
<http://www.iucnredlist.org>.
Marler TE, Lee V, Shaw CA (2007) Habitat heterogeneity
of Cycas micronesica seed chemistry in Guam’s forest.
Micronesica, 39, 297–314.
Meerow AW, Nakamura K (2007) Ten microsatellite loci from
Zamia integrifolia (Zamiaceae). Molecular Ecology Notes, 7,
824–826.
Moynihan J, Meerow AW, Francisco-Ortega J (2007) Isolation,
characterization and cross-species amplification of
microsatellite loci in the cycad genus Dioon (Zamiaceae).
Potential utilization in population genetics studies of Dioon
edule. Molecular Ecology Notes, 7, 72–74.
Muller-Landau H, Wright S, Calderon O, Condit R, Hubbell S
(2008) Interspecific variation in primary seed dispersal in a
tropical forest. Journal of Ecology, 96, 653–667.
Nathan R, Schurr F, Spiegel O et al. (2008) Mechanisms of
long-distance seed dispersal. Trends in Ecol Evol, 23, 638–647.
Nei M (1973) Analysis of gene diversity in subdivided
populations. Proceedings of the National Academy of Sciences,
USA, 70, 3321–3323.
Nei M (1978) Estimation of average heterozygosity and genetic
distance from a small number of individuals. Genetics, 89,
583–590.
Nei M, Tajima F, Tateno Y (1983) Accuracy of estimated
phylogenetic trees from molecular data. Journal of Molecular
Evolution, 19, 153–170.
Nixon K, Crepet W, Stevenson DW, Friis E (1994) A
reevaluation of seed plant phylogeny. Annals of the Missouri
Botanical Garden, 81, 484–583.
Norstog K, Nicholls TJ (1997) The Biology of the Cycads. Cornell
University Press, Ithaca, N.Y.
Norstog KJ (2003) Foreword. In: Cycads: Status, Survey, and
Conservation Action Plan (ed. Donaldson J), pp. 3–8.
IUCN ⁄ SSC, Gland, Switzerland.
Park SDE (2001) Trypanotolerance in West African Cattle and the
Population Genetic Effects of Selection. University of Dublin,
Dublin.
Parmesan C (2006) Ecological and evolutionary responses to
recent climate change. Annual Review of Ecology, Evolution
and Systematics, 37, 637–669.
� 2010 Blackwell Publishing Ltd
Peakall R, Smouse PE (2006) GENALEX 6: genetic analysis in
Excel. Population genetic software for teaching and research.
Molecular Ecology Notes, 6, 288–295.
Peakall R, Smouse PE, Huff DR (1995) Evolutionary
implications of allozyme and RAPD variation in diploid
populations of dioecious buffalograss Buchloe dactyloides.
Molecular Ecology, 4, 135–147.
Pijl VD (1957) The dispersal of plants by bats. Acta Botanica
Neerlandica, 6, 291–315.
Pritchard JK, Stephens M, Donnelly P (2000) Inference of
population structure using multilocus genotype data.
Genetics, 155, 945–959.
Reaser JK, Meyerson LA, Cronk Q et al. (2007) Ecological and
socioeconomic impacts of invasive alien species in island
ecosystems. Environmental Conservation, 34, 98–111.
Rogers RF (1995) Destiny’s Landfall: a History of Guam.
University of Hawaii Press, Honolulu.
Rossetto M, Crayn D, Ford A, Mellick R, Sommerville K (2009)
The influence of environment and life-history traits on the
distribution of genes and individuals: a comparative study.
Molecular Ecology, 18, 1422–1438.
Rousset F (2000) Genetic differentiation between individuals.
Journal of Evolutionary Biology, 13, 58–62.
Rowe G, Beebee JC (2007) Defining population boundaries: Use
of three Bayesian approaches with microsatellite data from
British natterjack toads (Bufo calamita). Molecular Ecology, 16,
785–796.
Schneider D, Wink M, Sporer F, Lounibos P (2002) Cycads:
Their evolution, toxins, herbivores and insect pollinators.
Naturwissenschaften, 89, 281–294.
Seidler T, Plotkin J (2006) Seed dispersal and spatial pattern in
tropical trees. PLoS Biology, 4, e344.
Shapcott A, Playford J (1996) Comparison of genetic variability
in remnant and wide-spread rainforest understorey species
of Austromyrtus (Myrtaceae). Biodiversity and Conservation, 5,
881–895.
Sharma IK, Jones DL, Forster PI, Young AG (1999) Low
isozymic differentiation among five species of the
Macrozamia heteromera group (Zamiaceae). Biochemical
Systematics and Ecology, 27, 67–77.
Sharma IK, Jones DL, Forster PI (2004) Genetic differentiation
and phenetic relatedness among seven species of the
Macrozamia plurinervia complex (Zamiaceae). Biochemical
Systematics and Ecology, 32, 313–327.
Slatkin M (1993) Isolation by distance in equilibrium and
nonequilibrium populations. Evolution, 47, 264–279.
Smouse PE, Long JC (1992) Matrix correlation analysis in
anthropology and genetics. Yearbook of Physical Anthropology,
35, 187–213.
Smouse PE, Peakall R (1999) Spatial autocorrelation analysis of
individual multiallele and multilocus genetic structure.
Heredity, 82, 561–573.
Smouse P, Long JC, Sokal RR (1986) Multiple regression and
correlation extensions of the Mantel test of matrix
correspondence. Systematic Zoology, 35, 627–632.
Snow E, Walter G (2007) Large seeds, extinct vectors and
contemporary ecology: testing dispersal in a locally
distributed cycad, Macrozamia lucida (Cycadales). Australian
Journal of Botany, 55, 592–600.
2378 A. CI BRIAN - JARAMI LLO ET AL.
Sork VL, Smouse PE (2006) Genetic analysis of landscape
connectivity in tree populations. Landscape Ecology, 21, 821–
836.
Sork V, Naso J, Campbel DR, Fernandez J (1999) Landscape
approaches to historical and contemporary gene flow in
plants. Trends in Ecology & Evolution, 14, 219–224.
Spencer PS, Hunn PB, Nugon J et al. (1987) Guam amyotrophic
lateral sclerosis-Parkinsonism-dimentia linked to a plant
excitant neurotoxin. Science, 237, 517–522.
Spoehr A (1955) The human background of Pacific science.
Science Monthly, 81, 3–9.
Steele J, McGeer P (2008) The ALS ⁄ PDC syndrome of Guam
and the cycad hypothesis. Journal of Neurology, 70, 1984.
Stevenson D (1990) Morphology and systematics of the
Cycadales. Memoirs New York Botanical Garden, 57, 8–55.
Storz JF, Beaumont MA (2002) Testing for genetic evidence of
population expansion and contraction: an empirical analysis
of microsatellite DNA variation using a hierarchical Bayesian
model. Evolution, 56, 154–166.
Taylor TN, Taylor EL (1993) The Biology and Evolution of Fossil
Plants. Prentice–Hall, New Jersey.
Terry I (2001) Thrips and weevils as dual, specialist pollinators
of the Australian cycad Macrozamia communis (Zamiaceae).
International Journal of Plant Science, 162, 1294–1305.
Terry I, Roe M, Tang W, Marler T (2009) Cone insects and
putative pollen vectors of the endangered cycad, Cycas
micronesica. Micronesica, 41, 83–99.
Van Oosterhout C, Hutchinson WF, Wills DP, Shipley P (2004)
PROGRAM NOTE: micro-checker: software for identifying
and correcting genotyping errors in microsatellite data.
Molecular Ecology Notes, 4, 535–538.
Walters T, Decker-Walters D (1991) Patterns of allozyme
diversity in the West Indian cycad Zamia pumila (Zamiaceae).
American Journal of Botany, 78, 436–449.
Weir BS (1996) Genetic Data Analysis II: Methods for Discrete
Population Genetic Data. Sinauer Associates, Sunderland,
Massachusetts.
Weir BS, Cockerham CC (1984) Estimating F-Statistics for the
analysis of population structure. Evolution, 38, 1358–1370.
Whiting MG (1963) Toxicity of cycads. Economic Botany, 17,
271–302.
Wiles GJ, Johnson NC (2004) Population size and natural
history of Mariana fruit bats (Chiroptera: Pteropodidae) on
Sarigan, Mariana Islands. Pacific Science, 58, 585–596.
Wilson G, Rannala B (2003) Bayesian inference of recent
migration rates using multilocus genotypes. Genetics, 163,
1177–1191.
Wolfgang Bruggemann PRM (1989) NADH-dependent
Fe3 + EDTA and oxygen reduction by plasma
membrane vesicles from barley roots. Physiologia Plantarum,
75, 245–254.
Wright S (1951) The genetical structure of populations. Annals
of Eugenics, 15, 323–354.
Xiao LQ, Gong XUN (2006) Genetic differentiation and
relationships of populations in the Cycas balansae complex
(Cycadaceae) and its conservation implications. Annals of
Botany, 97, 807–812.
Xiao LQ, Ge X, Gong XUN, Hao G, Zheng SIX (2004)
ISSR variation in the endemic and endangered plant
Cycas guizhouensis (Cycadaceae). Annals of Botany, 94, 133–
138.
Yang SL, Meerow AW (1996) The Cycas pectinata (Cycadaceae)
complex: genetic structure and gene flow. International
Journal of Plant Sciences, 157, 468–483.
Young F (1988) Soil survey of territory of Guam. Report to the
US Department of Agriculture Soil Conservation Service.
Angelica Cibrian-Jaramillo is the joint American Museum of
Natural History and The New York Botanical Garden Lewis
Cullman Fellow and is interested in the genetic and genomic
basis of plant diversity from a population and phylogenetic
perspective, focusing on endangered species of palms and
cycads distributed throughout Mesoamerican and Pacific
tropical forests.
Aidan C. Daly is interested in the intersection of computer
science and evolutionary biology and is currently at Harvard
University.
Eric Brenner is interested in plant genomics, molecular genetics
and development, and is currently a clinical professor at New
York University.
Rob DeSalle is a curator and professor at the American
Museum of Natural History working on molecular systematics,
molecular evolution, population and conservation genetics, and
evolutionary genomics of a wide array of life forms ranging
from viruses, bacteria, corals and plants, to all kinds of insects,
reptiles, and mammals. He is also an adjunct professor at
Adjunct Professor at Columbia University and City University
of New York, Distinguished Professor in Residence at New
York University.
Thomas E. Marler is a professor with the Western Pacific Tro-
pical Research Center in the College of Natural and Applied
Sciences at the University of Guam, where he conducts
research on the horticultural practices on Guam, and in envir-
onmental plant physiology in relation to the typical abiotic
stresses of the Mariana Islands, and conservation of threatened
plant taxa in the Mariana Islands.
Supporting Information
Additional supporting information may be found in the online
version of this article.
Table S1 Sample size and levels of heterozygosity across popu-
lations. HE, average expected heterozygosity; HO, average
observed heterozygosity; N, sample size. Estimates of genetic
variation
Table S2 Pairwise population Fst (via frequency) values for all
localities
Fig. S1 The number 14 indicates all loci included in the analy-
sis, 10 only includes neutral loci (loci 224, 250, 268, 270
excluded). HE, unbiased expected heterozygosity. HO, observed
heterozygosity; Na, average number of alleles.
Fig. S2 Most likely number of clusters estimated using STRUC-
TURE. Shown is the coefficient of membership for individuals
assigned to K = 5, 8, 18 and 24 clusters.
� 2010 Blackwell Publishing Ltd

POPULATION GENETI CS OF CYCAS MICRONESICA 2379
Fig. S3 Comparison of self-recruitment rates from genetic pop-
ulations. The influence of each locality on self-recruitment rates
of others. Shown is the difference between the self-recruitment
rates of the remaining localities when omitting one locality
(jackknifing, mean variance).
Fig. S4 Test for recent population bottlenecks based on distor-
tion of allele frequency distribution. There is no evidence of a
recent population bottleneck in any of the sampling localities.
� 2010 Blackwell Publishing Ltd
Please note: Wiley-Blackwell are not responsible for the content
or functionality of any supporting information supplied by the
authors. Any queries (other than missing material) should be
directed to the corresponding author for the article.