Embed Size (px)
Citation preview

WHEN PROBLEMS OCCUR IN WAREHOUSE OPERATIONS:
REENGINEERING IS OFTEN DONELAYOUT PROJECTS ARE COMMENCED
WITH NO IDEA OF THE ROOT CAUSE OF THE PROBLEMS DUE TO:
LACK OF KNOWLEDGELACK OF TOOLSLACK OF TIME
Investigating Warehouse Operations Chapter 2
Activity Profiling: Mining For Gold

Warehouse Activity Profiling
Systematic analysis of item activity & order activity
Profiling is designed to readily identify root causes Of material flow problems Of information flow problems
Pinpoint opportunities for process improvementProvide an objective basis for decision making

Advantages of Profiling
Can Quickly Reveal: Design and Planning Opportunities Correct Baseline for Justifying New Investments People Feel a Sense of Involvement
Picture is Worth a 1000 Words Capture the activities of the warehouse in pictorial
form

CAUTION
Don’t get stuck on Analysis Paralysis Profiling becomes the goal Forget to solve the problems

7 Key Planning & Design Issues
1. Order Picking & Shipping2. Receiving & Put-away3. Slotting4. Material Transportation System5. Layout & Material Flow6. Warehouse Sizing7. Level of automation & Staffing

Picking & Shipping
Order Batch Size
Pick Wave Planning
Picking Tour Construction
Shipping Mode Disposition

Receiving & Put-away
Receiving Mode Disposition
Put-away Batch Sizing
Put-away Tour Construction

Slotting
Zone Definition
Storage Mode Selection & Sizing
Pick Face Sizing
Location Assignments

Material Transportation System
System Selection
System Size

Warehouse Layout & Material Flow
Overall Warehouse Flow
Relative Functional Locations
Building Configuration

Warehouse Sizing
Space Requirements

Level of Automation
Staffing Requirements
Capital-Labor Substitution
Level of Mechanization

What do Customers Want?
their orders filled
Some customers are High Demand Use a large portion of warehouse activity Have high customer service requirements
May dedicate a portion of the warehouse to that customer or business unit 3rd Party Providers dedicate aisles to a customer Contract Warehouses have complete support to a
customer
Warehouse within a Warehouse

Advantages of a Warehouse within a Warehouse
Smaller warehouses are more efficient
Provide better customer service
Can sub-divide the warehouse into self-contained processing units (ie: Divide & Conquer)

Types of Profiles: Customer Order Profile
Order mix distributions
Lines/Order distribution
Cubes/Order distribution
Lines & Cubes/ Order distribution

Order Mix Distribution
There are several order mix distributions that are helpful in plotting warehouse operating strategies.
Family Mix – overall warehouse operating strategy is dictated by order mix If Pure - (orders tend to be from one Product Family)
indicates an advantage of virtual warehousing within a warehouse
Results in good productivity & customer service

Family Mix Distribution
35% 25% 15% 5% 5% 5% 10%
A Only B Only C Only A & B A & C B & C A, B & C
35
15
5 5 5
10
25
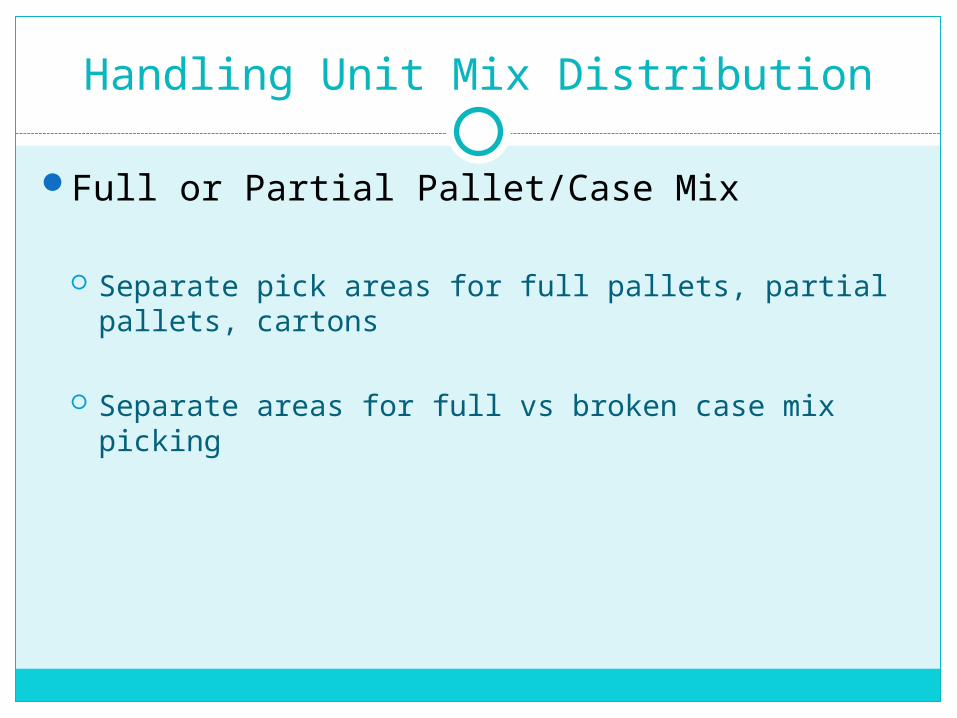
Handling Unit Mix Distribution
Full or Partial Pallet/Case Mix
Separate pick areas for full pallets, partial pallets, cartons
Separate areas for full vs broken case mix picking

Handling Unit Mix Distribution
% of Orders
50 30 20 55 25 20
% of lines 75 10 15 60 30 10
Loose carton
Full pallet
Mixed Broken Case
Full Case
Mixed

Order Increment Distribution
Determine portion of full unit load (pallets, cartons)
vs partial unit loads (½ pallet, ¼ pallet)
Build partial unit loads: At the supplier, if possible Upon receipt in necessary
Storage space may be sacrificed

Order Increment Distribution %
of
ord
er
lin
es

Lines/Order Distribution%
of
ord
ers

Lines & Cubes Per Order Distribution
Lines per
Cubes per Order (ft3)Totals
% Total %
Order 0-1 1-2 2-5 5-10 10-20 20+ Orders Lines Lines
1 176 15 16 7 3 3 220 49% 220 17%
2 - 5 100 24 27 15 10 2 178 40% 623 47%
6 - 9 8 6 6 6 4 3 33 7% 248 19%
10+ 2 1 1 6 4 1 15 3% 225 17%
Totals 286 46 50 34 21 9 446 100% 1316 100%
% Orders
64% 10% 11% 8% 5% 2% 100%
Total Cube
143 69 175 255 315 270 1227

Purchase Order Profile
For inbound material vice outbound material
Use same distribution analyses as for outbound profiling
Supports the same batching and processing strategies for receiving and putaway
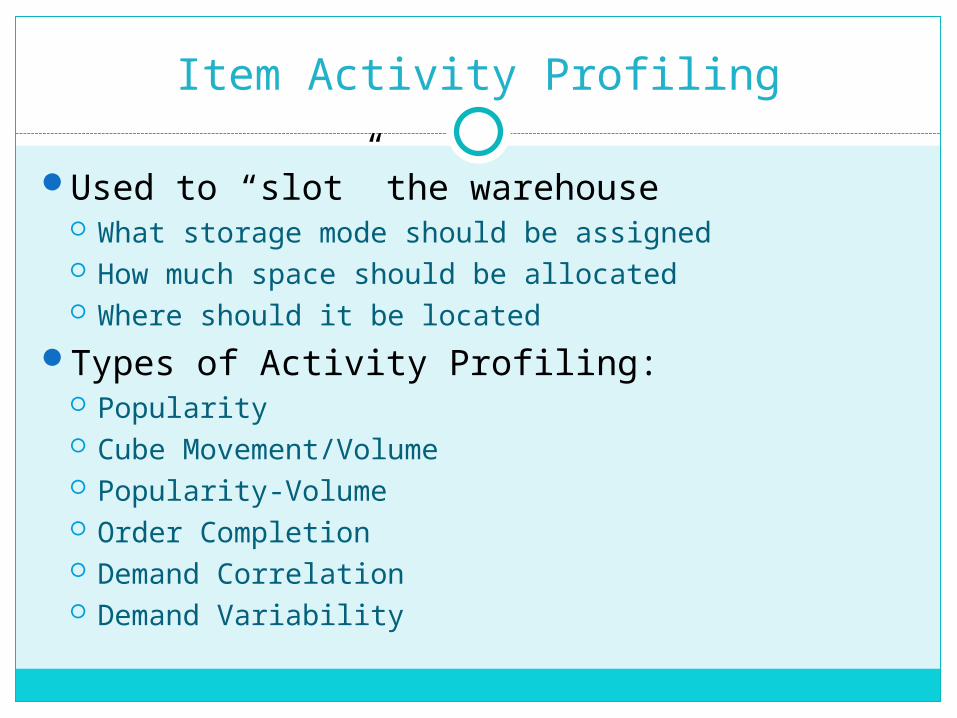
Item Activity Profiling
Used to “slot” the warehouse What storage mode should be assigned How much space should be allocated Where should it be located
Types of Activity Profiling: Popularity Cube Movement/Volume Popularity-Volume Order Completion Demand Correlation Demand Variability

Item Popularity Distribution
Close to the door/Close to the floor Minority of items generate majority of the picks
Uses Pareto Analysis or ABC Analysis A – automated-highly productive storage mode Golden Zone – close to aisle – at or near waist high B – semi-automatic – moderately productive
storage/picking modeSilver Zone – next most readily accessible C – manual – offers high density storage

Item Popularity Distribution
Popularity may be based on:
Dollars of Sales
Volume
# of Requests

Cube Movement / Month%
of
Item
s

Popularity-Cube Movement Mix
High Popularity-High Cube: Uses carton flow racks located for ease of
replenishment
High Popularity-Low Cube: Many picks / unit of space – use light directed
carousels (carousels are not easy to restock, are expensive per foot of storage)
Low Popularity – Low Cube: Lends itself to bin storage
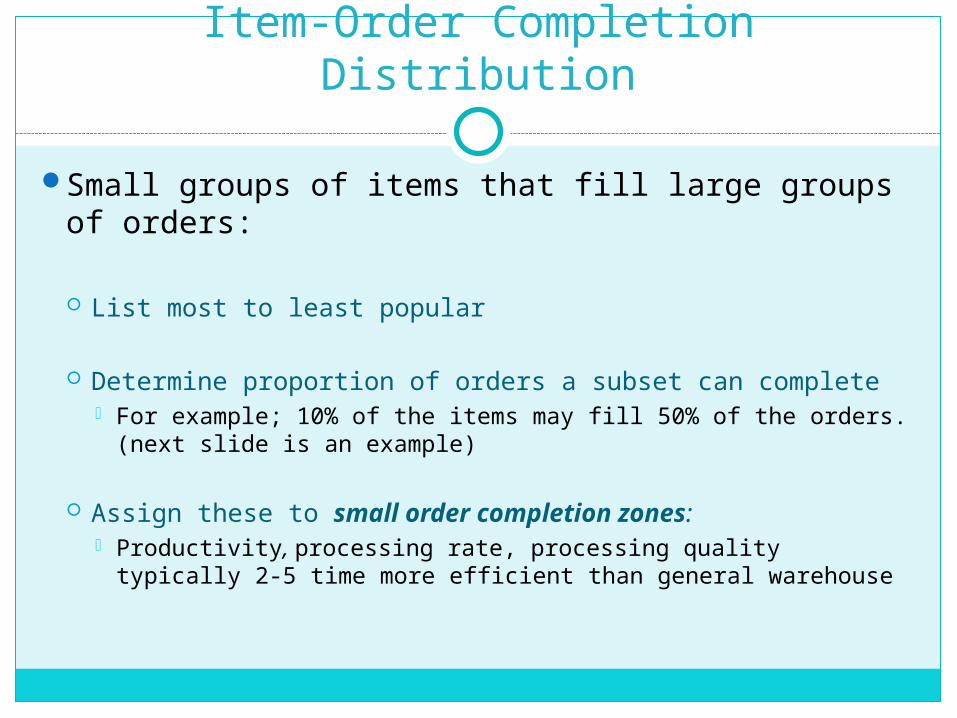
Item-Order Completion Distribution
Small groups of items that fill large groups of orders:
List most to least popular
Determine proportion of orders a subset can complete For example; 10% of the items may fill 50% of the orders.
(next slide is an example)
Assign these to small order completion zones: Productivity, processing rate, processing quality typically
2-5 time more efficient than general warehouse

Item-Order Completion Distribution
50% of the orders are completed by 10% of the items

Demand Correlation Distribution
Identify relationship (affinity) of demand between individual items or families.
Determined based on frequency of being requested together on orders Often based on same style or size Sometime complementary items such as shoes &
purse
This data can be used when slotting the warehouse to minimize movement when filling orders.

Demand Correlation Distribution
Item Number Item Number Pair Frequency
189-2-4 189-2-1 58
493-2-1 493-2-8 45
007-3-3 007-3-2 36
119-2-1 119-2-7 30
999-1-8 999-1-6 22
207-4-2 207-4-4 15
662-1-9 662-1-1 12
339-7-4 879-2-8 9
112-3-8 112-3-4 6