Embed Size (px)
Citation preview

Which Came First? The Dashboard or the Population?Laia Tiderman, MLDSCAnn T. Kellogg, MLDSC
2017 NCES STATS-DC Data Conference
August 3, 2017
https://mldscenter.maryland.gov/

Agenda Overview of MLDSC Purpose for project Evolution of project Current status Feedback from you!
2

About the Center
3
Maryland’sP20W System
Independent State Agency with a Governing Board
Centralized SLDS system

MLDS Data O
verview
4
Data provided by Maryland Partner Agencies

Cross-Sector Analysis
5
Focus on what happens to students before and after critical transitions
Single agency research restriction All research must
be cross-sector utilizing data from a minimum of two agencies

Output Goals vs Staff Capacity
6
MLDSC
Dashboards and Other
Output
Data Requests
Research Reports
Legislative Requests
Annual Reports

Is there a better way?
7
Data and Legislative Requests• Repeat requests for
similar data
Reports• Recurring annual
Dashboard Development• Expanding content• Adding new years of
data
Limited Resources (Time and Staff)

Couture vs. Ready-Made?Gourmet vs. Fast Food?
Define Unique Populations
Pro: Focus in on specific groups defined by specific attributes
Con: Extends production time by requiring populations to be built each time before analysis
Pre-define Key Populations
Pro: Pre-defined populations already established, streamlines production and analysis
Con: May exclude observations and reduce completeness of results
8

First Step . . . Sorting Populations
9
What are the characteristics of the populations that are of interest?
Is there a logical way to organize demographic variables, academic indicators, and outcomes?
Time.com; June 26, 2017The Ultimate Harry Potter Quiz: Find Out Which House You Truly Belong In

Identified Major Sector TransitionsEarly
Childhood to Primary
High School to College
High School to Workforce
High School to Workforce to
College
College to Workforce

What do we want to know about the transitions between sectors?
High School to College Transitions
Who goes to
college?
Where do they go?
When do they go?
What degrees do they pursue and at what rate?
How long do they study?

What do we want to know about the who, what, where, when, etc. within a transition?
Who goes to college from High School?
Gender Race/ Ethnicity Age FARMS
High School Completion
Type
LEA/ District
Other Characteristics
(AP, Dual Enrollment,
etc.)

Can we account for everyone? Who gets lost?
13

Can we account for everyone? Who gets lost?
14
High School to College Transition Open Items
Who goes to college?• None
Where do they go?• What about out-of-
state students• What about
transfers-in?• What if student is
concurrently enrolled at two or more colleges?
• IF out-of-state is 1st
initial, do we count in-state as “initial” too?
When do they go?• What intervals
matter?• Do we only
consider data points against “initial enrollment”? What about change of majors?
• What about students who leave and return?
What degrees do they pursue?• Do we use major
categories –Undergraduate vs Graduate?
• Degree types –Associates, Bachelors, etc.?
• Degrees – BBA, BFA, BS, etc.?
How long do they study?• Is transferring an
outcome? • How do we count
stop-out period for students who return and graduate?

Stakeholder Engagement Reviewed preliminary plans Solicited feedback on
Common nomenclature Align to agency reporting Completeness Hierarchy Level of detail
Output capacity Shifting staff focus to data organize rather than output
production
15

Pilot PhasePilot 1
Selected one population of interest Could we identify everyone? How long would it take? What decisions needed to be
made? How could those decisions be documented?
How could we validate our results?
How could we document the limitations on the population we’ve identified?
Pilot 2 A fortunate opportunity . . . A data request on high
school graduates who completed a career and technical program
Repeated population exercise
Then. . . Could the population be used
to answer the data request? Were there gaps? Was this faster?
16
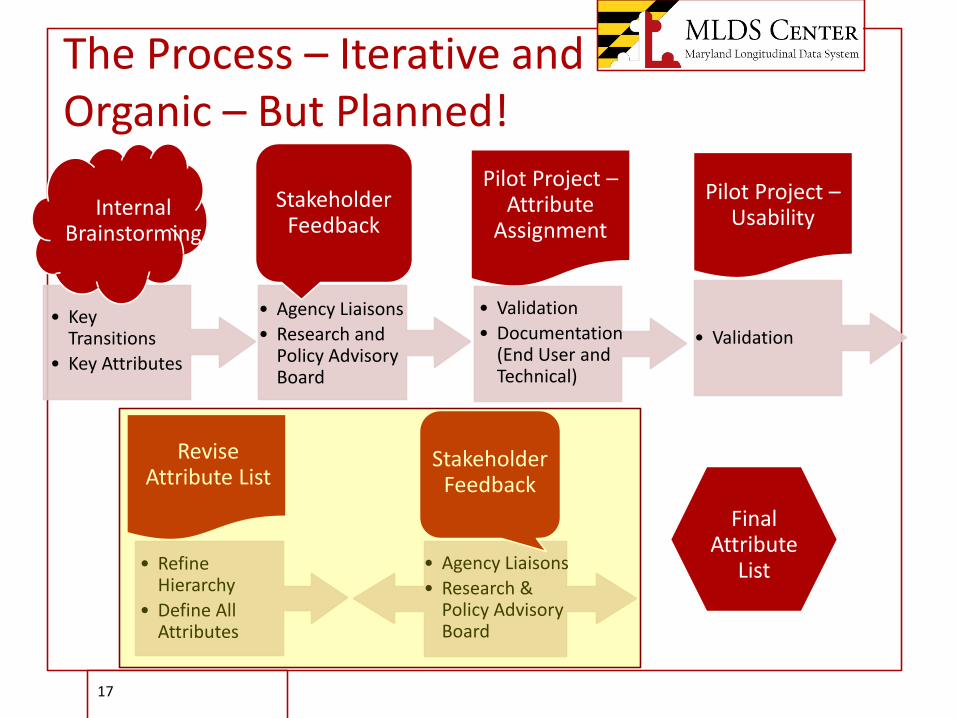
The Process – Iterative and Organic – But Planned!
17
Final Attribute
List
Internal Brainstorming
Stakeholder Feedback
Pilot Project –Attribute
Assignment
• Key Transitions
• Key Attributes
• Agency Liaisons• Research and
Policy Advisory Board
• Validation• Documentation
(End User and Technical)
Pilot Project –Usability
• Validation
• Refine Hierarchy
• Define All Attributes
Revise Attribute List
• Agency Liaisons• Research &
Policy Advisory Board
Stakeholder Feedback

Hierarchy How can we structure for data we have and data we
may some day get? Can structures be parallel across all agencies? When it is too much? What is the right number of
attributes? How deep do we go?
18

Hierarchy – Select Examples
19
Agency Sector Sub-Sector CategorySub-category Attribute
Sub-Attribute
MDSE PreK-12
Secondary Education (9th-12th)
Cohort Types
Exiters by Academic Year 9th Grade None
MDSE PreK-12
Secondary Education (9th-12th)
Cohort Types
Exiters by Academic Year 10th Grade None
MHECPostsecondary Education
Postsecondary Degree Seeking Students
Cohort Types
Initial Enrollment
Fall after secondary outcome None
MHECPostsecondary Education
Postsecondary Degree Seeking Students
Enrollment Attributes
Academic Level Undergraduate Bachelor's
DLLR WorkforceLabor and UI Wage Data Wage Data
Quarterly earnings <=$7500 None

Roundtables
20
Pick a sub-sector Review population
attribute map What’s missing? What’s weedy?
What about PreK? K-8th? We haven’t started . . .
College
Workforce
9th to 12th

Discussion & Questions
21

AcknowledgementWe are grateful for the data, technical, and research support provided by the MLDS Center and its agency partners. The views and opinions expressed are those of the authors and do not necessarily represent the views of the MLDS Center or its agency partners. The MLDS Center is an independent agency of the State of Maryland. The mission of the Center is to develop and maintain the Maryland Longitudinal Data System in order to provide analyses, produce relevant information, and inform choices to improve student and workforce outcomes in the State of Maryland.