Embed Size (px)
Citation preview
DMD #50278
1
Which Metabolites Circulate?
Cho-Ming Loi, Dennis A. Smith and Deepak Dalvie
Pharmacokinetics, Dynamics, and Metabolism, Pfizer Worldwide Research and Development,
San Diego, CA 92121 (CML, DD); Honary Professor, Department of Chemistry, University of
Capetown, South Africa, Visiting Professor, Institute of Translational Medicine, University of
Liverpool, UK (DAS)
DMD Fast Forward. Published on March 1, 2013 as doi:10.1124/dmd.112.050278
Copyright 2013 by the American Society for Pharmacology and Experimental Therapeutics.
This article has not been copyedited and formatted. The final version may differ from this version.DMD Fast Forward. Published on March 1, 2013 as DOI: 10.1124/dmd.112.050278
at ASPE
T Journals on February 13, 2019
dmd.aspetjournals.org
Dow
nloaded from
DMD #50278
2
Running Title: Which Metabolites Circulate?
Corresponding Author: Cho-Ming Loi
Address: Pfizer, Inc., 10646 Science Center Drive, San Diego, CA 92121
Telephone: (858)622-7361
E-Mail address: [email protected]
Number of Text Pages: 38
Number of Tables: 7
Number of Figures: 7
Number of word in the Abstract: 247
This article has not been copyedited and formatted. The final version may differ from this version.DMD Fast Forward. Published on March 1, 2013 as DOI: 10.1124/dmd.112.050278
at ASPE
T Journals on February 13, 2019
dmd.aspetjournals.org
Dow
nloaded from
DMD #50278
3
Non-standard Abbreviations:
ADME: Absorption, distribution, metabolism, excretion
AUC: Area-under-the concentration time curve
AUCm: Area-under-the concentration time curve for a metabolite
BSEP: Bile salt export pump
CLf : Formation clearance of metabolite
CLm : Elimination clearance of metabolite
CLparent : Clearance of parent drug
CLs = Total systemic clearance
CLR, U = Unbound renal clearance
CLNR, U = Unbound non-renal (hepato-biliary) clearance
CYP: Cytochrome P450
DDI: Drug-drug interactions
EM: Extensive metabolizer
EMA: European Medicines Agency
Fa : Fraction of dose absorbed after oral administration
FDA: Food and Drug Administration
Fh,m : Systemic availability of the metabolite
fm : Fraction of dose converted to a given metabolite from the parent
fp : Lipoidal permeability
MIST: Drug metabolites in safety testing
M/P ratio: Relative abundance of metabolite to parent based on the ratio of plasma/serum AUC values
MRP: Multidrug resistance protein
MRP2: Multidrug resistance protein 2
This article has not been copyedited and formatted. The final version may differ from this version.DMD Fast Forward. Published on March 1, 2013 as DOI: 10.1124/dmd.112.050278
at ASPE
T Journals on February 13, 2019
dmd.aspetjournals.org
Dow
nloaded from
DMD #50278
4
MRP3: Multidrug resistance protein 3
PAPS: 3'-phosphoadenosine 5'-phosphosulfate
PM: Poor metabolizer
tPSA: Topological polar surface area
UDPGA: Uridine 5'-diphospho-glucuronic acid
UGT: Uridine diphosphate glucuronosyltransferase
UM: Ultra rapid metabolizer
This article has not been copyedited and formatted. The final version may differ from this version.DMD Fast Forward. Published on March 1, 2013 as DOI: 10.1124/dmd.112.050278
at ASPE
T Journals on February 13, 2019
dmd.aspetjournals.org
Dow
nloaded from
DMD #50278
5
Abstract
Characterization of the circulating metabolites for a new chemical entity in humans is essential
for safety assessment, an understanding of their contributions to pharmacologic activities, and
their potential involvement in drug-drug interactions (DDI). This review examines the
abundance of metabolites relative to the total parent drug (M/P ratio) from 125 drugs in relation
to their structural and physicochemical characteristics, lipoidal permeability, protein binding, and
fractional formation from parent (fm). Our analysis suggests that fm is the major determinant of
total drug M/P ratio for amine, alcohol, N- and S-oxide, and carboxylic acid metabolites.
Passage from the hepatocyte to systemic circulation does not appear to be limiting owing to the
vast majority of metabolites formed being relatively lipid permeable. In some cases, active
transport plays an important role in this process (e.g., carboxylic acid metabolites). Differences
in total parent drug clearance and metabolite clearance are attenuated by the reduction in
lipophilicty introduced by the metabolic step and resultant compensatory changes in unbound
clearance and protein binding. A small sub-class of these drugs (e.g. terfenadine) are
unintentional pro-drugs with very high parent drug clearance resulting in very high M/P ratios.
In contrast, arenol metabolites show a more complex relationship with fm due largely to the new
metabolic routes (conjugation) available to the metabolite compared to the parent drug molecule.
For these metabolites, a more thorough understanding of the elimination clearance of the
metabolite is critical to discern the likelihood of whether the phenol will constitute a major
circulating metabolite.
This article has not been copyedited and formatted. The final version may differ from this version.DMD Fast Forward. Published on March 1, 2013 as DOI: 10.1124/dmd.112.050278
at ASPE
T Journals on February 13, 2019
dmd.aspetjournals.org
Dow
nloaded from
DMD #50278
6
1. Introduction
An early understanding of the key metabolites for a new chemical entity is important in
drug discovery and development. At the lead optimization stage, this can help to support
medicinal chemistry efforts in designing more metabolically stable candidates via identification
of soft spots in lead candidates that are rapidly cleared (Lin and Lu, 1997; Baillie, 2008). From a
development perspective, characterization of metabolites provides a systematic understanding of
the metabolic pathways of a drug and therefore the enzymes that are involved in their formation.
This can aide in the proper design of drug-drug interaction (DDI) studies to evaluate the impact
of inhibition or induction of the metabolic enzyme(s) contributing to the major pathway of
clearance on systemic drug exposure. Assessment of circulating metabolites in humans also
contributes to an overall understanding of their potential impact on the safety and efficacy of a
drug. From a safety point of view, an effort towards gathering knowledge of the in vivo
metabolic profile of a drug in humans has gained more importance since the publication of
position papers on drug metabolites in safety testing (MIST) as well as recently issued ICH
Guidance M3(R2) on nonclinical safety studies for the conduct of human clinical trials and
marketing authorization for pharmaceuticals (FDA guidance;
http://www.fda.gov/downloads/Drugs/GuidanceComplianceRegulatoryInformation/Guidances/U
CM073246.pdf); (Davis-Bruno and Atrakchi, 2006; Nedderman et al., 2011). This guidance
recommends that nonclinical safety evaluation is warranted if the exposure of a human
circulating metabolite is observed at greater than 10% of the total drug-related exposure and at
significantly greater levels in humans than the maximum exposure seen in the toxicity studies.
Assessment of circulating metabolites in humans is also essential for a comprehensive
understanding of their contributions to pharmacologic activities. Structural alteration of drugs
This article has not been copyedited and formatted. The final version may differ from this version.DMD Fast Forward. Published on March 1, 2013 as DOI: 10.1124/dmd.112.050278
at ASPE
T Journals on February 13, 2019
dmd.aspetjournals.org
Dow
nloaded from
DMD #50278
7
via metabolism can sometimes lead to products that contribute to the therapeutic effect of the
drug (on target activity) or cause an undesirable effect as a consequence of off-target activity
(Fura, 2006). More recently, efforts have been directed in evaluating the potential involvement
of metabolites in inhibitory DDI. Several clinically important drugs (especially clinically
recognized CYP inhibitors) have been shown to have circulating metabolites that act as potent
inhibitors of CYP enzymes and therefore contribute to in vivo DDIs (Isoherranen et al., 2009;
Yeung et al., 2011). The most recent guidance by the European Medicines Agency (EMA) and
US Food and Drug Administration (FDA) also suggest evaluation of potential inhibitory effect of
metabolites on the common drug metabolizing enzymes. These guidances recommend that
circulating metabolite with an AUC of ≥25% relative to parent AUC (Draft FDA Guidance;
http://www.fda.gov/downloads/Drugs/GuidanceComplianceRegulatoryInformation/Guidances/U
CM292362.pdf) and phase 1 metabolites with an AUC both larger than one fourth of the AUC of
parent drug and larger than 10% of the drug-related exposure (EMA Guidance;
http://www.ema.europa.eu/docs/en_GB/document_library/Scientific_guideline/2012/07/WC500
129606.pdf) should be investigated for their inhibitory potential. These recommendations
necessitate characterization and quantification of the metabolites in plasma early on to allow a
full assessment of their contributions to the pharmacological or toxicological effects and DDI
potential.
In most cases, principal metabolites are identified by performing radiolabeled ADME
studies where 14C or 3H analogs of the drugs are administered to humans (Roffey et al., 2007;
Isin et al., 2012; Penner et al., 2012). The biological matrices collected from this study are then
analyzed to yield a quantitative profile of metabolites in circulation or in the excreta. While the
This article has not been copyedited and formatted. The final version may differ from this version.DMD Fast Forward. Published on March 1, 2013 as DOI: 10.1124/dmd.112.050278
at ASPE
T Journals on February 13, 2019
dmd.aspetjournals.org
Dow
nloaded from
DMD #50278
8
abundance of metabolites in the excreta provides a means of assessing the clearance pathways
and the fraction of the drug metabolized via a given pathway (fm), the exposure of metabolites in
plasma obtained from this study serves as a starting point for prioritizing their further evaluation.
The major metabolites are then synthesized and evaluated for pharmacological on-target and off-
target interactions that may result in unpredicted toxicity or DDI. However, radiolabeled ADME
studies in humans are expensive and resource-intensive and hence, not routinely feasible in early
development. This can hinder the knowledge about relevant circulating plasma metabolites and
hence their evaluation in a timely manner. Hence, until definitive data are obtained from human
studies, one may need to rely on the in vitro systems for an assessment of potential metabolites
that are generated. Human-derived reagents such as the liver microsomes, hepatocytes or S9
fractions, are the commonly used in vitro systems to study human drug metabolism and identify
the principal metabolites, preferably prior to the human radiolabel ADME study (Dalvie et al.,
2009). A comprehensive analysis of these in vitro systems by Dalvie and co-workers provide
sufficient confidence in using these systems to reliably produce primary human metabolites
(Dalvie et al., 2009). Although primary human metabolites can be predicted readily by in vitro
systems, it is important to understand which metabolites formed in these systems are likely to
circulate in vivo. This can help in prioritizing the synthesis of important metabolites for further
characterization with respect to their pharmacological activity and/or their role as inhibitors or
inducers of important drug metabolizing enzymes.
Smith and Dalvie have recently attempted to analyze the influence of physicochemical
properties on the metabolites that circulate. This review showed that metabolites with high
lipoidal permeability will passively diffuse from liver to plasma and circulate (Smith and Dalvie,
This article has not been copyedited and formatted. The final version may differ from this version.DMD Fast Forward. Published on March 1, 2013 as DOI: 10.1124/dmd.112.050278
at ASPE
T Journals on February 13, 2019
dmd.aspetjournals.org
Dow
nloaded from
DMD #50278
9
2012). The aim of the current analysis was to extend this investigation and explore how the
structures of the metabolite (e.g., amines, alcohols, etc.) and their associated physicochemical
properties, as well as the fraction of dose converted to a given metabolite from the parent (fm)
may influence their abundance in circulation.
We conducted a literature review to collect data on the plasma or serum area-under-the
concentration time curve (AUC) values from 125 drugs and their metabolites after oral
administration of single or multiple doses of the parent, and then determine the relative
abundance of metabolite to parent based on the ratio of plasma/serum AUC values (M/P ratio).
Although several secondary and tertiary metabolites were detected circulating for several drugs,
no attempt was made to classify and categorize these metabolites separately. In the vast majority
of cases, the ratio of plasma or serum AUC of the metabolite to the corresponding parent was
used, although in a few cases (as indicated by the asterisk in Tables 1-6), single time-point
concentrations were used due to paucity of the overall AUC data. In a few cases (clozapine,
dextromethorphan, dothiepin, flecainide, and zolpiclone) where plasma concentration-time
profiles were presented in the publication but the AUC values were not calculated, the data were
captured using the software DigitizeIt version 1.5 (Eden Prairie, MN) and the AUC values were
calculated by noncompartmental analysis using WinNonlin version 5.2 (Pharsight Corp., Cary,
NC). The M/P ratio for these metabolites was then matched with the structure and
physicochemical properties of the corresponding parent and metabolite pair to discern any
possible relationship between the two. The physicochemical properties for the parent and
metabolites were calculated using the ACD software version 12.01 (ACD Labs, Advanced
Chemistry Development Inc., Toronto, Ontario, Canada), and the chemical structures of the
This article has not been copyedited and formatted. The final version may differ from this version.DMD Fast Forward. Published on March 1, 2013 as DOI: 10.1124/dmd.112.050278
at ASPE
T Journals on February 13, 2019
dmd.aspetjournals.org
Dow
nloaded from
DMD #50278
10
parent and corresponding metabolites are shown in the Supplementary file (SuppTable 1-6). In
addition, where data exists, information on the fm value was also estimated from the published
human radiolabeled ADME studies. The fraction of dose for the metabolite of interest and its
sequential metabolic products recovered in excreta (both urine and feces) was assumed to be
representative of the in vivo fm value. An analysis was conducted in an attempt to identify
parameter values for the physicochemical properties and fm that are associated with metabolites
considered to have met the criteria for follow-up DDI evaluations according to the regulatory
guidance.
2. Theoretical Considerations of Determining In Vivo Metabolite Exposure
Theoretical models related to metabolite kinetics after oral or intravenous administration
of the parent drug have been described extensively (Houston, 1982; Lutz et al., 2010) and will
only be discussed briefly in this review. In vivo, a metabolite can display either a formation-rate
limited or an elimination-rate limited kinetics. In the former case, the half-life of the terminal
elimination phase of a metabolite plasma/serum concentration versus time curve will be equal to
that of the parent drug; while in the latter case, the half-life of the terminal elimination phase of
the metabolite will be greater than that of the parent. Most assessment of circulating
concentrations of drugs and their metabolites are made without reference to protein binding,
certainly historically and also at the initial profiling and identification stage of drug discovery
and development. Regulatory guidelines reflect this in that the identification of “major”
metabolite rely on total concentration compared to parent or drug-derived moieties, although
there is recognition that certain metabolites may have very different binding characteristics to
their parent. In order to understand the dynamics of metabolites, protein binding must be
This article has not been copyedited and formatted. The final version may differ from this version.DMD Fast Forward. Published on March 1, 2013 as DOI: 10.1124/dmd.112.050278
at ASPE
T Journals on February 13, 2019
dmd.aspetjournals.org
Dow
nloaded from
DMD #50278
11
measured to derive unbound concentrations. This is reinforced by the tendency for a reduced
lipophilicity for the metabolite, which may increase the fraction unbound and lowers unbound
clearance leading to disproportionate concentrations of unbound metabolite compared to
unbound concentrations of parent. Unfortunately, protein binding data is lacking in many cases
to provide more sophisticated analysis. In terms of the effects of changes in chemical structures
and how they may impact the ratio of total drug to metabolite, the influence of protein binding
may be attenuated. Most metabolic steps typically result in reduced lipophilicity, which will
tend to decrease protein binding (or increase fraction unbound) and intrinsic metabolic clearance
(unless the metabolic step introduces a route by which the parent cannot be metabolized),
thereby attenuating the effect on the difference between parent and metabolite clearance (See
Section 9.3). Similarly, the lowered lipophilicity will tend to decrease tissue or membrane
affinity, which will be compensated for by the increased free fraction in plasma, thereby
attenuating the effects on total volume of distribution. Thus, the ratio of total parent to
metabolite is probably more sensitive to other factors as detailed below.
The systemic exposure (total, bound plus free), as represented by the AUC of a
metabolite (AUCm), will be dependent on the dose of the parent drug (D), the fraction of dose
absorbed (after oral administration, Fa), the fraction of the absorbed drug dose that is converted
to the metabolite (fm), the systemic availability of the metabolite (Fh,m), and the clearance of the
metabolite (CLm), i.e., AUCm = (fm • Fh,m • Fa • D) / CLm (Houston, 1982). As illustrated in
Figure 1, the systemic availability of a metabolite can be conceptualized as the net fraction of
the formed metabolite partitioning back into the circulation. Physiologically, this reflects the
permeability rate of the metabolite across the sinusoid for passive diffusion (lipoidal
This article has not been copyedited and formatted. The final version may differ from this version.DMD Fast Forward. Published on March 1, 2013 as DOI: 10.1124/dmd.112.050278
at ASPE
T Journals on February 13, 2019
dmd.aspetjournals.org
Dow
nloaded from
DMD #50278
12
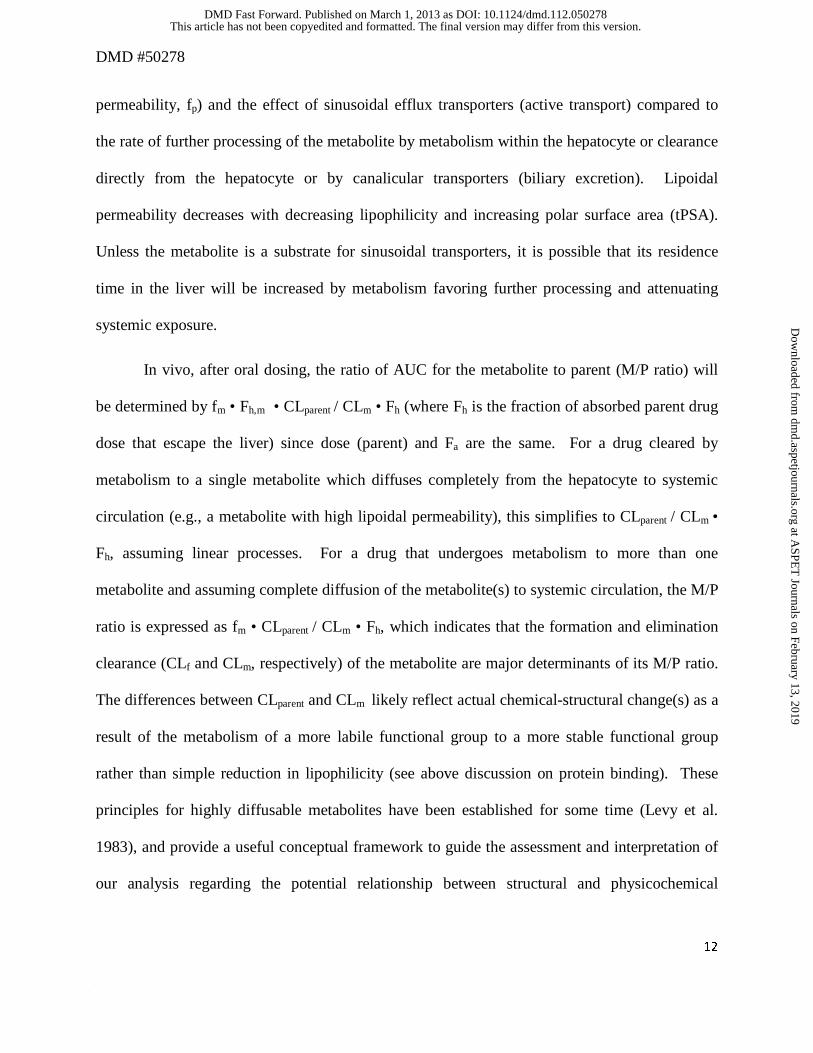
permeability, fp) and the effect of sinusoidal efflux transporters (active transport) compared to
the rate of further processing of the metabolite by metabolism within the hepatocyte or clearance
directly from the hepatocyte or by canalicular transporters (biliary excretion). Lipoidal
permeability decreases with decreasing lipophilicity and increasing polar surface area (tPSA).
Unless the metabolite is a substrate for sinusoidal transporters, it is possible that its residence
time in the liver will be increased by metabolism favoring further processing and attenuating
systemic exposure.
In vivo, after oral dosing, the ratio of AUC for the metabolite to parent (M/P ratio) will
be determined by fm • Fh,m • CLparent / CLm • Fh (where Fh is the fraction of absorbed parent drug
dose that escape the liver) since dose (parent) and Fa are the same. For a drug cleared by
metabolism to a single metabolite which diffuses completely from the hepatocyte to systemic
circulation (e.g., a metabolite with high lipoidal permeability), this simplifies to CLparent / CLm •
Fh, assuming linear processes. For a drug that undergoes metabolism to more than one
metabolite and assuming complete diffusion of the metabolite(s) to systemic circulation, the M/P
ratio is expressed as fm • CLparent / CLm • Fh, which indicates that the formation and elimination
clearance (CLf and CLm, respectively) of the metabolite are major determinants of its M/P ratio.
The differences between CLparent and CLm likely reflect actual chemical-structural change(s) as a
result of the metabolism of a more labile functional group to a more stable functional group
rather than simple reduction in lipophilicity (see above discussion on protein binding). These
principles for highly diffusable metabolites have been established for some time (Levy et al.
1983), and provide a useful conceptual framework to guide the assessment and interpretation of
our analysis regarding the potential relationship between structural and physicochemical
This article has not been copyedited and formatted. The final version may differ from this version.DMD Fast Forward. Published on March 1, 2013 as DOI: 10.1124/dmd.112.050278
at ASPE
T Journals on February 13, 2019
dmd.aspetjournals.org
Dow
nloaded from
DMD #50278
13
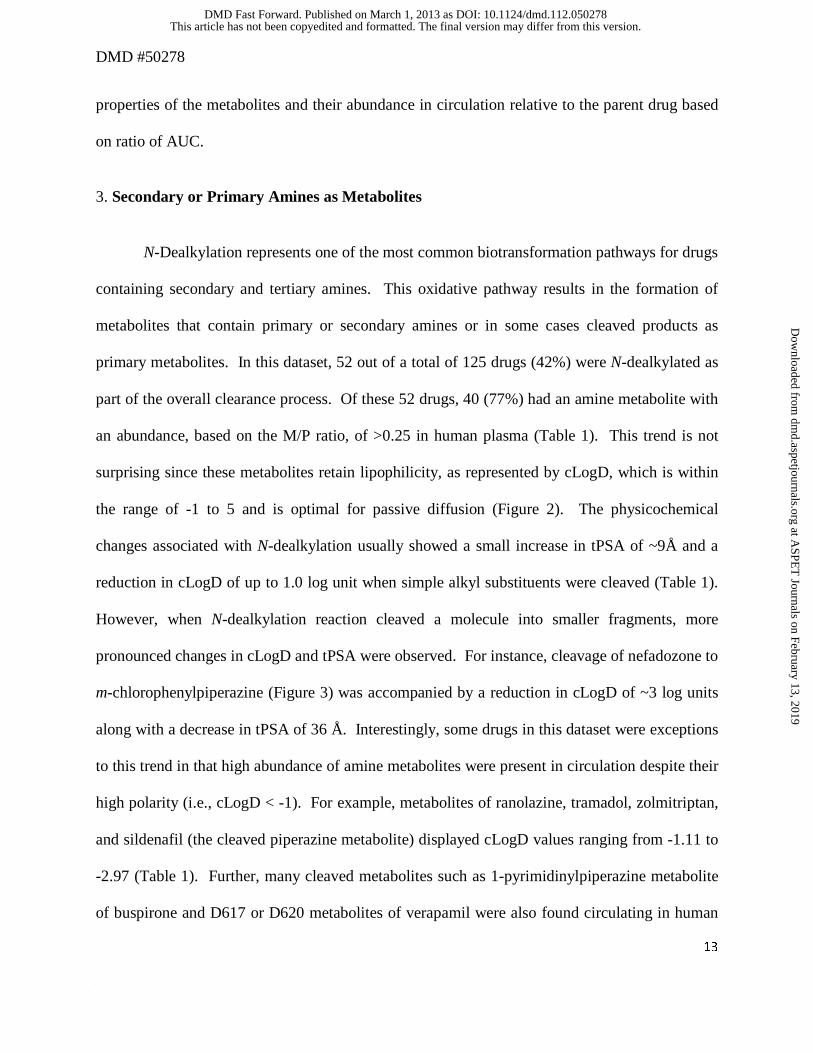
properties of the metabolites and their abundance in circulation relative to the parent drug based
on ratio of AUC.
3. Secondary or Primary Amines as Metabolites
N-Dealkylation represents one of the most common biotransformation pathways for drugs
containing secondary and tertiary amines. This oxidative pathway results in the formation of
metabolites that contain primary or secondary amines or in some cases cleaved products as
primary metabolites. In this dataset, 52 out of a total of 125 drugs (42%) were N-dealkylated as
part of the overall clearance process. Of these 52 drugs, 40 (77%) had an amine metabolite with
an abundance, based on the M/P ratio, of >0.25 in human plasma (Table 1). This trend is not
surprising since these metabolites retain lipophilicity, as represented by cLogD, which is within
the range of -1 to 5 and is optimal for passive diffusion (Figure 2). The physicochemical
changes associated with N-dealkylation usually showed a small increase in tPSA of ~9Å and a
reduction in cLogD of up to 1.0 log unit when simple alkyl substituents were cleaved (Table 1).
However, when N-dealkylation reaction cleaved a molecule into smaller fragments, more
pronounced changes in cLogD and tPSA were observed. For instance, cleavage of nefadozone to
m-chlorophenylpiperazine (Figure 3) was accompanied by a reduction in cLogD of ~3 log units
along with a decrease in tPSA of 36 Å. Interestingly, some drugs in this dataset were exceptions
to this trend in that high abundance of amine metabolites were present in circulation despite their
high polarity (i.e., cLogD < -1). For example, metabolites of ranolazine, tramadol, zolmitriptan,
and sildenafil (the cleaved piperazine metabolite) displayed cLogD values ranging from -1.11 to
-2.97 (Table 1). Further, many cleaved metabolites such as 1-pyrimidinylpiperazine metabolite
of buspirone and D617 or D620 metabolites of verapamil were also found circulating in human
This article has not been copyedited and formatted. The final version may differ from this version.DMD Fast Forward. Published on March 1, 2013 as DOI: 10.1124/dmd.112.050278
at ASPE
T Journals on February 13, 2019
dmd.aspetjournals.org
Dow
nloaded from
DMD #50278
14
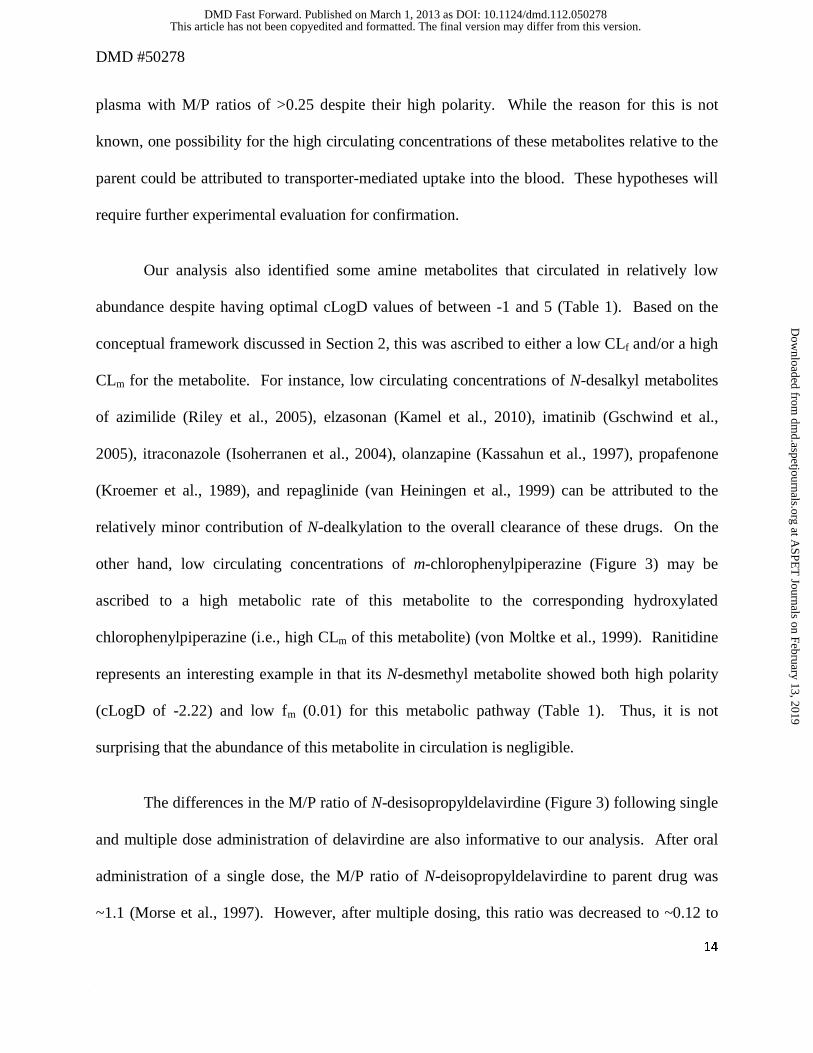
plasma with M/P ratios of >0.25 despite their high polarity. While the reason for this is not
known, one possibility for the high circulating concentrations of these metabolites relative to the
parent could be attributed to transporter-mediated uptake into the blood. These hypotheses will
require further experimental evaluation for confirmation.
Our analysis also identified some amine metabolites that circulated in relatively low
abundance despite having optimal cLogD values of between -1 and 5 (Table 1). Based on the
conceptual framework discussed in Section 2, this was ascribed to either a low CLf and/or a high
CLm for the metabolite. For instance, low circulating concentrations of N-desalkyl metabolites
of azimilide (Riley et al., 2005), elzasonan (Kamel et al., 2010), imatinib (Gschwind et al.,
2005), itraconazole (Isoherranen et al., 2004), olanzapine (Kassahun et al., 1997), propafenone
(Kroemer et al., 1989), and repaglinide (van Heiningen et al., 1999) can be attributed to the
relatively minor contribution of N-dealkylation to the overall clearance of these drugs. On the
other hand, low circulating concentrations of m-chlorophenylpiperazine (Figure 3) may be
ascribed to a high metabolic rate of this metabolite to the corresponding hydroxylated
chlorophenylpiperazine (i.e., high CLm of this metabolite) (von Moltke et al., 1999). Ranitidine
represents an interesting example in that its N-desmethyl metabolite showed both high polarity
(cLogD of -2.22) and low fm (0.01) for this metabolic pathway (Table 1). Thus, it is not
surprising that the abundance of this metabolite in circulation is negligible.
The differences in the M/P ratio of N-desisopropyldelavirdine (Figure 3) following single
and multiple dose administration of delavirdine are also informative to our analysis. After oral
administration of a single dose, the M/P ratio of N-deisopropyldelavirdine to parent drug was
~1.1 (Morse et al., 1997). However, after multiple dosing, this ratio was decreased to ~0.12 to
This article has not been copyedited and formatted. The final version may differ from this version.DMD Fast Forward. Published on March 1, 2013 as DOI: 10.1124/dmd.112.050278
at ASPE
T Journals on February 13, 2019
dmd.aspetjournals.org
Dow
nloaded from
DMD #50278
15
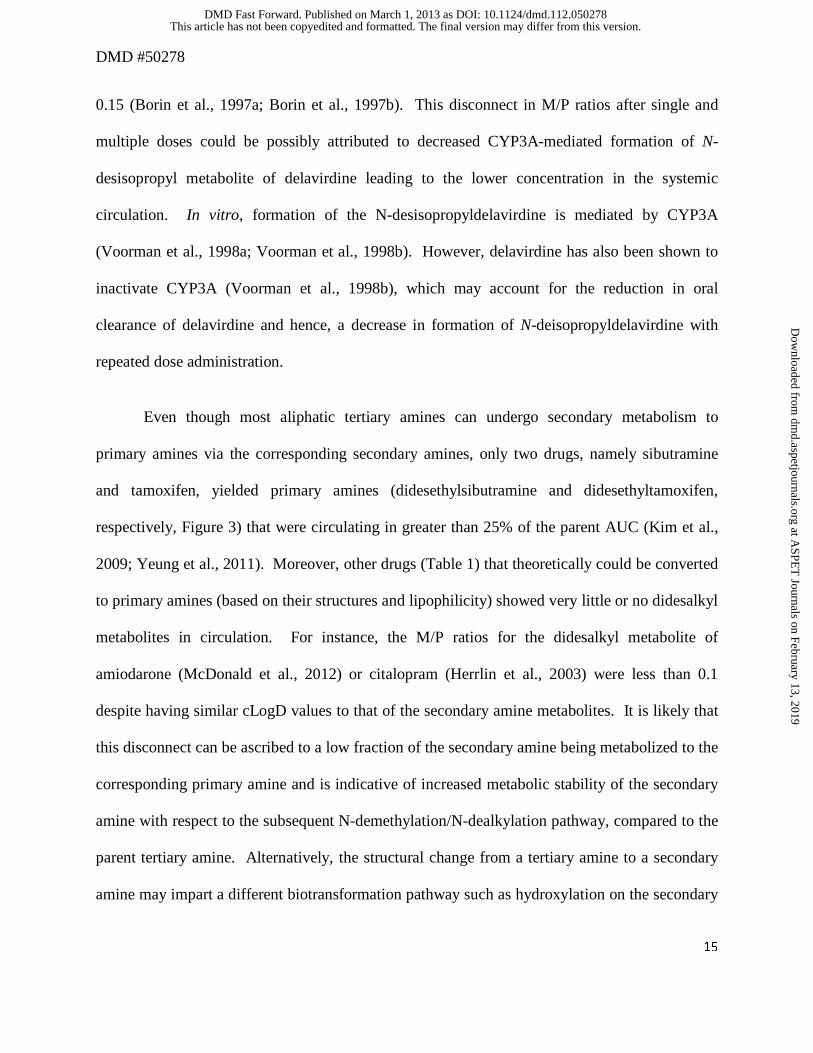
0.15 (Borin et al., 1997a; Borin et al., 1997b). This disconnect in M/P ratios after single and
multiple doses could be possibly attributed to decreased CYP3A-mediated formation of N-
desisopropyl metabolite of delavirdine leading to the lower concentration in the systemic
circulation. In vitro, formation of the N-desisopropyldelavirdine is mediated by CYP3A
(Voorman et al., 1998a; Voorman et al., 1998b). However, delavirdine has also been shown to
inactivate CYP3A (Voorman et al., 1998b), which may account for the reduction in oral
clearance of delavirdine and hence, a decrease in formation of N-deisopropyldelavirdine with
repeated dose administration.
Even though most aliphatic tertiary amines can undergo secondary metabolism to
primary amines via the corresponding secondary amines, only two drugs, namely sibutramine
and tamoxifen, yielded primary amines (didesethylsibutramine and didesethyltamoxifen,
respectively, Figure 3) that were circulating in greater than 25% of the parent AUC (Kim et al.,
2009; Yeung et al., 2011). Moreover, other drugs (Table 1) that theoretically could be converted
to primary amines (based on their structures and lipophilicity) showed very little or no didesalkyl
metabolites in circulation. For instance, the M/P ratios for the didesalkyl metabolite of
amiodarone (McDonald et al., 2012) or citalopram (Herrlin et al., 2003) were less than 0.1
despite having similar cLogD values to that of the secondary amine metabolites. It is likely that
this disconnect can be ascribed to a low fraction of the secondary amine being metabolized to the
corresponding primary amine and is indicative of increased metabolic stability of the secondary
amine with respect to the subsequent N-demethylation/N-dealkylation pathway, compared to the
parent tertiary amine. Alternatively, the structural change from a tertiary amine to a secondary
amine may impart a different biotransformation pathway such as hydroxylation on the secondary
This article has not been copyedited and formatted. The final version may differ from this version.DMD Fast Forward. Published on March 1, 2013 as DOI: 10.1124/dmd.112.050278
at ASPE
T Journals on February 13, 2019
dmd.aspetjournals.org
Dow
nloaded from
DMD #50278
16
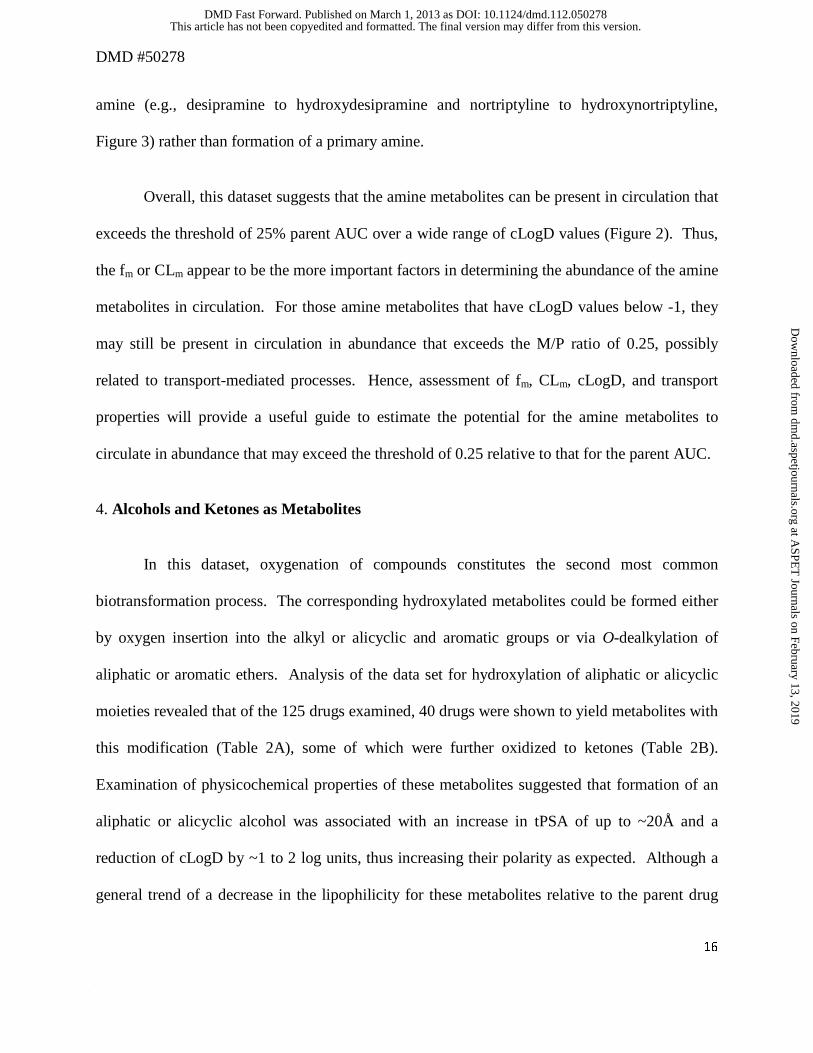
amine (e.g., desipramine to hydroxydesipramine and nortriptyline to hydroxynortriptyline,
Figure 3) rather than formation of a primary amine.
Overall, this dataset suggests that the amine metabolites can be present in circulation that
exceeds the threshold of 25% parent AUC over a wide range of cLogD values (Figure 2). Thus,
the fm or CLm appear to be the more important factors in determining the abundance of the amine
metabolites in circulation. For those amine metabolites that have cLogD values below -1, they
may still be present in circulation in abundance that exceeds the M/P ratio of 0.25, possibly
related to transport-mediated processes. Hence, assessment of fm, CLm, cLogD, and transport
properties will provide a useful guide to estimate the potential for the amine metabolites to
circulate in abundance that may exceed the threshold of 0.25 relative to that for the parent AUC.
4. Alcohols and Ketones as Metabolites
In this dataset, oxygenation of compounds constitutes the second most common
biotransformation process. The corresponding hydroxylated metabolites could be formed either
by oxygen insertion into the alkyl or alicyclic and aromatic groups or via O-dealkylation of
aliphatic or aromatic ethers. Analysis of the data set for hydroxylation of aliphatic or alicyclic
moieties revealed that of the 125 drugs examined, 40 drugs were shown to yield metabolites with
this modification (Table 2A), some of which were further oxidized to ketones (Table 2B).
Examination of physicochemical properties of these metabolites suggested that formation of an
aliphatic or alicyclic alcohol was associated with an increase in tPSA of up to ~20Å and a
reduction of cLogD by ~1 to 2 log units, thus increasing their polarity as expected. Although a
general trend of a decrease in the lipophilicity for these metabolites relative to the parent drug
This article has not been copyedited and formatted. The final version may differ from this version.DMD Fast Forward. Published on March 1, 2013 as DOI: 10.1124/dmd.112.050278
at ASPE
T Journals on February 13, 2019
dmd.aspetjournals.org
Dow
nloaded from
DMD #50278
17
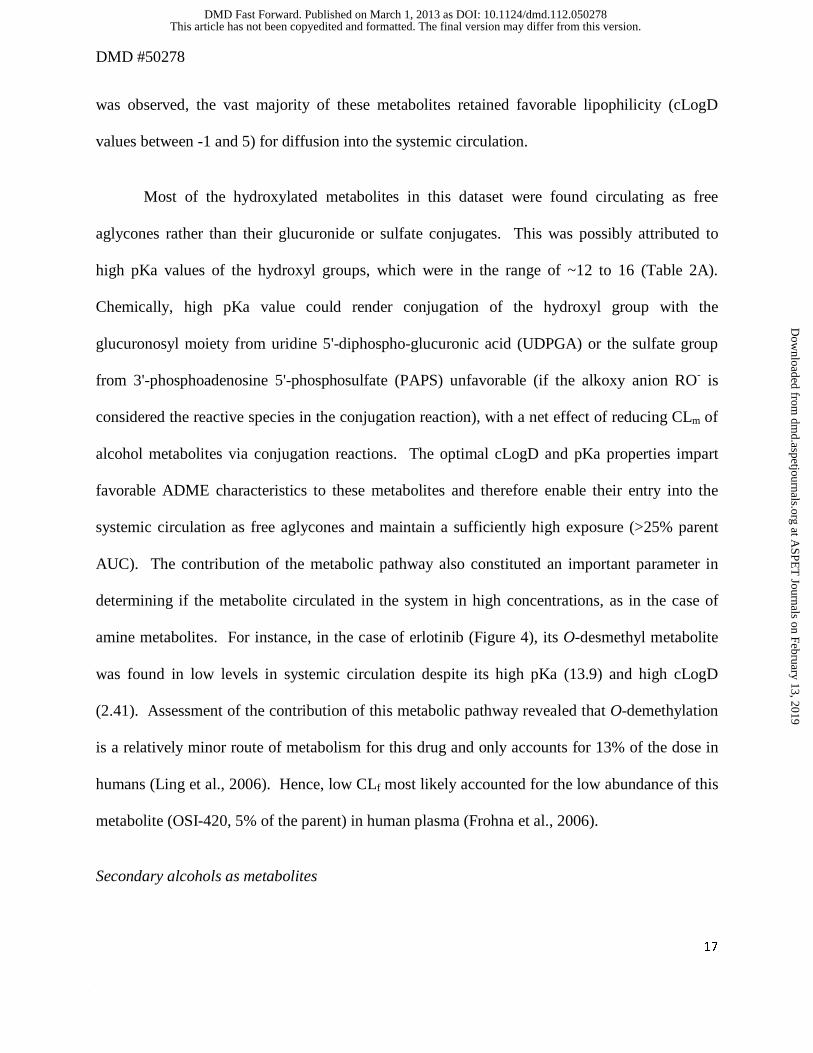
was observed, the vast majority of these metabolites retained favorable lipophilicity (cLogD
values between -1 and 5) for diffusion into the systemic circulation.
Most of the hydroxylated metabolites in this dataset were found circulating as free
aglycones rather than their glucuronide or sulfate conjugates. This was possibly attributed to
high pKa values of the hydroxyl groups, which were in the range of ~12 to 16 (Table 2A).
Chemically, high pKa value could render conjugation of the hydroxyl group with the
glucuronosyl moiety from uridine 5'-diphospho-glucuronic acid (UDPGA) or the sulfate group
from 3'-phosphoadenosine 5'-phosphosulfate (PAPS) unfavorable (if the alkoxy anion RO- is
considered the reactive species in the conjugation reaction), with a net effect of reducing CLm of
alcohol metabolites via conjugation reactions. The optimal cLogD and pKa properties impart
favorable ADME characteristics to these metabolites and therefore enable their entry into the
systemic circulation as free aglycones and maintain a sufficiently high exposure (>25% parent
AUC). The contribution of the metabolic pathway also constituted an important parameter in
determining if the metabolite circulated in the system in high concentrations, as in the case of
amine metabolites. For instance, in the case of erlotinib (Figure 4), its O-desmethyl metabolite
was found in low levels in systemic circulation despite its high pKa (13.9) and high cLogD
(2.41). Assessment of the contribution of this metabolic pathway revealed that O-demethylation
is a relatively minor route of metabolism for this drug and only accounts for 13% of the dose in
humans (Ling et al., 2006). Hence, low CLf most likely accounted for the low abundance of this
metabolite (OSI-420, 5% of the parent) in human plasma (Frohna et al., 2006).
Secondary alcohols as metabolites
This article has not been copyedited and formatted. The final version may differ from this version.DMD Fast Forward. Published on March 1, 2013 as DOI: 10.1124/dmd.112.050278
at ASPE
T Journals on February 13, 2019
dmd.aspetjournals.org
Dow
nloaded from
DMD #50278
18
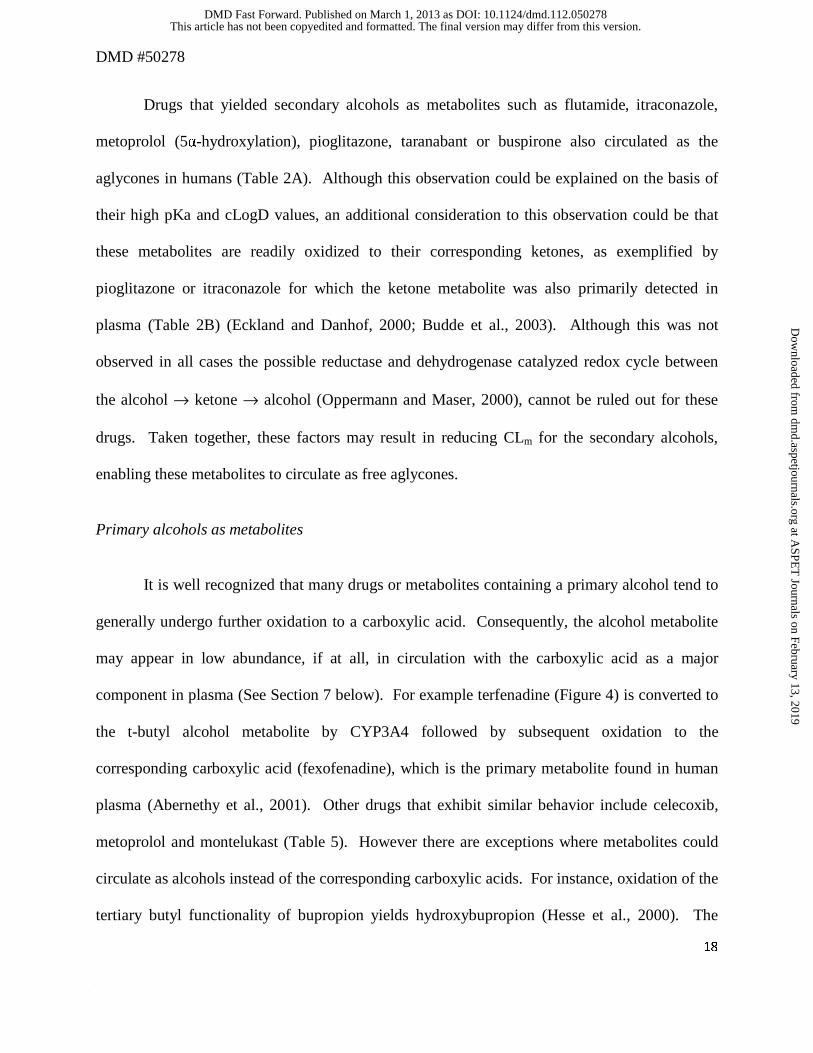
Drugs that yielded secondary alcohols as metabolites such as flutamide, itraconazole,
metoprolol (5α-hydroxylation), pioglitazone, taranabant or buspirone also circulated as the
aglycones in humans (Table 2A). Although this observation could be explained on the basis of
their high pKa and cLogD values, an additional consideration to this observation could be that
these metabolites are readily oxidized to their corresponding ketones, as exemplified by
pioglitazone or itraconazole for which the ketone metabolite was also primarily detected in
plasma (Table 2B) (Eckland and Danhof, 2000; Budde et al., 2003). Although this was not
observed in all cases the possible reductase and dehydrogenase catalyzed redox cycle between
the alcohol → ketone → alcohol (Oppermann and Maser, 2000), cannot be ruled out for these
drugs. Taken together, these factors may result in reducing CLm for the secondary alcohols,
enabling these metabolites to circulate as free aglycones.
Primary alcohols as metabolites
It is well recognized that many drugs or metabolites containing a primary alcohol tend to
generally undergo further oxidation to a carboxylic acid. Consequently, the alcohol metabolite
may appear in low abundance, if at all, in circulation with the carboxylic acid as a major
component in plasma (See Section 7 below). For example terfenadine (Figure 4) is converted to
the t-butyl alcohol metabolite by CYP3A4 followed by subsequent oxidation to the
corresponding carboxylic acid (fexofenadine), which is the primary metabolite found in human
plasma (Abernethy et al., 2001). Other drugs that exhibit similar behavior include celecoxib,
metoprolol and montelukast (Table 5). However there are exceptions where metabolites could
circulate as alcohols instead of the corresponding carboxylic acids. For instance, oxidation of the
tertiary butyl functionality of bupropion yields hydroxybupropion (Hesse et al., 2000). The
This article has not been copyedited and formatted. The final version may differ from this version.DMD Fast Forward. Published on March 1, 2013 as DOI: 10.1124/dmd.112.050278
at ASPE
T Journals on February 13, 2019
dmd.aspetjournals.org
Dow
nloaded from
DMD #50278
19
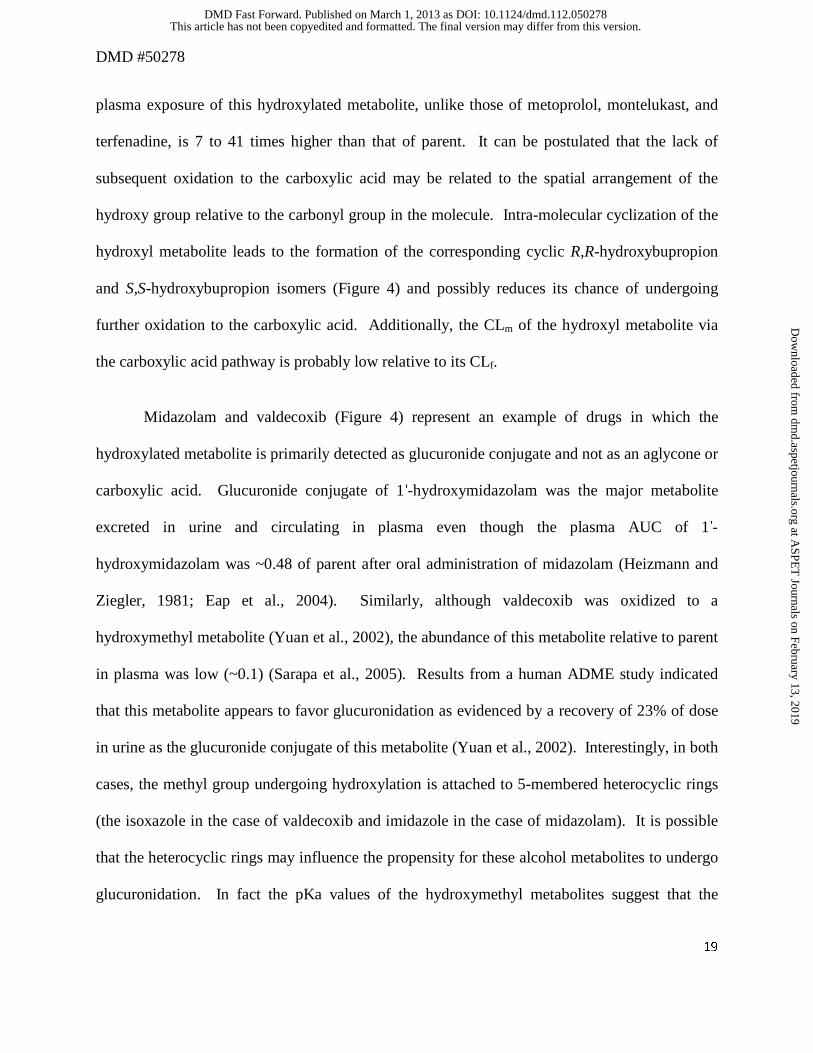
plasma exposure of this hydroxylated metabolite, unlike those of metoprolol, montelukast, and
terfenadine, is 7 to 41 times higher than that of parent. It can be postulated that the lack of
subsequent oxidation to the carboxylic acid may be related to the spatial arrangement of the
hydroxy group relative to the carbonyl group in the molecule. Intra-molecular cyclization of the
hydroxyl metabolite leads to the formation of the corresponding cyclic R,R-hydroxybupropion
and S,S-hydroxybupropion isomers (Figure 4) and possibly reduces its chance of undergoing
further oxidation to the carboxylic acid. Additionally, the CLm of the hydroxyl metabolite via
the carboxylic acid pathway is probably low relative to its CLf.
Midazolam and valdecoxib (Figure 4) represent an example of drugs in which the
hydroxylated metabolite is primarily detected as glucuronide conjugate and not as an aglycone or
carboxylic acid. Glucuronide conjugate of 1′-hydroxymidazolam was the major metabolite
excreted in urine and circulating in plasma even though the plasma AUC of 1′-
hydroxymidazolam was ~0.48 of parent after oral administration of midazolam (Heizmann and
Ziegler, 1981; Eap et al., 2004). Similarly, although valdecoxib was oxidized to a
hydroxymethyl metabolite (Yuan et al., 2002), the abundance of this metabolite relative to parent
in plasma was low (~0.1) (Sarapa et al., 2005). Results from a human ADME study indicated
that this metabolite appears to favor glucuronidation as evidenced by a recovery of 23% of dose
in urine as the glucuronide conjugate of this metabolite (Yuan et al., 2002). Interestingly, in both
cases, the methyl group undergoing hydroxylation is attached to 5-membered heterocyclic rings
(the isoxazole in the case of valdecoxib and imidazole in the case of midazolam). It is possible
that the heterocyclic rings may influence the propensity for these alcohol metabolites to undergo
glucuronidation. In fact the pKa values of the hydroxymethyl metabolites suggest that the
This article has not been copyedited and formatted. The final version may differ from this version.DMD Fast Forward. Published on March 1, 2013 as DOI: 10.1124/dmd.112.050278
at ASPE
T Journals on February 13, 2019
dmd.aspetjournals.org
Dow
nloaded from
DMD #50278
20
hydroxyl groups are relatively more acidic (13.09 and 13.59, respectively) compared to the
primary alcohols formed via oxidation of other drugs (Table 2A). Chemically, decreased pKa
could potentially increase the susceptibility of these metabolites to undergo further conjugation
reaction relative to other hydroxymethyl derivatives. Additionally, potential intra-molecular
interactions of the hydroxyl group with the nitrogen or oxygen atom in the imidazole or
isoxazole rings of the two drugs could possibly increase the propensity of conjugation by
rendering the hydroxyl group more nucleophilic. One caveat involves the limitation of our
current understanding of the interaction between alcohol metabolites and the conjugation
enzymes such as UGT to allow a priori prediction of how well the metabolites with this
structural motif may undergo conjugation (i.e., assessment of CLm). This parameter still requires
further in vitro experimentation to ascertain, such as the approach used by Lutz and Isoherranen
(Lutz and Isoherranen, 2012).
Bosentan represents another example of the exception to the trend that a hydroxyl
metabolite on the primary carbon will undergo further oxidation to a carboxylic acid. In humans,
the major metabolic pathway for bosentan involves oxidation of the t-butyl group to yield the
hydroxyl metabolite Ro 48-5033. This pathway constitutes at least 35% of the overall
biotransformation for bosentan (Weber et al., 1999). However, after oral administration, plasma
AUC of t-butyl hydroxybosentan to parent was only ~0.13, and the corresponding carboxylic
acid was not reported. Based on the pharmacokinetic framework described in Section 2, it can
be postulated that the elimination clearance of this metabolite (by pathways other than further
oxidation to carboxylic acid) is more likely favored relative to its formation. Bosentan is a
substrate for efflux transporter such as BSEP (Hartman et al., 2010). It may be hypothesized that
This article has not been copyedited and formatted. The final version may differ from this version.DMD Fast Forward. Published on March 1, 2013 as DOI: 10.1124/dmd.112.050278
at ASPE
T Journals on February 13, 2019
dmd.aspetjournals.org
Dow
nloaded from
DMD #50278
21
despite the structural modification, the t-butyl hydroxyl metabolite of bosentan may still retain
the affinity to the efflux transporters as with the parent so that biliary elimination rather than
further oxidation is favored. If this hypothesis holds true, it will illustrate the importance of
understanding the key factors (e.g., structural motifs, physicochemical properties) that impacts
the affinity of a metabolite to interact with transporters vs metabolic enzyme(s), which will
determine the elimination characteristics of the metabolite. Overall, the learnings from these
empiric observations can be taken into consideration when formulating a rational strategy to
anticipate and prioritize which alcohol metabolite(s) should be considered for synthesis and
quantitation early on to address the potential MIST or DDI issues.
5. Arenol Metabolites
Metabolites formed via hydroxylation of aromatic rings or O-dealkylation of aromatic
ethers (arenols) represented very different characteristics when compared to their alcoholic
counterparts. Thirty six drugs in this dataset revealed arenol formation as a part of their
biotransformation pathway (Table 3). The physicochemical properties of the arenol metabolites
were moderately changed compared to the parent drug, with increase in tPSA by ~11 to 20Å and
decrease in cLogD by ~0.5 to 1 log unit associated with these metabolic steps (Table 3).
Although the cLogD values of arenols, which typically ranged from -0.6 to 4, showed
considerable overlap with those for the alcohol metabolites, the pKa value of the hydroxyl group
in these metabolites ranged from ~4 to 11 (Table 2) and were more acidic compared to the
alcohol functionality (pKa of 12-16). As seen in Table 3, in contrast to alcohol metabolites,
many of the arenol metabolites circulated as glucuronide or sulfate conjugates in humans.
Chemically, lower pKa of arenols would make these metabolites more ionizable to yield a
This article has not been copyedited and formatted. The final version may differ from this version.DMD Fast Forward. Published on March 1, 2013 as DOI: 10.1124/dmd.112.050278
at ASPE
T Journals on February 13, 2019
dmd.aspetjournals.org
Dow
nloaded from
DMD #50278
22
phenoxy anion and hence favor the nucleophilic addition to UDPGA or PAPS. Thus, it is not
surprising that these metabolites are susceptible to further conjugation and circulated either as
glucuronide (e.g., apremilast, atomoxetine, chlorpromazine, codeine to morphine, desloratadine,
desipramine, dextromethorphan, duloxetine, efavirenz, imipramine, loxapine, and propranolol) or
sulfate (e.g., apixaban, pantoprazole, and rosiglitazone) conjugates (Table 3). While in vivo data
is lacking, in vitro data suggests that 7-OH S-warfarin likely undergoes extensive glucuronide
conjugation as well (Bratton et al., 2012).
Empirically, our meta-analysis suggested that conjugates of para-hydroxylated arenols
were major circulating metabolites rather than the aglycones while the ortho and possibly meta-
hydroxylated metabolites were primarily found as aglycones in circulation. For instance, the
hydroxylated metabolites of atorvastatin, ranolazine, gefitinib and tramadol (Figure 5) primarily
circulated as the aglycones with an M/P ratio of 0.25 or greater (Table 3). One reason for this
could be limited formation of the conjugates of ortho-hydroxyarenols. It is also possible that the
position of the hydroxy group on the aromatic ring may influence the efficiency of conjugation.
Alternatively, the substrate affinity of the ortho-hydroxylated metabolites for various efflux
transporters (e.g., MRP2 vs MRP3) may alter the disposition of these metabolites (i.e., being
transported to the bile vs to the systemic circulation). The validity of these hypotheses will need
to be confirmed with further research.
Some examples from this dataset illustrate the utility of the pharmacokinetic framework
discussed in Section 2 in rationalizing the relative abundance of the arenol metabolite to parent.
For instance, the ratio of O-dealkylamiodarone to amiodarone is low (0.1) (McDonald et al.,
2012), suggesting that the CLf is low relative to the CLm of this metabolite. It can be postulated
This article has not been copyedited and formatted. The final version may differ from this version.DMD Fast Forward. Published on March 1, 2013 as DOI: 10.1124/dmd.112.050278
at ASPE
T Journals on February 13, 2019
dmd.aspetjournals.org
Dow
nloaded from
DMD #50278
23
that since N-deethylation and 3′-hydroxy monodeethylation (Figure 5) constitutes the major
metabolic pathways rather than O-dealkylation of amiodarone, the low ratio may possibly reflect
a low CLf for this metabolite. Another example may include the O-desmethyl metabolite for
bosentan (Ro 47-8634) (Figure 5), which also showed low abundance relative to the parent in
plasma (~0.05) (van Giersbergen et al., 2002). The relatively low fraction of dose attributable to
the O-demethylation pathway in the excreta for this drug (~6.4% of dose) is consistent with this
interpretation (Weber et al., 1999).
Another drug that displayed an exception to the general trend was venlafaxine. O-
dealkylation of venlafaxine resulted in the formation of desvenlafaxine (Figure 5) (Howell et al.,
1993). The systemic exposure of this metabolite was 4 to 6-fold higher than that of parent in
CYP2D6 extensive metabolizers (EM) (Patat et al., 1998; Hynninen et al., 2008). Further, while
a significant portion of the dose (26%) was excreted in urine as the glucuronide conjugate of
desvenlafaxine, 29% of the dose was excreted as the aglycone (Howell et al., 1993). Also,
following oral administration of desvenlafaxine, renal clearance constitutes a major clearance
mechanism for the parent (DeMaio et al., 2011). This example illustrates that a change in
physicochemical properties associated with the metabolite may alter its clearance mechanism, in
this case, to renal elimination. This can result in a significant impact on the elimination
clearance of the metabolite and thus affecting the anticipated AUC ratio of metabolite to parent.
Overall this analysis suggested the complexity of predicting the exact nature of the metabolites
that undergo aromatic hydroxylation or O-dealkylation and emphasized the importance to
understand the formation and elimination (e.g., conjugation) characteristics of the metabolites. It
This article has not been copyedited and formatted. The final version may differ from this version.DMD Fast Forward. Published on March 1, 2013 as DOI: 10.1124/dmd.112.050278
at ASPE
T Journals on February 13, 2019
dmd.aspetjournals.org
Dow
nloaded from
DMD #50278
24
also highlighted the importance of obtaining good estimates of both CLf and CLm in order to
yield a more accurate assessment of the AUC ratio of metabolite (aglycone) to parent.
6. S- and N-Oxides Metabolites
S-Oxides
Twelve drugs in this dataset were metabolized to the corresponding sulfoxide and/or
sulfone metabolites (Table 4). Formation of a sulfoxide via oxidation of the sulfur moiety
lowered the cLogD by ~1 to 2 log units and increased tPSA by ~11Å relative to the parent drug.
Despite this, most of the metabolic products from sulfoxidation retained sufficient lipophilicity,
as reflected by the cLogD values, in the range of -1 to 3 (Table 4). This favorable
physicochemical property probably enabled these entities to reach systemic circulation since
most drugs (6 out 8) that were converted to the sulfoxide metabolite had an M/P ratio exceeding
0.25. On the other hand, relatively low amounts of the circulating sulfoxide metabolite of
montelukast and ranitidine were detected in human plasma. Montelukast is primarily
metabolized in humans via hydroxylation and subsequent conversion to the carboxylic acid while
S-oxidation constitutes a minor pathway of metabolism for this drug. Low levels of the
montelukast sulfoxide in human plasma despite the favorable cLogD and tPSA values (1.74 and
107, respectively) were therefore likely attributed to a low CLf, while the sulfoxide metabolite of
ranitidine exhibited both low fm (0.01) and high polarity (cLogD of -3.43).
Drugs containing a sulfoxide moiety can generally undergo further oxidation to a sulfone,
which can also circulate as the major metabolite. For instance, flosequinan, omeprazole,
lansoprazole in CYP2C19 PM, and thioridazine were converted to their corresponding sulfone
This article has not been copyedited and formatted. The final version may differ from this version.DMD Fast Forward. Published on March 1, 2013 as DOI: 10.1124/dmd.112.050278
at ASPE
T Journals on February 13, 2019
dmd.aspetjournals.org
Dow
nloaded from
DMD #50278
25
metabolites and had M/P ratios >0.25 (Table 4). This was ascribed to their favorable cLog D
values since in most cases the conversion of a sulfoxide to a sulfone metabolite increased its
cLogD by up to ~1 log unit and decreased tPSA by ~6Å (Table 4). The only outlier to this trend
was pantoprazole which showed an M/P ratio < 0.25. While the reason for this is not known, the
discrepancy could also be ascribed to relatively less contribution of this metabolic pathway
towards clearance of this drug since the major pathway appears to be O-dealkylation of the
methoxy ether to the corresponding arenol metabolite. Of interest, in this analysis, for the parent
drugs that contain sulfide in its structure, oxidative metabolism yields sulfoxide as the major
circulating metabolite (e.g., albendazole, axitinib, chlorpromazine, dothiepin, thioridazine).
However, the corresponding sulfone tends to be either not present as major circulating
metabolite, or is present in abundance considerably lower than the corresponding sulfoxide (e.g.,
thioridazine). Like the amines (Section 3), this may also be attributed to the low CLf for this
sequential oxidation step.
N-Oxides
In this analysis, 11 drugs were converted to aliphatic or aromatic N-oxides (Table 4).
Three drugs showed the formation of aromatic N-oxide, two of which are pyridine N-oxide
(roflumilast and regorafenib), and one is a pyrimidine N-oxide (voriconazole). The remaining
eight drugs formed aliphatic or cyclic N-oxide. Changes in physicochemical properties from N-
oxidation are of a similar order to S-oxidation to a sulfoxide with an increase of tPSA of 14Å and
a lowering of lipophilicity of ~0.5 to 2 log units. All except ranitidine N-oxide and zolmitriptan
N-oxide showed a cLogD value of greater than zero (Table 4), which conferred a favorable
lipophilic property to enable these metabolites to reach the systemic circulation provided that a
This article has not been copyedited and formatted. The final version may differ from this version.DMD Fast Forward. Published on March 1, 2013 as DOI: 10.1124/dmd.112.050278
at ASPE
T Journals on February 13, 2019
dmd.aspetjournals.org
Dow
nloaded from
DMD #50278
26
sufficient amount was formed. A notable feature of N-oxide metabolites is their apparent rapid
interconversion with parent leading to formation of both parent drug and other primary and
secondary metabolites. Interconversion after administration of the metabolite to man and
animals has been shown for chlorpromazine (Jaworski et al., 1990), clozapine (Chang et al.,
1998) and voriconazole (Roffey et al., 2003). The interconversion will tend to lower the M/P
ratio of this type of metabolite.
7. Carboxylic Acid Metabolites
Eleven drugs in this dataset were oxidized to a carboxylic acid metabolite via various
metabolic reactions (Table 5). Seven of these drugs including celecoxib, losartan, metoprolol
(O-demethylation), montelukast, quetiapine, N-dealkyl product of ranolazine (CVT-2534), and
terfenadine underwent oxidation of either the parent drug or the intermediate alcohol metabolite
to the corresponding carboxylic acid (see Section 4). As observed from the M/P ratios, in all
cases, the carboxylic acid was the major circulating metabolic product possibly due to its small
volume of distribution and high plasma protein binding (Obach et al., 2008). The data from
these seven drugs/metabolites was consistent with this hypothesis in that the AUC of the
carboxylic acid metabolite was considerably higher compared to their corresponding alcohol
metabolite. Another factor that may also influence the high M/P ratio for the carboxylic acid
metabolites is related to the new functional group being introduced to the metabolite, which is
metabolically more stable than the parent (i.e., reduced CLm). This is illustrated by the example
of losartan. A comparison of the pharmacokinetics of losartan to its carboxylic acid metabolite
indicates that the volume of distribution (~0.45 L/kg) and plasma clearance (~9 mL/min/kg) of
losartan was greater than that of carboxylosartan (plasma clearance ~0.7 mL/min/kg and volume
This article has not been copyedited and formatted. The final version may differ from this version.DMD Fast Forward. Published on March 1, 2013 as DOI: 10.1124/dmd.112.050278
at ASPE
T Journals on February 13, 2019
dmd.aspetjournals.org
Dow
nloaded from
DMD #50278
27
of distribution ~0.14 L/Kg) (Christ, 1995; Lo et al., 1995). Additionally, the renal clearance (~1
mL/min/kg) of losartan accounted for 11% of its total plasma clearance while the renal clearance
of carboxylosartan (~0.4 mL/min/kg) accounted for 55% of its total plasma clearance. The free
fraction for the metabolite (~0.0035) showed ~4-fold decrease compared to the parent (~0.0135),
suggesting that the effect of the additional acidic function in the metabolite has little effect on
unbound volume of distribution or renal clearance. However, there was a 7-fold reduction (593
mL/min/kg for losartan and 86 mL/min/kg for carboxylosartan) in unbound non-renal clearance,
which can be postulated to be mainly due to the oxidation of the more labile hydroxyl group in
losartan to a substantially more metabolically stable carboxyl function. Besides losartan,
metabolic conversion of terfenadine to fexofenadine likely represents another example in support
of this postulate.
In this dataset, 8 of 11 carboxylic acid metabolites showed negative cLogD values
ranging from -0.06 (carboxylosartan) to -3.4 (zolmitriptan indoleacetic acid), suggesting that
these metabolites have high polarity (Table 5). However, 7 out of 8 of these metabolites had an
M/P ratio of 0.25 or higher, with repaglinide carboxylic acid (Figure 6) as the only exception.
Although the mechanism(s) by which passage of these polar carboxylic acid metabolites into
systemic circulation is not well understood, one possible explanation may involve transporter-
mediated processes. For instance, fexofenadine is a substrate for hMRP3 (Matsushima et al.,
2008), which mediates the sinusoidal efflux of a variety of organic anions. This transporter
therefore may play a role in mediating the efflux of fexofenadine from the liver to the systemic
circulation, as demonstrated in the Mrp3 (-/-) mouse model (Matsushima et al., 2008).
Moreover, the example from the carboxylic acid metabolite of repaglinide illustrates the
This article has not been copyedited and formatted. The final version may differ from this version.DMD Fast Forward. Published on March 1, 2013 as DOI: 10.1124/dmd.112.050278
at ASPE
T Journals on February 13, 2019
dmd.aspetjournals.org
Dow
nloaded from
DMD #50278
28
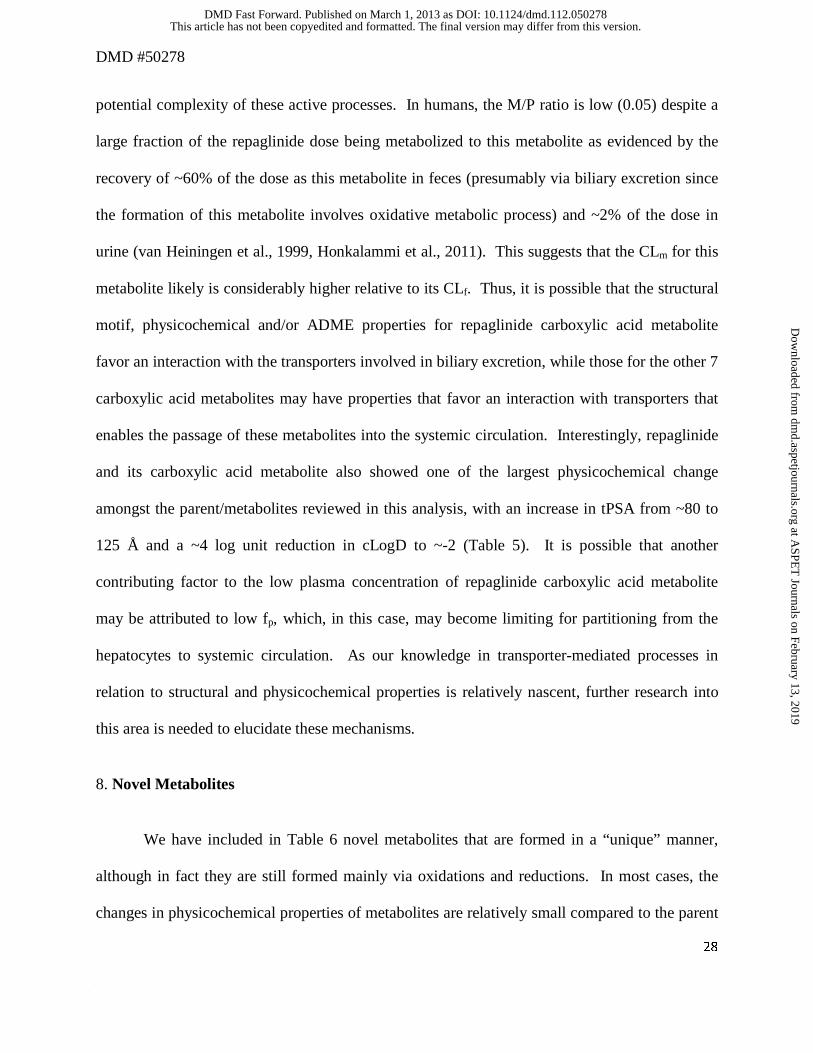
potential complexity of these active processes. In humans, the M/P ratio is low (0.05) despite a
large fraction of the repaglinide dose being metabolized to this metabolite as evidenced by the
recovery of ~60% of the dose as this metabolite in feces (presumably via biliary excretion since
the formation of this metabolite involves oxidative metabolic process) and ~2% of the dose in
urine (van Heiningen et al., 1999, Honkalammi et al., 2011). This suggests that the CLm for this
metabolite likely is considerably higher relative to its CLf. Thus, it is possible that the structural
motif, physicochemical and/or ADME properties for repaglinide carboxylic acid metabolite
favor an interaction with the transporters involved in biliary excretion, while those for the other 7
carboxylic acid metabolites may have properties that favor an interaction with transporters that
enables the passage of these metabolites into the systemic circulation. Interestingly, repaglinide
and its carboxylic acid metabolite also showed one of the largest physicochemical change
amongst the parent/metabolites reviewed in this analysis, with an increase in tPSA from ~80 to
125 Å and a ~4 log unit reduction in cLogD to ~-2 (Table 5). It is possible that another
contributing factor to the low plasma concentration of repaglinide carboxylic acid metabolite
may be attributed to low fp, which, in this case, may become limiting for partitioning from the
hepatocytes to systemic circulation. As our knowledge in transporter-mediated processes in
relation to structural and physicochemical properties is relatively nascent, further research into
this area is needed to elucidate these mechanisms.
8. Novel Metabolites
We have included in Table 6 novel metabolites that are formed in a “unique” manner,
although in fact they are still formed mainly via oxidations and reductions. In most cases, the
changes in physicochemical properties of metabolites are relatively small compared to the parent
This article has not been copyedited and formatted. The final version may differ from this version.DMD Fast Forward. Published on March 1, 2013 as DOI: 10.1124/dmd.112.050278
at ASPE
T Journals on February 13, 2019
dmd.aspetjournals.org
Dow
nloaded from
DMD #50278
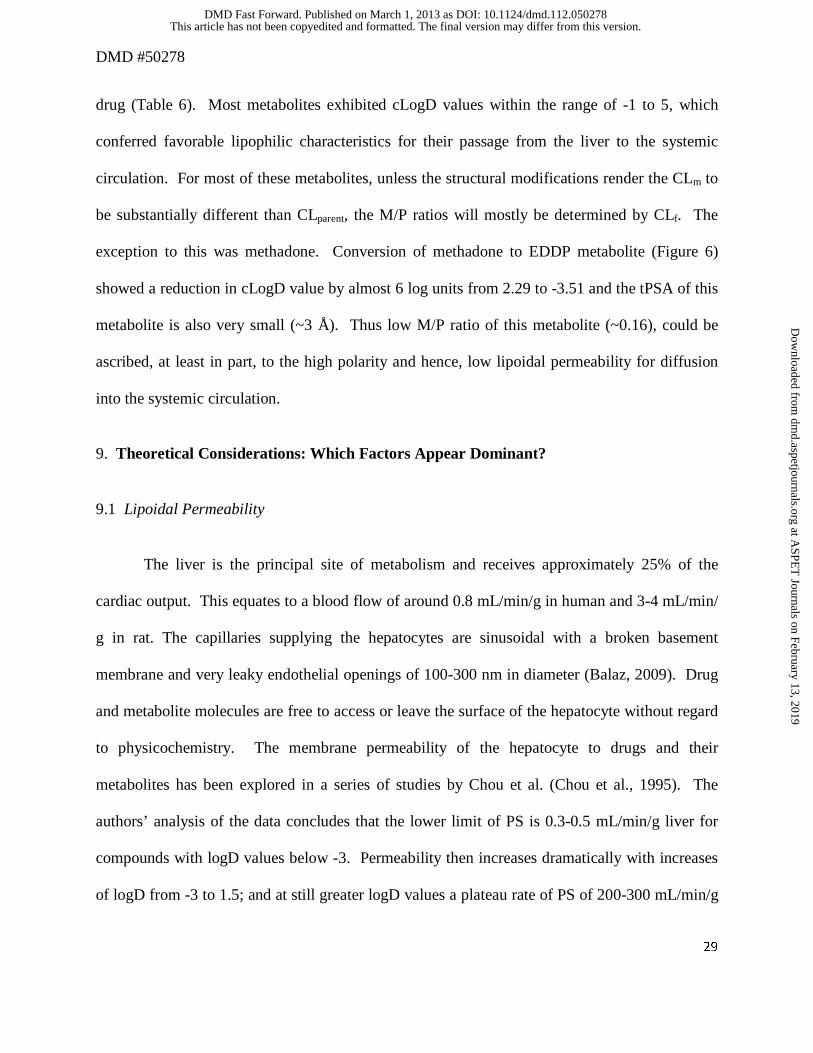
29
drug (Table 6). Most metabolites exhibited cLogD values within the range of -1 to 5, which
conferred favorable lipophilic characteristics for their passage from the liver to the systemic
circulation. For most of these metabolites, unless the structural modifications render the CLm to
be substantially different than CLparent, the M/P ratios will mostly be determined by CLf. The
exception to this was methadone. Conversion of methadone to EDDP metabolite (Figure 6)
showed a reduction in cLogD value by almost 6 log units from 2.29 to -3.51 and the tPSA of this
metabolite is also very small (~3 Å). Thus low M/P ratio of this metabolite (~0.16), could be
ascribed, at least in part, to the high polarity and hence, low lipoidal permeability for diffusion
into the systemic circulation.
9. Theoretical Considerations: Which Factors Appear Dominant?
9.1 Lipoidal Permeability
The liver is the principal site of metabolism and receives approximately 25% of the
cardiac output. This equates to a blood flow of around 0.8 mL/min/g in human and 3-4 mL/min/
g in rat. The capillaries supplying the hepatocytes are sinusoidal with a broken basement
membrane and very leaky endothelial openings of 100-300 nm in diameter (Balaz, 2009). Drug
and metabolite molecules are free to access or leave the surface of the hepatocyte without regard
to physicochemistry. The membrane permeability of the hepatocyte to drugs and their
metabolites has been explored in a series of studies by Chou et al. (Chou et al., 1995). The
authors’ analysis of the data concludes that the lower limit of PS is 0.3-0.5 mL/min/g liver for
compounds with logD values below -3. Permeability then increases dramatically with increases
of logD from -3 to 1.5; and at still greater logD values a plateau rate of PS of 200-300 mL/min/g
This article has not been copyedited and formatted. The final version may differ from this version.DMD Fast Forward. Published on March 1, 2013 as DOI: 10.1124/dmd.112.050278
at ASPE
T Journals on February 13, 2019
dmd.aspetjournals.org
Dow
nloaded from
DMD #50278
30
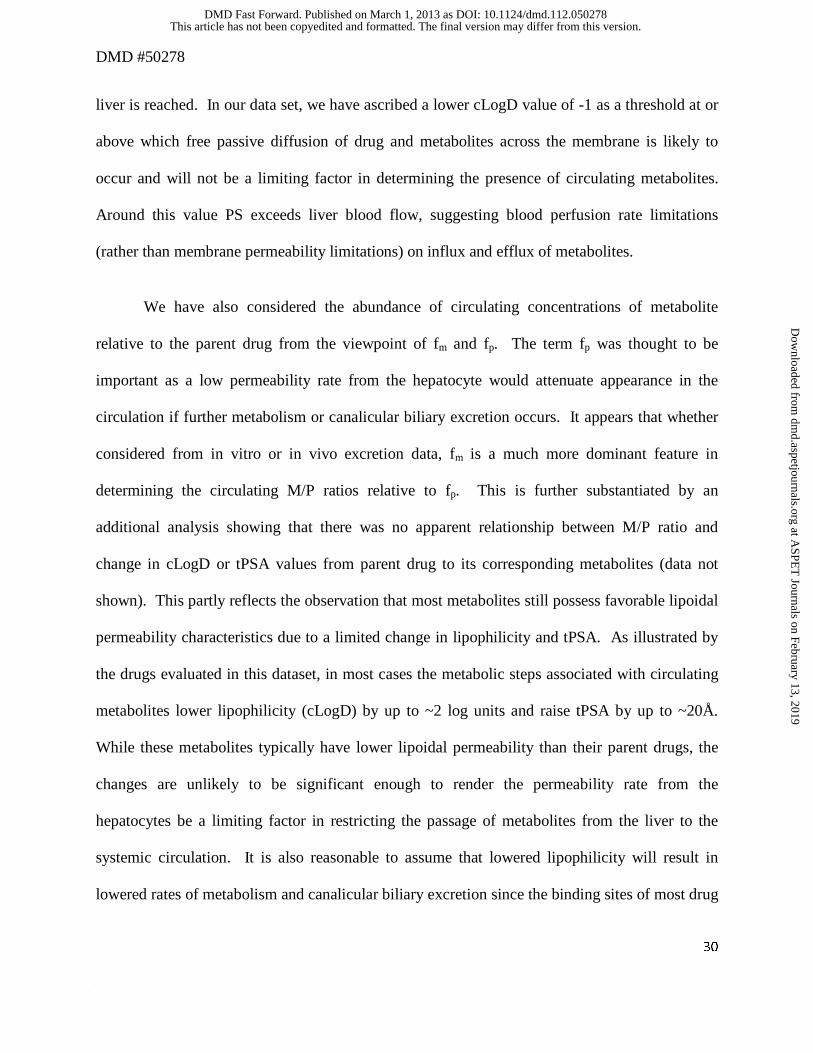
liver is reached. In our data set, we have ascribed a lower cLogD value of -1 as a threshold at or
above which free passive diffusion of drug and metabolites across the membrane is likely to
occur and will not be a limiting factor in determining the presence of circulating metabolites.
Around this value PS exceeds liver blood flow, suggesting blood perfusion rate limitations
(rather than membrane permeability limitations) on influx and efflux of metabolites.
We have also considered the abundance of circulating concentrations of metabolite
relative to the parent drug from the viewpoint of fm and fp. The term fp was thought to be
important as a low permeability rate from the hepatocyte would attenuate appearance in the
circulation if further metabolism or canalicular biliary excretion occurs. It appears that whether
considered from in vitro or in vivo excretion data, fm is a much more dominant feature in
determining the circulating M/P ratios relative to fp. This is further substantiated by an
additional analysis showing that there was no apparent relationship between M/P ratio and
change in cLogD or tPSA values from parent drug to its corresponding metabolites (data not
shown). This partly reflects the observation that most metabolites still possess favorable lipoidal
permeability characteristics due to a limited change in lipophilicity and tPSA. As illustrated by
the drugs evaluated in this dataset, in most cases the metabolic steps associated with circulating
metabolites lower lipophilicity (cLogD) by up to ~2 log units and raise tPSA by up to ~20Å.
While these metabolites typically have lower lipoidal permeability than their parent drugs, the
changes are unlikely to be significant enough to render the permeability rate from the
hepatocytes be a limiting factor in restricting the passage of metabolites from the liver to the
systemic circulation. It is also reasonable to assume that lowered lipophilicity will result in
lowered rates of metabolism and canalicular biliary excretion since the binding sites of most drug
This article has not been copyedited and formatted. The final version may differ from this version.DMD Fast Forward. Published on March 1, 2013 as DOI: 10.1124/dmd.112.050278
at ASPE
T Journals on February 13, 2019
dmd.aspetjournals.org
Dow
nloaded from
DMD #50278
31
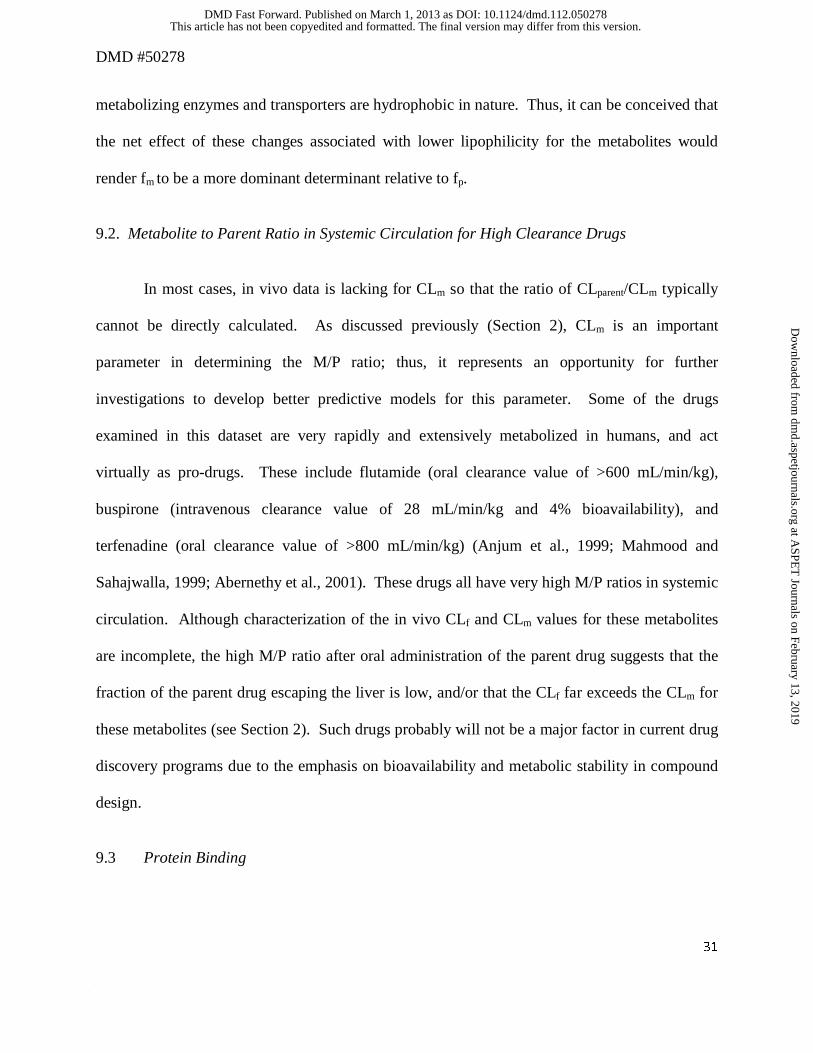
metabolizing enzymes and transporters are hydrophobic in nature. Thus, it can be conceived that
the net effect of these changes associated with lower lipophilicity for the metabolites would
render fm to be a more dominant determinant relative to fp.
9.2. Metabolite to Parent Ratio in Systemic Circulation for High Clearance Drugs
In most cases, in vivo data is lacking for CLm so that the ratio of CLparent/CLm typically
cannot be directly calculated. As discussed previously (Section 2), CLm is an important
parameter in determining the M/P ratio; thus, it represents an opportunity for further
investigations to develop better predictive models for this parameter. Some of the drugs
examined in this dataset are very rapidly and extensively metabolized in humans, and act
virtually as pro-drugs. These include flutamide (oral clearance value of >600 mL/min/kg),
buspirone (intravenous clearance value of 28 mL/min/kg and 4% bioavailability), and
terfenadine (oral clearance value of >800 mL/min/kg) (Anjum et al., 1999; Mahmood and
Sahajwalla, 1999; Abernethy et al., 2001). These drugs all have very high M/P ratios in systemic
circulation. Although characterization of the in vivo CLf and CLm values for these metabolites
are incomplete, the high M/P ratio after oral administration of the parent drug suggests that the
fraction of the parent drug escaping the liver is low, and/or that the CLf far exceeds the CLm for
these metabolites (see Section 2). Such drugs probably will not be a major factor in current drug
discovery programs due to the emphasis on bioavailability and metabolic stability in compound
design.
9.3 Protein Binding
This article has not been copyedited and formatted. The final version may differ from this version.DMD Fast Forward. Published on March 1, 2013 as DOI: 10.1124/dmd.112.050278
at ASPE
T Journals on February 13, 2019
dmd.aspetjournals.org
Dow
nloaded from
DMD #50278
32
In Section 2, it was postulated that overall the reduction in lipophilicity seen in most
cases of metabolism would generally result in a higher free fraction and a lower intrinsic
(unbound) metabolic clearance, thus attenuating the effects on total drug clearance versus total
metabolite clearance. Data are available for several drugs that undergo different metabolic
routes to their corresponding metabolites to illustrate this hypothesis (Table 7). In all cases,
metabolism lowered lipophilicity and increased free fraction. For those metabolites which are
cleared predominantly by metabolism (5/6, desmethylclozapine being predominantly renal), their
total clearances are within 3-fold of that for the parent even though their unbound metabolic or
hepato-biliary (non-renal) clearance differences can be much larger. This attenuation of
differences in clearance is exemplified by darifenacin and its hydroxyl metabolite. The total
clearance of the parent and metabolite is similar but there is a 10-fold difference in unbound
clearance and fraction unbound. Similar trends are observed for chlorpromazine, diltiazem, and
tolterodine (Table 7). These examples illustrate that the effects of the reduction in lipophilicity
seen with metabolism does not have pronounced effects on the ratio of CLparent/CLm..
Although the effect of reduction in lipophicity generally tends to attenuate the influence
on total drug clearance versus total metabolite clearance, an exception to this has been observed
and is related to the new functional group being introduced into the metabolite, which is itself
highly labile to a metabolic route unavailable to the parent. In this case, the metabolite may
display a higher clearance compared to the parent. This exception is illustrated by the metabolic
conversion of propranolol to hydroxypropranolol, which is cleared predominantly by conjugation
of the newly introduced phenolic group. The clearance of this metabolite is higher than its
parent (Table 7), consistent with its very low concentration after systemic administration and its
presence being observed only after the rapid first-pass effects seen for parent after oral
This article has not been copyedited and formatted. The final version may differ from this version.DMD Fast Forward. Published on March 1, 2013 as DOI: 10.1124/dmd.112.050278
at ASPE
T Journals on February 13, 2019
dmd.aspetjournals.org
Dow
nloaded from
DMD #50278
33
administration. This reinforces the observation that besides protein binding, additional factors
such as the new structural motif(s) introduced into the metabolite, should be taken into
consideration when determining the potential influence of structural-chemical changes on the
CLm of the metabolite.
9.4 Pivotal role of fm
Given the pivotal role that fm plays in determining the AUC of a given metabolite (see
Section 2), and hence its relative abundance in relation to the parent drug, an additional analysis
was conducted to ascertain if there is a threshold value that can be identified to be associated
with a M/P ratio of >25%. The data (M/P ratios and fm values) used in this analysis are listed in
Tables 1-5. The fm values were estimated from data obtained in human ADME studies with
radiolabeled drugs. The fraction of dose for the metabolite of interest and its sequential
metabolic products recovered in excreta (both urine and feces) was assumed to be representative
of the in vivo fm value. Data were available for a total of 60 metabolites in this dataset, and the
results are presented in Figure 7. Visual inspection of this data suggests that fm value of 0.15
appears to be a reasonable threshold value to distinguish the metabolites that may circulate with
abundance exceeding the threshold of 25% of parent AUC compared to those that do not. Using
this threshold fm value, 4 metabolites have been identified as “false negative” in that while the fm
values are below 0.15, the M/P ratios exceed the threshold of 0.25. These 4 metabolites are
cyclized indole product of elzasonan, 2-hydroxycyclopentyl ruxolitinib, zolmitriptan N-oxide,
and N-desmethylzolmitriptan. The reason(s) for this is not readily apparent, but it could be
postulated that underestimation of fm (possibly related to incomplete collection of radioactive
dose and/or characterization of the metabolite profiles for elzasonan (79% of dose recovered),
This article has not been copyedited and formatted. The final version may differ from this version.DMD Fast Forward. Published on March 1, 2013 as DOI: 10.1124/dmd.112.050278
at ASPE
T Journals on February 13, 2019
dmd.aspetjournals.org
Dow
nloaded from
DMD #50278
34
and potential back-conversion of N-oxide to parent in feces for zolmitriptan) may have
contributed to this discordance.
When the M/P ratio for the aglycone of the arenol metabolites were used in this analysis,
there were 14 “false positives” identified (i.e., fm of >0.15 but M/P of <0.25). Amongst these 14
“false positives”, the most common structures are the arenol metabolites where the circulating
level of the aglycone is negligible. However, when the M/P values for the conjugates of these
arenol metabolites were plotted instead (Figure 7), the number of “false positive” is reduced to 6.
Three of these 6 metabolites appear to be conjugated (5-hydroxyelzasonan, O-desalkyl
flecainide, and 5-methylhydroxy valdecoxib) and excreted; however, the conjugate was not
reported to be present in plasma. Two additional metabolites (t-butyl hydroxybosentan and
repaglinide carboxylic acid) may also display similar properties in that once formed, these
metabolites likely favors excretion into the bile rather than being transported to the systemic
circulation. N-desmethylzopiclone represents a marginal case in that the fm value is estimated to
be 0.17 while the M/P ratio is 0.2.
Using the threshold fm value of 0.15, the false negative and the false positive rates (when
the M/P ratios of the conjugates of the arenol metabolites are considered) are 10% (4 out of 40
metabolites) and 30% (6 out of 20 metabolites), respectively, which represent a reasonable trade-
off since further reduction in the false negative rate will increase the false positive rate
considerably. Moreover, this suggested threshold value may be further refined as more data
become available in the future.
10. Special Considerations
This article has not been copyedited and formatted. The final version may differ from this version.DMD Fast Forward. Published on March 1, 2013 as DOI: 10.1124/dmd.112.050278
at ASPE
T Journals on February 13, 2019
dmd.aspetjournals.org
Dow
nloaded from
DMD #50278
35
10.1 Genetic Polymorphisms
Genetic polymorphisms of the drug metabolizing enzymes play an important role in
influencing the disposition of many drugs and metabolites. In this analysis, a few examples
illustrate the important influence of genetic polymorphisms on the abundance of major
circulating metabolites. The first set of examples involves the differences in the abundance of
circulating metabolites between extensive (EM) and poor metabolizers (PM) of CYP2C19 and
CYP2D6. In the former case, the M/P ratio of lansoprazole sulfone in CYP2C19 PM (0.88) was
considerably higher than those in the CYP2C19 homozygous EM and heterozygous EM (<0.1).
Another example that showed a similar pattern was atomoxetine, which is metabolized by
CYP2D6 (aromatic 4-hydroxylation, major pathway in CYP2D6 EM) and CYP2C19 (N-
demethylation) (Sauer et al., 2005). In CYP2D6 EM subjects, 4-OH atomoxetine glucuronide
constitutes the major circulating moiety, while the plasma AUC ratios of N-desmethyl
atomoxetine and 4-hydroxyatomoxetine to parent were low (<0.1) (Sauer et al., 2003).
Moreover, in CYP2D6 PM, the AUC ratio of N-desmethyl atomoxetine to parent drug was 0.33
to 0.42 (Sauer et al., 2003); FDA Clinical Pharmacology Review:
http://www.accessdata.fda.gov/drugsatfda_docs/nda/2002/21-411_Strattera_biopharmr_P2.pdf),
thus constituting a moiety that needs to be considered for assessment for potential DDI under the
current EMA and draft FDA Guidance. These examples highlight the need to evaluate the
abundance of circulating metabolites in relation to the genotype and phenotype of the
metabolizing enzymes, if genetic polymorphisms are known to exist for the particular enzyme of
interest.
This article has not been copyedited and formatted. The final version may differ from this version.DMD Fast Forward. Published on March 1, 2013 as DOI: 10.1124/dmd.112.050278
at ASPE
T Journals on February 13, 2019
dmd.aspetjournals.org
Dow
nloaded from
DMD #50278
36
Another set of examples that illustrate the importance of gene dose on the abundance of
the circulating metabolites include nortriptyline and codeine. In humans, nortriptyline undergoes
CYP2D6-mediated hydroxylation to form the cyclic E-10-hydroxynortriptyline (major form of
this metabolite), while the formation of Z-10-hydroxynortriptyline (minor form of this
metabolite) is not related to CYP2D6 polymorphism. Dalen and co-workers demonstrated that
the ratio of AUC of 10-hydroxynortriptyline to parent increased with the number of functional
CYP2D6 genes, ranging from 0.36 in subjects with no functional CYP2D6 genes to 13 in
subjects with 13 functional CYP2D6 genes (Dalen et al., 1998). Likewise, in humans, codeine
undergoes CYP2D6-mediated demethylation to form morphine, which is glucuronidated to
morphine 3-glucuronide and morphine 6-glucuronide. In subjects who are CYP2D6 PM, ratio of
plasma AUC for morphine to codeine was minimal (0.008), whereas this ratio was higher in
subjects who are CYP2D6 EM (0.06) and CYP2D6 UM (0.08) (Kirchheiner et al., 2007).
Furthermore, in these same subjects, the systemic exposure (plasma AUC) of morphine 3-
glucuronide and morphine 6-glucuronide (pharmacologically active) in CYP2D6 EM and UM
were substantially higher than in CYP2D6 PM. Thus, gene dose can exert a significant influence
on the systemic exposure to the circulating metabolites and should be taken into consideration
when attempting to project the abundance of circulating metabolites.
10.2. Caveats to this Analysis
This analysis is intended to assess general trends regarding possible relationship of
structural motif and the associated physicochemical properties of the metabolites to their relative
abundance in systemic circulation. Attempts to rationalize some of the observed trends were
made based on existing known biologic and/or chemistry principles. However, there are some
This article has not been copyedited and formatted. The final version may differ from this version.DMD Fast Forward. Published on March 1, 2013 as DOI: 10.1124/dmd.112.050278
at ASPE
T Journals on February 13, 2019
dmd.aspetjournals.org
Dow
nloaded from
DMD #50278
37
significant knowledge gaps in certain areas where mechanistic insights are lacking to fully
understand the observed results. Plausible hypotheses for further testing are postulated for
subsequent confirmation when feasible. Not surprisingly, results of this analysis point to the
need for: (1) further understanding of the scaling for conjugation reactions (e.g., glucuronidation
and sulfation) to provide a more accurate estimate of CLm for the alcohol and arenol metabolites
in order to better predict the ratio of AUC of metabolite to parent, (2) an integrated approach to
combine metabolism and transport data for quantitative prediction, particularly the transport
processes in the liver that mediate biliary excretion vs passage into systemic circulation, and (3)
a more complete understanding of the interplay between physicochemical properties for passive
processes with spatial arrangement of the compound for its affinity to enzymatic/active transport
processes.
Another caveat to our results involves the complexity of the metabolic pathways. In this
dataset, the vast majority of the circulating metabolites are formed from primary
biotransformation pathways. However, in humans, there are examples where the major
circulating metabolites are derived from secondary or tertiary biotransformation steps, e.g.,
torceptrapib (Dalvie et al., 2008). Since the ability for the in vitro systems to predict these
secondary or tertiary metabolites is poor (Dalvie et al., 2009), there is still the necessity to
confirm the major circulating metabolites in a human in vivo ADME study with radiolabeled
drug. In addition, this analysis only addressed the relative abundance of the metabolite to parent,
and there is no attempt to assess structure-physicochemical properties in relation to
pharmacologic activity. Clearly, in drug discovery and development programs, an understanding
of both aspects is essential.
This article has not been copyedited and formatted. The final version may differ from this version.DMD Fast Forward. Published on March 1, 2013 as DOI: 10.1124/dmd.112.050278
at ASPE
T Journals on February 13, 2019
dmd.aspetjournals.org
Dow
nloaded from
DMD #50278
38
11. Summary
To our knowledge, this is one of the first attempts to assess the relative abundance of
circulating metabolites using an integrated approach of principles of metabolite kinetics along
with structure-physicochemical properties of the parent/metabolites. The analysis was conducted
in a dataset comprising 125 drugs with their circulating metabolites. The major factors identified
in this analysis that will favor a given circulating metabolite to exceed the threshold of 25% of
parent appears be: a fm value of >15%, a clogD value of > -1, and structural motif that minimizes
the CLm relative to its CLf. Potential hypotheses are proposed where exceptions to these general
trends are observed, which provides opportunities for further scientific investigations to refine
these recommendations.
This article has not been copyedited and formatted. The final version may differ from this version.DMD Fast Forward. Published on March 1, 2013 as DOI: 10.1124/dmd.112.050278
at ASPE
T Journals on February 13, 2019
dmd.aspetjournals.org
Dow
nloaded from
DMD #50278
39
Authorship Contribution:
Participated in research design: Cho-Ming Loi, Dennis Smith, Deepak Dalvie
Performed data analysis: Cho-Ming Loi, Dennis Smith, Deepak Dalvie
Wrote or contributed to the writing of the manuscript: Cho-Ming Loi, Dennis Smith, Deepak
Dalvie
This article has not been copyedited and formatted. The final version may differ from this version.DMD Fast Forward. Published on March 1, 2013 as DOI: 10.1124/dmd.112.050278
at ASPE
T Journals on February 13, 2019
dmd.aspetjournals.org
Dow
nloaded from
DMD #50278
40
References
Abernethy DR, Barbey JT, Franc J, Brown KS, Feirrera I, Ford N, and Salazar DE (2001) Loratadine and terfenadine interaction with nefazodone: Both antihistamines are associated with QTc prolongation. Clin Pharmacol Ther 69:96-103.
Anjum S, Swan SK, Lambrecht LJ, Radwanski E, Cutler DL, Affrime MB, and Halstenson CE (1999) Pharmacokinetics of flutamide in patients with renal insufficiency. Br J Clin Pharmacol 47:43-47.
Baillie TA (2008) Metabolism and toxicity of drugs. Two decades of progress in industrial drug metabolism. Chem Res Toxicol 21:129-137.
Balaz S (2009) Modeling kinetics of subcellular disposition of chemicals. Chem Rev 109:1793-1899.
Borin MT, Chambers JH, Carel BJ, Gagnon S, and Freimuth WW (1997a) Pharmacokinetic study of the interaction between rifampin and delavirdine mesylate. Clin Pharmacol Ther 61:544-553.
Borin MT, Cox SR, Herman BD, Carel BJ, Anderson RD, and Freimuth WW (1997b) Effect of fluconazole on the steady-state pharmacokinetics of delavirdine in human immunodeficiency virus-positive patients. Antimicrob Agents Chemother 41:1892-1897.
Boyd RA, Chin SK, Don-Pedro O, Verotta D, Sheiner LB, Williams RL, and Giacomini KM (1989) The pharmacokinetics and pharmacodynamics of diltiazem and its metabolites in healthy adults after a single oral dose. Clin Pharmacol Ther 46:408-419.
Bratton SM, Mosher CM, Khallouki F, Finel M, Court MH, Moran JH, and Radominska-Pandya A (2012) Analysis of R- and S-hydroxywarfarin glucuronidation catalyzed by human liver microsomes and recombinant UDP-glucuronosyltransferases. J Pharmacol Exp Ther 340:46-55.
Budde K, Neumayer HH, Fritsche L, Sulowicz W, Stompor T, and Eckland D (2003) The pharmacokinetics of pioglitazone in patients with impaired renal function. Br J Clin Pharmacol 55:368-374.
Chang WH, Lin SK, Lane HY, Wei FC, Hu WH, Lam YW, and Jann MW (1998) Reversible metabolism of clozapine and clozapine N-oxide in schizophrenic patients. Prog Neuropsychopharmacol Biol Psychiatry 22:723-739.
Chou C, McLachlan AJ, and Rowland M (1995) Membrane permeability and lipophilicity in the isolated perfused rat liver: 5-ethyl barbituric acid and other compounds. J Pharmacol Exp Ther 275:933-940.
This article has not been copyedited and formatted. The final version may differ from this version.DMD Fast Forward. Published on March 1, 2013 as DOI: 10.1124/dmd.112.050278
at ASPE
T Journals on February 13, 2019
dmd.aspetjournals.org
Dow
nloaded from
DMD #50278
41
Christ DD (1995) Human plasma protein binding of the angiotensin II receptor antagonist losartan potassium (DuP 753/MK 954) and its pharmacologically active metabolite EXP3174. J Clin Pharmacol 35:515-520.
Dalen P, Dahl ML, Bernal Ruiz ML, Nordin J, and Bertilsson L (1998) 10-Hydroxylation of nortriptyline in white persons with 0, 1, 2, 3, and 13 functional CYP2D6 genes. Clin Pharmacol Ther 63:444-452.
Dalvie D, Chen W, Zhang C, Vaz AD, Smolarek TA, Cox LM, Lin J, and Obach RS (2008) Pharmacokinetics, metabolism, and excretion of torcetrapib, a cholesteryl ester transfer protein inhibitor, in humans. Drug Metab Dispos 36:2185-2198.
Dalvie D, Obach RS, Kang P, Prakash C, Loi CM, Hurst S, Nedderman A, Goulet L, Smith E, Bu HZ, and Smith DA (2009) Assessment of three human in vitro systems in the generation of major human excretory and circulating metabolites. Chem Res Toxicol 22:357-368.
Davis-Bruno KL and Atrakchi A (2006) A regulatory perspective on issues and approaches in characterizing human metabolites. Chem Res Toxicol 19:1561-1563.
DeMaio W, Kane CP, Nichols AI, and Jordan R (2011) Metabolism Studies of Desvenlafaxine. J Bioequiv Availab 3:151-160.
Eap CB, Buclin T, Cucchia G, Zullino D, Hustert E, Bleiber G, Golay KP, Aubert AC, Baumann P, Telenti A, and Kerb R (2004) Oral administration of a low dose of midazolam (75 microg) as an in vivo probe for CYP3A activity. Eur J Clin Pharmacol 60:237-246.
Eckland DA and Danhof M (2000) Clinical Pharmacokinetics of pioglitazone. Exp Clin Endocrinol Diabetes 108:S234-S-242.
Freedberg KA, Innis RB, Creese I, and Snyder SH (1979) Antischizophrenic drugs: differential plasma protein binding and therapeutic activity. Life Sci 24:2467-2473.
Frohna P, Lu J, Eppler S, Hamilton M, Wolf J, Rakhit A, Ling J, Kenkare-Mitra SR, and Lum BL (2006) Evaluation of the absolute oral bioavailability and bioequivalence of erlotinib, an inhibitor of the epidermal growth factor receptor tyrosine kinase, in a randomized, crossover study in healthy subjects. J Clin Pharmacol 46:282-290.
Fura A (2006) Role of pharmacologically active metabolites in drug discovery and development. Drug Discov Today 11:133-142.
Gschwind HP, Pfaar U, Waldmeier F, Zollinger M, Sayer C, Zbinden P, Hayes M, Pokorny R, Seiberling M, Ben-Am M, Peng B, and Gross G (2005) Metabolism and disposition of imatinib mesylate in healthy volunteers. Drug Metab Dispos 33:1503-1512.
This article has not been copyedited and formatted. The final version may differ from this version.DMD Fast Forward. Published on March 1, 2013 as DOI: 10.1124/dmd.112.050278
at ASPE
T Journals on February 13, 2019
dmd.aspetjournals.org
Dow
nloaded from
DMD #50278
42
Hartman JC, Brouwer K, Mandagere A, Melvin L, and Gorczynski R (2010) Evaluation of the endothelin receptor antagonists ambrisentan, darusentan, bosentan, and sitaxsentan as substrates and inhibitors of hepatobiliary transporters in sandwich-cultured human hepatocytes. Can J Physiol Pharmacol 88:682-691.
Heizmann P and Ziegler WH (1981) Excretion and metabolism of 14C-midazolam in humans following oral dosing. Arzneimittelforschung 31:2220-2223.
Herrlin K, Yasui-Furukori N, Tybring G, Widen J, Gustafsson LL, and Bertilsson L (2003) Metabolism of citalopram enantiomers in CYP2C19/CYP2D6 phenotyped panels of healthy Swedes. Br J Clin Pharmacol 56:415-421.
Hesse LM, Venkatakrishnan K, Court MH, von Moltke LL, Duan SX, Shader RI, and Greenblatt DJ (2000) CYP2B6 mediates the in vitro hydroxylation of bupropion: potential drug interactions with other antidepressants. Drug Metab Dispos 28:1176-1183.
Honkalammi J, Niemi M, Neuvonen PJ, and Backman JT (2011) Dose-dependent interaction between gemfibrozil and repaglinide in humans: strong inhibition of CYP2C8 with subtherapeutic gemfibrozil doses. Drug Metab Dispos 39:1977-1986.
Houston JB (1982) Drug Metabolite Kinetics. Pharmacol Ther 15:521-552.
Howell SR, Husbands GE, Scatina JA, and Sisenwine SF (1993) Metabolic disposition of 14C-venlafaxine in mouse, rat, dog, rhesus monkey and man. Xenobiotica 23:349-359.
Hynninen VV, Olkkola KT, Bertilsson L, Kurkinen K, Neuvonen PJ, and Laine K (2008) Effect of terbinafine and voriconazole on the pharmacokinetics of the antidepressant venlafaxine. Clin Pharmacol Ther 83:342-348.
Isin EM, Elmore CS, Nilsson GN, Thompson RA, and Weidolf L (2012) Use of radiolabeled compounds in drug metabolism and pharmacokinetic studies. Chem Res Toxicol 25:532-542.
Isoherranen N, Hachad H, Yeung CK, and Levy RH (2009) Qualitative analysis of the role of metabolites in inhibitory drug-drug interactions: literature evaluation based on the metabolism and transport drug interaction database. Chem Res Toxicol 22:294-298.
Isoherranen N, Kunze KL, Allen KE, Nelson WL, and Thummel KE (2004) Role of itraconazole metabolites in CYP3A4 inhibition. Drug Metab Dispos 32:1121-1131.
Jaworski TJ, Hawes EM, McKay G, and Midha KK (1990) The metabolism of chlorpromazine N-oxide in man and dog. Xenobiotica 20:107-115.
Kamel A, Obach RS, Colizza K, Wang W, O'Connell TN, Coelho RV, Jr., Kelley RM, and Schildknegt K (2010) Metabolism, pharmacokinetics, and excretion of the 5-
This article has not been copyedited and formatted. The final version may differ from this version.DMD Fast Forward. Published on March 1, 2013 as DOI: 10.1124/dmd.112.050278
at ASPE
T Journals on February 13, 2019
dmd.aspetjournals.org
Dow
nloaded from
DMD #50278
43
hydroxytryptamine1b receptor antagonist elzasonan in humans. Drug Metab Dispos 38:1984-1999.
Kassahun K, Mattiuz E, Nyhart E, Jr., Obermeyer B, Gillespie T, Murphy A, Goodwin RM, Tupper D, Callaghan JT, and Lemberger L (1997) Disposition and biotransformation of the antipsychotic agent olanzapine in humans. Drug Metab Dispos 25:81-93.
Kerbusch T, Milligan PA, and Karlsson MO (2004) Assessment of the relative in vivo potency of the hydroxylated metabolite of darifenacin in its ability to decrease salivary flow using pooled population pharmacokinetic-pharmacodynamic data. Br J Clin Pharmacol 57:170-180.
Kim KA, Song WK, and Park JY (2009) Association of CYP2B6, CYP3A5, and CYP2C19 genetic polymorphisms with sibutramine pharmacokinetics in healthy Korean subjects. Clin Pharmacol Ther 86:511-518.
Kirchheiner J, Schmidt H, Tzvetkov M, Keulen JT, Lotsch J, Roots I, and Brockmoller J (2007) Pharmacokinetics of codeine and its metabolite morphine in ultra-rapid metabolizers due to CYP2D6 duplication. Pharmacogenomics J 7:257-265.
Kroemer HK, Funck-Brentano C, Silberstein DJ, Wood AJ, Eichelbaum M, Woosley RL, and Roden DM (1989) Stereoselective disposition and pharmacologic activity of propafenone enantiomers. Circulation 79:1068-1076.
Levy RH, Lane EA, Guyot M, Brachet-Liermain A, Cenraud B, and Loiseau P (1983) Analysis of parent drug-metabolite relationship in the presence of an inducer. Application to the carbamazepine-clobazam interaction in normal man. Drug Metab Dispos 11:286-292.
Lin JH and Lu AY (1997) Role of pharmacokinetics and metabolism in drug discovery and development. Pharmacol Rev 49:403-449.
Ling J, Johnson KA, Miao Z, Rakhit A, Pantze MP, Hamilton M, Lum BL, and Prakash C (2006) Metabolism and excretion of erlotinib, a small molecule inhibitor of epidermal growth factor receptor tyrosine kinase, in healthy male volunteers. Drug Metab Dispos 34:420-426.
Lo MW, Goldberg MR, McCrea JB, Lu H, Furtek CI, and Bjornsson TD (1995) Pharmacokinetics of losartan, an angiotensin II receptor antagonist, and its active metabolite EXP3174 in humans. Clin Pharmacol Ther 58:641-649.
Lutz JD, Fujioka Y, and Isoherranen N (2010) Rationalization and prediction of in vivo metabolite exposures: the role of metabolite kinetics, clearance predictions and in vitro parameters. Expert Opin Drug Metab Toxicol 6:1095-1109.
This article has not been copyedited and formatted. The final version may differ from this version.DMD Fast Forward. Published on March 1, 2013 as DOI: 10.1124/dmd.112.050278
at ASPE
T Journals on February 13, 2019
dmd.aspetjournals.org
Dow
nloaded from
DMD #50278
44
Lutz JD and Isoherranen N (2012) Prediction of relative in vivo metabolite exposure from in vitro data using two model drugs: dextromethorphan and omeprazole. Drug Metab Dispos 40:159-168.
Mahmood I and Sahajwalla C (1999) Clinical pharmacokinetics and pharmacodynamics of buspirone, an anxiolytic drug. Clin Pharmacokinet 36:277-287.
Matsushima S, Maeda K, Hayashi H, Debori Y, Schinkel AH, Schuetz JD, Kusuhara H, and Sugiyama Y (2008) Involvement of multiple efflux transporters in hepatic disposition of fexofenadine. Mol Pharmacol 73:1474-1483.
McDonald MG, Au NT, Wittkowsky AK, and Rettie AE (2012) Warfarin-amiodarone drug-drug interactions: determination of [I](u)/K(I,u) for amiodarone and its plasma metabolites. Clin Pharmacol Ther 91:709-717.
Morse GD, Fischl MA, Shelton MJ, Cox SR, Driver M, DeRemer M, and Freimuth WW (1997) Single-dose pharmacokinetics of delavirdine mesylate and didanosine in patients with human immunodeficiency virus infection. Antimicrob Agents Chemother 41:169-174.
Nedderman AN, Dear GJ, North S, Obach RS, and Higton D (2011) From definition to implementation: a cross-industry perspective of past, current and future MIST strategies. Xenobiotica 41:605-622.
Obach RS, Lombardo F, and Waters NJ (2008) Trend analysis of a database of intravenous pharmacokinetic parameters in humans for 670 drug compounds. Drug Metab Dispos 36:1385-1405.
Oppermann UC and Maser E (2000) Molecular and structural aspects of xenobiotic carbonyl metabolizing enzymes. Role of reductases and dehydrogenases in xenobiotic phase I reactions. Toxicology 144:71-81.
Pahlman I and Gozzi P (1999) Serum protein binding of tolterodine and its major metabolites in humans and several animal species. Biopharm Drug Dispos 20:91-99.
Patat A, Troy S, Burke J, Trocherie S, Danjou P, Le Coz F, Allain H, and Gandon JM (1998) Absolute bioavailability and electroencephalographic effects of conventional and extended-release formulations of venlafaxine in healthy subjects. J Clin Pharmacol 38:256-267.
Penner N, Xu L, and Prakash C (2012) Radiolabeled absorption, distribution, metabolism, and excretion studies in drug development: why, when, and how? Chem Res Toxicol 25:513-531.
This article has not been copyedited and formatted. The final version may differ from this version.DMD Fast Forward. Published on March 1, 2013 as DOI: 10.1124/dmd.112.050278
at ASPE
T Journals on February 13, 2019
dmd.aspetjournals.org
Dow
nloaded from
DMD #50278
45
Riley P, Figary PC, Entwisle JR, Roe AL, Thompson GA, Ohashi R, Ohashi N, and Moorehead TJ (2005) The metabolic profile of azimilide in man: in vivo and in vitro evaluations. J Pharm Sci 94:2084-2095.
Rochester CL, Gammon DE, Shane E, and Bilezikian JP (1980) A radioreceptor assay for propranolol and 4-hydroxypropranolol. Clin Pharmacol Ther 28:32-39.
Roffey SJ, Cole S, Comby P, Gibson D, Jezequel SG, Nedderman AN, Smith DA, Walker DK, and Wood N (2003) The disposition of voriconazole in mouse, rat, rabbit, guinea pig, dog, and human. Drug Metab Dispos 31:731-741.
Roffey SJ, Obach RS, Gedge JI, and Smith DA (2007) What is the objective of the mass balance study? A retrospective analysis of data in animal and human excretion studies employing radiolabeled drugs. Drug Metab Rev 39:17-43.
Sarapa N, Britto MR, Mainka MB, and Parivar K (2005) The effect of mild and moderate hepatic impairment on the pharmacokinetics of valdecoxib, a selective COX-2 inhibitor. Eur J Clin Pharmacol 61:247-256.
Sauer JM, Ponsler GD, Mattiuz EL, Long AJ, Witcher JW, Thomasson HR, and Desante KA (2003) Disposition and metabolic fate of atomoxetine hydrochloride: the role of CYP2D6 in human disposition and metabolism. Drug Metab Dispos 31:98-107.
Sauer JM, Ring BJ, and Witcher JW (2005) Clinical pharmacokinetics of atomoxetine. Clin Pharmacokinet 44:571-590.
Schaber G, Stevens I, Gaertner HJ, Dietz K, and Breyer-Pfaff U (1998) Pharmacokinetics of clozapine and its metabolites in psychiatric patients: plasma protein binding and renal clearance. Br J Clin Pharmacol 46:453-459.
Smith DA and Dalvie D (2012) Why do metabolites circulate? Xenobiotica 42:107-126.
van Giersbergen PL, Halabi A, and Dingemanse J (2002) Single- and multiple-dose pharmacokinetics of bosentan and its interaction with ketoconazole. Br J Clin Pharmacol 53:589-595.
van Heiningen PN, Hatorp V, Kramer Nielsen K, Hansen KT, van Lier JJ, De Merbel NC, Oosterhuis B, and Jonkman JH (1999) Absorption, metabolism and excretion of a single oral dose of (14)C-repaglinide during repaglinide multiple dosing. Eur J Clin Pharmacol 55:521-525.
von Moltke LL, Greenblatt DJ, Granda BW, Grassi JM, Schmider J, Harmatz JS, and Shader RI (1999) Nefazodone, meta-chlorophenylpiperazine, and their metabolites in vitro: cytochromes mediating transformation, and P450-3A4 inhibitory actions. Psychopharmacology (Berl) 145:113-122.
This article has not been copyedited and formatted. The final version may differ from this version.DMD Fast Forward. Published on March 1, 2013 as DOI: 10.1124/dmd.112.050278
at ASPE
T Journals on February 13, 2019
dmd.aspetjournals.org
Dow
nloaded from
DMD #50278
46
Voorman RL, Maio SM, Hauer MJ, Sanders PE, Payne NA, and Ackland MJ (1998a) Metabolism of delavirdine, a human immunodeficiency virus type-1 reverse transcriptase inhibitor, by microsomal cytochrome P450 in humans, rats, and other species: probable involvement of CYP2D6 and CYP3A. Drug Metab Dispos 26:631-639.
Voorman RL, Maio SM, Payne NA, Zhao Z, Koeplinger KA, and Wang X (1998b) Microsomal metabolism of delavirdine: evidence for mechanism-based inactivation of human cytochrome P450 3A. J Pharmacol Exp Ther 287:381-388.
Weber C, Gasser R, and Hopfgartner G (1999) Absorption, excretion, and metabolism of the endothelin receptor antagonist bosentan in healthy male subjects. Drug Metab Dispos 27:810-815.
Weiss YA, Safar ME, Lehner JP, Levenson JA, Simon A, and Alexandre JM (1978) (+)-Propranolol clearance, an estimation of hepatic blood flow in man. Br J Clin Pharmacol 5:457-460.
Yeung CK, Fujioka Y, Hachad H, Levy RH, and Isoherranen N (2011) Are circulating metabolites important in drug-drug interactions?: Quantitative analysis of risk prediction and inhibitory potency. Clin Pharmacol Ther 89:105-113.
Yeung PK, Hubbard JW, Korchinski ED, and Midha KK (1993) Pharmacokinetics of chlorpromazine and key metabolites. Eur J Clin Pharmacol 45:563-569.
Yuan JJ, Yang DC, Zhang JY, Bible R, Jr., Karim A, and Findlay JW (2002) Disposition of a specific cyclooxygenase-2 inhibitor, valdecoxib, in human. Drug Metab Dispos 30:1013-1021.
This article has not been copyedited and formatted. The final version may differ from this version.DMD Fast Forward. Published on March 1, 2013 as DOI: 10.1124/dmd.112.050278
at ASPE
T Journals on February 13, 2019
dmd.aspetjournals.org
Dow
nloaded from
DMD #50278
47
Legends for Figures
Figure 1 Scheme depicting potential routes of metabolite disposition
Figure 2 Relationship between M/P ratio and cLog D values for amine metabolites (A, all metabolites and B, expanded view).
Figure 3 Structures of selected drugs that form amine metabolites.
Figure 4 Structures of selected drugs that form alcohol metabolites.
Figure 5 Structures of selected drugs that form arenol metabolites.
Figure 6 Scheme showing conversion of repaglinide to repaglinide carboxylic acid and methadone to EDDP metabolite.
Figure 7 Relationship of metabolite to parent AUC ratio as a function of fm (A, all metabolites and B, expanded view).
This article has not been copyedited and formatted. The final version may differ from this version.DMD Fast Forward. Published on March 1, 2013 as DOI: 10.1124/dmd.112.050278
at ASPE
T Journals on February 13, 2019
dmd.aspetjournals.org
Dow
nloaded from
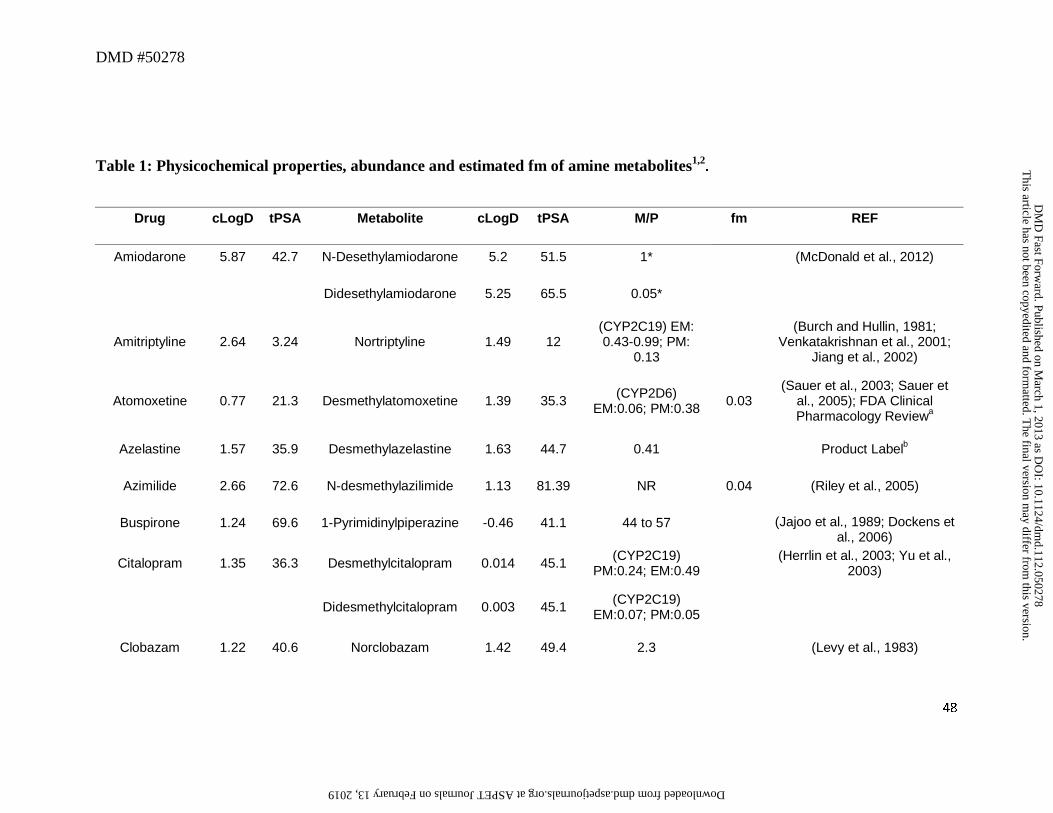
DMD #50278
48
Table 1: Physicochemical properties, abundance and estimated fm of amine metabolites1,2.
Drug cLogD tPSA Metabolite cLogD tPSA M/P fm REF
Amiodarone 5.87 42.7 N-Desethylamiodarone 5.2 51.5 1* (McDonald et al., 2012)
Didesethylamiodarone 5.25 65.5 0.05*
Amitriptyline 2.64 3.24 Nortriptyline 1.49 12 (CYP2C19) EM: 0.43-0.99; PM:
0.13
(Burch and Hullin, 1981; Venkatakrishnan et al., 2001;
Jiang et al., 2002)
Atomoxetine 0.77 21.3 Desmethylatomoxetine 1.39 35.3 (CYP2D6) EM:0.06; PM:0.38 0.03
(Sauer et al., 2003; Sauer et al., 2005); FDA Clinical Pharmacology Reviewa
Azelastine 1.57 35.9 Desmethylazelastine 1.63 44.7 0.41 Product Labelb
Azimilide 2.66 72.6 N-desmethylazilimide 1.13 81.39 NR 0.04 (Riley et al., 2005)
Buspirone 1.24 69.6 1-Pyrimidinylpiperazine -0.46 41.1 44 to 57 (Jajoo et al., 1989; Dockens et al., 2006)
Citalopram 1.35 36.3 Desmethylcitalopram 0.014 45.1 (CYP2C19) PM:0.24; EM:0.49 (Herrlin et al., 2003; Yu et al.,
2003)
Didesmethylcitalopram 0.003 45.1 (CYP2C19) EM:0.07; PM:0.05
Clobazam 1.22 40.6 Norclobazam 1.42 49.4 2.3 (Levy et al., 1983)
This article has not been copyedited and form
atted. The final version m
ay differ from this version.
DM
D Fast Forw
ard. Published on March 1, 2013 as D
OI: 10.1124/dm
d.112.050278 at ASPET Journals on February 13, 2019 dmd.aspetjournals.org Downloaded from
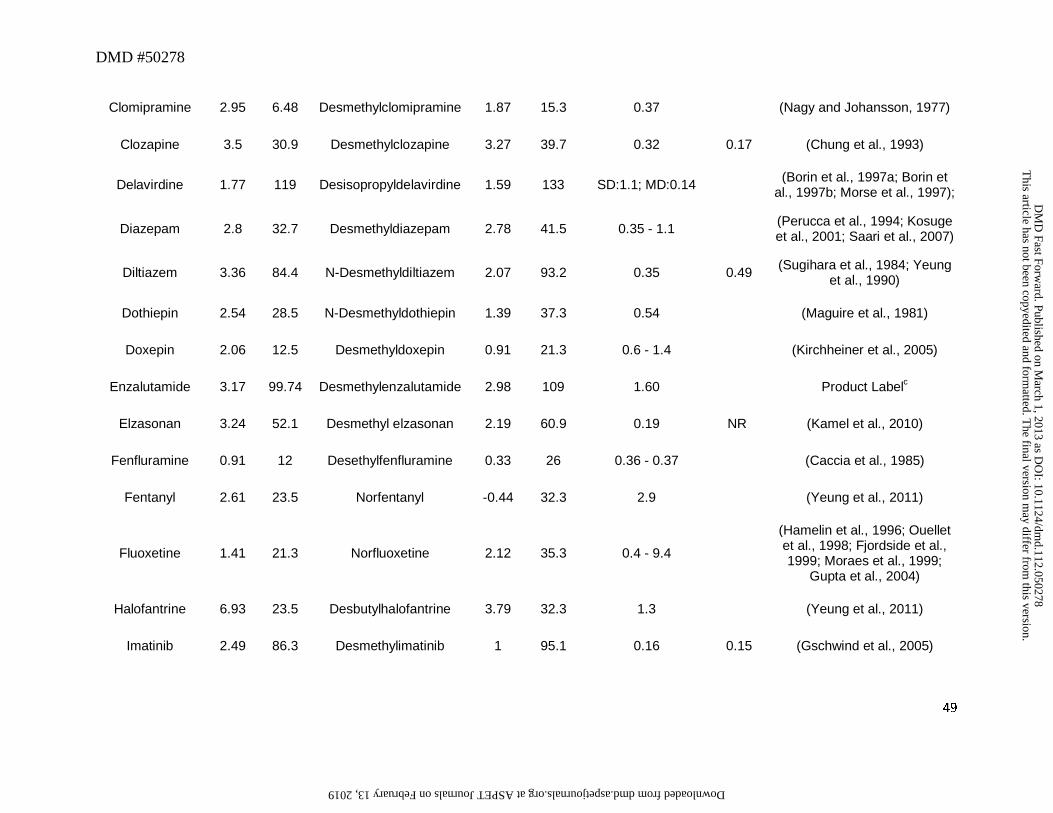
DMD #50278
49
Clomipramine 2.95 6.48 Desmethylclomipramine 1.87 15.3 0.37 (Nagy and Johansson, 1977)
Clozapine 3.5 30.9 Desmethylclozapine 3.27 39.7 0.32 0.17 (Chung et al., 1993)
Delavirdine 1.77 119 Desisopropyldelavirdine 1.59 133 SD:1.1; MD:0.14 (Borin et al., 1997a; Borin et al., 1997b; Morse et al., 1997);
Diazepam 2.8 32.7 Desmethyldiazepam 2.78 41.5 0.35 - 1.1 (Perucca et al., 1994; Kosuge et al., 2001; Saari et al., 2007)
Diltiazem 3.36 84.4 N-Desmethyldiltiazem 2.07 93.2 0.35 0.49 (Sugihara et al., 1984; Yeung et al., 1990)
Dothiepin 2.54 28.5 N-Desmethyldothiepin 1.39 37.3 0.54 (Maguire et al., 1981)
Doxepin 2.06 12.5 Desmethyldoxepin 0.91 21.3 0.6 - 1.4 (Kirchheiner et al., 2005)
Enzalutamide 3.17 99.74 Desmethylenzalutamide 2.98 109 1.60 Product Labelc
Elzasonan 3.24 52.1 Desmethyl elzasonan 2.19 60.9 0.19 NR (Kamel et al., 2010)
Fenfluramine 0.91 12 Desethylfenfluramine 0.33 26 0.36 - 0.37 (Caccia et al., 1985)
Fentanyl 2.61 23.5 Norfentanyl -0.44 32.3 2.9 (Yeung et al., 2011)
Fluoxetine 1.41 21.3 Norfluoxetine 2.12 35.3 0.4 - 9.4
(Hamelin et al., 1996; Ouellet et al., 1998; Fjordside et al., 1999; Moraes et al., 1999;
Gupta et al., 2004)
Halofantrine 6.93 23.5 Desbutylhalofantrine 3.79 32.3 1.3 (Yeung et al., 2011)
Imatinib 2.49 86.3 Desmethylimatinib 1 95.1 0.16 0.15 (Gschwind et al., 2005)
This article has not been copyedited and form
atted. The final version m
ay differ from this version.
DM
D Fast Forw
ard. Published on March 1, 2013 as D
OI: 10.1124/dm
d.112.050278 at ASPET Journals on February 13, 2019 dmd.aspetjournals.org Downloaded from
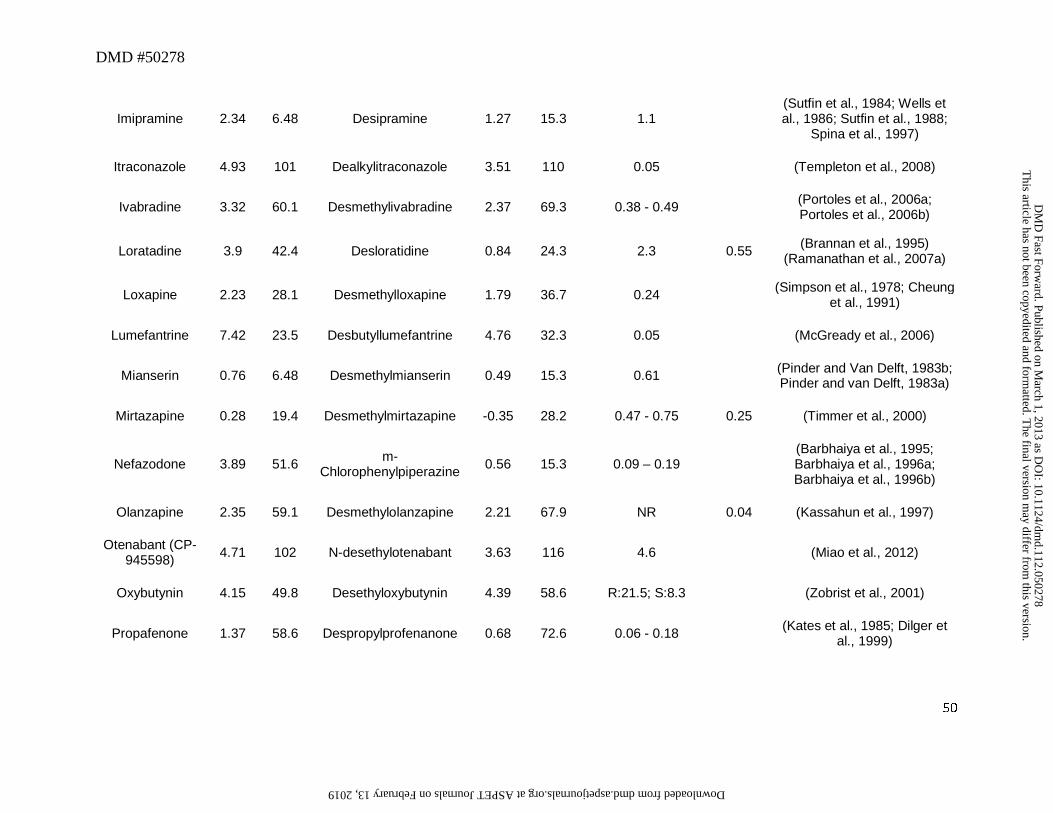
DMD #50278
50
Imipramine 2.34 6.48 Desipramine 1.27 15.3 1.1 (Sutfin et al., 1984; Wells et al., 1986; Sutfin et al., 1988;
Spina et al., 1997)
Itraconazole 4.93 101 Dealkylitraconazole 3.51 110 0.05 (Templeton et al., 2008)
Ivabradine 3.32 60.1 Desmethylivabradine 2.37 69.3 0.38 - 0.49 (Portoles et al., 2006a; Portoles et al., 2006b)
Loratadine 3.9 42.4 Desloratidine 0.84 24.3 2.3 0.55 (Brannan et al., 1995) (Ramanathan et al., 2007a)
Loxapine 2.23 28.1 Desmethylloxapine 1.79 36.7 0.24 (Simpson et al., 1978; Cheung et al., 1991)
Lumefantrine 7.42 23.5 Desbutyllumefantrine 4.76 32.3 0.05 (McGready et al., 2006)
Mianserin 0.76 6.48 Desmethylmianserin 0.49 15.3 0.61 (Pinder and Van Delft, 1983b; Pinder and van Delft, 1983a)
Mirtazapine 0.28 19.4 Desmethylmirtazapine -0.35 28.2 0.47 - 0.75 0.25 (Timmer et al., 2000)
Nefazodone 3.89 51.6 m-Chlorophenylpiperazine 0.56 15.3 0.09 – 0.19
(Barbhaiya et al., 1995; Barbhaiya et al., 1996a; Barbhaiya et al., 1996b)
Olanzapine 2.35 59.1 Desmethylolanzapine 2.21 67.9 NR 0.04 (Kassahun et al., 1997)
Otenabant (CP-945598) 4.71 102 N-desethylotenabant 3.63 116 4.6 (Miao et al., 2012)
Oxybutynin 4.15 49.8 Desethyloxybutynin 4.39 58.6 R:21.5; S:8.3 (Zobrist et al., 2001)
Propafenone 1.37 58.6 Despropylprofenanone 0.68 72.6 0.06 - 0.18 (Kates et al., 1985; Dilger et al., 1999)
This article has not been copyedited and form
atted. The final version m
ay differ from this version.
DM
D Fast Forw
ard. Published on March 1, 2013 as D
OI: 10.1124/dm
d.112.050278 at ASPET Journals on February 13, 2019 dmd.aspetjournals.org Downloaded from
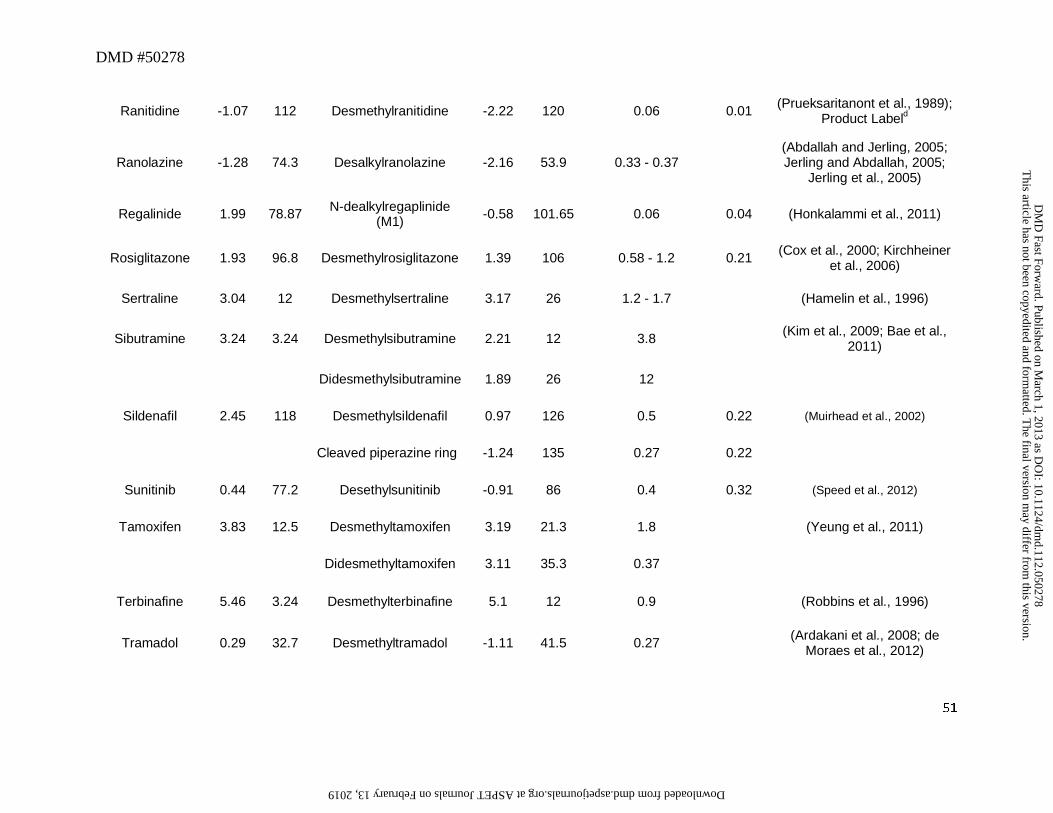
DMD #50278
51
Ranitidine -1.07 112 Desmethylranitidine -2.22 120 0.06 0.01 (Prueksaritanont et al., 1989); Product Labeld
Ranolazine -1.28 74.3 Desalkylranolazine -2.16 53.9 0.33 - 0.37 (Abdallah and Jerling, 2005; Jerling and Abdallah, 2005;
Jerling et al., 2005)
Regalinide 1.99 78.87 N-dealkylregaplinide (M1) -0.58 101.65 0.06 0.04 (Honkalammi et al., 2011)
Rosiglitazone 1.93 96.8 Desmethylrosiglitazone 1.39 106 0.58 - 1.2 0.21 (Cox et al., 2000; Kirchheiner et al., 2006)
Sertraline 3.04 12 Desmethylsertraline 3.17 26 1.2 - 1.7 (Hamelin et al., 1996)
Sibutramine 3.24 3.24 Desmethylsibutramine 2.21 12 3.8 (Kim et al., 2009; Bae et al., 2011)
Didesmethylsibutramine 1.89 26 12
Sildenafil 2.45 118 Desmethylsildenafil 0.97 126 0.5 0.22 (Muirhead et al., 2002)
Cleaved piperazine ring -1.24 135 0.27 0.22
Sunitinib 0.44 77.2 Desethylsunitinib -0.91 86 0.4 0.32 (Speed et al., 2012)
Tamoxifen 3.83 12.5 Desmethyltamoxifen 3.19 21.3 1.8 (Yeung et al., 2011)
Didesmethyltamoxifen 3.11 35.3 0.37
Terbinafine 5.46 3.24 Desmethylterbinafine 5.1 12 0.9 (Robbins et al., 1996)
Tramadol 0.29 32.7 Desmethyltramadol -1.11 41.5 0.27 (Ardakani et al., 2008; de Moraes et al., 2012)
This article has not been copyedited and form
atted. The final version m
ay differ from this version.
DM
D Fast Forw
ard. Published on March 1, 2013 as D
OI: 10.1124/dm
d.112.050278 at ASPET Journals on February 13, 2019 dmd.aspetjournals.org Downloaded from
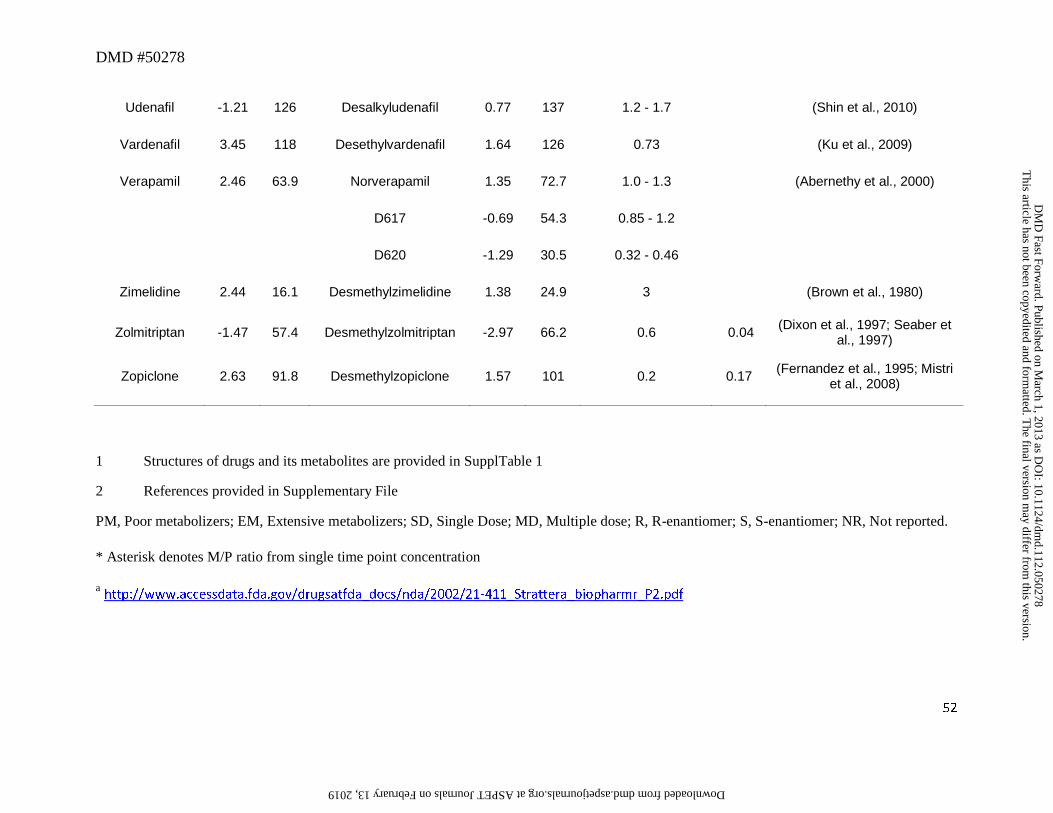
DMD #50278
52
Udenafil -1.21 126 Desalkyludenafil 0.77 137 1.2 - 1.7 (Shin et al., 2010)
Vardenafil 3.45 118 Desethylvardenafil 1.64 126 0.73 (Ku et al., 2009)
Verapamil 2.46 63.9 Norverapamil 1.35 72.7 1.0 - 1.3 (Abernethy et al., 2000)
D617 -0.69 54.3 0.85 - 1.2
D620 -1.29 30.5 0.32 - 0.46
Zimelidine 2.44 16.1 Desmethylzimelidine 1.38 24.9 3 (Brown et al., 1980)
Zolmitriptan -1.47 57.4 Desmethylzolmitriptan -2.97 66.2 0.6 0.04 (Dixon et al., 1997; Seaber et al., 1997)
Zopiclone 2.63 91.8 Desmethylzopiclone 1.57 101 0.2 0.17 (Fernandez et al., 1995; Mistri et al., 2008)
1 Structures of drugs and its metabolites are provided in SupplTable 1
2 References provided in Supplementary File
PM, Poor metabolizers; EM, Extensive metabolizers; SD, Single Dose; MD, Multiple dose; R, R-enantiomer; S, S-enantiomer; NR, Not reported.
* Asterisk denotes M/P ratio from single time point concentration
a http://www.accessdata.fda.gov/drugsatfda_docs/nda/2002/21-411_Strattera_biopharmr_P2.pdf
This article has not been copyedited and form
atted. The final version m
ay differ from this version.
DM
D Fast Forw
ard. Published on March 1, 2013 as D
OI: 10.1124/dm
d.112.050278 at ASPET Journals on February 13, 2019 dmd.aspetjournals.org Downloaded from
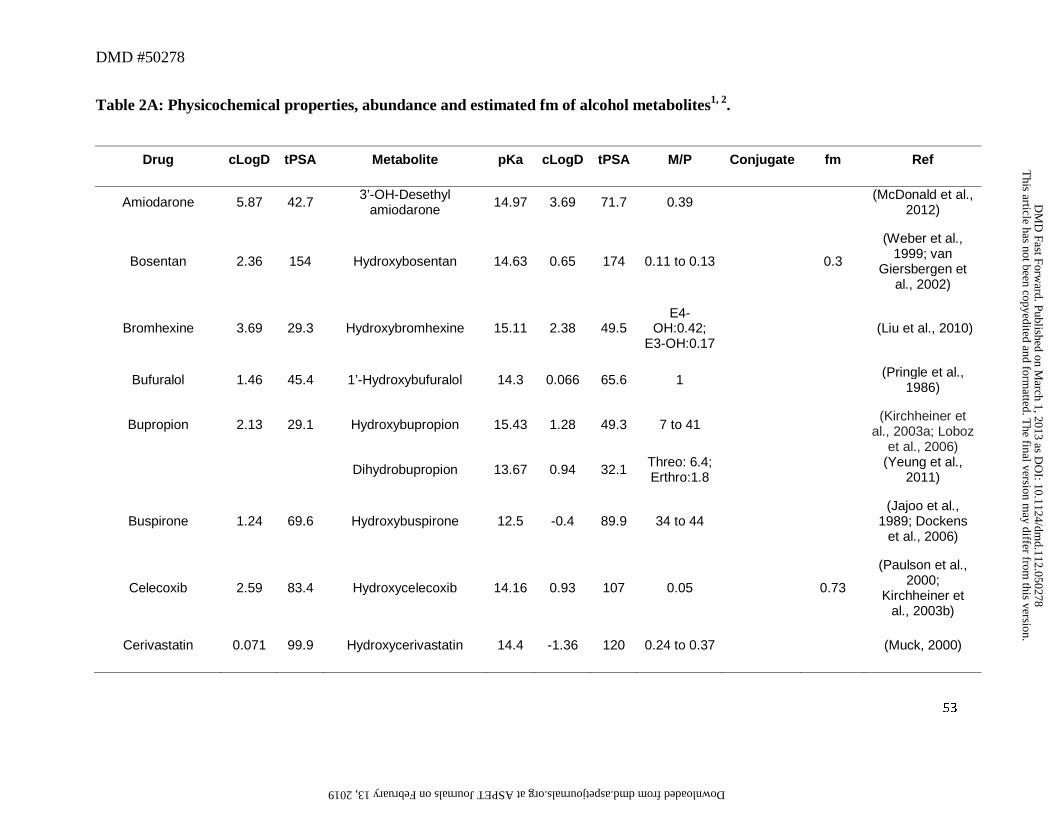
DMD #50278
53
Table 2A: Physicochemical properties, abundance and estimated fm of alcohol metabolites1, 2.
Drug cLogD tPSA Metabolite pKa cLogD tPSA M/P Conjugate fm Ref
Amiodarone 5.87 42.7 3’-OH-Desethyl amiodarone 14.97 3.69 71.7 0.39 (McDonald et al.,
2012)
Bosentan 2.36 154 Hydroxybosentan 14.63 0.65 174 0.11 to 0.13 0.3
(Weber et al., 1999; van
Giersbergen et al., 2002)
Bromhexine 3.69 29.3 Hydroxybromhexine 15.11 2.38 49.5 E4-
OH:0.42; E3-OH:0.17
(Liu et al., 2010)
Bufuralol 1.46 45.4 1’-Hydroxybufuralol 14.3 0.066 65.6 1 (Pringle et al., 1986)
Bupropion 2.13 29.1 Hydroxybupropion 15.43 1.28 49.3 7 to 41 (Kirchheiner et
al., 2003a; Loboz et al., 2006)
Dihydrobupropion 13.67 0.94 32.1 Threo: 6.4; Erthro:1.8 (Yeung et al.,
2011)
Buspirone 1.24 69.6 Hydroxybuspirone 12.5 -0.4 89.9 34 to 44 (Jajoo et al.,
1989; Dockens et al., 2006)
Celecoxib 2.59 83.4 Hydroxycelecoxib 14.16 0.93 107 0.05 0.73
(Paulson et al., 2000;
Kirchheiner et al., 2003b)
Cerivastatin 0.071 99.9 Hydroxycerivastatin 14.4 -1.36 120 0.24 to 0.37 (Muck, 2000)
This article has not been copyedited and form
atted. The final version m
ay differ from this version.
DM
D Fast Forw
ard. Published on March 1, 2013 as D
OI: 10.1124/dm
d.112.050278 at ASPET Journals on February 13, 2019 dmd.aspetjournals.org Downloaded from
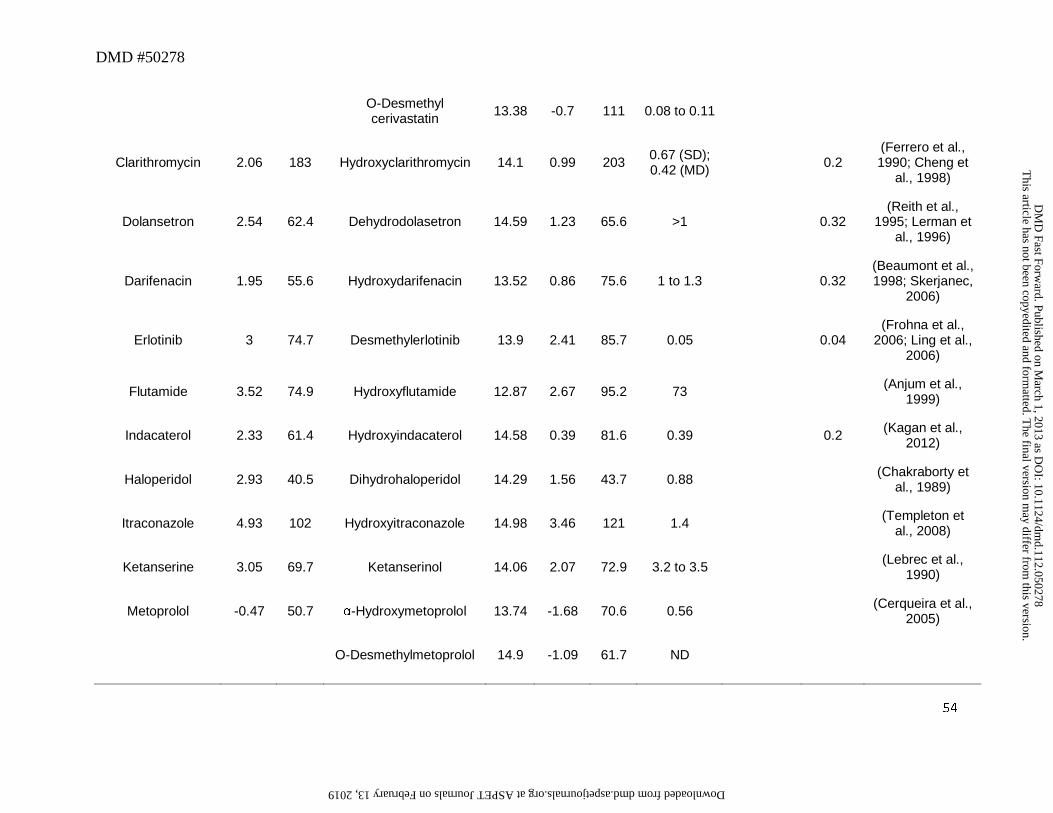
DMD #50278
54
O-Desmethyl cerivastatin 13.38 -0.7 111 0.08 to 0.11
Clarithromycin 2.06 183 Hydroxyclarithromycin 14.1 0.99 203 0.67 (SD); 0.42 (MD) 0.2
(Ferrero et al., 1990; Cheng et
al., 1998)
Dolansetron 2.54 62.4 Dehydrodolasetron 14.59 1.23 65.6 >1 0.32 (Reith et al.,
1995; Lerman et al., 1996)
Darifenacin 1.95 55.6 Hydroxydarifenacin 13.52 0.86 75.6 1 to 1.3 0.32 (Beaumont et al., 1998; Skerjanec,
2006)
Erlotinib 3 74.7 Desmethylerlotinib 13.9 2.41 85.7 0.05 0.04 (Frohna et al.,
2006; Ling et al., 2006)
Flutamide 3.52 74.9 Hydroxyflutamide 12.87 2.67 95.2 73 (Anjum et al., 1999)
Indacaterol 2.33 61.4 Hydroxyindacaterol 14.58 0.39 81.6 0.39 0.2 (Kagan et al., 2012)
Haloperidol 2.93 40.5 Dihydrohaloperidol 14.29 1.56 43.7 0.88 (Chakraborty et al., 1989)
Itraconazole 4.93 102 Hydroxyitraconazole 14.98 3.46 121 1.4 (Templeton et al., 2008)
Ketanserine 3.05 69.7 Ketanserinol 14.06 2.07 72.9 3.2 to 3.5 (Lebrec et al., 1990)
Metoprolol -0.47 50.7 α-Hydroxymetoprolol 13.74 -1.68 70.6 0.56 (Cerqueira et al., 2005)
O-Desmethylmetoprolol 14.9 -1.09 61.7 ND
This article has not been copyedited and form
atted. The final version m
ay differ from this version.
DM
D Fast Forw
ard. Published on March 1, 2013 as D
OI: 10.1124/dm
d.112.050278 at ASPET Journals on February 13, 2019 dmd.aspetjournals.org Downloaded from
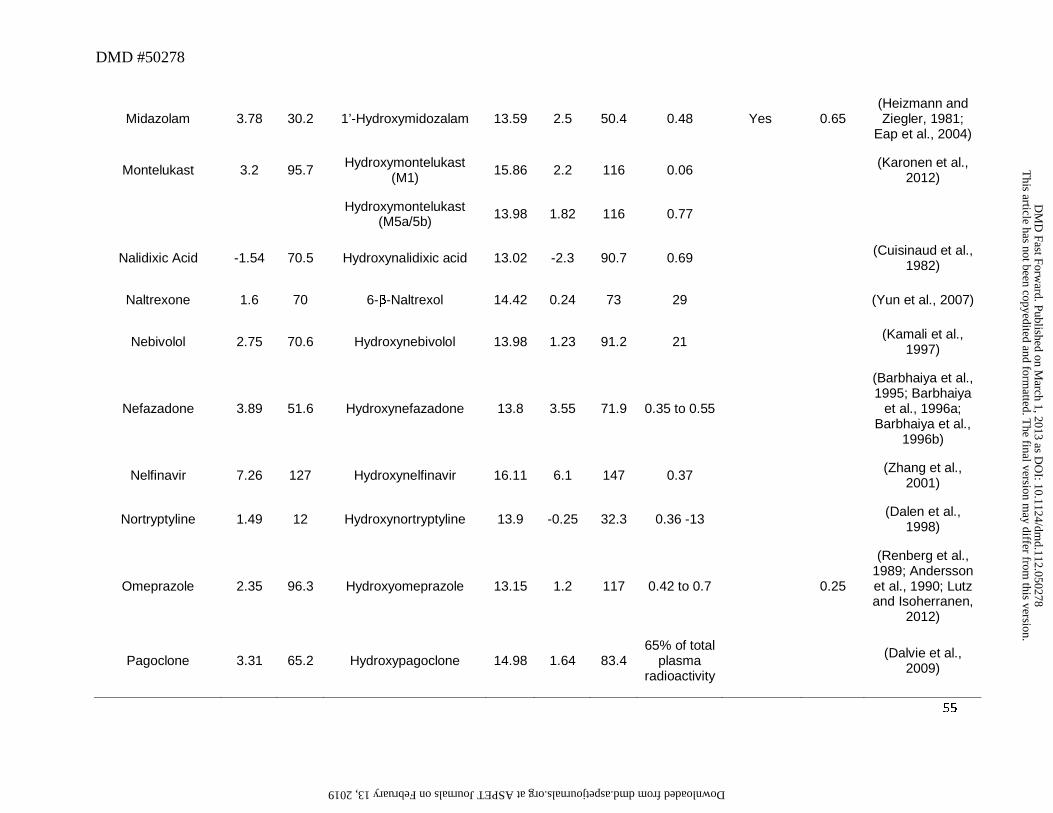
DMD #50278
55
Midazolam 3.78 30.2 1’-Hydroxymidozalam 13.59 2.5 50.4 0.48 Yes 0.65 (Heizmann and Ziegler, 1981;
Eap et al., 2004)
Montelukast 3.2 95.7 Hydroxymontelukast (M1) 15.86 2.2 116 0.06 (Karonen et al.,
2012)
Hydroxymontelukast (M5a/5b) 13.98 1.82 116 0.77
Nalidixic Acid -1.54 70.5 Hydroxynalidixic acid 13.02 -2.3 90.7 0.69 (Cuisinaud et al., 1982)
Naltrexone 1.6 70 6-β-Naltrexol 14.42 0.24 73 29 (Yun et al., 2007)
Nebivolol 2.75 70.6 Hydroxynebivolol 13.98 1.23 91.2 21 (Kamali et al., 1997)
Nefazadone 3.89 51.6 Hydroxynefazadone 13.8 3.55 71.9 0.35 to 0.55
(Barbhaiya et al., 1995; Barbhaiya
et al., 1996a; Barbhaiya et al.,
1996b)
Nelfinavir 7.26 127 Hydroxynelfinavir 16.11 6.1 147 0.37 (Zhang et al., 2001)
Nortryptyline 1.49 12 Hydroxynortryptyline 13.9 -0.25 32.3 0.36 -13 (Dalen et al., 1998)
Omeprazole 2.35 96.3 Hydroxyomeprazole 13.15 1.2 117 0.42 to 0.7 0.25
(Renberg et al., 1989; Andersson et al., 1990; Lutz and Isoherranen,
2012)
Pagoclone 3.31 65.2 Hydroxypagoclone 14.98 1.64 83.4 65% of total
plasma radioactivity
(Dalvie et al., 2009)
This article has not been copyedited and form
atted. The final version m
ay differ from this version.
DM
D Fast Forw
ard. Published on March 1, 2013 as D
OI: 10.1124/dm
d.112.050278 at ASPET Journals on February 13, 2019 dmd.aspetjournals.org Downloaded from
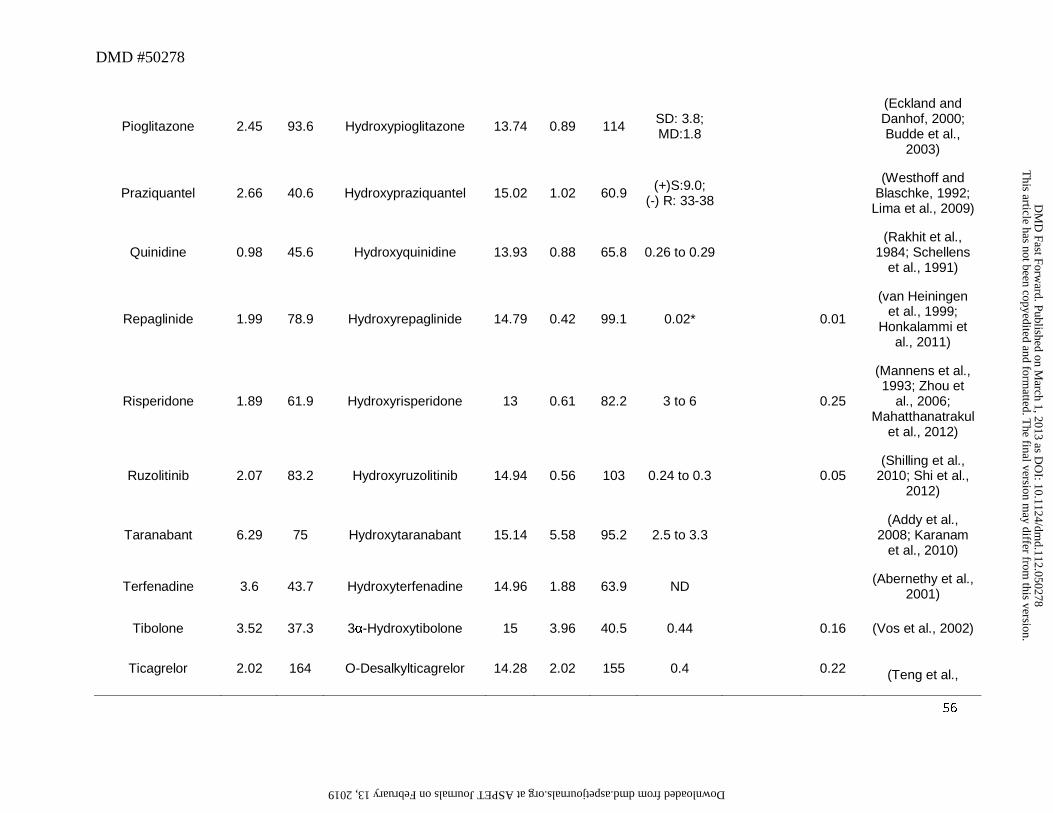
DMD #50278
56
Pioglitazone 2.45 93.6 Hydroxypioglitazone 13.74 0.89 114 SD: 3.8; MD:1.8
(Eckland and Danhof, 2000; Budde et al.,
2003)
Praziquantel 2.66 40.6 Hydroxypraziquantel 15.02 1.02 60.9 (+)S:9.0; (-) R: 33-38
(Westhoff and Blaschke, 1992;
Lima et al., 2009)
Quinidine 0.98 45.6 Hydroxyquinidine 13.93 0.88 65.8 0.26 to 0.29 (Rakhit et al.,
1984; Schellens et al., 1991)
Repaglinide 1.99 78.9 Hydroxyrepaglinide 14.79 0.42 99.1 0.02* 0.01
(van Heiningen et al., 1999;
Honkalammi et al., 2011)
Risperidone 1.89 61.9 Hydroxyrisperidone 13 0.61 82.2 3 to 6 0.25
(Mannens et al., 1993; Zhou et
al., 2006; Mahatthanatrakul
et al., 2012)
Ruzolitinib 2.07 83.2 Hydroxyruzolitinib 14.94 0.56 103 0.24 to 0.3 0.05 (Shilling et al.,
2010; Shi et al., 2012)
Taranabant 6.29 75 Hydroxytaranabant 15.14 5.58 95.2 2.5 to 3.3 (Addy et al.,
2008; Karanam et al., 2010)
Terfenadine 3.6 43.7 Hydroxyterfenadine 14.96 1.88 63.9 ND (Abernethy et al., 2001)
Tibolone 3.52 37.3 3α-Hydroxytibolone 15 3.96 40.5 0.44 0.16 (Vos et al., 2002)
Ticagrelor 2.02 164 O-Desalkylticagrelor 14.28 2.02 155 0.4 0.22 (Teng et al.,
This article has not been copyedited and form
atted. The final version m
ay differ from this version.
DM
D Fast Forw
ard. Published on March 1, 2013 as D
OI: 10.1124/dm
d.112.050278 at ASPET Journals on February 13, 2019 dmd.aspetjournals.org Downloaded from
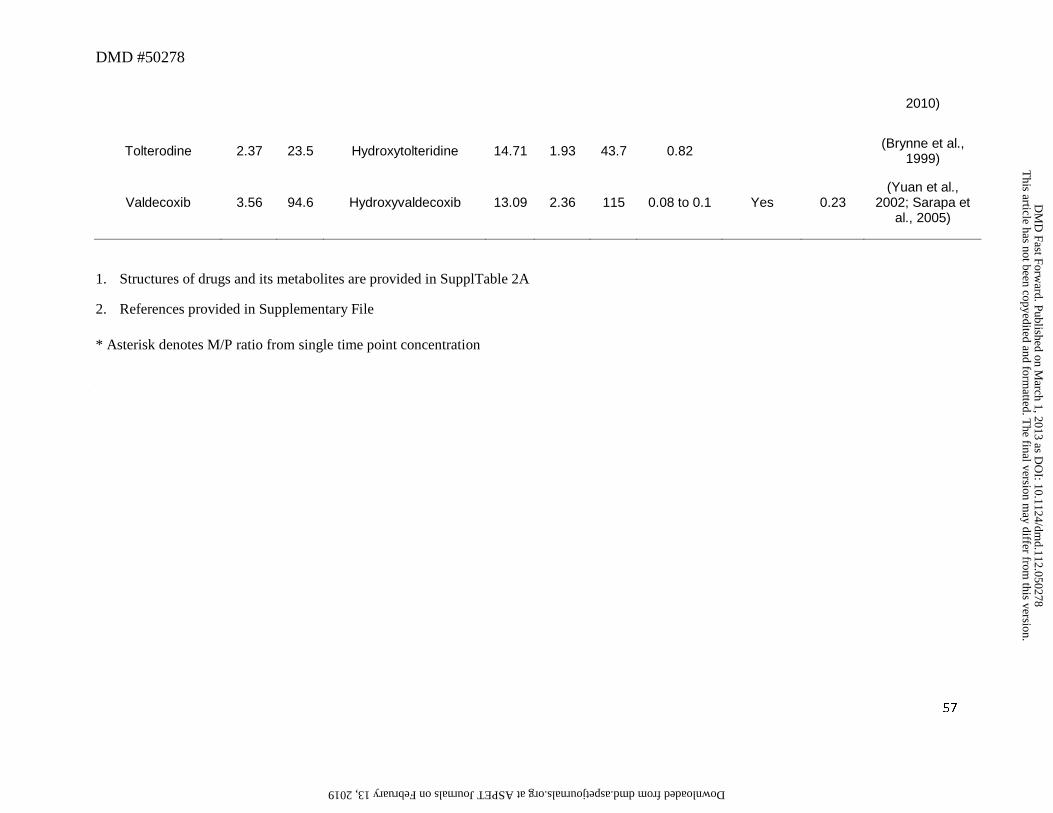
DMD #50278
57
2010)
Tolterodine 2.37 23.5 Hydroxytolteridine 14.71 1.93 43.7 0.82 (Brynne et al., 1999)
Valdecoxib 3.56 94.6 Hydroxyvaldecoxib 13.09 2.36 115 0.08 to 0.1 Yes 0.23 (Yuan et al.,
2002; Sarapa et al., 2005)
1. Structures of drugs and its metabolites are provided in SupplTable 2A
2. References provided in Supplementary File
* Asterisk denotes M/P ratio from single time point concentration
This article has not been copyedited and form
atted. The final version m
ay differ from this version.
DM
D Fast Forw
ard. Published on March 1, 2013 as D
OI: 10.1124/dm
d.112.050278 at ASPET Journals on February 13, 2019 dmd.aspetjournals.org Downloaded from
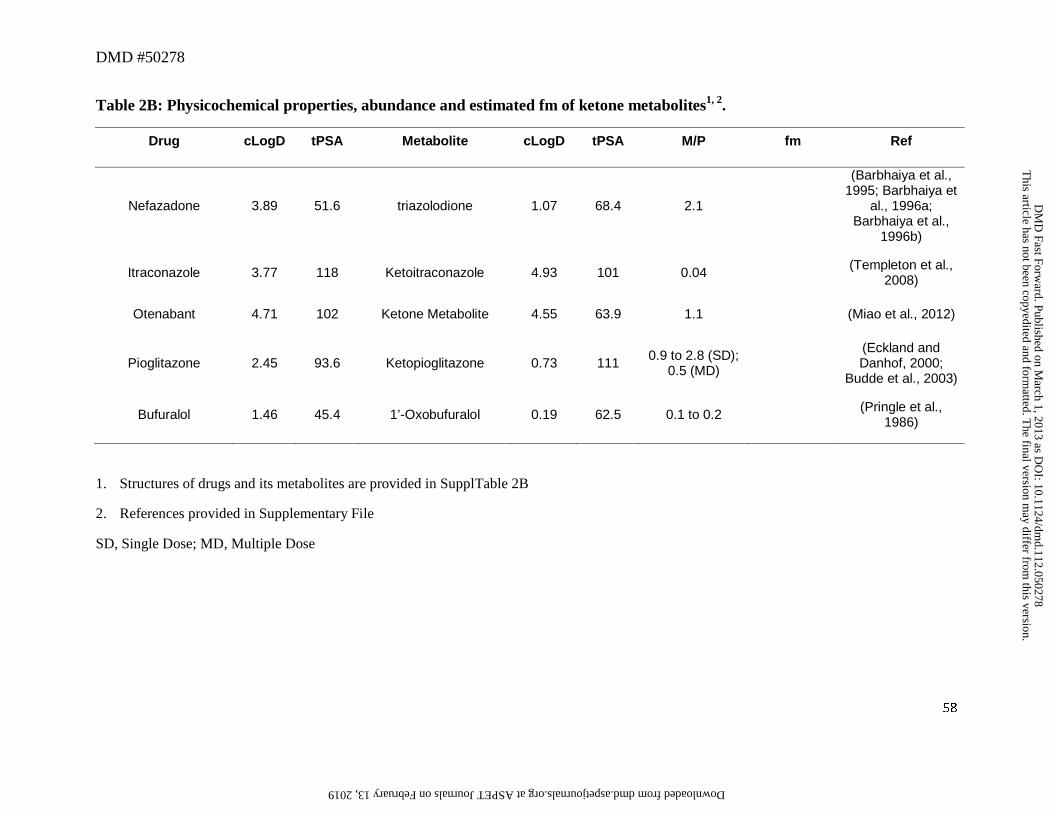
DMD #50278
58
Table 2B: Physicochemical properties, abundance and estimated fm of ketone metabolites1, 2.
Drug cLogD tPSA Metabolite cLogD tPSA M/P fm Ref
Nefazadone 3.89 51.6 triazolodione 1.07 68.4 2.1
(Barbhaiya et al., 1995; Barbhaiya et
al., 1996a; Barbhaiya et al.,
1996b)
Itraconazole 3.77 118 Ketoitraconazole 4.93 101 0.04 (Templeton et al., 2008)
Otenabant 4.71 102 Ketone Metabolite 4.55 63.9 1.1 (Miao et al., 2012)
Pioglitazone 2.45 93.6 Ketopioglitazone 0.73 111 0.9 to 2.8 (SD); 0.5 (MD)
(Eckland and Danhof, 2000;
Budde et al., 2003)
Bufuralol 1.46 45.4 1’-Oxobufuralol 0.19 62.5 0.1 to 0.2 (Pringle et al., 1986)
1. Structures of drugs and its metabolites are provided in SupplTable 2B
2. References provided in Supplementary File
SD, Single Dose; MD, Multiple Dose
This article has not been copyedited and form
atted. The final version m
ay differ from this version.
DM
D Fast Forw
ard. Published on March 1, 2013 as D
OI: 10.1124/dm
d.112.050278 at ASPET Journals on February 13, 2019 dmd.aspetjournals.org Downloaded from
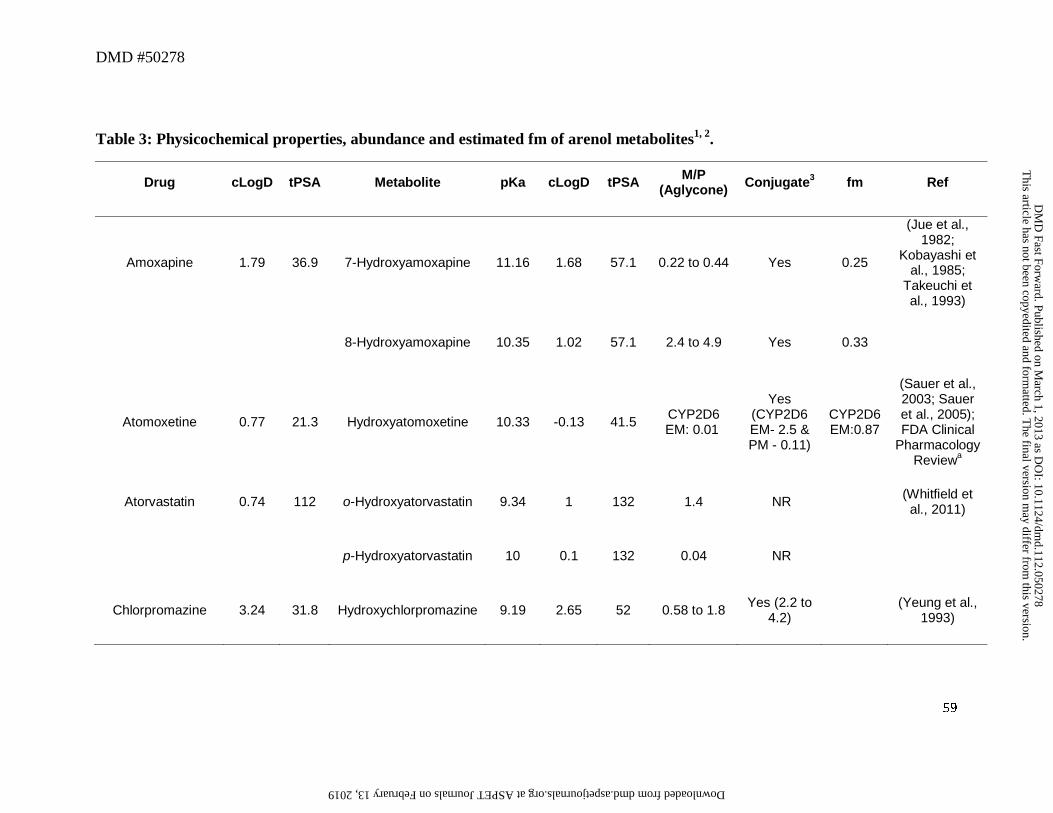
DMD #50278
59
Table 3: Physicochemical properties, abundance and estimated fm of arenol metabolites1, 2.
Drug cLogD tPSA Metabolite pKa cLogD tPSA M/P (Aglycone) Conjugate3 fm Ref
Amoxapine 1.79 36.9 7-Hydroxyamoxapine 11.16 1.68 57.1 0.22 to 0.44 Yes 0.25
(Jue et al., 1982;
Kobayashi et al., 1985;
Takeuchi et al., 1993)
8-Hydroxyamoxapine 10.35 1.02 57.1 2.4 to 4.9 Yes 0.33
Atomoxetine 0.77 21.3 Hydroxyatomoxetine 10.33 -0.13 41.5 CYP2D6 EM: 0.01
Yes (CYP2D6 EM- 2.5 & PM - 0.11)
CYP2D6 EM:0.87
(Sauer et al., 2003; Sauer et al., 2005); FDA Clinical
Pharmacology Reviewa
Atorvastatin 0.74 112 o-Hydroxyatorvastatin 9.34 1 132 1.4 NR (Whitfield et al., 2011)
p-Hydroxyatorvastatin 10 0.1 132 0.04 NR
Chlorpromazine 3.24 31.8 Hydroxychlorpromazine 9.19 2.65 52 0.58 to 1.8 Yes (2.2 to 4.2) (Yeung et al.,
1993)
This article has not been copyedited and form
atted. The final version m
ay differ from this version.
DM
D Fast Forw
ard. Published on March 1, 2013 as D
OI: 10.1124/dm
d.112.050278 at ASPET Journals on February 13, 2019 dmd.aspetjournals.org Downloaded from
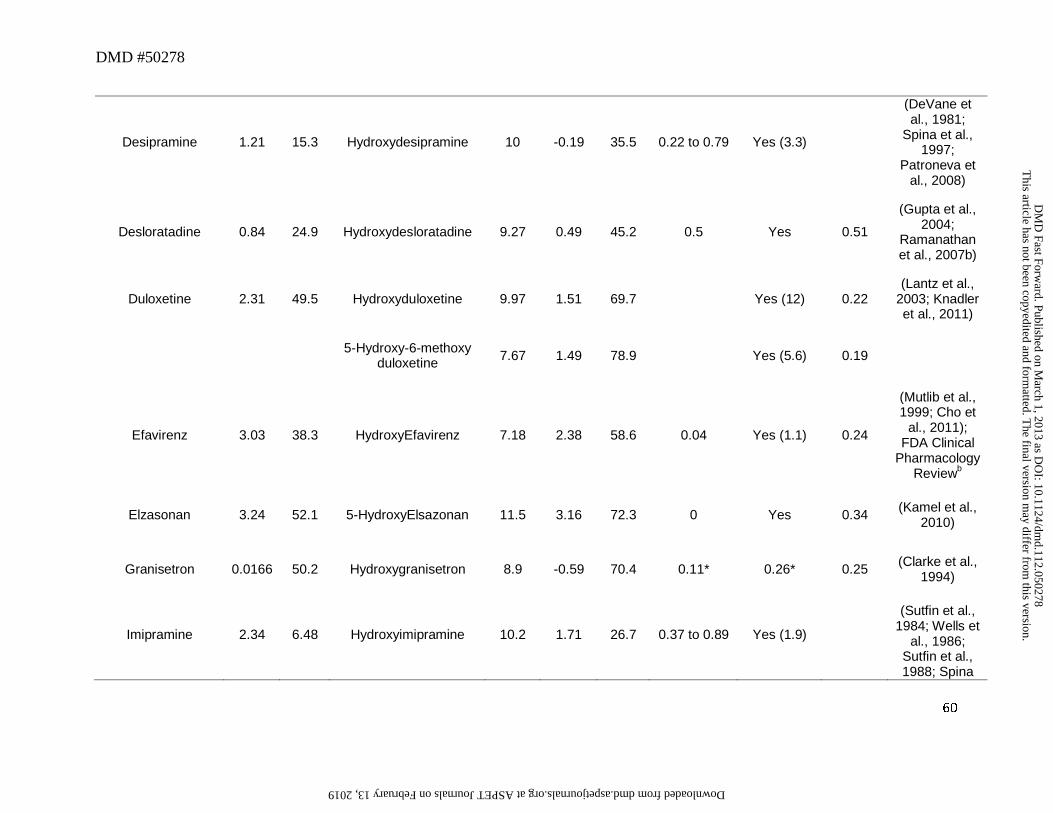
DMD #50278
60
Desipramine 1.21 15.3 Hydroxydesipramine 10 -0.19 35.5 0.22 to 0.79 Yes (3.3)
(DeVane et al., 1981;
Spina et al., 1997;
Patroneva et al., 2008)
Desloratadine 0.84 24.9 Hydroxydesloratadine 9.27 0.49 45.2 0.5 Yes 0.51
(Gupta et al., 2004;
Ramanathan et al., 2007b)
Duloxetine 2.31 49.5 Hydroxyduloxetine 9.97 1.51 69.7 Yes (12) 0.22 (Lantz et al.,
2003; Knadler et al., 2011)
5-Hydroxy-6-methoxy duloxetine 7.67 1.49 78.9 Yes (5.6) 0.19
Efavirenz 3.03 38.3 HydroxyEfavirenz 7.18 2.38 58.6 0.04 Yes (1.1) 0.24
(Mutlib et al., 1999; Cho et
al., 2011); FDA Clinical
Pharmacology Reviewb
Elzasonan 3.24 52.1 5-HydroxyElsazonan 11.5 3.16 72.3 0 Yes 0.34 (Kamel et al., 2010)
Granisetron 0.0166 50.2 Hydroxygranisetron 8.9 -0.59 70.4 0.11* 0.26* 0.25 (Clarke et al., 1994)
Imipramine 2.34 6.48 Hydroxyimipramine 10.2 1.71 26.7 0.37 to 0.89 Yes (1.9)
(Sutfin et al., 1984; Wells et
al., 1986; Sutfin et al., 1988; Spina
This article has not been copyedited and form
atted. The final version m
ay differ from this version.
DM
D Fast Forw
ard. Published on March 1, 2013 as D
OI: 10.1124/dm
d.112.050278 at ASPET Journals on February 13, 2019 dmd.aspetjournals.org Downloaded from
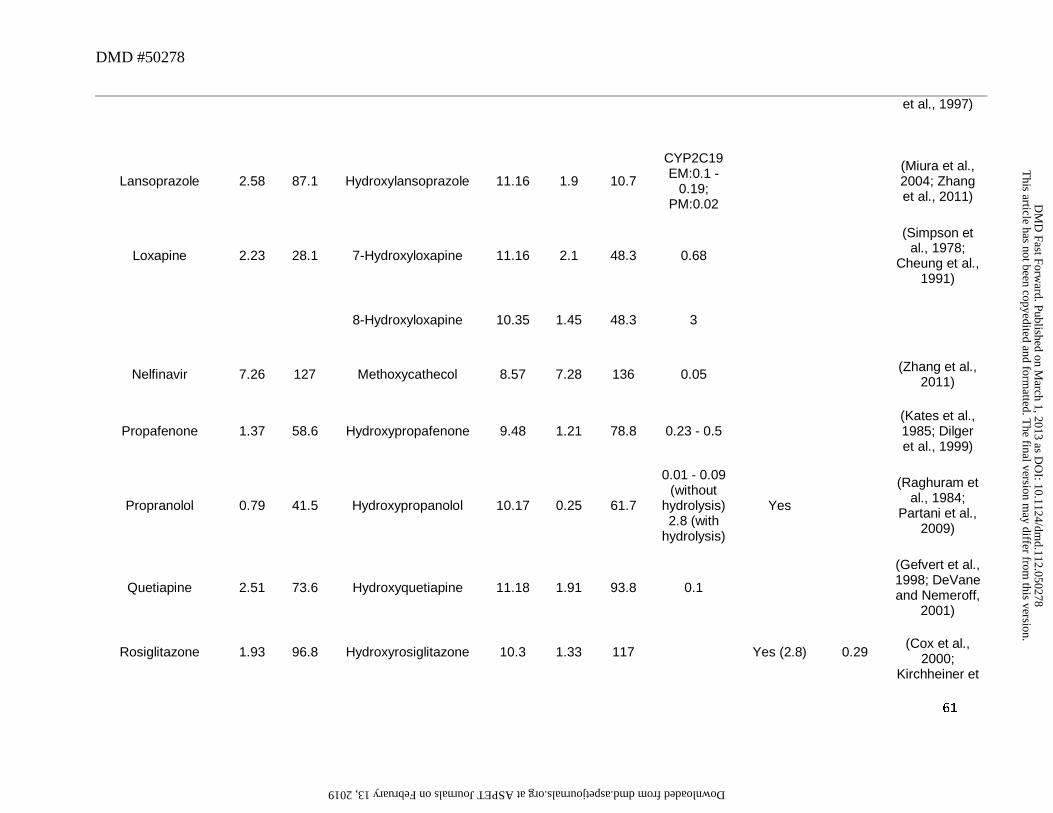
DMD #50278
61
et al., 1997)
Lansoprazole 2.58 87.1 Hydroxylansoprazole 11.16 1.9 10.7
CYP2C19 EM:0.1 -
0.19; PM:0.02
(Miura et al., 2004; Zhang et al., 2011)
Loxapine 2.23 28.1 7-Hydroxyloxapine 11.16 2.1 48.3 0.68
(Simpson et al., 1978;
Cheung et al., 1991)
8-Hydroxyloxapine 10.35 1.45 48.3 3
Nelfinavir 7.26 127 Methoxycathecol 8.57 7.28 136 0.05 (Zhang et al., 2011)
Propafenone 1.37 58.6 Hydroxypropafenone 9.48 1.21 78.8 0.23 - 0.5 (Kates et al., 1985; Dilger et al., 1999)
Propranolol 0.79 41.5 Hydroxypropanolol 10.17 0.25 61.7
0.01 - 0.09 (without
hydrolysis) 2.8 (with
hydrolysis)
Yes
(Raghuram et al., 1984;
Partani et al., 2009)
Quetiapine 2.51 73.6 Hydroxyquetiapine 11.18 1.91 93.8 0.1
(Gefvert et al., 1998; DeVane and Nemeroff,
2001)
Rosiglitazone 1.93 96.8 Hydroxyrosiglitazone 10.3 1.33 117 Yes (2.8) 0.29 (Cox et al.,
2000; Kirchheiner et
This article has not been copyedited and form
atted. The final version m
ay differ from this version.
DM
D Fast Forw
ard. Published on March 1, 2013 as D
OI: 10.1124/dm
d.112.050278 at ASPET Journals on February 13, 2019 dmd.aspetjournals.org Downloaded from
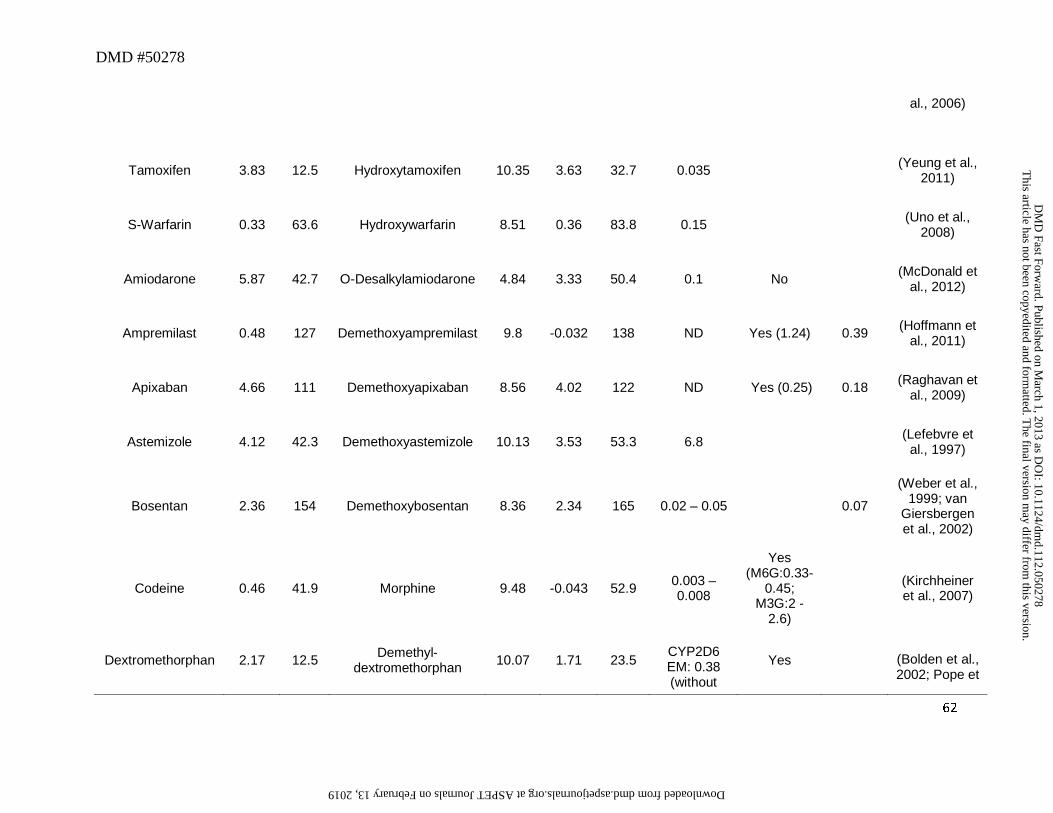
DMD #50278
62
al., 2006)
Tamoxifen 3.83 12.5 Hydroxytamoxifen 10.35 3.63 32.7 0.035 (Yeung et al., 2011)
S-Warfarin 0.33 63.6 Hydroxywarfarin 8.51 0.36 83.8 0.15 (Uno et al., 2008)
Amiodarone 5.87 42.7 O-Desalkylamiodarone 4.84 3.33 50.4 0.1 No (McDonald et al., 2012)
Ampremilast 0.48 127 Demethoxyampremilast 9.8 -0.032 138 ND Yes (1.24) 0.39 (Hoffmann et al., 2011)
Apixaban 4.66 111 Demethoxyapixaban 8.56 4.02 122 ND Yes (0.25) 0.18 (Raghavan et al., 2009)
Astemizole 4.12 42.3 Demethoxyastemizole 10.13 3.53 53.3 6.8 (Lefebvre et al., 1997)
Bosentan 2.36 154 Demethoxybosentan 8.36 2.34 165 0.02 – 0.05 0.07
(Weber et al., 1999; van
Giersbergen et al., 2002)
Codeine 0.46 41.9 Morphine 9.48 -0.043 52.9 0.003 – 0.008
Yes (M6G:0.33-
0.45; M3G:2 -
2.6)
(Kirchheiner et al., 2007)
Dextromethorphan 2.17 12.5 Demethyl-dextromethorphan 10.07 1.71 23.5
CYP2D6 EM: 0.38 (without
Yes (Bolden et al., 2002; Pope et
This article has not been copyedited and form
atted. The final version m
ay differ from this version.
DM
D Fast Forw
ard. Published on March 1, 2013 as D
OI: 10.1124/dm
d.112.050278 at ASPET Journals on February 13, 2019 dmd.aspetjournals.org Downloaded from
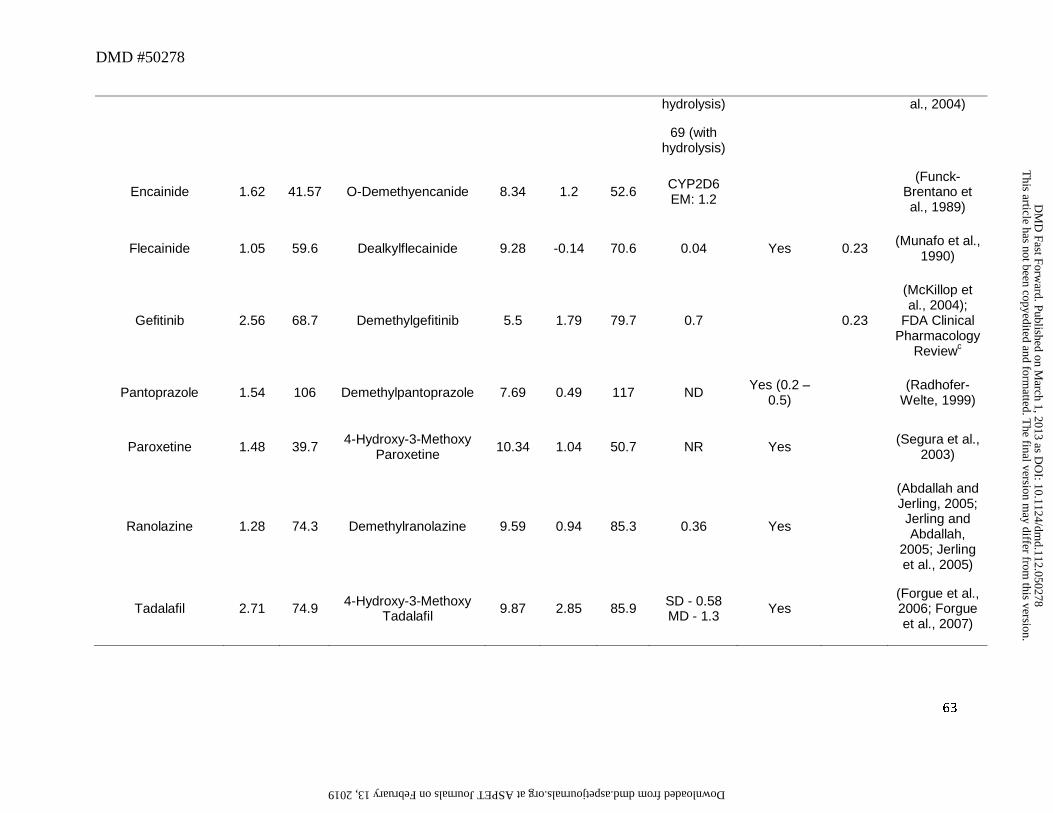
DMD #50278
63
hydrolysis)
69 (with hydrolysis)
al., 2004)
Encainide 1.62 41.57 O-Demethyencanide 8.34 1.2 52.6 CYP2D6 EM: 1.2
(Funck-Brentano et al., 1989)
Flecainide 1.05 59.6 Dealkylflecainide 9.28 -0.14 70.6 0.04 Yes 0.23 (Munafo et al., 1990)
Gefitinib 2.56 68.7 Demethylgefitinib 5.5 1.79 79.7 0.7
0.23
(McKillop et al., 2004);
FDA Clinical Pharmacology
Reviewc
Pantoprazole 1.54 106 Demethylpantoprazole 7.69 0.49 117 ND Yes (0.2 – 0.5) (Radhofer-
Welte, 1999)
Paroxetine 1.48 39.7 4-Hydroxy-3-Methoxy Paroxetine 10.34 1.04 50.7 NR Yes (Segura et al.,
2003)
Ranolazine 1.28 74.3 Demethylranolazine 9.59 0.94 85.3 0.36 Yes
(Abdallah and Jerling, 2005; Jerling and Abdallah,
2005; Jerling et al., 2005)
Tadalafil 2.71 74.9 4-Hydroxy-3-Methoxy Tadalafil 9.87 2.85 85.9 SD - 0.58
MD - 1.3 Yes (Forgue et al., 2006; Forgue et al., 2007)
This article has not been copyedited and form
atted. The final version m
ay differ from this version.
DM
D Fast Forw
ard. Published on March 1, 2013 as D
OI: 10.1124/dm
d.112.050278 at ASPET Journals on February 13, 2019 dmd.aspetjournals.org Downloaded from
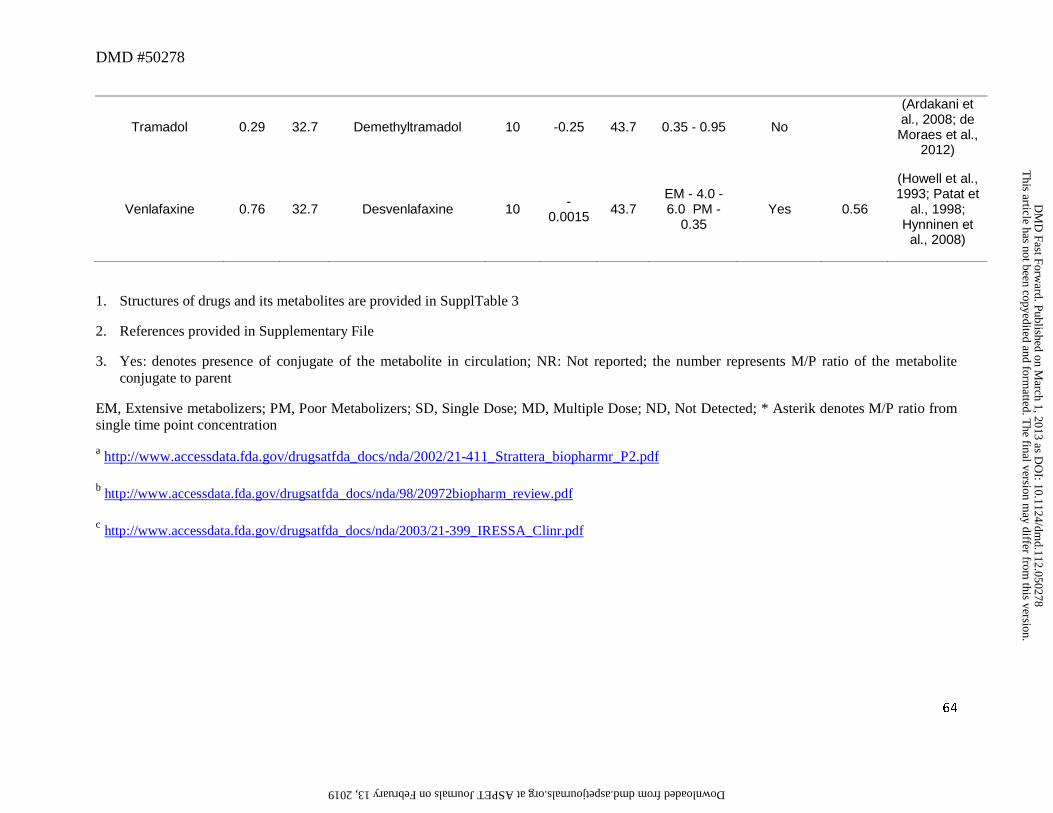
DMD #50278
64
Tramadol 0.29 32.7 Demethyltramadol 10 -0.25 43.7 0.35 - 0.95 No
(Ardakani et al., 2008; de Moraes et al.,
2012)
Venlafaxine 0.76 32.7 Desvenlafaxine 10 -0.0015 43.7
EM - 4.0 - 6.0 PM -
0.35 Yes 0.56
(Howell et al., 1993; Patat et
al., 1998; Hynninen et
al., 2008)
1. Structures of drugs and its metabolites are provided in SupplTable 3
2. References provided in Supplementary File
3. Yes: denotes presence of conjugate of the metabolite in circulation; NR: Not reported; the number represents M/P ratio of the metabolite conjugate to parent
EM, Extensive metabolizers; PM, Poor Metabolizers; SD, Single Dose; MD, Multiple Dose; ND, Not Detected; * Asterik denotes M/P ratio from single time point concentration
a http://www.accessdata.fda.gov/drugsatfda_docs/nda/2002/21-411_Strattera_biopharmr_P2.pdf
b http://www.accessdata.fda.gov/drugsatfda_docs/nda/98/20972biopharm_review.pdf
c http://www.accessdata.fda.gov/drugsatfda_docs/nda/2003/21-399_IRESSA_Clinr.pdf
This article has not been copyedited and form
atted. The final version m
ay differ from this version.
DM
D Fast Forw
ard. Published on March 1, 2013 as D
OI: 10.1124/dm
d.112.050278 at ASPET Journals on February 13, 2019 dmd.aspetjournals.org Downloaded from
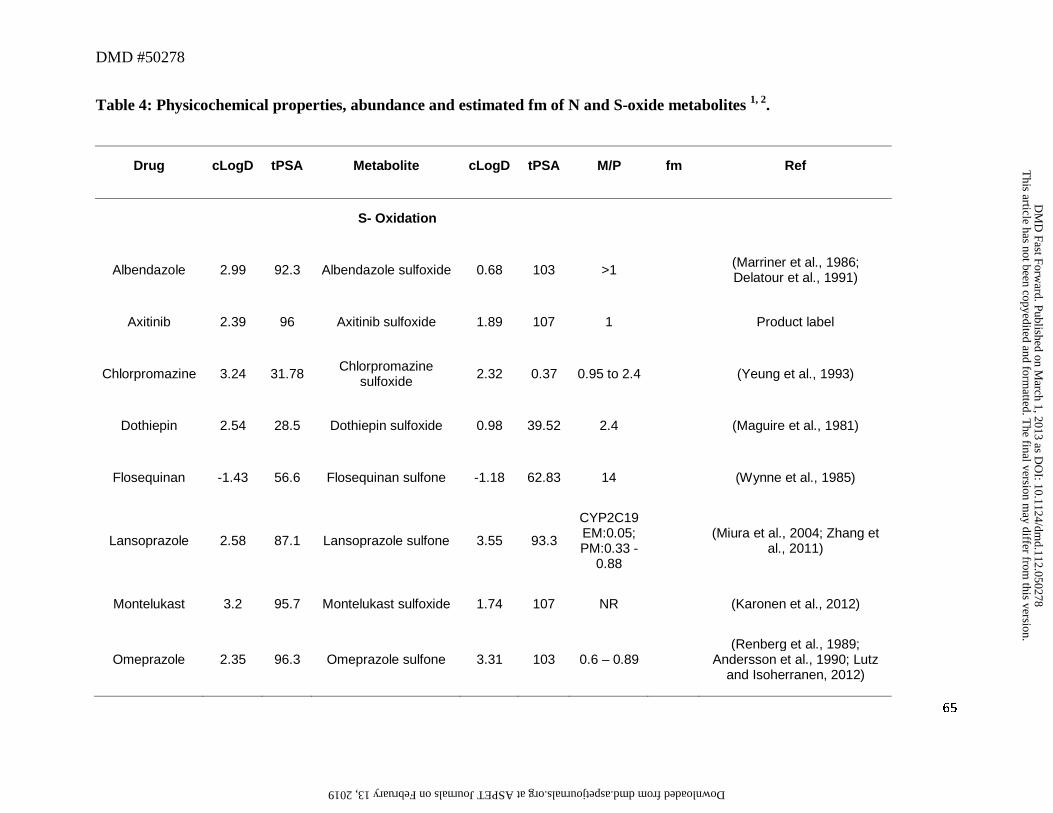
DMD #50278
65
Table 4: Physicochemical properties, abundance and estimated fm of N and S-oxide metabolites 1, 2.
Drug cLogD tPSA Metabolite cLogD tPSA M/P fm Ref
S- Oxidation
Albendazole 2.99 92.3 Albendazole sulfoxide 0.68 103 >1 (Marriner et al., 1986; Delatour et al., 1991)
Axitinib 2.39 96 Axitinib sulfoxide 1.89 107 1 Product label
Chlorpromazine 3.24 31.78 Chlorpromazine sulfoxide 2.32 0.37 0.95 to 2.4 (Yeung et al., 1993)
Dothiepin 2.54 28.5 Dothiepin sulfoxide 0.98 39.52 2.4 (Maguire et al., 1981)
Flosequinan -1.43 56.6 Flosequinan sulfone -1.18 62.83 14 (Wynne et al., 1985)
Lansoprazole 2.58 87.1 Lansoprazole sulfone 3.55 93.3
CYP2C19 EM:0.05; PM:0.33 -
0.88
(Miura et al., 2004; Zhang et al., 2011)
Montelukast 3.2 95.7 Montelukast sulfoxide 1.74 107 NR (Karonen et al., 2012)
Omeprazole 2.35 96.3 Omeprazole sulfone 3.31 103 0.6 – 0.89 (Renberg et al., 1989;
Andersson et al., 1990; Lutz and Isoherranen, 2012)
This article has not been copyedited and form
atted. The final version m
ay differ from this version.
DM
D Fast Forw
ard. Published on March 1, 2013 as D
OI: 10.1124/dm
d.112.050278 at ASPET Journals on February 13, 2019 dmd.aspetjournals.org Downloaded from
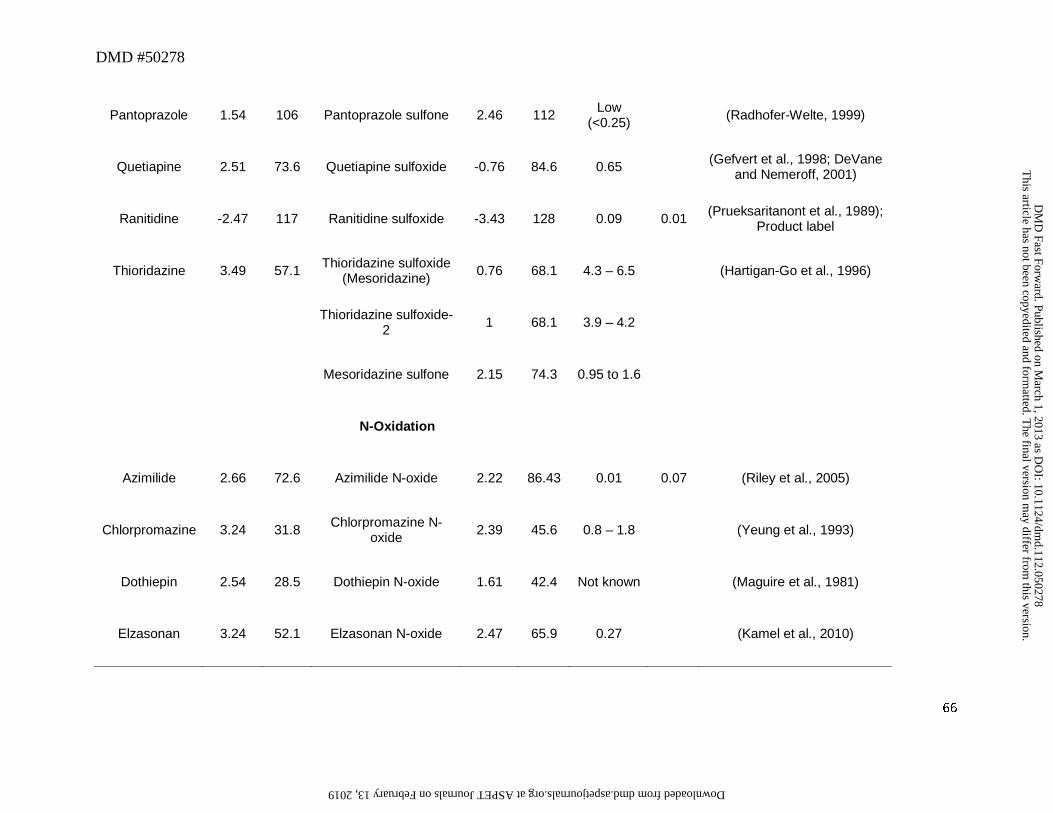
DMD #50278
66
Pantoprazole 1.54 106 Pantoprazole sulfone 2.46 112 Low (<0.25) (Radhofer-Welte, 1999)
Quetiapine 2.51 73.6 Quetiapine sulfoxide -0.76 84.6 0.65 (Gefvert et al., 1998; DeVane and Nemeroff, 2001)
Ranitidine -2.47 117 Ranitidine sulfoxide -3.43 128 0.09 0.01 (Prueksaritanont et al., 1989); Product label
Thioridazine 3.49 57.1 Thioridazine sulfoxide (Mesoridazine) 0.76 68.1 4.3 – 6.5 (Hartigan-Go et al., 1996)
Thioridazine sulfoxide-2 1 68.1 3.9 – 4.2
Mesoridazine sulfone 2.15 74.3 0.95 to 1.6
N-Oxidation
Azimilide 2.66 72.6 Azimilide N-oxide 2.22 86.43 0.01 0.07 (Riley et al., 2005)
Chlorpromazine 3.24 31.8 Chlorpromazine N-oxide 2.39 45.6 0.8 – 1.8 (Yeung et al., 1993)
Dothiepin 2.54 28.5 Dothiepin N-oxide 1.61 42.4 Not known (Maguire et al., 1981)
Elzasonan 3.24 52.1 Elzasonan N-oxide 2.47 65.9 0.27 (Kamel et al., 2010)
This article has not been copyedited and form
atted. The final version m
ay differ from this version.
DM
D Fast Forw
ard. Published on March 1, 2013 as D
OI: 10.1124/dm
d.112.050278 at ASPET Journals on February 13, 2019 dmd.aspetjournals.org Downloaded from
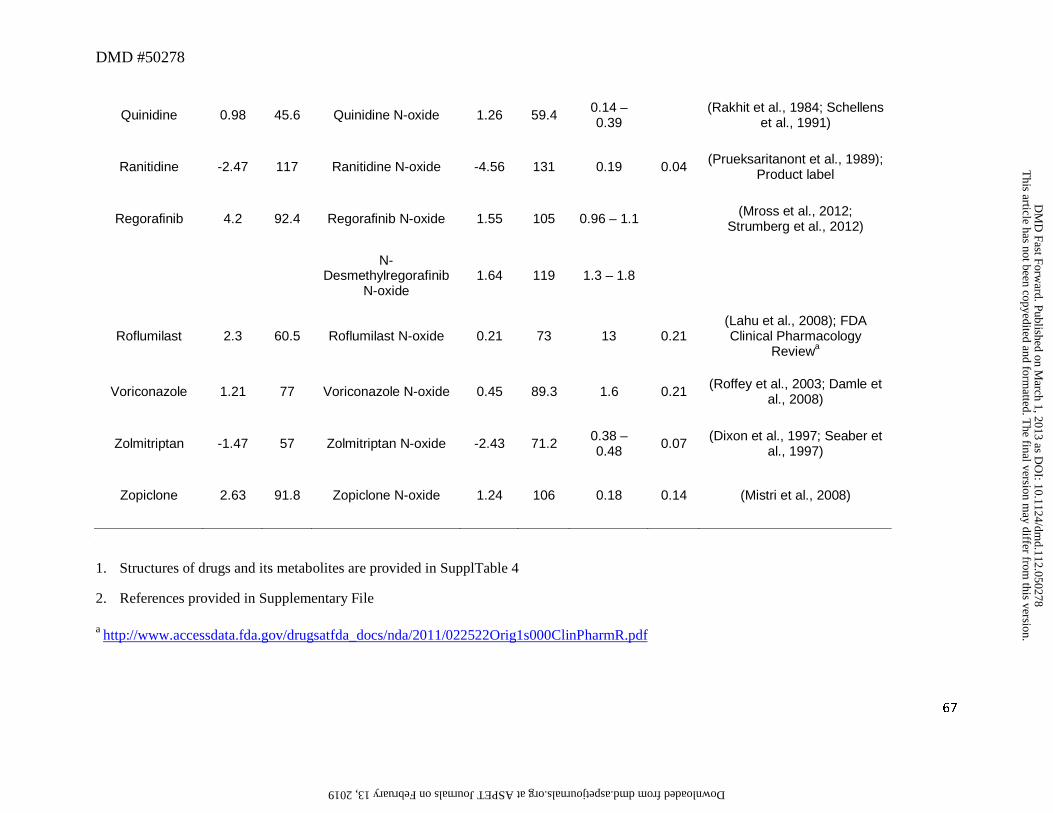
DMD #50278
67
Quinidine 0.98 45.6 Quinidine N-oxide 1.26 59.4 0.14 – 0.39 (Rakhit et al., 1984; Schellens
et al., 1991)
Ranitidine -2.47 117 Ranitidine N-oxide -4.56 131 0.19 0.04 (Prueksaritanont et al., 1989); Product label
Regorafinib 4.2 92.4 Regorafinib N-oxide 1.55 105 0.96 – 1.1 (Mross et al., 2012; Strumberg et al., 2012)
N-
Desmethylregorafinib N-oxide
1.64 119 1.3 – 1.8
Roflumilast 2.3 60.5 Roflumilast N-oxide 0.21 73 13 0.21 (Lahu et al., 2008); FDA Clinical Pharmacology
Reviewa
Voriconazole 1.21 77 Voriconazole N-oxide 0.45 89.3 1.6 0.21 (Roffey et al., 2003; Damle et al., 2008)
Zolmitriptan -1.47 57 Zolmitriptan N-oxide -2.43 71.2 0.38 – 0.48 0.07 (Dixon et al., 1997; Seaber et
al., 1997)
Zopiclone 2.63 91.8 Zopiclone N-oxide 1.24 106 0.18 0.14 (Mistri et al., 2008)
1. Structures of drugs and its metabolites are provided in SupplTable 4
2. References provided in Supplementary File
a http://www.accessdata.fda.gov/drugsatfda_docs/nda/2011/022522Orig1s000ClinPharmR.pdf
This article has not been copyedited and form
atted. The final version m
ay differ from this version.
DM
D Fast Forw
ard. Published on March 1, 2013 as D
OI: 10.1124/dm
d.112.050278 at ASPET Journals on February 13, 2019 dmd.aspetjournals.org Downloaded from
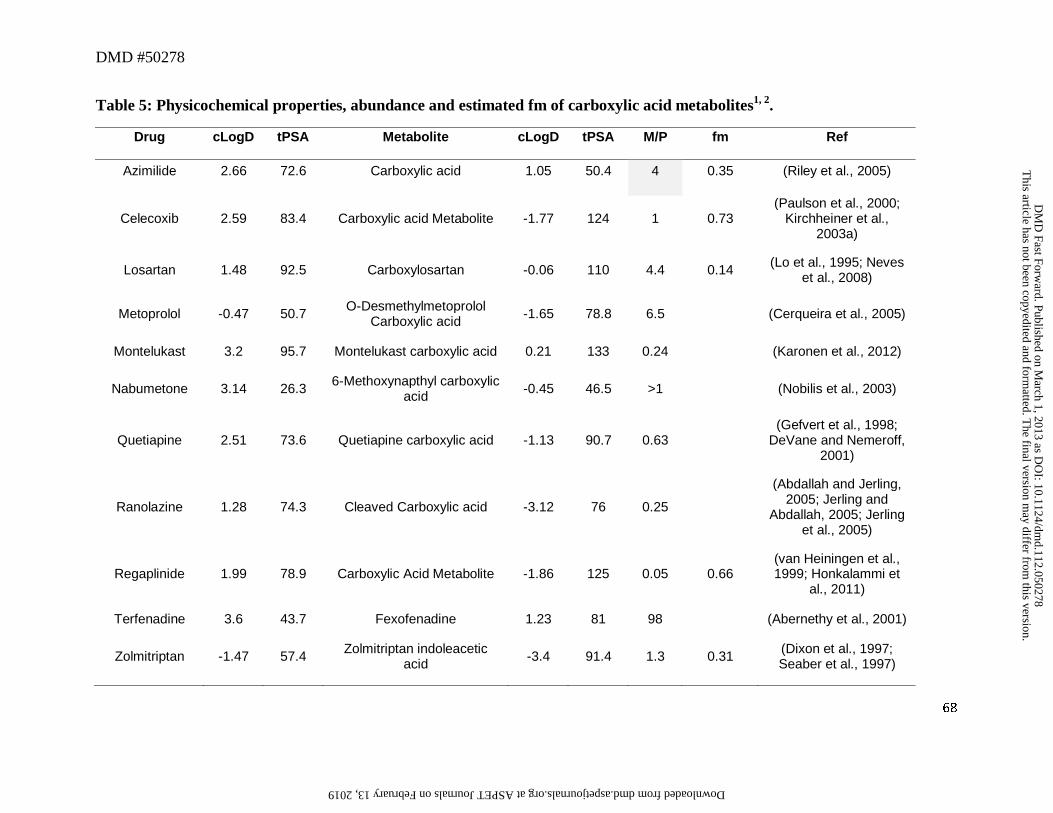
DMD #50278
68
Table 5: Physicochemical properties, abundance and estimated fm of carboxylic acid metabolites1, 2.
Drug cLogD tPSA Metabolite cLogD tPSA M/P fm Ref
Azimilide 2.66 72.6 Carboxylic acid 1.05 50.4 4 0.35 (Riley et al., 2005)
Celecoxib 2.59 83.4 Carboxylic acid Metabolite -1.77 124 1 0.73 (Paulson et al., 2000;
Kirchheiner et al., 2003a)
Losartan 1.48 92.5 Carboxylosartan -0.06 110 4.4 0.14 (Lo et al., 1995; Neves et al., 2008)
Metoprolol -0.47 50.7 O-Desmethylmetoprolol Carboxylic acid -1.65 78.8 6.5
(Cerqueira et al., 2005)
Montelukast 3.2 95.7 Montelukast carboxylic acid 0.21 133 0.24
(Karonen et al., 2012)
Nabumetone 3.14 26.3 6-Methoxynapthyl carboxylic acid -0.45 46.5 >1
(Nobilis et al., 2003)
Quetiapine 2.51 73.6 Quetiapine carboxylic acid -1.13 90.7 0.63
(Gefvert et al., 1998; DeVane and Nemeroff,
2001)
Ranolazine 1.28 74.3 Cleaved Carboxylic acid -3.12 76 0.25
(Abdallah and Jerling, 2005; Jerling and
Abdallah, 2005; Jerling et al., 2005)
Regaplinide 1.99 78.9 Carboxylic Acid Metabolite -1.86 125 0.05 0.66 (van Heiningen et al., 1999; Honkalammi et
al., 2011)
Terfenadine 3.6 43.7 Fexofenadine 1.23 81 98
(Abernethy et al., 2001)
Zolmitriptan -1.47 57.4 Zolmitriptan indoleacetic acid -3.4 91.4 1.3 0.31 (Dixon et al., 1997;
Seaber et al., 1997)
This article has not been copyedited and form
atted. The final version m
ay differ from this version.
DM
D Fast Forw
ard. Published on March 1, 2013 as D
OI: 10.1124/dm
d.112.050278 at ASPET Journals on February 13, 2019 dmd.aspetjournals.org Downloaded from
DMD #50278
69
1. Structures of drugs and its metabolites are provided in SupplTable 5
2. References provided in Supplementary File This article has not been copyedited and form
atted. The final version m
ay differ from this version.
DM
D Fast Forw
ard. Published on March 1, 2013 as D
OI: 10.1124/dm
d.112.050278 at ASPET Journals on February 13, 2019 dmd.aspetjournals.org Downloaded from
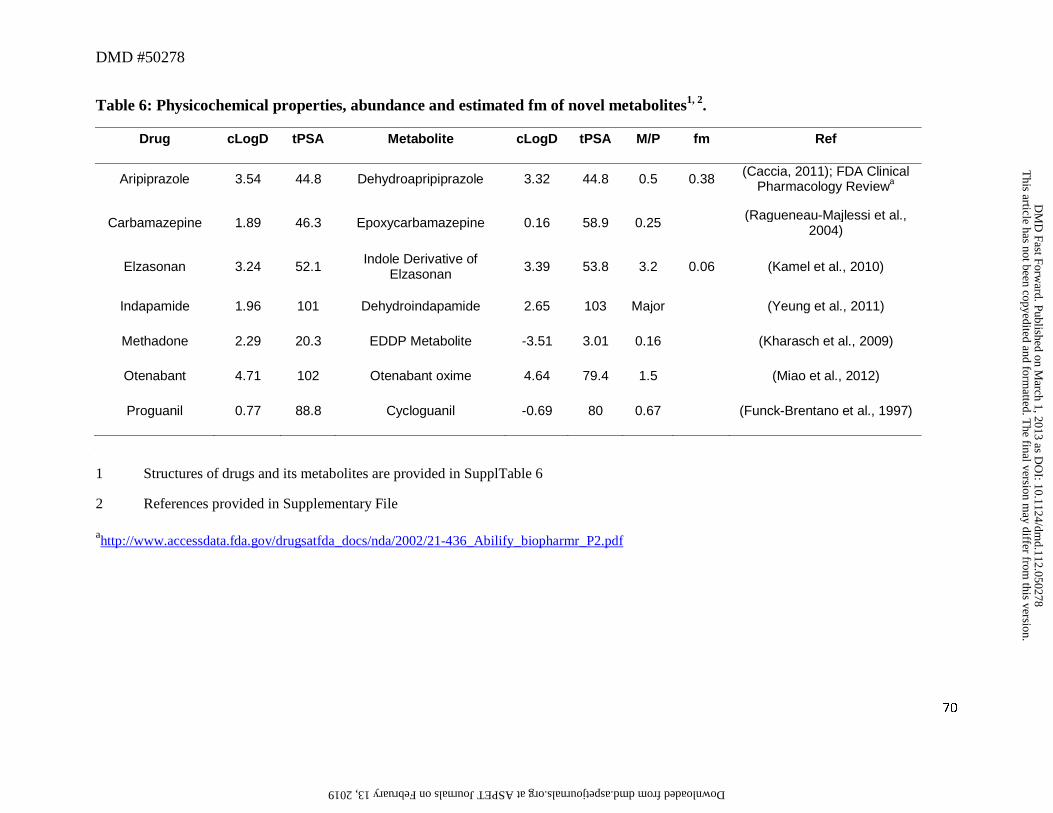
DMD #50278
70
Table 6: Physicochemical properties, abundance and estimated fm of novel metabolites1, 2.
Drug cLogD tPSA Metabolite cLogD tPSA M/P fm Ref
Aripiprazole 3.54 44.8 Dehydroapripiprazole 3.32 44.8 0.5 0.38 (Caccia, 2011); FDA Clinical Pharmacology Reviewa
Carbamazepine 1.89 46.3 Epoxycarbamazepine 0.16 58.9 0.25 (Ragueneau-Majlessi et al., 2004)
Elzasonan 3.24 52.1 Indole Derivative of Elzasonan 3.39 53.8 3.2 0.06 (Kamel et al., 2010)
Indapamide 1.96 101 Dehydroindapamide 2.65 103 Major (Yeung et al., 2011)
Methadone 2.29 20.3 EDDP Metabolite -3.51 3.01 0.16 (Kharasch et al., 2009)
Otenabant 4.71 102 Otenabant oxime 4.64 79.4 1.5 (Miao et al., 2012)
Proguanil 0.77 88.8 Cycloguanil -0.69 80 0.67 (Funck-Brentano et al., 1997)
1 Structures of drugs and its metabolites are provided in SupplTable 6
2 References provided in Supplementary File
ahttp://www.accessdata.fda.gov/drugsatfda_docs/nda/2002/21-436_Abilify_biopharmr_P2.pdf
This article has not been copyedited and form
atted. The final version m
ay differ from this version.
DM
D Fast Forw
ard. Published on March 1, 2013 as D
OI: 10.1124/dm
d.112.050278 at ASPET Journals on February 13, 2019 dmd.aspetjournals.org Downloaded from
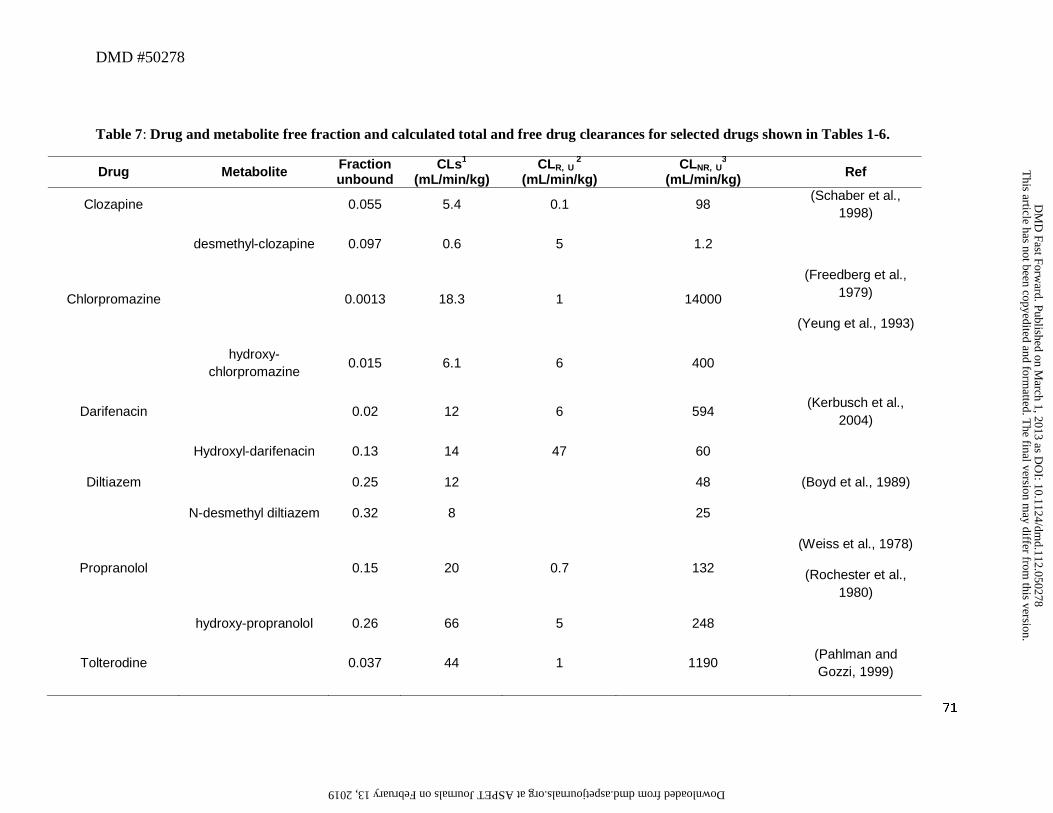
DMD #50278
71
Table 7: Drug and metabolite free fraction and calculated total and free drug clearances for selected drugs shown in Tables 1-6.
Drug Metabolite Fraction unbound
CLs1 (mL/min/kg)
CLR, U 2
(mL/min/kg) CLNR, U
3 (mL/min/kg) Ref
Clozapine 0.055 5.4 0.1 98 (Schaber et al.,
1998)
desmethyl-clozapine 0.097 0.6 5 1.2
Chlorpromazine 0.0013 18.3 1 14000
(Freedberg et al., 1979)
(Yeung et al., 1993)
hydroxy-
chlorpromazine 0.015 6.1 6 400
Darifenacin 0.02 12 6 594 (Kerbusch et al.,
2004)
Hydroxyl-darifenacin 0.13 14 47 60
Diltiazem 0.25 12 48 (Boyd et al., 1989)
N-desmethyl diltiazem 0.32 8 25
Propranolol 0.15 20 0.7 132
(Weiss et al., 1978)
(Rochester et al., 1980)
hydroxy-propranolol 0.26 66 5 248
Tolterodine 0.037 44 1 1190 (Pahlman and Gozzi, 1999)
This article has not been copyedited and form
atted. The final version m
ay differ from this version.
DM
D Fast Forw
ard. Published on March 1, 2013 as D
OI: 10.1124/dm
d.112.050278 at ASPET Journals on February 13, 2019 dmd.aspetjournals.org Downloaded from
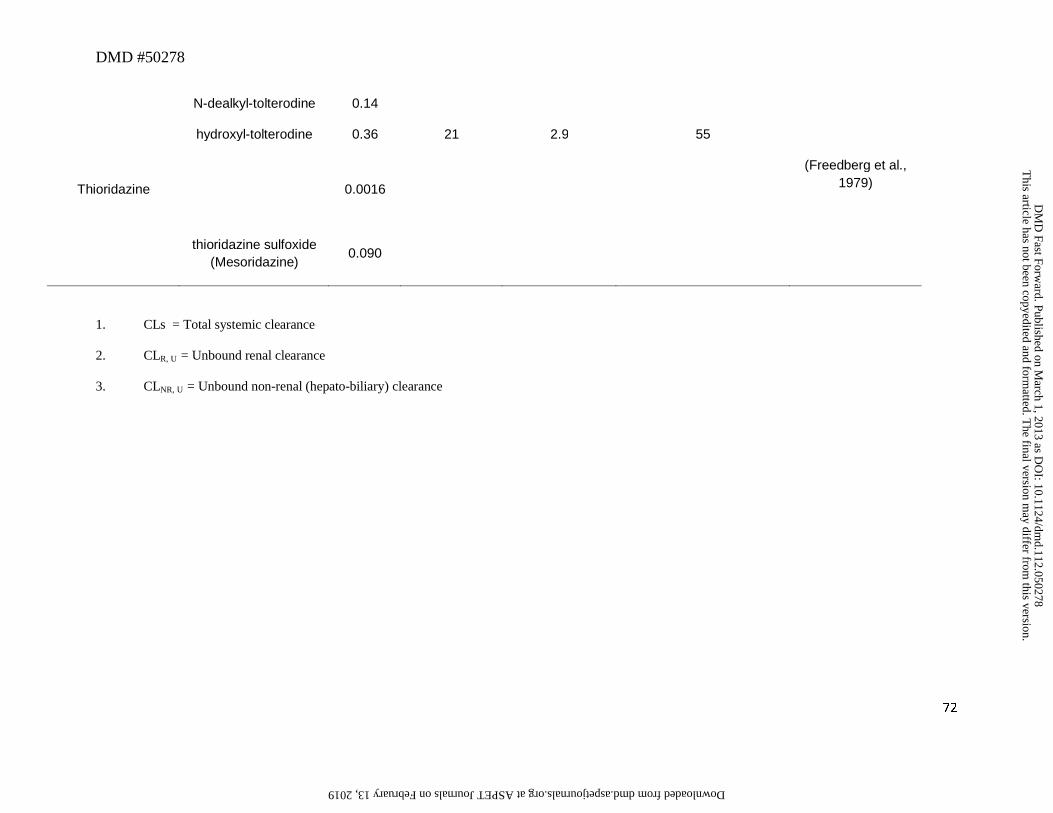
DMD #50278
72
N-dealkyl-tolterodine 0.14
hydroxyl-tolterodine 0.36 21 2.9 55
Thioridazine 0.0016
(Freedberg et al., 1979)
thioridazine sulfoxide
(Mesoridazine) 0.090
1. CLs = Total systemic clearance
2. CLR, U = Unbound renal clearance
3. CLNR, U = Unbound non-renal (hepato-biliary) clearance
This article has not been copyedited and form
atted. The final version m
ay differ from this version.
DM
D Fast Forw
ard. Published on March 1, 2013 as D
OI: 10.1124/dm
d.112.050278 at ASPET Journals on February 13, 2019 dmd.aspetjournals.org Downloaded from
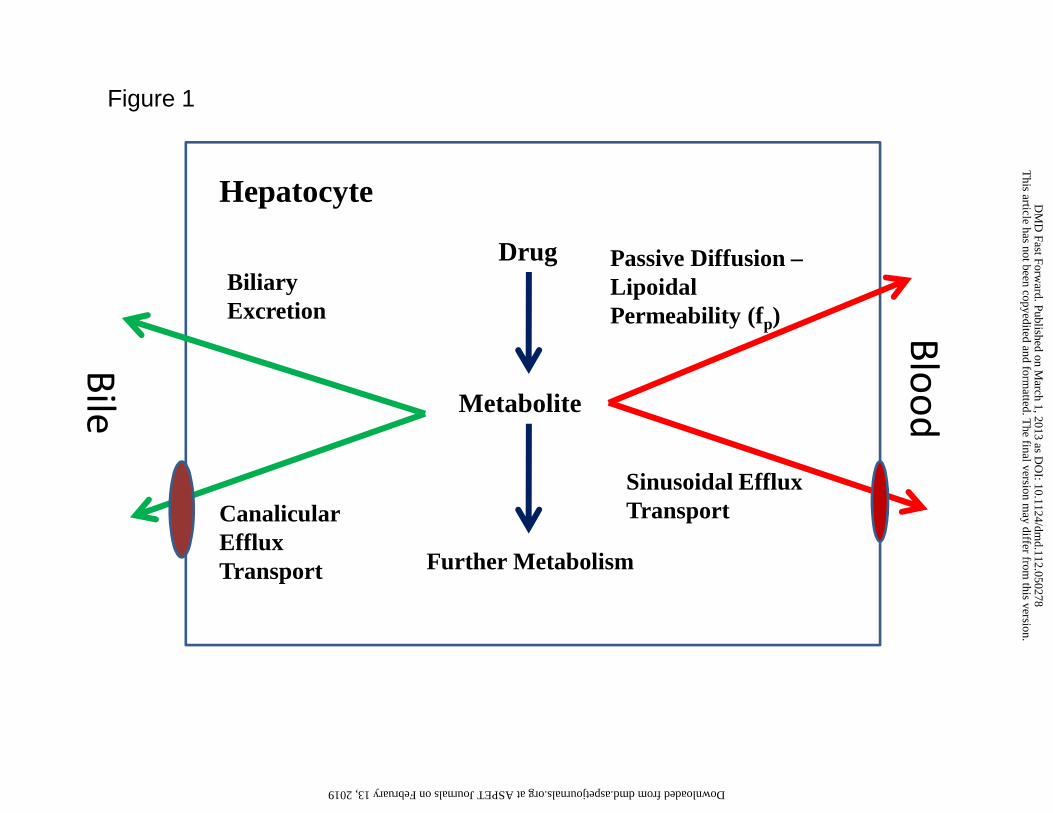
Drug
Metabolite
Blood
Passive Diffusion –Lipoidal Permeability (fp)
Sinusoidal Efflux Transport
Further Metabolism
Biliary Excretion
Bile
Hepatocyte
Canalicular Efflux Transport
Figure 1
This article has not been copyedited and form
atted. The final version m
ay differ from this version.
DM
D Fast Forw
ard. Published on March 1, 2013 as D
OI: 10.1124/dm
d.112.050278 at ASPET Journals on February 13, 2019 dmd.aspetjournals.org Downloaded from
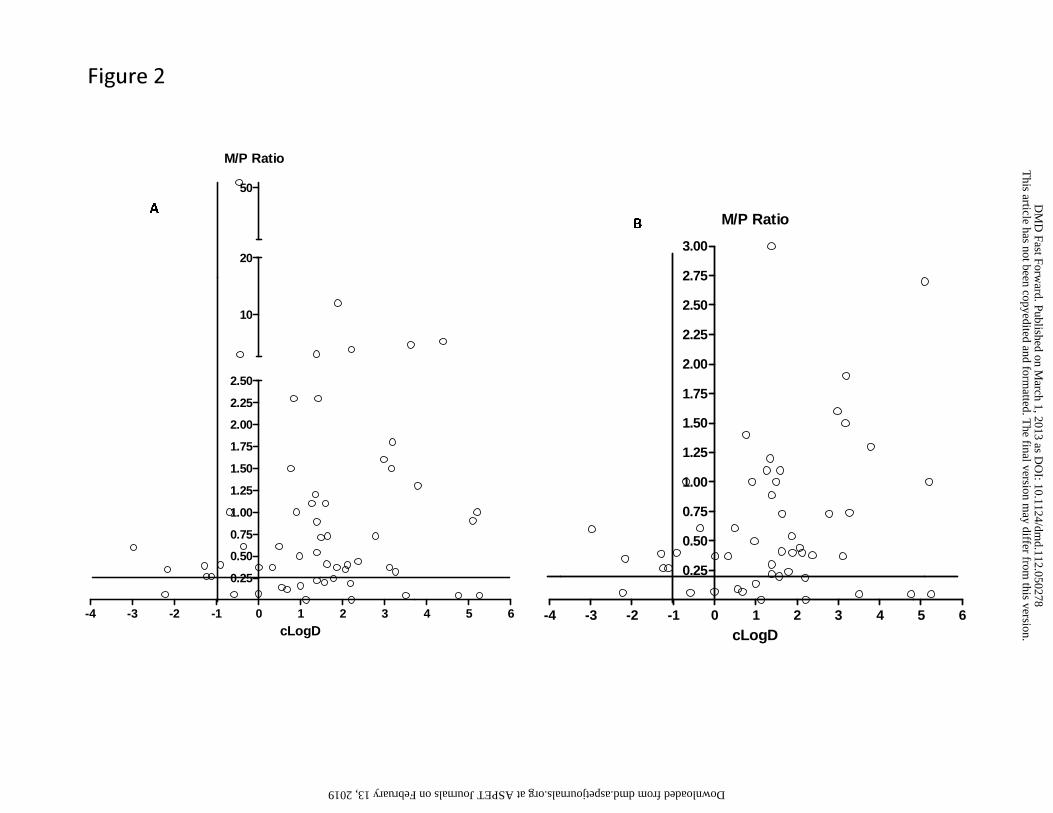
-4 -3 -2 -1 0 1 2 3 4 5 6
0.25
0.50
0.75
1.00
1.25
1.50
1.75
2.00
2.25
2.50
10
20
50
M/P Ratio
cLogD-4 -3 -2 -1 0 1 2 3 4 5 6
0.25
0.50
0.75
1.00
1.25
1.50
1.75
2.00
2.25
2.50
2.75
3.00
M/P Ratio
cLogD
A
B
Figure 2
This article has not been copyedited and form
atted. The final version m
ay differ from this version.
DM
D Fast Forw
ard. Published on March 1, 2013 as D
OI: 10.1124/dm
d.112.050278 at ASPET Journals on February 13, 2019 dmd.aspetjournals.org Downloaded from
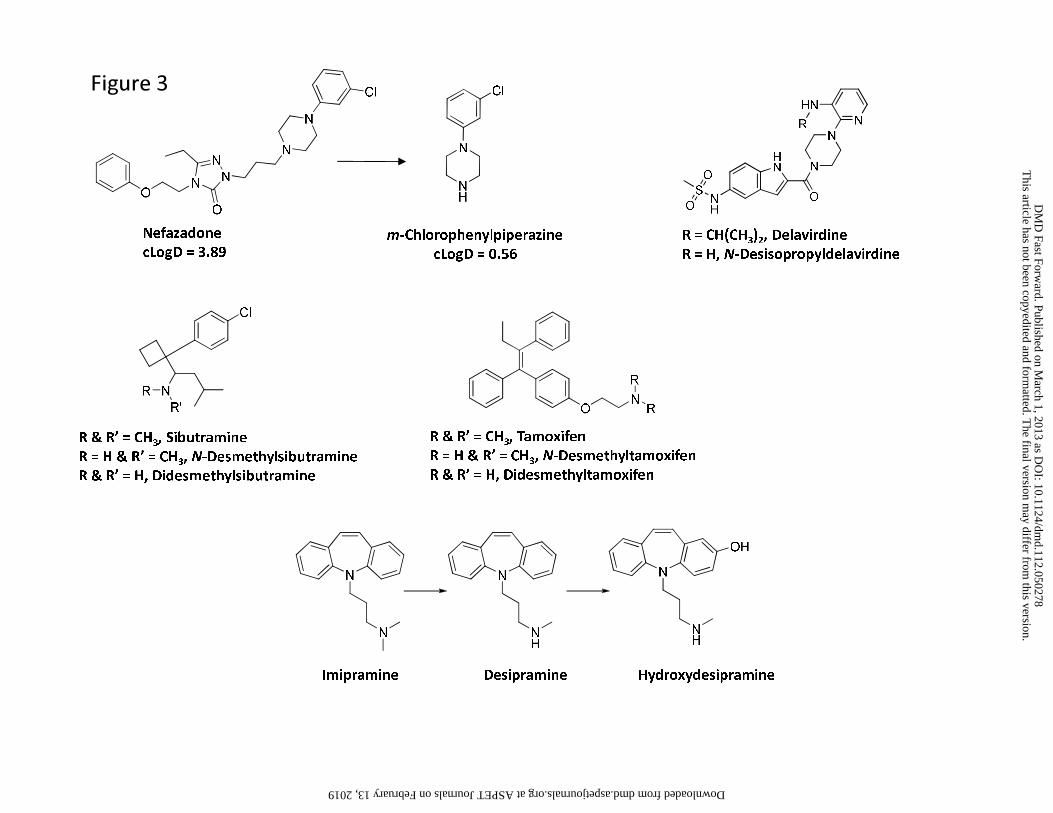
Nefazadone
cLogD = 3.89m-Chlorophenylpiperazine
cLogD = 0.56
R = CH(CH3)2, Delavirdine
R = H, N-Desisopropyldelavirdine
R & R’ = CH3, Sibutramine
R = H & R’ = CH3, N-Desmethylsibutramine
R & R’ = H, Didesmethylsibutramine
R & R’ = CH3, Tamoxifen
R = H & R’ = CH3, N-Desmethyltamoxifen
R & R’ = H, Didesmethyltamoxifen
Imipramine Desipramine Hydroxydesipramine
Figure 3
This article has not been copyedited and form
atted. The final version m
ay differ from this version.
DM
D Fast Forw
ard. Published on March 1, 2013 as D
OI: 10.1124/dm
d.112.050278 at ASPET Journals on February 13, 2019 dmd.aspetjournals.org Downloaded from
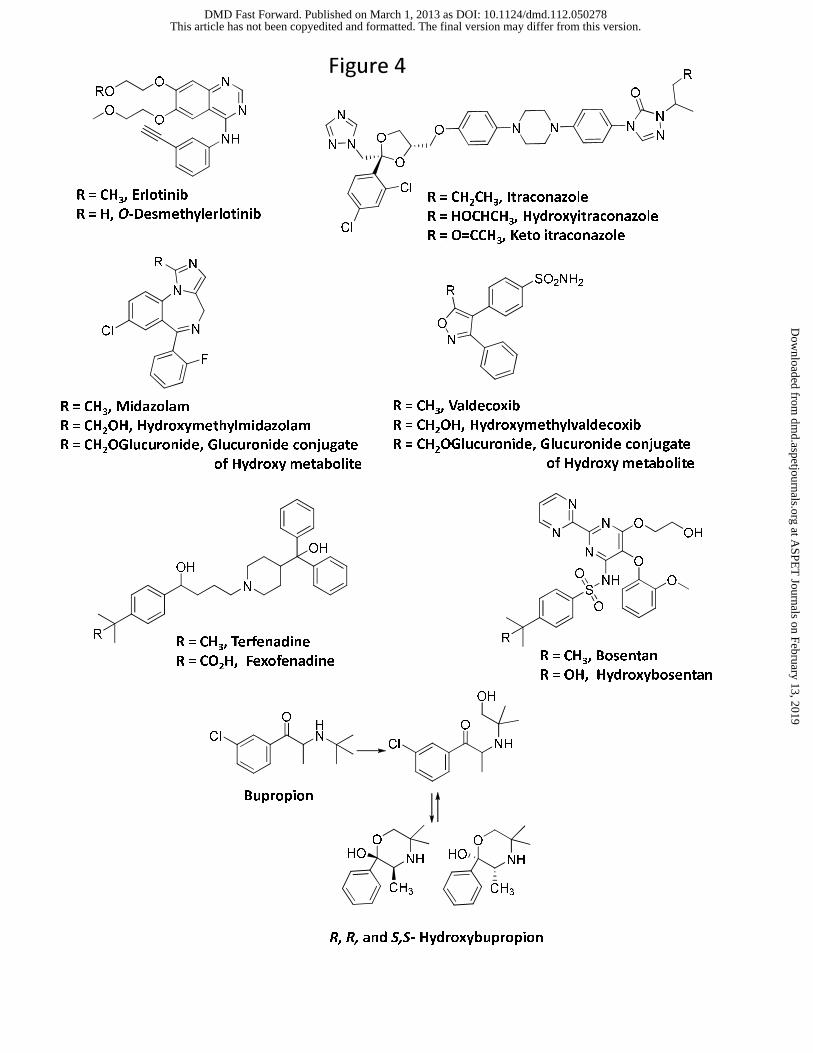
R = CH3, Erlotinib
R = H, O-DesmethylerlotinibR = CH
2CH
3, Itraconazole
R = HOCHCH3, Hydroxyitraconazole
R = O=CCH3, Keto itraconazole
R = CH3, Valdecoxib
R = CH2OH, Hydroxymethylvaldecoxib
R = CH2OGlucuronide, Glucuronide conjugate
of Hydroxy metabolite
R = CH3, Midazolam
R = CH2OH, Hydroxymethylmidazolam
R = CH2OGlucuronide, Glucuronide conjugate
of Hydroxy metabolite
R = CH3, Terfenadine
R = CO2H, Fexofenadine
O
ClHN
O
Cl NH
NH
O
HO
CH3
OH
NH
O
HO
CH3
Bupropion
R, R, and S,S- Hydroxybupropion
R = CH3, Bosentan
R = OH, Hydroxybosentan
Figure 4
This article has not been copyedited and formatted. The final version may differ from this version.DMD Fast Forward. Published on March 1, 2013 as DOI: 10.1124/dmd.112.050278
at ASPE
T Journals on February 13, 2019
dmd.aspetjournals.org
Dow
nloaded from
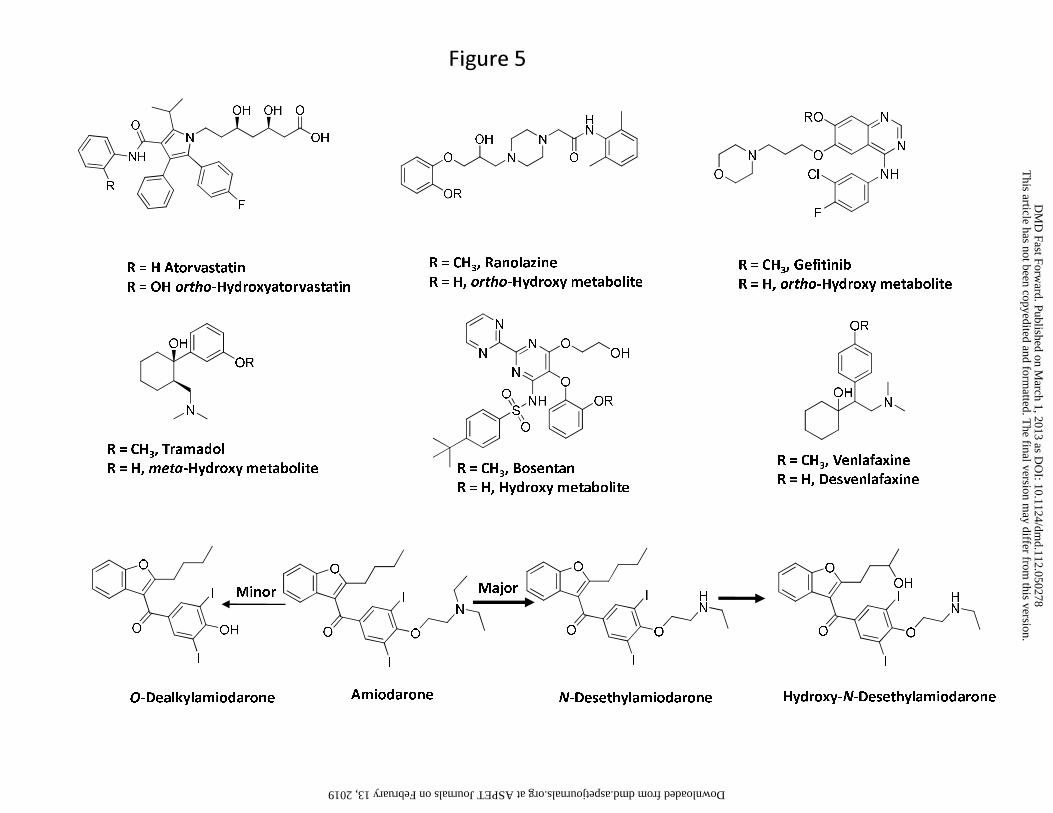
R = H Atorvastatin
R = OH ortho-Hydroxyatorvastatin
R = CH3, Ranolazine
R = H, ortho-Hydroxy metaboliteR = CH
3, Gefitinib
R = H, ortho-Hydroxy metabolite
OH
OR
N
R = CH3, Venlafaxine
R = H, Desvenlafaxine
R = CH3, Tramadol
R = H, meta-Hydroxy metabolite R = CH3, Bosentan
R = H, Hydroxy metabolite
AmiodaroneO-Dealkylamiodarone N-Desethylamiodarone Hydroxy-N-Desethylamiodarone
Minor Major
Figure 5
This article has not been copyedited and form
atted. The final version m
ay differ from this version.
DM
D Fast Forw
ard. Published on March 1, 2013 as D
OI: 10.1124/dm
d.112.050278 at ASPET Journals on February 13, 2019 dmd.aspetjournals.org Downloaded from
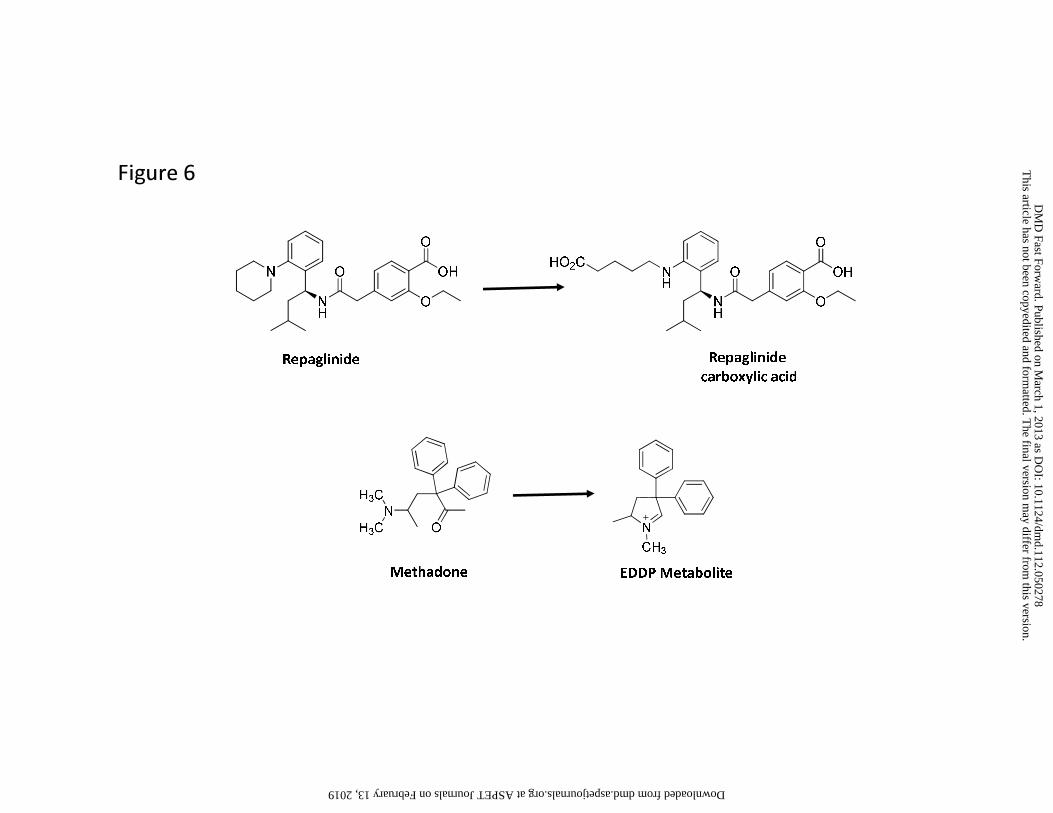
Repaglinide Repaglinide
carboxylic acid
N
CH3
Methadone EDDP Metabolite
Figure 6
This article has not been copyedited and form
atted. The final version m
ay differ from this version.
DM
D Fast Forw
ard. Published on March 1, 2013 as D
OI: 10.1124/dm
d.112.050278 at ASPET Journals on February 13, 2019 dmd.aspetjournals.org Downloaded from
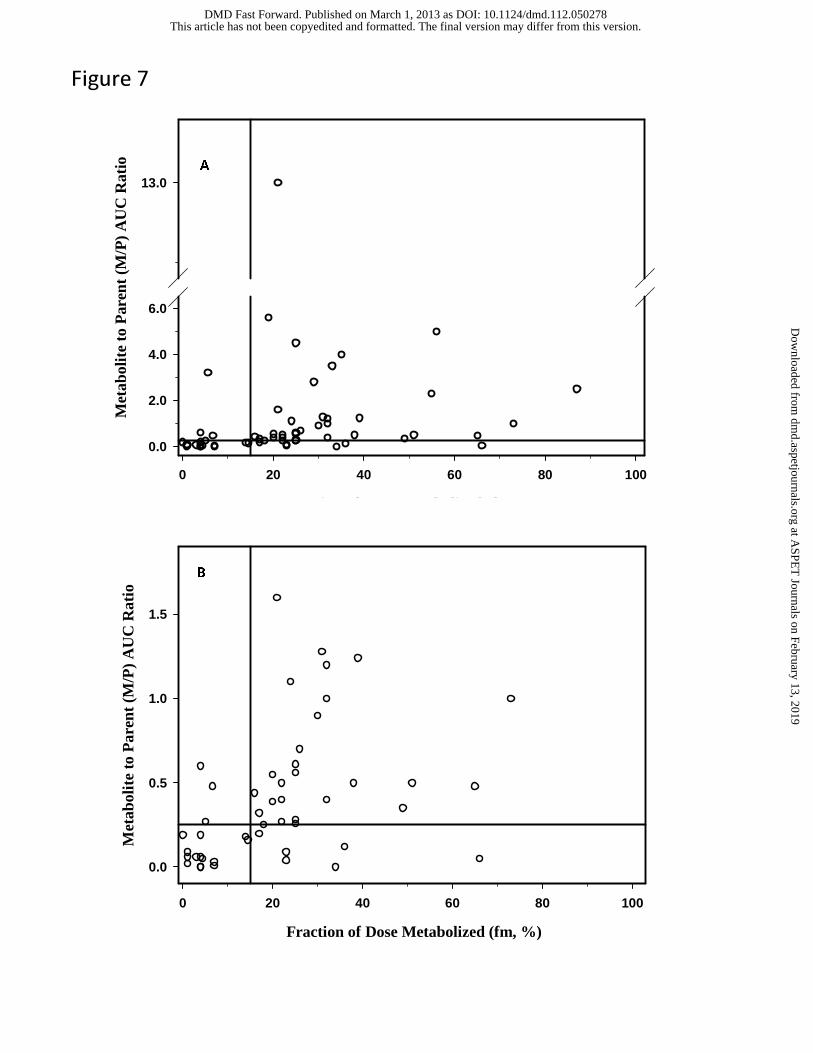
Fraction of Dose Metabolized (fm, %)
0 20 40 60 80 100
Met
abol
ite
to P
aren
t (M
/P)
AU
C R
atio
0.0
2.0
4.0
6.0
13.0
Fraction of Dose Metabolized (fm, %)
0 20 40 60 80 100
Met
abol
ite
to P
aren
t (M
/P)
AU
C R
atio
0.0
0.5
1.0
1.5
A
B
Figure 7
This article has not been copyedited and formatted. The final version may differ from this version.DMD Fast Forward. Published on March 1, 2013 as DOI: 10.1124/dmd.112.050278
at ASPE
T Journals on February 13, 2019
dmd.aspetjournals.org
Dow
nloaded from