Embed Size (px)
Citation preview
BearWorks BearWorks
MSU Graduate Theses
Summer 2019
White-Nose Syndrome and Immune Responses in a Resistant Bat White-Nose Syndrome and Immune Responses in a Resistant Bat
Species (Eptesicus fuscus) Species (Eptesicus fuscus)
Keslie Skye Naffa Missouri State University, [email protected]
As with any intellectual project, the content and views expressed in this thesis may be
considered objectionable by some readers. However, this student-scholar’s work has been
judged to have academic value by the student’s thesis committee members trained in the
discipline. The content and views expressed in this thesis are those of the student-scholar and
are not endorsed by Missouri State University, its Graduate College, or its employees.
Follow this and additional works at: https://bearworks.missouristate.edu/theses
Part of the Biology Commons, Immunology of Infectious Disease Commons, Other
Immunology and Infectious Disease Commons, Physiology Commons, and the Zoology
Commons
Recommended Citation Recommended Citation Naffa, Keslie Skye, "White-Nose Syndrome and Immune Responses in a Resistant Bat Species (Eptesicus fuscus)" (2019). MSU Graduate Theses. 3437. https://bearworks.missouristate.edu/theses/3437
This article or document was made available through BearWorks, the institutional repository of Missouri State University. The work contained in it may be protected by copyright and require permission of the copyright holder for reuse or redistribution. For more information, please contact [email protected].
WHITE-NOSE SYNDROME AND IMMUNE RESPONSES IN A RESISTANT BAT
SPECIES (EPTESICUS FUSCUS)
A Master’s Thesis
Presented to
The Graduate College of
Missouri State University
TEMPLATE
In Partial Fulfillment
Of the Requirements for the Degree
Master of Science, Biology
By
Keslie Naffa
August 2019

ii
Copyright 2019 by Keslie Skye Naffa
iii
WHITE-NOSE SYNDROME AND IMMUNE RESPONSES IN A RESISTANT BAT
SPECIES (EPTESICUS FUSCUS)
Biology
Missouri State University, August 2019
Master of Science
Keslie Naffa
ABSTRACT
White-nose syndrome (WNS) has had a large negative impact on bat populations across eastern
North America since its arrival in 2006. Bats affected by WNS appear to die of starvation,
possibly due to the increased arousals during hibernation when there is no food present to replace
the energy used to arouse. During hibernation, the bat’s immune system should be suppressed.
However, once a bat of a susceptible species is exposed to the fungus that causes WNS,
Psuedogymnoascus destructans (Pd), the immune system seems to respond, potentially causing
an elevation in metabolic rate, which may cause the bat to arouse more often. I hypothesize that
resistant bats do not mount an immune response; however, if they do mount an immune
response, I hypothesize that bats inoculated with Pd and treated with an anti-inflammatory
treatment will not respond to the infection, ultimately preserving fat reserves and lowering
metabolic expenditures during hibernation. I tested these hypotheses by inoculating a species that
does not suffer from high WNS mortality (big brown bats: Eptesicus fuscus), with Pd.
Meloxicam was given to one of the three treatment groups in order to suppress the immune
system. Metabolic rate during torpor, via oxygen consumption, was measured in addition to
arousal/torpor bout patterns, the latter utilizing temperature-sensitive dataloggers. To quantify
expression of four immune-function genes (NLRP10, CD200, ICAM5, and TNFRSF21), gene
activity was measured via RT-qPCR on tissue and blood samples taken from each bat pre- and
post- hibernation. These genes were chosen based on a prior study that showed differences in
these genes between susceptible and resistant species. There were no significant differences
found across treatment groups for gene expression, nor energetic data; however, hibernation did
suppress NLRP10 expression, and blood samples consistently had higher gene expression than
tissue samples, thus indicating these genes may be expressed at low levels in some tissues. It is
imperative that we continue investigating the differences between susceptible and resistant bat
species as WNS is advancing westward throughout the country.
KEYWORDS: immune system, hibernation, torpor, WNS, white-nose syndrome, inflammation,
Eptesicus fuscus, Pseudogymnoascus destructans, Pd
iv
WHITE-NOSE SYNDROME AND IMMUNE RESPONSES IN A RESISTANT BAT
SPECIES (EPTESICUS FUSCUS)
By
Keslie Naffa
A Master’s Thesis
Submitted to the Graduate College
Of Missouri State University
In Partial Fulfillment of the Requirements
For the Degree of Master of Science, Biology
August 2019
Approved:
Tom Tomasi, Ph.D., Thesis Committee Chair
Christopher Lupfer, Ph.D., Committee Member
Day Ligon, Ph.D., Committee Member
Julie Masterson, Ph.D., Dean of the Graduate College
In the interest of academic freedom and the principle of free speech, approval of this thesis
indicates the format is acceptable and meets the academic criteria for the discipline as
determined by the faculty that constitute the thesis committee. The content and views expressed
in this thesis are those of the student-scholar and are not endorsed by Missouri State University,
its Graduate College, or its employees.

v
ACKNOWLEDGEMENTS
I would like to thank the following people for their support during the duration of my
graduate studies. For undying encouragement and support, I thank my committee members: Drs.
Tom Tomasi, Christopher Lupfer and Day Ligon. For research funding, I would like to thank
Missouri State University Graduate College and Department of Biology. For the aid in bat
collection and processing, I thank the Missouri Department of Conservation. For research
assistance, I thank Tricia Blankenship, Susan Anderson, Meagan Rippee-Brooks, Abbigale
Brown, and Christopher Bogart. For endless motivation, support, and much needed laughs, I
thank Savanna and Lilly, Danielle, Ciera, Meagan, Mora, and Winston. I thank my grandmother,
Bonnie, my grandfather, Mansour, and my step-father, Steve, for providing me with the
motivation I needed during the trying times. For unconditional love and continuous inspiration, I
thank my extraordinary mother, Dena- “to the moon and back, always.”
I dedicate this thesis to my best friend and better half, Jacob Inman, for providing
unconditional encouragement, love, and support, even during the most undeserving of times. I
am forever grateful for you and your devotion to our goals.
vi
TABLE OF CONTENTS
Introduction Page 1
Bat Value Page 1
Conservation Implications Page 3
WNS and Big Brown Bats Page 5
Hibernation Page 8
Immune Function Page 9
Research Questions Page 11
Methods Page 13
Results Page 18
Discussion Page 20
References Page 23 Appendix Page 52
vii
LIST OF TABLES
Table 1. Primer sequences Page 30
Table 2. Energetics data Page 31
Table 3. Gene expression descriptive statistics Page 32
Table 4. Gene expression across hibernation time Page 33
viii
LIST OF FIGURES
Figure 1. WNS occurrence map Page 34
Figure 2. Torpor/Arousal cycle Page 35
Figure 3. Apneic/breathing cycles Page 36
Figure 4. Temperature-sensitive datalogger data Page 37
Figure 5. Mass loss vs. total number of arousals Page 38
Figure 6. Survival rates Page 39
Figure 7. NLRP10 expression Page 40
Figure 8. CD200 expression Page 41
Figure 9. ICAM5 expression Page 42
Figure 10. TNFRSF21 expression Page 43
1
INTRODUCTION
The Order Chiroptera represents more than 1,200 known species of bats that are
distributed across the globe and demonstrate a wide variety of foraging techniques, diet
specializations, reproductive behaviors, and habitat diversity (Jones et al. 2005; Kunz et al. 2011;
Wilson 2019). They account for approximately 20% of all living mammalian species (Hill 1984)
and include 19 different families. Vespertilionidae, the largest bat family in the world, includes
over 400 insectivorous bat species. Vespertilionids are well established on all continents except
Antarctica and hold great physiological diversity (Birkett et al. 2014). The International Union
for Conservation of Nature (IUCN) reports 7 vespertilionid species critically endangered, 16
endangered, and 26 vulnerable (IUCN Red List 2019). With the continuous addition of species to
the threatened list, it is imperative to continue research and educational outreach regarding bats
and their value, in order to create management plans to aid in the conservation of these animals.
Bat Value
The natural resources and ecological services that bats provide to our society are
extremely important. Bats are one of the world’s leading groups of pollinators, and they are
considered one of the most efficient forms of natural insect control (Kunz et al. 2011). A colony
of 150 insectivorous bats can consume up to 1.3 million insects per season (Whitaker 1995),
which saves agriculturalists time and money by not having to treat their crops with
environmentally un-safe pesticides. Mexican free-tailed bats (Tadarida brasiliensis) are a
critically important source of natural pest control. A maternity colony of one million bats can
consume an estimated 8.4 metric tons of insects per night, which is equivalent to one individual
2
consuming half of its body weight per night (Kunz and Fenton 2003). It is estimated in the
United States that insectivorous bats have an economic value of approximately $22.9 billion
annually in by reducing the need for chemical insect control alone (Boyles et al. 2011). This
estimation does not include the consumption of forest pests, which aid harvesters of lumber, nor
does it include the human health aspects of avoiding the ingestion of potentially harmful
pesticides or a decrease in insect-borne diseases. Therefore, the estimate of the economic
importance of bats is clearly an underestimate.
In Mexico, Agave tequilana, the plant from which we derive tequila, was known to have
a very small genetic diversity in cultivated fields, leaving them vulnerable to disease that may
lead to widespread crop failure. With the help of bat pollination, and bat-friendly agricultural
practices, genetic diversity has been increased (Trejo-Salazar et al. 2016). At one Agave farm,
progressive Agave farmers are allowing 5% of their crops to flower, which feeds an estimated 89
individual bats per night (Trejo-Salazer et al. 2016). In addition to providing bats food,
pollination as a result of bat nectar consumption has increased genetic diversity via pollination of
Agave flowers throughout many Agave croplands across Mexico (Trejo-Salazer et al. 2016). An
increase in genetic diversity is not only beneficial to the fitness of the species, but also acts as a
form of job security for many Agave farmers in Mexico’s rural areas, since their entire crop is
less likely to be killed by an emerging disease or climate change issues. If this practice was
implemented across Mexico, it could provide food for over two million bats per month across the
country during the flowering season, in addition to aiding in economic growth (Trejo-Salazer et
al. 2016).
3
Conservation Implications
Fungal diseases have had a devastating impact on multiple taxa, both plant and animal,
across the globe. The increase in fungal pathogens are due to both environmental and non-
environmental factors. Global warming is an environmental factor that is allowing fungi to
flourish in areas that were not well-suited habitats several years ago. Because the majority of
fungi are typically found in moist, temperate environments, the warming of the earth and the
change in habitats are allowing fungal pathogens to inhabit new areas, which means they could
be inhabiting new hosts (Konkel 2017). These shifts in temperature could drive the evolution of
more heat-tolerant fungal pathogens (Konkel 2017). In addition, drug resistance has also been a
factor in increasing fungal pathogens. A large amount of agricultural fungicides are no longer
providing protection against fungal pathogens due to increased resistance (Konkel 2017). These
fungal pathogens have been devastating to several populations and are increasingly becoming
more virulent (Konkel 2017).
A fungi, known as rice blast (Magnaporthe oryzae), can cause losses of up to 30% of a
grain field in a given season (Talbot 2003), which can inhibit agricultural yield and disrupt the
ecological balance of the area. Among animal taxa, frog (McCallum 2005), bee (Fisher et al.
2012), and bat (Blehert et al. 2009) populations have all been declining due to invasive fungal
diseases that affect the animals’ environment and immune systems. Chytrid fungus in
amphibians has decimated populations globally. This fungus infects keratinized cells of the
epidermis, but the mechanism of how this fungus becomes fatal is unknown (Ouellet et al. 2005).
Chalkbrood is a fungal disease in bee populations that affects the developing broods (Flores et al.
2005). It causes mummification of the infected individual, causing population declines and
decreased honey production. In social animals such as bees, individual and social immune
4
responses may be produced to create a warning to other colony members (Armitage et al. 2011).
Physiological, organizational, and behavioral defenses allow colonies to form social immunity
by preventing attack and dispersal of pathogenic agents (Richter et al. 2012). Bats also face a
high risk of contracting a fungal disease known as white-nose syndrome (WNS).
Bat populations of some species in North America have been declining rapidly for
several decades. Habitat destruction (Rabinowitz and Tuttle 1980; Medellin 2003), wind energy
farms (Arnett et al. 2008), and WNS (Blehert et al. 2009) are the primary causes for this decline.
Bats typically select specialized habitats for foraging and roosting, such as caves and mines
(Brooks and Ford 2006); however, due to cave and mine destruction for agriculture and
development, populations that previously inhabited these areas are displaced. They then select
areas to roost where they are seen as pests and/or are being forced to roost in areas of increased
vulnerability to predators (Mering and Chambers 2014). However, scientists and civilians are
now creating artificial roosts, where natural roosts have been destroyed, to aid in population
management and to increase bat-mediated seed dispersal and pest control (Mering and Chambers
2014). In addition, bat mortalities have now surpassed bird mortalities in regions where wind
turbines are abundant (Barclay et al. 2007). An estimated 1.3 million bats were killed by wind
turbines from 2000-2012 (Arnett and Baerwald 2013). While conservationists and
environmentalists are advocating for renewable energy resources to take over as primary energy
sources, they are also fighting to reduce bird and bat mortalities by implementing new strategies
to help these animals avoid the areas and to engineer safer designs for wind turbines (Baerwald
et al. 2009; Zimmerling and Francis 2016). In addition, WNS has been the leading cause of bat
population decline since its arrival in the US in 2006 (Blehert et al. 2009). Some species have
5
suffered from exceedingly high rates of mortality (90-99%) in several populations across eastern
North America (Blehert et al. 2009).
WNS and Big Brown Bats
The responsible pathogenic agent of WNS is Pseudogymnoascus destructans (Pd) (Field
et al. 2015), previously referred to as Geomyces destructans (Lorch et al. 2011). Pd is a
psychrophilic (cold-loving) fungal pathogen that poses physiological threats such as increased
frequency of arousal and resulting depletion of fat during the hibernation season (Verant et al.
2014). The fungus was first observed at Howe’s Cave, New York in 2006 (Blehert et al. 2009)
and has since spread westward throughout the eastern and central United States and Canada, and
reaching small, isolated sections of California and Washington state (Lorch et al. 2016; Fig. 1).
The presence of Pd has been observed on 18 species of bats in North America: eastern small-
footed bats (Myotis leibii), Indiana bats (M. sodalis), gray bats (M. grisescens), little brown bats
(M. lucifugus), northern long-eared bats (M. septentrionalis), southeastern myotis (M.
austroriparius), Yuma myotis (M. yumanensis), big brown bat (Eptesicus fuscus), cave myotis
(Myotis velifer), silver-haired bat (Lasionycteris noctivagans), Virginia big-eared bat
(Corynorhinus townsendii virgianus), eastern red bat (Lasiurus borealis), Rafinesque’s big-eared
bat (Corynorhinus rafinesquii), Ozark big-eared bat (Plecotus towndendii ingens), Townsend’s
big-eared bat (Corynorhinus townsendii), western small-footed bat (Myotis ciliolabrum),
Mexican free-tailed bat (Tadarida brasiliensis), and tri-colored bat (Perimyotis subflavus)
(Moore et al. 2013; Bat Conservation International 2018). Although Pd spores and/or hyphae
have been observed in these species, it is not always an indication of inevitable mortality. Some
species are relatively resistant to WNS, while others are known to be extremely susceptible
6
(Davy et al. 2017). It has been suggested that bat populations in Europe most likely coevolved
with G. destructans, enabling resistance to the fungus via residual microbes (Wibbelt et al.
2010). European populations have had relatively little-known mortality compared to populations
in North America. Pd has also been found in several sites in northeastern China, as well as in
high rates throughout Russia (Hoyt et al. 2016; Kovacova et al. 2018), without any mass
mortality events documented. In addition to questioning the genetic differences between
European bat populations and North American populations, this also raises the question of how
WNS is being transmitted between land masses. Marine vessels have been a vehicle of assisted
migration of bats to Alaska and Canada (Voute 1980; Wright and Moran 2011). Furthermore,
human-assisted spread of Pd has contributed to the rapid dispersal of the fungus to and within
North America. The lack of decontamination efforts by cavers have likely increased the speed
and range of fungal spread (Ballmann et al. 2017).
Pd grows at temperatures between 2-18C (Verant et al. 2012), with an optimal growth
temperature of 5-10C (Blehert et al. 2009), which coincides with typical ambient temperatures
of bat hibernacula. When fungal spores germinate, they develop into filaments of fungal cells,
called hyphae, that become embedded in the epidermis of the hibernating bat skin. The hyphae
become a large network, which then extends under the skin surface, leading to the generation of
white fruiting bodies on the cutaneous membranes (skin) of the face and wings of the bats
(Boyles and Willis 2010), causing microscopic erosions in tissue that serves as a quantitative
index of disease severity (Reeder et al. 2012). Symptoms of the syndrome include an increased
number or arousals (Reeder et al. 2012), low fat reserves (Britzke et al. 2010; Courtin et al.
2010), increased evaporative water loss (Willis et al. 2011), and increased metabolic rate
(Anderson 2018; McGuire et al. 2017). Pd can also be spread through bat-to-bat or environment-
7
to-bat contact within and between hibernacula (Meyer et al. 2016); additionally, ectoparasitic
Spinturnix mites, are found exclusively on bat wings and have tested positive for Pd, suggesting
an additional mode of transmission as mites travel from bat-to-bat (Lučan et al. 2016).
Big brown bats have suffered relatively little mortality since the arrival of WNS in North
America (Langwig et al. 2012). In sites that have been previously exposed to Pd, big brown bat
populations remain stable, whereas little brown bat populations have declined dramatically
(Frank et al. 2014). Little brown bats suffer from more severe membrane lesions compared to big
brown bats (Moore et al. 2018). Big brown bats have a body mass of 11-25 grams (Kurta and
Baker 1990) and have a wide geographical range, spanning from northern Canada to Mexico
(Parker et al. 1997). In the northern part of their range, these bats typically hibernate in
extremely cold microclimates, not only in caves and mines, but also in tree holes, rock crevices,
and man-made structures. Big brown bats typically arouse more often than little brown myotis
during the hibernation period, with torpor bouts lasting 3.3 ± 13.3 days (Halsall et al. 2012) and
20.88 ± 6.22 days (Jonasson and Willis 2012; Ehlman et al. 2013), respectively. This could
explain why severe population declines have not occurred in big brown bats (Turner et al. 2011;
Frank et al. 2014), suggesting more euthermic periods could aid in fighting WNS. However, this
has never been tested in whole bats, only in wing tissue (Field et al. 2015). Big brown bats’
arousal frequencies do not seem to be influenced by Pd presence (Moore et al. 2018).
Besides a differing immune response, another factor that might provide protection from
WNS is the fatty acid composition on skin membranes. E. fuscus have higher amounts
(compared to M. lucifugus) of myristic, palmitoleic, and oleic acids (fatty acids present on
cutaneous membranes) that inhibit the growth of Pd in vitro (Frank et al. 2016). It has been
suggested that fatty acids on the skin are providing protection against membrane deterioration,
8
creating a barrier that doesn’t allow the pathogen to infiltrate the tissue (Ingala et al. 2017), and
requiring little or no immune response to the fungus. A third factor that might confer WNS
resistance is the skin microbial community. Microbes such as Pseudomonas have also been
shown to act as a probiotic on in vitro bat skin that may outcompete Pd (Hoyt et al. 2015). Due
to big brown bats being relatively resistant to WNS, they have received less attention, and little is
known about how their immune system might actually respond to Pd.
Hibernation
During hibernation, mammals go through periods of torpor, which consist of a controlled
decrease of body temperature (Tb) and associated physical inactivity (Carey et al. 2003). Bats are
heterotherms that can reduce Tb to save energy (Dunbar and Tomasi 2006). Their hibernation
seasons usually consist of long bouts of torpor (10-20 days) separated by brief arousals that last
2-3 hours (Spurrier and Dawe 1973; Lyman et al. 1982; Fig. 2). During an arousal, the animal’s
metabolism increases, heightening Tb (Day and Tomasi 2014) and causing bats to utilize stored
fat reserves. Thus, with more arousals, the fat reserves are depleted more quickly. Mitochondria
in brown adipose tissue utilize a modified electron transport chain in order to produce heat to
raise the Tb during an arousal. In addition, the ATP generated from glycolysis, oxidative
phosphorylation, and lipid catabolism are utilized to increase oxygen consumption and Tb. In a
population of healthy bats, individuals will typically go through seasonal and sexual variation in
metabolism and thermoregulation. Females will gain more weight prior to hibernation to ensure
some energy is available for reproduction the following spring (Richardson et al. 2018). To
conserve energy, bats at the end of hibernation appear to use barometric pressure within the
9
hibernacula to predict the weather and associated changes in abundance of insects outside of the
roost without having to investigate first-hand (Paige 1995).
Similar to the decreased rate of other physiological processes during hibernation, the
immune system is often suppressed. The production of antibodies (McKenna and Musacchia
1968) and the lipopolysaccharide (LPS) response are generally limited in most hibernating
animals (Maniero 2000; Prendergast et al. 2002). Animals infected with psychrophilic bacteria
during hibernation could have an increased risk of severe infection due to the lack of an immune
response (Luis and Hudson 2006). Arousals may be an opportunity to fight off pathogens due to
the suppression of the immune system while in torpor. Therefore, both immune function and the
thermogenesis of arousals may contribute to the depletion of energy reserves (Canale and Henry
2011).
Immune Function
In response to a pathogen invasion, the immune system will initiate immune defenses,
beginning with cell signaling and resulting in phagocytosis and destruction of the pathogen
(Shoman and Levitz 2005; Blanco and Garcia 2008). The initial response against a pathogen is
formed by the “innate” immune system, which is always present and responsive. The innate
immune system is responsible for the detection and defense against “non-self” pathogens by
recognition of the proteins and surface molecules of foreign biota. Once the immune system
detects a pathogen, it will begin its defense by secreting chemical messengers to attract
leukocytes (white blood cells), such as macrophages and neutrophils, to the site of infection.
These leukocytes are crucial to the production of cytokines, which are more proteins released for
cell-to-cell communication during immune responses. Pro-inflammatory cytokines will recruit
10
other nearby leukocytes, which intensifies the immune response and upregulates specific genes,
such as NLRP10 or CD200 (defined below).
At this time, the “adaptive” immune system will usually start producing antibodies
against the pathogen. These antibodies can remain present for several years in the body and can
continue to fight off the pathogen during subsequent exposures. In little brown bats, anti-Pd
antibodies have been observed, which suggests that antibody-mediated responses to Pd may not
provide adequate protection against WNS (Johnson et al. 2015).
In order to bolster our knowledge of how the immune system responds against Pd, it is
important to explore all viable options, and distinguish between competing hypotheses. Some
species suffer extensive mortality due to WNS, while others appear to be resistant. In spite of the
immune system being suppressed during torpor and hibernation, a partial (albeit insufficient)
immune response to Pd exposure may still occur in at least little brown bats (Moore et al. 2013).
This elevates torpid metabolism (Janicki 2010; McGuire et al. 2017), possibly causing the
observed increase in arousals (Reeder et al. 2012). WNS mortality seems to stem from
emaciation (Britzke et al. 2010), which may be due to the increased energetic cost during torpor
and the increased number of arousals.
Differences in WNS mortality could be explained by variations in the immune response.
One possible explanation for WNS mortality is that, upon exposure to Pd, the immune system of
susceptible bat species initiates an inflammatory response, increasing energy expenditures during
hibernation, leading to a depletion of previously stored fat reserves. However, the immune
response is not sufficient to rid the bat of the fungus and thus the immune response is indirectly
detrimental to the survival of the bat. In a susceptible species, this suggests that an anti-
inflammatory treatment, such as meloxicam (mel), would suppress the immune response,
11
allowing the bats to preserve fat reserves instead of arousing to fight off a pathogen. If a WNS-
resistant species, such as big brown bats, are surviving the WNS epidemic because they do not
try to mount an immune response, it is expected that an anti-inflammatory treatment will have no
effect on them. Susceptible bats have been shown to differentially express immune-function
genes, in response to Pd, which resistant species do not (Anderson 2018). That study was
conducted via cell culture analysis through transcriptomics and was used to identify the specific
genes I have selected. Investigating the immune function of resistant bats will aid in
understanding the distinction between resistant and susceptible bat immune responses.
Research Questions
I focused on the following metabolic and immune regulatory genes to understand how the
immune system in big brown bats responds to Pd exposure during hibernation. These genes are:
• NOD-like receptor family pyrin-10 (NLRP10) – This gene plays a key role in the
innate immune system. In addition, it has been suggested that this gene is also a
negative regulator of inflammation and cellular apoptosis. It has also been implicated
in the immune response to fungal infection in mice.
• Intercellular adhesion molecule 5 (ICAM5) – This adhesion gene is crucial to the
immune-nervous system interactions during an infection. It is known to bind to
leukocytes during inflammation and immune responses.
• Cluster of differentiation 200 (CD200) – This gene plays a role in
immunosuppression and anti-tumor activity. It is distributed across the cell surface as
a glycoprotein, which can interact with receptors and mediate the immune response.
• Tumor necrosis factor receptor superfamily member 21 (TNFRSF21) – This gene
plays a role in T-helper cell activation, which is directly related to immune response.
In summary, all of these genes play an essential role for both the innate and adaptive
immune system (National Center for Biotechnology Information Database). Differential
expression of these genes will indicate whether the bats are activating their immune system. I
12
hypothesized that because big brown bats are relatively resistant to WNS, exposure to Pd would
not change the expression of these genes. Consistent with the belief that resistance is due to a
lack of an immune response, I further hypothesized that inoculated bats of a WNS-resistant
species treated with meloxicam would not express differences in gene regulation compared to the
Pd-inoculated group. Gene expression was measured via RT-qPCR from wing and blood tissue
taken during initiation and termination of this experiment.
In addition to gene expression, measurements of metabolic rate and Tb were made to
evaluate differences in arousals and torpor duration among treatment groups. Due to the WNS-
resistant nature of this species, I hypothesized that bats exposed to Pd would not display any
differences in torpor/arousal patterns. Furthermore, I hypothesized that the Pd-inoculated bats
treated with the anti-inflammatory drug would also not display any differences from inoculated
bats without the anti-inflammatory agent. To test these hypotheses, torpor duration, arousal
cycles, and O2 consumption were measured in Pd-exposed big brown bats with and without the
meloxicam, the anti-inflammatory agent, and compared to control bats.
13
METHODS
In January 2018, 30 male hibernating big brown bats were collected by hand from a Pd-
positive mine hibernaculum in Unity Village, Missouri. Bats were transported in sterilized cloth
bags to Missouri State University where they were weighed and assigned to treatment groups.
Capture of these bats was permitted by the Missouri Department of Conservation (permit #17622
to Thomas Tomasi). All animal welfare and care techniques were approved through the Missouri
State University Institutional Animal Care and Use Committee (IACUC) under protocol 18.017.
All bats were tested for Pd presence on their muzzle, ears, and wing membrane using a
sterile swab. All swabs were stored at -80C until PCR according to the DreamTaq polymerase
protocol by ThermoFisher Scientific (cat. no. K1072; Lot: LT-02241) could be completed.
Following PCR with the use of Pd primers (Table 1), swab samples were then evaluated via
agarose gel using ethidium bromide to verify the presence of the Pd sequence. Results of this
PCR demonstrated that all bats tested negative for Pd at the beginning of the study.
The bats were randomly assigned into three treatment groups (n=10 per treatment) and
placed in environmental chambers maintained at 8C, 85% relative humidity, and 0L:24D photo
period until April 2018, the end of their natural hibernation season. Water was added to a glass
dish at the bottom of each chamber when needed. In order to observe the bats without
disturbance, IR cameras were positioned inside each environmental chamber. Cameras were
checked twice daily to ensure any apparently dead or distressed bats were removed in a timely
manner.
Pd spores were placed along the lateral aspect of the body, on the wing margins of bats in
the two treatment groups. The first treatment group was inoculated with 1x10⁵ CFUs (colony
14
forming units) of Pd, plus 2.5 µg meloxicam in 25 µL dimethyl sulfoxide (DMSO) on the
posterior side of the ears. This is approximately 0.15 µg/g bat, a veterinarian-recommended
effective anti-inflammatory concentration for topical use (M. Stafford, personal communication).
The second treatment group received the same inoculation of Pd, plus 25 µL DMSO (vehicle
control) along the posterior aspect of the ears. The final treatment group served as a control (i.e.
no Pd inoculation, DMSO, or meloxicam). Subsequent dosing of 25µL DMSO (vehicle) or
meloxicam occurred approximately every two weeks, on the posterior aspect of the ears, until
hibernation ended. Because meloxicam has been shown to inhibit biofilm formation of other
fungal species (Alem and Douglas 2004), a preliminary test was conducted to determine which
meloxicam dose would directly inhibit Pd growth (Anderson 2018). In that study, 0.10 µg/mL
showed no fungal inhibition (in the in vitro growth medium). It should be noted however, that
the effect of torpor on the dosage/metabolism of meloxicam has not been previously studied.
Temperature-sensitive dataloggers (AlphaMach iButtonsTM; DS2422), modified to reduce
mass (Lovegrove 2009), were set to record temperature (to 0.5ºC) every 20 minutes and were
attached to the back of each bat using surgical cement to identify torpor/arousal cycles
throughout winter.
During the middle (8 January 2018) and end (15 March 2018) of the hibernation season,
metabolic rates while torpid were calculated as a rate of O2 consumption. These measurements
were conducted in 50 mL open-flow metabolic chambers. Chambers were lined with plastic
mesh to provide a surface for attachment for the bat and were placed in a small refrigerator that
was maintained at 8 2C. Continuous air flow through each metabolic chamber was achieved
by an air pump when the bat’s metabolism was not being measured. During metabolic rate
measurements, air was pulled through these chambers via a flow controller maintained at
15
25mL/min (Sable Systems). Soda lime and silica gel removed carbon dioxide and water,
respectively, prior to passing through the oxygen analyzer (Sable Systems, FC-10a) with room
air set as 20.95% oxygen. All bats were acclimated to the metabolic chamber for at least 12
hours prior to measurements to ensure torpor was established. ExpeDataTM was used to sample
the excurrent percent oxygen every second until at least three full apneic/breathing cycles were
recorded (Fig. 3).
Dataloggers were removed from each bat post-euthanasia or prior to release, and
temperature data were analyzed for arousal bouts. Arousals were defined as any three
consecutive (equaling one hour) temperature recordings above 15C. To obtain metabolic rates
for each bat (displayed as mL O2/hr), the sum volume (mL) oxygen consumed per breathing
cycle was divided by the total time (hours) of each cycle. O2 consumption data from mid- and
late- hibernation were averaged to obtain one value per bat. Arousal durations were measured as
the total amount of time (minutes) above 15C. Arousals that correspond to the disturbance of
opening the chamber for bat removal were not included.
Ultraviolet (UV) light photographs were taken to identify the presence of any Pd growth
on each wing membrane at the beginning (day 0) and end (day 77) of the study. Photo analyses
were completed using ImageJ software (Rasband 1997-2018). The percentage of area infected
was computed by outlining the area (pixels) of the whole bat, then determining the percent of
area infected by outlining the area (pixels) of the fluoresced/infected regions of the bat wing
membrane.
Wing tissue biopsies (3-mm diameter) and blood samples (~20-50µL via femoral vein)
were also taken from the bats upon capture to establish the baseline immune function, and upon
completion, to measure differentially expressed genes. All samples were stored at -80C.
16
Surviving bats in the control treatment were released at the site of capture in early April after one
week of feeding and monitoring. All other bats were then euthanized to avoid releasing Pd-
exposed bats into the wild. Survival rates were calculated as the number of days alive from point
of capture to point of experiment termination (77 days).
Blood and tissue samples were analyzed for gene expression of NLRP10, CD200,
ICAM5, and TNFRSF21 via RT-qPCR according to the manufacturer’s protocol (DyNAmo HS
SYBR Green: ThermoFisher Scientific; cat. no. F410L; lot: 00672146) following RNA isolation
using TRIzol (Invitrogen; cat. no. AM97381). Primers for the genes of interest were created
based on transcriptomics data (Anderson 2018) via CLC Genomics Workbench. The annealing
temperatures were confirmed via PCR and gel electrophoresis (Table 1) and used under the
following thermal cycler conditions: three minutes of primary denaturation (95C), 40 cycles of
denaturation (30 seconds at 95C), annealing (30 seconds at the specified temperature per Table
1), and extension (1 minute at 72C), with a final extension step (10 minutes at 72C).
Gene expression was determined by the CT method based on the number of PCR
cycles compared to a standard curve. I did a linear regression of the cycle threshold values from
the standards. This line was then used to interpolate the number of copies of RNA for each
individual bat sample. The four genes of interest for each sample were also normalized against
the expression of RPS8 (ribosomal protein subunit 8) after determining the RPS8 expression by
the CT method based on the number of PCR cycles compared to its own standard curve. This
was completed to eliminate any differences in RNA concentration due to variability of RNA
extraction efficiency or sample handling. The normalized data were then log10 transformed to
minimize the data distribution. RNA concentrations below the level of detection were assigned a
relative value of 0.01 (log10 = -2.00).
17
Treatment effects on rates of oxygen consumption, total arousal time (hr), number of
arousals, and total mass loss (g) were tested via one-way analyses of variance (ANOVAs).
Because the control bats were not exposed to the fungus, the effect of meloxicam was assessed
by comparing the Pd-inoculated bats to the Pd + mel bats, via ANOVA, and infection severity
was assessed via UV photos. Survival rates were analyzed via a Log-rank test. Quantitative gene
expression (relative number of RNA copies) between treatment groups were analyzed via one-
way ANOVA and Tukey’s post-hoc test when the ANOVA was significant. Comparisons of
tissue type (blood vs. wing tissue) and hibernation duration (January vs. March) were also made
with two-sample T-tests. Significance was established at = 0.05. Statistical analyses were
performed using Minitab 18. Data are presented as mean SE.
18
RESULTS
Data from temperature-sensitive dataloggers (Fig. 4; Table 2) were analyzed for 28 bats
throughout the hibernation study and were compared among treatment groups; two bats did not
wear dataloggers due to equipment limitations. We should note that some dataloggers failed to
communicate with the software/hardware post-experiment, mostly in the Pd + mel treatment,
which reduced the sample size for this treatment to 5 bats.
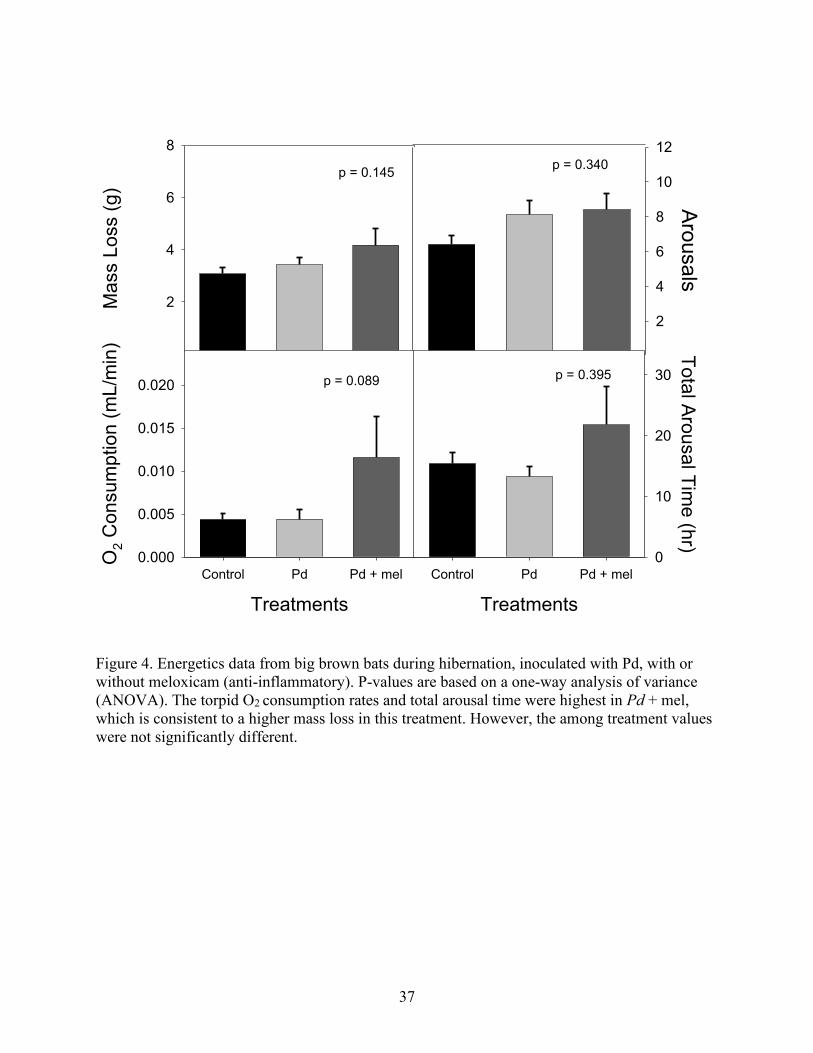
The number of arousals did not differ among the treatment groups (p = 0.340).
Consistent with the number of total arousals, the average total arousal duration did not differ
among treatments (p = 0.395). O2 consumption (mL/min) also did not differ significantly among
treatment groups (p = 0.089), though Pd + mel bats did trend toward a higher average O2
consumption than Pd bats or control bats (Fig. 4; Table 2). On average, mass loss did not differ
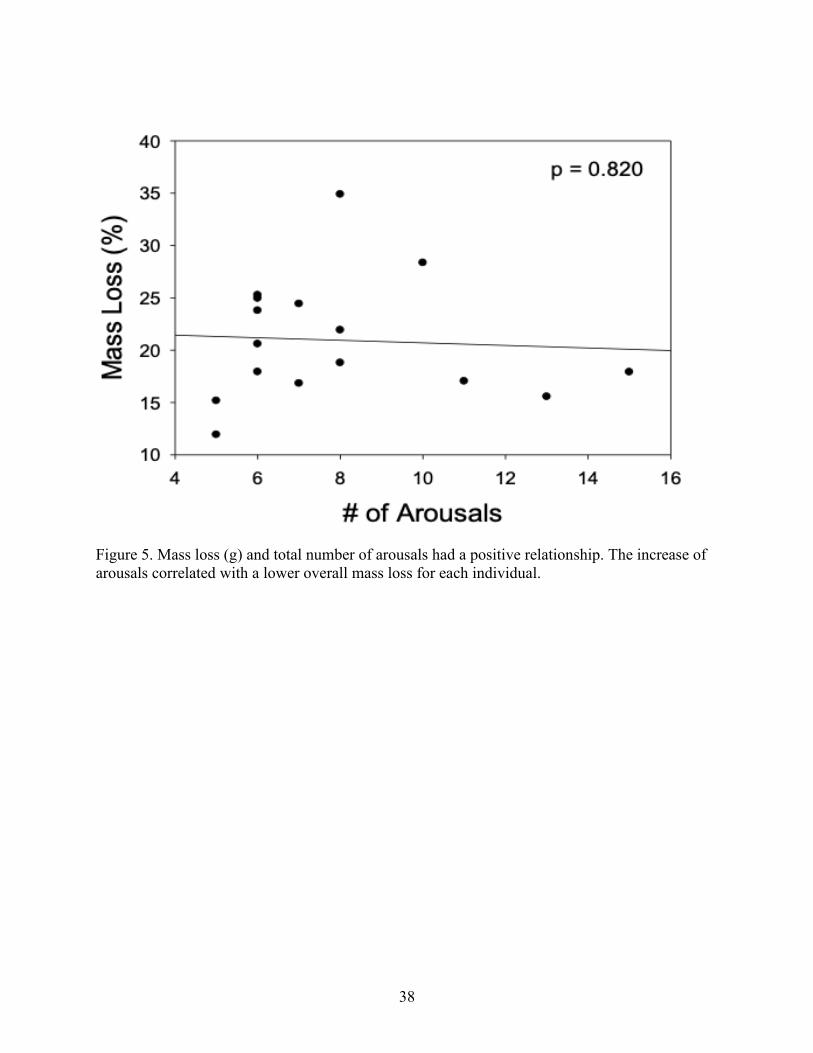
between treatments (p = 0.145; Fig. 4; Table 2). Overall, across all groups, mass loss (%) did not
change with number of arousals (p = 0.820; Fig. 5). There was no relationship between torpid O2
consumption and number of arousals (p = 0.104).
UV analyses of infected wing area revealed no differences between treatments (Table 2).
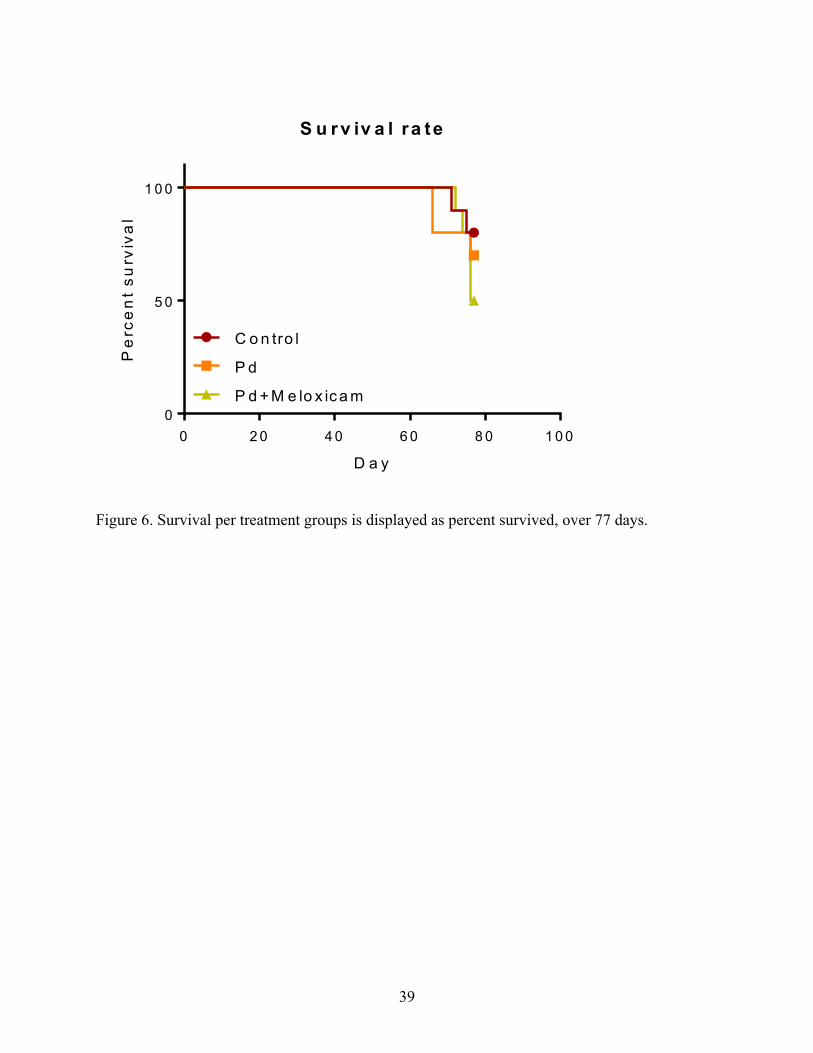
The survival rates, through the 77 days of the study, for the control, Pd, and Pd + mel bats were
80%, 70%, and 50%, respectively (Fig. 6; Table 2).
Based upon gene expression data, the random assignment of bats was successful; 7 of 8
of the measures in January (blood and wing samples), showed no difference between treatment
groups. However, CD200 January wing samples did show a difference between treatment groups
prior to treatment initiation (Table 3; Figs. 7-10). Bats in the control treatment showed a decrease
in gene expression from January to March in NLRP10 (p < 0.0005) and CD200 (p < 0.0005), but
19
not in ICAM5 (p = 0.085) or TNFRSF21 (p = 0.585). When all genes and treatments are
combined, expression is lower in March than in January (p < 0.0005).
To address the question of any Pd effect on gene expression, I compared January (pre-
Pd) to March (post-Pd) wing samples, which showed no difference in the expression of any
genes of interest (Table 4). Similarly, in March, gene expression was not different in Pd bats
compared to controls (Table 4). To address the question of whether mel alters gene expression of
bats exposed to Pd, I compared January (pre-treatment) to March (post-treatment) bat samples,
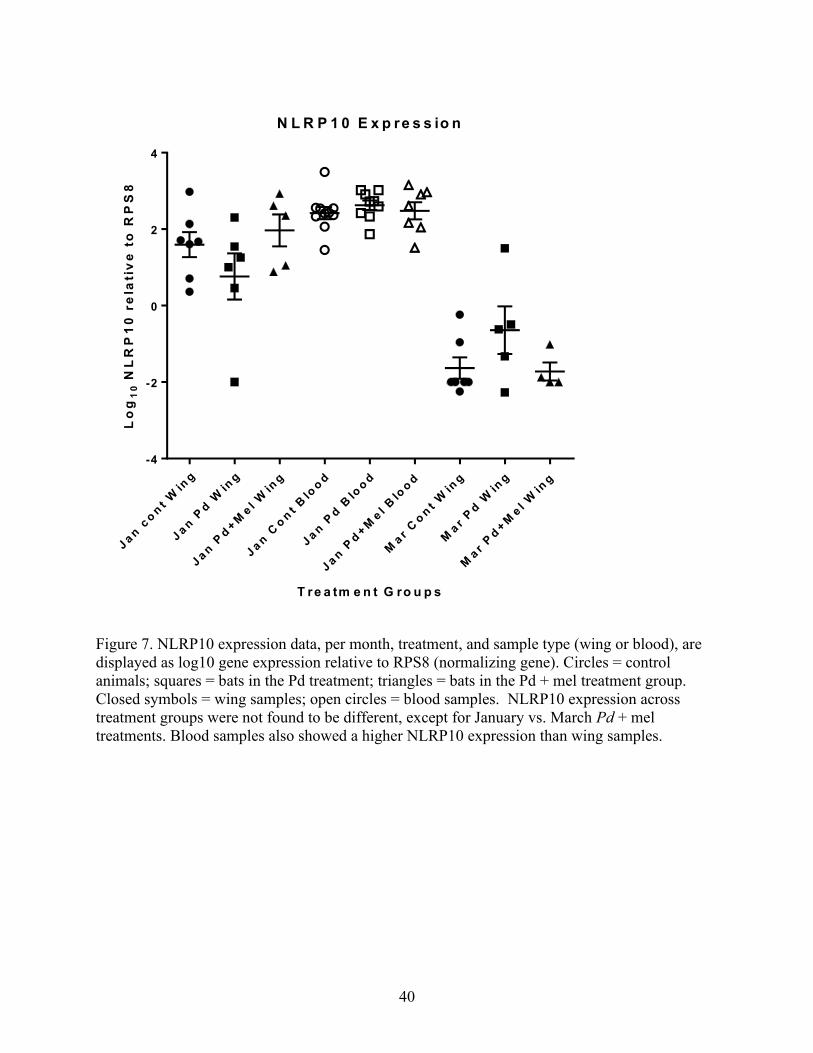
which only revealed a difference in NLRP10 expression (Table 4). Gene expression in Pd + mel
bats did not differ from expression in Pd bats (Table 4). Expression across all treatment groups
in March did not differ throughout any genes of interest (Table 3). I also found that gene
expression was higher in blood than in wing samples (Table 3; p 0.001 for all four genes).
20
DISCUSSION
The results from the energetics section of this study support the hypotheses that neither
Pd inoculation, nor an anti-inflammatory agent, would cause differences in WNS symptoms,
such as arousal duration or O2 consumption, in big brown bats. Meloxicam bats trended toward
more mass loss, more time aroused (number of arousals, and longer arousal duration), and higher
metabolic rates in torpor, which together suggest that meloxicam may harm the bats. However,
individually, these parameters did not differ between treatments and there is no direct evidence
that meloxicam effected mortality.
Bats inoculated with Pd (with or without meloxicam) demonstrated severe damage to the
wing membrane, which is typically observed in susceptible species like little brown bats
(Meteyer et al. 2009). This level of severity has not been observed in Pd-exposed big brown bats.
While the infection severity was higher in meloxicam bats, the survival rates among treatment
groups did not differ significantly.
The control bats were not infected with Pd, but their expression levels for all genes of
interest still decreased with time, indicating that expression was inhibited by hibernation
progression, not the Pd infection. This could occur if, for example, the suppression of gene
expression was based on levels of body fat. An additional variable could be the physiological
state of the bats when samples were collected. Bats were aroused for several hours prior to first
sample collection (January), during transport from their hibernation site to the laboratory,
whereas bats were fairly torpid during second sample collection (March). This is consistent with
the findings that immunosuppression takes place during torpor bouts (McKenna and Musacchia
1968; Luis and Hudson 2006). Another possible explanation is that RPS8 (normalizing gene)
21
increased as hibernation progressed, but this seems unlikely due to the physiological depression
that occurs during torpor. In addition, gene expression of RPS8 is consistent across multiple
tissue types in euthermic birds (Carvalho et al. 2019), but this has not been tested during torpor.
January samples were taken prior to exposure to Pd, which may indicate that these bats express
these genes at low levels consistently.
Expression of CD200 in January wing samples was different across treatment groups,
which posed a peculiar question of why there would be any difference prior to Pd exposure, but
no significant difference post-exposure in March. The cause of this significant difference is
unknown and could be a Type II statistical error.
Gene expression was higher in January blood samples than in January and March wing
samples. This is likely due to the density of leukocytes (cells with nuclei), and thus active
immune system genes, in the blood compared to other types of tissues, which contain a larger
variety of cell types. A dilution effect takes place when these immune system cells, such as
macrophages, are mixed with other cells, such as normal epithelial cells, in skin tissue that do not
participate in immune system function.
Other than CD200 in January wing samples, all other gene expression findings support
my hypothesis. Due to the WNS-resistance of big brown bats, I hypothesized there would not be
significant differences in gene expression across treatment groups. Instead of upregulating
immune genes, their immune systems would remain downregulated, as typically observed during
hibernation. The combination of infection severity, observed by UV photos, and the scarcity of
gene expression differences among treatment groups supports my hypothesis that big brown bats
do not seem to mount an immune response during hibernation when exposed to Pd.
22
Limitations to this study include a limited sample size due to collecting permit limitations
based on conservation measures. In addition, the refrigerator that housed the metabolic chambers
displayed a +2C shift from the desired temperature, and this range of 4C may have affected the
measured metabolic rates of these bats. Statistical analyses for gene expression may have yielded
some differences if March blood samples were also included. Without March blood samples,
meloxicam’s influence on the ability to mount an immune response was based solely on wing
tissue gene expression data. Blood samples were taken in March, but extremely low RNA
concentration levels after extraction prevented these samples from being utilized. As
conservation constraints should remain present, it is apparent that blood provides an accurate
representation of gene expression; however, wing tissue sampling should be considered as it
seems less invasive.
Since the debut of WNS in North America in 2006, an estimated 5.7–6.7 million bats had
died by 2012 (USFWS 2012), with a likely additional 6 million bats dying in the next 6-year
period (2012–18). As WNS continues to spread west, it is important to understand the
physiological and genetic differences between resistant and susceptible species. If there is an
understanding of how resistant species are maintaining their vigilance against Pd, there is
potential for both increasing the resistance of susceptible species and identifying the
susceptibility of western bat populations before the fungus presents itself in those areas. While it
is imperative to implement additional conservation measures, such as caving regulations and
educational awareness, it is also crucial that we continue investigating the differences between
susceptible and resistant bat species as WNS is advancing westward throughout the North
American continent.
23
REFERENCES
ALEM, M. A. S. AND L. J. DOUGLAS. 2004. Effects of aspirin and other nonsteroidal anti-
inflammatory drugs on biofilms and planktonic cells of Candida albicans. Antimicrobial
Agents and Chemotherapy 48:41-47.
ANDERSON, B. A. 2018. The immune function and metabolism of hibernating North American
bats with white-nose syndrome. M.S. thesis, Missouri State University. Springfield,
Missouri, USA.
ARMITAGE, S. A. O., J. F. BROCH, H. F. MARIN, D. R. NASH, AND J. J. BOOMSMA. 2011.
Immune defense in leaf-cutting ants: a cross-fostering approach. Evolution 65:1791-1799.
ARNETT, E. B., ET AL. 2008. Patterns of bat fatalities at wind energy facilities in North America.
The Journal of Wildlife Management 72:61-78.
ARNETT, E. B. AND E. F. BAERWALD. 2013. Impacts of wind energy development on bats:
implications for conservation. Pp 435-456 in Bat evolution, ecology, and conservation (R. A.
Adams and S. C. Pedersen, eds.) Springer-Verlag. New York, New York.
BAERWALD, E. F., J. EDWORTHY, M. HOLDER, AND R. M. R. BARCLAY. 2009. A large-scale
mitigation experiment to reduce bat fatalities at wind energy facilities. The Journal of
Wildlife Management 73:1077-1081.
BALLMANN, A. E., M. R. TORKELSON, E. A. BOHUSKI, R. E. RUSSELL, AND D. S. BLEHERT.
2017. Dispersal hazards of Pseudogymnoascus destructans by bats and human activity at
hibernacula in summer. Journal of Wildlife Diseases 53:725-735.
BARCLAY, R. M. R., E. F. BAERWALD, AND J. C. GRUVER. 2007. Variation in bat and bird
fatalities at wind energy facilities: assessing the effects of rotor size and tower height.
Canadian Journal of Zoology 85:381-387.
BAT CONSERVATION INTERNATIONAL. 2018. White-nose syndrome species and locations.
http://www.batcon.org/our-work/regions/usa-canada/white-nose-syndrome/species-and-
locations
BIRKETT, K. M., K. S. WEIDMAN, AND Y. WOO. 2014. Vespertilionidae (On-line). Animal
Diversity Web. https://animaldiversity.org/accounts/Vespertilionidae/. Accessed 1 January 2019.
BLANCO, J. L., AND M. E. GARCIA. 2008. Immune response to fungal infections. Veterinary
Immunology and Immunopathology 125:47-70.
BLEHERT, D. S., ET AL. 2009. Bat white-nose syndrome: an emerging fungal pathogen? Science
323:227.
24
BOYLES, J. G. AND C. K. R. WILLIS. 2010. Could localized warm areas inside cold caves
reduce mortality of hibernating bats affected by white-nose syndrome? Frontiers in Ecology
and the Environment 8:92-98.
BOYLES, J. G., P. M. CRYAN, G. F. MCCRACKEN, AND T. H. KUNZ. 2011. Economic
importance of bats in agriculture. Science 332:41-42.
BRITZKE, E. R., P. SEWELL, M. G. HOHMANN, R. SMITH, AND S. R. DARLING. 2010. Use of
temperature-sensitive transmitters to monitor the temperature profiles of hibernating bats
affected with white-nose syndrome. Northeast Naturalist 17:239-246.
BROOKS, R. T. AND W. M. FORD. 2006. Introduction to the special section: bat habitat use in
eastern North American temperate forests: site, stand, and landscape effects. The Journal of
Wildlife Management 70:1171-1173.
CANALE, C. I. AND P. Y. HENRY. 2011. Energetic costs of the immune response and torpor use
in a primate. Functional Ecology 25:557-565.
CAREY, H. V., M. T. ANDREWS, AND S. L. MARTIN. 2003. Mammalian hibernation: cellular
and molecular responses to depressed metabolism and low temperature. Physiological
Reviews 83:1153-1181.
CARVALHO, A. V., N. COUROSSE, S. CROCHET, AND V. COUSTHAM. 2019. Identification of
reference genes for quantitative gene expression studies in three tissues of Japanese Quail.
Genes 10:1-12.
COURTIN, F., W. B. STONE, G. RISATTI, K. GILBERT, AND H. J. VAN KRUININGEN. 2010.
Pathologic findings and liver elements in hibernating bats with white-nose syndrome.
Veterinary Pathology 47:214-219.
DAVY, C. M., ET AL. 2017. The other white-nose syndrome transcriptome: Tolerant and
susceptible hosts respond differently to the pathogen Pseudogymnoascus destructans.
Ecology and Evolution 7:7161-7170.
DAY, K. M., AND T. E. TOMASI. 2014. Winter energetics of female Indiana bats (Myotis
sodalis). Physiological and Biochemical Zoology 87:56-64.
DUNBAR, M. B. AND T. E. TOMASI. 2006. Arousal patterns, metabolic rate, and an energy
budget of eastern red bats (Lasiurus borealis) in winter. Journal of Mammalogy 87:1096-
1103.
EHLMAN, S. M., J. J. COX, AND P. H. CROWLEY. 2013. Evaporative water loss, spatial
distributions, and survival in white-nose syndrome-affected little brown myotis: a model.
Journal of Mammalogy 94:572-583.
FIELD, K. A., ET AL. 2015. The white-nose syndrome transcriptome: activation of anti-fungal hose
responses in wing tissue of hibernating little brown myotis. PLoS pathogens 11:e1005168.
25
FISHER, M. C., ET AL. 2012. Emerging fungal threats to animal, plant and ecosystem health.
Nature 484:186-194.
FLORES, J. M., I. GUTIEREZ, AND R. ESPEJO. 2005. The role of pollen in chalkbrood disease in
Apis mellifera: transmission and predisposing conditions. Mycologia 97:1171-1176.
FRANK, C. L., A. MICHALSKI, A. A. MCDONOUGH, M. RAHIMIAN, R. J. RUDD, AND C.
HERZOG. 2014. The resistance of a North American bat species (Eptesicus fuscus) to white-
nose syndrome (WNS). PLoS One 9:e0113958.
FRANK, C. L., M. R. INGALA, R. E. RAVENELLE, K. DOUGHERTY-HOWARD, S. O. WICKS, C.
HERZOG, AND R. J. RUDD. 2016. The effects of cutaneous fatty acids on the growth of
Pseudogymnoascus destructants, the etiological agent of white-nose syndrome (WNS). PLoS
One 11:0153535.
HALSALL, A. L., J. G. BOYLES, AND J. O. WHITAKER, JR. 2012. Body Temperature patterns of
big brown bats during winter in a building hibernaculum. Journal of Mammalogy 93:497-503.
HILL, J. J. 1984. Bats: a natural history. Austin: A University Press.
HOYT, J. R., T. L. CHENG, K. E. LANGWIG, M. M. HEE, W. F. FRICK, AND A. M. KILPATRICK.
2015. Bacteria isolated from bats inhibit the growth the Pseudogymnoascus destructans, the
causative agent of white-nose syndrome. PLoS One 10:0121329.
HOYT, J. R., ET AL. 2016. Widespread bat white-nose syndrome fungus, northeast China.
Emerging Infectious Diseases 22:140-142.
INGALA, M. R., R. E. RAVENELLE, J. J. MONRO, AND C. L. FRANK. 2017. The effects of
epidermal fatty profiles, 1-oleglycerol, and triacylglycerols, on the susceptibility of hibernating
bats to Psuedogymnoascus destructans. PLoS One 12:e0187195.
INVITROGEN. 2016. TRIzol reagent user guide. ThermoFisher Scientific.
https://assets.thermofisher.com/TFS-Assets/LSG/manuals/trizol_reagent.pdf
IUCN. 2019. The IUCN Red List of Threatened Species. Version 2018-2.
http://www.icunredlist.org. Accessed 1 January 2019.
JANICKI, A. F. 2010. Effects of white-nose syndrome on winter energetics of little brown myotis
(Myotis lucifugus). M.S. thesis, Missouri State University. Springfield, Missouri, USA.
JOHNSON, J. S., ET AL. 2015. Antibodies to Pseudogymnoascus destructans are not sufficient for
protection against white-nose syndrome. Ecology and Evolution 5:2203-2214.
JONASSON, K. A. AND C. K. R. WILLIS. 2012. Hibernation energetics of free-ranging little
brown bats. Journal of Experimental Biology 215:2141-2149.
JONES, K. E., O. R. P. BININDA-EMONDS, AND J. L. GITTLEMAN. 2005. Bats, clocks, and
rocks: diversification and patterns in Chiroptera. Evolution 59:2243-2255.
26
KONKEL, L. 2017. Fungal diseases are on the rise. Is environmental change to blame? Accessed
June 7, 2019. https://ensia.com/features/19036/
KOVACOVA, V., ET AL. 2018. White-nose syndrome detected in bats over an extensive area in
Russia. BMC Veterinary Research 14:1-9.
KUNZ, T. H., AND M. B. FENTON. 2003. Bat Ecology. University of Chicago Press, Chicago,
Illinois.
KUNZ, T. H., E. BRAUM DE TORREZ, D. BAUER, T. LOBOVA, AND T. H. FLEMING. 2011.
Ecosystem service provided by bats. Annals of the New York Academy of Sciences 1223:1-
38.
KURTA, A. AND R. H. BAKER. 1990. Eptesicus fuscus. Mammalian species 356:1-10.
LANGWIG, K. E., W. F. FRICK, J. T. BRIED, A. C. HICKS, T. H. KUNZ, AND A. M.
KILPATRICK. 2012. Sociality, density-dependence, and microclimates determine the
persistence of populations suffering from the novel fungal disease, white-nose syndrome.
Ecology Letters 15:1050-1057.
LORCH, J. M., ET AL. 2011. Experimental infection of bats with Geomyces destructans causes
white-nose syndrome. Nature 480:376-378.
LORCH, J. M., ET AL. 2016. First detection of bat white-nose syndrome in western North
America. mSphere 1:e00148-16.
LOVEGROVE, B. G. 2009. Modification and miniaturization of Thermochron iButtons for
surgical implantation into small animals. Journal of Comparative Physiology B: Biochemical,
Systems, and Environmental Physiology 179:451-458.
LUCAN, R. K., ET AL. 2016. Ectoparasites may serve as vectors for the white-nose syndrome
fungus. Parasites & Vectors 9:16.
LUIS, A. D. AND P. J. HUDSON. 2006. Hibernation patterns in mammals: a role for bacterial
growth? Functional Ecology 20: 471-477.
LYMAN, C. P., J. S. WILLIS, A. MALAN, AND L. C. H. WANG. 1982. Hibernation and torpor in
mammals and birds. Academic Press, New York. Chapter 2: 12-31.
MANIERO, G. D. 2000. The influence of temperature and season on mitogen-induced
proliferation of ground squirrel lymphocytes. Life in the Cold, eds G. Heldmaier and M.
Klingenspor 493-503.
MCCALLUM, H. 2005. Inconclusiveness of chytridiomycosis as the agent in widespread frog
declines. Conservation Biology 19:1421-1430.
27
MCGUIRE, L. P., H. W. MAYBERRY, AND C. K. R. WILLIS. 2017. White-nose syndrome
increases torpid metabolic rate and evaporative water loss in hibernating bats. Regulatory,
Integrative and Comparative Physiology 313:R680-R686.
MCKENNA, J. M. AND X. J. MUSACCHIA. 1968. Antibody formation in hibernating ground
squirrels (Citellus tridecemlineatus). Proceedings of the Society for Experimental Biology
and Medicine 129: 720-724.
MEDELLIN, R. A. 2003. Diversity and conservation of bats in Mexico: research priorities,
strategies, and actions. Wildlife Society Bulletin 31:87-97.
MERING, E. D. AND C. L. CHAMBERS. 2014. Thinking outside of the box: review of artificial
roosts for bats. Wildlife Society Bulletin 38:741-751.
METEYER, C. U., ET AL. 2009. Histopathologic criteria to confirm white-nose syndrome in bats.
Journal of Veterinary Diagnostic Investigation 21:411-414.
MEYER, A. D., D. F. STEVENS, AND J. C. BLACKWOOD. 2016. Predicting bat colony survival
under control targeting multiple transmission routes of white-nose syndrome. Journal of
Theoretical Biology 409:60-69.
MOORE, M. S., ET AL. 2013. Hibernating little brown myotis (Myotis lucifugus) show variable
immunological responses to white-nose syndrome. PLoS One 8:e59876.
MOORE, M. S., ET AL. 2018. Energy conserving thermoregulatory patterns and lower disease
severity in a bat resistant to the impacts of white-nose syndrome. Journal of Comparative
Physiology B 188:163-176.
NATIONAL CENTER FOR BIOTECHNOLOGY INFORMATION DATABASE, U.S. National Library
of Medicine. Accessed 1 January 2019. https://www.ncbi.nlm.nih.gov.
OUELLET, M., I. MIKAELIAN, B. D. PAULI, J. RODRIGUEZ, AND D. M. GREEN. 2005.
Historical evidence of widespread chytrid infection in North America amphibian populations.
Conservation Biology 19:1431-1440.
PARKER, D. I., B. E. LAWHEAD, AND J. A. COOK. 1997. Distributional limits of bats in Alaska.
Arctic 50:256-265.
PAIGE, K. N. 1995. Bats and barometric pressure: conserving limited energy and tracking insects
from the roost. Functional Ecology 9:463-467.
PRENDERGRAST, B. J., D. A. FREEMAN, I. ZUCKER, AND R. J. NELSON. 2002. Periodic arousal
from hibernation is necessary for initiation of immune response in ground squirrels.
American Journal of Physiology, Regulatory Integrative and Comparative Physiology
282:1054-1062.
RABINOWITZ, A. AND M. D. TUTTLE. 1980. Status of summer colonies of the endangered gray
bat in Kentucky. The Journal of Wildlife Management 44:955-960.
28
RASBAND, W.S. 1997-2018. ImageJ. U. S. National Institutes of Health. Bethesda, MD, USA.
https://imagej.nih.gov/ij/.
REEDER, D. A. M., ET AL. 2012. Frequent arousal from hibernation linked to severity of
infection and mortality in bats with white-nose syndrome. PLoS One 7:e38920.
RICHARDSON, C. S., T. HEEREN, AND T. H. KUNZ. 2018. Seasonal and sexual variation in
metabolism, thermoregulation, and hormones in the big brown bat (Eptesicus fuscus).
Physiological and Biochemical Zoology 91:705-715.
RICHTER, J., S. HELBING, S. ERLER, AND H. M. G. LATTORFF. 2012. Social context-dependent
immune gene expression in bumblebees (Bombus terrestris). Behavioral Ecology and
Sociobiology 66:791-796.
SHOMAN, S., AND S. M. LEVITZ. 2005. The immune response to fungal infections. British
Journal of Haematology 129:569-582.
SPURRIER, W. A., AND A. R. DAWE. 1973. Several blood and circulatory changes in the
hibernation of the 13-lined ground squirrel, Citellus tridecemlineatus. Comparative
Biochemistry and Physiology Part A: Comparative Physiology 44:267-282.
TALBOT, N. J. 2003. On the trail of a cereal killer: exploring the biology of Magnaporthe grisea.
Annual Review of Microbiology 57:177-202.
TREJO-SALAZAR, R. E., L. E. EGUIARTE, D. SURO-PINERA, AND R. A. MEDELLIN. 2016. Save
our bats, save our tequila: industry and science join forces to help bats and Agaves. Natural
Areas Journal 36:523-530.
TURNER, G. G., D. M. REEDER, AND J. T. H. COLEMAN. 2011. A five-year assessment of
mortality and geographic spread of white-nose syndrome in North American bats, with a look
at the future. Update of white-nose syndrome in bats. Bat Research News 52:13-27.
UNITED STATES FISH AND WILDLIFE SERVICE (USFWS). 2012. North American bat death toll
exceeds 5.5 million from white-nose syndrome: [Arlington, Virginia, Office of
Communications]
http://www.batcon.org/pdfs/USFWS_WNS_Mortality_2012_NR_FINAL.pdf
VERANT, M. L., J. G. BOYLES, W. WALDREP JR., G. WIBBELT, AND D. S. BLEHERT. 2012.
Temperature-dependent growth of Geomyces destructans, the fungus that causes bat white-
nose syndrome. PLos One 7:e46280.
VERANT, M. L., C. U. METEYER, J. R. SPEAKMAN, P. M. CRYAN, J. M. LORCH, AND D. S.
BLEHERT. 2014. White-nose syndrome initiates a cascade of physiologic disturbances in the
hibernating bat host. BMC Physiology 14:10.
VOUTE, A. M. 1980. First recorded transatlantic bat transport. Bat Research News 23:16-18.
29
WHITAKER JR. W. O. 1995. Food of the big brown bat Eptesicus fuscus and maternity colonies
in Indiana and Illinois. The American Midland Naturalist 134:346-360.
WIBBELT, G., ET AL. 2010. White-nose syndrome fungus (Geomyces destructans) in bats,
Europe. Emerging Infectious Diseases 16:1237-1243.
WILLIS, C. K. R., A. K. MENZIES, J. G. BOYLES, AND M. S. WOJCIECHOWSKI. 2011.
Evaporative water loss is a plausible explanation or mortality of bats from white-nose
syndrome. Integrative and Comparative Biology 51:364-373.
WILSON, D. E. 2019. Bat. Encyclopedia Britannica, Inc. Accessed February 16, 2019.
https://www.britannica.com/animal/bat-mammal.
WRIGHT, S. K. AND J. R. MORAN. 2011. Ocean-going vessels: a possible conduit for the
introduction of white-nose syndrome fungus (Geomyces destructans) into bats in Alaska.
Northwestern Naturalist 92:133-135.
ZIMMERLING, J. R. AND C. M. FRANCIS. 2016. Bat mortality due to wind turbines in Canada.
The Journal of Wildlife Management 80:1360-1369.
30
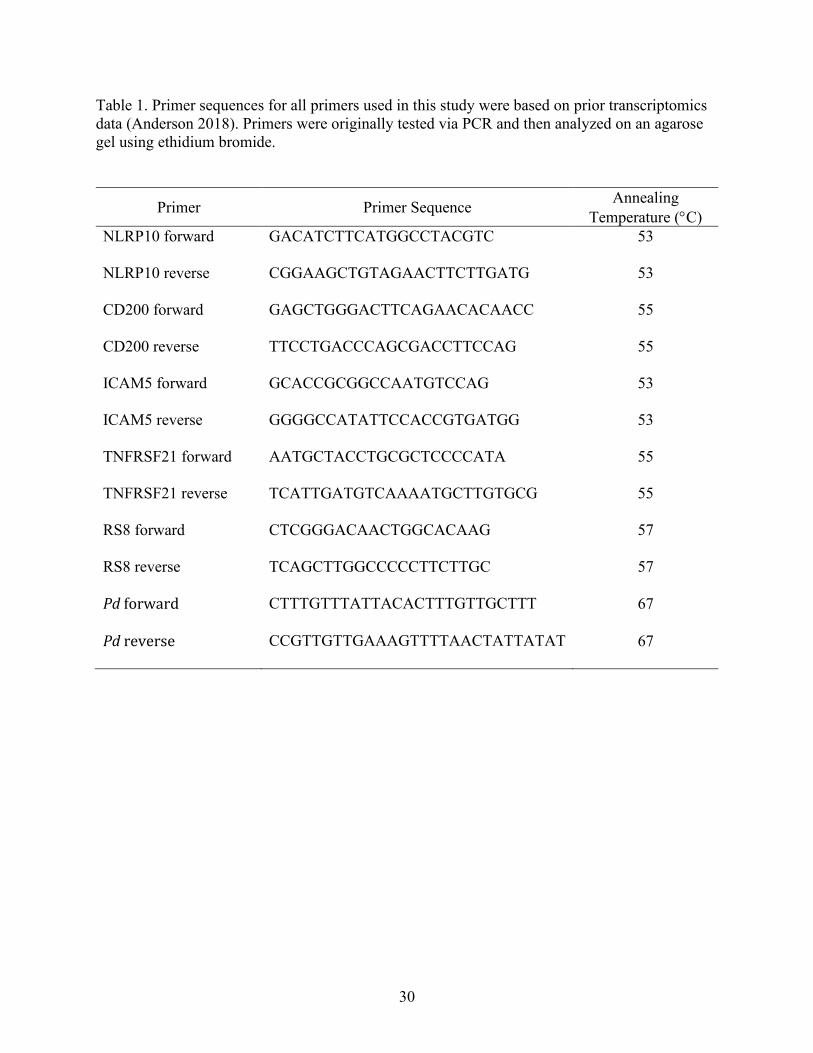
Table 1. Primer sequences for all primers used in this study were based on prior transcriptomics
data (Anderson 2018). Primers were originally tested via PCR and then analyzed on an agarose
gel using ethidium bromide.
Primer Primer Sequence Annealing
Temperature (C)
NLRP10 forward GACATCTTCATGGCCTACGTC 53
NLRP10 reverse CGGAAGCTGTAGAACTTCTTGATG 53
CD200 forward GAGCTGGGACTTCAGAACACAACC 55
CD200 reverse TTCCTGACCCAGCGACCTTCCAG 55
ICAM5 forward GCACCGCGGCCAATGTCCAG 53
ICAM5 reverse GGGGCCATATTCCACCGTGATGG 53
TNFRSF21 forward AATGCTACCTGCGCTCCCCATA 55
TNFRSF21 reverse TCATTGATGTCAAAATGCTTGTGCG 55
RS8 forward CTCGGGACAACTGGCACAAG 57
RS8 reverse TCAGCTTGGCCCCCTTCTTGC 57
Pd forward CTTTGTTTATTACACTTTGTTGCTTT 67
Pd reverse CCGTTGTTGAAAGTTTTAACTATTATAT 67
31
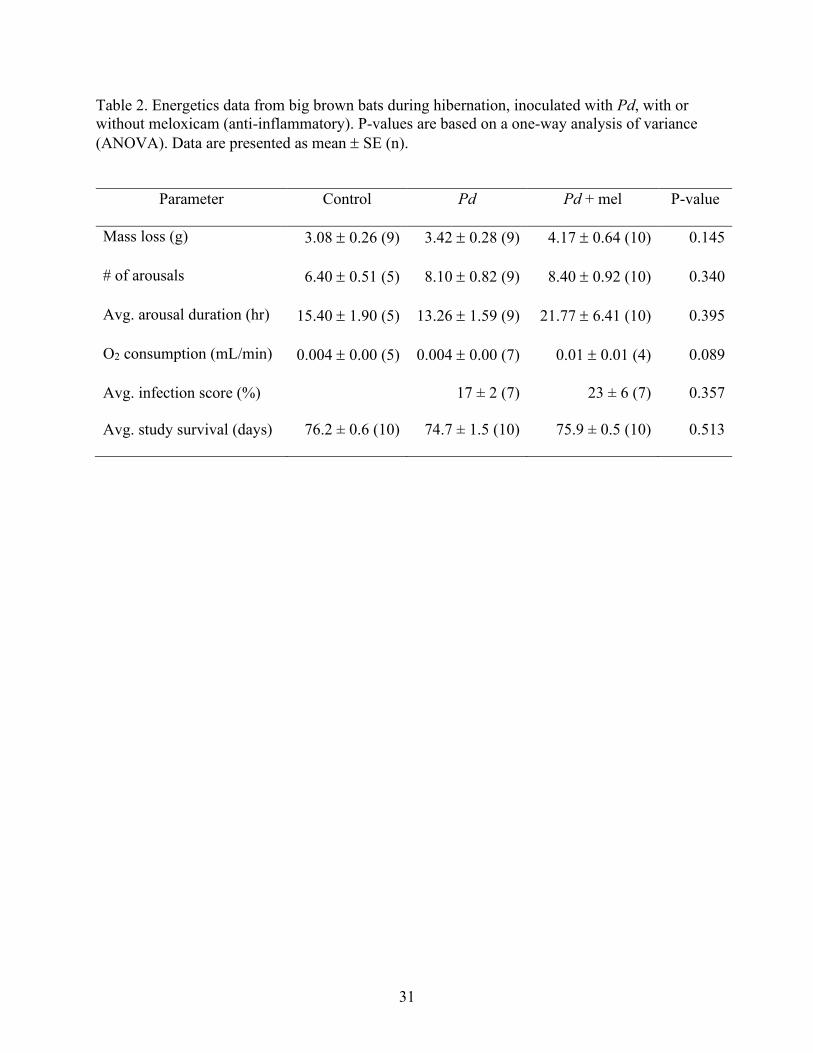
Table 2. Energetics data from big brown bats during hibernation, inoculated with Pd, with or
without meloxicam (anti-inflammatory). P-values are based on a one-way analysis of variance
(ANOVA). Data are presented as mean SE (n).
Parameter Control Pd Pd + mel P-value
Mass loss (g) 3.08 0.26 (9) 3.42 0.28 (9) 4.17 0.64 (10) 0.145
# of arousals 6.40 0.51 (5) 8.10 0.82 (9) 8.40 0.92 (10) 0.340
Avg. arousal duration (hr) 15.40 1.90 (5) 13.26 1.59 (9) 21.77 6.41 (10) 0.395
O2 consumption (mL/min) 0.004 0.00 (5) 0.004 0.00 (7) 0.01 0.01 (4) 0.089
Avg. infection score (%) 17 ± 2 (7) 23 ± 6 (7) 0.357
Avg. study survival (days) 76.2 ± 0.6 (10) 74.7 ± 1.5 (10) 75.9 ± 0.5 (10) 0.513
32
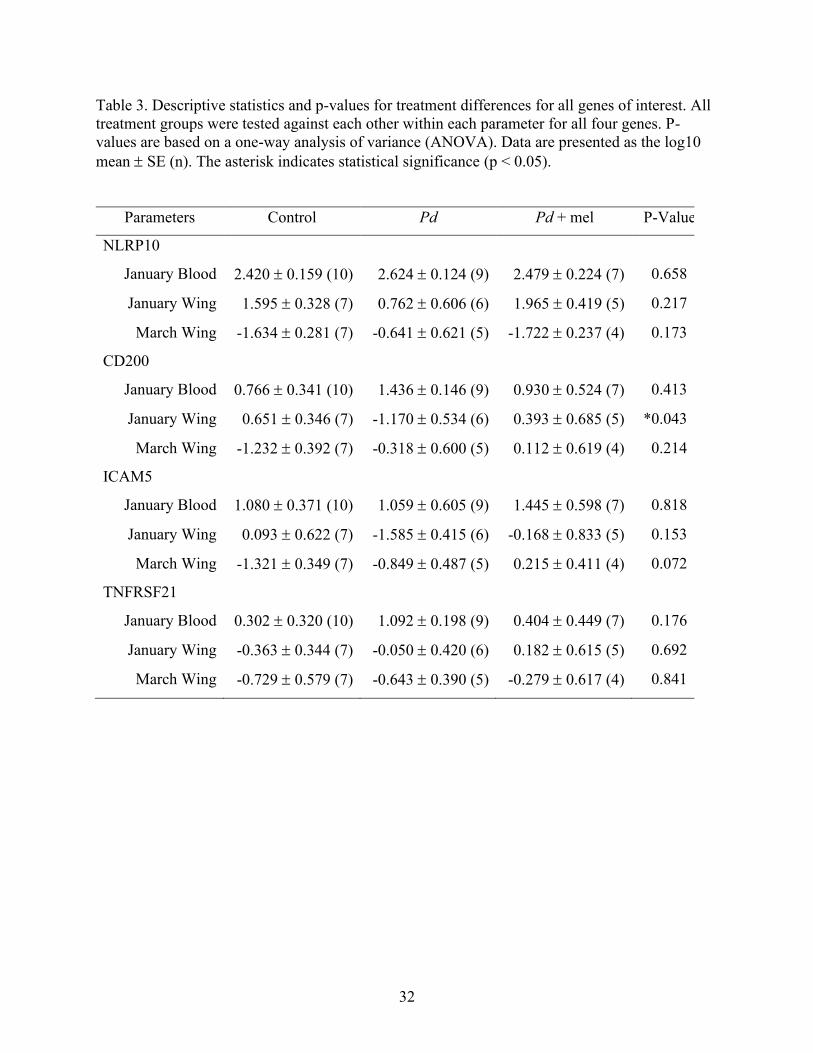
Table 3. Descriptive statistics and p-values for treatment differences for all genes of interest. All
treatment groups were tested against each other within each parameter for all four genes. P-
values are based on a one-way analysis of variance (ANOVA). Data are presented as the log10
mean SE (n). The asterisk indicates statistical significance (p < 0.05).
Parameters Control Pd Pd + mel P-Value
NLRP10
January Blood 2.420 0.159 (10) 2.624 0.124 (9) 2.479 0.224 (7) 0.658
January Wing 1.595 0.328 (7) 0.762 0.606 (6) 1.965 0.419 (5) 0.217
March Wing -1.634 0.281 (7) -0.641 0.621 (5) -1.722 0.237 (4) 0.173
CD200
January Blood 0.766 0.341 (10) 1.436 0.146 (9) 0.930 0.524 (7) 0.413
January Wing 0.651 0.346 (7) -1.170 0.534 (6) 0.393 0.685 (5) *0.043
March Wing -1.232 0.392 (7) -0.318 0.600 (5) 0.112 0.619 (4) 0.214
ICAM5
January Blood 1.080 0.371 (10) 1.059 0.605 (9) 1.445 0.598 (7) 0.818
January Wing 0.093 0.622 (7) -1.585 0.415 (6) -0.168 0.833 (5) 0.153
March Wing -1.321 0.349 (7) -0.849 0.487 (5) 0.215 0.411 (4) 0.072
TNFRSF21
January Blood 0.302 0.320 (10) 1.092 0.198 (9) 0.404 0.449 (7) 0.176
January Wing -0.363 0.344 (7) -0.050 0.420 (6) 0.182 0.615 (5) 0.692
March Wing -0.729 0.579 (7) -0.643 0.390 (5) -0.279 0.617 (4) 0.841
33
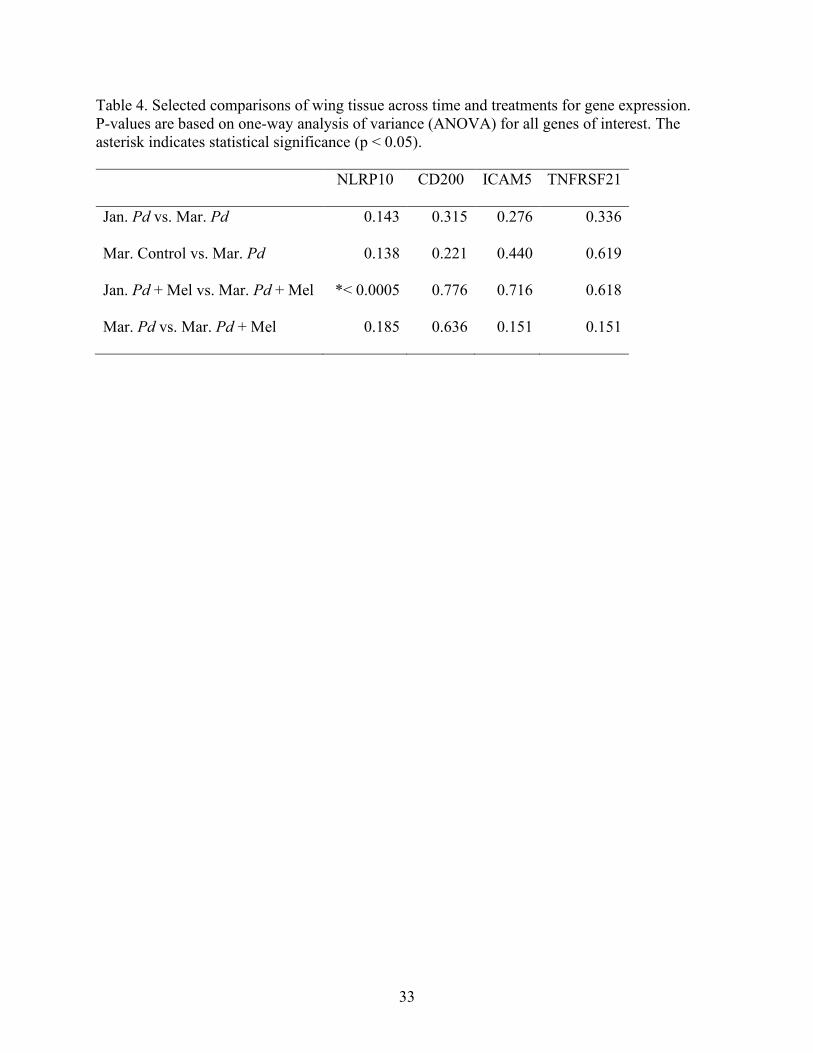
Table 4. Selected comparisons of wing tissue across time and treatments for gene expression.
P-values are based on one-way analysis of variance (ANOVA) for all genes of interest. The
asterisk indicates statistical significance (p < 0.05).
NLRP10 CD200 ICAM5 TNFRSF21
Jan. Pd vs. Mar. Pd 0.143 0.315 0.276 0.336
Mar. Control vs. Mar. Pd 0.138 0.221 0.440 0.619
Jan. Pd + Mel vs. Mar. Pd + Mel *< 0.0005 0.776 0.716 0.618
Mar. Pd vs. Mar. Pd + Mel 0.185 0.636 0.151 0.151
34
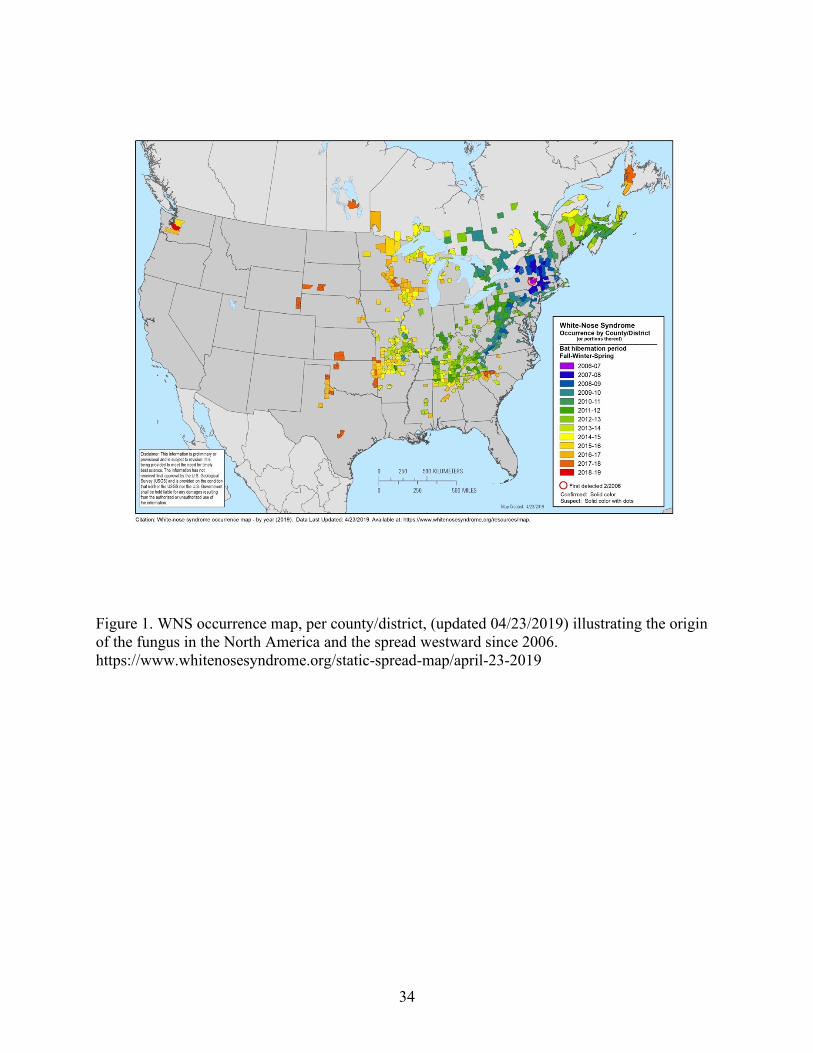
Figure 1. WNS occurrence map, per county/district, (updated 04/23/2019) illustrating the origin
of the fungus in the North America and the spread westward since 2006.
https://www.whitenosesyndrome.org/static-spread-map/april-23-2019
35
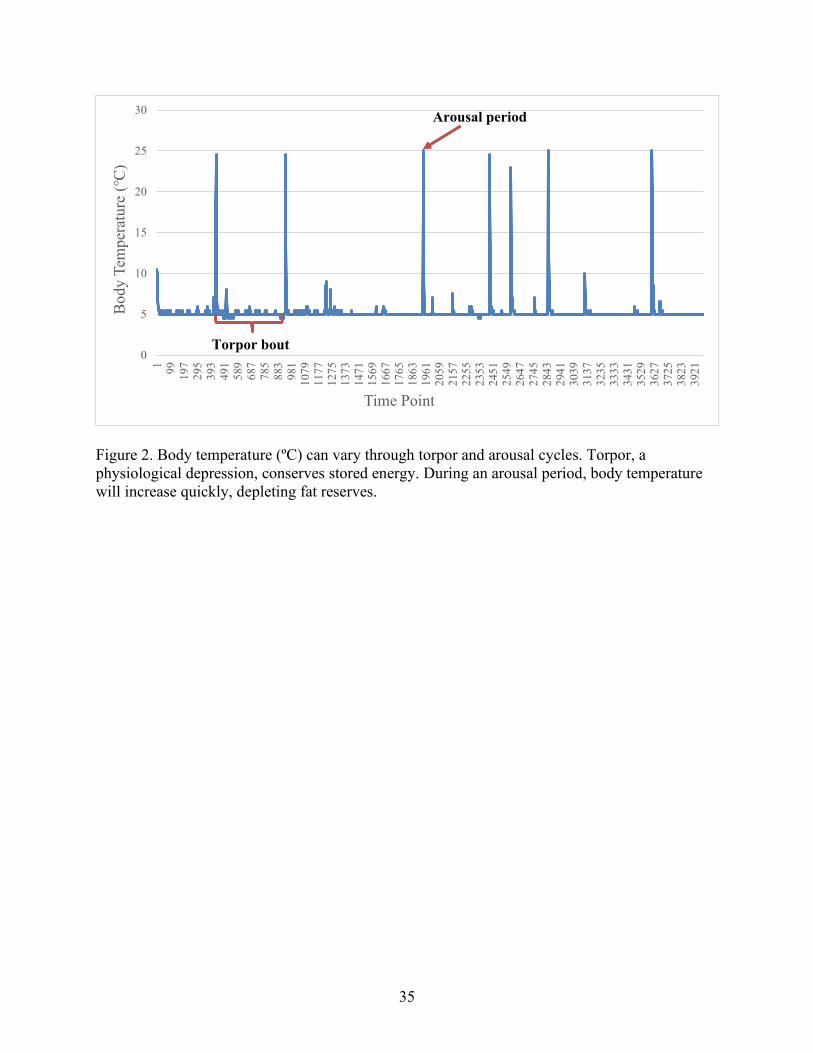
Figure 2. Body temperature (ºC) can vary through torpor and arousal cycles. Torpor, a
physiological depression, conserves stored energy. During an arousal period, body temperature
will increase quickly, depleting fat reserves.
0
5
10
15
20
25
30
19
91
97
295
393
491
589
687
785
883
981
107
91
17
71
27
51
37
31
47
11
56
91
66
71
76
51
86
31
96
12
05
92
15
72
25
52
35
32
45
12
54
92
64
72
74
52
84
32
94
13
03
93
13
73
23
53
33
33
43
13
52
93
62
73
72
53
82
33
92
1
Body T
emper
ature
(℃
)
Time Point
Torpor bout
Arousal period
36
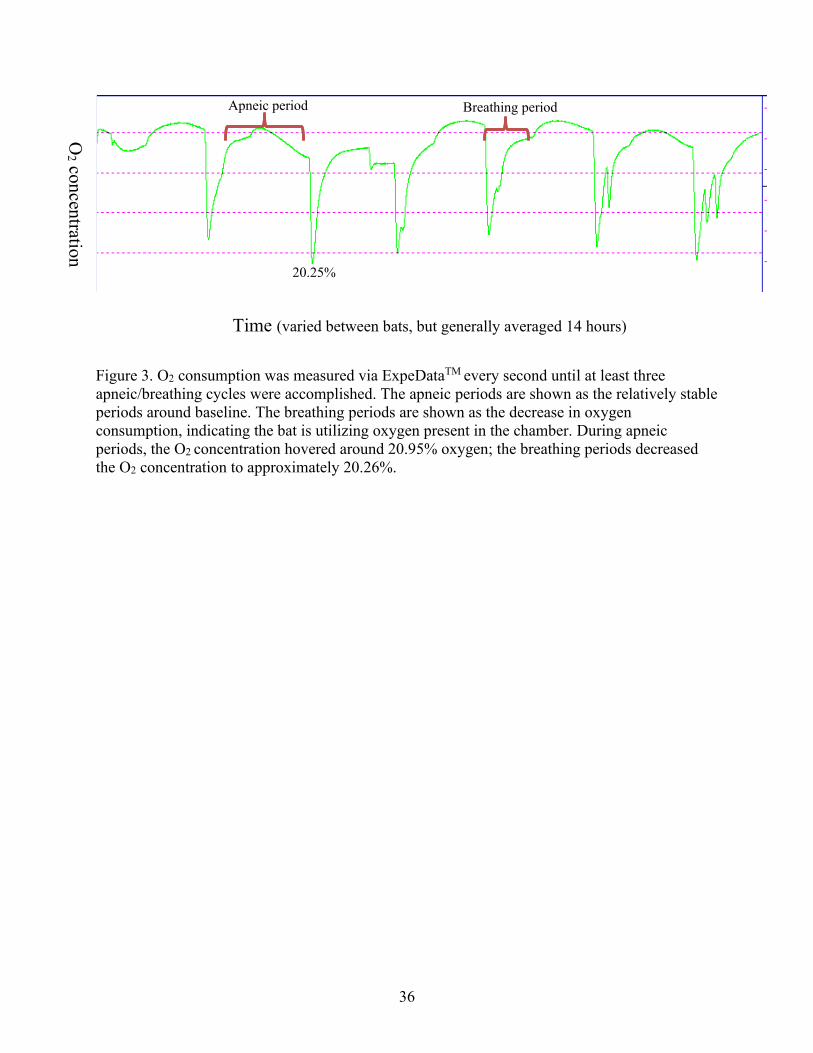
Figure 3. O2 consumption was measured via ExpeDataTM every second until at least three
apneic/breathing cycles were accomplished. The apneic periods are shown as the relatively stable
periods around baseline. The breathing periods are shown as the decrease in oxygen
consumption, indicating the bat is utilizing oxygen present in the chamber. During apneic
periods, the O2 concentration hovered around 20.95% oxygen; the breathing periods decreased
the O2 concentration to approximately 20.26%.
O2 co
ncen
tration
Time (varied between bats, but generally averaged 14 hours)
Breathing period Apneic period
20.25%
37
Treatments
Control Pd Pd + mel
Mass L
oss (
g)
2
4
6
8
Treatments
Control Pd Pd + mel
Aro
usa
ls
2
4
6
8
10
12
p = 0.145
Treatments
Control Pd Pd + mel
O2 C
on
sum
ptio
n (
mL/m
in)
0.000
0.005
0.010
0.015
0.020
Treatments
Control Pd Pd + mel
Tota
l Aro
usal T
ime (h
r)
0
10
20
30p = 0.089 p = 0.395
p = 0.340
Figure 4. Energetics data from big brown bats during hibernation, inoculated with Pd, with or
without meloxicam (anti-inflammatory). P-values are based on a one-way analysis of variance
(ANOVA). The torpid O2 consumption rates and total arousal time were highest in Pd + mel,
which is consistent to a higher mass loss in this treatment. However, the among treatment values
were not significantly different.
38
Figure 5. Mass loss (g) and total number of arousals had a positive relationship. The increase of
arousals correlated with a lower overall mass loss for each individual.
39
0 2 0 4 0 6 0 8 0 1 0 0
0
5 0
1 0 0
S u r v iv a l ra te
D a y
Pe
rce
nt
su
rviv
al
C o n tro l
P d
P d + M e lo x ic a m
Figure 6. Survival per treatment groups is displayed as percent survived, over 77 days.
40
Jan
co
nt
Win
g
Jan
Pd
Win
g
Jan
Pd
+M
el W
ing
Jan
Co
nt
Blo
od
Jan
Pd
Blo
od
Jan
Pd
+M
el B
loo
d
Mar
Co
nt
Win
g
Mar
Pd
Win
g
Mar
Pd
+M
el W
ing
-4
-2
0
2
4
N L R P 1 0 E x p re s s io n
T re a tm e n t G ro u p s
Lo
g1
0N
LR
P1
0 r
ela
tiv
e t
o R
PS
8
Figure 7. NLRP10 expression data, per month, treatment, and sample type (wing or blood), are
displayed as log10 gene expression relative to RPS8 (normalizing gene). Circles = control
animals; squares = bats in the Pd treatment; triangles = bats in the Pd + mel treatment group.
Closed symbols = wing samples; open circles = blood samples. NLRP10 expression across
treatment groups were not found to be different, except for January vs. March Pd + mel
treatments. Blood samples also showed a higher NLRP10 expression than wing samples.
41
Jan
co
nt
Win
g
Jan
Pd
Win
g
Jan
Pd
+M
el W
ing
Jan
Co
nt
Blo
od
Jan
Pd
Blo
od
Jan
Pd
+M
el B
loo
d
Mar
Co
nt
Win
g
Mar
Pd
Win
g
Mar
Pd
+M
el W
ing
-3
-2
-1
0
1
2
3
C D 2 0 0 E x p re s s io n
T re a tm e n t G ro u p s
Lo
g1
0C
D2
00
re
lati
ve
to
RP
S8
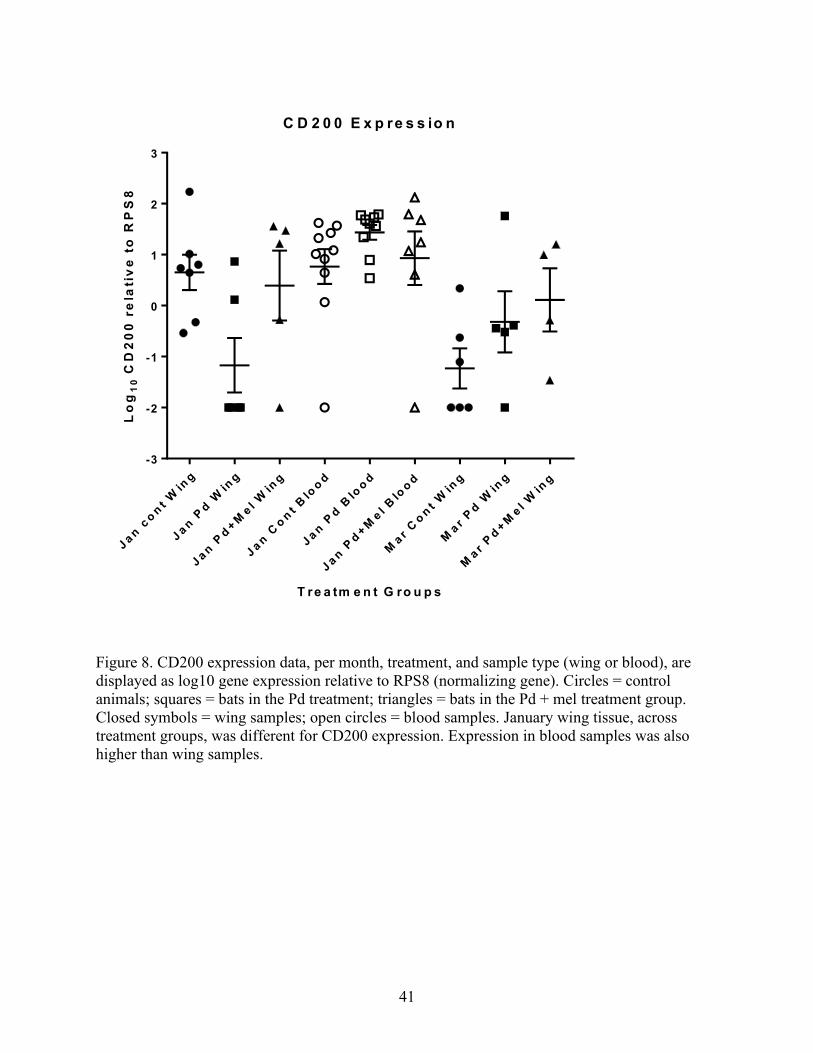
Figure 8. CD200 expression data, per month, treatment, and sample type (wing or blood), are
displayed as log10 gene expression relative to RPS8 (normalizing gene). Circles = control
animals; squares = bats in the Pd treatment; triangles = bats in the Pd + mel treatment group.
Closed symbols = wing samples; open circles = blood samples. January wing tissue, across
treatment groups, was different for CD200 expression. Expression in blood samples was also
higher than wing samples.
42
Jan
co
nt
Win
g
Jan
Pd
Win
g
Jan
Pd
+M
el W
ing
Jan
Co
nt
Blo
od
Jan
Pd
Blo
od
Jan
Pd
+M
el B
loo
d
Mar
Co
nt
Win
g
Mar
Pd
Win
g
Mar
Pd
+M
el W
ing
-3
-2
-1
0
1
2
3
C D 2 0 0 E x p re s s io n
T re a tm e n t G ro u p s
Lo
g1
0C
D2
00
re
lati
ve
to
RP
S8
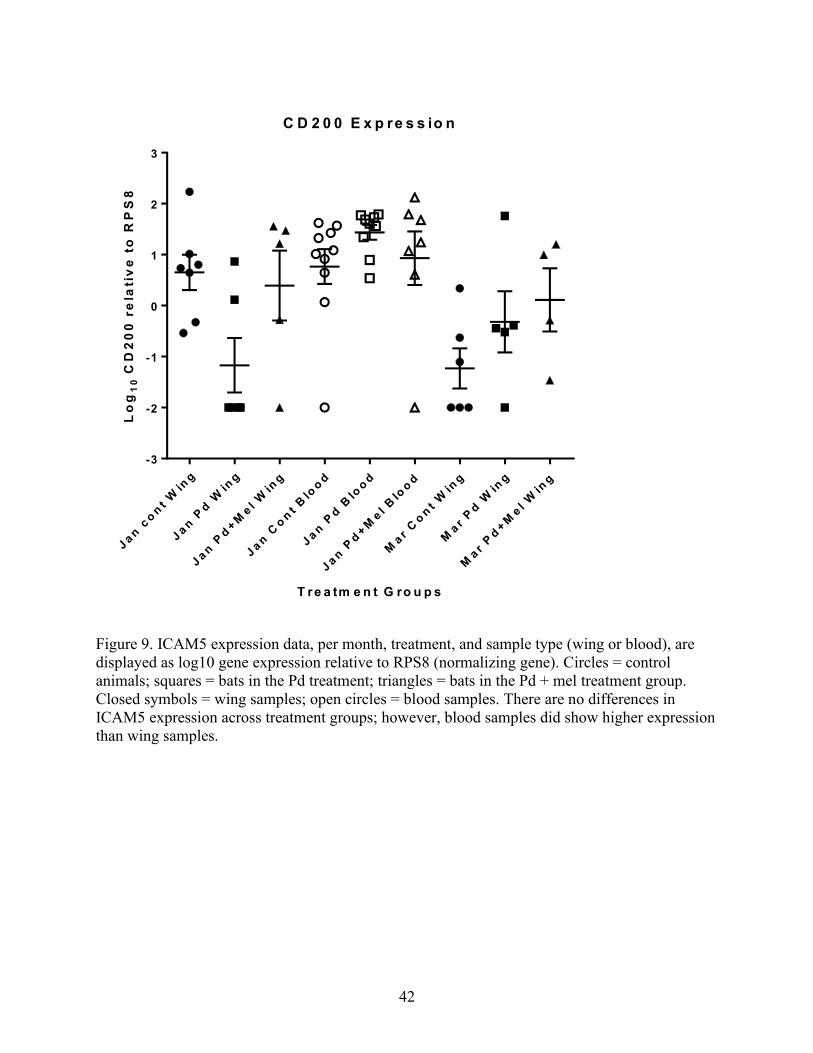
Figure 9. ICAM5 expression data, per month, treatment, and sample type (wing or blood), are
displayed as log10 gene expression relative to RPS8 (normalizing gene). Circles = control
animals; squares = bats in the Pd treatment; triangles = bats in the Pd + mel treatment group.
Closed symbols = wing samples; open circles = blood samples. There are no differences in
ICAM5 expression across treatment groups; however, blood samples did show higher expression
than wing samples.
43
Jan
co
nt
Win
g
Jan
Pd
Win
g
Jan
Pd
+M
el W
ing
Jan
Co
nt
Blo
od
Jan
Pd
Blo
od
Jan
Pd
+M
el B
loo
d
Mar
Co
nt
Win
g
Mar
Pd
Win
g
Mar
Pd
+M
el W
ing
-3
-2
-1
0
1
2
3
IC A M 5 E x p re s s io n
T re a tm e n t G ro u p s
Lo
g1
0IC
AM
5 r
ela
tiv
e t
o R
PS
8
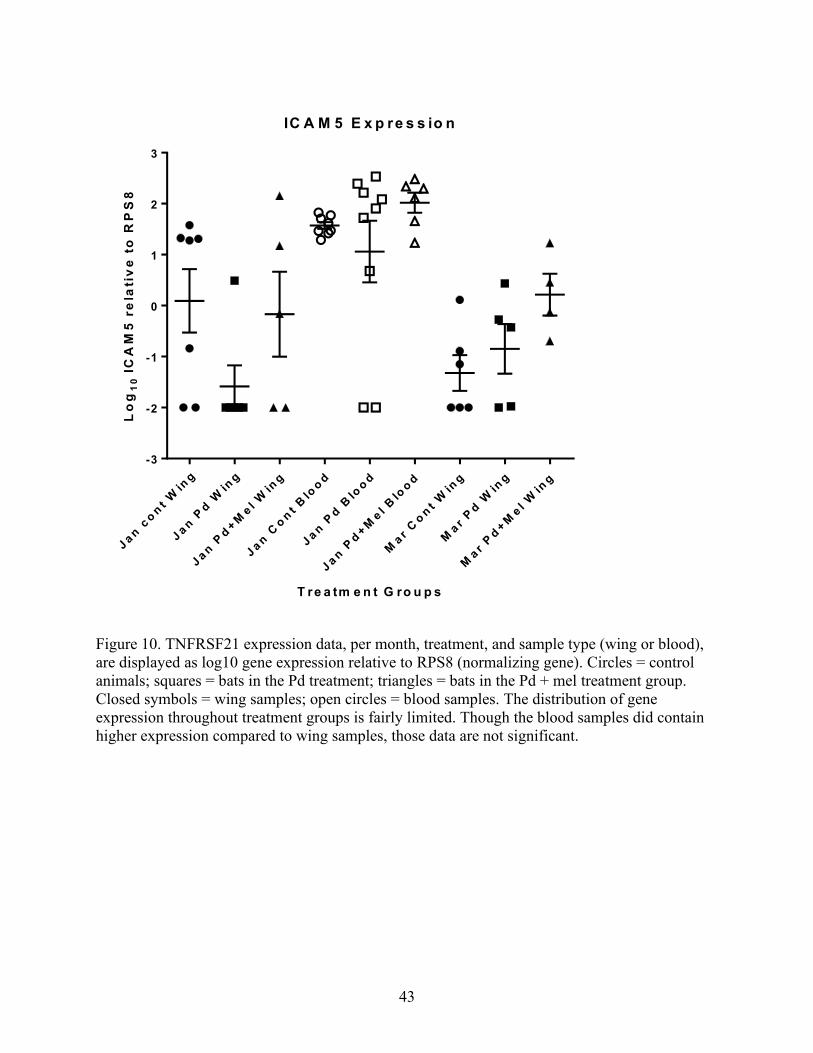
Figure 10. TNFRSF21 expression data, per month, treatment, and sample type (wing or blood),
are displayed as log10 gene expression relative to RPS8 (normalizing gene). Circles = control
animals; squares = bats in the Pd treatment; triangles = bats in the Pd + mel treatment group.
Closed symbols = wing samples; open circles = blood samples. The distribution of gene
expression throughout treatment groups is fairly limited. Though the blood samples did contain
higher expression compared to wing samples, those data are not significant.
44
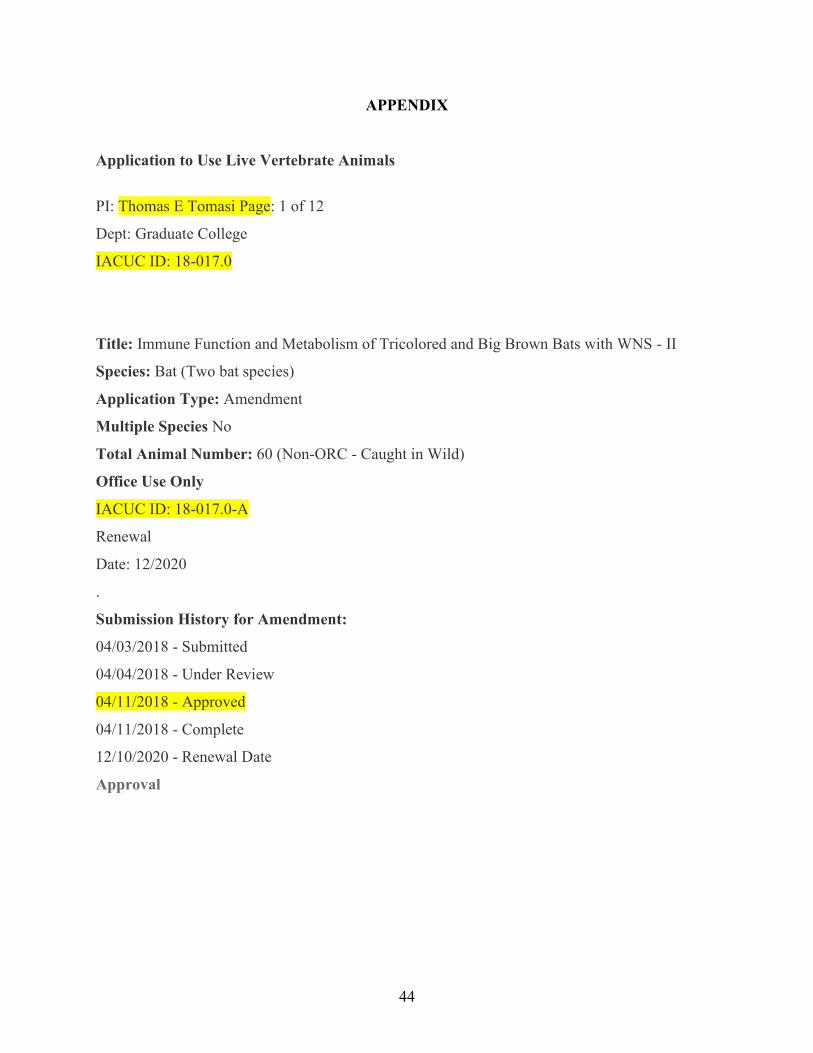
APPENDIX
Application to Use Live Vertebrate Animals
PI: Thomas E Tomasi Page: 1 of 12
Dept: Graduate College
IACUC ID: 18-017.0
Title: Immune Function and Metabolism of Tricolored and Big Brown Bats with WNS - II
Species: Bat (Two bat species)
Application Type: Amendment
Multiple Species No
Total Animal Number: 60 (Non-ORC - Caught in Wild)
Office Use Only
IACUC ID: 18-017.0-A
Renewal
Date: 12/2020
.
Submission History for Amendment:
04/03/2018 - Submitted
04/04/2018 - Under Review
04/11/2018 - Approved
04/11/2018 - Complete
12/10/2020 - Renewal Date
Approval