Embed Size (px)
Citation preview

March 2018
Captur ing the intangible va lue of susta inable and respons ib le
bus inesses{ {
WHITE PAPERSERIES #10
100 ESG Indices

Introduction The emphasis on sustainable and responsible investment (SRI) strategies have been steadily on
the rise given the increasing awareness towards environmental stability, socio-economic
development and adherence to ethical standards. Recently, the perceived lack of governance
during global financial crisis, increasing threat from global warming, activism on social issues etc.
have brought about a consensus towards importance of holistic growth and responsible
investment. One such strategy that has gradually gained popularity among investors is
environmental, social and governance (ESG) based investing. The underlying principle behind ESG
based investing lies in identifying & quantifying the intangible value possessed by socially
responsible, environmentally friendly firms with robust governance policies in place. These firms
are believed to exhibit better risk management measures on ESG parameters which in turn creates
value for investors with long-lasting sustainable business models.
ESG based investment philosophy has a rich history with its roots in United States and Europe set
in 1960-70. In Europe, the first SRI fund was launched in Sweden in 1960s whereas socio-political
movements in US led to start of socially responsible investments in 1970s. Globally, as of 2016,
there were $22.89 trillion worth of assets professionally managed under SRI theme. This
represents a healthy rise ~11.9% CAGR since 2014.
Environmental, Social and Governance (ESG) theme is an effective portfolio selection strategy
under the broader theme of sustainable and responsible investment (SRI). Fund managers and
investors can focus upon firms with better ESG performance to generate higher returns with lower
company specific risk. India Index Services & Products Ltd (IISL), an NSE group company, has
launched 2 ESG indices: NIFTY100 Enhanced ESG Index and NIFTY100 ESG Index. These ESG indices
are expected to appeal to the investment community looking to align their investment with ESG
theme.

Global landscape Assets managed under sustainable and responsible investment (SRI) theme have been on a steady
rise, recording USD 22.9 trillion in AUM by 2016, a CAGR growth of 11.9% since 2014. Europe
remains a dominant force in SRI theme based investing by contributing over 52% in total
investment, followed by United States at 38%. Geographically, Japan is the fastest growing
investment destination for SRI based themes by registering a huge jump from USD 7 bn in 2014 to
USD 474 bn in 2016. Among SRI based investment strategies, ESG theme based investment had an
AUM of USD 10.3 trillion in 2016, a robust CAGR growth of 17.4% since 2014. As of 2016, United
States accounted for ~56% of AUM managed under ESG theme, followed by Europe (27.8%) and
Canada (10.1%).
Exhibit 1: Growth in SRI assets by geographical region
Growth of SRI Assets by region from 2014-2016 (Assets in USD bn)
Region 2014 Share (%) 2016 Share (%) CAGR (%)*
Europe 10,775 59.0% 12,040 52.6% 5.7%
United States 6,572 36.0% 8,723 38.1% 15.2%
Canada 729 4.0% 1,086 4.7% 22.1%
Australia/New Zealand 148 0.8% 516 2.3% 86.7%
Asia ex Japan 45 0.2% 52 0.2% 7.5%
Japan 7 0.0% 474 2.1% 722.9%
Total 18,276 100.0% 22,891 100.0% 11.9% Source: Global Sustainable investment Review 2016, USSIF

NIFTY100 ESG indices uses robust ESG research framework In NIFTY100 ESG indices, a company is broadly measured on 3 main pillars: Environmental (E),
Social (S) and Governance (G). The research is conducted by Sustainalytics, one of the global
leaders in ESG research.
Environmental: Environmental factor covers the impact of the firm’s activity on environment
which includes carbon intensity trend, recycling & waste management process, development of
renewable energy etc. The environmental pillar consist of 52 indicators based on which a company
is assessed upon.
Exhibit 2: Broad ESG metrics
Social: Social factor covers the policies and impact of a firm’s activity on working conditions,
human rights, health and safety norms, financial inclusion etc. The social pillar consist of 52
indicators.
Governance: Governance factor measures the effectiveness of processes and policies pertaining
to corporate governance, business ethics, fraud and anti-corruption measures, public policy etc.
The governance pillar has 34 indicators which captures the various facet of governance.
Environmental(E)*Carbon intensity trend
*Waste management
*Renewable energy use
*Organic products
*Hazardoues products
Governance(G)*Whistleblower programs
*Bribery and corruption policy
*Responsible investment policy
* ESG Governance
*Board diversity
Social(S)*Working conditions policy
*Employee fatality rate
*Discrimination policy
*Employee training
*Health & safety mngt.
*Financial inclusion

Exhibit 3: Sustainalytics rating framework
Source: Sustainalytics
In Sustainalytics ESG rating framework, on each E, S, G pillar, a firm is rated based on 3 main areas:
Preparedness, Disclosure and Performance. Preparedness indicators measure effectiveness of a
firm’s policy, programmes and structures, Disclosure indicators measure effectiveness of a firm’s
standard and reporting process and Performance indicators capture firm’s
controversies/incidents and it’s response.
On each applicable indicator, a company is assigned a score of 0 to 100. The weight of each
indicator depends upon the relevance and importance of the indicator in the sector in which the
company operates. Based on the raw score and weight of all applicable indicators across E, S and
G pillar, a weighted average company level ESG score is determined, which ranges from 0 to 100.
ESG
Rat
ing
PreparednessPreparedness
indicators
DisclosureExternal & Internal
reporting
PerformanceQualitative &
Quantitative indicators
Framework Measurement units
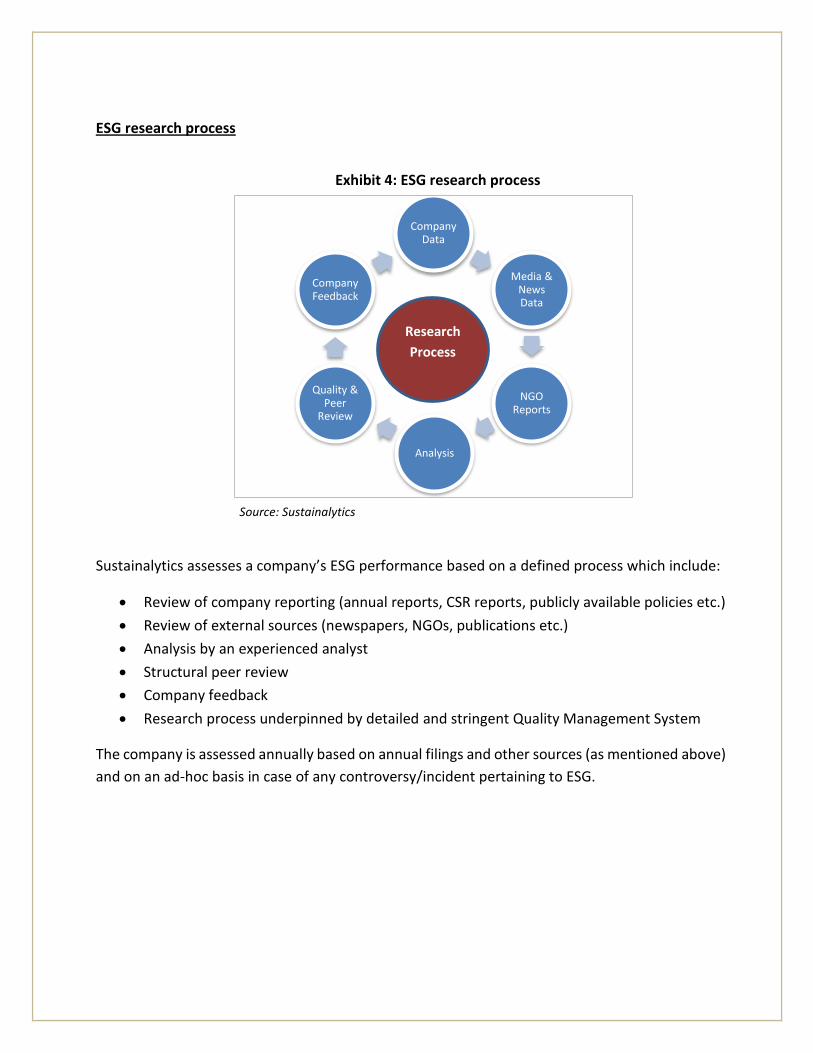
ESG research process
Exhibit 4: ESG research process
Source: Sustainalytics
Sustainalytics assesses a company’s ESG performance based on a defined process which include:
Review of company reporting (annual reports, CSR reports, publicly available policies etc.)
Review of external sources (newspapers, NGOs, publications etc.)
Analysis by an experienced analyst
Structural peer review
Company feedback
Research process underpinned by detailed and stringent Quality Management System
The company is assessed annually based on annual filings and other sources (as mentioned above)
and on an ad-hoc basis in case of any controversy/incident pertaining to ESG.
Company Data
Media & News Data
NGO Reports
Analysis
Quality & Peer
Review
Company Feedback
Research
Process

Controversy analysis A key component of ESG research focuses on assessing a company’s involvement in incidents and
controversies which can point to the lack of ESG compliance and imply potentially higher risk to
investors. The controversy analysis allows for a nuanced understanding of the issues that are
driving a company’s ESG performance.
Controversy analysis highlights the incidents that have reputational risk and captures the severity
of the event.
Exhibit 5: Controversy analysis process
Source: Sustainalytics
Events are classified into 10 areas across E, S and G Pillars and are scored on a scale from one to
five, depending on the reputational risk to the company and potential impact on stakeholders.
“Category 1” controversy event has low impact whereas “Category 5” controversy event has the
highest, indicating a severe impact on the involved stakeholders. Firms with controversy category
4 and 5 are excluded from the NIFTY100 ESG indices.
Category 1 Category 2 Category 3 Category 4 Category 5
*Low impact on
environment and
society, poses
negligible risk to
the company
*Moderate impact on
environment and society
with minimal risk to the
company
*Significant impact on
environment and society
with significant business
risk
*High impact on
environment and society
with high business risk
*Severe impact on
environment and society
with serious business risk
*Represents most severe
corporate conduct
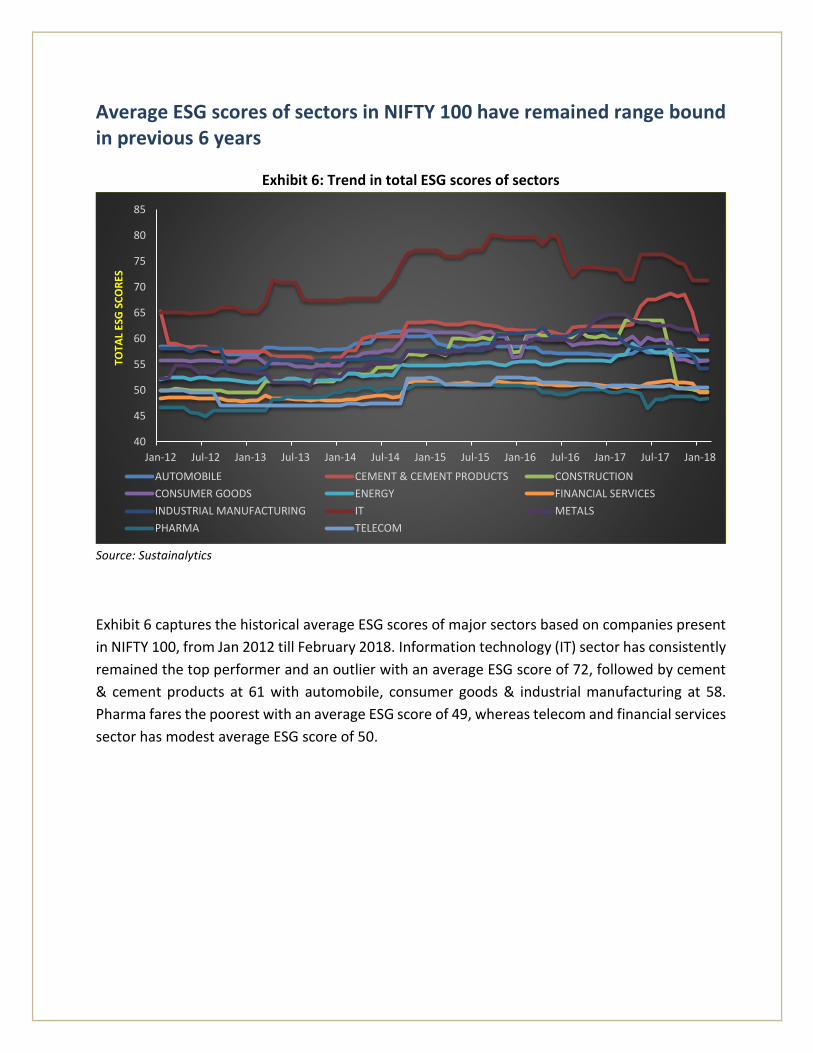
Average ESG scores of sectors in NIFTY 100 have remained range bound in previous 6 years
Exhibit 6: Trend in total ESG scores of sectors
Source: Sustainalytics
Exhibit 6 captures the historical average ESG scores of major sectors based on companies present
in NIFTY 100, from Jan 2012 till February 2018. Information technology (IT) sector has consistently
remained the top performer and an outlier with an average ESG score of 72, followed by cement
& cement products at 61 with automobile, consumer goods & industrial manufacturing at 58.
Pharma fares the poorest with an average ESG score of 49, whereas telecom and financial services
sector has modest average ESG score of 50.
40
45
50
55
60
65
70
75
80
85
Jan-12 Jul-12 Jan-13 Jul-13 Jan-14 Jul-14 Jan-15 Jul-15 Jan-16 Jul-16 Jan-17 Jul-17 Jan-18
TOTA
L ES
G S
CO
RES
AUTOMOBILE CEMENT & CEMENT PRODUCTS CONSTRUCTION
CONSUMER GOODS ENERGY FINANCIAL SERVICES
INDUSTRIAL MANUFACTURING IT METALS
PHARMA TELECOM

ESG performance of Indian companies
Exhibit 7: Distribution of latest ESG scores of NIFTY 100 companies
As on February 28, 2018
As on February 2018, out of NIFTY 100 companies, 23 Indian companies had an ESG score of below
50, but then only 2 Indian companies had an ESG score of above 80. This highlights the fact that
approx. 70% of Indian large cap companies lie in 3rd quartile on the basis of ESG score. The average
ESG score of NIFTY 100 companies is ~58.
Further on analyzing the ESG score of all 250 Indian companies covered by Sustainalytics, it can be
observed that 40% of companies lie in 2nd Quartile and 57% of companies lie in 3rd quartile on
the basis of ESG score, as against 23% and 70% of NIFTY 100 companies respectively, which
highlights the fact that comparatively, companies beyond large cap (NIFTY 100) fares poorly on
ESG parameters. The average ESG score of companies covered by Sustainalytics globally is 53.36
whereas the average score of Indian companies is marginally higher at 53.6.
Exhibit 8: Distribution of latest ESG scores of companies covered by Sustainalytics
ESG performance of all Indian companies covered by Sustainalytics Particulars Quartiles All
Companies Quartile 1 Quartile 2 Quartile 3 Quartile 4 (ESG Score 0-25) (ESG Score 25-50) (ESG Score 50-75) (ESG Score 75-100)
Number of companies 0 102 142 6 250
Median ESG Score - 47.1 55.2 77.7 51.6
Average ESG Score - 46.7 57.3 81.6 53.6
As on February 28, 2018
0 0 0
23
40
19
15
02
0
5
10
15
20
25
30
35
40
45
10 - 20 20 - 30 30 - 40 40 - 50 50 - 60 60 - 70 70 - 80 80 - 90 90 - 100
NO
. OF
CO
MP
AN
IES
ESG SCORE BINS OF NIFTY 100 COMPANIES

About NIFTY100 ESG indices The NIFTY100 ESG indices are designed to reflect the performance of companies that are part of NIFTY 100 index based on Environmental, Social and Governance score. The weight of constituents in these indices is tilted based on ESG score assigned to the company, i.e. the constituent weight is derived from its free float market capitalization and ESG score. These indices exclude companies engaged in the business of tobacco, alcohol, controversial weapons and gambling operations. The companies that are involved in any major Environmental, Social or Governance controversy are not considered for selection in the index. Additionally, the NIFTY100 Enhanced ESG Index includes only those companies that have a normalized ESG score of at least 50%.
NIFTY ESG indices have marginally outperformed NIFTY 100 index in
long term horizon
Exhibit 9 and 10 given below shows the performance of NIFTY100 Enhanced ESG Index, NIFTY100
ESG Index and NIFTY 100 from April 2011 till February 2018.
Exhibit 9: Performance of NIFTY100 ESG indices and NIFTY 100
As on February 28, 2018
700
900
1100
1300
1500
1700
1900
2100
2300
Apr-11 Dec-11 Aug-12 Apr-13 Dec-13 Sep-14 May-15 Jan-16 Sep-16 May-17 Feb-18
BEN
CH
MA
RK
ED IN
DEX
VA
LUES
NIFTY100 ESG NIFTY 100 NIFTY100 Enhanced ESG
Global
Economic
Slowdown
General
Elections
Reform
initiatives by
Govt.

Exhibit 10: Calendar year performance of NIFTY100 Enhanced ESG, NIFTY100 ESG and NIFTY 100 Calendar
year
Returns (%) Volatility (%) Returns-Risk Ratio
NIFTY100
ESG
NIFTY100
Enhanced
ESG
NIFTY
100
NIFTY100
ESG
NIFTY100
Enhanced
ESG
NIFTY
100
NIFTY100
ESG
NIFTY100
Enhanced
ESG
NIFTY
100
2011 -23.2% -23.0% -21.6% 22.5% 22.5% 20.1% -1.03 -1.02 -1.07
2012 33.4% 33.4% 30.6% 16.8% 16.8% 15.0% 1.99 1.99 2.04
2013 9.1% 9.4% 6.5% 17.8% 17.9% 17.7% 0.51 0.52 0.36
2014 32.0% 31.9% 33.2% 13.5% 13.5% 13.0% 2.36 2.36 2.56
2015 -2.2% -1.7% -2.4% 16.5% 16.4% 16.1% -0.13 -0.10 -0.15
2016 3.2% 3.6% 3.6% 15.3% 15.2% 15.2% 0.21 0.23 0.24
2017 31.6% 32.3% 31.1% 9.2% 9.1% 9.3% 3.44 3.54 3.34
2018 YTD -0.4% -0.1% -1.1% 12.0% 11.9% 11.6% -0.03 -0.01 -0.10
As on February 28, 2018
NIFTY100 ESG indices have given comparable returns vis-à-vis their parent NIFTY 100 index since
2011, though both NIFTY100 Enhanced ESG and NIFTY100 ESG indices have marginally
outperformed NIFTY 100 Index in 4 out of the 6 full calendar years since April, 2011. The
outperformance is comparatively high during 2012 and 2013 calendar years.
Since inception, NIFTY 100 has given CAGR of 9.7% whereas NIFTY100 ESG index and NIFTY100
Enhanced ESG Index has given CAGR of 10.1% and 10.5% respectively.

Sector level diversification of NIFTY100 ESG indices remains comparable
with its parent NIFTY 100 index
Exhibit 11: Portfolio comparison of NIFTY100 ESG indices and NIFTY 100
As on February 28, 2018
NIFTY100 ESG indices target to achieve the same sector weights (distribution) as the parent NIFTY
100 index and thus the sector weight in NIFTY100 ESG indices remains comparable with NIFTY 100
index. Aggregate weight of top 5 sectors in NIFTY100 ESG and NIFTY100 Enhanced ESG indices is
76.7% and 78.2% respectively which is similar to the NIFTY 100 index, whose combined weight of
same top 5 sectors stands at 79.0%. Both NIFTY100 ESG indices and NIFTY 100 index represents
15 sectors, where the individual weight of 12 sectors are less than 10%.
32.5 32.4 32.4
13.6 13.8 13.5
13.5 14.711.1
8.8 8.69.9
8.2 8.7 12.2
5.3 2.5 4.34.7 5.1
5.14.5 4.9
3.62.5 2.7 2.02.5 2.7 2.03.9 3.9 4.0
0%
10%
20%
30%
40%
50%
60%
70%
80%
90%
100%
NIFTY100 ESG NIFTY100 Enhanced ESG NIFTY 100
OTHERS
TELECOM
CEMENT & CEMENTPRODUCTSCONSTRUCTION
METALS
PHARMA
CONSUMER GOODS
AUTOMOBILE
IT
ENERGY
FINANCIAL SERVICES

Stock level diversification of NIFTY100 ESG indices remains comparable
with NIFTY 100
Exhibit 12: Weightage of top 10 stocks in indices
NIFTY100 ESG NIFTY100 ESG Enhanced ESG NIFTY 100
Company Name Weight Company Name Weight Company Name Weight
Reliance Industries Ltd. 10.3 Reliance Industries Ltd. 10.3 HDFC Bank Ltd. 8.1
HDFC Bank Ltd. 7.0 HDFC Bank Ltd. 7.1 Reliance Industries Ltd. 6.9
Infosys Ltd. 6.0 Infosys Ltd. 6.6 HDFC 6.1 HDFC Ltd. 5.3 HDFC 5.4 Infosys Ltd. 4.9
Larsen & Toubro Ltd. 4.4 Larsen & Toubro Ltd. 4.8 I T C Ltd. 4.7
Kotak Mahindra Bank Ltd. 4.0 Kotak Mahindra Bank Ltd. 4.1 ICICI Bank Ltd. 4.2
Mahindra & Mahindra Ltd. 3.9 Hindustan Unilever Ltd. 4.0 Larsen & Toubro Ltd. 3.4
Hindustan Unilever Ltd. 3.8 Mahindra & Mahindra Ltd. 3.9 Tata Consultancy Services Ltd.
3.2
Yes Bank Ltd. 3.5 Tata Consultancy Services Ltd. 3.8 Kotak Mahindra Bank Ltd. 3.0
Tata Consultancy Services Ltd. 3.5 Yes Bank Ltd. 3.6 Maruti Suzuki India Ltd. 2.5
Weight of top 10 stocks 51.8 Weight of top 10 stocks 53.6 Weight of top 10 stocks 46.9
(HHI)*1 value 365.1 (HHI) *1 value 384.3 (HHI) *1 Value 299.1
As on February 28, 2018
As on February 28, 2018, top 10 stocks in NIFTY100 ESG index contribute 51.8% of weight (with
individual weights ranging between 3.5% to 10.3%) whereas those of NIFTY100 Enhanced ESG
index contribute to 53.6% of weight (with individual weights ranging between 3.6% to 10.3%),
which is comparable to NIFTY 100 index where top 10 stocks contribute 46.9% of weight (with
individual weights ranging between 2.5% to 8.1%).
The Herfindahl - Hirschman Index (HHI)1 value explains the degree of diversification in a portfolio,
where a lower value signifies a more diversified portfolio. The HHI value of NIFTY100 ESG Index is
365.1 whereas that of NIFTY100 Enhanced ESG portfolio is 384.3, which is fairly comparable with
that of NIFTY 100 Index (which has an HHI value of 299.1).
1: Herfindahl Hirschman Index (HHI) measures of concentration. Calculated as sum of squares of percentage weight of each stock
in the portfolio

Signing off…
ESG based investment strategy has gained popularity across global investors with emphasis on
investment in companies which have sustainable and responsible business models. The underlying
drive behind ESG theme based investing lies in generating returns from socially responsible,
environment friendly and ethical firms by reducing the company specific risk associated with ESG
controversies. The construct of NIFTY100 ESG indices results in portfolio with similar sector
exposure vis-à-vis NIFTY 100 (parent index), but with stock level ESG tilt. This results in portfolio
with higher weightage towards companies with better ESG performance. The NIFTY100 ESG
indices have outperformed their parent NIFTY 100 over long term investment horizons. These
indices will cater to the benchmarking needs of investors seeking to track the performance of
portfolio of companies that have better ESG compliance. The indices are also expected to serve as
reference indices, which can be tracked by passive funds in the form of Exchange Traded Funds
(ETFs), index funds and structured products.
For information on Index methodology and factsheet, please visit us at www.niftyindices.com

About India Index Services & Products Ltd. (IISL):
India Index Services & Products Ltd. (IISL), a subsidiary of NSE, provides a variety of indices and
index related services for the capital markets. IISL focuses on the index as a core product. IISL owns
and manages a portfolio of indices under the NIFTY brand of NSE, including the flagship index, the
NIFTY 50. IISL equity Indices comprises broad-based benchmark indices, sectoral indices, strategy
indices, thematic indices and customised indices. IISL also maintains fixed income indices based
on Government of India securities, corporate bonds, money market instruments and hybrid
indices. Many investment products based on IISL indices have been developed within India and
abroad. These include index based derivatives traded on NSE, Singapore Exchange Ltd. (SGX),
Chicago Mercantile Exchange Inc. (CME), Osaka Exchange Inc. (OSE), Taiwan Futures Exchange
(TAIFEX) and a number of index funds and exchange traded funds. The flagship 'NIFTY 50' index is
widely tracked and traded as the benchmark for Indian Capital Markets.
For more information, please visit: www.niftyindices.com
Disclaimer:
The ownership and all intellectual property rights in Sustainalytics’ environmental, social and governance (“ESG”) data points and information contained in the ESG profile are vested exclusively in Sustainalytics and/or its suppliers. Unless otherwise expressly agreed in writing between you and Sustainalytics, you will not be permitted to use this information otherwise than for internal use, nor will you be permitted to reproduce, disseminate, comingle, create derivative works, furnish in any manner, make available to third parties or publish this information or parts thereof in any form or in any manner, be it electronically, mechanically, through photocopies, recordings. The Sustainalytics’ environmental, social and governance (“ESG”) data points and information contained in the ESG profile are based on information that reflects the situation as on the date of its elaboration. Such information has – fully or partially – been derived from third parties and is therefore subject to continuous modification. The information herein is provided solely for informational purposes and therefore are not an offer to buy or sell a security. Neither Sustainalytics nor all its third-party suppliers provide investment advice (as defined in the applicable jurisdiction) or any other form of (financial) advice and nothing within this information constitutes such advice. Sustainalytics observes the greatest possible care in using information, however the information is provided “as is” and neither Sustainalytics nor its suppliers accept any liability for damage arising from the use of this information in any manner whatsoever. Moreover, Sustainalytics and all its third-party suppliers disclaim any and all warranties and representations, express or implied, including any warranties of merchantibility, completeness, accuracy or fitness for a particular purpose.

Contact:
Email: [email protected]
Tel: +91 22 26598386
Address: Exchange Plaza, Bandra Kurla Complex,
Bandra (East), Mumbai– 400 051(India)
Disclaimer: All information contained herewith is provided for reference purpose only. IISL ensures accuracy and reliability of
the above information to the best of its endeavors. However, IISL makes no warranty or representation as to the accuracy,
completeness or reliability of any of the information contained herein and disclaim any and all liability whatsoever to any
person for any damage or loss of any nature arising from or as a result of reliance on any of the information provided herein.
The information contained in this document is not intended to provide any professional advice.
Contact Details
Analytical contact
Aman Singhania, CFA, FRM
Head – Products (IISL)
+91-22-26598214
Business Development contact
Rohit Kumar, FRM
Chief Manager – Business Development
+91-22- 26598386