Embed Size (px)
Citation preview
White Paper on Tourism In Japan
The Tourism Situation in FY2016
Table of contents Part I Tourism Trends in 2016 .............................................................................................. 1
Chapter 1 Global Tourism Trends ..................................................................................... 1 Section 1 Global Macroeconomic Conditions ................................................................ 1 Section 2 The Global Tourism Situation in 2016 ......................................................... 2
Chapter 2 Tourism Trends in Japan ................................................................................. 9 Section 1 Travel to Japan ............................................................................................... 9
1 Travel to Japan ........................................................................................................ 9 2 International Conferences and Exhibitions Held in Japan ................................ 16
Section 2 Trends in Japanese Overseas Travel .......................................................... 21 Section 3 Trends in Domestic Trips ............................................................................. 23 Section 4 Trends in Overnight Trips ........................................................................... 24 Section 5 Recovery from the Great East Japan Earthquake .................................... 28
1 Guest Nights of Japanese at Tourist-oriented Accommodations ........................ 28 2 Guest Nights of International Visitors at Tourist-oriented
Accommodations ................................................................................................ 29 3 Guest Nights at Business People-oriented Accommodations ............................. 29
Section 6 The Tourism Situation in Regional Areas .................................................. 30 1 Hokkaido ................................................................................................................ 33 2 Tohoku .................................................................................................................... 33 3 Kanto ...................................................................................................................... 33 4 Hokuriku-Shinetsu ................................................................................................ 33 5 Chubu ..................................................................................................................... 33 6 Kinki ....................................................................................................................... 33 7 Chugoku.................................................................................................................. 33 8 Shikoku ................................................................................................................... 34 9 Kyushu .................................................................................................................... 34 10 Okinawa ............................................................................................................... 34
Section 7 Initiatives to Promote Tourism in Each Region ......................................... 35 1 Hokkaido ................................................................................................................ 35 2 Tohoku .................................................................................................................... 36 3 Kanto ...................................................................................................................... 37 4 Hokuriku-Shinetsu ................................................................................................ 38 5 Chubu ..................................................................................................................... 39 6 Kinki ....................................................................................................................... 40 7 Chugoku.................................................................................................................. 40 8 Shikoku ................................................................................................................... 41 9 Kyushu .................................................................................................................... 42 10 Okinawa ............................................................................................................... 43
1
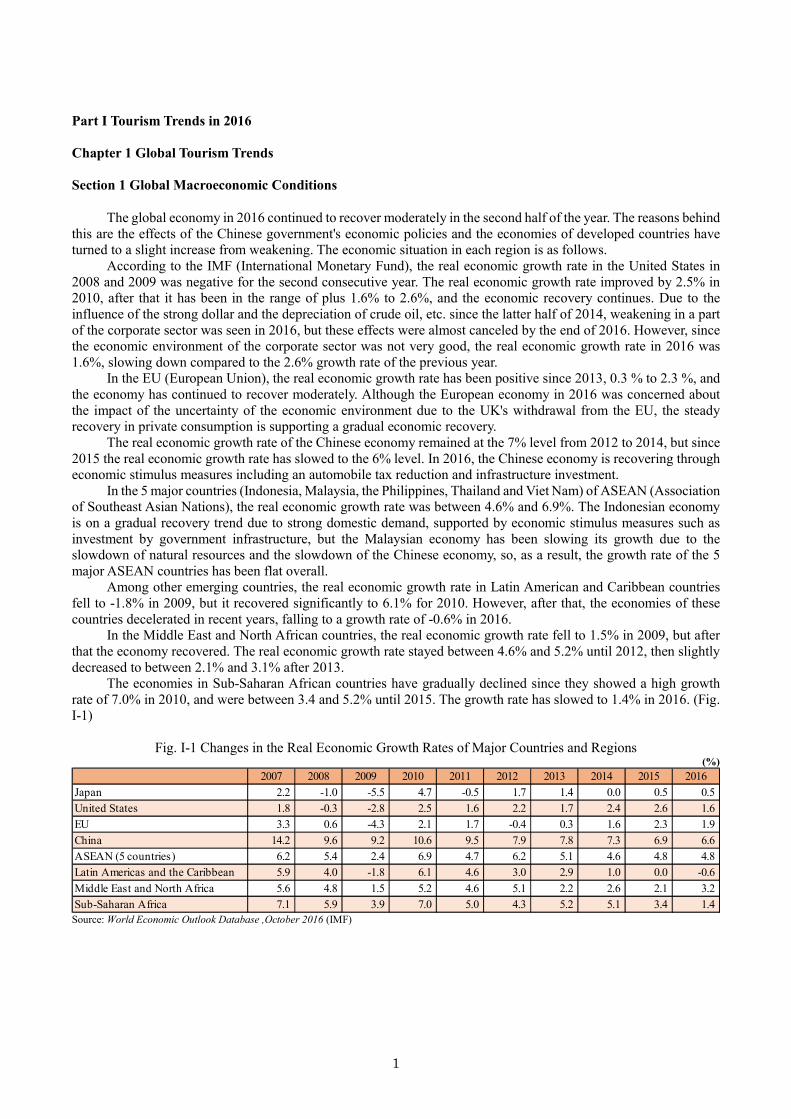
Part I Tourism Trends in 2016 Chapter 1 Global Tourism Trends Section 1 Global Macroeconomic Conditions
The global economy in 2016 continued to recover moderately in the second half of the year. The reasons behind this are the effects of the Chinese government's economic policies and the economies of developed countries have turned to a slight increase from weakening. The economic situation in each region is as follows.
According to the IMF (International Monetary Fund), the real economic growth rate in the United States in 2008 and 2009 was negative for the second consecutive year. The real economic growth rate improved by 2.5% in 2010, after that it has been in the range of plus 1.6% to 2.6%, and the economic recovery continues. Due to the influence of the strong dollar and the depreciation of crude oil, etc. since the latter half of 2014, weakening in a part of the corporate sector was seen in 2016, but these effects were almost canceled by the end of 2016. However, since the economic environment of the corporate sector was not very good, the real economic growth rate in 2016 was 1.6%, slowing down compared to the 2.6% growth rate of the previous year.
In the EU (European Union), the real economic growth rate has been positive since 2013, 0.3 % to 2.3 %, and the economy has continued to recover moderately. Although the European economy in 2016 was concerned about the impact of the uncertainty of the economic environment due to the UK's withdrawal from the EU, the steady recovery in private consumption is supporting a gradual economic recovery.
The real economic growth rate of the Chinese economy remained at the 7% level from 2012 to 2014, but since 2015 the real economic growth rate has slowed to the 6% level. In 2016, the Chinese economy is recovering through economic stimulus measures including an automobile tax reduction and infrastructure investment.
In the 5 major countries (Indonesia, Malaysia, the Philippines, Thailand and Viet Nam) of ASEAN (Association of Southeast Asian Nations), the real economic growth rate was between 4.6% and 6.9%. The Indonesian economy is on a gradual recovery trend due to strong domestic demand, supported by economic stimulus measures such as investment by government infrastructure, but the Malaysian economy has been slowing its growth due to the slowdown of natural resources and the slowdown of the Chinese economy, so, as a result, the growth rate of the 5 major ASEAN countries has been flat overall.
Among other emerging countries, the real economic growth rate in Latin American and Caribbean countries fell to -1.8% in 2009, but it recovered significantly to 6.1% for 2010. However, after that, the economies of these countries decelerated in recent years, falling to a growth rate of -0.6% in 2016.
In the Middle East and North African countries, the real economic growth rate fell to 1.5% in 2009, but after that the economy recovered. The real economic growth rate stayed between 4.6% and 5.2% until 2012, then slightly decreased to between 2.1% and 3.1% after 2013.
The economies in Sub-Saharan African countries have gradually declined since they showed a high growth rate of 7.0% in 2010, and were between 3.4 and 5.2% until 2015. The growth rate has slowed to 1.4% in 2016. (Fig. I-1)
Fig. I-1 Changes in the Real Economic Growth Rates of Major Countries and Regions
(%)
Source: World Economic Outlook Database ,October 2016 (IMF)
2007 2008 2009 2010 2011 2012 2013 2014 2015 2016Japan 2.2 -1.0 -5.5 4.7 -0.5 1.7 1.4 0.0 0.5 0.5United States 1.8 -0.3 -2.8 2.5 1.6 2.2 1.7 2.4 2.6 1.6EU 3.3 0.6 -4.3 2.1 1.7 -0.4 0.3 1.6 2.3 1.9China 14.2 9.6 9.2 10.6 9.5 7.9 7.8 7.3 6.9 6.6ASEAN (5 countries) 6.2 5.4 2.4 6.9 4.7 6.2 5.1 4.6 4.8 4.8Latin Americas and the Caribbean 5.9 4.0 -1.8 6.1 4.6 3.0 2.9 1.0 0.0 -0.6Middle East and North Africa 5.6 4.8 1.5 5.2 4.6 5.1 2.2 2.6 2.1 3.2Sub-Saharan Africa 7.1 5.9 3.9 7.0 5.0 4.3 5.2 5.1 3.4 1.4
2
Section 2 The Global Tourism Situation in 2016
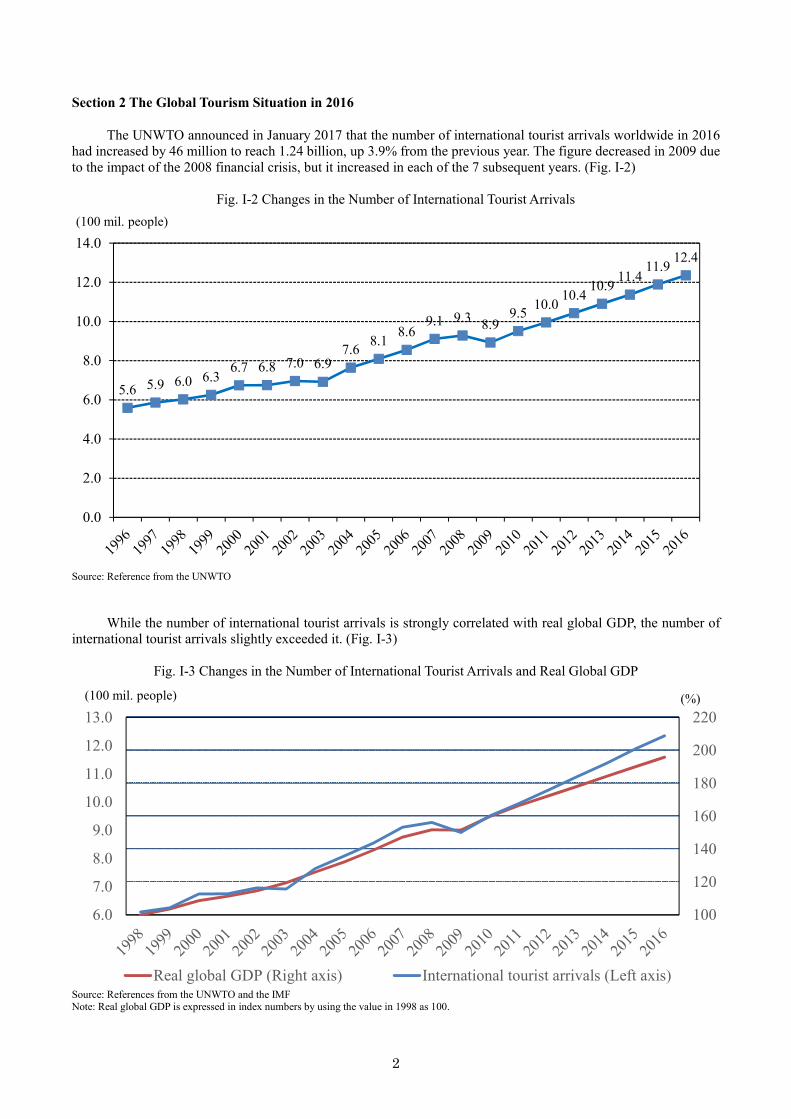
The UNWTO announced in January 2017 that the number of international tourist arrivals worldwide in 2016 had increased by 46 million to reach 1.24 billion, up 3.9% from the previous year. The figure decreased in 2009 due to the impact of the 2008 financial crisis, but it increased in each of the 7 subsequent years. (Fig. I-2)
Fig. I-2 Changes in the Number of International Tourist Arrivals
Source: Reference from the UNWTO
While the number of international tourist arrivals is strongly correlated with real global GDP, the number of international tourist arrivals slightly exceeded it. (Fig. I-3)
Fig. I-3 Changes in the Number of International Tourist Arrivals and Real Global GDP
Source: References from the UNWTO and the IMF Note: Real global GDP is expressed in index numbers by using the value in 1998 as 100.
5.6 5.9 6.0 6.36.7 6.8 7.0 6.9
7.6 8.1 8.69.1 9.3 8.9
9.5 10.010.4
10.911.4
11.9 12.4
0.0
2.0
4.0
6.0
8.0
10.0
12.0
14.0(100 mil. people)
6.0
7.0
8.0
9.0
10.0
11.0
12.0
13.0
100
120
140
160
180
200
220
Real global GDP (Right axis) International tourist arrivals (Left axis)
(100 mil. people) (%)
3
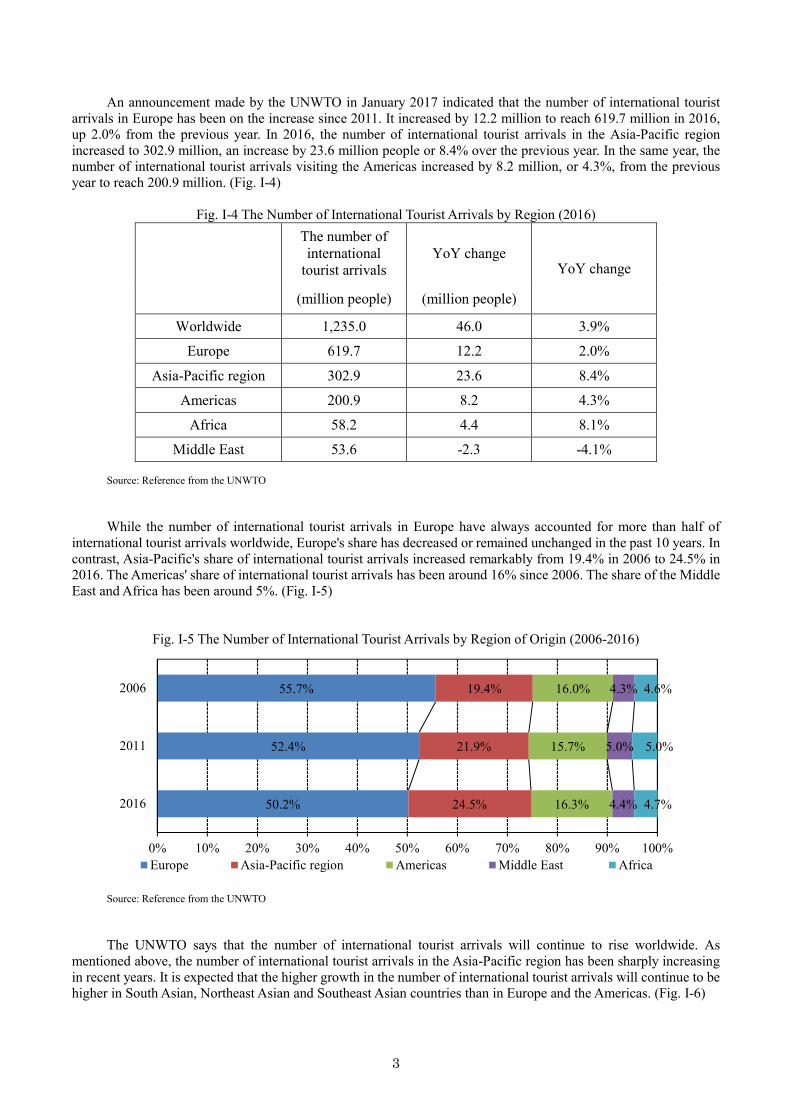
An announcement made by the UNWTO in January 2017 indicated that the number of international tourist arrivals in Europe has been on the increase since 2011. It increased by 12.2 million to reach 619.7 million in 2016, up 2.0% from the previous year. In 2016, the number of international tourist arrivals in the Asia-Pacific region increased to 302.9 million, an increase by 23.6 million people or 8.4% over the previous year. In the same year, the number of international tourist arrivals visiting the Americas increased by 8.2 million, or 4.3%, from the previous year to reach 200.9 million. (Fig. I-4)
Fig. I-4 The Number of International Tourist Arrivals by Region (2016)
The number of international
tourist arrivals YoY change
YoY change
(million people) (million people)
Worldwide 1,235.0 46.0 3.9%
Europe 619.7 12.2 2.0%
Asia-Pacific region 302.9 23.6 8.4%
Americas 200.9 8.2 4.3%
Africa 58.2 4.4 8.1%
Middle East 53.6 -2.3 -4.1%
Source: Reference from the UNWTO
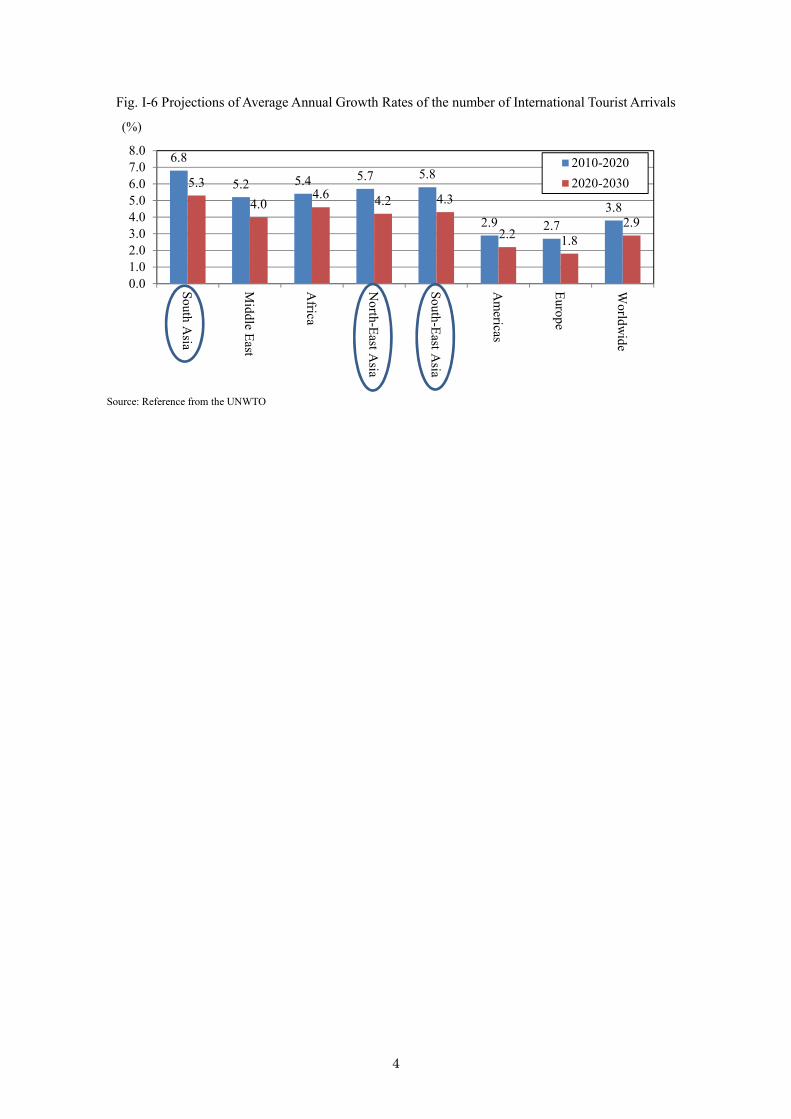
While the number of international tourist arrivals in Europe have always accounted for more than half of international tourist arrivals worldwide, Europe's share has decreased or remained unchanged in the past 10 years. In contrast, Asia-Pacific's share of international tourist arrivals increased remarkably from 19.4% in 2006 to 24.5% in 2016. The Americas' share of international tourist arrivals has been around 16% since 2006. The share of the Middle East and Africa has been around 5%. (Fig. I-5)
Fig. I-5 The Number of International Tourist Arrivals by Region of Origin (2006-2016)
Source: Reference from the UNWTO
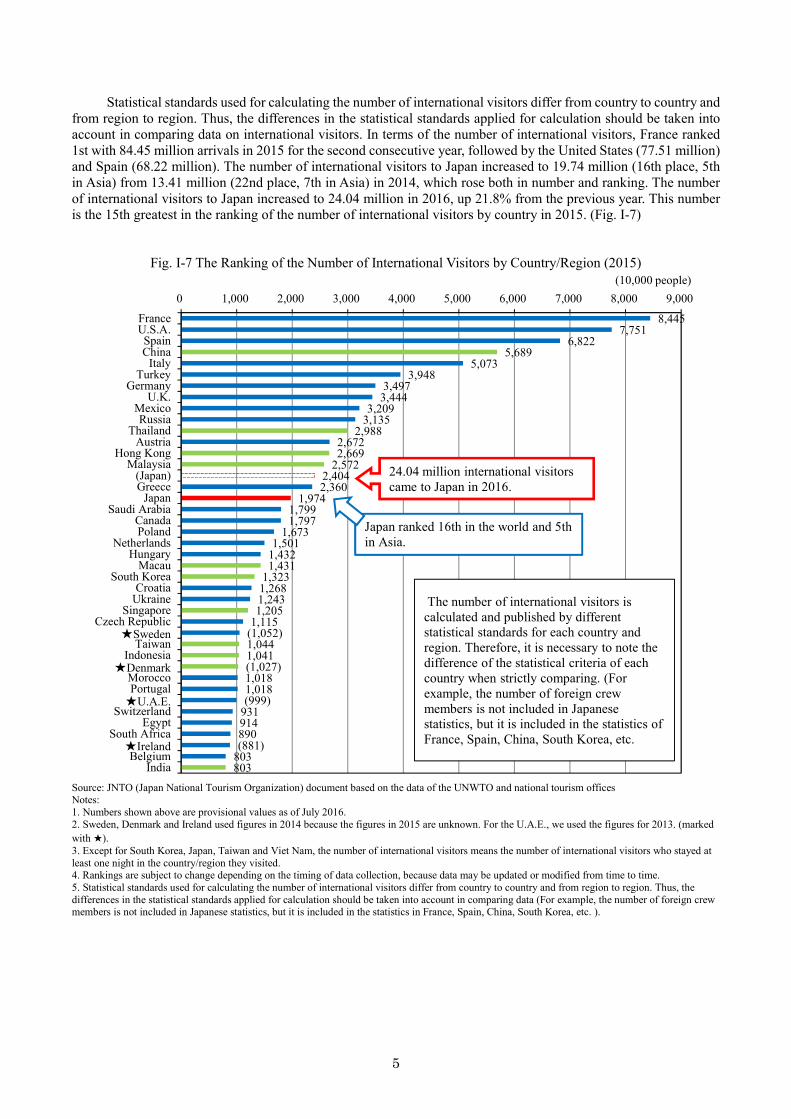
The UNWTO says that the number of international tourist arrivals will continue to rise worldwide. As mentioned above, the number of international tourist arrivals in the Asia-Pacific region has been sharply increasing in recent years. It is expected that the higher growth in the number of international tourist arrivals will continue to be higher in South Asian, Northeast Asian and Southeast Asian countries than in Europe and the Americas. (Fig. I-6)
50.2%
52.4%
55.7%
24.5%
21.9%
19.4%
16.3%
15.7%
16.0%
4.4%
5.0%
4.3%
4.7%
5.0%
4.6%
0% 10% 20% 30% 40% 50% 60% 70% 80% 90% 100%
2016
2011
2006
Europe Asia-Pacific region Americas Middle East Africa
4
Fig. I-6 Projections of Average Annual Growth Rates of the number of International Tourist Arrivals
Source: Reference from the UNWTO
6.8
5.2 5.4 5.7 5.8
2.9 2.73.8
5.34.0
4.6 4.2 4.3
2.2 1.82.9
0.01.02.03.04.05.06.07.08.0
South Asia
Middle East
Africa
North-East A
sia
South-East Asia
Am
ericas
Europe
Worldw
ide2010-20202020-2030
(%)
5
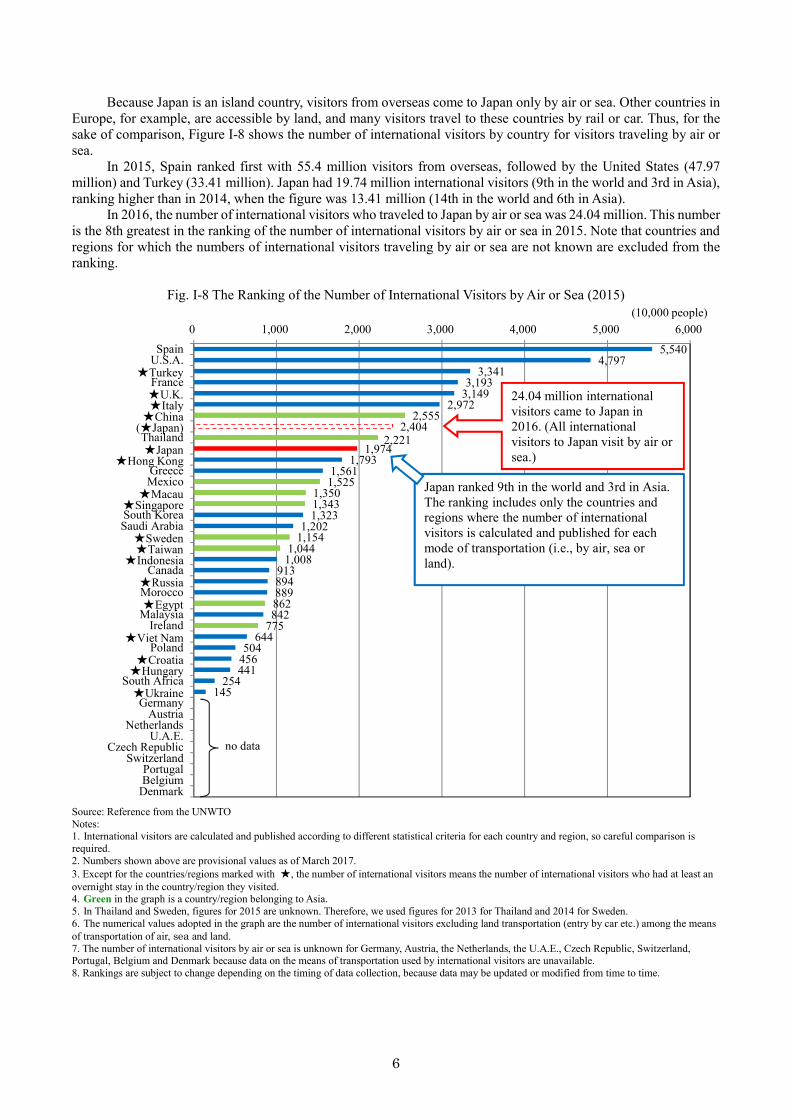
Statistical standards used for calculating the number of international visitors differ from country to country and from region to region. Thus, the differences in the statistical standards applied for calculation should be taken into account in comparing data on international visitors. In terms of the number of international visitors, France ranked 1st with 84.45 million arrivals in 2015 for the second consecutive year, followed by the United States (77.51 million) and Spain (68.22 million). The number of international visitors to Japan increased to 19.74 million (16th place, 5th in Asia) from 13.41 million (22nd place, 7th in Asia) in 2014, which rose both in number and ranking. The number of international visitors to Japan increased to 24.04 million in 2016, up 21.8% from the previous year. This number is the 15th greatest in the ranking of the number of international visitors by country in 2015. (Fig. I-7)
Fig. I-7 The Ranking of the Number of International Visitors by Country/Region (2015)
Source: JNTO (Japan National Tourism Organization) document based on the data of the UNWTO and national tourism offices Notes: 1. Numbers shown above are provisional values as of July 2016. 2. Sweden, Denmark and Ireland used figures in 2014 because the figures in 2015 are unknown. For the U.A.E., we used the figures for 2013. (marked with ★). 3. Except for South Korea, Japan, Taiwan and Viet Nam, the number of international visitors means the number of international visitors who stayed at least one night in the country/region they visited. 4. Rankings are subject to change depending on the timing of data collection, because data may be updated or modified from time to time. 5. Statistical standards used for calculating the number of international visitors differ from country to country and from region to region. Thus, the differences in the statistical standards applied for calculation should be taken into account in comparing data (For example, the number of foreign crew members is not included in Japanese statistics, but it is included in the statistics in France, Spain, China, South Korea, etc. ).
8,445 7,751
6,822 5,689
5,073 3,948
3,497 3,444
3,209 3,135
2,988 2,672 2,669
2,572 2,404 2,360
1,974 1,799 1,797
1,673 1,501
1,432 1,431
1,323 1,268 1,243 1,205
1,115 (1,052)1,044 1,041 (1,027)1,018 1,018 (999)
931 914 890 (881)
803 803
0 1,000 2,000 3,000 4,000 5,000 6,000 7,000 8,000 9,000
FranceU.S.A.SpainChina
ItalyTurkey
GermanyU.K.
MexicoRussia
ThailandAustria
Hong KongMalaysia
(Japan)Greece
JapanSaudi Arabia
CanadaPoland
NetherlandsHungary
MacauSouth Korea
CroatiaUkraine
SingaporeCzech Republic
★SwedenTaiwan
Indonesia★Denmark
MoroccoPortugal★U.A.E.
SwitzerlandEgypt
South Africa★IrelandBelgium
India
(10,000 people)
The number of international visitors is calculated and published by different statistical standards for each country and region. Therefore, it is necessary to note the difference of the statistical criteria of each country when strictly comparing. (For example, the number of foreign crew members is not included in Japanese statistics, but it is included in the statistics of France, Spain, China, South Korea, etc.
24.04 million international visitors came to Japan in 2016.
Japan ranked 16th in the world and 5th in Asia.
6
Because Japan is an island country, visitors from overseas come to Japan only by air or sea. Other countries in Europe, for example, are accessible by land, and many visitors travel to these countries by rail or car. Thus, for the sake of comparison, Figure I-8 shows the number of international visitors by country for visitors traveling by air or sea.
In 2015, Spain ranked first with 55.4 million visitors from overseas, followed by the United States (47.97 million) and Turkey (33.41 million). Japan had 19.74 million international visitors (9th in the world and 3rd in Asia), ranking higher than in 2014, when the figure was 13.41 million (14th in the world and 6th in Asia).
In 2016, the number of international visitors who traveled to Japan by air or sea was 24.04 million. This number is the 8th greatest in the ranking of the number of international visitors by air or sea in 2015. Note that countries and regions for which the numbers of international visitors traveling by air or sea are not known are excluded from the ranking.
Fig. I-8 The Ranking of the Number of International Visitors by Air or Sea (2015)
Source: Reference from the UNWTO Notes: 1. International visitors are calculated and published according to different statistical criteria for each country and region, so careful comparison is required. 2. Numbers shown above are provisional values as of March 2017. 3. Except for the countries/regions marked with ★, the number of international visitors means the number of international visitors who had at least an overnight stay in the country/region they visited. 4. Green in the graph is a country/region belonging to Asia. 5. In Thailand and Sweden, figures for 2015 are unknown. Therefore, we used figures for 2013 for Thailand and 2014 for Sweden. 6. The numerical values adopted in the graph are the number of international visitors excluding land transportation (entry by car etc.) among the means of transportation of air, sea and land. 7. The number of international visitors by air or sea is unknown for Germany, Austria, the Netherlands, the U.A.E., Czech Republic, Switzerland, Portugal, Belgium and Denmark because data on the means of transportation used by international visitors are unavailable. 8. Rankings are subject to change depending on the timing of data collection, because data may be updated or modified from time to time.
5,540 4,797
3,341 3,193
3,149 2,972
2,555 2,404
2,221 1,974
1,793 1,561
1,525 1,350 1,343 1,323
1,202 1,154
1,044 1,008
913 894 889 862 842
775 644
504 456 441
254 145
0 1,000 2,000 3,000 4,000 5,000 6,000Spain
U.S.A.★Turkey
France★U.K.★Italy★China
(★Japan)Thailand★Japan
★Hong KongGreeceMexico★Macau
★SingaporeSouth KoreaSaudi Arabia★Sweden★Taiwan★Indonesia
Canada★RussiaMorocco★Egypt
MalaysiaIreland
★Viet NamPoland
★Croatia★Hungary
South Africa★Ukraine
GermanyAustria
NetherlandsU.A.E.
Czech RepublicSwitzerland
PortugalBelgium
Denmark
(10,000 people)
24.04 million international visitors came to Japan in 2016. (All international visitors to Japan visit by air or sea.)
Japan ranked 9th in the world and 3rd in Asia. The ranking includes only the countries and regions where the number of international visitors is calculated and published for each mode of transportation (i.e., by air, sea or land).
no data
7
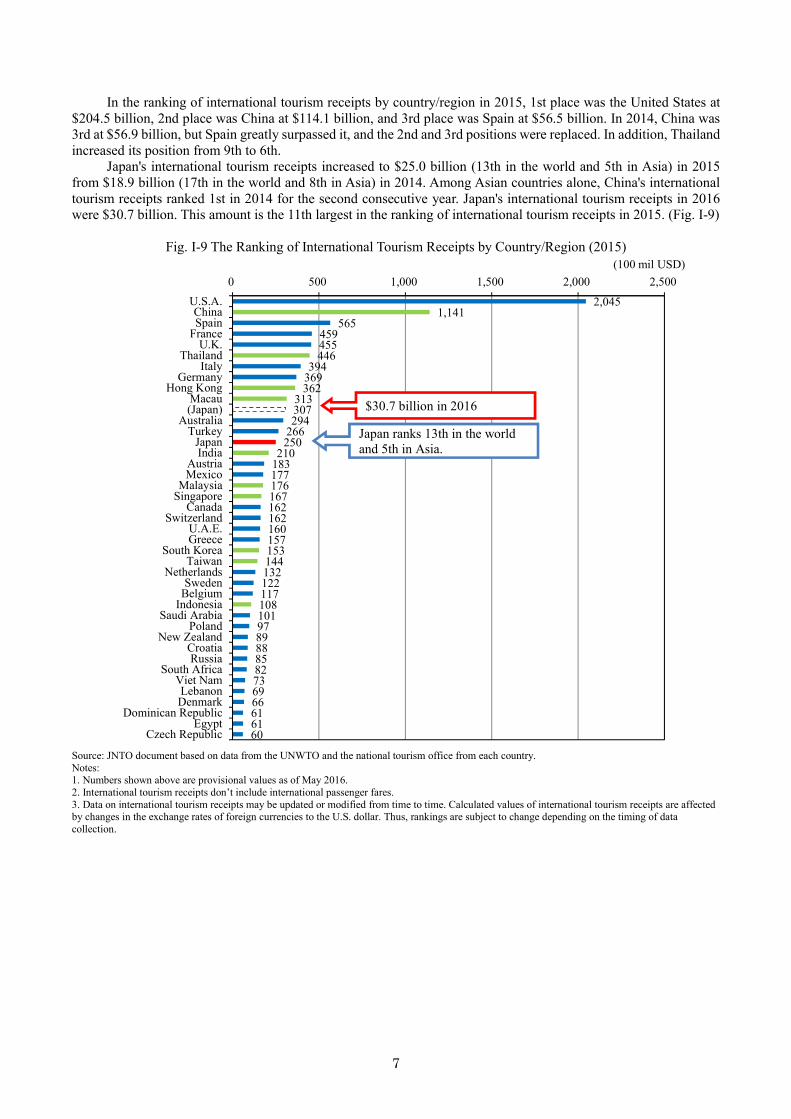
In the ranking of international tourism receipts by country/region in 2015, 1st place was the United States at $204.5 billion, 2nd place was China at $114.1 billion, and 3rd place was Spain at $56.5 billion. In 2014, China was 3rd at $56.9 billion, but Spain greatly surpassed it, and the 2nd and 3rd positions were replaced. In addition, Thailand increased its position from 9th to 6th.
Japan's international tourism receipts increased to $25.0 billion (13th in the world and 5th in Asia) in 2015 from $18.9 billion (17th in the world and 8th in Asia) in 2014. Among Asian countries alone, China's international tourism receipts ranked 1st in 2014 for the second consecutive year. Japan's international tourism receipts in 2016 were $30.7 billion. This amount is the 11th largest in the ranking of international tourism receipts in 2015. (Fig. I-9)
Fig. I-9 The Ranking of International Tourism Receipts by Country/Region (2015)
Source: JNTO document based on data from the UNWTO and the national tourism office from each country. Notes: 1. Numbers shown above are provisional values as of May 2016. 2. International tourism receipts don’t include international passenger fares. 3. Data on international tourism receipts may be updated or modified from time to time. Calculated values of international tourism receipts are affected by changes in the exchange rates of foreign currencies to the U.S. dollar. Thus, rankings are subject to change depending on the timing of data collection.
2,045 1,141
565 459 455 446
394 369 362
313 307 294
266 250
210 183 177 176 167 162 162 160 157 153 144 132 122 117 108 101 97 89 88 85 82 73 69 66 61 61 60
0 500 1,000 1,500 2,000 2,500U.S.A.ChinaSpain
FranceU.K.
ThailandItaly
GermanyHong Kong
Macau(Japan)
AustraliaTurkey
JapanIndia
AustriaMexico
MalaysiaSingapore
CanadaSwitzerland
U.A.E.Greece
South KoreaTaiwan
NetherlandsSweden
BelgiumIndonesia
Saudi ArabiaPoland
New ZealandCroatiaRussia
South AfricaViet NamLebanonDenmark
Dominican RepublicEgypt
Czech Republic
(100 mil USD)
Japan ranks 13th in the world and 5th in Asia.
$30.7 billion in 2016
8
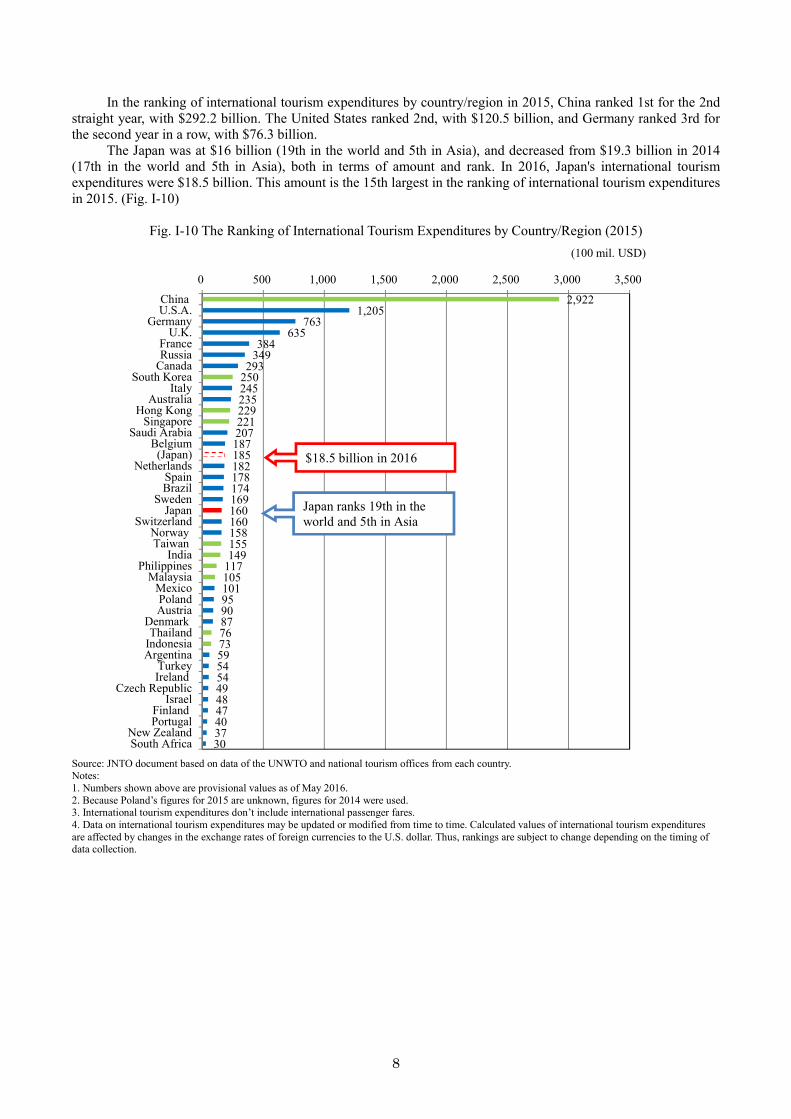
In the ranking of international tourism expenditures by country/region in 2015, China ranked 1st for the 2nd straight year, with $292.2 billion. The United States ranked 2nd, with $120.5 billion, and Germany ranked 3rd for the second year in a row, with $76.3 billion.
The Japan was at $16 billion (19th in the world and 5th in Asia), and decreased from $19.3 billion in 2014 (17th in the world and 5th in Asia), both in terms of amount and rank. In 2016, Japan's international tourism expenditures were $18.5 billion. This amount is the 15th largest in the ranking of international tourism expenditures in 2015. (Fig. I-10)
Fig. I-10 The Ranking of International Tourism Expenditures by Country/Region (2015)
Source: JNTO document based on data of the UNWTO and national tourism offices from each country. Notes: 1. Numbers shown above are provisional values as of May 2016. 2. Because Poland’s figures for 2015 are unknown, figures for 2014 were used. 3. International tourism expenditures don’t include international passenger fares. 4. Data on international tourism expenditures may be updated or modified from time to time. Calculated values of international tourism expenditures are affected by changes in the exchange rates of foreign currencies to the U.S. dollar. Thus, rankings are subject to change depending on the timing of data collection.
2,922 1,205
763 635
384 349
293 250 245 235 229 221 207 187 185 182 178 174 169 160 160 158 155 149
117 105 101 95 90 87 76 73 59 54 54 4948 47 40 37 30
0 500 1,000 1,500 2,000 2,500 3,000 3,500ChinaU.S.A.
Germany U.K.
France RussiaCanada
South KoreaItaly
AustraliaHong Kong
Singapore Saudi Arabia
Belgium(Japan)
NetherlandsSpainBrazil
SwedenJapan
SwitzerlandNorwayTaiwan
IndiaPhilippines
MalaysiaMexicoPoland
Austria Denmark
Thailand IndonesiaArgentina
TurkeyIreland
Czech RepublicIsrael
FinlandPortugal
New ZealandSouth Africa
(100 mil. USD)
Japan ranks 19th in the world and 5th in Asia
$18.5 billion in 2016
9
Chapter 2 Tourism Trends in Japan
According to “The Japanese Economy 2016-2017,” released by the Cabinet Office in January 2017, while the employment and acquisition environments continue to improve, the Japanese economy continues its moderate recovery trend, focused on production, reflecting improvements in business conditions. Also, while personal consumption saw a downward trend due to temporary factors such as the Kumamoto earthquake in 2016 (hereinafter referred to as the Kumamoto earthquake) and the higher than usual number of typhoons making landfall in the summer, there has been some improvement seen since the fall of 2016.
In March 2016, we began to move toward a new goal, which was discussed at the “Meeting of the Concil for a Tourism Vision to Support the Future of Japan” In May, the G7 summit was held in Ise-shima, attracting attention from the world and increasing recognition. After the summit, the President of the United States of America, Barack Obama, visited Hiroshima. It was the first time that an incumbent president of the United States visited a place where an atomic bomb was dropped.
The transportation infrastructure in 2016 expanded in March, with the opening of the Hokkaido Shinkansen, connecting Tokyo and Hakodate in the shortest time of 4 hours and 2 minutes. In April, the country's largest highway bus terminal, “Shinjuku Expressway Bus Terminal,” opened. In terms of airports, Kansai International Airport expanded with the terminal 2 building exclusively for LCCs. In January 2017, terminal 2 (international) opened, and the development of an environment for using highway buses and LCCs moved forward.
On the other hand, the Kumamoto earthquake occurred in April, and there was major damage to tourist facilities such as Kumamoto Castle and accommodation facilities. In August, 4 typhoons made landfall in Hokkaido and the Tohoku region, and then 2 typhoons made landfall in September, causing significant damage to the Kyushu and Shikoku regions. It was a year that many natural disasters occurred.
Section 1 Travel to Japan 1 Travel to Japan
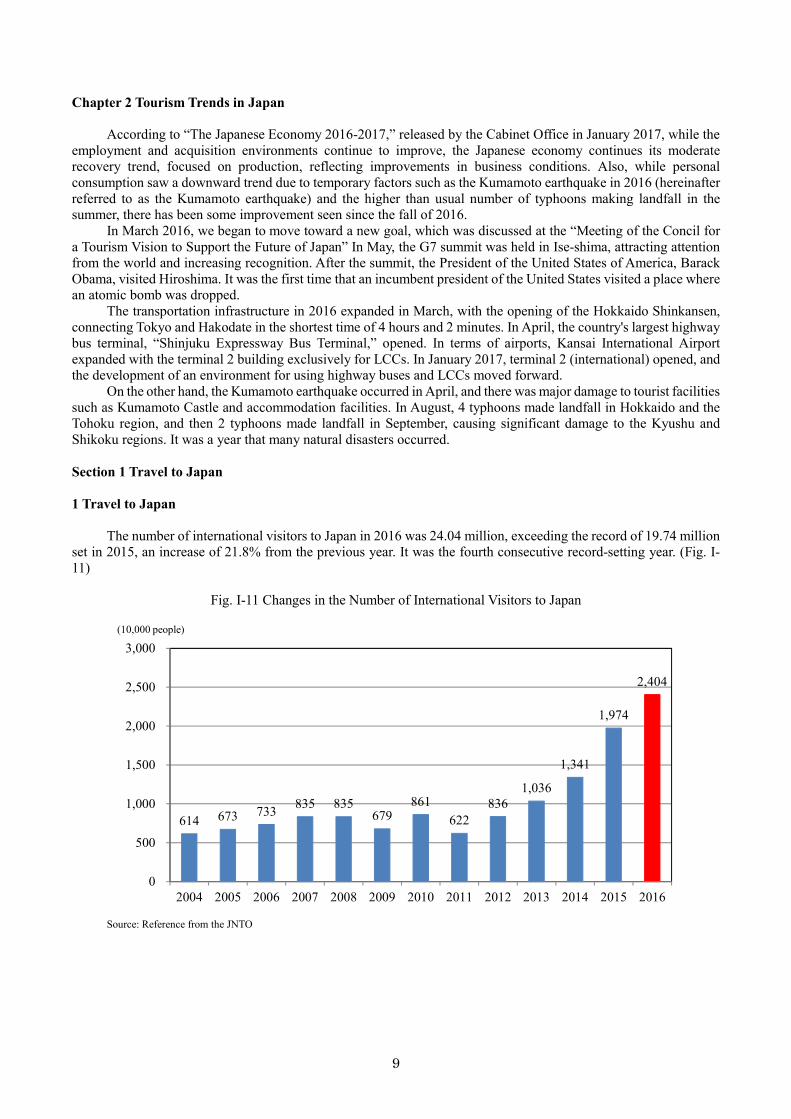
The number of international visitors to Japan in 2016 was 24.04 million, exceeding the record of 19.74 million set in 2015, an increase of 21.8% from the previous year. It was the fourth consecutive record-setting year. (Fig. I-11)
Fig. I-11 Changes in the Number of International Visitors to Japan
Source: Reference from the JNTO
614 673 733 835 835 679
861 622
836 1,036
1,341
1,974
2,404
0
500
1,000
1,500
2,000
2,500
3,000
2004 2005 2006 2007 2008 2009 2010 2011 2012 2013 2014 2015 2016
(10,000 people)
10
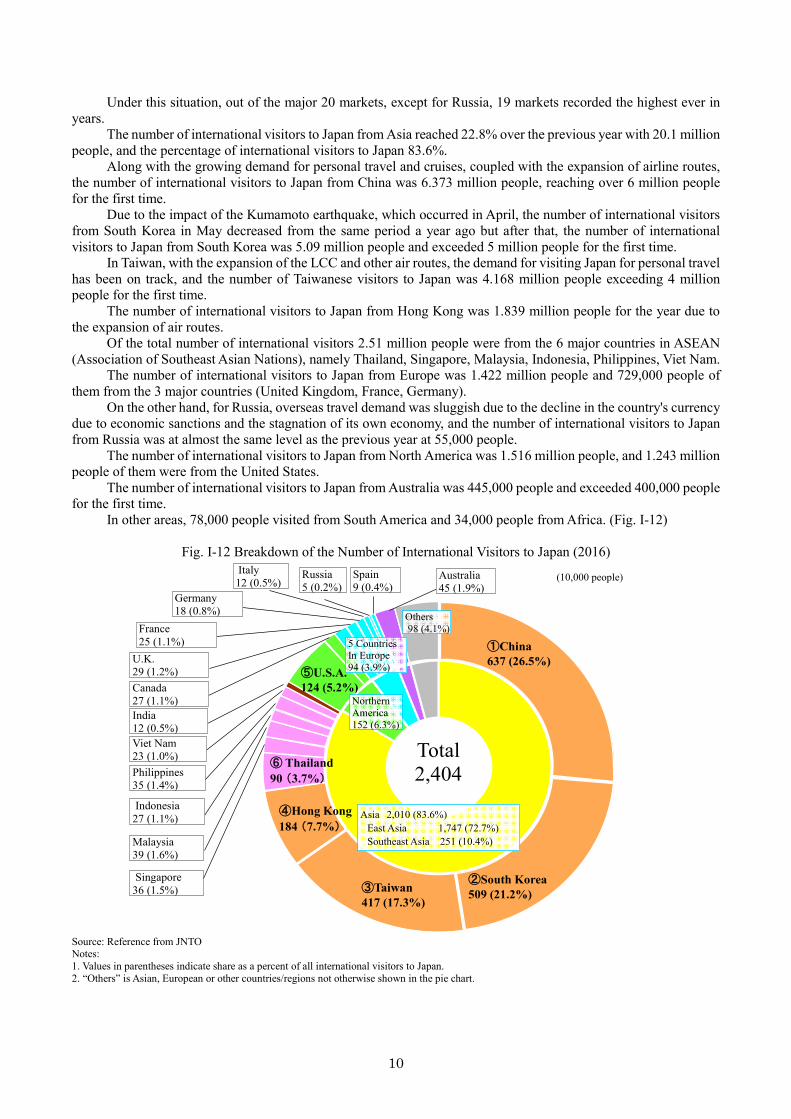
Under this situation, out of the major 20 markets, except for Russia, 19 markets recorded the highest ever in years.
The number of international visitors to Japan from Asia reached 22.8% over the previous year with 20.1 million people, and the percentage of international visitors to Japan 83.6%.
Along with the growing demand for personal travel and cruises, coupled with the expansion of airline routes, the number of international visitors to Japan from China was 6.373 million people, reaching over 6 million people for the first time.
Due to the impact of the Kumamoto earthquake, which occurred in April, the number of international visitors from South Korea in May decreased from the same period a year ago but after that, the number of international visitors to Japan from South Korea was 5.09 million people and exceeded 5 million people for the first time.
In Taiwan, with the expansion of the LCC and other air routes, the demand for visiting Japan for personal travel has been on track, and the number of Taiwanese visitors to Japan was 4.168 million people exceeding 4 million people for the first time.
The number of international visitors to Japan from Hong Kong was 1.839 million people for the year due to the expansion of air routes.
Of the total number of international visitors 2.51 million people were from the 6 major countries in ASEAN (Association of Southeast Asian Nations), namely Thailand, Singapore, Malaysia, Indonesia, Philippines, Viet Nam.
The number of international visitors to Japan from Europe was 1.422 million people and 729,000 people of them from the 3 major countries (United Kingdom, France, Germany).
On the other hand, for Russia, overseas travel demand was sluggish due to the decline in the country's currency due to economic sanctions and the stagnation of its own economy, and the number of international visitors to Japan from Russia was at almost the same level as the previous year at 55,000 people.
The number of international visitors to Japan from North America was 1.516 million people, and 1.243 million people of them were from the United States.
The number of international visitors to Japan from Australia was 445,000 people and exceeded 400,000 people for the first time.
In other areas, 78,000 people visited from South America and 34,000 people from Africa. (Fig. I-12)
Fig. I-12 Breakdown of the Number of International Visitors to Japan (2016)
Source: Reference from JNTO Notes: 1. Values in parentheses indicate share as a percent of all international visitors to Japan. 2. “Others” is Asian, European or other countries/regions not otherwise shown in the pie chart.
Philippines35 (1.4%)
Total2,404
Asia 2,010 (83.6%)East Asia 1,747 (72.7%)Southeast Asia 251 (10.4%)
⑤U.S.A.124 (5.2%)
④Hong Kong 184 (7.7%)
③Taiwan417 (17.3%)
Others98 (4.1%)
5 CountriesIn Europe94 (3.9%)
Northern America152 (6.3%)
Indonesia27 (1.1%)
Australia45 (1.9%)
Spain9 (0.4%)
U.K.29 (1.2%)Canada27 (1.1%)
Viet Nam23 (1.0%)
Singapore36 (1.5%)
Malaysia39 (1.6%)
India12 (0.5%)
⑥ Thailand90 (3.7%)
France25 (1.1%)
Germany18 (0.8%)
Russia5 (0.2%)
①China637 (26.5%)
②South Korea509 (21.2%)
Italy12 (0.5%) (10,000 people)
11
The reason why the number of international visitors to Japan has increased steadily is that tourism is regarded as the pillar of Japan's economic growth strategy, and one of the main components of the regional revitalization. Other reasons include the implementation of bold initiatives that have never been done before, such as visa relaxation, consumption tax exemption for international visitors, improving the acceptance environment through multilingual notation and enhancing the CIQ system, all brought about through promotions resulting from cooperation between the Japan National Tourism Organization (JNTO) and other tourism officials.
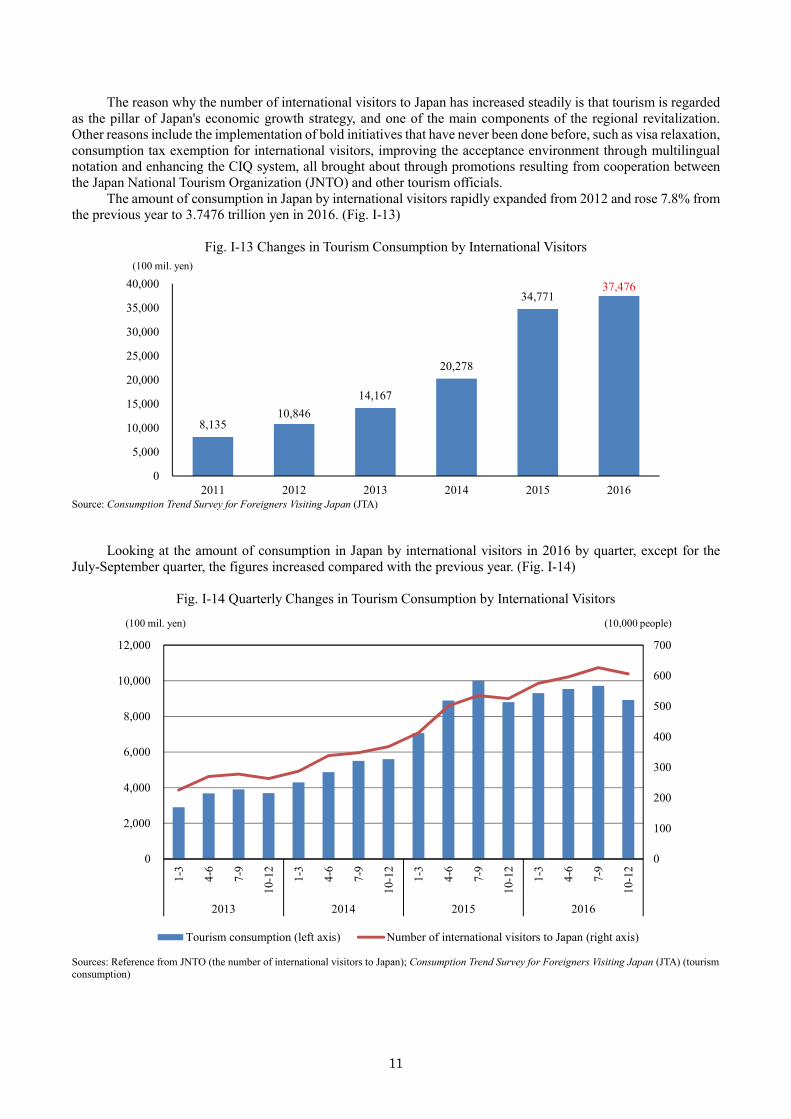
The amount of consumption in Japan by international visitors rapidly expanded from 2012 and rose 7.8% from the previous year to 3.7476 trillion yen in 2016. (Fig. I-13)
Fig. I-13 Changes in Tourism Consumption by International Visitors
Source: Consumption Trend Survey for Foreigners Visiting Japan (JTA)
Looking at the amount of consumption in Japan by international visitors in 2016 by quarter, except for the
July-September quarter, the figures increased compared with the previous year. (Fig. I-14)
Fig. I-14 Quarterly Changes in Tourism Consumption by International Visitors
Sources: Reference from JNTO (the number of international visitors to Japan); Consumption Trend Survey for Foreigners Visiting Japan (JTA) (tourism consumption)
8,135 10,846
14,167
20,278
34,771 37,476
0
5,000
10,000
15,000
20,000
25,000
30,000
35,000
40,000
2011 2012 2013 2014 2015 2016
(100 mil. yen)
0
100
200
300
400
500
600
700
0
2,000
4,000
6,000
8,000
10,000
12,000
1-3
4-6
7-9
10-1
2
1-3
4-6
7-9
10-1
2
1-3
4-6
7-9
10-1
2
1-3
4-6
7-9
10-1
2
2013 2014 2015 2016
Tourism consumption (left axis) Number of international visitors to Japan (right axis)
(10,000 people)(100 mil. yen)
12
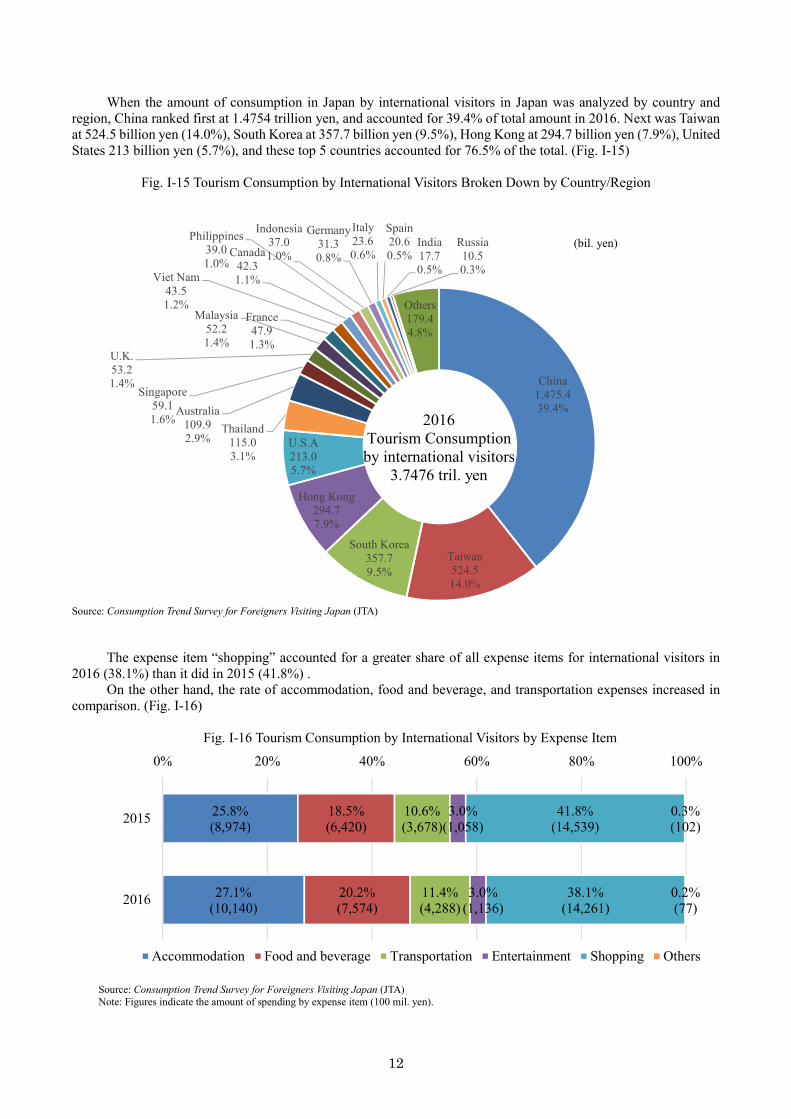
When the amount of consumption in Japan by international visitors in Japan was analyzed by country and region, China ranked first at 1.4754 trillion yen, and accounted for 39.4% of total amount in 2016. Next was Taiwan at 524.5 billion yen (14.0%), South Korea at 357.7 billion yen (9.5%), Hong Kong at 294.7 billion yen (7.9%), United States 213 billion yen (5.7%), and these top 5 countries accounted for 76.5% of the total. (Fig. I-15)
Fig. I-15 Tourism Consumption by International Visitors Broken Down by Country/Region
Source: Consumption Trend Survey for Foreigners Visiting Japan (JTA)
The expense item “shopping” accounted for a greater share of all expense items for international visitors in 2016 (38.1%) than it did in 2015 (41.8%) .
On the other hand, the rate of accommodation, food and beverage, and transportation expenses increased in comparison. (Fig. I-16)
Fig. I-16 Tourism Consumption by International Visitors by Expense Item
Source: Consumption Trend Survey for Foreigners Visiting Japan (JTA) Note: Figures indicate the amount of spending by expense item (100 mil. yen).
China1,475.439.4%
Taiwan524.514.0%
South Korea357.79.5%
Hong Kong294.77.9%
U.S.A213.05.7%
Thailand115.03.1%
Australia109.92.9%
Singapore59.11.6%
U.K.53.21.4%
Malaysia52.21.4%
France47.91.3%
Viet Nam43.51.2%
Canada42.31.1%
Philippines39.01.0%
Indonesia37.01.0%
Germany31.30.8%
Italy23.60.6%
Spain20.60.5%
India17.70.5%
Russia10.50.3%
Others179.44.8%
2016Tourism Consumptionby international visitors
3.7476 tril. yen
25.8%(8,974)
27.1%(10,140)
18.5%(6,420)
20.2%(7,574)
10.6%(3,678)
11.4%(4,288)
3.0%(1,058)
3.0%(1,136)
41.8%(14,539)
38.1%(14,261)
0.3%(102)
0.2%(77)
0% 20% 40% 60% 80% 100%
2015
2016
Accommodation Food and beverage Transportation Entertainment Shopping Others
(bil. yen)
13
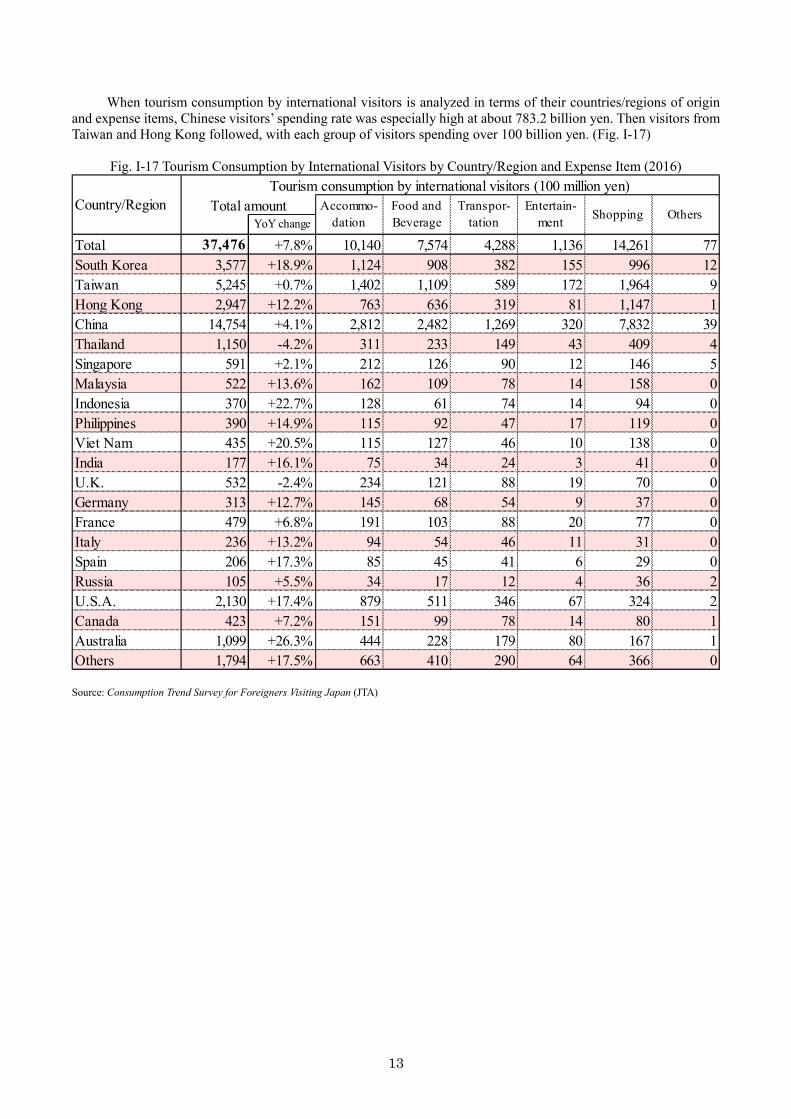
When tourism consumption by international visitors is analyzed in terms of their countries/regions of origin and expense items, Chinese visitors’ spending rate was especially high at about 783.2 billion yen. Then visitors from Taiwan and Hong Kong followed, with each group of visitors spending over 100 billion yen. (Fig. I-17)
Fig. I-17 Tourism Consumption by International Visitors by Country/Region and Expense Item (2016)
Source: Consumption Trend Survey for Foreigners Visiting Japan (JTA)
YoY change
Total 37,476 +7.8% 10,140 7,574 4,288 1,136 14,261 77South Korea 3,577 +18.9% 1,124 908 382 155 996 12Taiwan 5,245 +0.7% 1,402 1,109 589 172 1,964 9Hong Kong 2,947 +12.2% 763 636 319 81 1,147 1China 14,754 +4.1% 2,812 2,482 1,269 320 7,832 39Thailand 1,150 -4.2% 311 233 149 43 409 4Singapore 591 +2.1% 212 126 90 12 146 5Malaysia 522 +13.6% 162 109 78 14 158 0Indonesia 370 +22.7% 128 61 74 14 94 0Philippines 390 +14.9% 115 92 47 17 119 0Viet Nam 435 +20.5% 115 127 46 10 138 0India 177 +16.1% 75 34 24 3 41 0U.K. 532 -2.4% 234 121 88 19 70 0Germany 313 +12.7% 145 68 54 9 37 0France 479 +6.8% 191 103 88 20 77 0Italy 236 +13.2% 94 54 46 11 31 0Spain 206 +17.3% 85 45 41 6 29 0Russia 105 +5.5% 34 17 12 4 36 2U.S.A. 2,130 +17.4% 879 511 346 67 324 2Canada 423 +7.2% 151 99 78 14 80 1Australia 1,099 +26.3% 444 228 179 80 167 1Others 1,794 +17.5% 663 410 290 64 366 0
Country/RegionTourism consumption by international visitors (100 million yen)
Total amount Accommo-dation
Food andBeverage
Transpor-tation
Entertain-ment Shopping Others
14
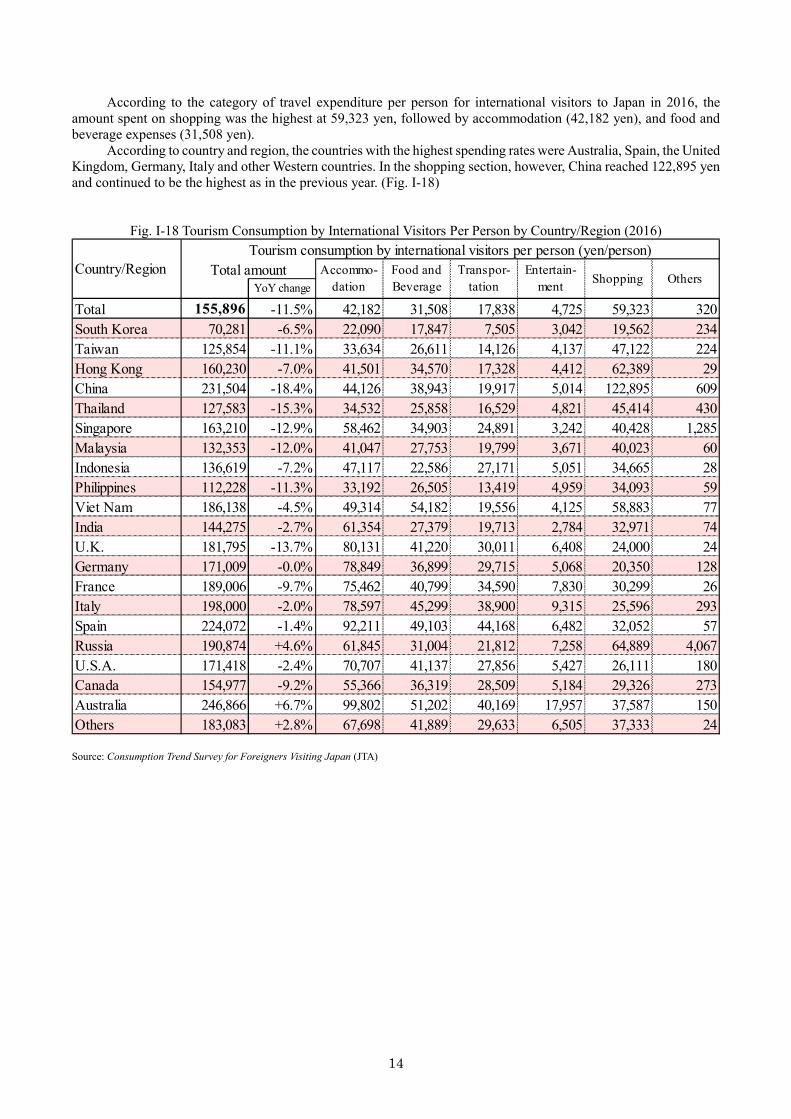
According to the category of travel expenditure per person for international visitors to Japan in 2016, the amount spent on shopping was the highest at 59,323 yen, followed by accommodation (42,182 yen), and food and beverage expenses (31,508 yen).
According to country and region, the countries with the highest spending rates were Australia, Spain, the United Kingdom, Germany, Italy and other Western countries. In the shopping section, however, China reached 122,895 yen and continued to be the highest as in the previous year. (Fig. I-18)
Fig. I-18 Tourism Consumption by International Visitors Per Person by Country/Region (2016)
Source: Consumption Trend Survey for Foreigners Visiting Japan (JTA)
YoY change
Total 155,896 -11.5% 42,182 31,508 17,838 4,725 59,323 320South Korea 70,281 -6.5% 22,090 17,847 7,505 3,042 19,562 234Taiwan 125,854 -11.1% 33,634 26,611 14,126 4,137 47,122 224Hong Kong 160,230 -7.0% 41,501 34,570 17,328 4,412 62,389 29China 231,504 -18.4% 44,126 38,943 19,917 5,014 122,895 609Thailand 127,583 -15.3% 34,532 25,858 16,529 4,821 45,414 430Singapore 163,210 -12.9% 58,462 34,903 24,891 3,242 40,428 1,285Malaysia 132,353 -12.0% 41,047 27,753 19,799 3,671 40,023 60Indonesia 136,619 -7.2% 47,117 22,586 27,171 5,051 34,665 28Philippines 112,228 -11.3% 33,192 26,505 13,419 4,959 34,093 59Viet Nam 186,138 -4.5% 49,314 54,182 19,556 4,125 58,883 77India 144,275 -2.7% 61,354 27,379 19,713 2,784 32,971 74U.K. 181,795 -13.7% 80,131 41,220 30,011 6,408 24,000 24Germany 171,009 -0.0% 78,849 36,899 29,715 5,068 20,350 128France 189,006 -9.7% 75,462 40,799 34,590 7,830 30,299 26Italy 198,000 -2.0% 78,597 45,299 38,900 9,315 25,596 293Spain 224,072 -1.4% 92,211 49,103 44,168 6,482 32,052 57Russia 190,874 +4.6% 61,845 31,004 21,812 7,258 64,889 4,067U.S.A. 171,418 -2.4% 70,707 41,137 27,856 5,427 26,111 180Canada 154,977 -9.2% 55,366 36,319 28,509 5,184 29,326 273Australia 246,866 +6.7% 99,802 51,202 40,169 17,957 37,587 150Others 183,083 +2.8% 67,698 41,889 29,633 6,505 37,333 24
Country/RegionTourism consumption by international visitors per person (yen/person)
Total amount Accommo-dation
Food andBeverage
Transpor-tation
Entertain-ment Shopping Others
15
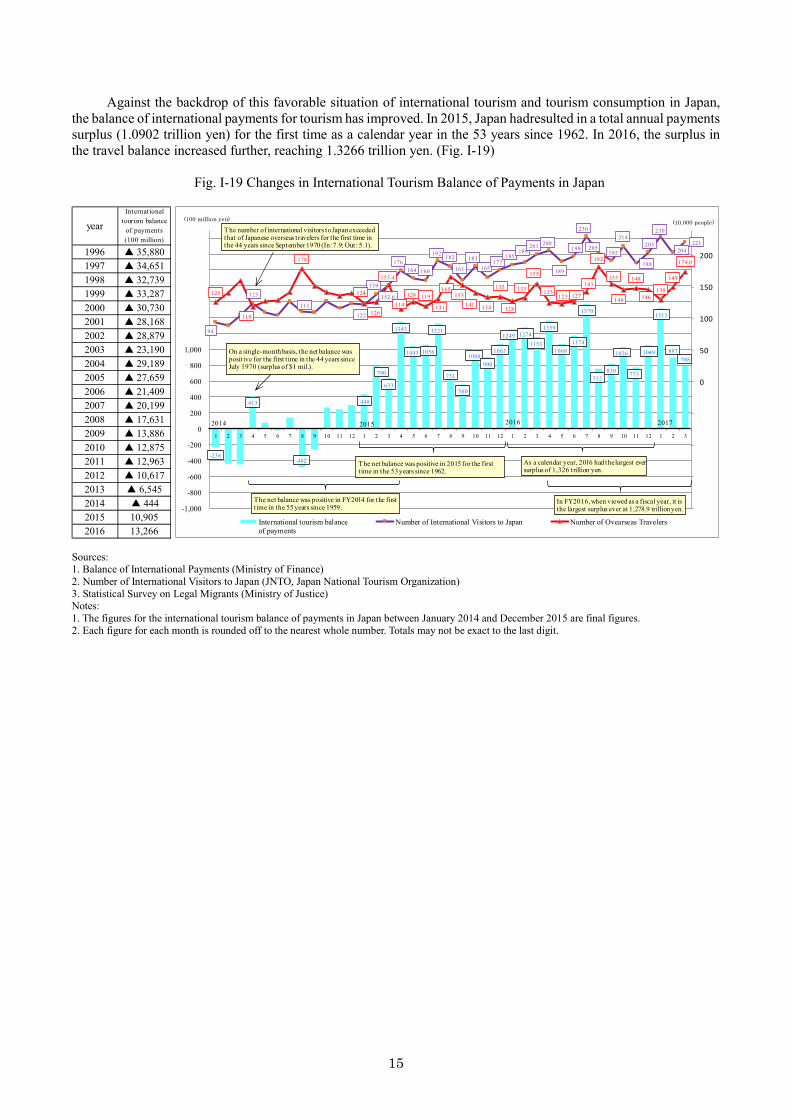
Against the backdrop of this favorable situation of international tourism and tourism consumption in Japan, the balance of international payments for tourism has improved. In 2015, Japan hadresulted in a total annual payments surplus (1.0902 trillion yen) for the first time as a calendar year in the 53 years since 1962. In 2016, the surplus in the travel balance increased further, reaching 1.3266 trillion yen. (Fig. I-19)
Fig. I-19 Changes in International Tourism Balance of Payments in Japan
Sources: 1. Balance of International Payments (Ministry of Finance) 2. Number of International Visitors to Japan (JNTO, Japan National Tourism Organization) 3. Statistical Survey on Legal Migrants (Ministry of Justice) Notes: 1. The figures for the international tourism balance of payments in Japan between January 2014 and December 2015 are final figures. 2. Each figure for each month is rounded off to the nearest whole number. Totals may not be exact to the last digit.
yearInternational
tourism balanceof payments(100 million)
1996 ▲ 35,8801997 ▲ 34,6511998 ▲ 32,7391999 ▲ 33,2872000 ▲ 30,7302001 ▲ 28,1682002 ▲ 28,8792003 ▲ 23,1902004 ▲ 29,1892005 ▲ 27,6592006 ▲ 21,4092007 ▲ 20,1992008 ▲ 17,6312009 ▲ 13,8862010 ▲ 12,8752011 ▲ 12,9632012 ▲ 10,6172013 ▲ 6,5452014 ▲ 4442015 10,9052016 13,266
-236
413
-482
440
790
633
1343
1043 1056
1321
751
560
1000 900
1065
1249 1274
1153
1359
1068 1174
1570
752 820
1026
773
1049
1513
897 788
94
123
111
122
139
152.6
176 164 160
192 182
161
183
165 177
185 189
201 208
189
199
230
205 192
214
188
205
230
204 221
125
119
178
124
126
153.4
114
126 119
131
165 153
141 134
135
128
133
155
125 123.3127
143
182
155
146
148
146 130
149
174.0
-200
-150
-100
-50
0
50
100
150
200
-1,000
-800
-600
-400
-200
0
200
400
600
800
1,000
1,200
1,400
1,600
1,800
2,000
2,200
2,400
1 2 3 4 5 6 7 8 9 10 11 12 1 2 3 4 5 6 7 8 9 10 11 12 1 2 3 4 5 6 7 8 9 10 11 12 1 2 3
International tourism balanceof payments
Number of International Visitors to Japan Number of Ovearseas Travelers
As a calendar year, 2016 had the largest ever surplus of 1,326 trillion yen.
(100 million yen) (10,000 people)The number of international visitors to Japan exceeded that of Japanese overseas travelers for the first time in the 44 years since September 1970 (In: 7.9; Out: 5.1).
On a single-month basis, the net balance was positive for the first t ime in the 44 years since July 1970 (surplus of $1 mil.).
2014 2015 2016
The net balance was positive in 2015 for the first t ime in the 53 years since 1962.
The net balance was positive in FY2014 for the first time in the 55 years since 1959.
In FY2016, when viewed as a fiscal year, it is the largest surplus ever at 1,278.9 trillion yen.
2017
16
2 International Conferences and Exhibitions Held in Japan (1) International conferences
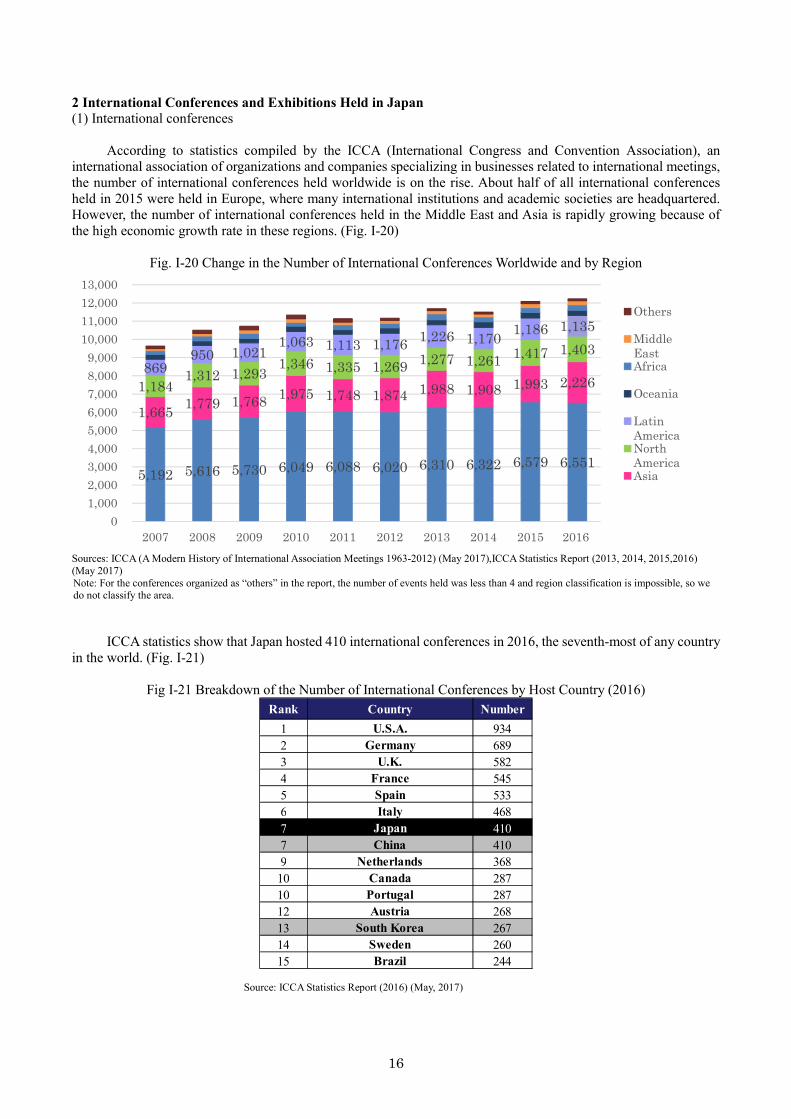
According to statistics compiled by the ICCA (International Congress and Convention Association), an international association of organizations and companies specializing in businesses related to international meetings, the number of international conferences held worldwide is on the rise. About half of all international conferences held in 2015 were held in Europe, where many international institutions and academic societies are headquartered. However, the number of international conferences held in the Middle East and Asia is rapidly growing because of the high economic growth rate in these regions. (Fig. I-20)
Fig. I-20 Change in the Number of International Conferences Worldwide and by Region
Sources: ICCA (A Modern History of International Association Meetings 1963-2012) (May 2017),ICCA Statistics Report (2013, 2014, 2015,2016) (May 2017) Note: For the conferences organized as “others” in the report, the number of events held was less than 4 and region classification is impossible, so we do not classify the area.
ICCA statistics show that Japan hosted 410 international conferences in 2016, the seventh-most of any country
in the world. (Fig. I-21)
Fig I-21 Breakdown of the Number of International Conferences by Host Country (2016)
Source: ICCA Statistics Report (2016) (May, 2017)
5,192 5,616 5,730 6,049 6,088 6,020 6,310 6,322 6,579 6,551
1,665 1,779 1,768 1,975 1,748 1,874 1,988 1,908 1,993 2,226 1,184 1,312 1,293 1,346 1,335 1,269 1,277 1,261 1,417 1,403
869 950 1,021
1,063 1,113 1,176 1,226 1,170 1,186 1,135
01,0002,0003,0004,0005,0006,0007,0008,0009,000
10,00011,00012,00013,000
2007 2008 2009 2010 2011 2012 2013 2014 2015 2016
Others
MiddleEastAfrica
Oceania
LatinAmericaNorthAmericaAsia
Rank Country Number1 U.S.A. 9342 Germany 6893 U.K. 5824 France 5455 Spain 5336 Italy 4687 Japan 4107 China 4109 Netherlands 368
10 Canada 28710 Portugal 28712 Austria 26813 South Korea 26714 Sweden 26015 Brazil 244
17
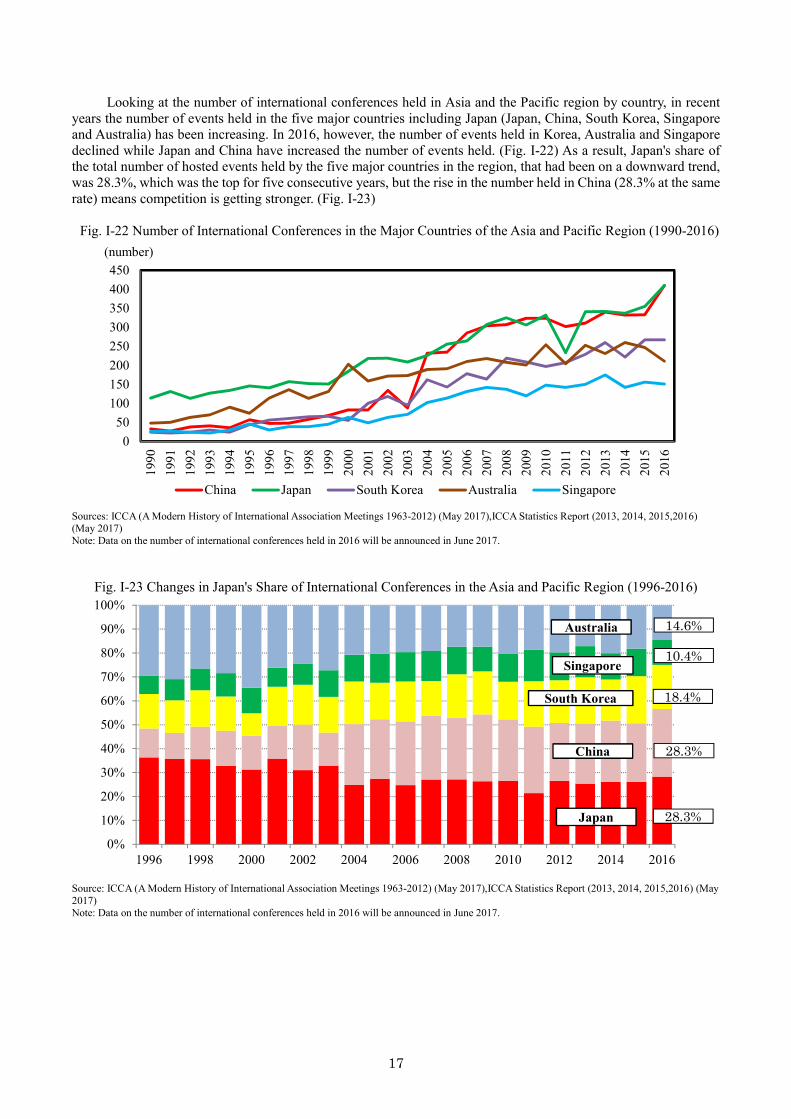
Looking at the number of international conferences held in Asia and the Pacific region by country, in recent years the number of events held in the five major countries including Japan (Japan, China, South Korea, Singapore and Australia) has been increasing. In 2016, however, the number of events held in Korea, Australia and Singapore declined while Japan and China have increased the number of events held. (Fig. I-22) As a result, Japan's share of the total number of hosted events held by the five major countries in the region, that had been on a downward trend, was 28.3%, which was the top for five consecutive years, but the rise in the number held in China (28.3% at the same rate) means competition is getting stronger. (Fig. I-23)
Fig. I-22 Number of International Conferences in the Major Countries of the Asia and Pacific Region (1990-2016)
Sources: ICCA (A Modern History of International Association Meetings 1963-2012) (May 2017),ICCA Statistics Report (2013, 2014, 2015,2016) (May 2017) Note: Data on the number of international conferences held in 2016 will be announced in June 2017.
Fig. I-23 Changes in Japan's Share of International Conferences in the Asia and Pacific Region (1996-2016)
Source: ICCA (A Modern History of International Association Meetings 1963-2012) (May 2017),ICCA Statistics Report (2013, 2014, 2015,2016) (May 2017) Note: Data on the number of international conferences held in 2016 will be announced in June 2017.
050
100150200250300350400450
1990
1991
1992
1993
1994
1995
1996
1997
1998
1999
2000
2001
2002
2003
2004
2005
2006
2007
2008
2009
2010
2011
2012
2013
2014
2015
2016
(number)
China Japan South Korea Australia Singapore
0%
10%
20%
30%
40%
50%
60%
70%
80%
90%
100%
1996 1998 2000 2002 2004 2006 2008 2010 2012 2014 2016
28.3%
28.3%
18.4%
10.4%
14.6%
Singapore
South Korea
China
Japan
Australia
18
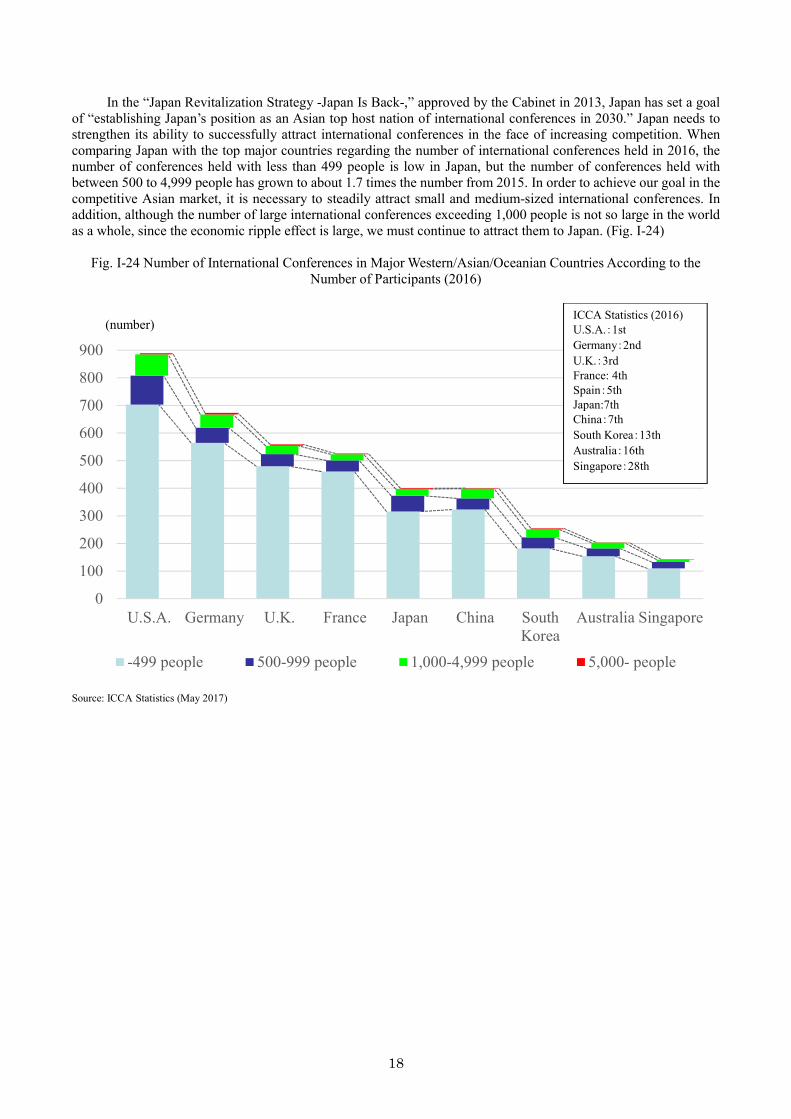
In the “Japan Revitalization Strategy -Japan Is Back-,” approved by the Cabinet in 2013, Japan has set a goal of “establishing Japan’s position as an Asian top host nation of international conferences in 2030.” Japan needs to strengthen its ability to successfully attract international conferences in the face of increasing competition. When comparing Japan with the top major countries regarding the number of international conferences held in 2016, the number of conferences held with less than 499 people is low in Japan, but the number of conferences held with between 500 to 4,999 people has grown to about 1.7 times the number from 2015. In order to achieve our goal in the competitive Asian market, it is necessary to steadily attract small and medium-sized international conferences. In addition, although the number of large international conferences exceeding 1,000 people is not so large in the world as a whole, since the economic ripple effect is large, we must continue to attract them to Japan. (Fig. I-24)
Fig. I-24 Number of International Conferences in Major Western/Asian/Oceanian Countries According to the
Number of Participants (2016)
Source: ICCA Statistics (May 2017)
0
100
200
300
400
500
600
700
800
900
U.S.A. Germany U.K. France Japan China SouthKorea
Australia Singapore
-499 people 500-999 people 1,000-4,999 people 5,000- people
ICCA Statistics (2016) U.S.A.:1stGermany:2ndU.K.:3rdFrance: 4thSpain:5thJapan:7thChina:7thSouth Korea:13thAustralia:16thSingapore:28th
(number)
19
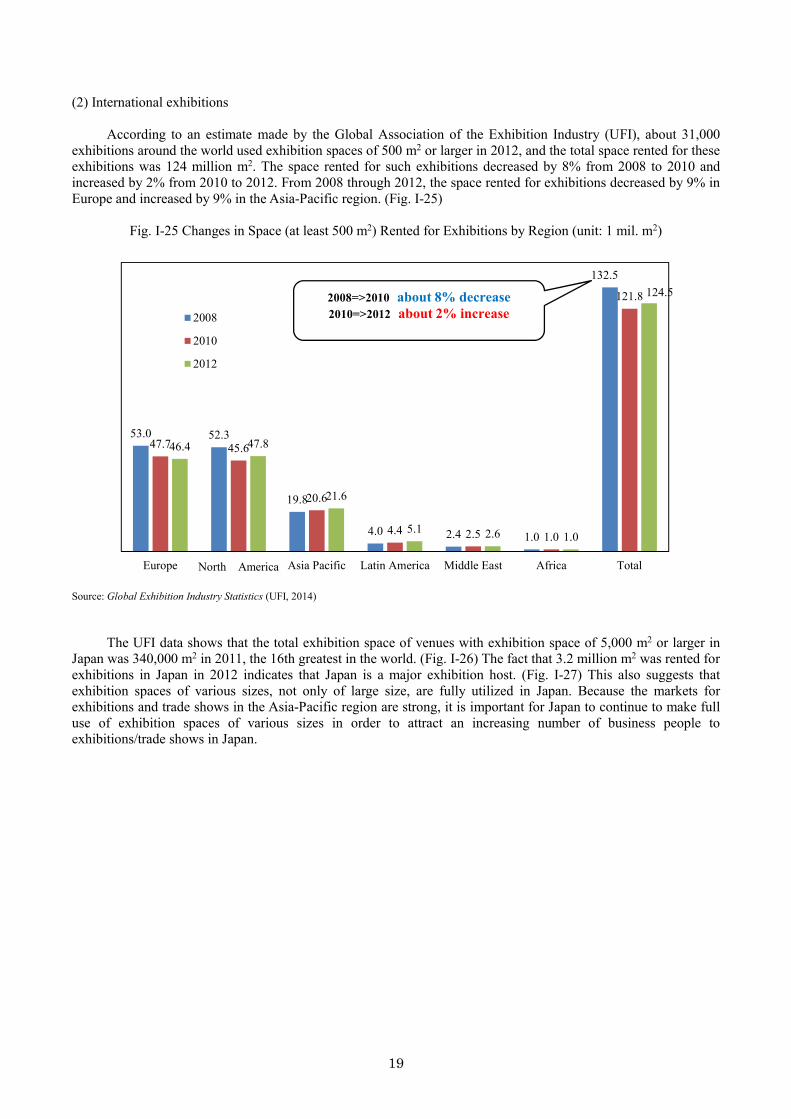
(2) International exhibitions
According to an estimate made by the Global Association of the Exhibition Industry (UFI), about 31,000 exhibitions around the world used exhibition spaces of 500 m2 or larger in 2012, and the total space rented for these exhibitions was 124 million m2. The space rented for such exhibitions decreased by 8% from 2008 to 2010 and increased by 2% from 2010 to 2012. From 2008 through 2012, the space rented for exhibitions decreased by 9% in Europe and increased by 9% in the Asia-Pacific region. (Fig. I-25)
Fig. I-25 Changes in Space (at least 500 m2) Rented for Exhibitions by Region (unit: 1 mil. m2)
Source: Global Exhibition Industry Statistics (UFI, 2014)
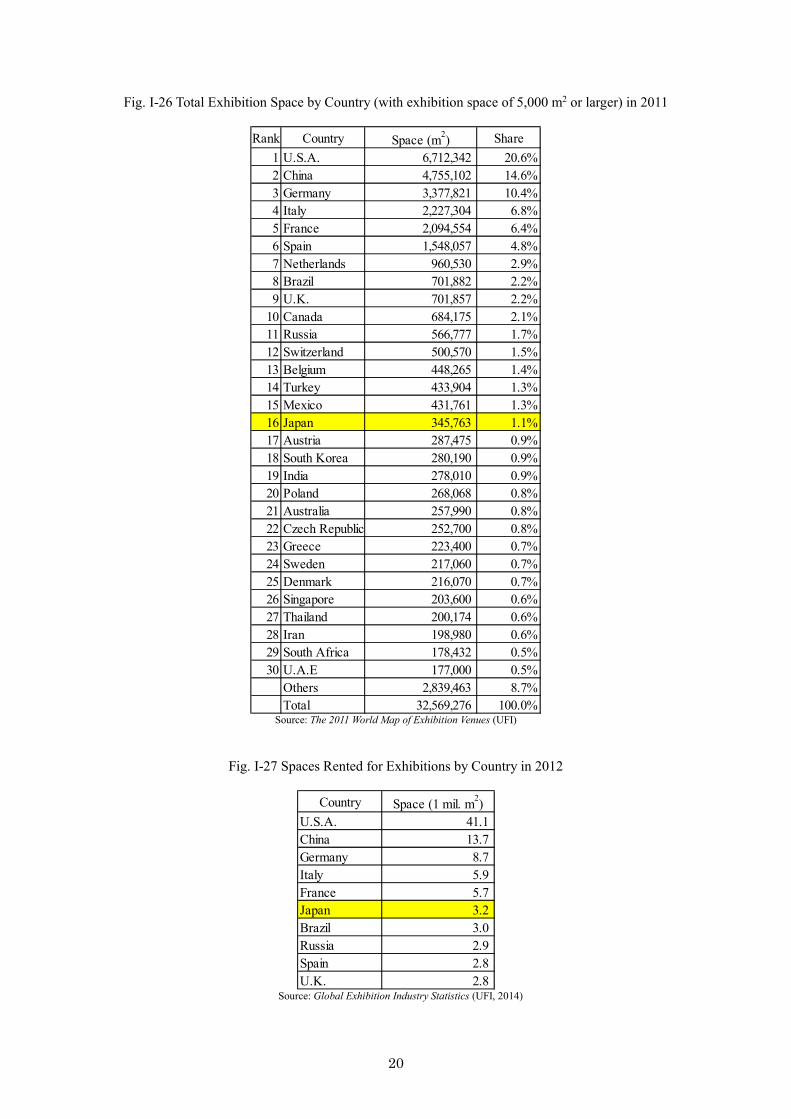
The UFI data shows that the total exhibition space of venues with exhibition space of 5,000 m2 or larger in Japan was 340,000 m2 in 2011, the 16th greatest in the world. (Fig. I-26) The fact that 3.2 million m2 was rented for exhibitions in Japan in 2012 indicates that Japan is a major exhibition host. (Fig. I-27) This also suggests that exhibition spaces of various sizes, not only of large size, are fully utilized in Japan. Because the markets for exhibitions and trade shows in the Asia-Pacific region are strong, it is important for Japan to continue to make full use of exhibition spaces of various sizes in order to attract an increasing number of business people to exhibitions/trade shows in Japan.
53.0 52.3
19.8
4.0 2.4 1.0
132.5
47.7 45.6
20.6
4.4 2.5 1.0
121.8
46.4 47.8
21.6
5.1 2.6 1.0
124.5
Europe North America Asia Pacific Latin America Middle East Africa Total
2008
2010
2012
2008=>2010 about 8% decrease2010=>2012 about 2% increase
20
Fig. I-26 Total Exhibition Space by Country (with exhibition space of 5,000 m2 or larger) in 2011
Source: The 2011 World Map of Exhibition Venues (UFI)
Fig. I-27 Spaces Rented for Exhibitions by Country in 2012
Source: Global Exhibition Industry Statistics (UFI, 2014)
Rank Country Space (m2) Share1 U.S.A. 6,712,342 20.6%2 China 4,755,102 14.6%3 Germany 3,377,821 10.4%4 Italy 2,227,304 6.8%5 France 2,094,554 6.4%6 Spain 1,548,057 4.8%7 Netherlands 960,530 2.9%8 Brazil 701,882 2.2%9 U.K. 701,857 2.2%
10 Canada 684,175 2.1%11 Russia 566,777 1.7%12 Switzerland 500,570 1.5%13 Belgium 448,265 1.4%14 Turkey 433,904 1.3%15 Mexico 431,761 1.3%16 Japan 345,763 1.1%17 Austria 287,475 0.9%18 South Korea 280,190 0.9%19 India 278,010 0.9%20 Poland 268,068 0.8%21 Australia 257,990 0.8%22 Czech Republic 252,700 0.8%23 Greece 223,400 0.7%24 Sweden 217,060 0.7%25 Denmark 216,070 0.7%26 Singapore 203,600 0.6%27 Thailand 200,174 0.6%28 Iran 198,980 0.6%29 South Africa 178,432 0.5%30 U.A.E 177,000 0.5%
Others 2,839,463 8.7%Total 32,569,276 100.0%
Country Space (1 mil. m2)U.S.A. 41.1China 13.7Germany 8.7Italy 5.9France 5.7Japan 3.2Brazil 3.0Russia 2.9Spain 2.8U.K. 2.8
21
Section 2 Trends in Japanese Overseas Travel
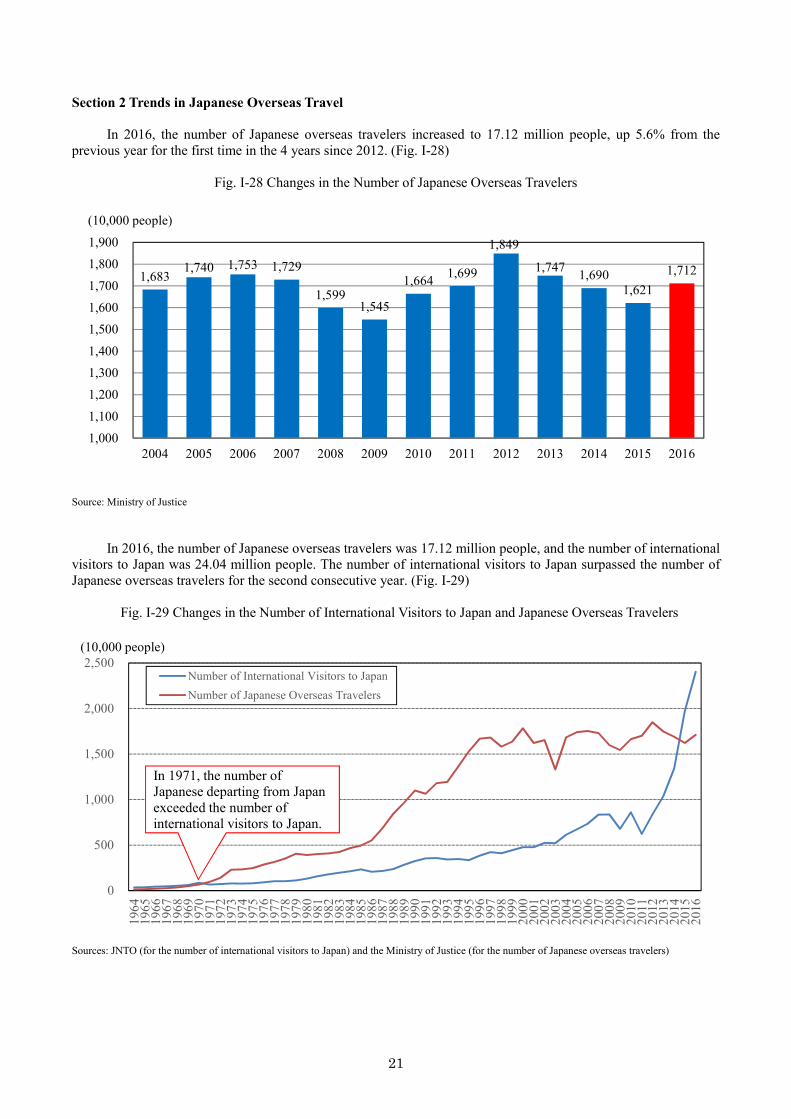
In 2016, the number of Japanese overseas travelers increased to 17.12 million people, up 5.6% from the previous year for the first time in the 4 years since 2012. (Fig. I-28)
Fig. I-28 Changes in the Number of Japanese Overseas Travelers
Source: Ministry of Justice
In 2016, the number of Japanese overseas travelers was 17.12 million people, and the number of international visitors to Japan was 24.04 million people. The number of international visitors to Japan surpassed the number of Japanese overseas travelers for the second consecutive year. (Fig. I-29)
Fig. I-29 Changes in the Number of International Visitors to Japan and Japanese Overseas Travelers
Sources: JNTO (for the number of international visitors to Japan) and the Ministry of Justice (for the number of Japanese overseas travelers)
1,683 1,740 1,753 1,729
1,599 1,545
1,664 1,699
1,849
1,747 1,690 1,621
1,712
1,0001,100
1,2001,3001,400
1,5001,6001,700
1,8001,900
2004 2005 2006 2007 2008 2009 2010 2011 2012 2013 2014 2015 2016
(10,000 people)
0
500
1,000
1,500
2,000
2,500
1964
1965
1966
1967
1968
1969
1970
1971
1972
1973
1974
1975
1976
1977
1978
1979
1980
1981
1982
1983
1984
1985
1986
1987
1988
1989
1990
1991
1992
1993
1994
1995
1996
1997
1998
1999
2000
2001
2002
2003
2004
2005
2006
2007
2008
2009
2010
2011
2012
2013
2014
2015
2016
Number of International Visitors to JapanNumber of Japanese Overseas Travelers
In 1971, the number of Japanese departing from Japan exceeded the number of international visitors to Japan.
(10,000 people)
22
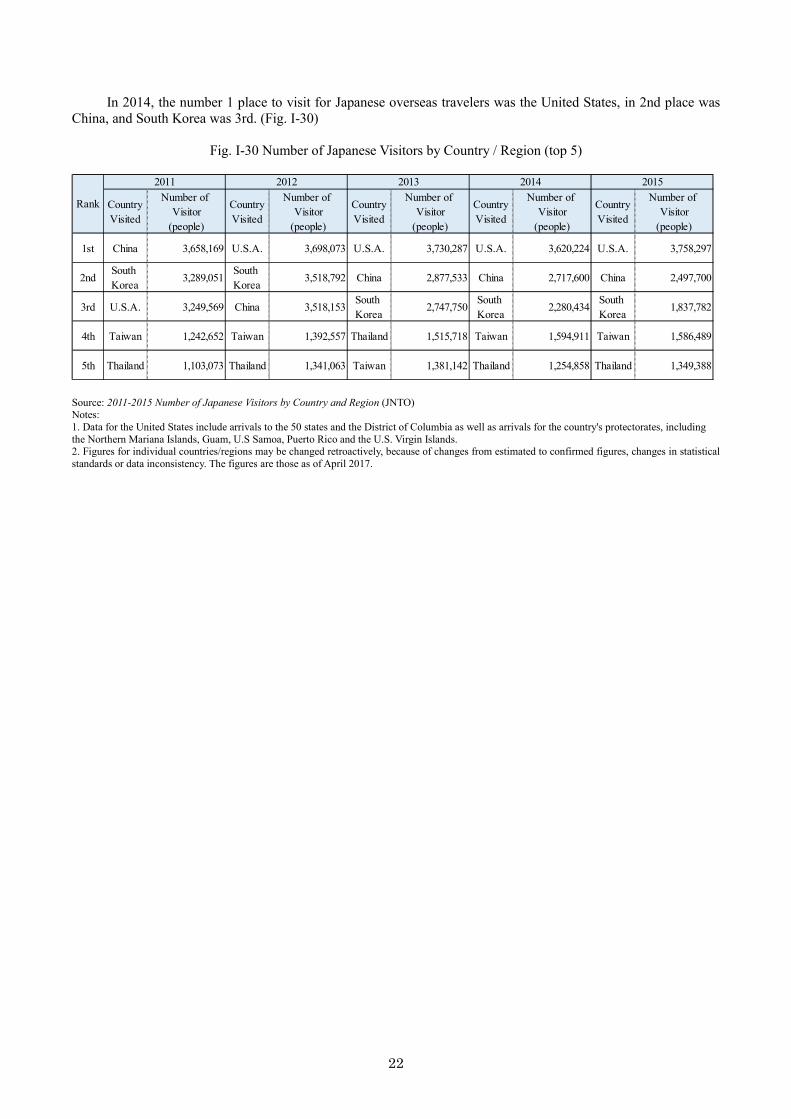
In 2014, the number 1 place to visit for Japanese overseas travelers was the United States, in 2nd place was China, and South Korea was 3rd. (Fig. I-30)
Fig. I-30 Number of Japanese Visitors by Country / Region (top 5)
CountryVisited
Number of Visitor
(people)
CountryVisited
Number of Visitor
(people)
CountryVisited
Number of Visitor
(people)
CountryVisited
Number of Visitor
(people)
CountryVisited
Number of Visitor
(people)
1st China 3,658,169 U.S.A. 3,698,073 U.S.A. 3,730,287 U.S.A. 3,620,224 U.S.A. 3,758,297
2ndSouth Korea
3,289,051South Korea
3,518,792 China 2,877,533 China 2,717,600 China 2,497,700
3rd U.S.A. 3,249,569 China 3,518,153South Korea
2,747,750South Korea
2,280,434South Korea
1,837,782
4th Taiwan 1,242,652 Taiwan 1,392,557 Thailand 1,515,718 Taiwan 1,594,911 Taiwan 1,586,489
5th Thailand 1,103,073 Thailand 1,341,063 Taiwan 1,381,142 Thailand 1,254,858 Thailand 1,349,388
2015
Rank
2011 2012 2013 2014
Source: 2011-2015 Number of Japanese Visitors by Country and Region (JNTO) Notes: 1. Data for the United States include arrivals to the 50 states and the District of Columbia as well as arrivals for the country's protectorates, including the Northern Mariana Islands, Guam, U.S Samoa, Puerto Rico and the U.S. Virgin Islands. 2. Figures for individual countries/regions may be changed retroactively, because of changes from estimated to confirmed figures, changes in statistical standards or data inconsistency. The figures are those as of April 2017.
23
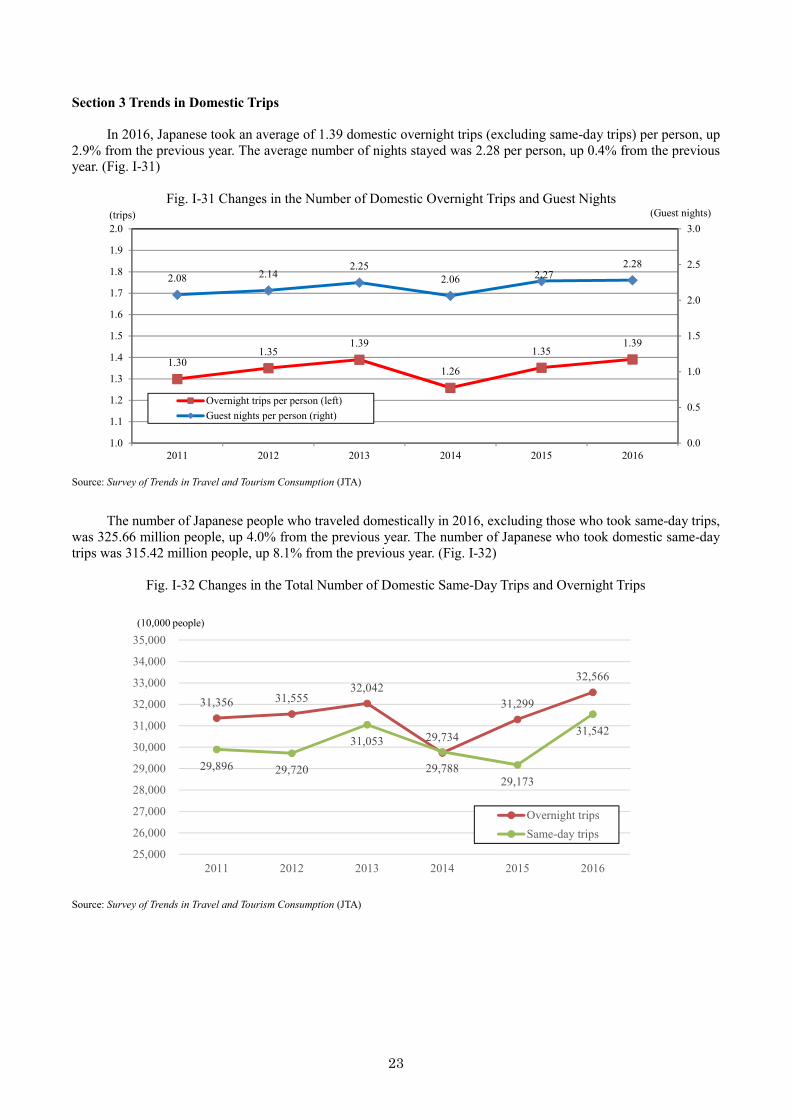
Section 3 Trends in Domestic Trips
In 2016, Japanese took an average of 1.39 domestic overnight trips (excluding same-day trips) per person, up 2.9% from the previous year. The average number of nights stayed was 2.28 per person, up 0.4% from the previous year. (Fig. I-31)
Fig. I-31 Changes in the Number of Domestic Overnight Trips and Guest Nights
Source: Survey of Trends in Travel and Tourism Consumption (JTA)
The number of Japanese people who traveled domestically in 2016, excluding those who took same-day trips,
was 325.66 million people, up 4.0% from the previous year. The number of Japanese who took domestic same-day trips was 315.42 million people, up 8.1% from the previous year. (Fig. I-32)
Fig. I-32 Changes in the Total Number of Domestic Same-Day Trips and Overnight Trips
Source: Survey of Trends in Travel and Tourism Consumption (JTA)
1.30 1.35
1.39
1.26
1.35 1.39
2.08 2.14 2.25
2.06 2.27 2.28
0.0
0.5
1.0
1.5
2.0
2.5
3.0
1.0
1.1
1.2
1.3
1.4
1.5
1.6
1.7
1.8
1.9
2.0
2011 2012 2013 2014 2015 2016
(trips)
Overnight trips per person (left)Guest nights per person (right)
(Guest nights)
31,356 31,555 32,042
29,734
31,299
32,566
29,896 29,720
31,053
29,788 29,173
31,542
25,000
26,000
27,000
28,000
29,000
30,000
31,000
32,000
33,000
34,000
35,000
2011 2012 2013 2014 2015 2016
Overnight tripsSame-day trips
(10,000 people)
24
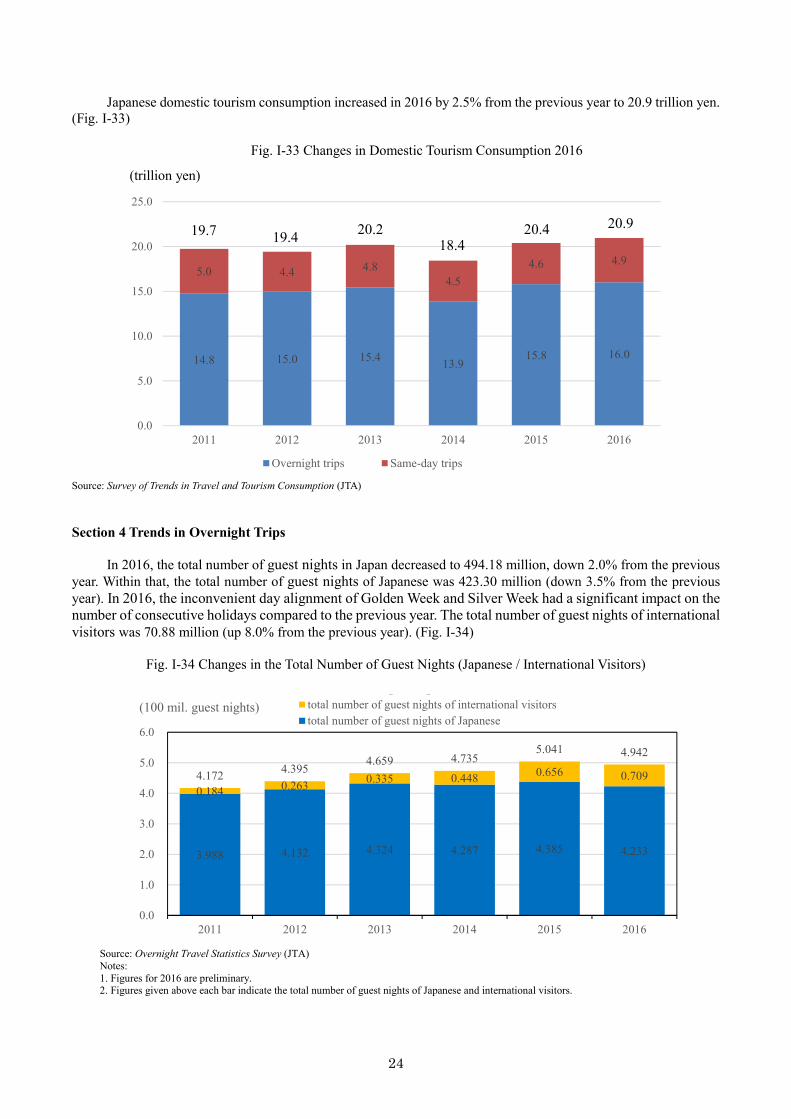
Japanese domestic tourism consumption increased in 2016 by 2.5% from the previous year to 20.9 trillion yen. (Fig. I-33)
Fig. I-33 Changes in Domestic Tourism Consumption 2016
Source: Survey of Trends in Travel and Tourism Consumption (JTA) Section 4 Trends in Overnight Trips
In 2016, the total number of guest nights in Japan decreased to 494.18 million, down 2.0% from the previous year. Within that, the total number of guest nights of Japanese was 423.30 million (down 3.5% from the previous year). In 2016, the inconvenient day alignment of Golden Week and Silver Week had a significant impact on the number of consecutive holidays compared to the previous year. The total number of guest nights of international visitors was 70.88 million (up 8.0% from the previous year). (Fig. I-34)
Fig. I-34 Changes in the Total Number of Guest Nights (Japanese / International Visitors)
Source: Overnight Travel Statistics Survey (JTA) Notes: 1. Figures for 2016 are preliminary. 2. Figures given above each bar indicate the total number of guest nights of Japanese and international visitors.
14.8 15.0 15.4 13.915.8 16.0
5.0 4.4 4.84.5
4.6 4.9
0.0
5.0
10.0
15.0
20.0
25.0
2011 2012 2013 2014 2015 2016
Overnight trips Same-day trips
(trillion yen)
19.7 19.4 20.218.4
20.4 20.9
3.988 4.132 4.324 4.287 4.385 4.233
0.184 0.263 0.335 0.448 0.656 0.709 4.172 4.395 4.659 4.735
5.041 4.942
0.0
1.0
2.0
3.0
4.0
5.0
6.0
2011 2012 2013 2014 2015 2016
(100 mil. guest nights)Total number of guest nightstotal number of guest nights of international visitorstotal number of guest nights of Japanese
25
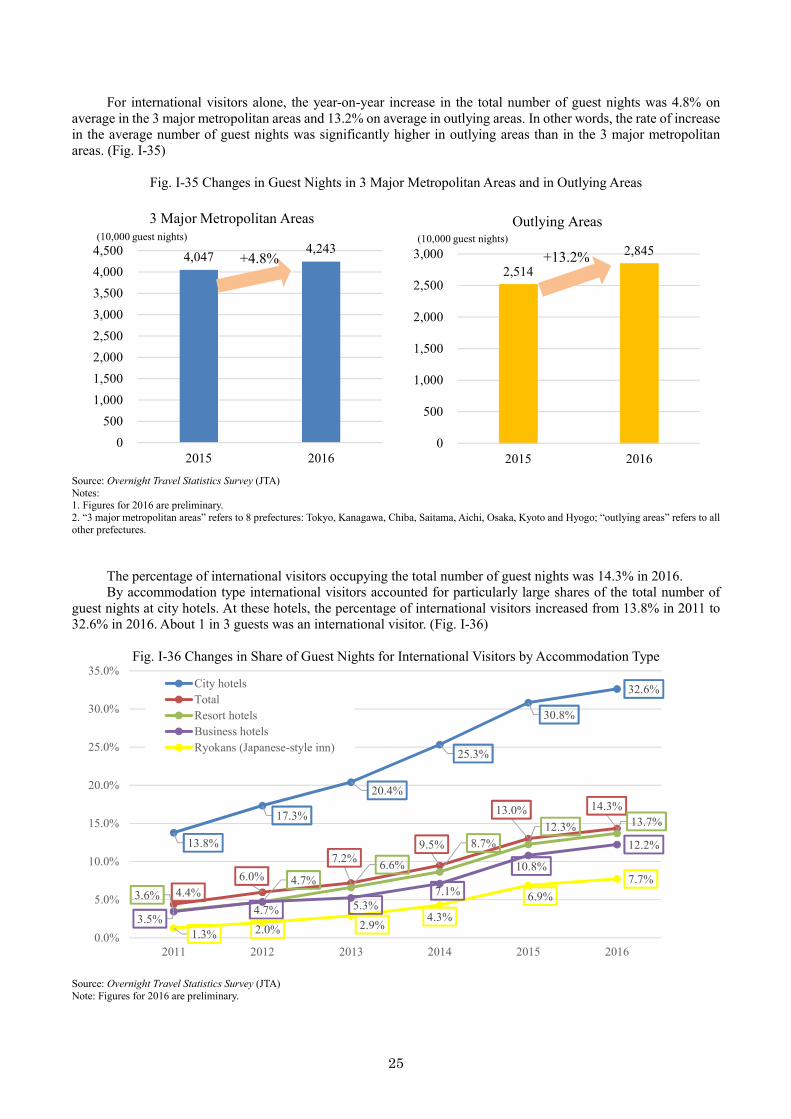
For international visitors alone, the year-on-year increase in the total number of guest nights was 4.8% on average in the 3 major metropolitan areas and 13.2% on average in outlying areas. In other words, the rate of increase in the average number of guest nights was significantly higher in outlying areas than in the 3 major metropolitan areas. (Fig. I-35)
Fig. I-35 Changes in Guest Nights in 3 Major Metropolitan Areas and in Outlying Areas
Source: Overnight Travel Statistics Survey (JTA) Notes: 1. Figures for 2016 are preliminary. 2. “3 major metropolitan areas” refers to 8 prefectures: Tokyo, Kanagawa, Chiba, Saitama, Aichi, Osaka, Kyoto and Hyogo; “outlying areas” refers to all other prefectures.
The percentage of international visitors occupying the total number of guest nights was 14.3% in 2016. By accommodation type international visitors accounted for particularly large shares of the total number of
guest nights at city hotels. At these hotels, the percentage of international visitors increased from 13.8% in 2011 to 32.6% in 2016. About 1 in 3 guests was an international visitor. (Fig. I-36)
Fig. I-36 Changes in Share of Guest Nights for International Visitors by Accommodation Type
Source: Overnight Travel Statistics Survey (JTA) Note: Figures for 2016 are preliminary.
4,047 4,243
0500
1,0001,5002,0002,5003,0003,5004,0004,500
2015 2016
3 Major Metropolitan Areas(10,000 guest nights)
+4.8%2,514
2,845
0
500
1,000
1,500
2,000
2,500
3,000
2015 2016
Outlying Areas(10,000 guest nights)
+13.2%
13.8%
17.3%
20.4%
25.3%
30.8%
32.6%
4.4%6.0%
7.2%9.5%
13.0% 14.3%
3.6%4.7%
6.6%
8.7%12.3% 13.7%
3.5%4.7% 5.3%
7.1%
10.8%
12.2%
1.3% 2.0% 2.9%4.3%
6.9%7.7%
0.0%
5.0%
10.0%
15.0%
20.0%
25.0%
30.0%
35.0%
2011 2012 2013 2014 2015 2016
City hotelsTotalResort hotelsBusiness hotelsRyokans (Japanese-style inn)
26
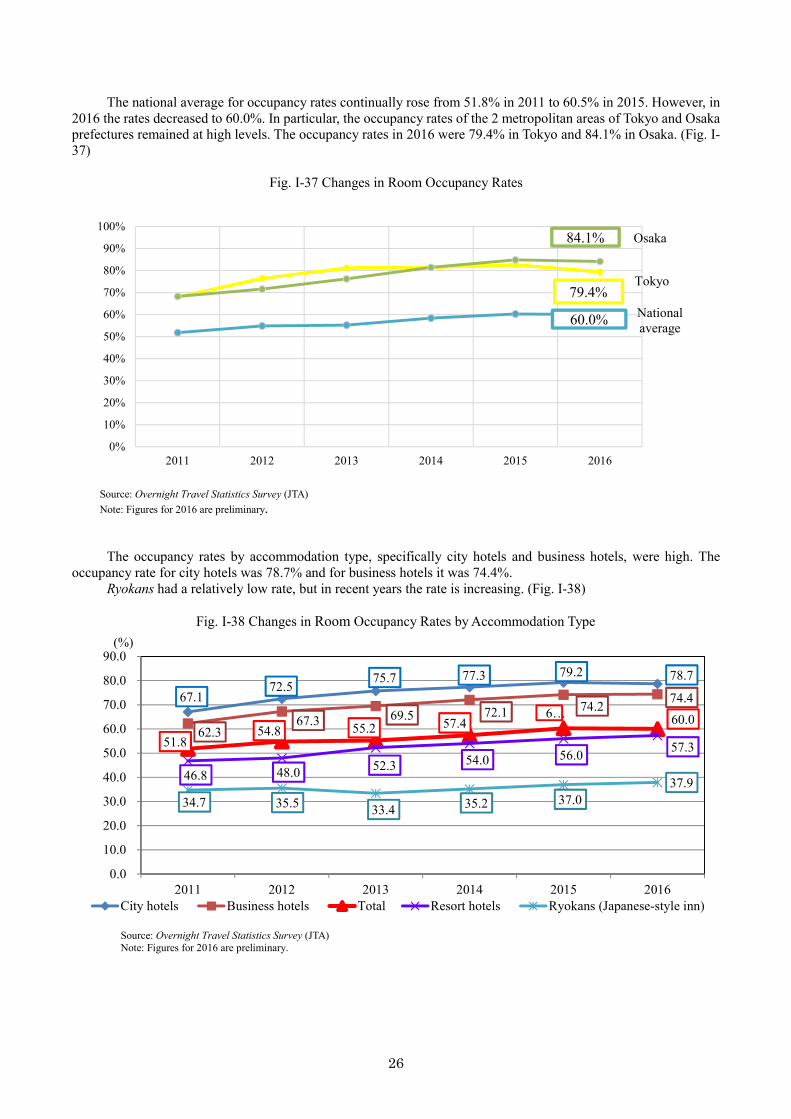
The national average for occupancy rates continually rose from 51.8% in 2011 to 60.5% in 2015. However, in 2016 the rates decreased to 60.0%. In particular, the occupancy rates of the 2 metropolitan areas of Tokyo and Osaka prefectures remained at high levels. The occupancy rates in 2016 were 79.4% in Tokyo and 84.1% in Osaka. (Fig. I-37)
Fig. I-37 Changes in Room Occupancy Rates
Source: Overnight Travel Statistics Survey (JTA) Note: Figures for 2016 are preliminary.
The occupancy rates by accommodation type, specifically city hotels and business hotels, were high. The
occupancy rate for city hotels was 78.7% and for business hotels it was 74.4%. Ryokans had a relatively low rate, but in recent years the rate is increasing. (Fig. I-38)
Fig. I-38 Changes in Room Occupancy Rates by Accommodation Type
Source: Overnight Travel Statistics Survey (JTA) Note: Figures for 2016 are preliminary.
0%
10%
20%
30%
40%
50%
60%
70%
80%
90%
100%
2011 2012 2013 2014 2015 2016
84.1%
60.0%
Tokyo
Osaka
National average
79.4%
67.1 72.5
75.7 77.3 79.2 78.7
62.3 67.3 69.5 72.1 74.2 74.4
51.8 54.8 55.2 57.4
6… 60.0
46.8 48.0 52.3 54.0 56.0 57.3
34.7 35.5 33.4 35.2 37.0 37.9
0.0
10.0
20.0
30.0
40.0
50.0
60.0
70.0
80.0
90.0
2011 2012 2013 2014 2015 2016City hotels Business hotels Total Resort hotels Ryokans (Japanese-style inn)
(%)
27
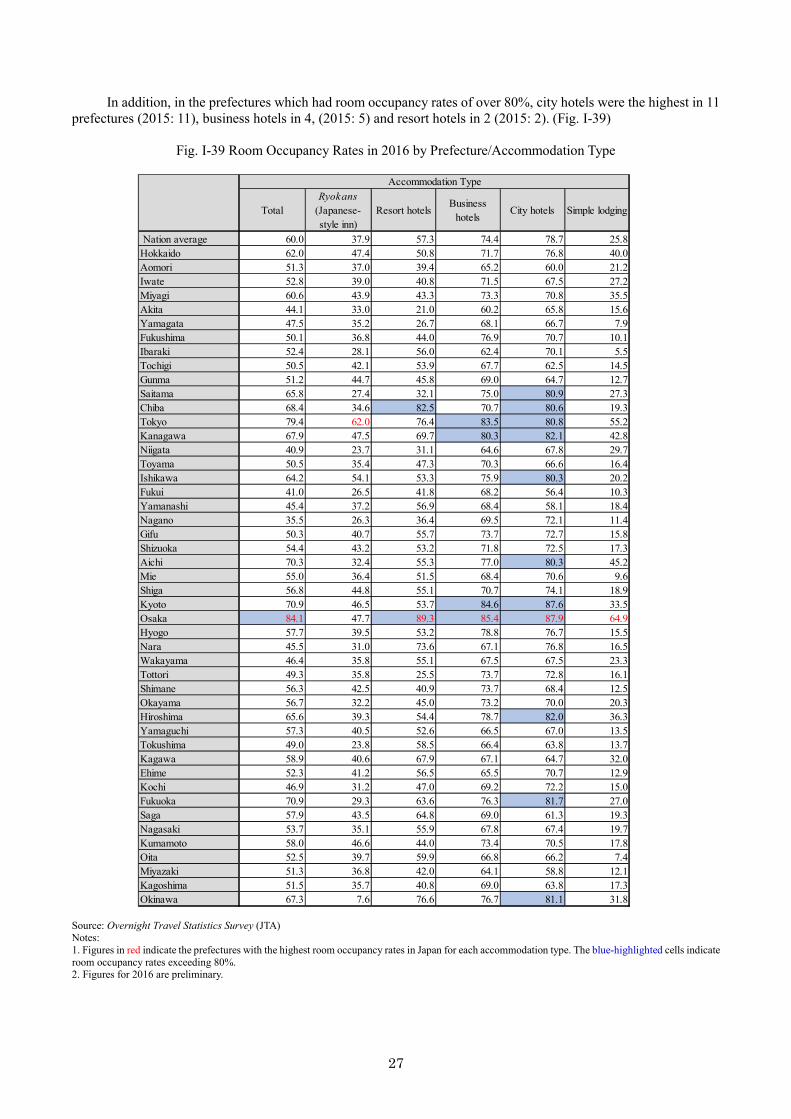
In addition, in the prefectures which had room occupancy rates of over 80%, city hotels were the highest in 11 prefectures (2015: 11), business hotels in 4, (2015: 5) and resort hotels in 2 (2015: 2). (Fig. I-39)
Fig. I-39 Room Occupancy Rates in 2016 by Prefecture/Accommodation Type
TotalRyokans
(Japanese-style inn)
Resort hotelsBusiness
hotelsCity hotels Simple lodging
Nation average 60.0 37.9 57.3 74.4 78.7 25.8Hokkaido 62.0 47.4 50.8 71.7 76.8 40.0Aomori 51.3 37.0 39.4 65.2 60.0 21.2Iwate 52.8 39.0 40.8 71.5 67.5 27.2Miyagi 60.6 43.9 43.3 73.3 70.8 35.5Akita 44.1 33.0 21.0 60.2 65.8 15.6Yamagata 47.5 35.2 26.7 68.1 66.7 7.9Fukushima 50.1 36.8 44.0 76.9 70.7 10.1Ibaraki 52.4 28.1 56.0 62.4 70.1 5.5Tochigi 50.5 42.1 53.9 67.7 62.5 14.5Gunma 51.2 44.7 45.8 69.0 64.7 12.7Saitama 65.8 27.4 32.1 75.0 80.9 27.3Chiba 68.4 34.6 82.5 70.7 80.6 19.3Tokyo 79.4 62.0 76.4 83.5 80.8 55.2Kanagawa 67.9 47.5 69.7 80.3 82.1 42.8Niigata 40.9 23.7 31.1 64.6 67.8 29.7Toyama 50.5 35.4 47.3 70.3 66.6 16.4Ishikawa 64.2 54.1 53.3 75.9 80.3 20.2Fukui 41.0 26.5 41.8 68.2 56.4 10.3Yamanashi 45.4 37.2 56.9 68.4 58.1 18.4Nagano 35.5 26.3 36.4 69.5 72.1 11.4Gifu 50.3 40.7 55.7 73.7 72.7 15.8Shizuoka 54.4 43.2 53.2 71.8 72.5 17.3Aichi 70.3 32.4 55.3 77.0 80.3 45.2Mie 55.0 36.4 51.5 68.4 70.6 9.6Shiga 56.8 44.8 55.1 70.7 74.1 18.9Kyoto 70.9 46.5 53.7 84.6 87.6 33.5Osaka 84.1 47.7 89.3 85.4 87.9 64.9Hyogo 57.7 39.5 53.2 78.8 76.7 15.5Nara 45.5 31.0 73.6 67.1 76.8 16.5Wakayama 46.4 35.8 55.1 67.5 67.5 23.3Tottori 49.3 35.8 25.5 73.7 72.8 16.1Shimane 56.3 42.5 40.9 73.7 68.4 12.5Okayama 56.7 32.2 45.0 73.2 70.0 20.3Hiroshima 65.6 39.3 54.4 78.7 82.0 36.3Yamaguchi 57.3 40.5 52.6 66.5 67.0 13.5Tokushima 49.0 23.8 58.5 66.4 63.8 13.7Kagawa 58.9 40.6 67.9 67.1 64.7 32.0Ehime 52.3 41.2 56.5 65.5 70.7 12.9Kochi 46.9 31.2 47.0 69.2 72.2 15.0Fukuoka 70.9 29.3 63.6 76.3 81.7 27.0Saga 57.9 43.5 64.8 69.0 61.3 19.3Nagasaki 53.7 35.1 55.9 67.8 67.4 19.7Kumamoto 58.0 46.6 44.0 73.4 70.5 17.8Oita 52.5 39.7 59.9 66.8 66.2 7.4Miyazaki 51.3 36.8 42.0 64.1 58.8 12.1Kagoshima 51.5 35.7 40.8 69.0 63.8 17.3Okinawa 67.3 7.6 76.6 76.7 81.1 31.8
Accommodation Type
Source: Overnight Travel Statistics Survey (JTA) Notes: 1. Figures in red indicate the prefectures with the highest room occupancy rates in Japan for each accommodation type. The blue-highlighted cells indicate room occupancy rates exceeding 80%. 2. Figures for 2016 are preliminary.
28
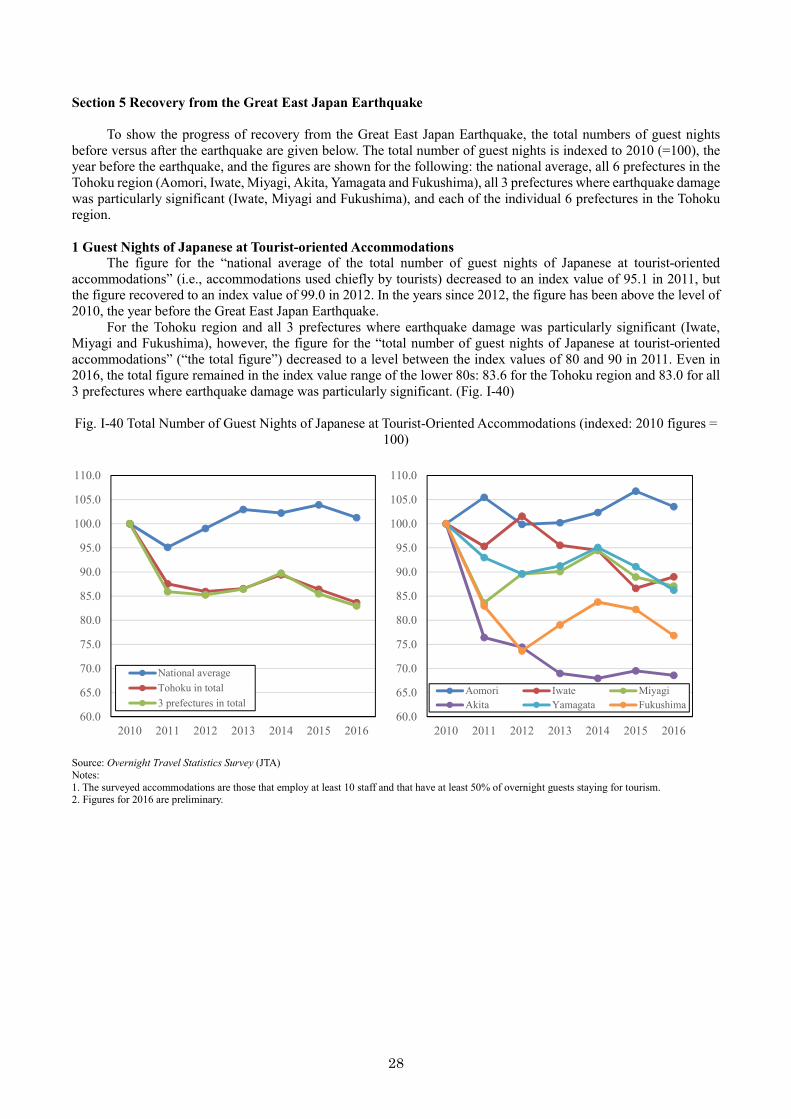
Section 5 Recovery from the Great East Japan Earthquake
To show the progress of recovery from the Great East Japan Earthquake, the total numbers of guest nights before versus after the earthquake are given below. The total number of guest nights is indexed to 2010 (=100), the year before the earthquake, and the figures are shown for the following: the national average, all 6 prefectures in the Tohoku region (Aomori, Iwate, Miyagi, Akita, Yamagata and Fukushima), all 3 prefectures where earthquake damage was particularly significant (Iwate, Miyagi and Fukushima), and each of the individual 6 prefectures in the Tohoku region. 1 Guest Nights of Japanese at Tourist-oriented Accommodations
The figure for the “national average of the total number of guest nights of Japanese at tourist-oriented accommodations” (i.e., accommodations used chiefly by tourists) decreased to an index value of 95.1 in 2011, but the figure recovered to an index value of 99.0 in 2012. In the years since 2012, the figure has been above the level of 2010, the year before the Great East Japan Earthquake.
For the Tohoku region and all 3 prefectures where earthquake damage was particularly significant (Iwate, Miyagi and Fukushima), however, the figure for the “total number of guest nights of Japanese at tourist-oriented accommodations” (“the total figure”) decreased to a level between the index values of 80 and 90 in 2011. Even in 2016, the total figure remained in the index value range of the lower 80s: 83.6 for the Tohoku region and 83.0 for all 3 prefectures where earthquake damage was particularly significant. (Fig. I-40)
Fig. I-40 Total Number of Guest Nights of Japanese at Tourist-Oriented Accommodations (indexed: 2010 figures =
100)
Source: Overnight Travel Statistics Survey (JTA) Notes: 1. The surveyed accommodations are those that employ at least 10 staff and that have at least 50% of overnight guests staying for tourism. 2. Figures for 2016 are preliminary.
60.0
65.0
70.0
75.0
80.0
85.0
90.0
95.0
100.0
105.0
110.0
2010 2011 2012 2013 2014 2015 2016
National averageTohoku in total3 prefectures in total
60.0
65.0
70.0
75.0
80.0
85.0
90.0
95.0
100.0
105.0
110.0
2010 2011 2012 2013 2014 2015 2016
Aomori Iwate MiyagiAkita Yamagata Fukushima
29
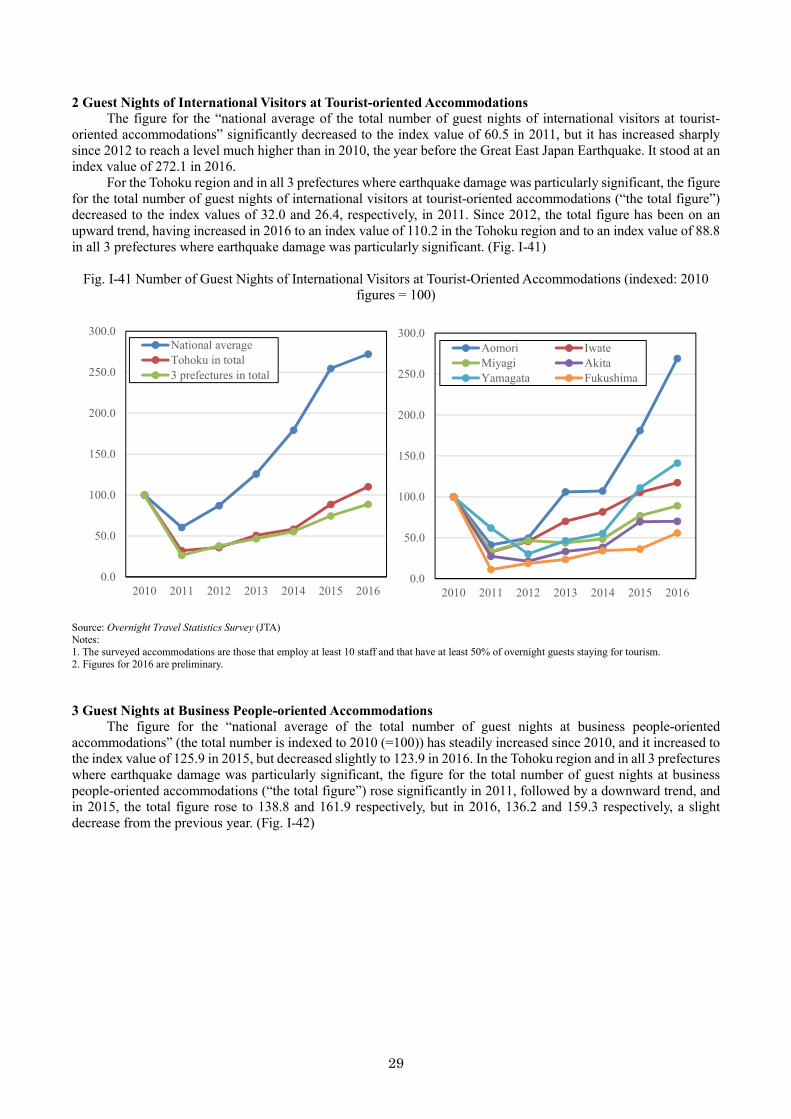
2 Guest Nights of International Visitors at Tourist-oriented Accommodations The figure for the “national average of the total number of guest nights of international visitors at tourist-
oriented accommodations” significantly decreased to the index value of 60.5 in 2011, but it has increased sharply since 2012 to reach a level much higher than in 2010, the year before the Great East Japan Earthquake. It stood at an index value of 272.1 in 2016.
For the Tohoku region and in all 3 prefectures where earthquake damage was particularly significant, the figure for the total number of guest nights of international visitors at tourist-oriented accommodations (“the total figure”) decreased to the index values of 32.0 and 26.4, respectively, in 2011. Since 2012, the total figure has been on an upward trend, having increased in 2016 to an index value of 110.2 in the Tohoku region and to an index value of 88.8 in all 3 prefectures where earthquake damage was particularly significant. (Fig. I-41)
Fig. I-41 Number of Guest Nights of International Visitors at Tourist-Oriented Accommodations (indexed: 2010
figures = 100)
Source: Overnight Travel Statistics Survey (JTA) Notes: 1. The surveyed accommodations are those that employ at least 10 staff and that have at least 50% of overnight guests staying for tourism. 2. Figures for 2016 are preliminary.
3 Guest Nights at Business People-oriented Accommodations The figure for the “national average of the total number of guest nights at business people-oriented
accommodations” (the total number is indexed to 2010 (=100)) has steadily increased since 2010, and it increased to the index value of 125.9 in 2015, but decreased slightly to 123.9 in 2016. In the Tohoku region and in all 3 prefectures where earthquake damage was particularly significant, the figure for the total number of guest nights at business people-oriented accommodations (“the total figure”) rose significantly in 2011, followed by a downward trend, and in 2015, the total figure rose to 138.8 and 161.9 respectively, but in 2016, 136.2 and 159.3 respectively, a slight decrease from the previous year. (Fig. I-42)
0.0
50.0
100.0
150.0
200.0
250.0
300.0
2010 2011 2012 2013 2014 2015 2016
National averageTohoku in total3 prefectures in total
0.0
50.0
100.0
150.0
200.0
250.0
300.0
2010 2011 2012 2013 2014 2015 2016
Aomori IwateMiyagi AkitaYamagata Fukushima
30
Fig. I-42 Total Number of Guest Nights at Business People-Oriented Accommodations (index: 2010 figures = 100)
Source: Overnight Travel Statistics Survey (JTA) Notes: 1. The surveyed accommodations are those that employ at least 10 staff and that have less than 50% of overnight guests staying for tourism. 2. Figures for 2016 are preliminary. Section 6 The Tourism Situation in Regional Areas
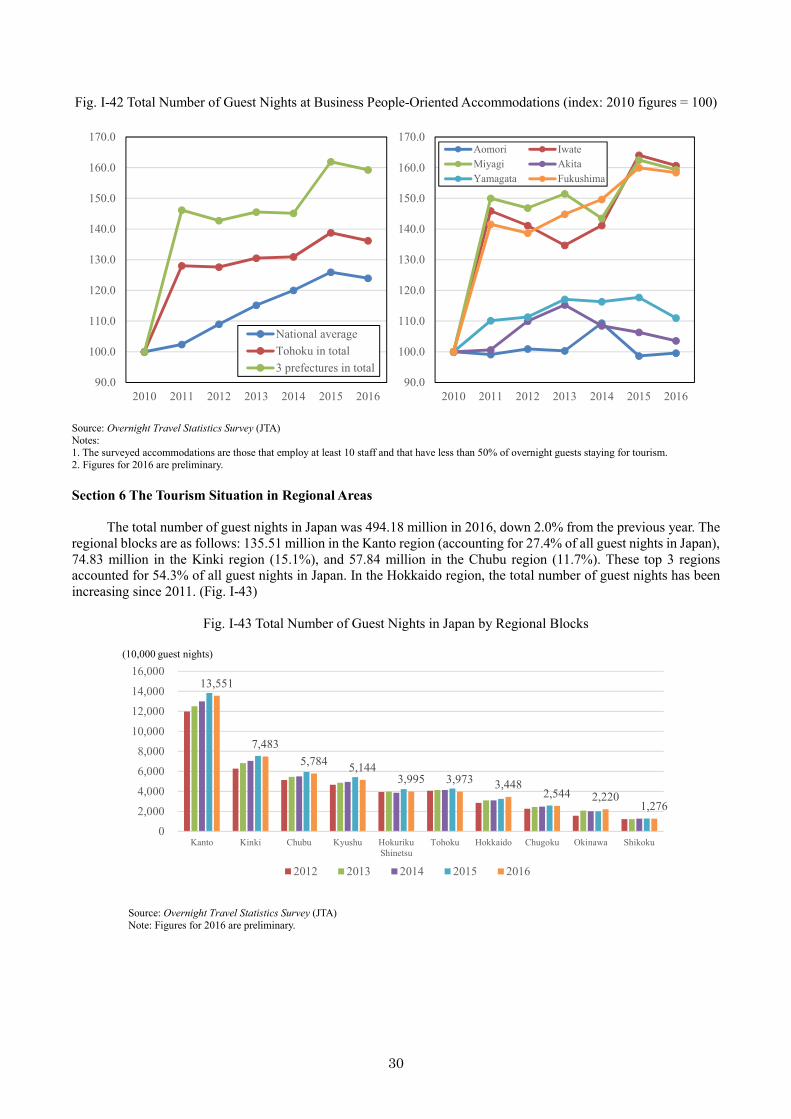
The total number of guest nights in Japan was 494.18 million in 2016, down 2.0% from the previous year. The regional blocks are as follows: 135.51 million in the Kanto region (accounting for 27.4% of all guest nights in Japan), 74.83 million in the Kinki region (15.1%), and 57.84 million in the Chubu region (11.7%). These top 3 regions accounted for 54.3% of all guest nights in Japan. In the Hokkaido region, the total number of guest nights has been increasing since 2011. (Fig. I-43)
Fig. I-43 Total Number of Guest Nights in Japan by Regional Blocks
Source: Overnight Travel Statistics Survey (JTA) Note: Figures for 2016 are preliminary.
90.0
100.0
110.0
120.0
130.0
140.0
150.0
160.0
170.0
2010 2011 2012 2013 2014 2015 2016
National averageTohoku in total3 prefectures in total
90.0
100.0
110.0
120.0
130.0
140.0
150.0
160.0
170.0
2010 2011 2012 2013 2014 2015 2016
Aomori IwateMiyagi AkitaYamagata Fukushima
13,551
7,483 5,784 5,144
3,995 3,973 3,448 2,544 2,220
1,276
0
2,000
4,000
6,000
8,000
10,000
12,000
14,000
16,000
Kanto Kinki Chubu Kyushu HokurikuShinetsu
Tohoku Hokkaido Chugoku Okinawa Shikoku
2012 2013 2014 2015 2016
(10,000 guest nights)
31
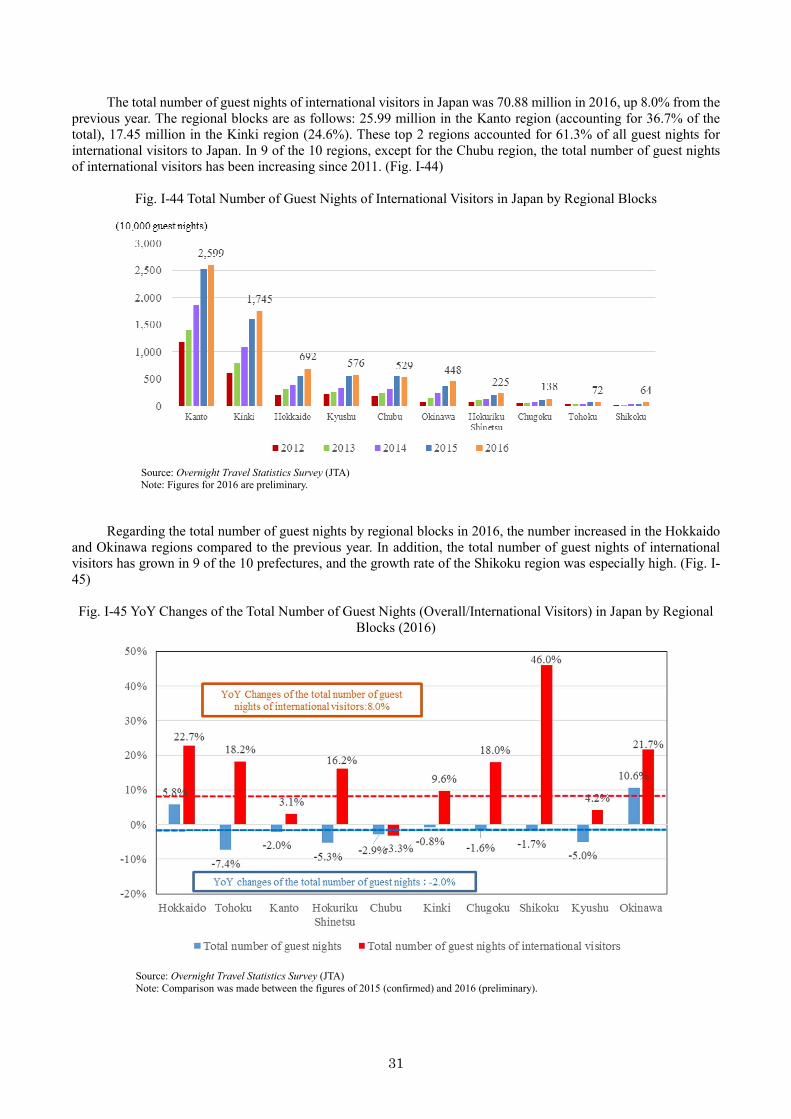
The total number of guest nights of international visitors in Japan was 70.88 million in 2016, up 8.0% from the previous year. The regional blocks are as follows: 25.99 million in the Kanto region (accounting for 36.7% of the total), 17.45 million in the Kinki region (24.6%). These top 2 regions accounted for 61.3% of all guest nights for international visitors to Japan. In 9 of the 10 regions, except for the Chubu region, the total number of guest nights of international visitors has been increasing since 2011. (Fig. I-44)
Fig. I-44 Total Number of Guest Nights of International Visitors in Japan by Regional Blocks
Source: Overnight Travel Statistics Survey (JTA)
Note: Figures for 2016 are preliminary.
Regarding the total number of guest nights by regional blocks in 2016, the number increased in the Hokkaido
and Okinawa regions compared to the previous year. In addition, the total number of guest nights of international visitors has grown in 9 of the 10 prefectures, and the growth rate of the Shikoku region was especially high. (Fig. I-45) Fig. I-45 YoY Changes of the Total Number of Guest Nights (Overall/International Visitors) in Japan by Regional
Blocks (2016)
Source: Overnight Travel Statistics Survey (JTA) Note: Comparison was made between the figures of 2015 (confirmed) and 2016 (preliminary).
32
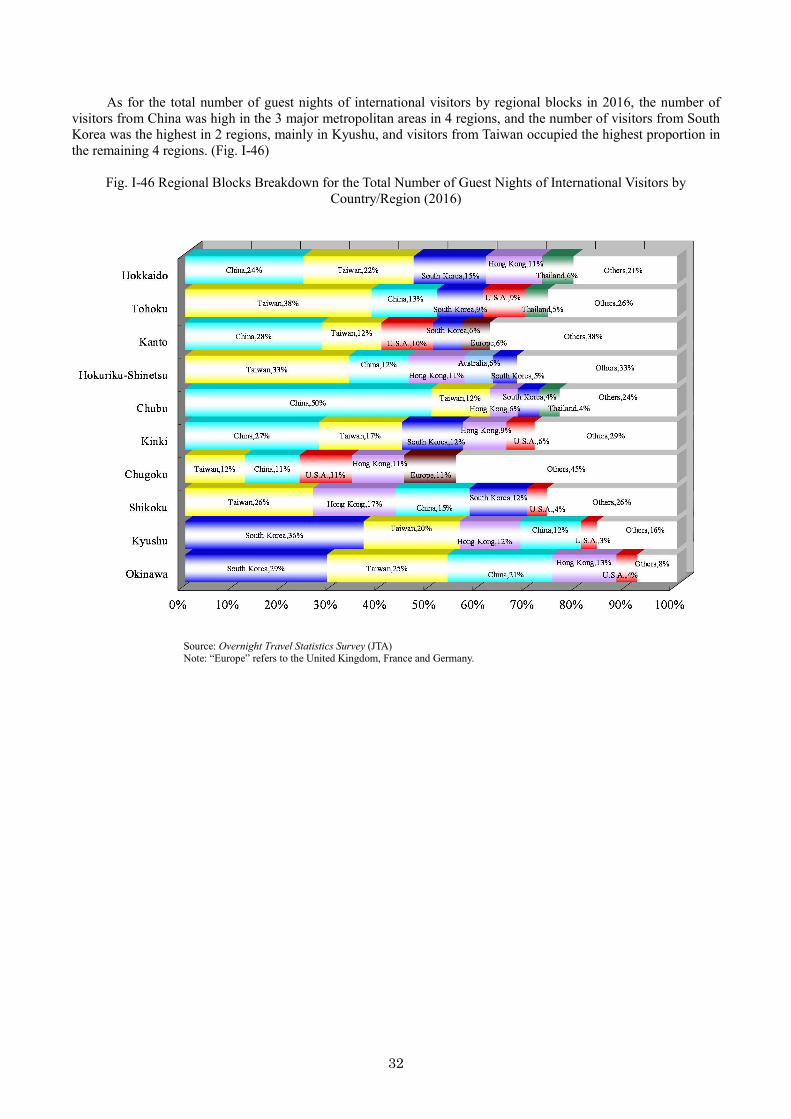
As for the total number of guest nights of international visitors by regional blocks in 2016, the number of visitors from China was high in the 3 major metropolitan areas in 4 regions, and the number of visitors from South Korea was the highest in 2 regions, mainly in Kyushu, and visitors from Taiwan occupied the highest proportion in the remaining 4 regions. (Fig. I-46)
Fig. I-46 Regional Blocks Breakdown for the Total Number of Guest Nights of International Visitors by Country/Region (2016)
Source: Overnight Travel Statistics Survey (JTA) Note: “Europe” refers to the United Kingdom, France and Germany.

33
Analysis results regarding the trends in each region are summarized as follows: 1 Hokkaido
Due to new international routes and an increase in the number of flights, the total number of guest nights of international visitors has increased, with especially sharp increases in visitors from South Korea and Malaysia.
In addition to the growth of international visitors, the total number of guest nights increased as a result of the increase in domestic overnight guests due to the opening of the Hokkaido Shinkansen in March 2016.
2 Tohoku
The total number of guest nights of international visitors to Tohoku in 2016 was at a record high. One of the reasons is that a goal of 1.5 million international visitors to Tohoku in 2020 was set and, in cooperation with each prefecture, municipality, and various tourism related organizations, efforts were made by the public and private sectors to promote and disseminate information. The second factor is the opening of new overseas routes to Sendai airport. Taiwan continued to have the highest number of overnight guests, and the growth rates in the number of visitors from China, Hong Kong and Thailand were higher compared to the previous year. In comparison with 2010, before the earthquake, the growth rates of visitors from Thailand, Australia, China, and Malaysia were remarkable.
On the other hand, the total number of guest nights declined due to the decrease in the total number of guest nights of Japanese.
3 Kanto
The total number of guest nights of international visitors increased. Reasons such as the increase in the number of business customers visiting the metropolitan area to attend MICE, such as large international conferences and events, and factors such as new international routes and more flights to the metropolitan airports are given. On the other hand, the total number of guest nights decreased due to the decrease in Japanese overnight guests. The main reason is the difficulty of taking days off because of the arrangement of the holidays. A typhoon making landfall in the metropolitan area and the lack of snow during the ski season are also considered factors.
4 Hokuriku-Shinetsu
The number of guest nights of international visitors is increasing every year with international tourists who enjoy skiing and snow play. Other factors include the enhancement of secondary transportation by tour routes, such as the “Osaka-Tokyo Hokuriku Arch Pass” (train) and the “Three-star Route Ticket” (bus), as well as a shift in travel patterns to individual travel and the overall increase in the number of international visitors.
As it was the 2nd year since the opening of the Hokuriku Shinkansen Kanazawa extension, the total number of guest nights decreased because the novelty effect of the opening wore off, but the number increased by 3.7% compared with 2015, before the opening of the extension.
5 Chubu
The total number of guest nights of international visitors increased in the first half of the year, with the effects of the media surrounding the G7 Ise-Shima summit. On the other hand, in the second half, the total number of guest nights of international visitors declined due to the decrease in overseas routes at the Mt. Fuji Shizuoka Airport, and the decline of Chinese tourists who accounted for a high composition ratio in the region. Therefore, the total number of guest nights decreased and the total number of guest nights of international visitors also declined.
6 Kinki
The total number of guest nights of international visitors has increased since Kansai International Airport has continued to expand, mainly with LCCs, and there has been a growing awareness overseas of cities in Kansai, such as Kyoto and Osaka. On the other hand, due to a decrease in the number of guest nights of Japanese guests, the total number of guest nights decreased slightly, but the ratio of international visitors to the total number of guest nights increased from last year. 7 Chugoku
The total number of guest nights of international visitors has increased in most markets, and also in the overall market. In March 2016, there was a new service of regular flights between Hong Kong and Okayama, and the Hong Kong market increased by 123% compared to the previous year.
As for the total number of guest nights, there was an increase in some prefectures, but there was a slight decrease in the whole block.
34
8 Shikoku Along with the increase in regular routes between Taiwan and Takamatsu, and the introduction of LCC routes
between Hong Kong and Takamatsu in July 2016, the number of visitors from Hong Kong and Taiwan increased. The number of visitors from China to Shikoku also increased and the total number of guest nights of international visitors showed high growth.
9 Kyushu
The total number of guest nights in 2016 was greatly affected by the Kumamoto earthquake, which occurred in April of the same year.
From April to June, both the total number of guest nights and the total number of guest nights of international visitors decreased compared with the previous year. However, the effects of the “Kyushu Tourism Travel Subsidy System,” also called the “Visit Kyushu Special Campaign” (Kyushu Recovery Discount), which started in July, helped bring about recovery.
Since September, the number of international visitors, mainly from South Korea, has also recovered from the effects of the earthquake, and showed growth higher than the previous year. 10 Okinawa
The total number of guest nights of international visitors from Taiwan, South Korea and China increased due to the expansion of new air routes, such as from Hong Kong. In addition, because of the growth in the number of international visitors, the total number of guest nights increased.
35
Section 7 Initiatives to Promote Tourism in Each Region
Efforts are being made in each region of Japan to attract tourists both from home and abroad and to promote tourism areas. In the following, we will introduce the efforts in each regional block.
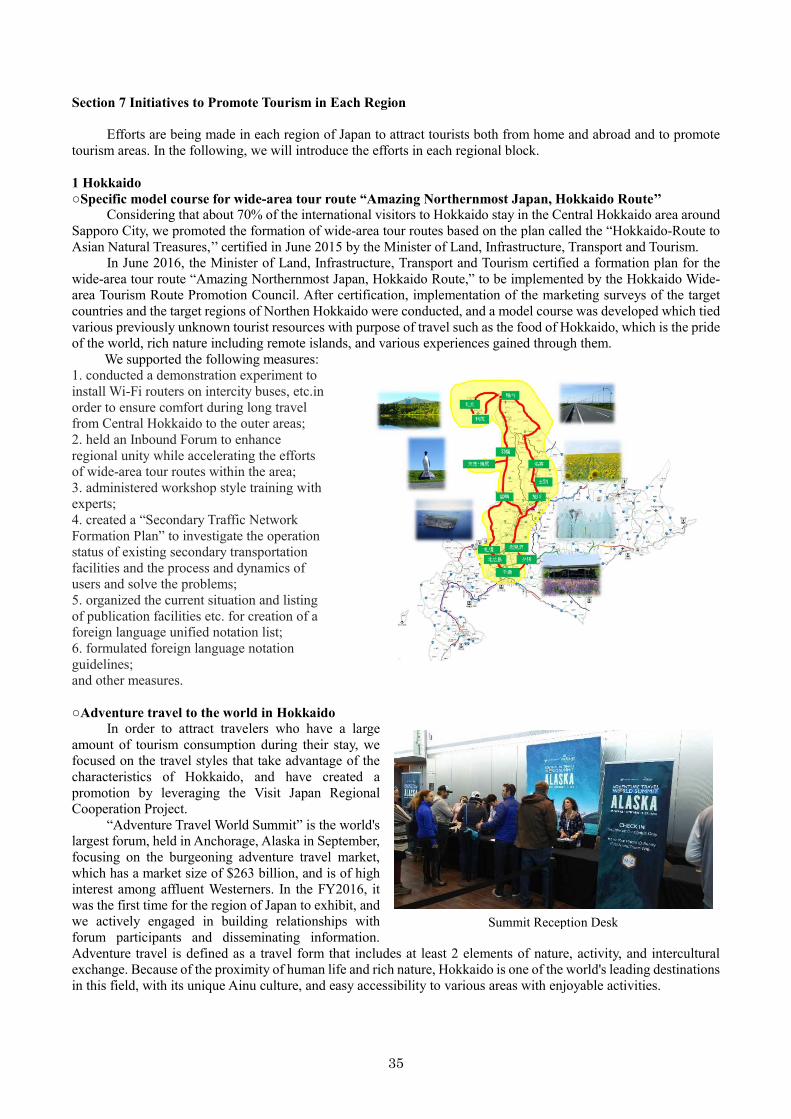
1 Hokkaido ○Specific model course for wide-area tour route “Amazing Northernmost Japan, Hokkaido Route’’
Considering that about 70% of the international visitors to Hokkaido stay in the Central Hokkaido area around Sapporo City, we promoted the formation of wide-area tour routes based on the plan called the “Hokkaido-Route to Asian Natural Treasures,’’ certified in June 2015 by the Minister of Land, Infrastructure, Transport and Tourism.
In June 2016, the Minister of Land, Infrastructure, Transport and Tourism certified a formation plan for the wide-area tour route “Amazing Northernmost Japan, Hokkaido Route,” to be implemented by the Hokkaido Wide-area Tourism Route Promotion Council. After certification, implementation of the marketing surveys of the target countries and the target regions of Northen Hokkaido were conducted, and a model course was developed which tied various previously unknown tourist resources with purpose of travel such as the food of Hokkaido, which is the pride of the world, rich nature including remote islands, and various experiences gained through them.
We supported the following measures: 1. conducted a demonstration experiment to install Wi-Fi routers on intercity buses, etc.in order to ensure comfort during long travel from Central Hokkaido to the outer areas; 2. held an Inbound Forum to enhance regional unity while accelerating the efforts of wide-area tour routes within the area; 3. administered workshop style training with experts; 4. created a “Secondary Traffic Network Formation Plan” to investigate the operation status of existing secondary transportation facilities and the process and dynamics of users and solve the problems; 5. organized the current situation and listing of publication facilities etc. for creation of a foreign language unified notation list; 6. formulated foreign language notation guidelines; and other measures. ○Adventure travel to the world in Hokkaido
In order to attract travelers who have a large amount of tourism consumption during their stay, we focused on the travel styles that take advantage of the characteristics of Hokkaido, and have created a promotion by leveraging the Visit Japan Regional Cooperation Project.
“Adventure Travel World Summit” is the world's largest forum, held in Anchorage, Alaska in September, focusing on the burgeoning adventure travel market, which has a market size of $263 billion, and is of high interest among affluent Westerners. In the FY2016, it was the first time for the region of Japan to exhibit, and we actively engaged in building relationships with forum participants and disseminating information. Adventure travel is defined as a travel form that includes at least 2 elements of nature, activity, and intercultural exchange. Because of the proximity of human life and rich nature, Hokkaido is one of the world's leading destinations in this field, with its unique Ainu culture, and easy accessibility to various areas with enjoyable activities.
Summit Reception Desk
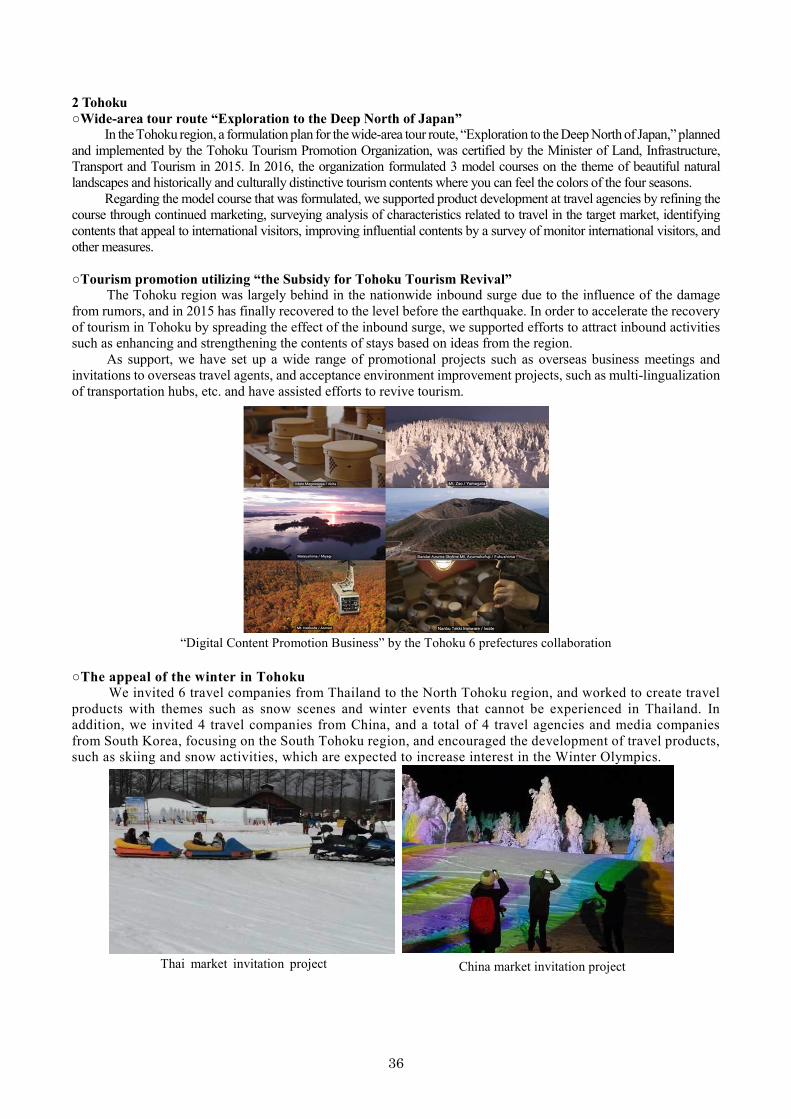
36
2 Tohoku ○Wide-area tour route “Exploration to the Deep North of Japan”
In the Tohoku region, a formulation plan for the wide-area tour route, “Exploration to the Deep North of Japan,” planned and implemented by the Tohoku Tourism Promotion Organization, was certified by the Minister of Land, Infrastructure, Transport and Tourism in 2015. In 2016, the organization formulated 3 model courses on the theme of beautiful natural landscapes and historically and culturally distinctive tourism contents where you can feel the colors of the four seasons.
Regarding the model course that was formulated, we supported product development at travel agencies by refining the course through continued marketing, surveying analysis of characteristics related to travel in the target market, identifying contents that appeal to international visitors, improving influential contents by a survey of monitor international visitors, and other measures. ○Tourism promotion utilizing “the Subsidy for Tohoku Tourism Revival”
The Tohoku region was largely behind in the nationwide inbound surge due to the influence of the damage from rumors, and in 2015 has finally recovered to the level before the earthquake. In order to accelerate the recovery of tourism in Tohoku by spreading the effect of the inbound surge, we supported efforts to attract inbound activities such as enhancing and strengthening the contents of stays based on ideas from the region.
As support, we have set up a wide range of promotional projects such as overseas business meetings and invitations to overseas travel agents, and acceptance environment improvement projects, such as multi-lingualization of transportation hubs, etc. and have assisted efforts to revive tourism.
○The appeal of the winter in Tohoku We invited 6 travel companies from Thailand to the North Tohoku region, and worked to create travel
products with themes such as snow scenes and winter events that cannot be experienced in Thailand. In addition, we invited 4 travel companies from China, and a total of 4 travel agencies and media companies from South Korea, focusing on the South Tohoku region, and encouraged the development of travel products, such as skiing and snow activities, which are expected to increase interest in the Winter Olympics.
“Digital Content Promotion Business” by the Tohoku 6 prefectures collaboration
Thai market invitation project
China market invitation project
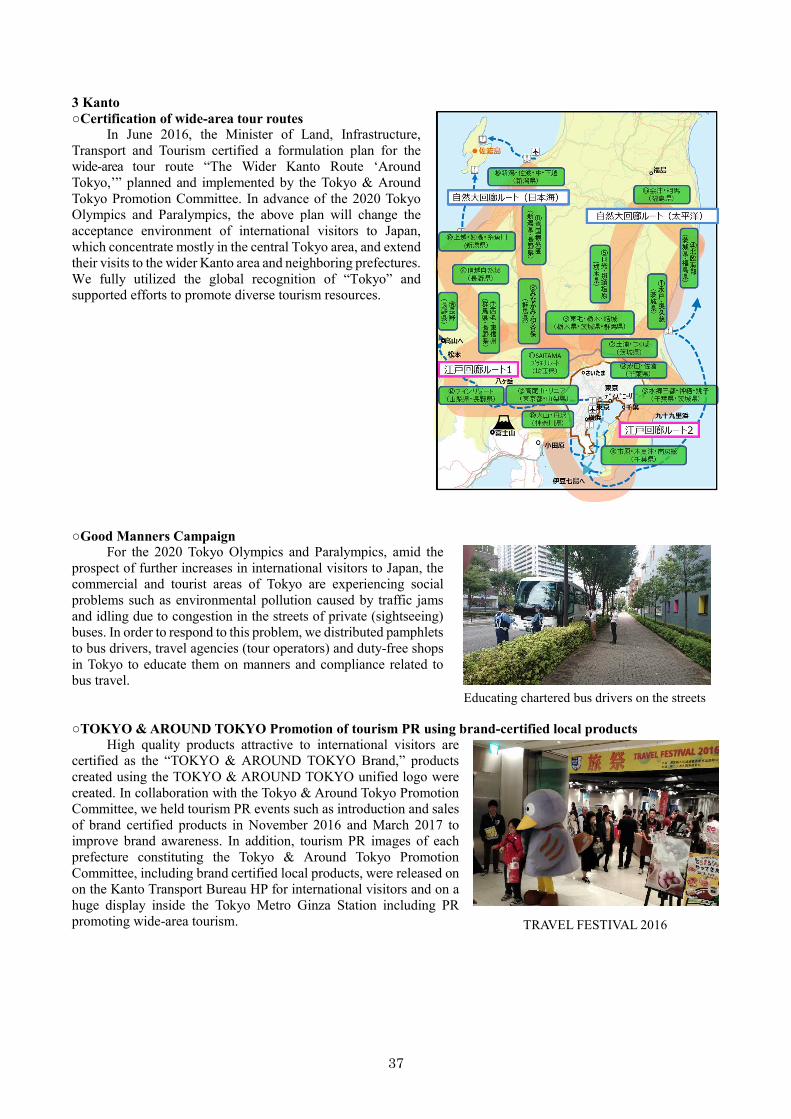
37
3 Kanto ○Certification of wide-area tour routes
In June 2016, the Minister of Land, Infrastructure, Transport and Tourism certified a formulation plan for the wide-area tour route “The Wider Kanto Route ‘Around Tokyo,’” planned and implemented by the Tokyo & Around Tokyo Promotion Committee. In advance of the 2020 Tokyo Olympics and Paralympics, the above plan will change the acceptance environment of international visitors to Japan, which concentrate mostly in the central Tokyo area, and extend their visits to the wider Kanto area and neighboring prefectures. We fully utilized the global recognition of “Tokyo” and supported efforts to promote diverse tourism resources. ○Good Manners Campaign
For the 2020 Tokyo Olympics and Paralympics, amid the prospect of further increases in international visitors to Japan, the commercial and tourist areas of Tokyo are experiencing social problems such as environmental pollution caused by traffic jams and idling due to congestion in the streets of private (sightseeing) buses. In order to respond to this problem, we distributed pamphlets to bus drivers, travel agencies (tour operators) and duty-free shops in Tokyo to educate them on manners and compliance related to bus travel. ○TOKYO & AROUND TOKYO Promotion of tourism PR using brand-certified local products
High quality products attractive to international visitors are certified as the “TOKYO & AROUND TOKYO Brand,” products created using the TOKYO & AROUND TOKYO unified logo were created. In collaboration with the Tokyo & Around Tokyo Promotion Committee, we held tourism PR events such as introduction and sales of brand certified products in November 2016 and March 2017 to improve brand awareness. In addition, tourism PR images of each prefecture constituting the Tokyo & Around Tokyo Promotion Committee, including brand certified local products, were released on on the Kanto Transport Bureau HP for international visitors and on a huge display inside the Tokyo Metro Ginza Station including PR promoting wide-area tourism.
Educating chartered bus drivers on the streets
TRAVEL FESTIVAL 2016
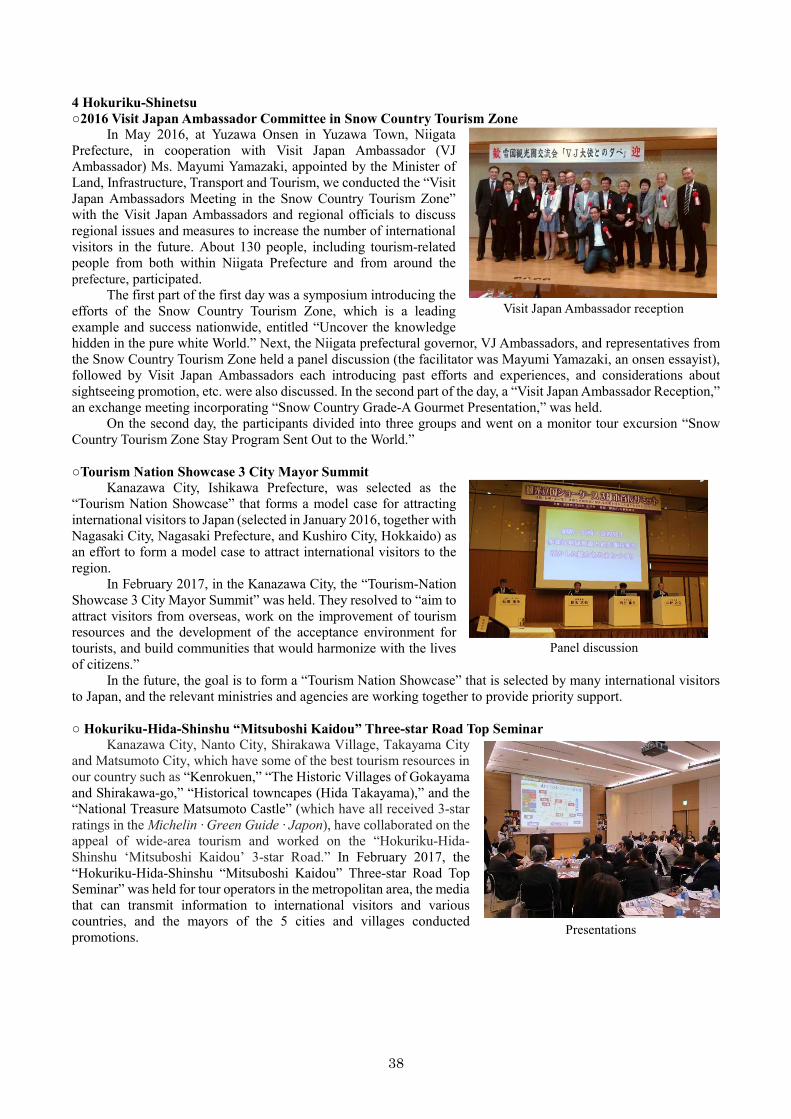
38
4 Hokuriku-Shinetsu ○2016 Visit Japan Ambassador Committee in Snow Country Tourism Zone
In May 2016, at Yuzawa Onsen in Yuzawa Town, Niigata Prefecture, in cooperation with Visit Japan Ambassador (VJ Ambassador) Ms. Mayumi Yamazaki, appointed by the Minister of Land, Infrastructure, Transport and Tourism, we conducted the “Visit Japan Ambassadors Meeting in the Snow Country Tourism Zone” with the Visit Japan Ambassadors and regional officials to discuss regional issues and measures to increase the number of international visitors in the future. About 130 people, including tourism-related people from both within Niigata Prefecture and from around the prefecture, participated.
The first part of the first day was a symposium introducing the efforts of the Snow Country Tourism Zone, which is a leading example and success nationwide, entitled “Uncover the knowledge hidden in the pure white World.” Next, the Niigata prefectural governor, VJ Ambassadors, and representatives from the Snow Country Tourism Zone held a panel discussion (the facilitator was Mayumi Yamazaki, an onsen essayist), followed by Visit Japan Ambassadors each introducing past efforts and experiences, and considerations about sightseeing promotion, etc. were also discussed. In the second part of the day, a “Visit Japan Ambassador Reception,” an exchange meeting incorporating “Snow Country Grade-A Gourmet Presentation,” was held.
On the second day, the participants divided into three groups and went on a monitor tour excursion “Snow Country Tourism Zone Stay Program Sent Out to the World.” ○Tourism Nation Showcase 3 City Mayor Summit
Kanazawa City, Ishikawa Prefecture, was selected as the “Tourism Nation Showcase” that forms a model case for attracting international visitors to Japan (selected in January 2016, together with Nagasaki City, Nagasaki Prefecture, and Kushiro City, Hokkaido) as an effort to form a model case to attract international visitors to the region.
In February 2017, in the Kanazawa City, the “Tourism-Nation Showcase 3 City Mayor Summit” was held. They resolved to “aim to attract visitors from overseas, work on the improvement of tourism resources and the development of the acceptance environment for tourists, and build communities that would harmonize with the lives of citizens.”
In the future, the goal is to form a “Tourism Nation Showcase” that is selected by many international visitors to Japan, and the relevant ministries and agencies are working together to provide priority support.
○ Hokuriku-Hida-Shinshu “Mitsuboshi Kaidou” Three-star Road Top Seminar
Kanazawa City, Nanto City, Shirakawa Village, Takayama City and Matsumoto City, which have some of the best tourism resources in our country such as “Kenrokuen,” “The Historic Villages of Gokayama and Shirakawa-go,” “Historical towncapes (Hida Takayama),” and the “National Treasure Matsumoto Castle” (which have all received 3-star ratings in the Michelin · Green Guide · Japon), have collaborated on the appeal of wide-area tourism and worked on the “Hokuriku-Hida-Shinshu ‘Mitsuboshi Kaidou’ 3-star Road.” In February 2017, the “Hokuriku-Hida-Shinshu “Mitsuboshi Kaidou” Three-star Road Top Seminar” was held for tour operators in the metropolitan area, the media that can transmit information to international visitors and various countries, and the mayors of the 5 cities and villages conducted promotions.
Visit Japan Ambassador reception
Presentations
Panel discussion
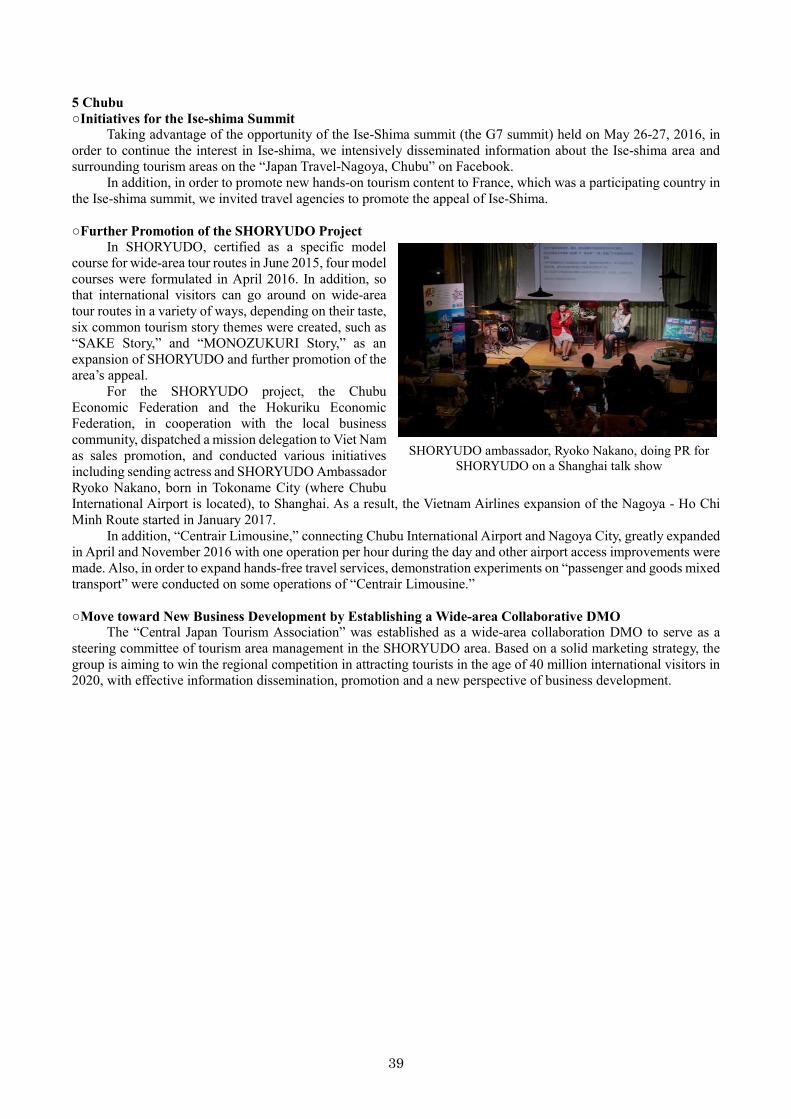
39
5 Chubu ○Initiatives for the Ise-shima Summit
Taking advantage of the opportunity of the Ise-Shima summit (the G7 summit) held on May 26-27, 2016, in order to continue the interest in Ise-shima, we intensively disseminated information about the Ise-shima area and surrounding tourism areas on the “Japan Travel-Nagoya, Chubu” on Facebook.
In addition, in order to promote new hands-on tourism content to France, which was a participating country in the Ise-shima summit, we invited travel agencies to promote the appeal of Ise-Shima.
○Further Promotion of the SHORYUDO Project
In SHORYUDO, certified as a specific model course for wide-area tour routes in June 2015, four model courses were formulated in April 2016. In addition, so that international visitors can go around on wide-area tour routes in a variety of ways, depending on their taste, six common tourism story themes were created, such as “SAKE Story,” and “MONOZUKURI Story,” as an expansion of SHORYUDO and further promotion of the area’s appeal.
For the SHORYUDO project, the Chubu Economic Federation and the Hokuriku Economic Federation, in cooperation with the local business community, dispatched a mission delegation to Viet Nam as sales promotion, and conducted various initiatives including sending actress and SHORYUDO Ambassador Ryoko Nakano, born in Tokoname City (where Chubu International Airport is located), to Shanghai. As a result, the Vietnam Airlines expansion of the Nagoya - Ho Chi Minh Route started in January 2017.
In addition, “Centrair Limousine,” connecting Chubu International Airport and Nagoya City, greatly expanded in April and November 2016 with one operation per hour during the day and other airport access improvements were made. Also, in order to expand hands-free travel services, demonstration experiments on “passenger and goods mixed transport” were conducted on some operations of “Centrair Limousine.” ○Move toward New Business Development by Establishing a Wide-area Collaborative DMO
The “Central Japan Tourism Association” was established as a wide-area collaboration DMO to serve as a steering committee of tourism area management in the SHORYUDO area. Based on a solid marketing strategy, the group is aiming to win the regional competition in attracting tourists in the age of 40 million international visitors in 2020, with effective information dissemination, promotion and a new perspective of business development.
SHORYUDO ambassador, Ryoko Nakano, doing PR for SHORYUDO on a Shanghai talk show
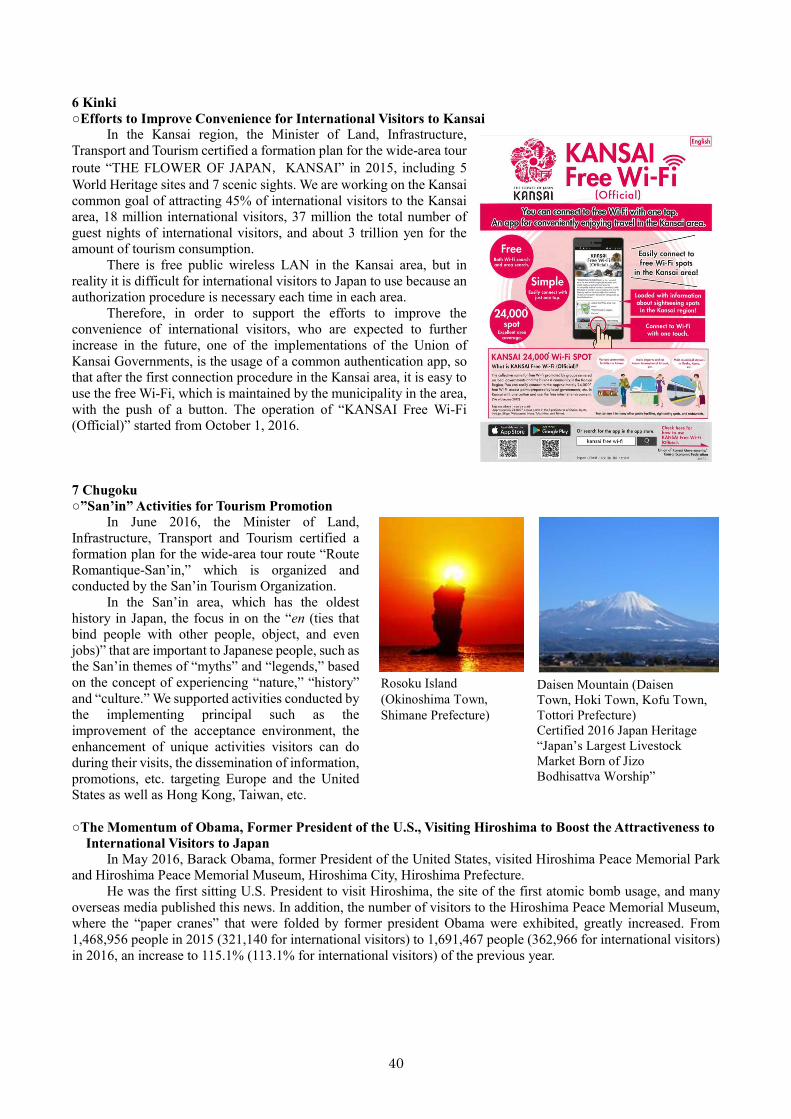
40
6 Kinki ○Efforts to Improve Convenience for International Visitors to Kansai
In the Kansai region, the Minister of Land, Infrastructure, Transport and Tourism certified a formation plan for the wide-area tour route “THE FLOWER OF JAPAN,KANSAI” in 2015, including 5 World Heritage sites and 7 scenic sights. We are working on the Kansai common goal of attracting 45% of international visitors to the Kansai area, 18 million international visitors, 37 million the total number of guest nights of international visitors, and about 3 trillion yen for the amount of tourism consumption.
There is free public wireless LAN in the Kansai area, but in reality it is difficult for international visitors to Japan to use because an authorization procedure is necessary each time in each area.
Therefore, in order to support the efforts to improve the convenience of international visitors, who are expected to further increase in the future, one of the implementations of the Union of Kansai Governments, is the usage of a common authentication app, so that after the first connection procedure in the Kansai area, it is easy to use the free Wi-Fi, which is maintained by the municipality in the area, with the push of a button. The operation of “KANSAI Free Wi-Fi (Official)” started from October 1, 2016. 7 Chugoku ○”San’in” Activities for Tourism Promotion
In June 2016, the Minister of Land, Infrastructure, Transport and Tourism certified a formation plan for the wide-area tour route “Route Romantique-San’in,” which is organized and conducted by the San’in Tourism Organization.
In the San’in area, which has the oldest history in Japan, the focus in on the “en (ties that bind people with other people, object, and even jobs)” that are important to Japanese people, such as the San’in themes of “myths” and “legends,” based on the concept of experiencing “nature,” “history” and “culture.” We supported activities conducted by the implementing principal such as the improvement of the acceptance environment, the enhancement of unique activities visitors can do during their visits, the dissemination of information, promotions, etc. targeting Europe and the United States as well as Hong Kong, Taiwan, etc. ○The Momentum of Obama, Former President of the U.S., Visiting Hiroshima to Boost the Attractiveness to
International Visitors to Japan In May 2016, Barack Obama, former President of the United States, visited Hiroshima Peace Memorial Park
and Hiroshima Peace Memorial Museum, Hiroshima City, Hiroshima Prefecture. He was the first sitting U.S. President to visit Hiroshima, the site of the first atomic bomb usage, and many
overseas media published this news. In addition, the number of visitors to the Hiroshima Peace Memorial Museum, where the “paper cranes” that were folded by former president Obama were exhibited, greatly increased. From 1,468,956 people in 2015 (321,140 for international visitors) to 1,691,467 people (362,966 for international visitors) in 2016, an increase to 115.1% (113.1% for international visitors) of the previous year.
Rosoku Island (Okinoshima Town, Shimane Prefecture)
Daisen Mountain (Daisen Town, Hoki Town, Kofu Town, Tottori Prefecture) Certified 2016 Japan Heritage “Japan’s Largest Livestock Market Born of Jizo Bodhisattva Worship”
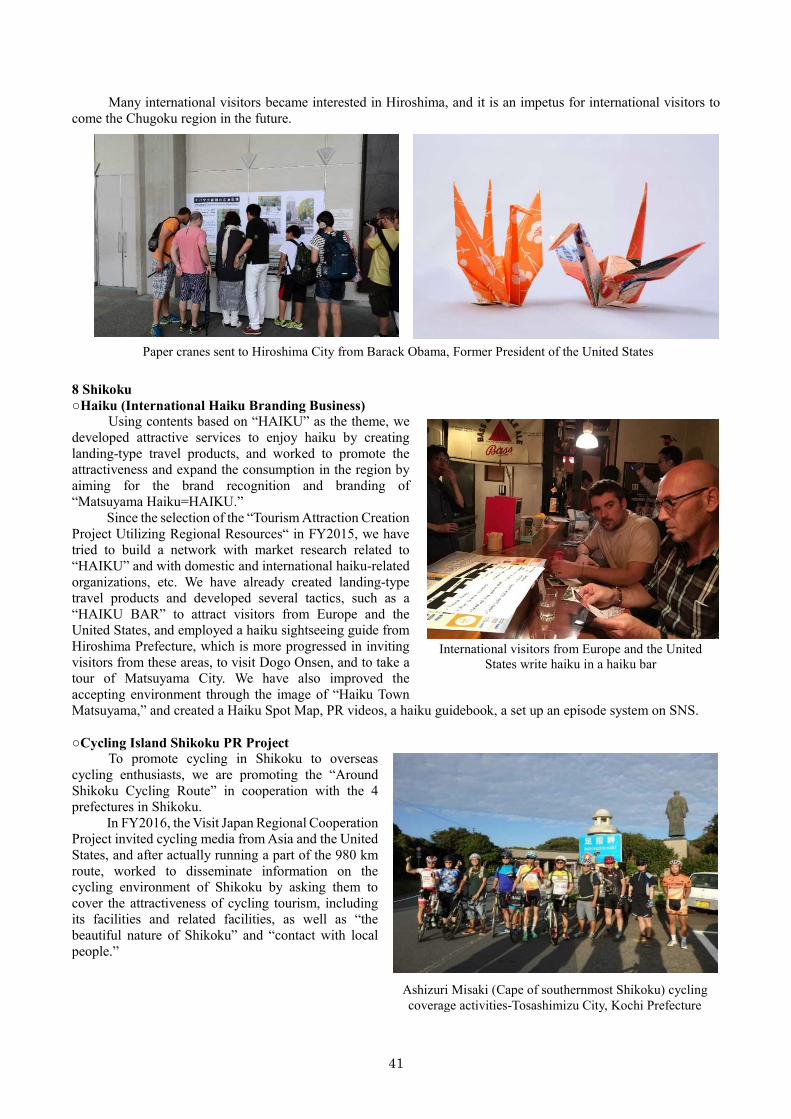
41
Many international visitors became interested in Hiroshima, and it is an impetus for international visitors to come the Chugoku region in the future.
8 Shikoku ○Haiku (International Haiku Branding Business)
Using contents based on “HAIKU” as the theme, we developed attractive services to enjoy haiku by creating landing-type travel products, and worked to promote the attractiveness and expand the consumption in the region by aiming for the brand recognition and branding of “Matsuyama Haiku=HAIKU.”
Since the selection of the “Tourism Attraction Creation Project Utilizing Regional Resources“ in FY2015, we have tried to build a network with market research related to “HAIKU” and with domestic and international haiku-related organizations, etc. We have already created landing-type travel products and developed several tactics, such as a “HAIKU BAR” to attract visitors from Europe and the United States, and employed a haiku sightseeing guide from Hiroshima Prefecture, which is more progressed in inviting visitors from these areas, to visit Dogo Onsen, and to take a tour of Matsuyama City. We have also improved the accepting environment through the image of “Haiku Town Matsuyama,” and created a Haiku Spot Map, PR videos, a haiku guidebook, a set up an episode system on SNS.
○Cycling Island Shikoku PR Project
To promote cycling in Shikoku to overseas cycling enthusiasts, we are promoting the “Around Shikoku Cycling Route” in cooperation with the 4 prefectures in Shikoku.
In FY2016, the Visit Japan Regional Cooperation Project invited cycling media from Asia and the United States, and after actually running a part of the 980 km route, worked to disseminate information on the cycling environment of Shikoku by asking them to cover the attractiveness of cycling tourism, including its facilities and related facilities, as well as “the beautiful nature of Shikoku” and “contact with local people.”
Ashizuri Misaki (Cape of southernmost Shikoku) cycling coverage activities-Tosashimizu City, Kochi Prefecture
International visitors from Europe and the United States write haiku in a haiku bar
Paper cranes sent to Hiroshima City from Barack Obama, Former President of the United States
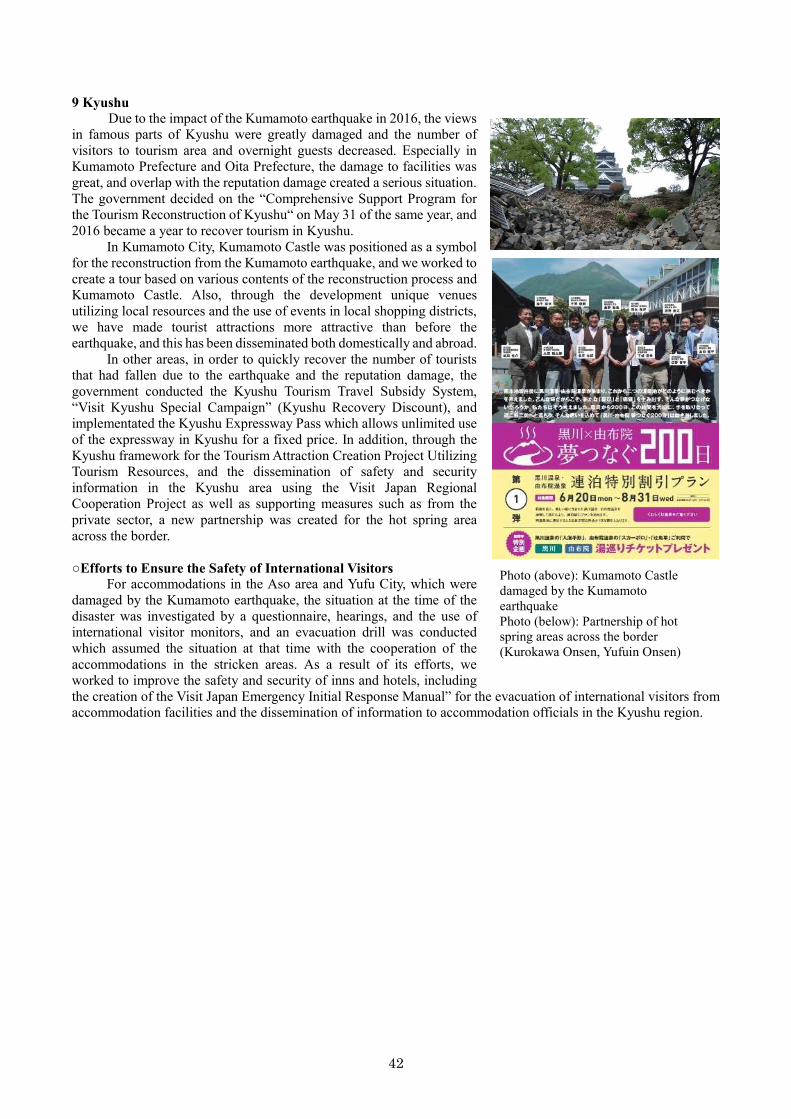
42
9 Kyushu Due to the impact of the Kumamoto earthquake in 2016, the views
in famous parts of Kyushu were greatly damaged and the number of visitors to tourism area and overnight guests decreased. Especially in Kumamoto Prefecture and Oita Prefecture, the damage to facilities was great, and overlap with the reputation damage created a serious situation. The government decided on the “Comprehensive Support Program for the Tourism Reconstruction of Kyushu“ on May 31 of the same year, and 2016 became a year to recover tourism in Kyushu.
In Kumamoto City, Kumamoto Castle was positioned as a symbol for the reconstruction from the Kumamoto earthquake, and we worked to create a tour based on various contents of the reconstruction process and Kumamoto Castle. Also, through the development unique venues utilizing local resources and the use of events in local shopping districts, we have made tourist attractions more attractive than before the earthquake, and this has been disseminated both domestically and abroad.
In other areas, in order to quickly recover the number of tourists that had fallen due to the earthquake and the reputation damage, the government conducted the Kyushu Tourism Travel Subsidy System, “Visit Kyushu Special Campaign” (Kyushu Recovery Discount), and implementated the Kyushu Expressway Pass which allows unlimited use of the expressway in Kyushu for a fixed price. In addition, through the Kyushu framework for the Tourism Attraction Creation Project Utilizing Tourism Resources, and the dissemination of safety and security information in the Kyushu area using the Visit Japan Regional Cooperation Project as well as supporting measures such as from the private sector, a new partnership was created for the hot spring area across the border. ○Efforts to Ensure the Safety of International Visitors
For accommodations in the Aso area and Yufu City, which were damaged by the Kumamoto earthquake, the situation at the time of the disaster was investigated by a questionnaire, hearings, and the use of international visitor monitors, and an evacuation drill was conducted which assumed the situation at that time with the cooperation of the accommodations in the stricken areas. As a result of its efforts, we worked to improve the safety and security of inns and hotels, including the creation of the Visit Japan Emergency Initial Response Manual” for the evacuation of international visitors from accommodation facilities and the dissemination of information to accommodation officials in the Kyushu region.
Photo (above): Kumamoto Castle damaged by the Kumamoto earthquake Photo (below): Partnership of hot spring areas across the border (Kurokawa Onsen, Yufuin Onsen)
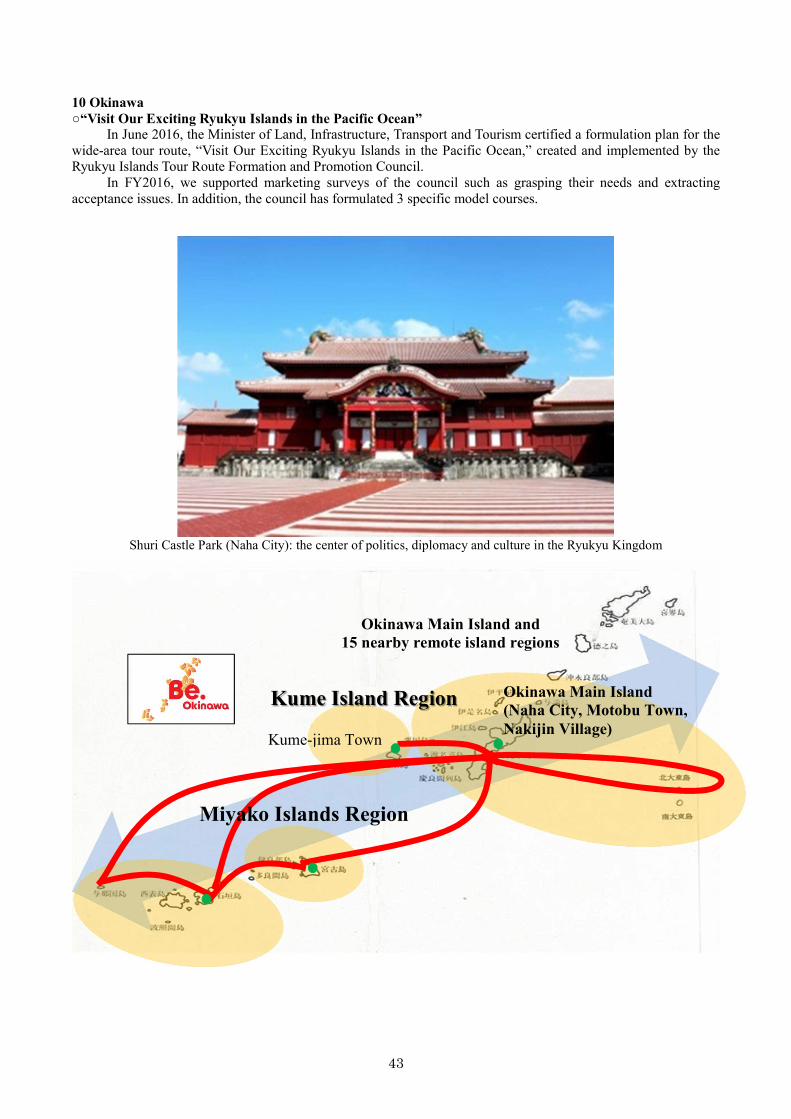
43
10 Okinawa ○“Visit Our Exciting Ryukyu Islands in the Pacific Ocean”
In June 2016, the Minister of Land, Infrastructure, Transport and Tourism certified a formulation plan for the wide-area tour route, “Visit Our Exciting Ryukyu Islands in the Pacific Ocean,” created and implemented by the Ryukyu Islands Tour Route Formation and Promotion Council.
In FY2016, we supported marketing surveys of the council such as grasping their needs and extracting acceptance issues. In addition, the council has formulated 3 specific model courses.
Shuri Castle Park (Naha City): the center of politics, diplomacy and culture in the Ryukyu Kingdom
Okinawa Main Island and 15 nearby remote island regions
Miyako Islands Region
Okinawa Main Island (Naha City, Motobu Town, Nakijin Village)
Kume-jima Town
Kume Island Region

44
Notes: 1. In Section 7, “a region” refers to the jurisdictional area of a District Transport Bureau.
2. The Tohoku region: the prefectures of Aomori, Iwate, Miyagi, Akita, Yamagata and Fukushima 3. The Kanto region: the prefectures of Ibaraki, Tochigi, Gumma, Saitama, Chiba, Tokyo, Kanagawa and
Yamanashi 4. The Hokuriku Shin-etsu region: the prefectures of Niigata, Toyama, Ishikawa and Nagano
5. The Chubu region: the prefectures of Fukui, Gifu, Shizuoka, Aichi and Mie 6. The Kinki region: the prefectures of Shiga, Kyoto, Osaka, Hyogo, Nara and Wakayama 7. The Chugoku region: the prefectures of Tottori, Shimane, Okayama, Hiroshima and Yamaguchi 8. The Shikoku region: the prefectures of Tokushima, Kagawa, Ehime and Kochi 9. The Kyushu region: the prefectures of Fukuoka, Saga, Nagasaki, Kumamoto, Oita, Miyazaki and
Kagoshima


![Tourism month calendar of events [r]](https://img.pdfslide.net/doc/110x75/55a280b91a28ab26408b481f/tourism-month-calendar-of-events-r.jpg)