Embed Size (px)
Citation preview

PERFORMANCEwhite paper:
AT PEAK
© StoreForce Solutions Inc.

2
PEAK PERFORMANCEEachweek,50%ofaretailstore’ssaleshappensduringonly20ofthestore’sopenhours.Didyouknowthat?
Yourecognizeyourpeaktimesarebusy,butwouldyoubesurprisedtofindthathalfofretailstoresaleshappenduringonlyaquarterofthestore’sopenhours?
THE50/20RULE
Whilethe50/20rulemayvaryslightlyfromretailertoretailer,observingandanalyzingretailstoreperformanceovermany
yearsandmanyclientshasconsistentlyproventhe50/20rule.
WhilethisisanindisputablefactinSpecialtyRetail,itrequiresadeeperlevelofunderstandingtoturnthe50/20principleintosomethingactionable.Itstartsbybeingabletopredictwhenthose20hourswilloccurforeachstore.
2

�3BACKGROUNDBetter Schedules Drive Measurable Improvements in Performance
PEAK HOURS MATTER TO ALL RETAILERS
Thereisalsoanunfoundedtheorythatonlyhightrafficretailersneedtoworryaboutstaffingupduringthepeakhoursintheweek.Ourexperiencecontradictsthisbelief.
INCREASED PEAK COVERAGE = INCREASED SWING
Whilealowvolumestorewithasmallcontingentofassociatesmightnotseemlikeastorethatneedstofollowpeakcoverageclosely,intruth,missingapeakopportunityhasalargeimpactonresults.MultipleAssociatesworkingatonetimeisarareoccurrenceinalowvolumestore.Missingpeakcoverageinthisenvironmentleadstoalostopportunitythatcannotbeeasilyrecoupedasthevolumeoffoottrafficsimplywon’tallowforit.
Conversely,effectivelyapplyingthosefewprecioushoursthatalowvolumestoremayreceiveinexcessofminimumcoveragecangeneratesalesincreasesyoumaynothavethoughtwerepossible.
Mostcurrentretailtechnologyiscapableofanalyzinglargeamountsofgranulardatatoforecastthecustomerpatternsuniquetoaspecificstoreforanyweekoftheyear.
Fromthere,advancedschedulingtoolscancombinethisforecastedtrafficcurvewithlegislationandshiftrulestoproduceanoptimumschedulethatmirrorsthehighsandlowsofwhencustomersactuallystepacrosstheleaseline.
Thisallowsaretailertoaccuratelyscheduletherightnumberofassociatesaswellasyourbestperformingassociatesduringthepeak20hoursoftheirbusiness.Asdiverseasretailersare,andasvariedthesizeandshapeoftheirstoresare,ensuringthatthepeak20hoursarestaffedproperlyisthemosteffectivewaytodrivetop-lineperformance.
Retailers that increase peak coverage by 10% increase Swing by 4-6%.
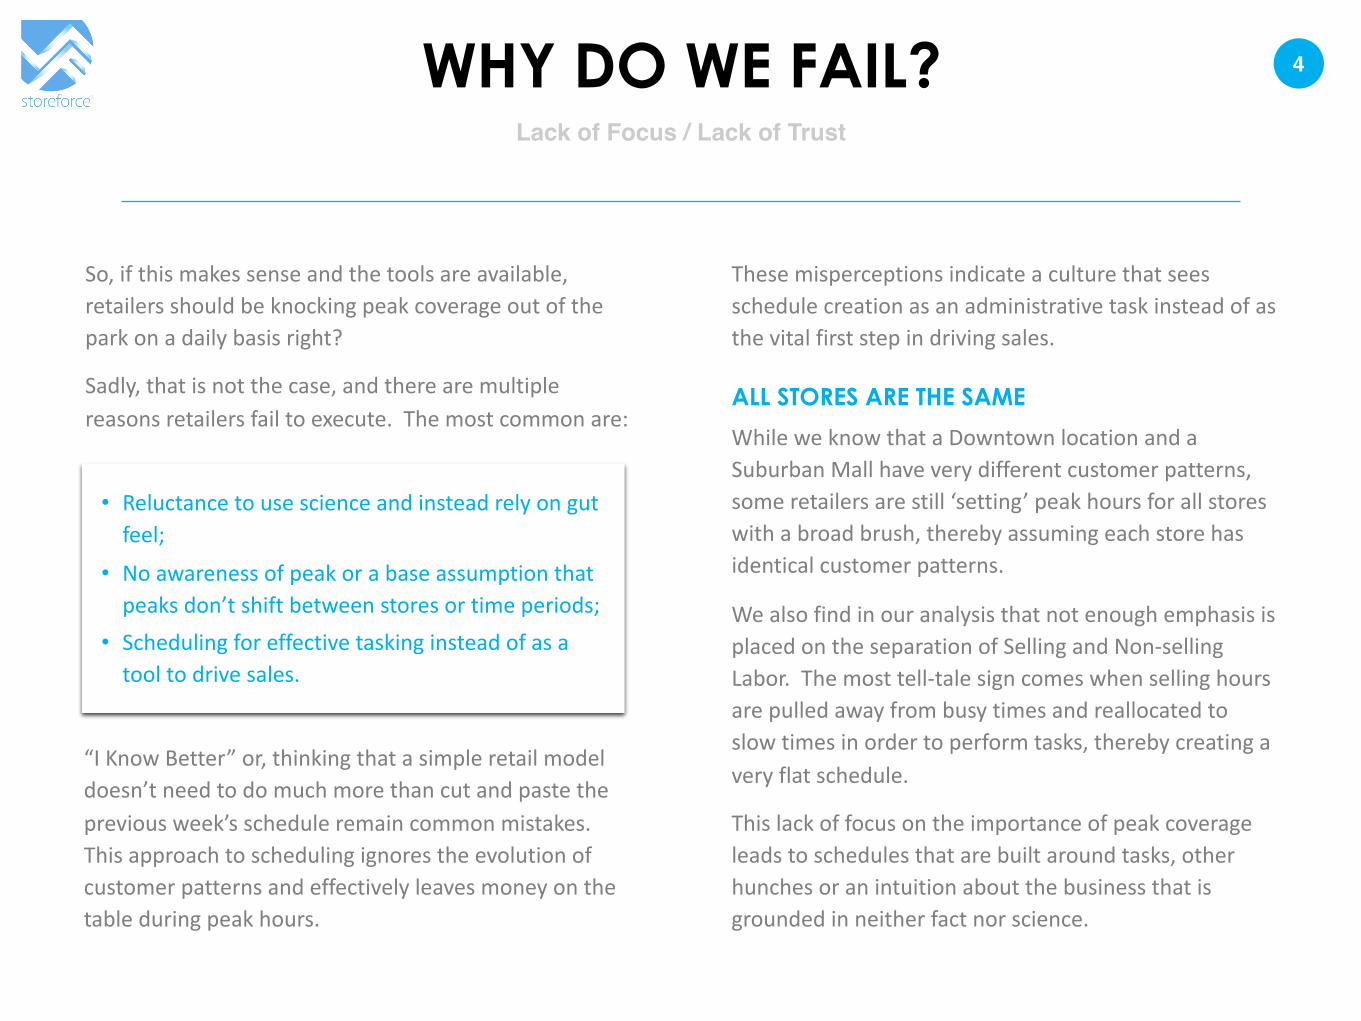
�4WHY DO WE FAIL?
Thesemisperceptionsindicateaculturethatseesschedulecreationasanadministrativetaskinsteadofasthevitalfirststepindrivingsales.
ALL STORES ARE THE SAME
WhileweknowthataDowntownlocationandaSuburbanMallhaveverydifferentcustomerpatterns,someretailersarestill‘setting’peakhoursforallstoreswithabroadbrush,therebyassumingeachstorehasidenticalcustomerpatterns.
WealsofindinouranalysisthatnotenoughemphasisisplacedontheseparationofSellingandNon-sellingLabor.Themosttell-talesigncomeswhensellinghoursarepulledawayfrombusytimesandreallocatedtoslowtimesinordertoperformtasks,therebycreatingaveryflatschedule.
Thislackoffocusontheimportanceofpeakcoverageleadstoschedulesthatarebuiltaroundtasks,otherhunchesoranintuitionaboutthebusinessthatisgroundedinneitherfactnorscience.
So,ifthismakessenseandthetoolsareavailable,retailersshouldbeknockingpeakcoverageoutoftheparkonadailybasisright?
Sadly,thatisnotthecase,andtherearemultiplereasonsretailersfailtoexecute.Themostcommonare:
Lack of Focus / Lack of Trust
• Reluctancetousescienceandinsteadrelyongutfeel;
• Noawarenessofpeakorabaseassumptionthatpeaksdon’tshiftbetweenstoresortimeperiods;
• Schedulingforeffectivetaskinginsteadofasatooltodrivesales.
“IKnowBetter”or,thinkingthatasimpleretailmodeldoesn’tneedtodomuchmorethancutandpastethepreviousweek’sscheduleremaincommonmistakes.Thisapproachtoschedulingignorestheevolutionofcustomerpatternsandeffectivelyleavesmoneyonthetableduringpeakhours.

5
MEASURING PEAKDoescoveringthepeakhoursreallydriveperformance?
TheobjectiveofthePeakCoverageAssessmentistobenchmarkeachstoreinaretailchainagainsteachotherinordertoquantifytherelationshipbetweeneffectivepeakschedulingandperformance.
Todothis,wemustbeabletoscorebothpeakcoverageandperformanceduringPeakSegments(periods).
PeakCoveragescoresarecalculatedforeachstore,withthescore
representingthe%ofrecommendedcoverage(assuggestedbyanadvancedschedulesystem)thatwasachievedonthescheduleduringPeakSegmentsonly.
StoresaregroupedbycoveragescoresandthenYearonYearandSalestoTrafficKPIsforeachgroupareusedtocalculatetheperformancecomparative.

�6
KEY CONCEPTSInthefollowingassessment,PeakCoverageScoreswereusedtogroupstoresintoHighandLowPeakCoveragegroups.Thethresholdusedwas90%-thatis,ifastorescheduledatleast90%oftherecommendedhoursduringpeak,thatstorewasputintheHighPeakCoveragegroup.
TheperformanceassessmentwasthenconductedbycomparingtheperformanceofHighPeakCoverageStorestotheremainingstorestoidentifyifimprovementinPeakCoverageimpactedperformance.
KEY KPIS: VISIT VALUE (“VV”) AND SWING
VisitValueindicatesthevalueofeachcustomerenteringthestore(Sales/Traffic).AnincreaseinVVisadirectresultofanincreaseinConversion,AverageTransactionorboth.“Swing”neutralizestheeffectoftrafficonsales(%YoYSalesChange-%YoYTrafficChange).ApositiveSwingindicatesthatastoreisperformingbetterregardlessoftraffic.TheseKPIsalongwithSales,ConversionUPTandAverageTransactionareusedintheassessment.
PEAK COVERAGE AND KPI PERFORMANCE
Exclude Non-Comp Stores
Eliminate stores with insufficient historical data to evaluate a change in performance from last year to avoid skewing results.
High and Low Groups
These groups are established by force ranking the Peak Coverage Score, and then dividing the stores into two groups. High Coverage stores are stores covering 90% (or greater) of the peak recommended hours during the analysis period. Low Coverage stores are below 90%;
Peak CoverageRepresents the % of recommended coverage that was achieved on the schedule during Peak Segments only;

�7THE FINDINGS
Moststoresthatwehaveanalyzedaresetuptocoverpeaksegmentsequally.Thefactthatsomedoandsomedonotisrelatedtoeitheragapintrainingorabeliefthatpeakcoverageisnotasimportantasotherprioritieswithinthebusiness.Thegoodnewsisgapsintrainingormisalignedprioritiescanbecoached,andiftheyare,resultswillfollow
ThegraphaboveillustratesthecommonthemebetweenHighandLowPeakCoveragestores.Lowcoveragestoresroutinelypullhoursintothemiddleoftheweek,awayfromthemajorityofpeaksegmentsontheweekends,insomecasesrepurposingsellinghourstofocusontasks.
FurtherAnalysisofLaborStatisticssuchasAverageShiftlength,PeoplePeropenHour(PPOH),Availability%andotherschedulingKPIscanhelpidentifyiftheissueisrelatedtonotbeingabletoexecute,ornotbeingwillingtoexecute.
LaborStatsAverage
ShiftLengthSchedulingFlexibility%
Avail%-Peak Sell% SPH PPOH TPLH
%FTSellHours
%FTTotalHours
High 6.63 25.2% 66.9% 53.9% $261 7.9 7.6 57.9% 55.5%Low 6.70 29.3% 65.8% 49.9% $298 7.4 8.9 54.7% 52.6%
Difference (0.06) -4.0% 1.1% 4.0% -$37 0.5 (1.3) 3.2% 2.9%
Overallthereislittledifferencebetweenthetwogroupsonthevariablesthatallowforflexibleschedulingandtheabilitytohitgoodpeakcoveragestores.Typicallyweseethatthisdoesnotappeartobeastaffcomplementissue.

�8THE RESULTS
A 10% IMPROVEMENT IN PEAK COVERAGE % RESULTS IN A 4% INCREASE IN SWING
AnalysisafteranalysishasproventhatpeakcoveragehasacorrelationtoKPI’ssuchasSwing,VisitValue,ConversionAverageTransactionsizeandultimatelySales. VISIT VALUE
2-5% growth in visit value compared to low peakcoverage stores
ATV2-5% growth in ATV compared to low peakcoverage stores
CONVERSIONOver 2% growth in Conversion compared to low peak coverage stores
Swin
g
-40%-30%-20%-10%
0%10%20%30%40%
Peak Coverage %
50% 63% 75% 88% 100%

www.storeforcesolutions.com
91TycosDr.,Suite202,Toronto,ON
+1(416)642-7438
CONTACT USToronto, Canada
Brighton, United Kingdom
Sydney, Australia
South Africa, Africa