Embed Size (px)
Citation preview
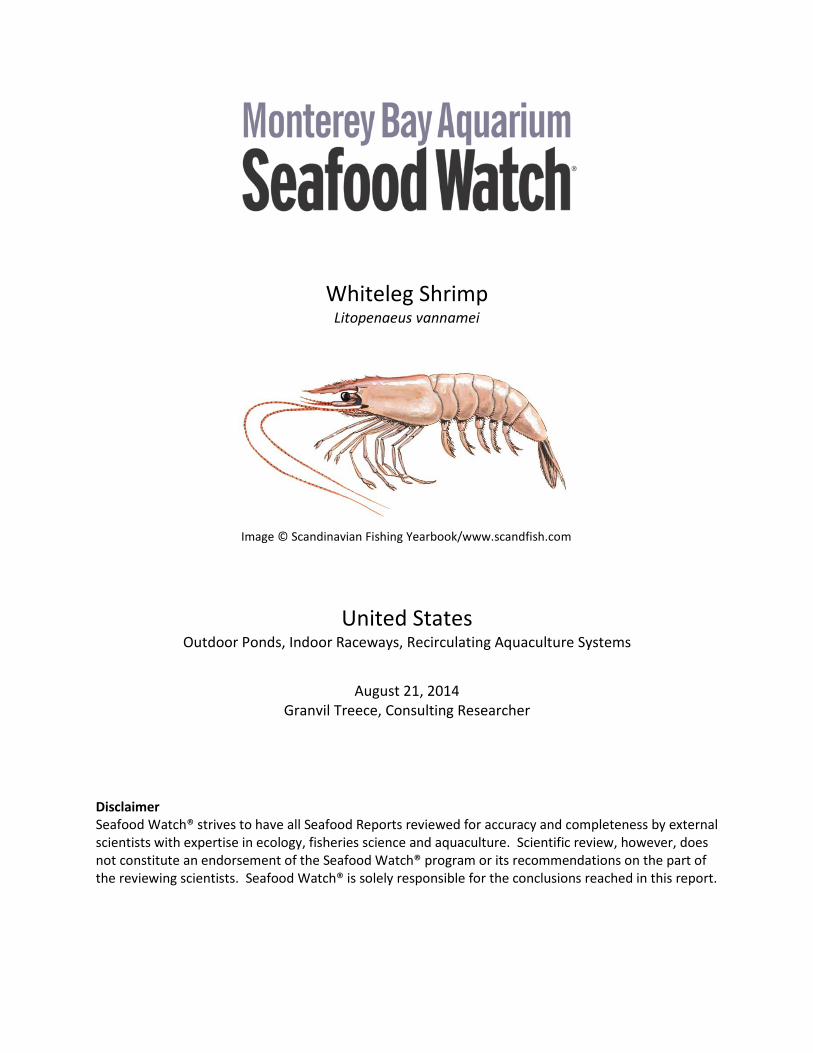
Whiteleg Shrimp Litopenaeus vannamei
Image © Scandinavian Fishing Yearbook/www.scandfish.com
United States Outdoor Ponds, Indoor Raceways, Recirculating Aquaculture Systems
August 21, 2014
Granvil Treece, Consulting Researcher
Disclaimer Seafood Watch® strives to have all Seafood Reports reviewed for accuracy and completeness by external scientists with expertise in ecology, fisheries science and aquaculture. Scientific review, however, does not constitute an endorsement of the Seafood Watch® program or its recommendations on the part of the reviewing scientists. Seafood Watch® is solely responsible for the conclusions reached in this report.
2
About Seafood Watch® The Monterey Bay Aquarium Seafood Watch® program evaluates the ecological sustainability of wild-caught and farmed seafood commonly found in the North American marketplace. Seafood Watch defines sustainable seafood as originating from sources, whether wild-caught or farmed, which can maintain or increase production in the long-term without jeopardizing the structure or function of affected ecosystems. The program’s mission is to engage and empower consumers and businesses to purchase environmentally responsible seafood fished or farmed in ways that minimize their impact on the environment or are in a credible improvement project with the same goal. Each sustainability recommendation is supported by a seafood report. Each report synthesizes and analyzes the most current ecological, fisheries and ecosystem science on a species, then evaluates this information against the program’s sustainability criteria to arrive at a recommendation of “Best Choice,” “Good Alternative,” or “Avoid.” In producing the seafood reports, Seafood Watch utilizes research published in academic, peer-reviewed journals whenever possible. Other sources of information include government technical publications, fishery management plans and supporting documents, and other scientific reviews of ecological sustainability. Seafood Watch research analysts also communicate with ecologists, fisheries and aquaculture scientists, and members of industry and conservation organizations when evaluating fisheries and aquaculture practices. Capture fisheries and aquaculture practices are highly dynamic; as the scientific information on each species changes, Seafood Watch’s sustainability recommendations and the underlying seafood reports will be updated to reflect these changes. Both the detailed evaluation methodology and the scientific reports, are available on seafoodwatch.org. For more information about Seafood Watch and seafood reports, please contact the Seafood Watch program at Monterey Bay Aquarium by calling 1-877-229-9990 or visit online at seafoodwatch.org. Disclaimer Seafood Watch® strives to ensure all its seafood reports and the recommendations contained therein are accurate and reflect the most up-to-date evidence available at time of publication. All our reports are peer reviewed for accuracy and completeness by external scientists with expertise in ecology, fisheries science or aquaculture. Scientific review, however, does not constitute an endorsement of the Seafood Watch program or its recommendations on the part of the reviewing scientists. Seafood Watch is solely responsible for the conclusions reached in this report. The program welcomes additional or updated data that can be used for the next revision. Seafood Watch and seafood reports are made possible through a grant from the David and Lucile Packard Foundation.
3
Guiding Principles Seafood Watch defines sustainable seafood as originating from sources, whether fished1 or farmed, that can maintain or increase production in the long-term without jeopardizing the structure or function of affected ecosystems. The following guiding principles illustrate the qualities that aquaculture must possess to be considered sustainable by the Seafood Watch program: Seafood Watch will: • Support data transparency and therefore aquaculture producers or industries that make
information and data on production practices and their impacts available to relevant stakeholders.
• Promote aquaculture production that minimizes or avoids the discharge of wastes at the farm level in combination with an effective management or regulatory system to control the location, scale and cumulative impacts of the industry’s waste discharges beyond the immediate vicinity of the farm.
• Promote aquaculture production at locations, scales and intensities that cumulatively maintain the functionality of ecologically valuable habitats without unreasonably penalizing historic habitat damage.
• Promote aquaculture production that by design, management or regulation avoids the use and discharge of chemicals toxic to aquatic life, and/or effectively controls the frequency, risk of environmental impact and risk to human health of their use.
• Within the typically limited data availability, use understandable quantitative and relative indicators to recognize the global impacts of feed production and the efficiency of conversion of feed ingredients to farmed seafood.
• Promote aquaculture operations that pose no substantial risk of deleterious effects to wild fish or shellfish populations through competition, habitat damage, genetic introgression, hybridization, spawning disruption, changes in trophic structure or other impacts associated with the escape of farmed fish or other unintentionally introduced species.
• Promote aquaculture operations that pose no substantial risk of deleterious effects to wild populations through the amplification and retransmission of pathogens or parasites.
• Promote the use of eggs, larvae, or juvenile fish produced in hatcheries using domesticated broodstocks thereby avoiding the need for wild capture.
1 “Fish” is used throughout this document to refer to finfish, shellfish and other invertebrates.
4
• Recognize that energy use varies greatly among different production systems and can be a major impact category for some aquaculture operations, and also recognize that improving practices for some criteria may lead to more energy intensive production systems (e.g., promoting more energy intensive closed recirculation systems).
Once a score and rank has been assigned to each criterion, an overall seafood recommendation is developed on additional evaluation guidelines. Criteria ranks and the overall recommendation are color-coded to correspond to the categories on the Seafood Watch pocket guide: Best Choices/Green: Are well managed and caught or farmed in environmentally friendly ways. Good Alternatives/Yellow: Buy, but be aware there are concerns with how they’re caught or farmed. Avoid/Red: Take a pass on these. These items are overfished or caught or farmed in ways that harm other marine life or the environment.
5
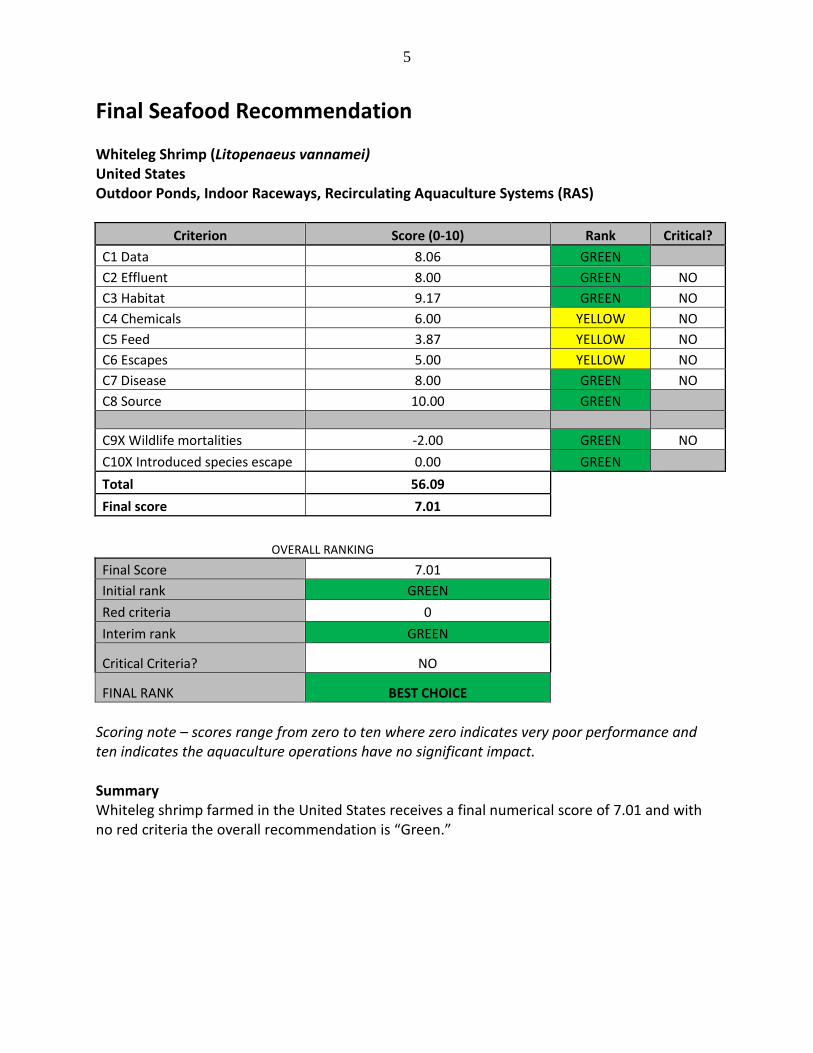
Final Seafood Recommendation Whiteleg Shrimp (Litopenaeus vannamei) United States Outdoor Ponds, Indoor Raceways, Recirculating Aquaculture Systems (RAS)
Criterion Score (0-10) Rank Critical? C1 Data 8.06 GREEN C2 Effluent 8.00 GREEN NO C3 Habitat 9.17 GREEN NO C4 Chemicals 6.00 YELLOW NO C5 Feed 3.87 YELLOW NO C6 Escapes 5.00 YELLOW NO C7 Disease 8.00 GREEN NO C8 Source 10.00 GREEN C9X Wildlife mortalities -2.00 GREEN NO C10X Introduced species escape 0.00 GREEN Total 56.09 Final score 7.01
OVERALL RANKING Final Score 7.01 Initial rank GREEN Red criteria 0 Interim rank GREEN
Critical Criteria? NO
FINAL RANK BEST CHOICE Scoring note – scores range from zero to ten where zero indicates very poor performance and ten indicates the aquaculture operations have no significant impact.
Summary Whiteleg shrimp farmed in the United States receives a final numerical score of 7.01 and with no red criteria the overall recommendation is “Green.”
6
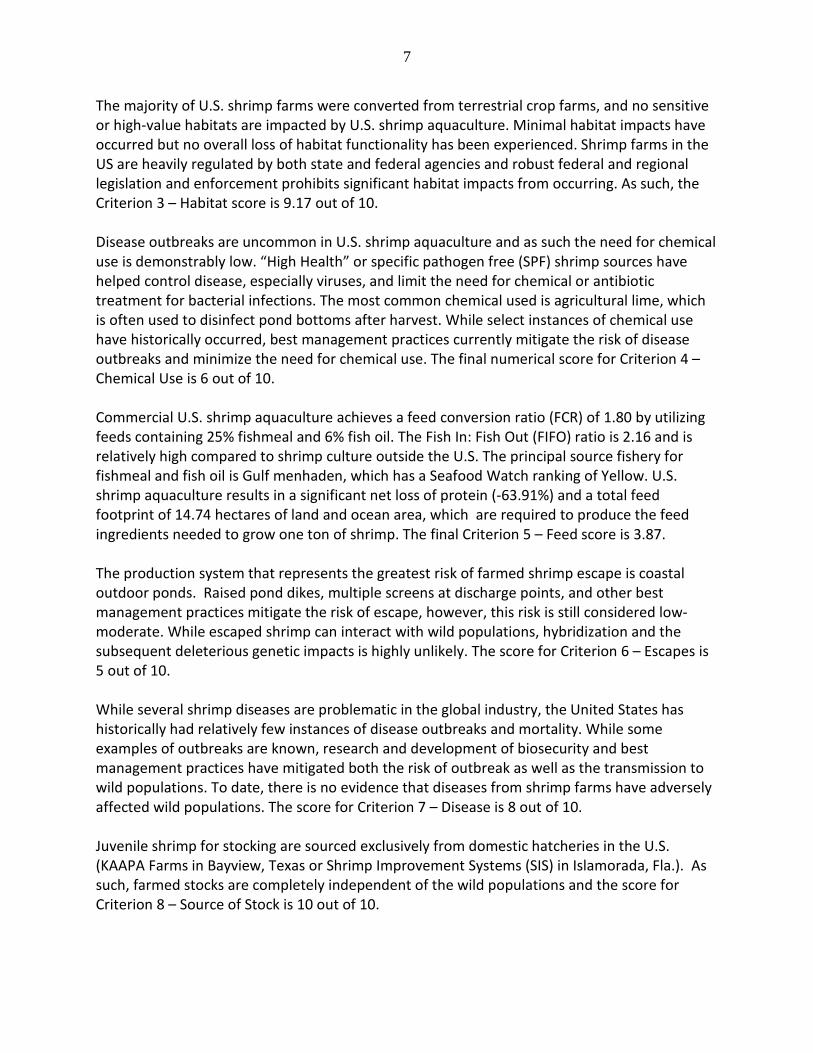
Executive Summary The whiteleg shrimp (Litopenaeus vannamei formerly Penaeus vannamei), also called Pacific white shrimp, is an eastern Pacific Ocean shrimp commonly caught or farmed for food. The US imports 1.2 billion pounds of shrimp (both wild captured and aquacultured) each year, and currently produces four million pounds per year through aquaculture. Aquaculture production of L. vannamei in the United States is very minor compared to global production values. Most commercial shrimp aquaculture production in the US is located in Texas, which has seven commercial farms. There is less production and fewer shrimp farms in Alabama (3), Florida (3), Hawaii (2), Nevada (1), Michigan (1), Indiana (1), Iowa (1), Maryland (1), Massachusetts (1) and the US territory of Guam (2). U.S. farms vary in size and production volume with a combined total of 4 million pounds produced in 2013. The seven farms in Texas produced 2.4 million pounds in 2013, down from 15 Texas farms producing 9 million pounds in 2003. The total production from the other U.S. farms combined is estimated to be between 1 to 2 million pounds a year. The greatest combined production reached by U.S. shrimp farms was in 2003 with a total of 13 million pounds produced that year. Overall, data availability for the US shrimp aquaculture industry is good, but the small size of the industry limits the national reporting on production volumes, exports/imports, and more detailed production factors. Further, the small industry size has led to scarcity on production data of whiteleg shrimp in the U.S. There are however, numerous research papers and reports published every year concerning the US shrimp farming industry on a variety of topics such as nutrition (diets using less fishmeal), diseases, genetic selection, and improved production techniques and technologies. There are a number of prominent trade associations and state aquaculture associations that produce newsletters and there are scientific journals and industry publications that publish shrimp farming information. Additionally, the author of this report has extensive personal experience in the U.S. shrimp farming industry. The score for Criterion 1 – Data is 8.06 out of 10. U.S. shrimp aquaculture utilizes principally pond production systems with infrequent water exchange, mitigating the downstream effluent impacts. Data show no evidence of adverse effluent impacts from U.S. shrimp farms today. Additionally, best management practices coupled with strong federal and state regulations and enforcement further reduce the risk of environmental impacts from effluents. Regulations are such on the coast that any discharge must be equal to or of better quality than receiving waters. Each farm’s requirements for effluent is individually set specifically for the site where it is located. The effluent score in this assessment reflects the regulation and oversight on discharge releases and the use of constructed wetland filtration systems or settling facilities to limit the release of solids, organic matter and nutrients. The score for Criterion 2 – Effluent is 8 out of 10.
7
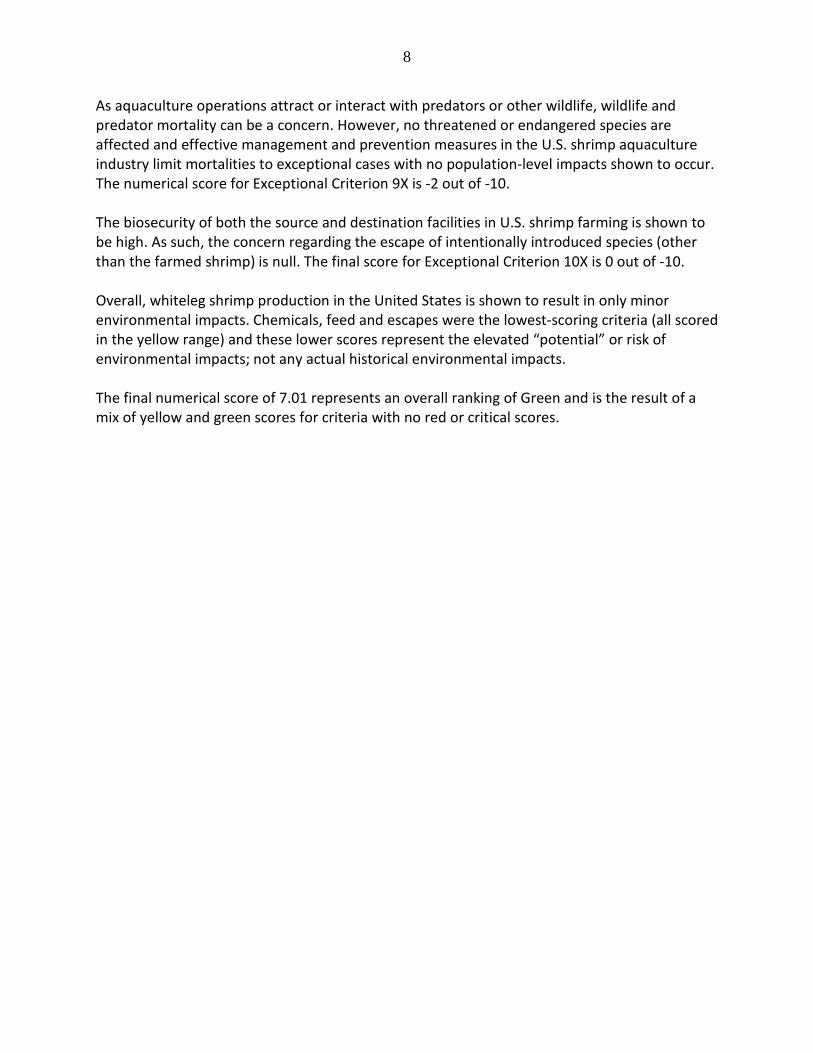
The majority of U.S. shrimp farms were converted from terrestrial crop farms, and no sensitive or high-value habitats are impacted by U.S. shrimp aquaculture. Minimal habitat impacts have occurred but no overall loss of habitat functionality has been experienced. Shrimp farms in the US are heavily regulated by both state and federal agencies and robust federal and regional legislation and enforcement prohibits significant habitat impacts from occurring. As such, the Criterion 3 – Habitat score is 9.17 out of 10. Disease outbreaks are uncommon in U.S. shrimp aquaculture and as such the need for chemical use is demonstrably low. “High Health” or specific pathogen free (SPF) shrimp sources have helped control disease, especially viruses, and limit the need for chemical or antibiotic treatment for bacterial infections. The most common chemical used is agricultural lime, which is often used to disinfect pond bottoms after harvest. While select instances of chemical use have historically occurred, best management practices currently mitigate the risk of disease outbreaks and minimize the need for chemical use. The final numerical score for Criterion 4 – Chemical Use is 6 out of 10. Commercial U.S. shrimp aquaculture achieves a feed conversion ratio (FCR) of 1.80 by utilizing feeds containing 25% fishmeal and 6% fish oil. The Fish In: Fish Out (FIFO) ratio is 2.16 and is relatively high compared to shrimp culture outside the U.S. The principal source fishery for fishmeal and fish oil is Gulf menhaden, which has a Seafood Watch ranking of Yellow. U.S. shrimp aquaculture results in a significant net loss of protein (-63.91%) and a total feed footprint of 14.74 hectares of land and ocean area, which are required to produce the feed ingredients needed to grow one ton of shrimp. The final Criterion 5 – Feed score is 3.87. The production system that represents the greatest risk of farmed shrimp escape is coastal outdoor ponds. Raised pond dikes, multiple screens at discharge points, and other best management practices mitigate the risk of escape, however, this risk is still considered low-moderate. While escaped shrimp can interact with wild populations, hybridization and the subsequent deleterious genetic impacts is highly unlikely. The score for Criterion 6 – Escapes is 5 out of 10. While several shrimp diseases are problematic in the global industry, the United States has historically had relatively few instances of disease outbreaks and mortality. While some examples of outbreaks are known, research and development of biosecurity and best management practices have mitigated both the risk of outbreak as well as the transmission to wild populations. To date, there is no evidence that diseases from shrimp farms have adversely affected wild populations. The score for Criterion 7 – Disease is 8 out of 10. Juvenile shrimp for stocking are sourced exclusively from domestic hatcheries in the U.S. (KAAPA Farms in Bayview, Texas or Shrimp Improvement Systems (SIS) in Islamorada, Fla.). As such, farmed stocks are completely independent of the wild populations and the score for Criterion 8 – Source of Stock is 10 out of 10.
8
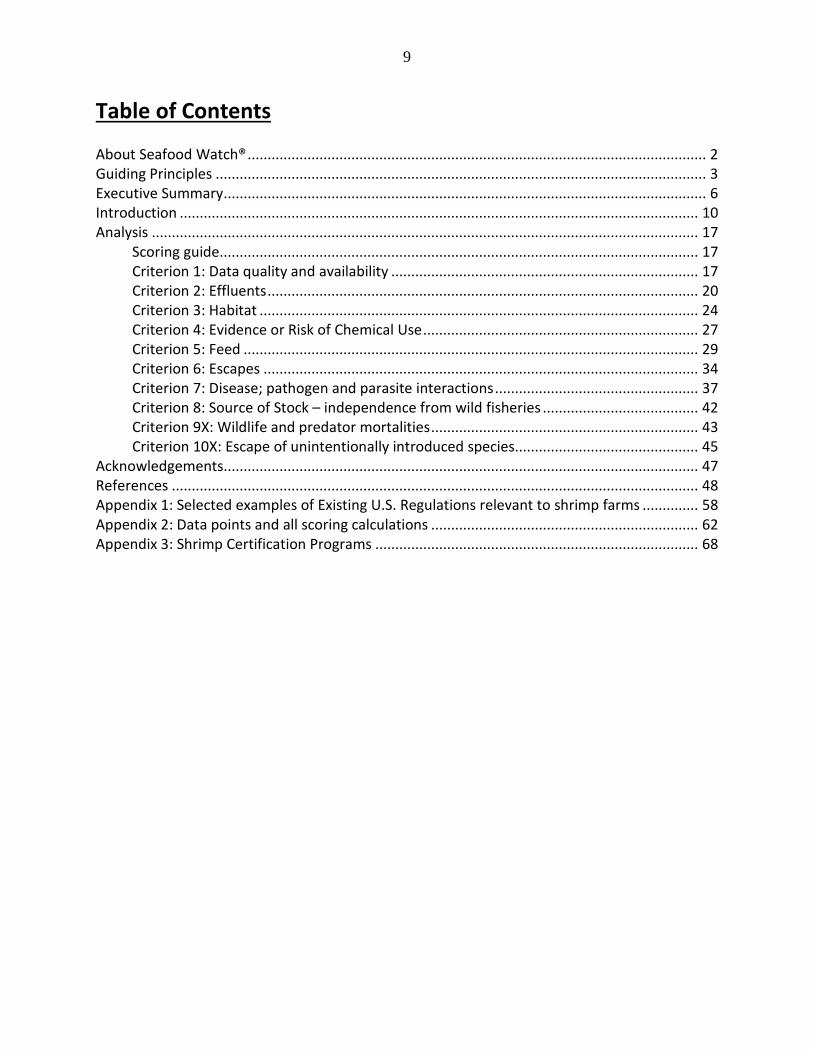
As aquaculture operations attract or interact with predators or other wildlife, wildlife and predator mortality can be a concern. However, no threatened or endangered species are affected and effective management and prevention measures in the U.S. shrimp aquaculture industry limit mortalities to exceptional cases with no population-level impacts shown to occur. The numerical score for Exceptional Criterion 9X is -2 out of -10. The biosecurity of both the source and destination facilities in U.S. shrimp farming is shown to be high. As such, the concern regarding the escape of intentionally introduced species (other than the farmed shrimp) is null. The final score for Exceptional Criterion 10X is 0 out of -10. Overall, whiteleg shrimp production in the United States is shown to result in only minor environmental impacts. Chemicals, feed and escapes were the lowest-scoring criteria (all scored in the yellow range) and these lower scores represent the elevated “potential” or risk of environmental impacts; not any actual historical environmental impacts. The final numerical score of 7.01 represents an overall ranking of Green and is the result of a mix of yellow and green scores for criteria with no red or critical scores.
9
Table of Contents About Seafood Watch® ................................................................................................................... 2 Guiding Principles ........................................................................................................................... 3 Executive Summary ......................................................................................................................... 6 Introduction .................................................................................................................................. 10 Analysis ......................................................................................................................................... 17
Scoring guide ........................................................................................................................ 17 Criterion 1: Data quality and availability ............................................................................. 17 Criterion 2: Effluents ............................................................................................................ 20 Criterion 3: Habitat .............................................................................................................. 24 Criterion 4: Evidence or Risk of Chemical Use ..................................................................... 27 Criterion 5: Feed .................................................................................................................. 29 Criterion 6: Escapes ............................................................................................................. 34 Criterion 7: Disease; pathogen and parasite interactions ................................................... 37 Criterion 8: Source of Stock – independence from wild fisheries ....................................... 42 Criterion 9X: Wildlife and predator mortalities ................................................................... 43 Criterion 10X: Escape of unintentionally introduced species .............................................. 45
Acknowledgements ....................................................................................................................... 47 References .................................................................................................................................... 48 Appendix 1: Selected examples of Existing U.S. Regulations relevant to shrimp farms .............. 58 Appendix 2: Data points and all scoring calculations ................................................................... 62 Appendix 3: Shrimp Certification Programs ................................................................................. 68
10
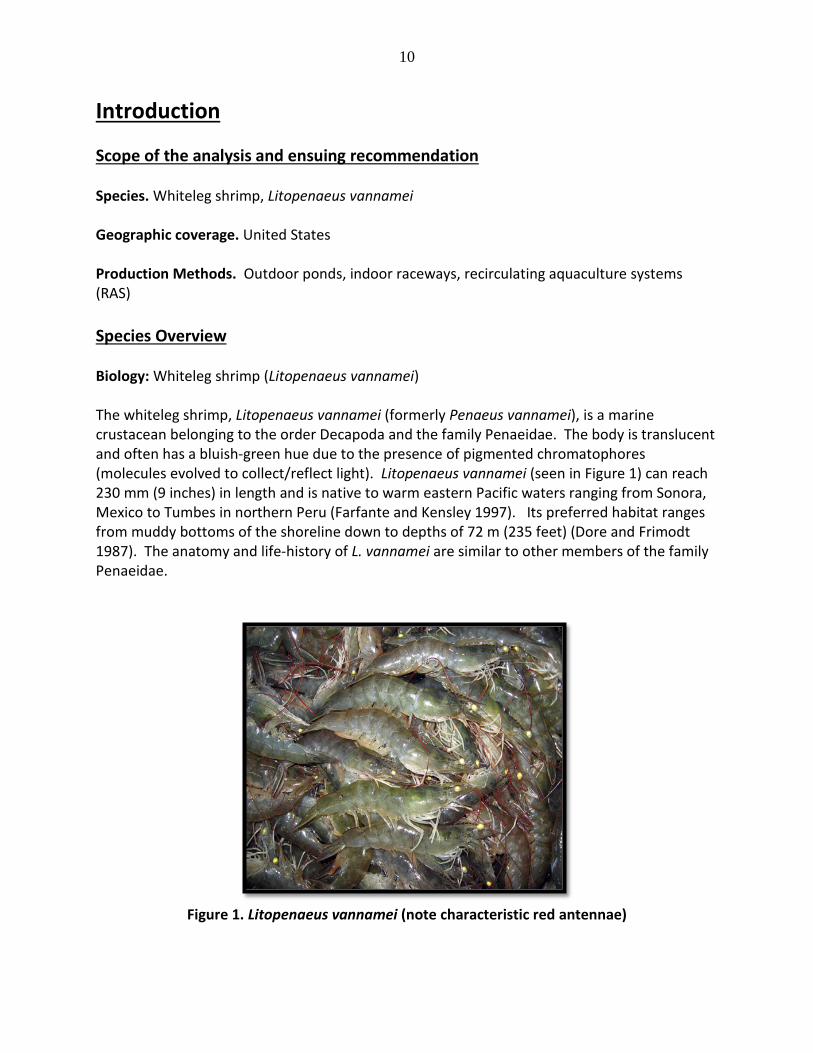
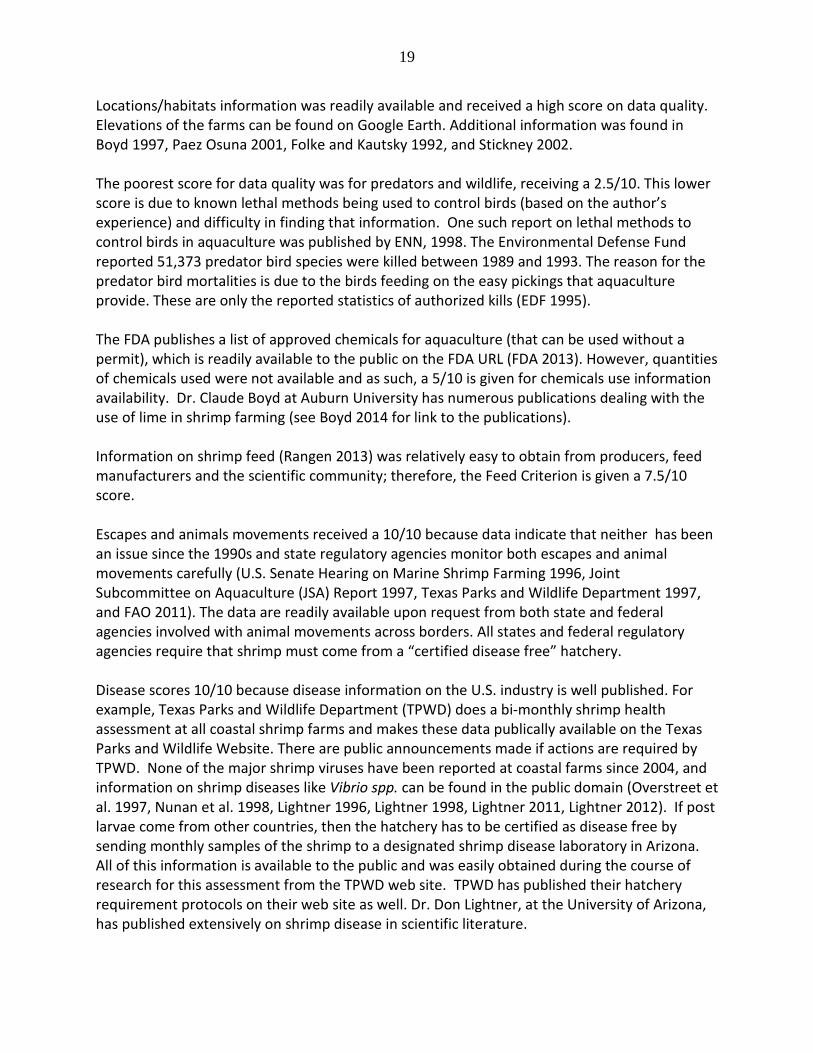
Introduction Scope of the analysis and ensuing recommendation Species. Whiteleg shrimp, Litopenaeus vannamei Geographic coverage. United States Production Methods. Outdoor ponds, indoor raceways, recirculating aquaculture systems (RAS) Species Overview Biology: Whiteleg shrimp (Litopenaeus vannamei) The whiteleg shrimp, Litopenaeus vannamei (formerly Penaeus vannamei), is a marine crustacean belonging to the order Decapoda and the family Penaeidae. The body is translucent and often has a bluish-green hue due to the presence of pigmented chromatophores (molecules evolved to collect/reflect light). Litopenaeus vannamei (seen in Figure 1) can reach 230 mm (9 inches) in length and is native to warm eastern Pacific waters ranging from Sonora, Mexico to Tumbes in northern Peru (Farfante and Kensley 1997). Its preferred habitat ranges from muddy bottoms of the shoreline down to depths of 72 m (235 feet) (Dore and Frimodt 1987). The anatomy and life-history of L. vannamei are similar to other members of the family Penaeidae.
Figure 1. Litopenaeus vannamei (note characteristic red antennae)
11
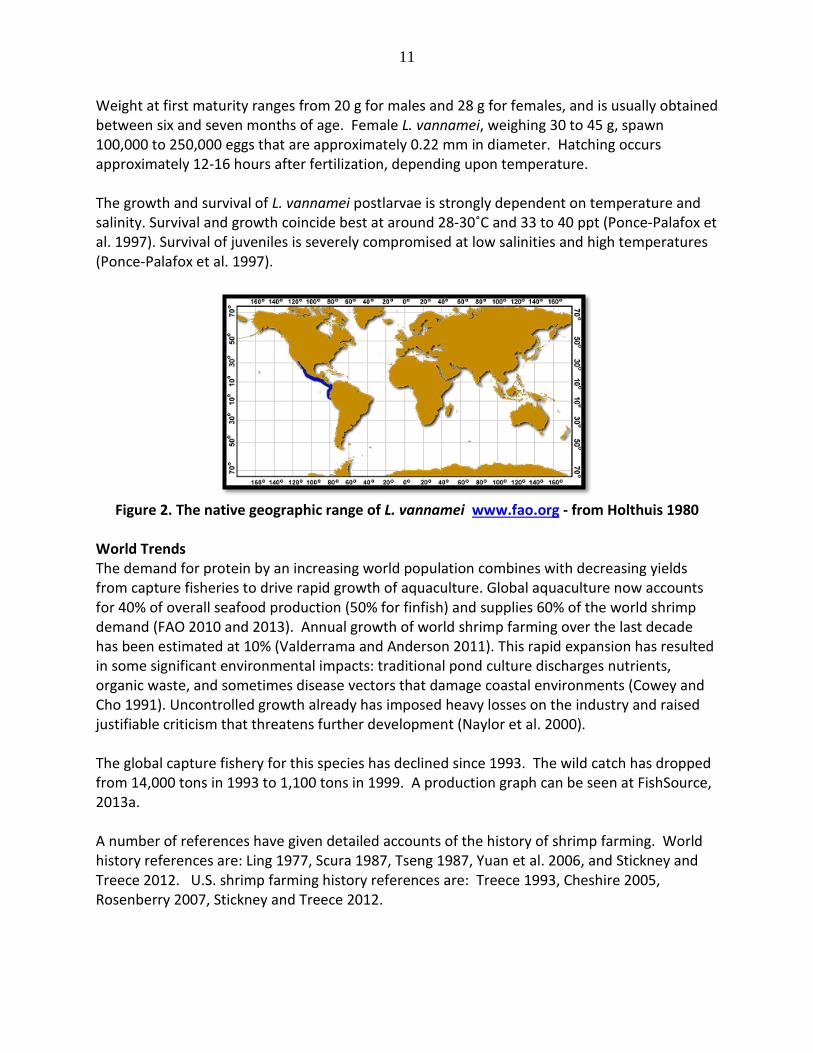
Weight at first maturity ranges from 20 g for males and 28 g for females, and is usually obtained between six and seven months of age. Female L. vannamei, weighing 30 to 45 g, spawn 100,000 to 250,000 eggs that are approximately 0.22 mm in diameter. Hatching occurs approximately 12-16 hours after fertilization, depending upon temperature. The growth and survival of L. vannamei postlarvae is strongly dependent on temperature and salinity. Survival and growth coincide best at around 28-30˚C and 33 to 40 ppt (Ponce-Palafox et al. 1997). Survival of juveniles is severely compromised at low salinities and high temperatures (Ponce-Palafox et al. 1997).
Figure 2. The native geographic range of L. vannamei www.fao.org - from Holthuis 1980
World Trends The demand for protein by an increasing world population combines with decreasing yields from capture fisheries to drive rapid growth of aquaculture. Global aquaculture now accounts for 40% of overall seafood production (50% for finfish) and supplies 60% of the world shrimp demand (FAO 2010 and 2013). Annual growth of world shrimp farming over the last decade has been estimated at 10% (Valderrama and Anderson 2011). This rapid expansion has resulted in some significant environmental impacts: traditional pond culture discharges nutrients, organic waste, and sometimes disease vectors that damage coastal environments (Cowey and Cho 1991). Uncontrolled growth already has imposed heavy losses on the industry and raised justifiable criticism that threatens further development (Naylor et al. 2000). The global capture fishery for this species has declined since 1993. The wild catch has dropped from 14,000 tons in 1993 to 1,100 tons in 1999. A production graph can be seen at FishSource, 2013a. A number of references have given detailed accounts of the history of shrimp farming. World history references are: Ling 1977, Scura 1987, Tseng 1987, Yuan et al. 2006, and Stickney and Treece 2012. U.S. shrimp farming history references are: Treece 1993, Cheshire 2005, Rosenberry 2007, Stickney and Treece 2012.
12
U.S. Shrimp Culture Despite the world trend of growth, U.S. shrimp aquaculture has shown an annual decline since production peaked in 2003 at 13 million pounds. The U.S. thus remains a net shrimp importer, with annual shrimp imports of 1.2 billion pounds worth $4.5 billion (USDA 2013, NOAA 2011, NOAA 2012). Commercial Shrimp Farms in the U.S. (2014) 1. Texas Farms: KAAPA Farms, San Tung, Bowers, Bowers Valley, Natural Shrimp
International, Michael Shrimp Farm, Global Blue Technologies. Seven farms totaling 853 acres. Outdoor ponds located in inland and coastal regions, plus two indoor facilities, one inland and one on the coast.
2. Florida: Woods Fisheries. 56 acres. Outdoor ponds located 5 miles inland, and Florida Organic Aquaculture and American Mariculture, Inc., which are indoor facilities located inland or on an island, but considered inland. Florida Organic Aquaculture leases land approximately 10 acres for their farm and American Mariculture, Inc. has 8.5 acres.
3. Alabama: Green Prairie Aquafarm and several others. About 100 acres total. Outdoor ponds, located inland.
4. Michigan, Iowa, Mass., Nevada, Indiana, Maryland: all indoor facilities. 5. Hawaii: Outdoor ponds and one indoor facility. There are several shrimp broodstock
production companies that sell shrimp worldwide. 6. Guam and Saipan: Outdoor ponds. The largest and highest production volume farm in the U.S. is located in Collegeport, Texas (Bowers Shrimp and Catfish). It holds and reuses its effluent, but does periodically discharge into coastal waters. Another operation, located on the coast in Port Isabel, Texas is a zero discharge shrimp raceway operation. It received the first zero discharge permit issued by Texas Commission on Environmental Quality several years ago, and is building a large, commercial indoor RAS facility on the coast near Rockport, Texas on Port Bay. With respect to inland farms in Texas, there is one in San Antonio that utilizes low salinity water in raceways under a greenhouse, and another being built in Lasara (near Raymondville) that is an outdoor pond-based farm with infrequent or periodic discharge of low salinity ground water into a recreational fishing lake or fee fishing lake. The farms in Alabama and Florida are similar to this and utilize outdoor pond-based operations with infrequent or periodic discharge of low salinity ground water (2 to 5 ppt). The Florida regulatory agency in charge of groundwater requires 7 test wells to be sampled yearly by Woods Fisheries shrimp farm outside Port St. Joe, for potential salination of drinking water (personal communication Mark Godwin, General Manager of Woods Fisheries farm outside St. Joe, Fla., August 2013). Florida Organic Aquaculture utilizes 32 ppt salt water from a well 2,600 feet deep. They are located inland at Fellsmere, Florida. They plan to utilize Salicornia beds and grow Salicornia (a succulent salt water plant used in the
13
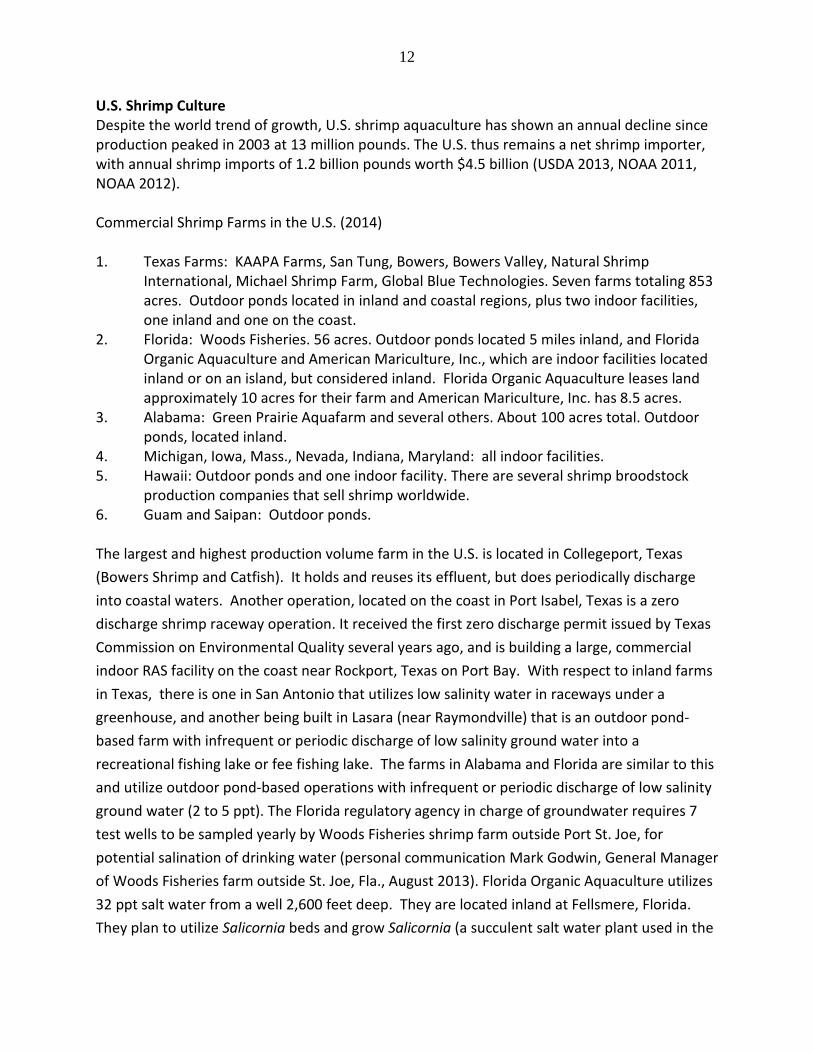
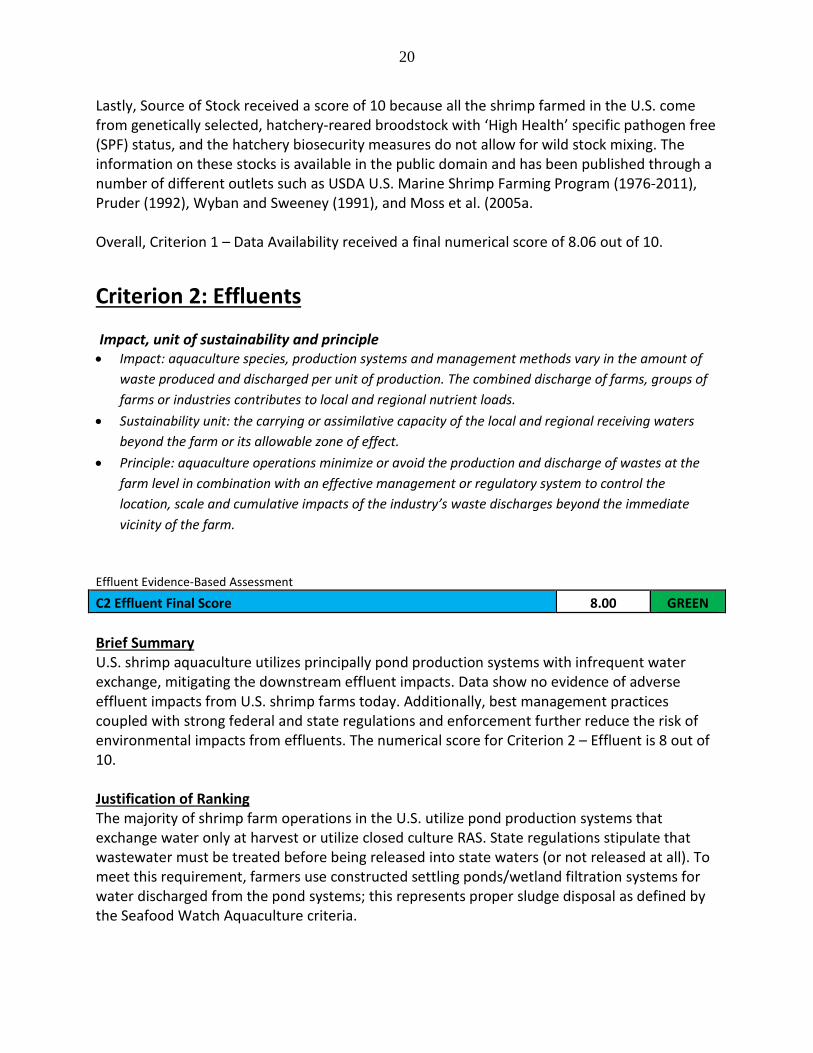
health food industry and as animal feed once it is cut and dried), fed by their effluent. Bob Rosenberry (Shrimp News International, June, 2014), gave details from Robin Pearl, president of American Mariculture, Inc., which operates an intensive shrimp farm in St. James City on Florida’s Gulf Coast. Their shrimp are raised without chemicals, antibiotics or preservatives, and marketed under the Sun Shrimp brand. American Mariculture’s farm is located on 17-mile long Pine Island, the largest island off Florida’s west coast.
Figure 3: American Mariculture, Inc. on Pine Island, Florida.
14
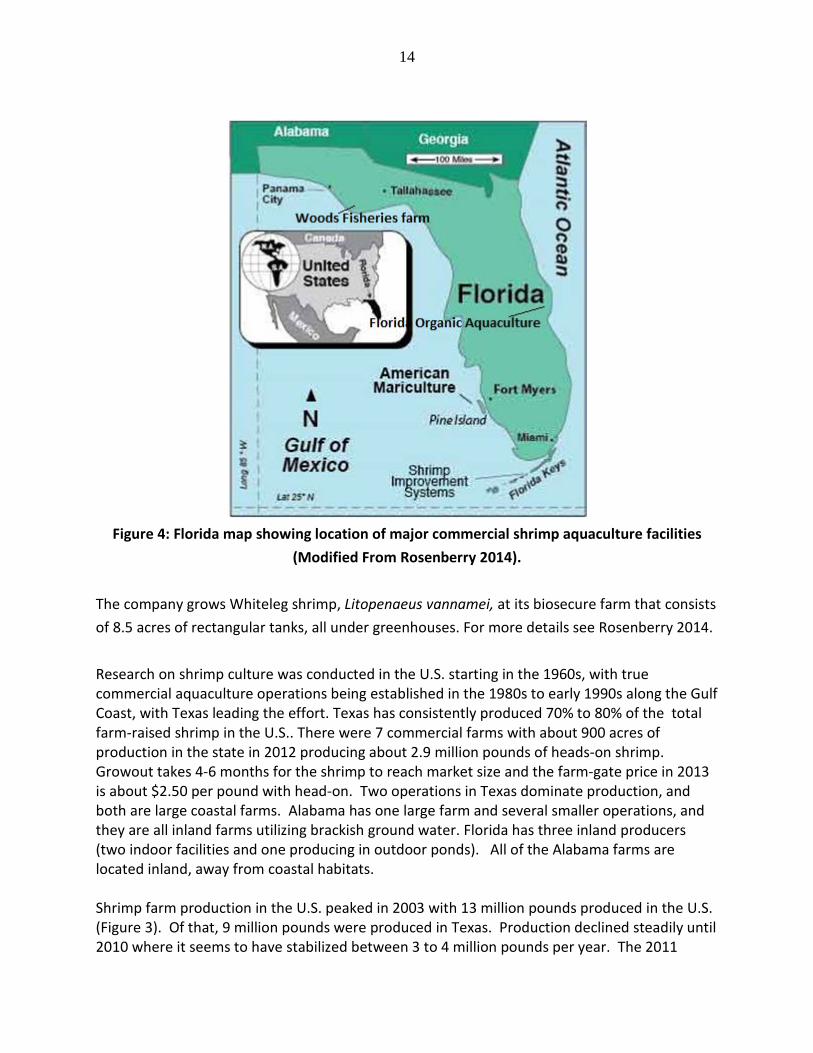
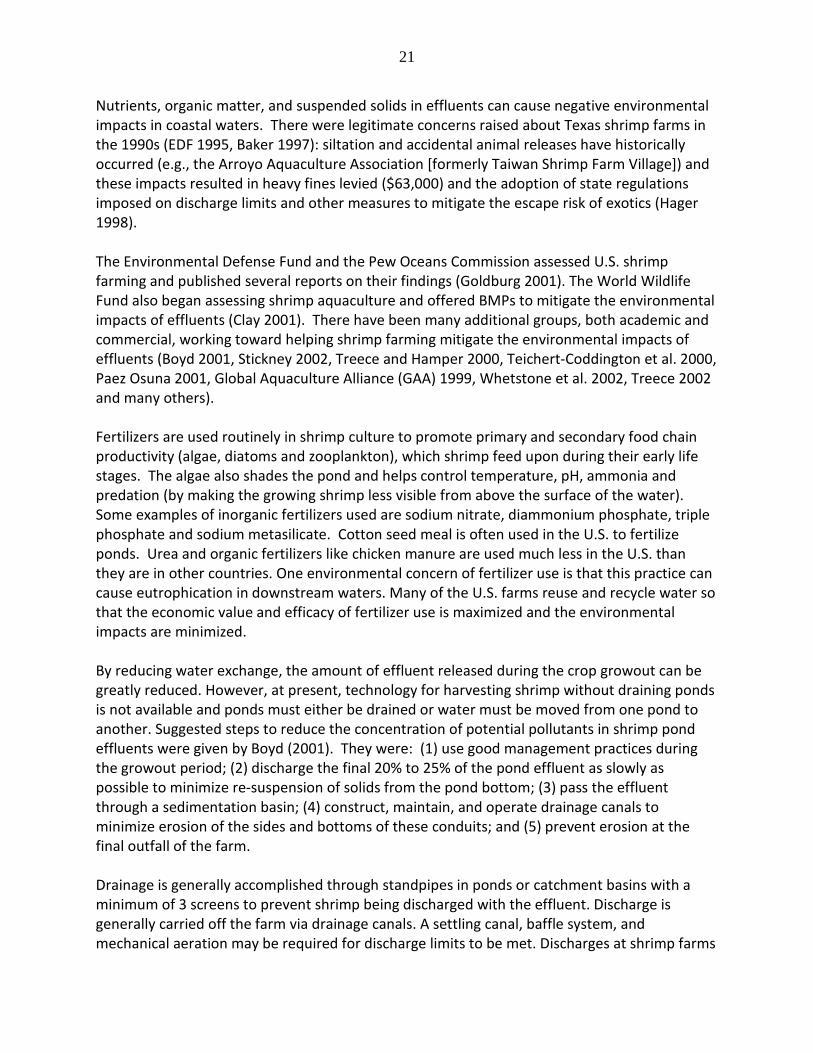
Figure 4: Florida map showing location of major commercial shrimp aquaculture facilities
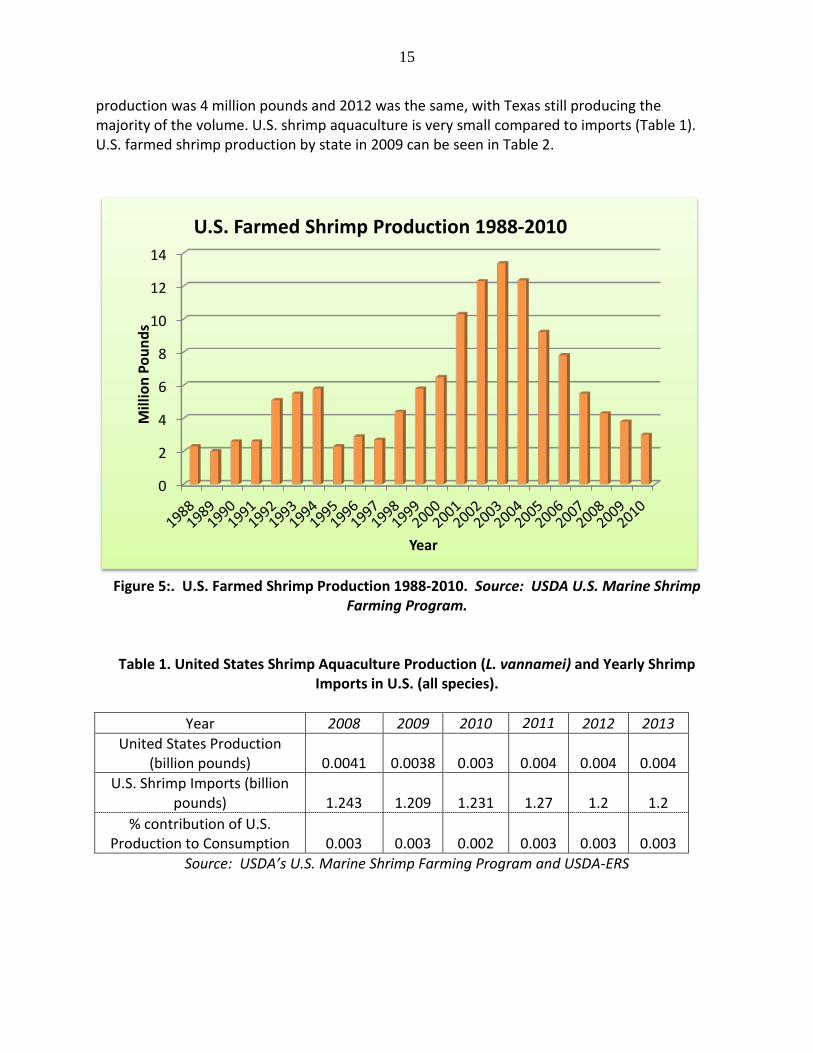
(Modified From Rosenberry 2014). The company grows Whiteleg shrimp, Litopenaeus vannamei, at its biosecure farm that consists of 8.5 acres of rectangular tanks, all under greenhouses. For more details see Rosenberry 2014. Research on shrimp culture was conducted in the U.S. starting in the 1960s, with true commercial aquaculture operations being established in the 1980s to early 1990s along the Gulf Coast, with Texas leading the effort. Texas has consistently produced 70% to 80% of the total farm-raised shrimp in the U.S.. There were 7 commercial farms with about 900 acres of production in the state in 2012 producing about 2.9 million pounds of heads-on shrimp. Growout takes 4-6 months for the shrimp to reach market size and the farm-gate price in 2013 is about $2.50 per pound with head-on. Two operations in Texas dominate production, and both are large coastal farms. Alabama has one large farm and several smaller operations, and they are all inland farms utilizing brackish ground water. Florida has three inland producers (two indoor facilities and one producing in outdoor ponds). All of the Alabama farms are located inland, away from coastal habitats. Shrimp farm production in the U.S. peaked in 2003 with 13 million pounds produced in the U.S. (Figure 3). Of that, 9 million pounds were produced in Texas. Production declined steadily until 2010 where it seems to have stabilized between 3 to 4 million pounds per year. The 2011
15
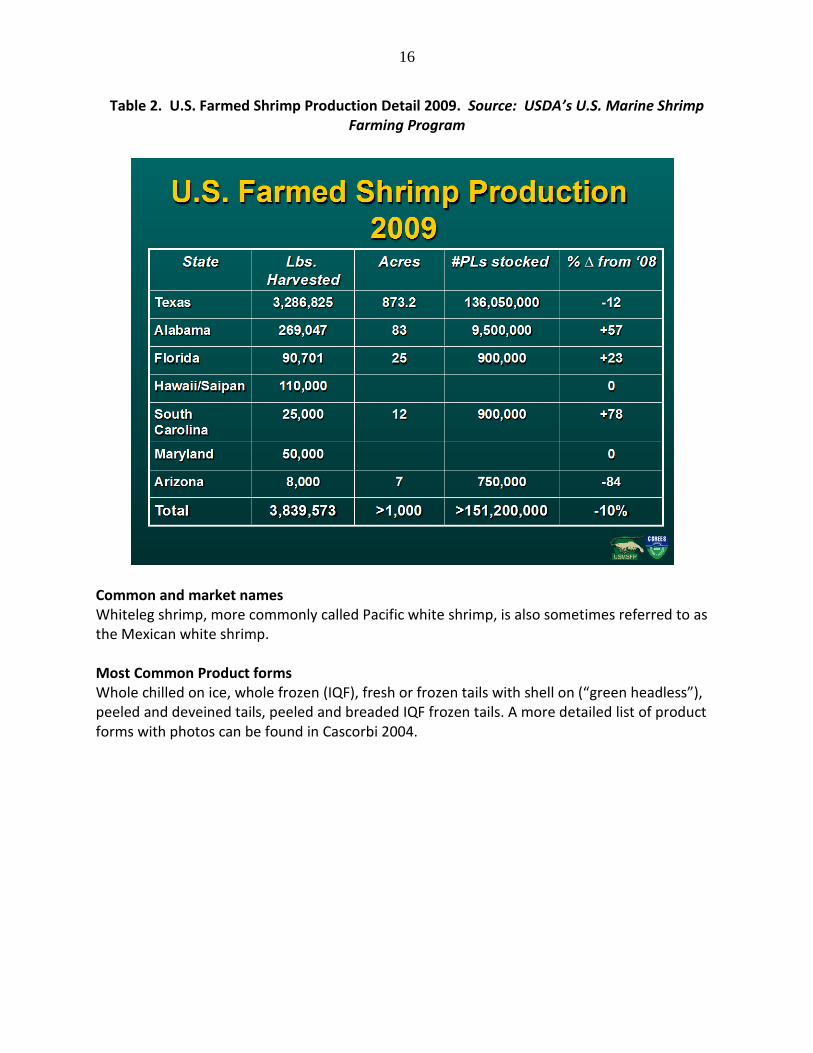
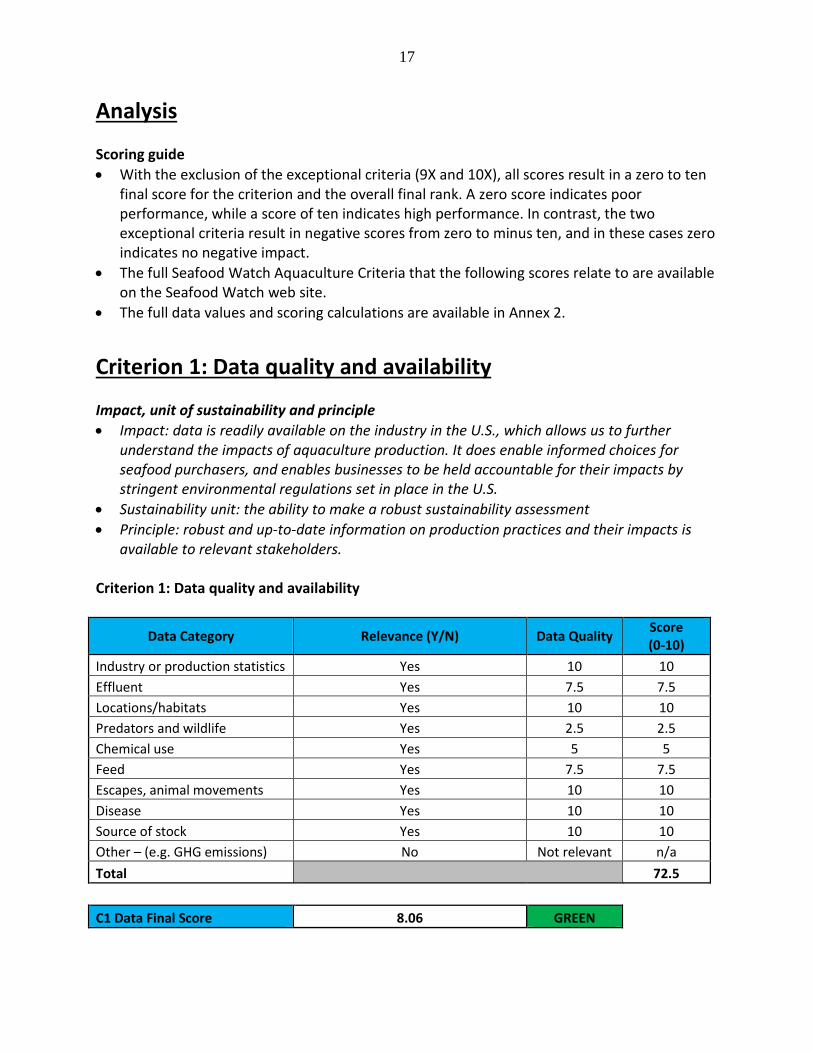
production was 4 million pounds and 2012 was the same, with Texas still producing the majority of the volume. U.S. shrimp aquaculture is very small compared to imports (Table 1). U.S. farmed shrimp production by state in 2009 can be seen in Table 2.
Figure 5:. U.S. Farmed Shrimp Production 1988-2010. Source: USDA U.S. Marine Shrimp
Farming Program.
Table 1. United States Shrimp Aquaculture Production (L. vannamei) and Yearly Shrimp
Imports in U.S. (all species).
Year 2008 2009 2010 2011 2012 2013 United States Production
(billion pounds) 0.0041 0.0038 0.003 0.004 0.004 0.004 U.S. Shrimp Imports (billion
pounds) 1.243 1.209 1.231 1.27 1.2 1.2 % contribution of U.S.
Production to Consumption 0.003 0.003 0.002 0.003 0.003 0.003 Source: USDA’s U.S. Marine Shrimp Farming Program and USDA-ERS
0
2
4
6
8
10
12
14
Mill
ion
Poun
ds
Year
U.S. Farmed Shrimp Production 1988-2010
16
Table 2. U.S. Farmed Shrimp Production Detail 2009. Source: USDA’s U.S. Marine Shrimp Farming Program
Common and market names Whiteleg shrimp, more commonly called Pacific white shrimp, is also sometimes referred to as the Mexican white shrimp. Most Common Product forms Whole chilled on ice, whole frozen (IQF), fresh or frozen tails with shell on (“green headless”), peeled and deveined tails, peeled and breaded IQF frozen tails. A more detailed list of product forms with photos can be found in Cascorbi 2004.
17
Analysis Scoring guide • With the exclusion of the exceptional criteria (9X and 10X), all scores result in a zero to ten
final score for the criterion and the overall final rank. A zero score indicates poor performance, while a score of ten indicates high performance. In contrast, the two exceptional criteria result in negative scores from zero to minus ten, and in these cases zero indicates no negative impact.
• The full Seafood Watch Aquaculture Criteria that the following scores relate to are available on the Seafood Watch web site.
• The full data values and scoring calculations are available in Annex 2.
Criterion 1: Data quality and availability
Impact, unit of sustainability and principle • Impact: data is readily available on the industry in the U.S., which allows us to further
understand the impacts of aquaculture production. It does enable informed choices for seafood purchasers, and enables businesses to be held accountable for their impacts by stringent environmental regulations set in place in the U.S.
• Sustainability unit: the ability to make a robust sustainability assessment • Principle: robust and up-to-date information on production practices and their impacts is
available to relevant stakeholders. Criterion 1: Data quality and availability
Data Category Relevance (Y/N) Data Quality Score (0-10)
Industry or production statistics Yes 10 10 Effluent Yes 7.5 7.5 Locations/habitats Yes 10 10 Predators and wildlife Yes 2.5 2.5 Chemical use Yes 5 5 Feed Yes 7.5 7.5 Escapes, animal movements Yes 10 10 Disease Yes 10 10 Source of stock Yes 10 10 Other – (e.g. GHG emissions) No Not relevant n/a Total 72.5
C1 Data Final Score 8.06 GREEN
18
Brief Summary Most of the assessed criteria have moderate or large amounts of data available. However, due to the small scale of the U.S. shrimp aquaculture industry, data gaps exist in such areas as predator/ wildlife interactions and chemical use. The author of this Seafood Watch report has extensive experience in the U.S. shrimp farming industry and relied on this experience throughout the assessment when necessary. The numerical score for Criterion 1 – Data is 8.06 out of 10. Justification of Ranking The author of this Seafood Watch report worked with USDA Trade Adjustment Assistance Program from 2004 to 2013 as a business planning specialist for U.S. shrimp farms and had an opportunity to work with most of the U.S. shrimp farmers on the farms. Two of the categories scored 7.5/10 for data quality and availability. Full data are not available for some categories due to the small size of the industry in the United States. Five categories had more up-to-date and specific data available (industry or production statistics, locations/habitats, escapes, animal movements, disease and source of stock) and scored 10 because of ease in locating the information and it availability to the public. A current source of data on L. vannamei production in the U.S. can be found on the Texas Aquaculture Association URL: www.texasaquaculture.org, Treece 2014. A continuous source of information can be found on Bob Rosenberry’s Shrimp News International URL: http://www.shrimpnews.com/. Occasionally the USDA conducts a nation-wide aquaculture survey which gathers a great deal of valuable information. The first survey was conducted in 1995, the second in 2005 and the most recent USDA aquaculture survey was conducted in 2009 (USDA 2005 and 2009). Further information on shrimp production in Texas was obtained from Dr. Ya-Sheng Juan, of Texas Parks and Wildlife in Brownsville, Texas. The yearly production data from shrimp farms is a requirement of the exotic species permit in the state. Some aquaculture magazines have also published recent articles on shrimp aquaculture in the U.S. These publications include Aquaculture North America, Fish Farming News, The Global Aquaculture Alliance Advocate, Aquaculture International and World Aquaculture Magazine. Texas Saltwater Fishing Magazine reported on the Texas Parks and Wildlife’s Shrimp Inspection Program in May 2010 (TSFM 2010). Information on effluent discharges wasobtained from Texas Commission on Environmental Quality, which posts on its website the farms that are and are not in compliance with effluent regulations (Texas Commission on Environmental Quality (TCEQ) 2013a). Goodland and Daly (1996), Hopkins et al. (1995), EDF (1997), Folke et al. (1998), Texas Senate Natural Resources Interim Subcommittee (1996), Texas Water Resources Institute (1997), and Goldberg (2001) discussed environmental effects of shrimp aquaculture. Shrimp feed information was relatively easy to obtain from researchers and from the feed companies in the U.S.—both effluent and feed received Criterion 1 – Data scores of 7.5/10.
19
Locations/habitats information was readily available and received a high score on data quality. Elevations of the farms can be found on Google Earth. Additional information was found in Boyd 1997, Paez Osuna 2001, Folke and Kautsky 1992, and Stickney 2002. The poorest score for data quality was for predators and wildlife, receiving a 2.5/10. This lower score is due to known lethal methods being used to control birds (based on the author’s experience) and difficulty in finding that information. One such report on lethal methods to control birds in aquaculture was published by ENN, 1998. The Environmental Defense Fund reported 51,373 predator bird species were killed between 1989 and 1993. The reason for the predator bird mortalities is due to the birds feeding on the easy pickings that aquaculture provide. These are only the reported statistics of authorized kills (EDF 1995). The FDA publishes a list of approved chemicals for aquaculture (that can be used without a permit), which is readily available to the public on the FDA URL (FDA 2013). However, quantities of chemicals used were not available and as such, a 5/10 is given for chemicals use information availability. Dr. Claude Boyd at Auburn University has numerous publications dealing with the use of lime in shrimp farming (see Boyd 2014 for link to the publications). Information on shrimp feed (Rangen 2013) was relatively easy to obtain from producers, feed manufacturers and the scientific community; therefore, the Feed Criterion is given a 7.5/10 score. Escapes and animals movements received a 10/10 because data indicate that neither has been an issue since the 1990s and state regulatory agencies monitor both escapes and animal movements carefully (U.S. Senate Hearing on Marine Shrimp Farming 1996, Joint Subcommittee on Aquaculture (JSA) Report 1997, Texas Parks and Wildlife Department 1997, and FAO 2011). The data are readily available upon request from both state and federal agencies involved with animal movements across borders. All states and federal regulatory agencies require that shrimp must come from a “certified disease free” hatchery. Disease scores 10/10 because disease information on the U.S. industry is well published. For example, Texas Parks and Wildlife Department (TPWD) does a bi-monthly shrimp health assessment at all coastal shrimp farms and makes these data publically available on the Texas Parks and Wildlife Website. There are public announcements made if actions are required by TPWD. None of the major shrimp viruses have been reported at coastal farms since 2004, and information on shrimp diseases like Vibrio spp. can be found in the public domain (Overstreet et al. 1997, Nunan et al. 1998, Lightner 1996, Lightner 1998, Lightner 2011, Lightner 2012). If post larvae come from other countries, then the hatchery has to be certified as disease free by sending monthly samples of the shrimp to a designated shrimp disease laboratory in Arizona. All of this information is available to the public and was easily obtained during the course of research for this assessment from the TPWD web site. TPWD has published their hatchery requirement protocols on their web site as well. Dr. Don Lightner, at the University of Arizona, has published extensively on shrimp disease in scientific literature.
20
Lastly, Source of Stock received a score of 10 because all the shrimp farmed in the U.S. come from genetically selected, hatchery-reared broodstock with ‘High Health’ specific pathogen free (SPF) status, and the hatchery biosecurity measures do not allow for wild stock mixing. The information on these stocks is available in the public domain and has been published through a number of different outlets such as USDA U.S. Marine Shrimp Farming Program (1976-2011), Pruder (1992), Wyban and Sweeney (1991), and Moss et al. (2005a. Overall, Criterion 1 – Data Availability received a final numerical score of 8.06 out of 10. Criterion 2: Effluents Impact, unit of sustainability and principle • Impact: aquaculture species, production systems and management methods vary in the amount of
waste produced and discharged per unit of production. The combined discharge of farms, groups of farms or industries contributes to local and regional nutrient loads.
• Sustainability unit: the carrying or assimilative capacity of the local and regional receiving waters beyond the farm or its allowable zone of effect.
• Principle: aquaculture operations minimize or avoid the production and discharge of wastes at the farm level in combination with an effective management or regulatory system to control the location, scale and cumulative impacts of the industry’s waste discharges beyond the immediate vicinity of the farm.
Effluent Evidence-Based Assessment C2 Effluent Final Score 8.00 GREEN Brief Summary U.S. shrimp aquaculture utilizes principally pond production systems with infrequent water exchange, mitigating the downstream effluent impacts. Data show no evidence of adverse effluent impacts from U.S. shrimp farms today. Additionally, best management practices coupled with strong federal and state regulations and enforcement further reduce the risk of environmental impacts from effluents. The numerical score for Criterion 2 – Effluent is 8 out of 10. Justification of Ranking The majority of shrimp farm operations in the U.S. utilize pond production systems that exchange water only at harvest or utilize closed culture RAS. State regulations stipulate that wastewater must be treated before being released into state waters (or not released at all). To meet this requirement, farmers use constructed settling ponds/wetland filtration systems for water discharged from the pond systems; this represents proper sludge disposal as defined by the Seafood Watch Aquaculture criteria.
21
Nutrients, organic matter, and suspended solids in effluents can cause negative environmental impacts in coastal waters. There were legitimate concerns raised about Texas shrimp farms in the 1990s (EDF 1995, Baker 1997): siltation and accidental animal releases have historically occurred (e.g., the Arroyo Aquaculture Association [formerly Taiwan Shrimp Farm Village]) and these impacts resulted in heavy fines levied ($63,000) and the adoption of state regulations imposed on discharge limits and other measures to mitigate the escape risk of exotics (Hager 1998). The Environmental Defense Fund and the Pew Oceans Commission assessed U.S. shrimp farming and published several reports on their findings (Goldburg 2001). The World Wildlife Fund also began assessing shrimp aquaculture and offered BMPs to mitigate the environmental impacts of effluents (Clay 2001). There have been many additional groups, both academic and commercial, working toward helping shrimp farming mitigate the environmental impacts of effluents (Boyd 2001, Stickney 2002, Treece and Hamper 2000, Teichert-Coddington et al. 2000, Paez Osuna 2001, Global Aquaculture Alliance (GAA) 1999, Whetstone et al. 2002, Treece 2002 and many others). Fertilizers are used routinely in shrimp culture to promote primary and secondary food chain productivity (algae, diatoms and zooplankton), which shrimp feed upon during their early life stages. The algae also shades the pond and helps control temperature, pH, ammonia and predation (by making the growing shrimp less visible from above the surface of the water). Some examples of inorganic fertilizers used are sodium nitrate, diammonium phosphate, triple phosphate and sodium metasilicate. Cotton seed meal is often used in the U.S. to fertilize ponds. Urea and organic fertilizers like chicken manure are used much less in the U.S. than they are in other countries. One environmental concern of fertilizer use is that this practice can cause eutrophication in downstream waters. Many of the U.S. farms reuse and recycle water so that the economic value and efficacy of fertilizer use is maximized and the environmental impacts are minimized. By reducing water exchange, the amount of effluent released during the crop growout can be greatly reduced. However, at present, technology for harvesting shrimp without draining ponds is not available and ponds must either be drained or water must be moved from one pond to another. Suggested steps to reduce the concentration of potential pollutants in shrimp pond effluents were given by Boyd (2001). They were: (1) use good management practices during the growout period; (2) discharge the final 20% to 25% of the pond effluent as slowly as possible to minimize re-suspension of solids from the pond bottom; (3) pass the effluent through a sedimentation basin; (4) construct, maintain, and operate drainage canals to minimize erosion of the sides and bottoms of these conduits; and (5) prevent erosion at the final outfall of the farm. Drainage is generally accomplished through standpipes in ponds or catchment basins with a minimum of 3 screens to prevent shrimp being discharged with the effluent. Discharge is generally carried off the farm via drainage canals. A settling canal, baffle system, and mechanical aeration may be required for discharge limits to be met. Discharges at shrimp farms
22
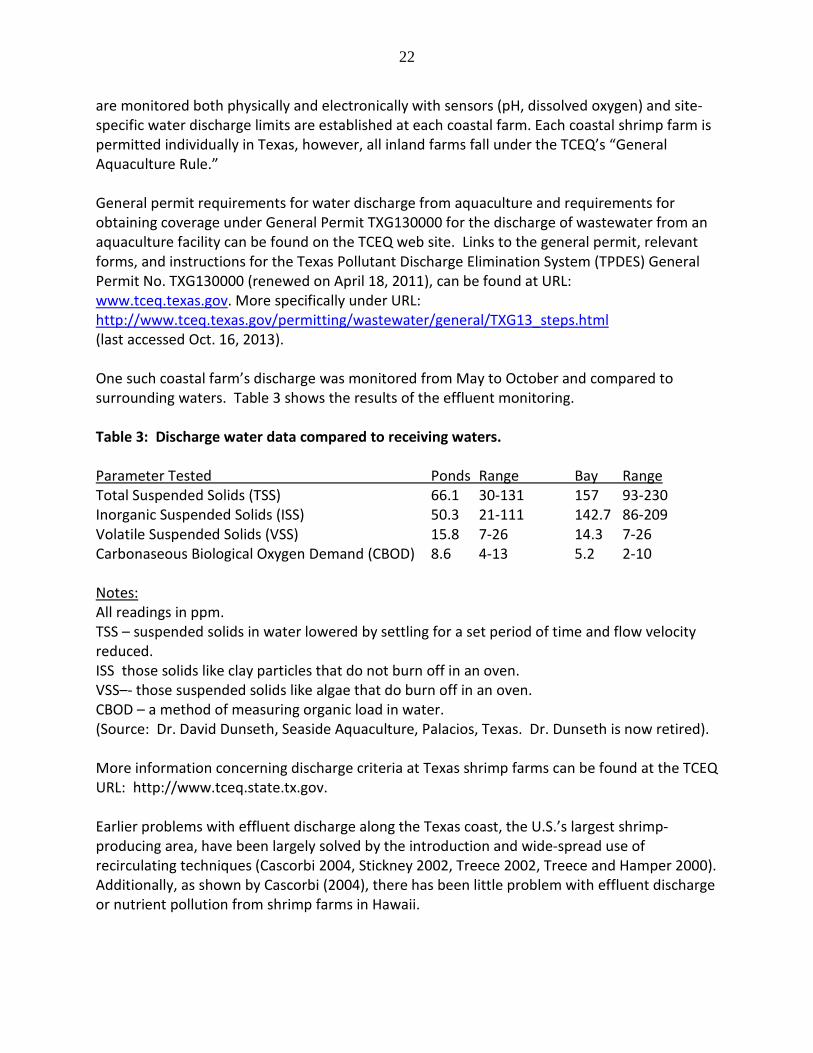
are monitored both physically and electronically with sensors (pH, dissolved oxygen) and site-specific water discharge limits are established at each coastal farm. Each coastal shrimp farm is permitted individually in Texas, however, all inland farms fall under the TCEQ’s “General Aquaculture Rule.” General permit requirements for water discharge from aquaculture and requirements for obtaining coverage under General Permit TXG130000 for the discharge of wastewater from an aquaculture facility can be found on the TCEQ web site. Links to the general permit, relevant forms, and instructions for the Texas Pollutant Discharge Elimination System (TPDES) General Permit No. TXG130000 (renewed on April 18, 2011), can be found at URL: www.tceq.texas.gov. More specifically under URL: http://www.tceq.texas.gov/permitting/wastewater/general/TXG13_steps.html (last accessed Oct. 16, 2013). One such coastal farm’s discharge was monitored from May to October and compared to surrounding waters. Table 3 shows the results of the effluent monitoring. Table 3: Discharge water data compared to receiving waters. Parameter Tested Ponds Range Bay Range Total Suspended Solids (TSS) 66.1 30-131 157 93-230 Inorganic Suspended Solids (ISS) 50.3 21-111 142.7 86-209 Volatile Suspended Solids (VSS) 15.8 7-26 14.3 7-26 Carbonaseous Biological Oxygen Demand (CBOD) 8.6 4-13 5.2 2-10 Notes: All readings in ppm. TSS – suspended solids in water lowered by settling for a set period of time and flow velocity reduced. ISS those solids like clay particles that do not burn off in an oven. VSS–- those suspended solids like algae that do burn off in an oven. CBOD – a method of measuring organic load in water. (Source: Dr. David Dunseth, Seaside Aquaculture, Palacios, Texas. Dr. Dunseth is now retired). More information concerning discharge criteria at Texas shrimp farms can be found at the TCEQ URL: http://www.tceq.state.tx.gov. Earlier problems with effluent discharge along the Texas coast, the U.S.’s largest shrimp-producing area, have been largely solved by the introduction and wide-spread use of recirculating techniques (Cascorbi 2004, Stickney 2002, Treece 2002, Treece and Hamper 2000). Additionally, as shown by Cascorbi (2004), there has been little problem with effluent discharge or nutrient pollution from shrimp farms in Hawaii.
23
Better management practices or best management practices (BMPs) have been used in several countries to establish more general principles of environmentally responsible shrimp farming. The shrimp farming industry in the U.S. has made significant advancements in developing BMPs. Experience has shown that well designed and implemented BMPs can support producers to:
• Increase efficiency and productivity by reducing the risk of shrimp health problems • Reduce or mitigate the impacts of farming on the environment • Improve food safety and quality of shrimp farm product • Improve the social benefits from shrimp farming and its social acceptability and sustainability
BMPs can be country-specific, or developed for a particular location, taking account of local farming systems, social and economic context, markets and environments. In India, for example, experiences have shown that although principles are widely applicable, there are considerable local variations in BMPs. BMPs are often voluntary practices, but can also be used as the basis for local regulations, or even certification programs. In Florida for example, Florida law (see Florida Statutes Chapter 570) requires that shrimp farms and other aquaculture operations register with the Florida Department of Agriculture and Consumer Affairs. The Certificate of Registration costs $US50 and requires that the farmer agree to follow the Department’s “best management practices” (BMPs). If the farmer follows the BMPs, the Department of Environmental Protection is prohibited from charging the farmer with environmental violations (such as the discharge of sewage or effluent) into surface waters. The implementing rules (see Florida Administrative Code Chapter 5L-3) do not require aquafarmers “to follow the effluent treatment BMPs” if they use “recirculation systems” or “do not discharge to waters of the state”—in those cases, they are labeled as having a “minimal impact on the surrounding environment.” Even if they do not meet those exceptions, the BMPs for effluent treatment require only a retention, evaporation, or percolation pond or vegetated filter strip. Based on federal regulations in combination with state regulations the “regulatory or management effectiveness” in the U.S. is considered high. Effluent regulations that are scientifically robust, specific to aquaculture operations, and site-specific limits to discharges, effluents and biomass are set to cover the entire production cycle (Environmental Protection Agency (EPA) 2012, TCEQ 2013a). Water quality measures (with limitations in place and set collection times) that must be collected under the “Texas Commission on Environmental Quality General Permit to Discharge Wastes” (TCEQ 2013b) include: flow; total suspended solids, inorganic suspended solids, total residual chlorine, pH, dissolved oxygen, carbonaceous biochemical oxygen demand, and ammonia nitrogen. Cumulative impacts are addressed as a control point in Section 309 of the Coastal Management Plan (CMP) along with secondary impacts of development (Texas General Land Office 2011). The EPA also requires all shrimp farms discharging into public waters to have their effluent tested for heavy metals; mainly copper and selenium. The EPA requires each coastal farm to send a water sample (55 gallon
24
barrel) to the EPA lab for testing, where toxicity test on the water is run using Daphnia, a well-known zooplankton commonly used for lab tests. Each farm is required to pay for the water testing, which generally costs $10,000/year/discharge point (personal communication with shrimp farmers, Reed Bowers and Fritz Jaenike). All Texas coastal shrimp farms are individually permitted. If the farm is located within the coastal plain, it must be individually permitted by the Texas Commission on Environmental Quality. If water is discharged into public waterways, then that water must be equal to or better than the receiving waters (TCEQ 2013b). This is also an Environmental Protection Agency (EPA) National Pollution Discharge Elimination System (NDPES) requirement (EPA 2012). Enforcement is also shown to be effective. For example, the Texas Department of Agriculture holds authority for the regulation of aquaculture in Texas and issues fish farming permits. Permitting and enforcement organizations include the Environmental Protection Agency (EPA), Texas Commission on Environmental Quality (TCEQ), and Texas Parks and Wildlife Department (TPWD), U.S. Fish and Wildlife Service, U.S. Army Corps of Engineers, etc. (Treece 2005). Penalties for infractions of the Texas Agriculture Code and the TCEQ General Permit to Discharge Waters are clearly identified in Section 134.023. Penalties and charges for infringements range from misdemeanor to felony charges (Texas Agriculture Code 2007). The EPA publishes online its enforcement cases with the name of the respondent, description of alleged violation, and the penalty amount (EPA 2012). The TCEQ supplies monthly enforcement reports (TCEQ 2013a) and reported numerous on-site investigations in 2012. Further, they also reported the percent of permitted facilities in compliance with permits, enforcement orders, or programs per annum. In 2012, it was reported that 99% of all ‘water facilities’ inspected were in compliance (TCEQ 2013a). Data show no evidence that effluents contribute to impacts beyond the immediate vicinity of the farm or discharge points. Additionally, best management practices coupled with effective management and enforcement is demonstrably efficient in avoiding any significant effluent impacts. As such, using the evidence-based assessment option, the numerical score for Criterion 2 – Effluent is 8 out of 10.
Criterion 3: Habitat
Impact, unit of sustainability and principle • Impact: Aquaculture farms can be located in a wide variety of aquatic and terrestrial habitat types
and have greatly varying levels of impact to both pristine and previously modified habitats and to the critical “ecosystem services” they provide.
• Sustainability unit: The ability to maintain the critical ecosystem services relevant to the habitat type.
25
• Principle: Aquaculture operations are located at sites, scales and intensities that cumulatively maintain the functionality of ecologically valuable habitats.
Criterion 3: Habitat
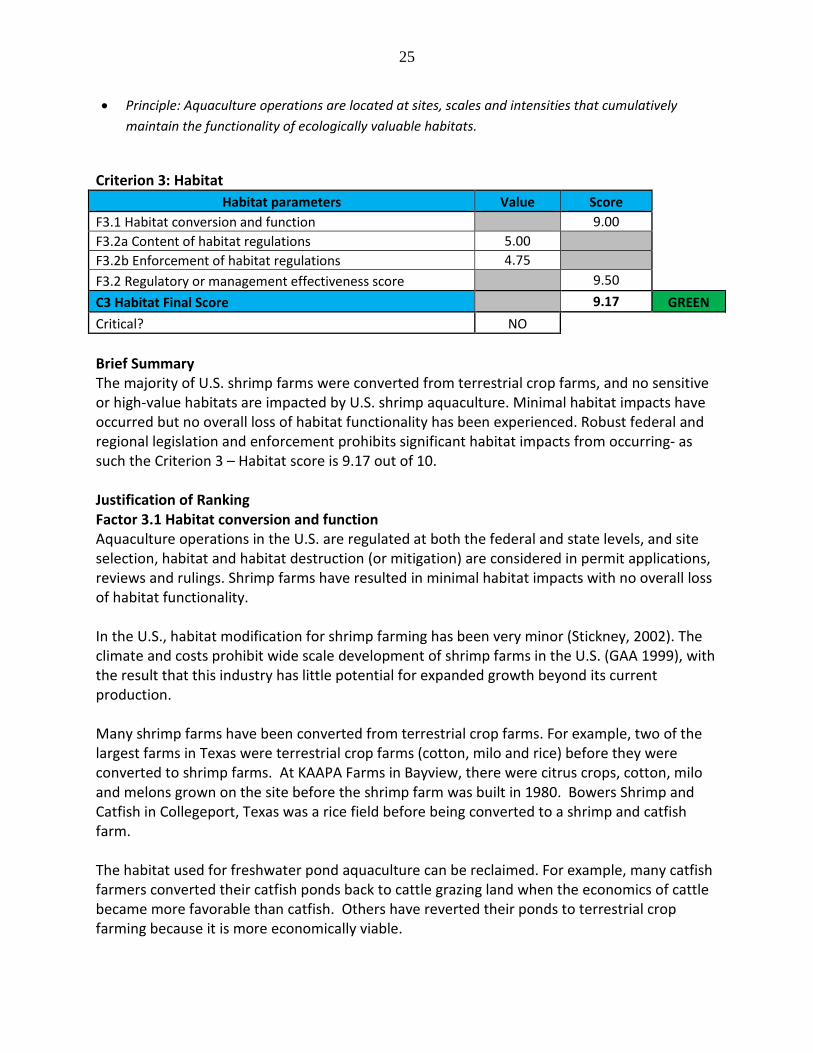
Habitat parameters Value Score F3.1 Habitat conversion and function 9.00 F3.2a Content of habitat regulations 5.00 F3.2b Enforcement of habitat regulations 4.75 F3.2 Regulatory or management effectiveness score 9.50 C3 Habitat Final Score 9.17 GREEN Critical? NO Brief Summary The majority of U.S. shrimp farms were converted from terrestrial crop farms, and no sensitive or high-value habitats are impacted by U.S. shrimp aquaculture. Minimal habitat impacts have occurred but no overall loss of habitat functionality has been experienced. Robust federal and regional legislation and enforcement prohibits significant habitat impacts from occurring- as such the Criterion 3 – Habitat score is 9.17 out of 10. Justification of Ranking Factor 3.1 Habitat conversion and function Aquaculture operations in the U.S. are regulated at both the federal and state levels, and site selection, habitat and habitat destruction (or mitigation) are considered in permit applications, reviews and rulings. Shrimp farms have resulted in minimal habitat impacts with no overall loss of habitat functionality. In the U.S., habitat modification for shrimp farming has been very minor (Stickney, 2002). The climate and costs prohibit wide scale development of shrimp farms in the U.S. (GAA 1999), with the result that this industry has little potential for expanded growth beyond its current production. Many shrimp farms have been converted from terrestrial crop farms. For example, two of the largest farms in Texas were terrestrial crop farms (cotton, milo and rice) before they were converted to shrimp farms. At KAAPA Farms in Bayview, there were citrus crops, cotton, milo and melons grown on the site before the shrimp farm was built in 1980. Bowers Shrimp and Catfish in Collegeport, Texas was a rice field before being converted to a shrimp and catfish farm. The habitat used for freshwater pond aquaculture can be reclaimed. For example, many catfish farmers converted their catfish ponds back to cattle grazing land when the economics of cattle became more favorable than catfish. Others have reverted their ponds to terrestrial crop farming because it is more economically viable.
26
There has been a long-standing misconception that shrimp farms in the U.S. are built in the intertidal zones. While this has historically occurred in some developing countries and resulted in mangrove destruction, U.S. shrimp farms are built in the intertidal zones and are high enough to ensure that they will drain completely at harvest. The majority of shrimp pond acres in the U.S. are located near the coast and are considered high-value “coastal-inshore” habitat by the Seafood Watch criteria. Nailon (2003) placed a habitat value of USD $6,000 per acre on the Texas salt marsh. Texas shrimp farms are located above the salt marshes at a higher elevation and away from sensitive nursery areas and estuaries. Ponds would not gravity-drain if they were located in the salt marsh, so they are generally at a higher elevation so the ponds will drain. Additionally, these sensitive areas that the ponds drain into are protected by discharge regulations that do not allow silt to cover grass beds, etc. King and Lester (1995) showed the value of salt marsh as a sea defense. Further values of the salt marshes of the U.S. are given at URL: http://www.greatmarsh.org/ Additionally, the discharge areas of shrimp farms provide improved habitat for bait fish, like mullet, shad and minnows. Other fish utilize these concentrations of bait fish as do recreational fishermen. Created wetlands have also been used at coastal shrimp farms with success and duck hunters enjoy the benefits afforded by these areas. Aquatic plant life such as Rupia, Spartina, duck weed, cattails, wigeon grass, mangroves and others flourish in these constructed wetlands. . The numerical score for Factor 3.1 is 9 out of 10, indicating minimal habitat conversion and only minor impacts on ecosystem functionality. Factor 3.2. Habitat and farm siting management effectiveness (appropriate to the scale of the industry) Aquaculture operations are regulated at both the federal and state levels, and site selection, habitat, and habitat destruction (or mitigation) are considered in a permit application, review, and ruling. The USDA’s Aquaculture Act of 1980 (Buck and Becker 1993) and EPA regulations apply as well as the state rules and regulations on aquaculture (listed individually for each state below). The Clean Water Act (CWA) was established in 1972 and last updated May 20, 2013 by EPA (CWA 2013). Section 404 of CWA is enforced by the USACE and requires a permit for any dredging, construction of intake structures, and any wetland use or habitat destruction. Further, under most states’ coastal management plans (CMP), there is generally a “no net loss of wetlands” policy in place, encouraged by EPA and U.S. Fish and Wildlife Service. In the period of 2006-2011, some 12,932 acres of wetland were regained through voluntary measures built by many different entities, including shrimp farms. There is no guarantee that wetland habitat is completely safe from all aspects of development, but this does suggest that a culture of wetland preservation exists. Data on loss of wetlands are not available as a U.S. Supreme Court decision removed wetlands as part of navigable waters and also removed them from permit requirements (Texas General Land Office 2011). As part of the permitting process in Texas, for example, cumulative impacts are addressed as a control point in Section 309 of the CMP, along
27
with secondary impacts of development (Texas General Land Office 2011). While cumulative impacts are addressed, overall ecosystem function is not. If there were new shrimp farms being built on the U.S. coast, there may be increased habitat concerns, however, there have been no new shrimp farms built in several years and none are planned in the near future that would affect habitat on the U.S. coast. The shrimp aquaculture permit process is very stringent for any coastal zone in the U.S., and no new coastal shrimp farms have been licensed in the last 10 years. Part of the reason for this is the strict permitting process and the economic expense of providing all the documentation and materials required by the applicant, including public hearings. The difficulties of aquaculture permitting in Gulf and South Atlantic U.S. states were discussed by Maxwell et al. (2006). The only shortfall in the established regulations is that ecosystem function is not always considered as part of the assessment for farms. The coastal farms in Texas were terrestrial crop fields before they were converted to shrimp farms. In other countries, however, this is not the case. Mangroves were lost in Ecuador, for example, at the expense of shrimp farming, and are now being replanted. Shrimp Aquaculture Regulations in the U.S. U.S. shrimp aquaculture operations are regulated by the U.S. Department of Agriculture (USDA)’s Aquaculture Act of 1980 (Buck and Becker 1993), as well as the U.S. Environmental Protection Agency (EPA) regulations (EPA, 2012). Enforcement and consequences of infractions are clearly defined by EPA and data are made available to the public. Additionally, the General Land Office of Texas has authority to regulate all submerged waters of the state and controls leasing bottom rights. Their Section 309 of the Texas coastal management program describes their role (Texas General Land Office 2011). A comprehensive list of state regulations governing U.S. shrimp farms is presented in Appendix 2 at the end of this report. Final Score for Criterion 3 Factors 3.2a and 3.2b score 5 out of 5 and 4.75 out of 5, respectively. The overall score for Factor 3.2 is 9.5 out of 10. The final numerical score for Criterion 3 – Habitat is 9.17 out of 10.
Criterion 4: Evidence or Risk of Chemical Use Impact, unit of sustainability and principle • Impact: Improper use of chemical treatments impacts non-target organisms and leads to production
losses and human health concerns due to the development of chemical-resistant organisms.
28
• Sustainability unit: Non-target organisms in the local or regional environment, presence of pathogens or parasites resistant to important treatments
• Principle: Aquaculture operations by design, management or regulation avoid the discharge of chemicals toxic to aquatic life, and/or effectively control the frequency, risk of environmental impact and risk to human health of their use.
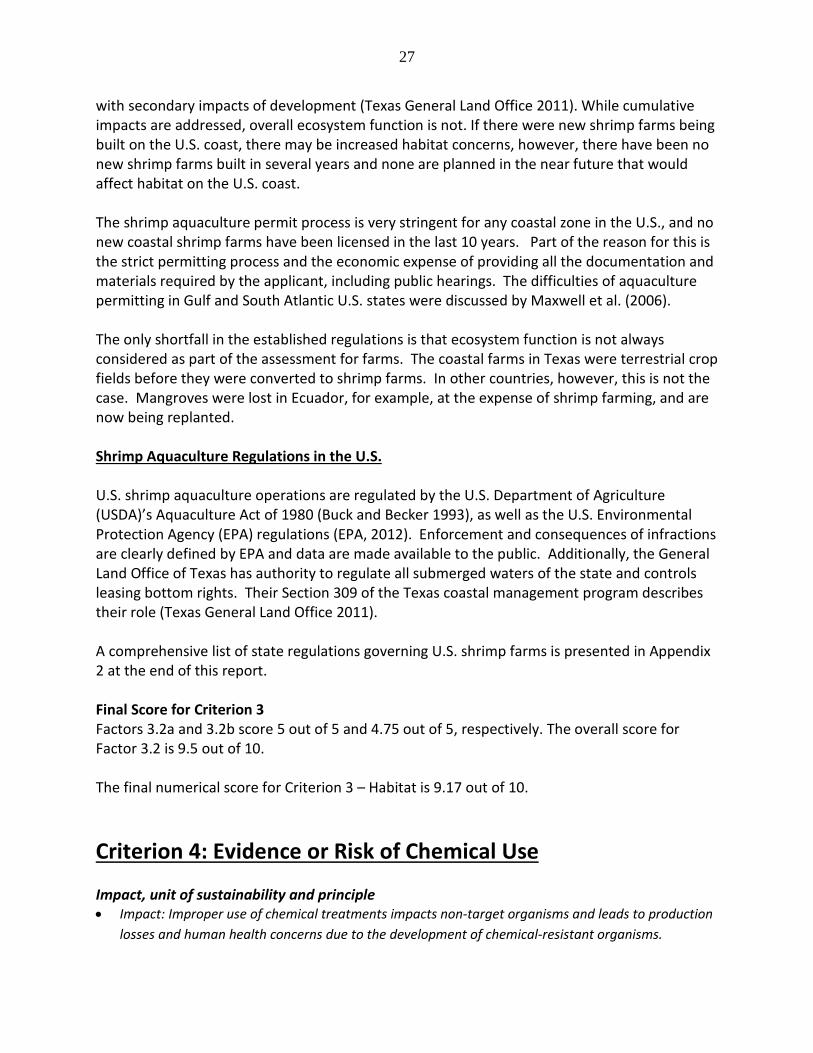
Criterion 4 Summary
Chemical Use parameters Score C4 Chemical Use Score 6.00 C4 Chemical Use Final Score 6.00 YELLOW Critical? NO Brief Summary Disease outbreaks are uncommon in U.S. shrimp aquaculture and as such the need for chemical use is demonstrably low. The most common chemical used is agricultural lime which is often used to disinfect pond bottoms after harvest. While select instances of chemical use have historically occurred, best management practices currently mitigate the risk of disease outbreaks and minimize the need for chemical use. The final numerical score for Criterion 4 – Chemical Use is 6 out of 10. Justification of Ranking In general, though chemical use is known to be low in U.S. shrimp aquaculture, publically-available scientific information is limited. The author of this assessment has relied on personal communications with producers as well as extensive personal experience as outlined in the following text. Boyd (2009) published “Calculating Chemical Treatments for Aquaculture,” which suggested specific amounts of substances to apply to ponds if needed. Regulations prohibit the use of many chemicals and antibiotics in U.S. shrimp aquaculture. The FDA in Silver Spring, MD publishes a list of drugs approved for aquaculture, USFDA URL: http://www.fda.gov/AnimalVeterinary/DevelopmentApprovalProcess/Aquaculture/ucm132954.htm The main commercial operations in the U.S. claim that they use chemicals and antibiotics responsibly and only when necessary. Although unsubstantiated, this claim is reinforced by limited or no disease occurrences in recent history in the U.S., negating the need for chemical use. Agricultural lime is used to control algal blooms and bacterial infections in shrimp like Vibrio spp. Lime is also used to adjust the soil pH or disinfect soils between crops. It can also be used directly in the pond during growout to control “black spot” on shrimp, an ailment caused by chitin-eating bacteria on the shell. Boyd (2002) described the correct liming procedures and amounts to use to improve shrimp pond water and bottom quality. In 2003, Boyd described chemical fertilizers in pond aquaculture. It is considered acceptable practice to use agriculture lime to disinfect pond bottoms between crops. This practice is used worldwide and is shown to have minimal effects on surrounding
29
habitats at the levels suggested for use by most best aquaculture practices (BAPs). Typical lime rates that have been used on shrimp farms to adjust soil pH, disinfect and oxidize metabolic wastes left on the pond bottom and other water quality issues are discussed by Boyd (1990). While the use of lime is commonplace and does not require a permit, other chemicals are regulated more closely and their use is permitted on a case by case basis. For example, an infestation of tubed-worms (Chaetagnaths) became a problem on one of the shrimp farms in South Texas and a special pesticide application was requested and approved by the TCEQ. The false mussel was another intruder that was introduced and grew on all structures under water (paddle wheel aerators, effluent pipes and water control gates) to the point that the sharp-edged shells became dangerous for workers. No control measures were taken for the false mussel other than mechanic measures (manually scraping off pipes and other structures). Generally, U.S. shrimp farms work to avoid disease, and the subsequent need for chemical use, through best management practices and good husbandry; however, on occasion chemical use is necessary. For example, if black spots are seen on the shrimp shells, the first course of action is to add molasses to the ponds as a carbon source to promote beneficial bacteria and control against the detrimental bacteria. If this is ineffective at combatting the black spot, lime is added to the pond in an attempt to disinfect and control the bacteria causing the black spots. Post-harvest, meta-bisulfite is often used at 2 ppm dip for 2 minutes to stop the normal chemical process that turns the shrimp shell dark after harvest. After a woman died in Corpus Christi, Texas in the 1980s from an allergic reaction to bisulfite in wild harvested shrimp, FDA established a regulation that no more than 100 ppm bisulfite could be found in shrimp muscle. FDA requires that all shrimp must be appropriately labeled if they contain bisulfite—this is similar to the wine and lettuce industries, which also use the same chemicals during processing for similar reasons. The TCEQ’s General Permit to Discharge Wastes (TCEQ 2013b) requires that the use of any chemical, drugs, or antibiotics is reported to the TCEQ. Given the data available, chemical use in U.S. shrimp farms are best defined by the Seafood Watch criteria as “Specific data may be limited, but the species or production systems have a demonstrably low need for chemical use.” The final numerical score for Criterion 4 – Chemical Use is 6 out of 10.
Criterion 5: Feed Impact, unit of sustainability and principle • Impact: feed consumption, feed type, ingredients used and the net nutritional gains or losses vary
dramatically between farmed species and production systems. Producing feeds and their ingredients has complex global ecological impacts, and their efficiency of conversion can result in net food gains, or dramatic net losses of nutrients. Feed use is considered to be one of the defining factors of aquaculture sustainability.
30
• Sustainability unit: the amount and sustainability of wild fish caught for feeding to farmed fish, the global impacts of harvesting or cultivating feed ingredients, and the net nutritional gains or losses from the farming operation.
• Principle: aquaculture operations source only sustainable feed ingredients, convert them efficiently and responsibly, and minimize and utilize the non-edible portion of farmed fish.
Criterion 5 Summary
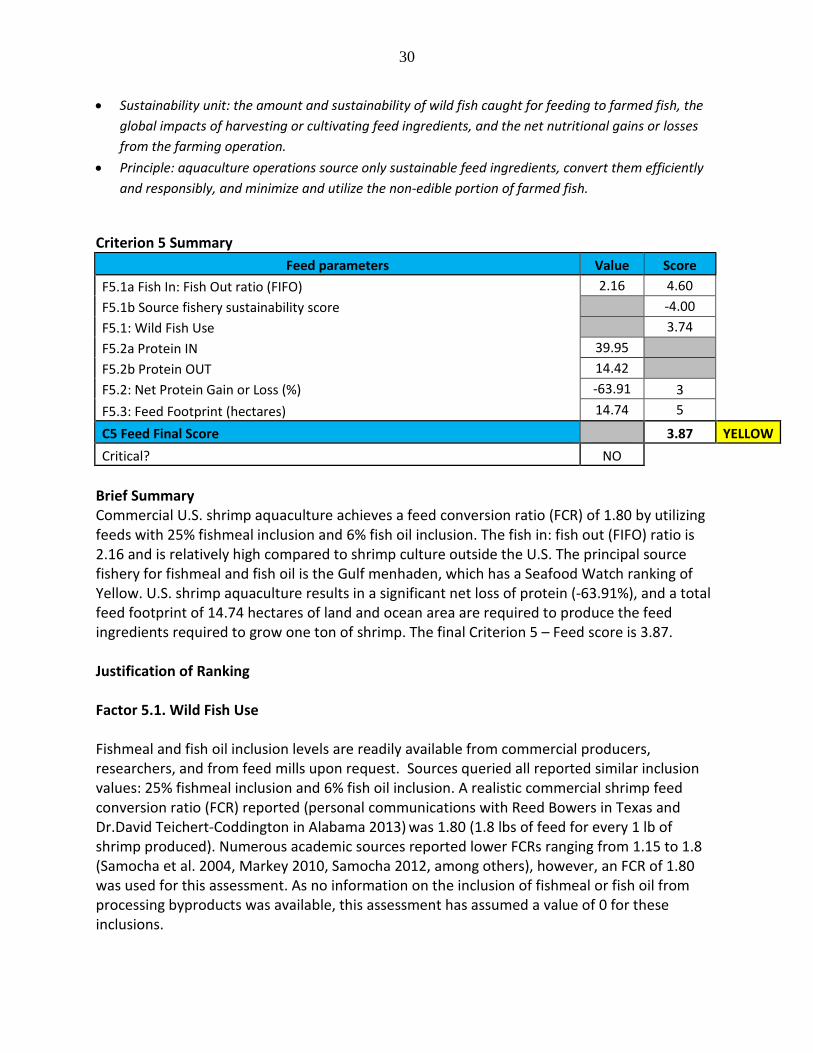
Feed parameters Value Score F5.1a Fish In: Fish Out ratio (FIFO) 2.16 4.60 F5.1b Source fishery sustainability score -4.00 F5.1: Wild Fish Use 3.74 F5.2a Protein IN 39.95 F5.2b Protein OUT 14.42 F5.2: Net Protein Gain or Loss (%) -63.91 3 F5.3: Feed Footprint (hectares) 14.74 5 C5 Feed Final Score 3.87 YELLOW Critical? NO
Brief Summary Commercial U.S. shrimp aquaculture achieves a feed conversion ratio (FCR) of 1.80 by utilizing feeds with 25% fishmeal inclusion and 6% fish oil inclusion. The fish in: fish out (FIFO) ratio is 2.16 and is relatively high compared to shrimp culture outside the U.S. The principal source fishery for fishmeal and fish oil is the Gulf menhaden, which has a Seafood Watch ranking of Yellow. U.S. shrimp aquaculture results in a significant net loss of protein (-63.91%), and a total feed footprint of 14.74 hectares of land and ocean area are required to produce the feed ingredients required to grow one ton of shrimp. The final Criterion 5 – Feed score is 3.87. Justification of Ranking Factor 5.1. Wild Fish Use Fishmeal and fish oil inclusion levels are readily available from commercial producers, researchers, and from feed mills upon request. Sources queried all reported similar inclusion values: 25% fishmeal inclusion and 6% fish oil inclusion. A realistic commercial shrimp feed conversion ratio (FCR) reported (personal communications with Reed Bowers in Texas and Dr.David Teichert-Coddington in Alabama 2013) was 1.80 (1.8 lbs of feed for every 1 lb of shrimp produced). Numerous academic sources reported lower FCRs ranging from 1.15 to 1.8 (Samocha et al. 2004, Markey 2010, Samocha 2012, among others), however, an FCR of 1.80 was used for this assessment. As no information on the inclusion of fishmeal or fish oil from processing byproducts was available, this assessment has assumed a value of 0 for these inclusions.
31
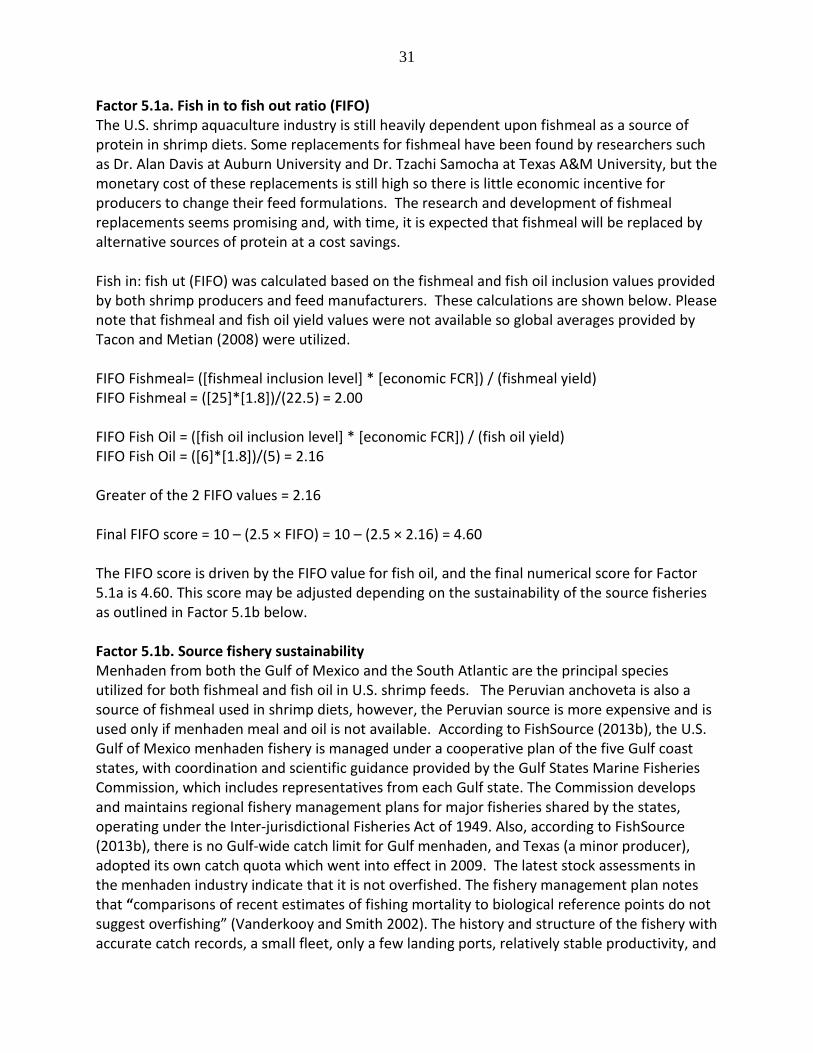
Factor 5.1a. Fish in to fish out ratio (FIFO) The U.S. shrimp aquaculture industry is still heavily dependent upon fishmeal as a source of protein in shrimp diets. Some replacements for fishmeal have been found by researchers such as Dr. Alan Davis at Auburn University and Dr. Tzachi Samocha at Texas A&M University, but the monetary cost of these replacements is still high so there is little economic incentive for producers to change their feed formulations. The research and development of fishmeal replacements seems promising and, with time, it is expected that fishmeal will be replaced by alternative sources of protein at a cost savings. Fish in: fish ut (FIFO) was calculated based on the fishmeal and fish oil inclusion values provided by both shrimp producers and feed manufacturers. These calculations are shown below. Please note that fishmeal and fish oil yield values were not available so global averages provided by Tacon and Metian (2008) were utilized. FIFO Fishmeal= ([fishmeal inclusion level] * [economic FCR]) / (fishmeal yield) FIFO Fishmeal = ([25]*[1.8])/(22.5) = 2.00 FIFO Fish Oil = ([fish oil inclusion level] * [economic FCR]) / (fish oil yield) FIFO Fish Oil = ([6]*[1.8])/(5) = 2.16 Greater of the 2 FIFO values = 2.16 Final FIFO score = 10 – (2.5 × FIFO) = 10 – (2.5 × 2.16) = 4.60 The FIFO score is driven by the FIFO value for fish oil, and the final numerical score for Factor 5.1a is 4.60. This score may be adjusted depending on the sustainability of the source fisheries as outlined in Factor 5.1b below. Factor 5.1b. Source fishery sustainability Menhaden from both the Gulf of Mexico and the South Atlantic are the principal species utilized for both fishmeal and fish oil in U.S. shrimp feeds. The Peruvian anchoveta is also a source of fishmeal used in shrimp diets, however, the Peruvian source is more expensive and is used only if menhaden meal and oil is not available. According to FishSource (2013b), the U.S. Gulf of Mexico menhaden fishery is managed under a cooperative plan of the five Gulf coast states, with coordination and scientific guidance provided by the Gulf States Marine Fisheries Commission, which includes representatives from each Gulf state. The Commission develops and maintains regional fishery management plans for major fisheries shared by the states, operating under the Inter-jurisdictional Fisheries Act of 1949. Also, according to FishSource (2013b), there is no Gulf-wide catch limit for Gulf menhaden, and Texas (a minor producer), adopted its own catch quota which went into effect in 2009. The latest stock assessments in the menhaden industry indicate that it is not overfished. The fishery management plan notes that “comparisons of recent estimates of fishing mortality to biological reference points do not suggest overfishing” (Vanderkooy and Smith 2002). The history and structure of the fishery with accurate catch records, a small fleet, only a few landing ports, relatively stable productivity, and
32
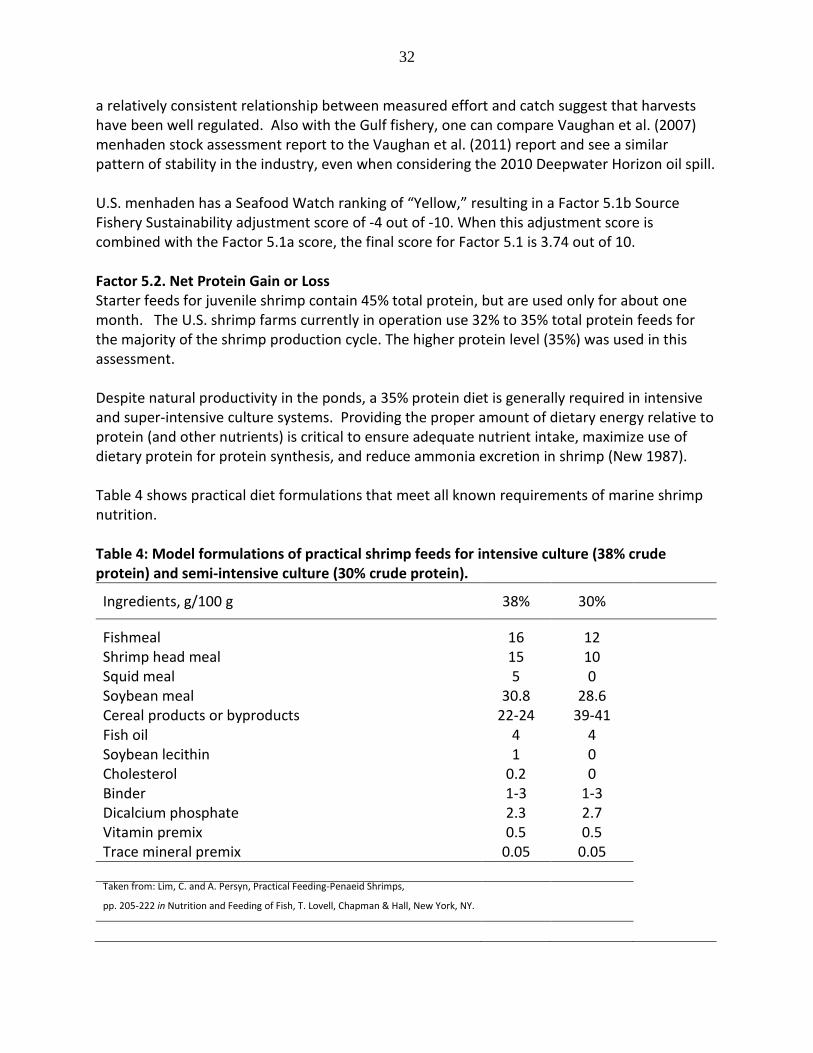
a relatively consistent relationship between measured effort and catch suggest that harvests have been well regulated. Also with the Gulf fishery, one can compare Vaughan et al. (2007) menhaden stock assessment report to the Vaughan et al. (2011) report and see a similar pattern of stability in the industry, even when considering the 2010 Deepwater Horizon oil spill. U.S. menhaden has a Seafood Watch ranking of “Yellow,” resulting in a Factor 5.1b Source Fishery Sustainability adjustment score of -4 out of -10. When this adjustment score is combined with the Factor 5.1a score, the final score for Factor 5.1 is 3.74 out of 10. Factor 5.2. Net Protein Gain or Loss Starter feeds for juvenile shrimp contain 45% total protein, but are used only for about one month. The U.S. shrimp farms currently in operation use 32% to 35% total protein feeds for the majority of the shrimp production cycle. The higher protein level (35%) was used in this assessment. Despite natural productivity in the ponds, a 35% protein diet is generally required in intensive and super-intensive culture systems. Providing the proper amount of dietary energy relative to protein (and other nutrients) is critical to ensure adequate nutrient intake, maximize use of dietary protein for protein synthesis, and reduce ammonia excretion in shrimp (New 1987). Table 4 shows practical diet formulations that meet all known requirements of marine shrimp nutrition. Table 4: Model formulations of practical shrimp feeds for intensive culture (38% crude protein) and semi-intensive culture (30% crude protein).
Ingredients, g/100 g 38% 30%
Fishmeal 16 12 Shrimp head meal 15 10 Squid meal 5 0 Soybean meal 30.8 28.6 Cereal products or byproducts 22-24 39-41 Fish oil 4 4 Soybean lecithin 1 0 Cholesterol 0.2 0 Binder 1-3 1-3 Dicalcium phosphate 2.3 2.7 Vitamin premix 0.5 0.5 Trace mineral premix 0.05 0.05 Taken from: Lim, C. and A. Persyn, Practical Feeding-Penaeid Shrimps,
pp. 205-222 in Nutrition and Feeding of Fish, T. Lovell, Chapman & Hall, New York, NY.
33
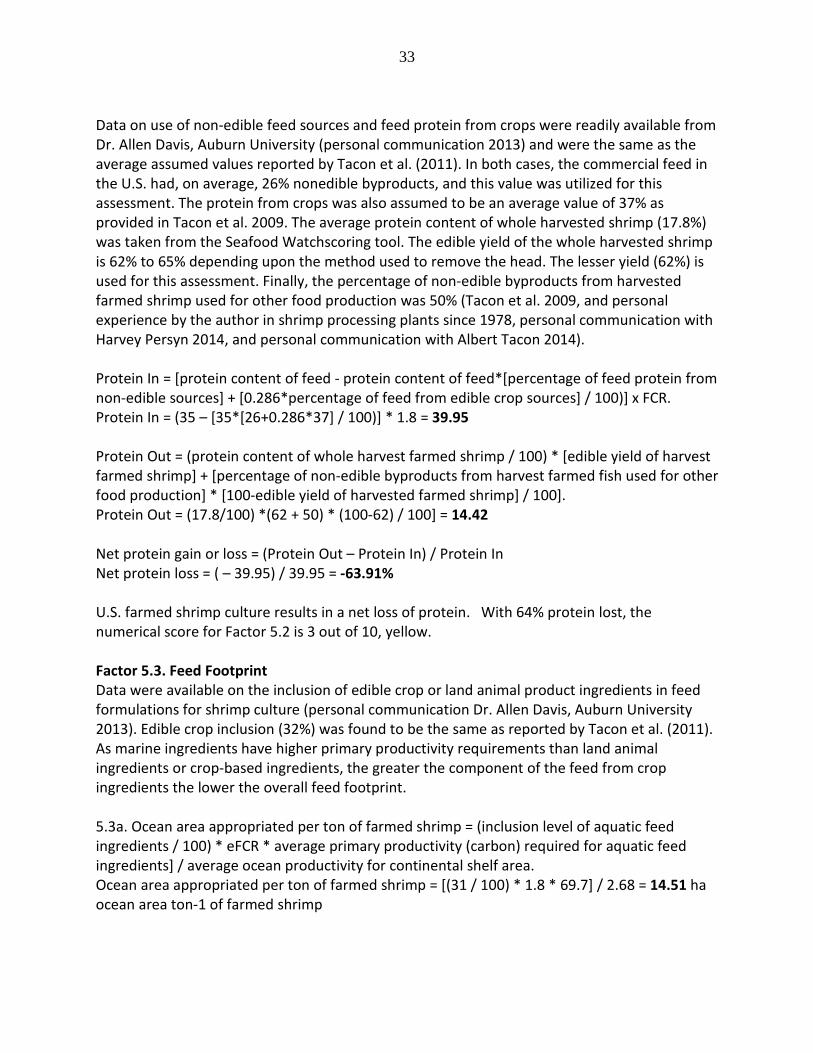
Data on use of non-edible feed sources and feed protein from crops were readily available from Dr. Allen Davis, Auburn University (personal communication 2013) and were the same as the average assumed values reported by Tacon et al. (2011). In both cases, the commercial feed in the U.S. had, on average, 26% nonedible byproducts, and this value was utilized for this assessment. The protein from crops was also assumed to be an average value of 37% as provided in Tacon et al. 2009. The average protein content of whole harvested shrimp (17.8%) was taken from the Seafood Watchscoring tool. The edible yield of the whole harvested shrimp is 62% to 65% depending upon the method used to remove the head. The lesser yield (62%) is used for this assessment. Finally, the percentage of non-edible byproducts from harvested farmed shrimp used for other food production was 50% (Tacon et al. 2009, and personal experience by the author in shrimp processing plants since 1978, personal communication with Harvey Persyn 2014, and personal communication with Albert Tacon 2014). Protein In = [protein content of feed - protein content of feed*[percentage of feed protein from non-edible sources] + [0.286*percentage of feed from edible crop sources] / 100)] x FCR. Protein In = (35 – [35*[26+0.286*37] / 100)] * 1.8 = 39.95 Protein Out = (protein content of whole harvest farmed shrimp / 100) * [edible yield of harvest farmed shrimp] + [percentage of non-edible byproducts from harvest farmed fish used for other food production] * [100-edible yield of harvested farmed shrimp] / 100]. Protein Out = (17.8/100) *(62 + 50) * (100-62) / 100] = 14.42 Net protein gain or loss = (Protein Out – Protein In) / Protein In Net protein loss = ( – 39.95) / 39.95 = -63.91% U.S. farmed shrimp culture results in a net loss of protein. With 64% protein lost, the numerical score for Factor 5.2 is 3 out of 10, yellow. Factor 5.3. Feed Footprint Data were available on the inclusion of edible crop or land animal product ingredients in feed formulations for shrimp culture (personal communication Dr. Allen Davis, Auburn University 2013). Edible crop inclusion (32%) was found to be the same as reported by Tacon et al. (2011). As marine ingredients have higher primary productivity requirements than land animal ingredients or crop-based ingredients, the greater the component of the feed from crop ingredients the lower the overall feed footprint. 5.3a. Ocean area appropriated per ton of farmed shrimp = (inclusion level of aquatic feed ingredients / 100) * eFCR * average primary productivity (carbon) required for aquatic feed ingredients] / average ocean productivity for continental shelf area. Ocean area appropriated per ton of farmed shrimp = [(31 / 100) * 1.8 * 69.7] / 2.68 = 14.51 ha ocean area ton-1 of farmed shrimp
34
5.3b. Land area appropriated per ton of farmed shrimp = [inclusion level of crop feed ingredients + (inclusion of land animal products * conversion ratio of crop ingredients to land animal products) * 0.01 * eFCR] / average yield of major feed ingredient crops The land area appropriated per ton of farmed shrimp = [33.5 + (0 * 2.88) * 0.01 * 1.8] /2.64 = 0.23 ha land area ton-1 of farmed shrimp. Value (ocean + land area) = 14.74 ha ton-1 of farmed shrimp. With a feed footprint of 14.74 hectares, the numerical score for Factor 5.3 is 5 out of 10. The final numerical score for Criterion 5 – Feed is 3.87 out of 10. The further development and inclusion of fishmeal and fish oil substitutes is likely to improve the Feed score. Many researchers (Davis and Boyd at Auburn Univ.; Samocha, Lawrence, and Gatlin at TAMU; among others) are working to find fishmeal replacement diets that are economical. This research has already started to affect commercial shrimp feed formulations at the major feed companies (Cargill, Zeigler and Rangen).
Criterion 6: Escapes Impact, unit of sustainability and principle • Impact: competition, genetic loss, predation, habitat damage , spawning disruption, and other
impacts on wild fish and ecosystems resulting from the escape of native, non-native and/or genetically distinct fish or other unintended species from aquaculture operations
• Sustainability unit: affected ecosystems and/or associated wild populations • Principle: aquaculture operations pose no substantial risk of deleterious effects to wild populations
associated with the escape of farmed fish or other unintentionally introduced species.
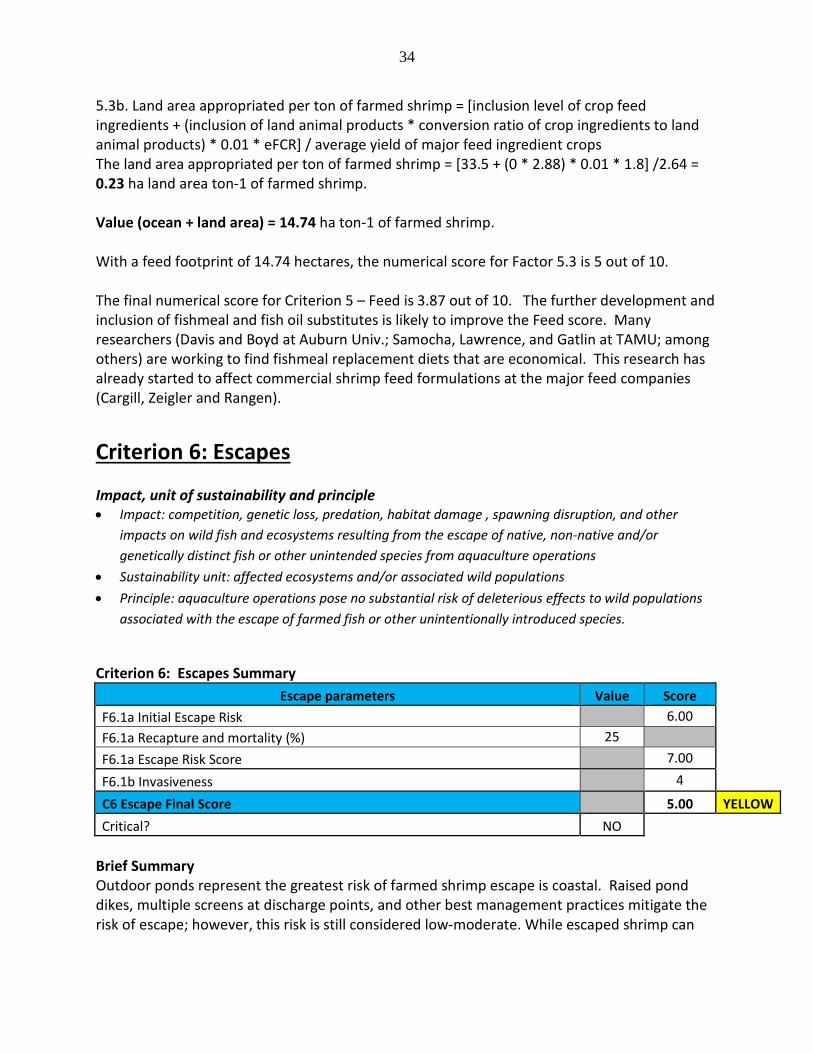
Criterion 6: Escapes Summary
Escape parameters Value Score F6.1a Initial Escape Risk 6.00 F6.1a Recapture and mortality (%) 25 F6.1a Escape Risk Score 7.00 F6.1b Invasiveness 4 C6 Escape Final Score 5.00 YELLOW Critical? NO
Brief Summary Outdoor ponds represent the greatest risk of farmed shrimp escape is coastal. Raised pond dikes, multiple screens at discharge points, and other best management practices mitigate the risk of escape; however, this risk is still considered low-moderate. While escaped shrimp can
35
interact with wild populations, hybridization and the subsequent deleterious genetic impacts is highly unlikely. The score for Criterion 6 – Escapes is 5 out of 10. Justification of Ranking Factor 6.1a. Escape risk Whiteleg shrimp are raised in enclosed earthen ponds and raceways and are heavily regulated as ‘exotic species’ in all states where they are cultured. Regulations and best management practices have been successful thus far in containing potential escapes which could pose environmental risks to the surrounding environment, especially native shrimp populations. The greatest risk of escape is in outdoor pond-based farms, however, these facilities employ multiple and appropriately-sized screens, water treatment and secondary capture devices. The coastal farms are also required to have pond dikes one foot above the 100-year flood plain. The majority of U.S. shrimp farms (in number, not in acreage) are inland operations using recirculation systems with screens, with no direct connection to natural water bodies. They are not subject to flood or storm surge because they are located inland from the coast. While hurricanes pose a direct threat of escapes to coastal farms due to potential storm surge, a hurricane has not affected shrimp farms in the U.S. since the first farm was built in 1980, and farms are required by regulatory agencies to have contingency plans in the event of a hurricane. In Texas, for example, each pond must have 3 separate (redundant) screens at the effluent discharge point to prevent escapes. To prevent potential storm surge from entering ponds, the tops of the pond dikes must be at least one foot above the 100-year flood plain, which generally results in the pond dikes being about 15 feet above sea level. Farms are required to either quick-harvest the crop before an on-coming storm or to lower the pond water level to prevent excessive rainfall from causing the pond to overflow. It is also thought that shrimps that successfully escape from ponds have a very high mortality rate because no farmed-raised shrimp have been found in the wild since the late 1990s when an accidental release occurred at Arroyo City, Texas. Several publications (e.g., Briggs et al. 2004, CABI 2011) have noted that no domesticated L. vannamei populations have established in the wild on the Atlantic coast or the Gulf of Mexico, even though shrimp farms have been in existence there since the 1980s and 1990s. Columbia, Nicaragua, Honduras, Panama, Venezuela, Trinidad, the Virgin Islands, Puerto Rico, Dominican Republic, the Bahamas, Cuba, and even Mexico’s Gulf of Mexico coast have vannamei farms, and no wild populations have been established (FAO 2011a, FAO 2011b, Briggs et al. 2004, CABI 2011). According to FAO (2011), L. vannamei is restricted to areas where the water temperature remains above 20 °C (68 °F) throughout the year. This is critical information in determining why this species has not been seen to be invasive outside it normal habitat. The initial escape risk score (Factor 6.1a) is 6 out of 10, based on low-exchange ponds with multiple or fail-safe escape prevention methods. The escape risk score can be improved by applying a recapture and mortality adjustment when there is evidence of immediate recapture
36
or direct mortality of escapes. Though no scientific studies were available to inform this adjustment, in the author’s experience, a large majority of escaped shrimp are expected to experience mortality based on the species’ requirements for high water temperatures and increased incidents of predators around farms. For the purposes of this assessment, a conservative adjustment of 25% is applied, although in reality a much higher portion of any escapes are not expected to survive long enough to impact surrounding environments. When the 25% recapture and mortality adjustment is applied, the numerical score for Factor 6.1a is 7 out of 10. Factor 6.1b. Invasiveness With respect to Factor 6.1b Invasiveness, L. vannamei are considered non-native to the United States. Farmed shrimp are not established in the region and any escapees are considered highly unlikely to survive or establish viable populations (FAO 2011, CABI 2011); as such, Factor 6.1b Part B scores 2 out of 2.5. CABI (2011) classifies L. vannamei as “not-invasive” in all the sea areas that it lists and all the areas of Asia, Africa, North America, Central America and Caribbean, South America. The only areas which L. vannamei has been introduced which CABI did not classify as not-invasive are: Netherlands, Fiji, French Polynesia, Guam and New Caledonia. FAO (2011) states the species will not survive in areas where the water temperature drops below 20 °C (68 °F). FAO goes further to say that the species is restricted to areas where the water temperature remains above 20 °C (68 °F) throughout the year. This temperature-dependency alone rules out any possibility of L. vannamei establishing wild breeding populations in U.S. waters as the climate in the U.S. is considered temperate and not tropical. There have been a number of physiological studies on the various species of shrimp and how they interact with other shrimp species. Dall et al. (1991) included discussion on L. vannamei. Evidence from earlier research at Texas A&M University on crossing various species of shrimp showed that even though hybridizing species is possible using artificial insemination, the crosses are sterile. It is thought that escapees would compete for habitat and would act to the detriment of other species (e.g., by feeding, foraging and settlement). No other impact of escapees on native shrimp is known. Further on the invasiveness factor, researchers attempted to cross the native Gulf of Mexico species with exotic shrimp in the 1980s and 1990s. Some of the crosses were successful, but the offspring were sterile and a viable cross could not be maintained. Hybridization was attempted with L. setiferus (Gulf white shrimp) + L. stylirostris (Pacific blue shrimp) and other species at Texas A&M University in the 1980s. Cryopreservation of eggs was also attempted with limited success both at Texas A&M University and the University of California at Davis. The results of these studies indicate that successful hybridization between shrimp species is unlikely and, therefore, deleterious genetic impacts of farm escapes on wild stocks is of low concern.
37
In further justification of the invasiveness scoring, an examination of current lists of invasive species published by the International Union for Conservation of Nature’s Invasive Species Specialist Group (IUCN) revealed no listings for L. vannamei. As mentioned in the section above, L. vannamei has been anthropogenically introduced as an aquaculture species to several areas of the world in which it is not native (e.g., U.S., Belize, Brazil, various Caribbean and Pacific islands, South-East Asia, mainland China, India, etc.). Although there have been numerous escapes from aquaculture production facilities into non-native waters, and this species is regularly caught in the wild around Asia, it is as yet unproven whether breeding populations have been established anywhere in the world outside its natural range (CABI 2011). CABI (2011) labels L. vannamei as a “not-invasive” species in all areas listed on its distribution table. Unlike P. monodon, L. vannamei has not been found to be invasive outside its normal range. FAO (2011) states that the species has a very restricted temperature requirement. Any escapes that do occur are expected to compete with native populations for food and habitat, as well as add predation pressure on wild populations. Escapees are also expected to modify habitats to the detriment of other species by feeding and foraging. However, as shown from the hybridization studies above, escapees are not expected to compete with native populations for breeding partners or disturb breeding behaviors or wild shrimp. The numerical score for Factor 6.1b is 4 out of 10. Final Escape Score The Escape Risk and Invasiveness Factors are combined to calculate an overall Escape Final Score. The Escape Risk score (Factor 6.1a, score of 7 out of 10) is driven mainly by the threat of escapement of exotics during a potential storm event. Coastal facilities are at greater risk of escapement due to potential hurricanes than inland facilities, and the indoor facilities are at less risk of escapement than the open ponds. While hybridization of farm escapes with wild shrimp populations is unlikely, any shrimp that do escape will impact the surrounding environment in a variety of ways (Factor 6.1b, score of 4 out of 10). The final numerical score for Criterion 6 – Escapes is 5 out of 10.
Criterion 7: Disease; pathogen and parasite interactions Impact, unit of sustainability and principle • Impact: amplification of local pathogens and parasites on fish farms and their retransmission to local
wild species that share the same water body • Sustainability unit: wild populations susceptible to elevated levels of pathogens and parasites. • Principle: aquaculture operations pose no substantial risk of deleterious effects to wild populations
through the amplification and retransmission of pathogens or parasites.
38
Criterion 7: Diseases
Pathogen and parasite parameters Score C7 Biosecurity 8.00 C7 Disease; pathogen and parasite Final Score 8.00 GREEN
Critical? NO Brief Summary While several shrimp diseases are problematic in the global industry, the United States has historically had relatively few instances of disease outbreaks and mortality. While some examples of outbreaks are known, research and development of biosecurity and best management practices have mitigated the risk of outbreak as well as the transmission to wild populations. To date there is no evidence that diseases from shrimp farms have adversely affected wild populations. The score for Criterion 7 – Disease is 8 out of 10. Justification of Ranking U.S. shrimp producers report that while viruses do not occur on their farms, bacterial infections are common. Outbreaks of Vibrio spp. (harveyi, vulnificus, parahimolicitus) are an ongoing problem in both the intensive outdoor and the super-intensive indoor operations. Treating bacterial infections with chemicals is both economically costly and may have adverse environmental impacts and as such preventative measures such as best management practices are employed to mitigate the risk of disease outbreaks. Biosecurity for outdoor ponds consists of obtaining disease resistant animals, preventing any human traffic that might contaminate or spread disease from other farms, washing and disinfecting cast nets, boats and other equipment that are shared between ponds, etc. During the 1990s, the understanding of shrimp diseases, virulence, and containment was limited and there was, therefore, justified concern for the spread of shrimp diseases from exotic cultured animals to wild populations in the U.S. Through research and development (see Johnson 1991, 1995; Lightner 1999; Alday and Flegel 1999; Brock and Main 1995), biosecurity protocols and best management practices were developed to mitigate these risks. These biosecurity measures have kept the U.S. virus-free since 2004. Historically, disease outbreaks have occurred on U.S. shrimp farms. An outbreak of white spot syndrome virus (WSSV) first occurred in the U.S. on a Texas shrimp farm in 1995. Taura syndrome virus (TSV) was first found in the Taura River basin in Ecuador and subsequently spread to the U.S. It was initially eradicated from the U.S. but another outbreak occurred in 2002. According to USDA/USMSFP, the USDA’s High Health program assisted in producing animals that were five times more resistant to TSV than the unimproved animals (personal communication with Tony Ostrowski, director of the USMSFP in 2003 and current president of the Oceanic Institute in Hawaii). Thus, by the time the second TSV outbreak occurred, the domesticated animals being cultured were more resistant and effective biosecurity measures were in place to mitigate the virus’s impacts. WSSV was effectively eradicated in 1995 and a
39
TSV outbreak has not occurred since 2004. It should be noted that WSSV has continued to cause problems in other countries, such as Mexico, where an outbreak occurred in the state of Sonora in 2010, and continues to cause problems on farms there today. Mexican shrimp hatcheries did not employ any selective breeding for disease resistance, according to personal communication from CIAD (2010) in Sonora. Environmentalists and shrimp harvest groups lobbied the U.S. Congress to create the Joint Subcommittee on Aquaculture (JSA) in the 1990s. The JSA initiated and paid for an assessment of the threat from shrimp farming to wild shrimp stocks, which was carried out from 1995 to 1997. The resulting report entitled “Evaluation of Potential Shrimp Virus Impacts on Cultured Shrimp and Wild Shrimp Populations in the Gulf of Mexico and Southeastern U.S. Atlantic Coastal Waters” was submitted to the U.S. Congress by the Joint Subcommittee on Aquaculture (consisting of the U.S. Dept. of Commerce, NOAA/NMFS, USDA, Animal and Health Inspection Service, National Center for Environmental Assessment, U.S. EPA, the U.S. Fish and Wildlife Service, and U.S. Dept. of Interior) in June 1997. In brief, the study concluded that there were threats to wild shrimp populations from farms, but that these threats were minimal due to the steps being taken by the shrimp culture industry to control disease outbreaks. They developed disease free strains of shrimp through the efforts of the USDA’s U.S. Marine Shrimp Farming Program, initially headed by Dr. Gary Pruder, then Dr. Anthony Ostrowski and lastly by Dr. Saun Moss. All three of these directors have numerous publications describing the extensive process of developing disease resistant animals (Pruder 1992; Ostrowski et al. 2005, 2006; Moss 2007, 2008, 2009, Moss et al. 2005a, 2005b, 2008a, 2008b, 2009). The JSA report concludes that diseases were becoming better understood and procedures were being implemented to avoid or prevent them (JSA 1997). An overall conclusion of the report was that as the industry technology and practices developed based on further information on disease control methods, the threat of disease outbreak and transfer was further minimized (JSA 1997). Since the 1997 publication, these conclusions have been shown to be accurate. Since 2004, there have been no further serious commercial outbreaks of any of the shrimp viruses in the U.S. (personal observation by author). There were also hearings in the U.S. Senate that explored the shrimp farming industry in 1996 and assessed the virus threat and how to stop it (U.S. Senate Hearing on “Marine Shrimp Farming and Aquaculture Research: hearing before a subcommittee of the Committee on Appropriations, U.S. Senate, 114th Congress, second session: special hearing, 1996”). Genetic selection for disease-resistant penaeids started in the U.S. in the late 1980s and early 1990s as a result of work by the USDA's Marine Shrimp Farming Program (Pruder 1992; Ostrowski et al. 2005, 2006, Moss, 2007, 2008, 2009; Moss et al. 2005a, 2005b, 2008a, 2008b, 2009). The technology and practices spread to other countries in the mid to late 1990s and that technology continues to spread (e.g., a recently-announced sale of technology from the Oceanic Institute in Hawaii to China). For more information on High Health shrimp development, refer to Newman, 2009.
40
Regular disease monitoring is carried out by the farms as well as the relevant state regulatory agencies. In Texas, for example, the regulatory agency responsible for monitoring and controlling exotic species (Texas Parks and Wildlife) sends a qualified biologist to each farm bi-monthly to look for signs of shrimp diseases. If any visual evidence of disease is detected on or in the shrimp, the shrimp are sent to the disease testing laboratory in Arizona. If disease is found, appropriate measures are given by the regulatory agency. The only hatchery in Texas, KAPPA Aquafarm, is also required to preserve post-larval shrimp per OIE protocols monthly, and to send samples to the shrimp disease laboratory in Arizona for disease diagnostic testing. The protocols currently in place were developed by the USDA and modeled after the poultry and swine industries successes with disease management. These protocols have been shown to control diseases in the U.S. shrimp aquaculture industry (Pruder 1992, Ostrowski et al. 2005, 2006; Moss 2007, 2008, 2009; Moss et al. 2005a, 2005b, 2008a, 2008b, 2009). The threat of spreading shrimp diseases to local species is minimized by the biosecurity measures practiced by farms and also by farms buying their seed animals from High Health, certified specific pathogen free sources. The biosecurity measures on U.S. shrimp farms are adopted from the OIE Aquatic Animal Health Code of Conduct and the disease testing used in the disease laboratories is outlined in the OIE Manual for Diagnostic Testing of Aquatic Animals. URL: http://www.oie.int/en/. The OIE publishes an “Aquatic Animal Health Code” and a “Manual of Diagnostic Tests for Aquatic Animals,” which the shrimp farm industries and pathology labs follow. Updated editions are published approximately every three years http://www.oie.int/en/international-standard-setting/aquatic-manual/access-online/ [site accessed on 7-16-13 ]. There is also the OIE Quality Standard and Guidelines for Veterinary Laboratories, which provides a specific interpretation of the generally stated requirements of the International Standards Organization (ISO)/IEC 17025 for veterinary laboratories. The U.S. marine shrimp farming industry has not been troubled by shrimp viruses in recent years. However, there are more than 20 known viruses that infect shrimp, and four continue to pose a major threat to the world industry (infectious hypodermal and hematopoietic necrosis virus - IHHN, Taura syndrome virus - TSV, yellow head virus - YHV, and white spot syndrome virus – WSSV). In the western hemisphere, nine of the 20 viruses have killed shrimp, and five are considered serious pathogens. Twelve viruses have been found in the eastern hemisphere, with five causing mass mortality. More recently, another disease has caused mass mortality of shrimp in Asia— early mortality syndrome (EMS). This disease typically manifests in the first 10 to 40 days after stocking postlarvae in ponds, and was first reported in China in 2009. It then spread to Vietnam in 2010, to Malaysia in 2011, and to Thailand in 2012 (In Thailand, it recently (2013) spread to the productive southern region). Global losses due to EMS are well in excess of USD $1 billion per year. Despite the four-year history of this disease, its cause has been obscure until recently. Initially, it was unclear whether an environmental toxin or an infectious agent caused the disease. At a panel discussion on EMS at a conference in Bangkok on October 31, 2012, experts
41
such as Don Lightner and Timothy Flegel speculated that the elusive nature of the disease might be explained by a bacteriophage, which is a virus that can transfer lethal toxin genes to bacteria. Examples of diseases in which bacteriophages cause toxicity of bacteria are diphtheria and cholera in humans and Vibrio harveyii in shrimp. A recent breakthrough by Lightner and his team at the University of Arizona not only confirms the cause as a pathogen— not an environmental toxin— but also provides an experimental model for identifying the infectious agent. This is expected to lead to rapid progress in developing diagnostic tools and to a better understanding of techniques for managing the disease. It is hoped that this breakthrough will help control this disease and mitigate the risks of an outbreak in the U.S. shrimp aquaculture industry through prevention and biosecurity practices. Transmission of exotic pathogens can occur through a variety of means, including movement by humans, birds, and other animals, as well as through the shipment of infected frozen food products (Humphrey 1995). Several studies of the method of introduction of WSSV into Texas (after the initial 1995 outbreak) concluded that introduction and spread of WSSV may be through the importation of frozen shrimp product (both as bait for sport fishermen and as products available in markets for human consumption) (Lightner 1996, Nunan et al. 1998). Shrimp processing plant wastes pose another major potential disease exposure pathway to shrimp in the U.S. Foreign wild shrimp harvesters may catch shrimp with diseases and ship them to the U.S. as a frozen product. Likewise, some foreign aquaculture operations harvest their ponds immediately upon finding disease and export the infected shrimp. Shrimp from foreign countries are repackaged at processing plants in the U.S. and the solid wastes, such as the carapace, were historically disposed of into local waters or landfills (Overstreet et al., 1997). This practice represents a significant biosecurity risk and the dumping of shrimp heads offshore was stopped. However, processing wastes still continue to be dumped in landfills where birds have access and transport the wastes some distances. Composting is a more biosecure solution for processing wastes and some shrimp processing facilities send their wastes for composting. While shrimp viruses do not affect humans who consume infected shrimp, a study of frozen imported shrimp sampled in 12 grocery stores in Arizona, California, and Texas found that five of the 12 samples of shrimp had either WSSV or YHV (Nunan, Poulos and Lightner 1998). Freezing does not destroy the virus—in fact, freezing is the preferred method of virus preservation among pathologists. In laboratory experiments, infection and mortality occurred when frozen imported shrimp were fed to live shrimp. Polymerase Chain Reaction (PCR) tests confirmed that the viruses were present in the frozen supermarket shrimp (Nunan, Poulos, and Lightner 1998). Despite significant advancements in the areas of shrimp disease management and mitigation, several recent developments have reduced the United States’ capacity for further research. The U.S. Congress initiated the U.S. Marine Shrimp Farming Program, which resulted in valuable
42
developments with Specific Pathogen Free (or High Health) L. vannamei and genetically improved animals (improved growth); however, funding for this program expired in 2011, ending studies. Additionally, the Texas Veterinary Medical Diagnostic Center in College Station closed the APHIS-certified laboratory that worked with aquatic diseases in Texas. As such, there are relatively few remaining laboratories in the U.S. that now work with shrimp diseases (labs exist in Arizona, Mississippi and Florida). Current production practices employ biosecurity and best management practices to mitigate disease outbreaks and do not increase the likelihood of pathogen amplification or transmission to natural populations. The final numerical score for Criterion 7 – Disease is 8 out of 10.
Criterion 8: Source of Stock – independence from wild fisheries Impact, unit of sustainability and principle • Impact: the removal of fish from wild populations for on-growing to harvest size in farms • Sustainability unit: wild fish populations • Principle: aquaculture operations use eggs, larvae, or juvenile fish produced from farm-raised
broodstocks thereby avoiding the need for wild capture
Criterion 8: Source of Stock
Source of stock parameters Score
C8 % of production from hatchery-raised broodstock, natural (passive) settlement, or sourced from sustainable fisheries
100
C8 Source of stock Final Score 10.00 GREEN Brief Summary Current U.S. shrimp farming operations rely completely on hatchery-reared broodstock for juveniles. As such, there is no dependence on wild stocks for seed—the score for Criterion 8 – Source of Stock is 10 out of 10. Justification of Ranking 25 years ago, the original development of specific pathogen free (SPF) shrimp used wild shrimp stocks as the source. However, soon after the establishment of the SPF program, animals were selected from 44 different domestic families that produced desired traits; these animals were incorporated into the SPF program as genetically improved animals (USDA USMSFP). For all U.S. shrimp farming operations during the last 25 years, the source of broodstock has been from the USDA U.S. Marine Shrimp Farming Program’s high health shrimp stocks, which are held in quarantine in Hawaii. However, the U.S. Congress defunded the program in 2011, and about
43
the same time Shrimp Improvement Systems, Inc. (SIS, located in Florida, is the largest shrimp hatchery in the U.S.) was purchased by CP-Indonesia. SIS provides most of the broodstock in the U.S. and their stocks originated from the USMSFP program. Today broodstock still originate from SIS’s High Health, genetically improved shrimp stocks, but the broodstock program was moved to Hawaii for better hurricane protection in 2014. A significant step toward intensification of L. vannamei culture and domestication started in the 1980s and continued into the 1990s in the U.S. In Hawaii, Dr. James Wyban (Wyban and Sweeney 1991) published an intensive culture manual and moved toward stock selection and specific pathogen free stocks. The USDA U.S. Marine Shrimp Farming Program started over 25 years ago and further developed the SPF concept, following the techniques used in the poultry and swine industries. Most other shrimp development programs around the world now follow similar procedures, and all have agreed to follow the OIE Aquatic Animal Code. Wyban further developed High Health P. monodon with similar techniques as were used with vannamei. Once the steps to domestication (i.e., mass selection, family selection, walk-back selection, marker-assisted selection or transgenics) are completed, there is no further reliance on the wild populations. The species is then considered domesticated, and generally more desirable for culture than wild shrimp. L. vannamei has been considered domesticated for the past 10 years. The process was described in a number of U.S. Marine Shrimp Farming Program publications and scientific articles (Lee 2005; Ostrowski et al. 2005, 2006; Pruder 1992; Moss 2007, 2008, 2009, Moss et al. 2005a, 2005b, 2008a, 2008b, 2009). All farmed stock is considered completely independent of wild populations. As such, the final score for Criterion 8 – Source of Stock is 10 out of 10.
Criterion 9X: Wildlife and predator mortalities
A measure of the effects of deliberate or accidental mortality on the populations of affected species of predators or other wildlife. This is an “exceptional” criterion that may not apply in many circumstances. It generates a negative score that is deducted from the overall final score. A score of zero means there is no impact. Criterion 9X Summary Wildlife and predator mortality parameters Score
C9X Wildlife and predator mortality Final Score -2.00 GREEN Critical? NO
44
Brief Summary Best management practices and non-lethal methods are effective at deterring predation of farmed shrimp in the U.S., however, wildlife mortalities are known to occur in exceptional cases. Precise data on numbers of mortalities are unavailable, however, no threatened or endangered species are affected and the exceptional mortalities are not shown to have a population-level effect. The final numerical score for Exceptional Criterion 9X is -2 out of -10. Justification of Ranking Although U.S. shrimp aquaculture operations may attract or interact with predators or other wildlife, there does seem to be effective management and prevention measures in place that limit wildlife mortalities to exceptional cases. Common predators on shrimp farms include birds (waders, diving ducks, and cormorants), wild pigs, muskrats, beavers, otters, rattlesnakes and alligators. Bird predation has the most significant economic impact on aquaculture operations and the Southern Regional Aquaculture Center offers extension services for implementing non-lethal deterrents such as scaring devices as well as physical barriers (Littauer et al. 1997). Although exceptions may be granted, the Migratory Bird Treaty Act of the U.S. prohibits the killing of migratory bird species (16 U.S.C. 703) and more information can be found at URL: http://www.law.cornell.edu/uscode/text/16/703. There is some difficulty in finding information about predator mortality (as noted in the low data score for this Criterion). For example, it is known that farms may apply to the U.S. Fish and Wildlife Service for permits to kill avian predators, but it is unknown how many birds are allowed to be killed on each permit. In general, farmers are not willing to discuss the measures taken or required to control birds and other wildlife, and information is not available in the scientific literature, however, in the author’s experience non-lethal methods are utilized much more often than lethal ones. Air cannons and other noise makers such as firecrackers, exploding rockets, or flare guns are initially effective, however, birds become accustomed to these noises and the efficacy of these methods is quickly reduced. Monofilament plastic fishing line can be stretched across a pond to deter birds’ flight; however, this method is not practical for large ponds. Farm operators report mostly nuisance occurrence of predatory birds, but lethal action to remove predators has occurred in some exceptional cases. The U.S. Fish and Wildlife Service issues a bird control permit that allows the farmer to use lethal action on a very limited number of birds and other predatory species. The double-breasted cormorant is one such bird predator that can eat significant volumes of farmed shrimp (it has been reported to be able to eat its weight in shrimp each day). The seagull is more of a nuisance bird than a predator bird; seagulls commonly fly behind the feed blower and land in the water to consume shrimp feed. Farmers use a sinking feed for shrimp, which helps deter seagulls. No threatened or endangered species prey on farmed shrimp, and the predators that do occur exhibit robust local populations. As shown, wildlife mortalities occur, but these mortalities are limited to exceptional cases and regulatory oversight ensures this lethal take does not
45
significantly impact affected species’ population size. As such, the final numerical score for Exceptional Criterion 9X is -2 out of -10.
Criterion 10X: Escape of unintentionally introduced species A measure of the escape risk (introduction to the wild) of alien species other than the principle farmed species unintentionally transported during live animal shipments. This is an “exceptional” criterion that may not apply in many circumstances. It generates a negative score that is deducted from the overall final score. Criterion 10X Summary
Escape of unintentionally introduced species parameters Score C10Xa International or trans-waterbody live animal shipments (%) 10.00 C10Xb Biosecurity of source/destination 10.00 C10X Escape of unintentionally introduced species Final Score 0.00 GREEN
Brief Summary The biosecurity of both the source and destination facilities in U.S. shrimp farming is shown to be high. As such, the concern regarding the escape of intentionally introduced species (other than the farmed shrimp) is null. The final score for Exceptional Criterion 10X is 0 out of -10. Justification of Ranking U.S. shrimp farms utilize only domestically raised postlarvae, or they must be from a hatchery with a health certification and is classified as disease-free. International hatcheries must also have their shrimp tested in the same manner as U.S. hatcheries and at the same shrimp disease laboratory in Tucson, Arizona. In the last 33 years of commercial shrimp farming, no shrimp were released accidently during shipping from the hatchery to the growout destination. As OIE biosecurity measures are strictly employed, thus far there have been no impacts surrounding international or trans-waterbody live shrimp shipments. A hurricane or flood event has not caused an accidental release of exotic shrimp on the mainland U.S. or Hawaii since the first shrimp farm was built in Texas in 1980. Contingency plans are required and in place at all coastal shrimp farms. Pond dikes are required to be one foot above the 100-year flood plain, which in Texas results in most pond dikes being built 15 feet above sea level. Accidental releases were found at an Arroyo City shrimp farm in the 1990s by regulatory agencies and as a result Texas Parks and Wildlife Dept. manually closed the farm discharge and later implemented strong regulations on exotic releases on the coast, which was effective at stopping the releases.
46
As both the source and destination biosecurity is high, the final score for Exceptional Criterion 10X – Escape of unintentionally introduced species is 0 out of -10.
47
Acknowledgements Scientific review does not constitute an endorsement of the Seafood Watch® program, or its seafood recommendations, on the part of the reviewing scientists. Seafood Watch® is solely responsible for the conclusions reached in this report. Seafood Watch would like to thank Francisco Fierro of El Terco Shrimp Farm, Mark Godwin of Woods Fisheries, Harvey Persyn, Dr. Robert R. Stickney, Dr.David Teichert-Coddington of Green Prairie Aquafarm, and Dr. Ya-Sheng Juan of the Texas Parks and Wildlife Department for graciously reviewing this report for scientific accuracy.
48
References
Alday de Graindorge, V. and Flegel, T.W. 1999. Interactive CD entitled “Diagnosis of Shrimp Diseases.” ISBN 974-662-093-2. FAO, Rome, Italy and Multimedia Asia Co. Ltd., Bangkok, Thailand. Baker, P., Coastal Shrimp Farming in Texas: A Case Study, in Murky Waters: Environmental Effects of Aquaculture in the United States, R. Goldburg, Editor. 1997, EDF Publications: Washington, DC. Boyd, C.E. 1990. Water quality in warmwater fish ponds, Auburn University, Auburn, Alabama, 1979. 2nd Edition. Boyd, C. E. 1997. Shrimp Farming & the Environment: A white Paper. Department of Fisheries and Allied Aquacultures. Auburn University Alabama. Boyd, C.E. 2001. Management Practices for Reducing the Environmental Impacts of Shrimp Farming. Pp.265-292 In Methods of Improving Shrimp Farming in Central America. USDA and University of Central America. ISBN:99924-36-14-X. Boyd, C.E. and Clay, J.W. 2002. Evaluation of Belize Aquaculture, Ltd: A Super-intensive Shrimp Aquaculture System. In Review report prepared under the World Bank, NACA, WWF and FAO Consortium Program on Shrimp Farming and the Environment, pp. 1-17. Boyd, C.E. and Yoo, K.H. 1994. Hydrology and Water Supply for Pond Aquaculture. Chapman and Hall, New York, pp. 439-449. Boyd, C.E. 2014. List of Publications: web link: http://www.ag.auburn.edu/fish/faa-directory/claude-e-boyd/. Boyd, C.E. 2009. Calculating Chemical Treatments For Aquaculture Production. Global Aquaculture Advocate Magazine. May/June, pp. 52-54. Boyd, C.E. 2003. Chemical Fertilizers in Pond Aquaculture. Global Aquaculture Advocate Magazine. June, pp. 74-75. Boyd, C.E. 2002. Correct Liming Improves Pond Water, Bottom Quality. Global Aquaculture Advocate Magazine. August, pp.58-59. Briggs, M., Funge-Smith, S., Subasinghe, R. and Phillips, M. 2004. Introductions and movement of Penaeus vannamei and Penaeus stylirostris in Asia and the Pacific. FAO Regional Office for Asia and the Pacific. RAP Publication 2004/10:1–12. Brock, J.A. and Main, K.L. 1995. A Guide to the Common Problems and Diseases of Cultured Penaeus vannamei, The Oceanic Institute, Hawaii, ISBN-1-886608-00-8, and the University of Hawaii Sea Grant College Program, UNIHI-SEAGRANT-CR-95-01.
49
Buck, E. and Becker, G. 1993. Aquaculture and the Federal Role. Report for Congress. Congressional Research Service, Library of Congress, Washington, DC. 15pp. CABI, 2011. Datasheet on Litopenaeus vannamei. Primary author, Dr. Joe Fox, TAMU Corpus Christi, Texas. Web link: http://www.cabi.org/isc/datasheet/71097. CWA, 2013. Federal water pollution control act. Section 404. Updated May 20, 2013. URL: http://water.epa.gov/lawsregs/guidance/wetlands/sec404.cfm. Cheshire, J.R. 2005. Memoirs of a Shrimp Farmer, Editor/Publisher, John R. Cheshire, Panama City, Fla. USA. Clay, J.W. 2001. Environmental and social BMPs for shrimp aquaculture. Louisiana State University, Baton Rouge, LA. 70803: World Aquaculture Society. Cascorbi, A. 2004. Farmed Shrimp, Worldwide Overview, excluding Mexico and Thailand. Monterey Bay Aquarium Seafood Watch, Seafood Report. URL: http://www.montereybayaquarium.org/cr/cr_seafoodwatch/content/media/MBA_SeafoodWatch_FarmedShrimpReport.pdf Cowey, C.B. and Cho, C.Y. 1991. Nutritional strategies and aquaculture waste. In: Cho, C.Y., Cowey, C.B. (Eds.), Proceedings of the 1st International Symposium on Nutritional Strategies in Management of Aquaculture Wastes using biological approaches. University of Guelph, Guelph, Ontario, Canada, pp. 275-276. Dall, W., Hill, B.J., Rothlisberg, P.C. and Sharples, D.J. 1991. Biology of the Penaeidae, In Advances in Marine Biology, 27. ISBN-10: 0120261278 | ISBN-13: 978-0120261277. Dore, I. and Frimodt, C. 1987. An Illustrated Guide to Shrimp of the World. Osprey Books, Huntington, NY. 229 pp. EDF. 1997. Environmental Defense Fund case study 1: " Murky Waters: Environmental Effects of Aquaculture in the United States." HYPERLINK http://www.edf.org/pubs/reports/aquaculture/f_dwnload.html www.edf.org/pubs/reports/aquaculture/f_dwnload.html Environmental News Network. 1998. Aquaculturalists Get OK to Kill Cormorants. ENN Daily News. Web link: http://www.enn.com/news/enn-stories/031398/. EPA. 2012. EPA announces summary of enforcement action for spring 2012. Released 08/13/2012. United States Environmental Protection Agency. URL: http://yosemite.epa.gov/opa/admpress.nsf/0/28AAA69F276AA65485257A590082EDA9. FAO. 1995. Code of Conduct for Responsible Fisheries. FAO, Rome, Italy. 41 pp FAO. 2011a. Movement of shrimp. http://www.fao.org/docrep/009/a0086e/A0086E11.htm FAO. 2011b. Cultured Aquatic Species Information Programme. Food and Agriculture Organization, Rome, Italy.
50
FAO. 2013. Food and Agriculture Organization of the United Nations. FIGIS. FishStat (Database). Accessed (28 Feb 2013). URL: http://data.fao.org/ref/babf3346-ff2d-4e6c-9a40-ef6a50fcd422.html?version=1.0 FAO (Food and Agriculture Organization of the United Nations). 2010. State of the World Fisheries: Part 1 World Review of Fisheries and Aquaculture. 104 pp. Farfante, I.P. and Kensley, B.F. 1997. Penaeoid and sergestoid shrimps and prawns of the world: Keys and diagnoses for the families and genera. Book (ISBN 2856535100 ). FDA, 2013. Approved aquaculture drugs in US. URL: http://www.fda.gov/AnimalVeterinary/DevelopmentApprovalProcess/Aquaculture/ucm132954.htm FishSource, 2013a. L. vannamei wild production. URL: http://www.FishSource.com/fishery/data_summary?fishery=Whiteleg+shrimp+-+stock+units+undefined+%28Country%3A+EC%3B+Gear%3A+GTR%2C+OTB%2C+MIS_scr%3B%29# FishSource. 2013b. Profile for Gulf menhaden - Gulf of Mexico. URL: http://www.FishSource.com/fishery/identification?fishery=Gulf+menhaden+-+Gulf+of+Mexico. Folke, C., N. Kautsky, H. Berg, A. Jansson & M. Troell, 1998. The ecological footprint concept for sustainable seafood production: a review. Ecological Applications 8(1):63-71. Folke, C. and N. Kautsky. 1992. Aquaculture with its Environment: Prospects for Sustainablilty. Ocean and Coastal Management. Elseveir Science Publishers Ltd, England. GAA, 1999. Codes of Practice for Responsible Shrimp Farming. The first publication moving toward the establishment of the Best Management Practices (BMPs) for Marine Shrimp Farming. Global Aquaculture Alliance, St. Louis, Mo. Goldburg, R. 2001. Marine Aquaculture in the United States: Environmental Impacts and Policy Options., Pew Oceans Commission: Arlington, VA. Goodland, R. and H. Daly, 1996. Environmental Sustainability: Universal and Non-negotiable. Ecological Applications 6(4):1002-1017. Hager, C.A. 1998. Sustainable shrimp farming in Texas: Pipe Dream or Future Reality. Web link: http://darwin.bio.uci.edu/sustain/suscoasts/hager.html. Hopkins et al. 1995 Environmental impacts of shrimp farming. Estuaries 18:25-42. Hopkins, J.S. and Villalon, J. 1992. Synopsis of industrial panel input on shrimp pond
51
management, in: Wyban, J.A. (ed.), Proceedings of the special session on shrimp farming. May 22–25. World Aquaculture Society, Baton Rouge, La., pp. 138-143. Holthuis, L.B. 1980. FAO species catalogue. Vol.1. Shrimps and prawns of the world. An annotated catalogue of species of interest to fisheries (FAO Fish. Synop. (125) V.1: 261). Horowitz, A. and Horowitz, S. 2001. Disease control in shrimp aquaculture from a microbial ecology perspective. In: Browdy, C.L., Jory, D. (Eds.), Proceedings of the special session on sustainable shrimp farming May 22-25. World Aquaculture Society, Baton Rouge, La., pp. 199-218. Humphrey, J.D. 1995. Australian quarantine policies and practices for aquatic animals and their products: a review for the Scientific Working Party on Aquatic Animal Quarantine. Bureau of Resource Sciences, Cnaberra. Johnson, S.K. 1991 and reprinted in 1995. Handbook of Shrimp Diseases, Texas A&M Univ. Sea Grant Pub. TAMU-SG-90-601 (R) Bryan, TX. JSA Report, 1997. An Evaluation of Potential Shrimp Virus Impacts on Cultured Shrimp and Wild Shrimp Populations in the Gulf of Mexico and Southeastern U.S.US Atlantic Coastal Waters. A Report to Congress by the Joint Subcommittee on Aquaculture (JSA), made up of committee members from US Dept. of Commerce, NOAA/NMFS, USDA, Animal and Health Inspection Service, National Center for Environmental Assessment, US EPA, US Fish and Wildlife Service, and US Dept. of Interior. King, S.E., Lester, J.N. (1995). The Value of Salt Marsh as a Sea Defense. Marine Pollution Bulletin 30(3): pp. 180-189. Koonse, B. 2003. The US FDA’s Good Aquaculture Practice (GAP) guidelines. United States Food and Drug Administration. Washington, DC. Lee, C.S. 2005. Application of biosecurity in aquaculture production systems. Pages 66-75 in Y. Sakai, J.P. McVey, D. Jang, E. McVey and M. Caesar, editors. Aquaculture and Pathobiology of Crustacean and Other Species. Proceedings of the Thirty-Second US Japan Symposium on Aquaculture. UJNR Technical Report 32. NOAA Research, Silver Spring, MD. Lightner, D.V. 1996. A handbook of shrimp pathology and diagnostic procedures for diseases of cultured penaeid shrimp. World Aquaculture Society, Baton Rouge, La. Lightner, D.V. 1999. The Penaeid Shrimp Viruses: Current Status, Available Diagnostic Methods, and Management Strategies. J. World Aquacult. Soc. Lightner, D.V. 2011. Virus diseases of farmed shrimp in the Western Hemisphere (the Americas): a review. Aquaculture Pathology Laboratory, Department of Veterinary Science and Microbiology, University of Arizona, Tucson, AZ 85721, USA. J Invertebr Pathol 106:110-30.
52
Lightner, D.V. 2012. Historic emergence, impact and current status of shrimp pathogens in the Americas. Aquaculture Pathology Laboratory, Dept Veterinary Science and Microbiology, University of Arizona, Tucson, AZ 85721, USA. J Invertebr Pathol 110:174-83. Ling, D.E. 1977. Aquaculture in Southeast Asia – A historic review. Seattle: University of Washington Press. Littauer, G., Glahn, J., Reinhold D., and Brunson, M. 1997. Control of bird predation at aquaculture facilities: strategies and cost estimates. Southern Regional Aquaculture Center. SRAC Publication No. 402. October 1997 Revision. URL: https://srac.tamu.edu/index.cfm/event/getFactSheet/whichfactsheet/82/ Markey, J.C., Amaya, E.A. and Davis, D.A. 2010. Replacement of Poultry By-product Meal in Production Diets for the Pacific White Shrimp, Litopenaeus vannamei. Jrnl of the World Aquaculture Society. Vol. 41, Issue 6, December 2010, pp: 893–902. Maxwell, V. J., Supan, J.E., Schiavinato, L., Showalter, S. and Treece, G. 2008. Aquaculture Parks in the Coastal Zone: A Review of Legal and Policy Issues in the Gulf of Mexico State Waters. Coastal Management Journal. 36(3): pp. 241-253. Moss, S.M., Doyle, R.W. and Lightner, D.V. 2005a. Breeding shrimp for disease resistance: challenges and opportunities for improvement. In: Walker, Lester, and Bondad Reantaso (Eds). Diseases in Asian Aquaculture V, Fish Health Section, Asian Fisheries Society, Manila, The Philippines. pp. 379-393. Moss, S.M., Moss, D.R., Arce, S.A. and Otoshi,.C.A. 2005b. Disease prevention strategies for penaeid shrimp culture. In: Pathobiology and Aquaculture of Crustaceans: Proceedings of the 32nd US-Japan Natural Resources Aquaculture Panel, US-Japan Natural Resources Technical Report. Moss, S.M. 2007. Science based practical aquatic animal breeding programs. American Association for the Advancement of Science, San Francisco, CA. Moss, S.M. 2008. Genetic improvement of farmed shrimp: opportunities and obstacles. Royal Golden Jubilee-Ph.D. Congress IX, The Thailand Research Fund, Pattaya, Thailand, p. 61. Moss, S.M. 2009. An integrated approach to sustainable shrimp aquaculture in the U.S. Clean, Green, Sustainable Recirculating Aquaculture Summit. Food and Water Watch, Washington, D.C. Moss, S.M., Moss, D.R., Arce, S.M. and Otoshi, C.A. 2008a. Obstacles and opportunities: selective breeding of penaeid shrimp. Global Aquaculture Advocate, 11(6),73-74. Moss, S.M., Moss, D.R., Arce, S.M. and Otoshi, C.A.. 2008b. Selective breeding of Pacific white shrimp. Aquaculture Asia Pacific, 4(6):8-9.
53
Moss S.M. and D.R. Moss DR. 2009. Selective breeding of penaeid shrimp In: Shellfish Safety and Quality, pp 425-452, Eds. S.E. Shumway and G.E. Rodrick, CRC Press, Woodhead Publishing Limited, Cambridge, England. Nailon, R. 2003. Value of Texas Salt Marshes. Texas A&M University, Texas Agricultural Extension Service and Sea Grant College Program. Naylor, R.L., Goldburg, R.J., Primavera, J.H., Kautsky, N., Beveridge, M.C.M., Clay, J., Folke, C., Lubchenco, J., Mooney, H. and Troell, M. 2000. Effect of aquaculture on world fish supplies. Nature, 405, pp. 1017-1024. New, M.B. 1987. Feed and Feeding of Fish and Shrimp, A Manual on the Preparation and Presentation of Compound Feeds for Shrimp and Fish in Aquaculture, ADCP/REP/87/26, UN Development Program. FAO, Rome, Italy. Newman, S.G. 2009. Specific Pathogen-Free Status Advances Shrimp Culture. Global Aquaculture Advocate, May/June 2009. URL: http://pdf.gaalliance.org/pdf/GAA-Newman-May09.pdf NOAA, 2011. Imports and exports of fishery products annual summary, 2011. Current Fisheries Statistic No. 2011-2. URL: http://www.st.nmfs.noaa.gov/Assets/commercial/trade/TRADE2011.pdf NOAA, 2012. NOAA Statistical Report Card for US Fisheries. NOAA web link: http://www.nmfs.noaa.gov/stories/2012/09/09_19_12fisheries_of_the_us.html Nunan, L.M., B.T. Poulos, D.V. Lightner. 1998. The detection of white spot syndrome virus (WSSV) and yellow head virus (YHV) in imported commodity shrimp. Aquaculture 160: pp. 19-30. Ostrowski, A.C., Alcivar-Warren, A. , Atwood, H. , Browdy, C. , Boopathy, R. , Lotz, J. M. , Lawrence, A. L. , Lightner, D.V. and Moss, S. M. 2005. Strategies and focus of the US marine shrimp farming program in a changing world market. Aquaculture America, New Orleans, LA January 17-20. page 308. Ostrowski, A.C., Atwood,H.L., Alcivar-Warren, A. , Fontenot, Q ., Lawrence, A.L., Lightner, D.V., Lotz, J.M. and Moss, S.M. 2006. Recent progress and milestone achievements of the US Marine Shrimp Farming Program in response to evolving world markets. Aquaculture America 2006. Annual Meeting of the US Chapter of the World Aquaculture Society. Las Vegas, Nevada.
54
Overstreet, R.M., Lightner, D.V., Hasson, D.W., McIlwain, S., Lotz, J.M. 1997. Susceptibility to Taura syndrome virus of some penaeid shrimp species native to the Gulf of Mexico and the southeastern US. Journal of Invertebrate Pathology 69: pp.165-176. Paez Osuna, F. 2001. The Environmental Impact of Shrimp Aquaculture: Causes, Effects, and Mitigating Alternatives. Environmental Management, 28(1): pp. 131-140. Ponce-Palafox, J., Carlos A. Martinez-Palacios, Lindsay G. Ross. 1997. The effects of salinity and temperature on the growth and survival rates of juvenile white shrimp, Penaeus vannamei, Boone, 1931. Aquaculture. 157: pp. 107-115. Pruder, G.D. 1992. U.S. marine shrimp farming program an annotated bibliography of Consortium sponsored publications. The Oceanic Institute, Hawaii, 1992. Also published by Animal Welfare Information Center, USDA, Nat. Agric. Library, 10301 Baltimore Blvd., Beltsville, Maryland (Quick Bibliography Series QB 94-43). Rangen, 2013. Shrimp Feed. Rangen, Inc. Aquaculture Feeds Division. URL: http://www.mresourcegroup.com/rangen/shrimpfeeds.htm Rosenberry, B. 2007. An Oral History of Shrimp Farming in the Western Hemisphere. Shrimp News International. URL: http://www.shrimpnews.com/index.html Rosenberry, B. 2014. June 17, 2014 posting of article on American Mariculture, Inc. URL: https://www.shrimpnews.com/FreeReportsFolder/NewsReportsFolder/USAflAmericanMariculture.html Samocha, T.M., Lawrence, A.L., Collins, C.A., Castille, F. L., Bray, W.A., Davies, C.J., Lee, P.G, Wood, G.F. 2004. Production of the Pacific White Shrimp, Litopenaeus vannamei, in High-Density Greenhouse-Enclosed Raceways Using Low Salinity Groundwater. Journal of Applied Aquaculture 01/2004; 15:1-19. Samocha, T.M, Lopez, I.M., Jones, E.R. Jackson, S. and Lawrence, A.L. 2004a. Characterization of intake and effluent waters from intensive and semi-intensive shrimp farms in Texas. Aqua. Res. 35, pp. 321-339. Samocha, T.M., Lawrence, A.L., Collins, C.A., Castille, F.L., Bray, W.A., Davies, C.J., Lee, P.G. and Wood, G.F. 2004b. Production of the Pacific white shrimp, Litopenaeus vannamei, in high-density greenhouse-enclosed raceways using low salinity groundwater. J. Appl. Aquacult. 15 (3/4), pp. 1-19. Samocha, T.M. 2012. Feed Study. An Update on Dr. Tzachi Samocha’s Research. Shrimp News International. November, 2012. Web link: http://www.shrimpnews.com/FreeReportsFolder/PondEcologyFolder/SamochaTzachiResearch2012.html
55
Scura, E. 1987. Review of world prawn farming. Seminars on Prawn Farming for Profit. SCP Fisheries Consultants Australia Pty. Ltd. pp. 1-12. Stickney, R.R. Editor. 2002. Responsible Marine Aquaculture. CABI Publishers. Stickney, R.R and Treece, G. 2012. History of Aquaculture. In Tidwell, J.H. Aquaculture Production Systems. Chapter 2, pp. 16-50. Wiley-Blackwell and World Aqua. Society. Tacon, A., Hasan, M., Metian, M. 2011. Demand and supply of feed ingredients for farmed fish and crustaceans: trends and prospects. FAO Fisheries and Aquaculture Technical Paper No. 564. FAO. 87 pp. Tacon, A., Metian, M., Hasan, M. 2009. Feed ingredients and fertilizers for farmed aquatic animals: sources and composition. FAO Fisheries and Aquaculture Technical Paper. No. 540. Rome, FAO. 209pp. TCEQ 2013a. Monthly enforcement reports. Texas Commission on Environmental Quality. URL: http://www.tceq.texas.gov/enforcement/reports/mer/enf_reports.html TCEQ 2013b. Texas Commission on Environmental Quality. TPDES General Permit No. TXG130000 under provision of Section 402 of the Clean Water Act and Chapter 26 of the Texas Water Code. URL: http://www.tceq.texas.gov/assets/public/permitting/wastewater/general/txg130000.pdf Teichert-Coddington, D.R., Martinez, D. and Ramirez E. 2000. Partial nutrient budgets for semi- intensive shrimp farms. Aquaculture, 190(1-2): pp. 139-154. Texas Agriculture Code. 2007. Texas Agriculture Code – Chapter 134 Regulation of Aquaculture. URL: http://law.onecle.com/texas/agriculture/chapter134.html Texas General Land Office. 2011. Texas coastal management program: Section 309 assessment strategies. Report 2011-2015. URL: http://coastalmanagement.noaa.gov/mystate/docs/tx3092011.pdf Texas Parks and Wildlife Department (TPWD). 1997. Exotic Shrimp Confirmed in Matagorda Bay. TWPD Newsstand. Web link: http://www.tpwd.state.tx.us/fish/geninfo/. Texas Saltwater Fishing Magazine. May 1, 2010. Texas Parks and Wildlife’s Shrimp Inspection Program. Article written by Robert Adami, Jr. Web link: http://www.texassaltwaterfishingmagazine.com/fishing/texas-parks-wildlife-shrimp-inspection-program/subpage1220.html.
56
Texas Senate Natural Resources Interim Subcommittee. 1996. Aquaculture and its Effects on State Bays and Estuaries. Report to the 75th Legislature. The Senate of Texas. Austin Texas. Texas Water Resources Institute (TWRI). 1997. Water Quality from South Texas Aquaculture Facilities. Web link: http://twri.tamu.edu/twripubs/NewWaves/. Treece, G. 2002. Ed. R.R. Stickney. Chpt. 15, Shrimp Farm Effluents, in Responsible Marine Aquaculture. CABI Publishers. pp. 297-308. Treece, G. and Hamper, L. 2000. Achieving environmentally friendly shrimp farming in Texas, USA. World Aquaculture, 31(2): pp. 49-53. Treece, G. 2011. An overview on desert aquaculture in the United States of America. In V. Crespi & A. Lovatelli, eds. Aquaculture in desert and arid lands: development constraints and opportunities. FAO Technical Workshop. 6–9 July 2010, Hermosillo, Mexico. FAO Fisheries and Aquaculture Proceedings No. 20. Rome, FAO. 2011. pp. 159–185. URL: http://www.fao.org/docrep/015/ba0114e/ba0114e.pdf Treece, G. 2005. Updated governmental permitting and regulatory requirements affecting Texas coastal aquaculture operations. Texas A&M University Sea Grant College Program. Texas A&M University Sea Grant Pub. TAMU-SG-05-501. URL: http://texas-sea-grant.tamu.edu/WhatWeDo/online%20publications/TexasPerMan.pdf Treece, G. 2014. The Texas Aquaculture Industry 2014. Part 1. The Texas Aquaculture Association. URL: http://texasaquaculture.org/TX%20Aqua%202014/Tex.%20aqua.%202014%20part%201.pdf Treece, G. 1993. Texas Aquaculture, History and Growth Potential for the 1990s. Texas A&M University, Sea Grant College Program. Pub.TAMU-SG-103.44 pp. National Sea Grant Library, URL: http://nsgl.gso.uri.edu Tseng, W. 1987. Shrimp Mariculture - A Practical Manual. Chien Cheng Publisher, Kaohsiung, Rep. of China. 305 pp. United States Department of Agriculture (USDA). 2005. Census of Aquaculture, United States. Vol. 1, Geographic Area Series, using 2002 Census of Agriculture data. Washington, DC. (URL www.agcensus.usda.gov/). United States Department of Agriculture (USDA). 2009. Census of Agriculture, United States. Vol. 1, Geographic Area Series, Part 51, Feb. 2009, using 2007 data. Washington, DC. (URL www.agcensus.usda.gov). United States Department of Agriculture, Economic Research Service. 2013. http://www.ers.usda.gov/data-products/aquaculture-data.aspx#.UVmtL0q3N8E
57
Valderrama, D. and Anderson, J.L. 2011, Shrimp Production Survey Issues & Challenges. GOAL 2011, Santiago, Chile, November 6-9, 2011. http://www.gaalliance.org/update/GOAL11/DiegoValderrama.pdf. US Senate Hearing on Marine Shrimp Farming. 1996. "Marine shrimp farming and aquaculture research : hearing before a subcommittee of the Committee on Appropriations, United States Senate, One Hundred Fourth Congress, second session : special hearing". US GOVERNMENT PRINTING OFFICE 24-531 cc WASHINGTON : 1996. Y4.AP 6/2: S. HRG. 104-476. ISBN 0-16-052781-3. VanderKooy, S. J. and Smith, J.W. 2002. The Menhaden Fishery of the Gulf of Mexico, United States: A Regional Management Plan. Gulf States Marine Fisheries Commission (GSMFC). Number 99, March 2002. 143 pp. http://www.sefsc.noaa.gov/sedar/download/S27_SAR_FINAL.pdf?id=DOCUMENT Vaughan, D. Shertzer, K. Smith, J. 2007. Gulf menhaden (Brevoortia patronus) in the US Gulf of Mexico: Fishery characteristics and biological reference points for management. Fisheries Research 83 (2007). pp. 263–275. http://menhaden.gsmfc.org/FishRes_Vaughan_etal_2007-GM.pdf Vaughan, D., Schueller, A., Smith, J. and VanderKooy, S. 2011. SEDAR 27: Gulf Menhaden Stock Assessment Report. Southeast Data, Assessment, and Review (SEDAR). December 5, 2011. 492 pp. http://www.sefsc.noaa.gov/sedar/download/S27_SAR_FINAL.pdf?id=DOCUMENT Wallace, R. K., and Fitsgibbons, S. 1997. Aquaculture Permitting Guide for Coastal Alabama. Alabama Sea Grant Extension Program. MASGP-97-005. Whetstone, J., Treece, G., Browdy, C. and Stokes, A., 2002. Opportunities and Constraints in Marine Shrimp Farming in the USA. Southern Regional Aquaculture Center Fact sheet #2600. USDA. Wyban, J.A. and Sweeney, J.N. 1991. Intensive Shrimp Production Technology, The Oceanic Institute Shrimp Manual, The Oceanic Institute, Hawaii. Yuan, Y., Cai, J. and Leung, P.S. 2006. Chapt. 14. An Overview of China’s Cultured Shrimp Industry. In: Shrimp Culture – Economics, Market and Trade. Leung and Engle, Eds. Blackwell Publishing.
58
Appendix 1: Selected examples of Existing U.S. Regulations relevant to shrimp farms Shrimp Aquaculture Permits in the U.S., State by State Shrimp aquaculture is regulated differently in each state, but each state requires a minimum of three to four permits to develop a shrimp farm: 1) Coastal Use Permit, 2) Rivers and Harbors Act Section 10 permit, 3) Water Quality Certifications or discharge permit, and 4) a general license to operate. How these permits and leases are approved and issued differs from state to state. Different state agencies may take the lead during the permitting process, and the number of agencies involved in the review process varies. The process is streamlined in some states by joint application. Most states require more than the four previously mentioned permits, such as an Aquaculture Certification in Florida and permits required to handle certain (exotic) organisms. In addition to the aquaculture certification, a Section 10 permit is required to install any equipment and/or obstructions to navigation (33 U.S.C. §403). The United States Army Corps of Engineers is responsible for issuing these permits regardless of whether the project is in State or Federal waters. Water certifications and National Pollutant Discharge Elimination System (NPDES) permits are required and these permits are handled by the FDEP (33 U.S.C. §1344). Alabama In Alabama, there is no aquaculture certification program or aquaculture permit program. Aquaculture is regulated by the Alabama Department of Environmental Management (ADEM). Together with the U.S. Army Corp of Engineers (USACE), the ADEM reviews proposed projects and addresses the necessary permits required (Wallace and Fitzgibbons 1997). The ADEM also issues the coastal se permits. Additionally, in Alabama, the Section 10 permit application is submitted separately from the coastal use permit, and the USACE Mobile District has a joint Section 10 and Section 404 permit application. Shrimp farms must abide by U.S. EPA and ADEM regulations for discharge. All the farms in Alabama are located inland from the coast. Florida In Florida, neither agricultural nor aquaculture operations arerequired to obtain county permits. However, Florida law (see Florida Statutes Chapter 570) requires that shrimp farms and other aquaculture operations register with the Florida Department of Agriculture and Consumer Affairs. The Certificate of Registration costs $50 and requires that the farmer agree to follow the Department’s “best management practices” (BMPs). If the farmer follows the BMPs, the Department of Environmental Protection is prohibited from charging the farmer with environmental violations (such as the discharge of sewage or effluent) into surface waters. The implementing rules (see Florida Administrative Code Chapter 5L-3) do not require aquafarmers “to follow the effluent treatment BMPs” if they use “recirculation systems” or “do not discharge to waters of the state”—in those cases, they are labeled as having a “minimal
59
impact on the surrounding environment.” Even if they do not meet those exceptions, the BMPs for effluent treatment require only a retention, evaporation, percolation pond or vegetated filter strip. A later Florida Aquaculture policy act declared aquaculture a form of agriculture and re-affirmed that the Department of Agriculture and Consumer Services is responsible for permitting aquaculture and is required to coordinate permits with other state agencies during the permitting process (Fla. Stat. Ann. § 597.002). Florida has a state aquaculture plan that requires all aquaculture producers to become permitted and provides aid in applying for permits to those within the industry (Fla. Stat. Ann. §591.0023, §597.004). Louisiana Mariculture is permitted by the Louisiana Department of Wildlife and Fisheries, but permits are only issued for mariculture on private lands and private water-bottoms (La. R.S. §56:579.1). Few entities have applied for permits and all who have applied have been denied or their applications were rescinded. At the time of this report there were no shrimp farms in Louisiana. Mississippi To establish a shrimp farm, additional permits are needed above and beyond receiving authorization from the county port authority to place an operation in their jurisdictional waters. This will include the Mississippi Coastal Zone Wetlands (MCZW) permit, issued by the Mississippi Department of Marine Resources (MDMR) in cooperation with the USACE. The MCZW permit is a joint permit that covers the coastal use permit, the Section 10 permit, the state water permit, the §401 water quality certification and any §404 permitting needs. Under MDMR Ordinance 13.001, MDMR prohibits the discharge of “any waste material including, but not limited to, solids, debris, sanitary and kitchen wastes, oils and grease, the excrement of the cultured species, and commercially prepared feeds fed to them” (MDMR ordinance initiated in 2000). Under the same Ordinance 13.001, aquaculturists are required to perform a pre-operation environmental survey, as well as develop and implement a marine aquaculture environmental monitoring program consisting of four principle elements: a hydrographic survey, sediment chemistry, water quality, and a benthic survey. Texas Texas mariculture is regulated mainly by the Texas Department of Agriculture (TDA), Texas Parks and Wildlife Department (TPWD), and the Texas Commission on Environmental Quality (TCEQ). A memoranda of agreement, which requires all three state agencies to work together in permitting aquaculture, went into effect in 1999 (Treece 2005). Before any aquaculture operation can legally begin operation, a discharge permit or exemption from TCEQ must be obtained (Texas Water Code §11), a permit is required from the TDA (Texas Agriculture Code §134.011), and if working with exotics (like L. vannamei) a permit must be obtained from TPWD (Texas Agriculture Code § 134.020). The U.S. Army Corp. of Engineers reviews all permits and EPA has an added layer of permits concerning aquaculture discharges. EPA rules take
60
precedence over state (TCEQ) rules, unless the state’s rules and regulations are more stringent. EPA’s NPDES permits are required under FDEP (33 U.S.C. §1344) and the TCEQ also requires a similar TPDES. Each shrimp farm on the Texas coast is individually permitted with site-specific requirements for discharges. Discharge waters must be equal to or better than receiving waters. Selected List of Key Shrimp Aquaculture Regulations in U.S., State by State
• Ala. Code. §11-23-1. Title 11. Counties and municipal corporations. Subtitle 1. Provisions Applicable to Counties Only. Chapter 23: Industrial Parks. Establishment authorized.
• Ala. Constitution Amendment 543. Natural lands and waters; preservation, etc. Fla. Stat. Ann. § 253.67-253.75. Title 18. Public Lands and Property. Chapter 253 State Lands.
• Fla. Stat. Ann. §253.68. Title 18. Public Lands and Property. Chapter 253 State Lands. Authority to lease or use submerged lands and water column for aquaculture activities.
• Fla. Stat. Ann. §253.69. Title 18. Public Lands and Property. Chapter 253 State Lands. Application to lease submerged land and water column.
• Fla. Stat. Ann. § 597.002. Title 35. Agriculture, Horticulture, and Animal Industry. Chapter 597: Aquaculture. Legislative declaration of public policy respecting aquaculture.
• Fla. Stat. Ann. § 597.004. Title 35. Agriculture, Horticulture, and Animal Industry. Chapter 597: Aquaculture. Aquaculture certificate of registration.
• Miss. Code § 59-9-5. Title 59. Ports, Harbors, Landings, and Watercraft. Chapter 9: County Port Authority or Development Commission. Definitions.
• Miss. Code §59-9-23. Title 59. Ports, Harbors, Landings, and Watercraft. Chapter 9: County Port Authority or Development Commission. Establishment and development of industrial parks.
• Miss. Code § 79-22-25. Title 79. Corporations, Associations, and Partnerships. Chapter 22: Mississippi Aquaculture Act of 1988. Management plan to be developed; Aquatic Ventures Center.
• Miss. Dept. of Marine Resources (DMR). 2000. Ordinance 13.001. An ordinance to regulate aquaculture in the marine environment. http://www.dmr.state.ms.us/ordinances/13001.pdf.
• Tex. Agriculture Code §134.011. Title 6. Production, Processing, and Sale of Animal Products. Subtitle A. Bees and Non-livestock Animal Industry. Chapter 134: Regulation of Aquaculture. Subchapter B: Aquaculture License. Licensing
• Tex. Agriculture Code §134.013 Title 6. Production, Processing, and Sale of Animal Products. Subtitle A. Bees and Non-livestock Animal Industry. Chapter 134: Regulation of Aquaculture. Subchapter B: Aquaculture License. Additional requirements for shrimp production within the Coastal Zone.
61
• Tex. Natural Resources Code § 33.103(1). Title 2. Public Domain. Subtitle C. Chapter 33: Management of Coastal Public Lands. Subchapter D: Rights in Coastal Public Land. Leases for public purpose.
• Tex. Natural Resources Code § 33.105. Title 2. Public Domain. Subtitle C. Chapter 33: Management of Coastal Public Lands. Subchapter D: Rights in Coastal Public Land. Person whom land may be leased.
• Tex. Water Code §11 et seq.et seq. Title 2. Water Administration. Subtitle B. Water Rights. Chapter 11: Water Rights. Subchapter B: Rights in State Waters.
• U.S. Code Title 33 § 403. Navigation and Navigable Waterways. Chapter 9: Protection of Navigable Waters and of Harbor and River Improvements Generally in General. Obstruction of navigable waters generally; wharves; piers, etc.; excavations and filling.
• U.S. Code Title 33 § 1344. Navigation and Navigable Waterways. Chapter 26: Water Pollution Prevention and Control Permits. Permits for dredge or fill material.
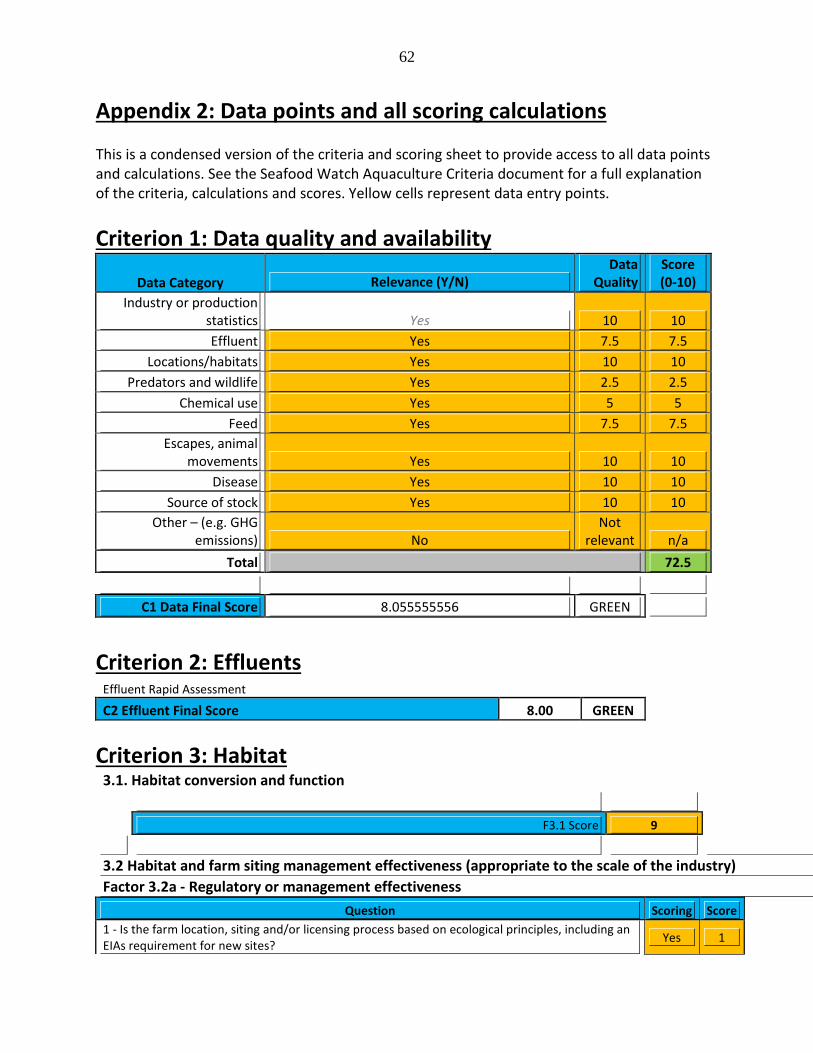
62
Appendix 2: Data points and all scoring calculations This is a condensed version of the criteria and scoring sheet to provide access to all data points and calculations. See the Seafood Watch Aquaculture Criteria document for a full explanation of the criteria, calculations and scores. Yellow cells represent data entry points.
Criterion 1: Data quality and availability
Data Category Relevance (Y/N) Data
Quality Score (0-10)
Industry or production statistics Yes 10 10 Effluent Yes 7.5 7.5
Locations/habitats Yes 10 10 Predators and wildlife Yes 2.5 2.5
Chemical use Yes 5 5 Feed Yes 7.5 7.5
Escapes, animal movements Yes 10 10
Disease Yes 10 10 Source of stock Yes 10 10
Other – (e.g. GHG emissions) No
Not relevant n/a
Total 72.5
C1 Data Final Score 8.055555556 GREEN
Criterion 2: Effluents
Effluent Rapid Assessment C2 Effluent Final Score 8.00 GREEN
Criterion 3: Habitat 3.1. Habitat conversion and function
F3.1 Score 9
3.2 Habitat and farm siting management effectiveness (appropriate to the scale of the industry) Factor 3.2a - Regulatory or management effectiveness
Question Scoring Score 1 - Is the farm location, siting and/or licensing process based on ecological principles, including an EIAs requirement for new sites? Yes 1
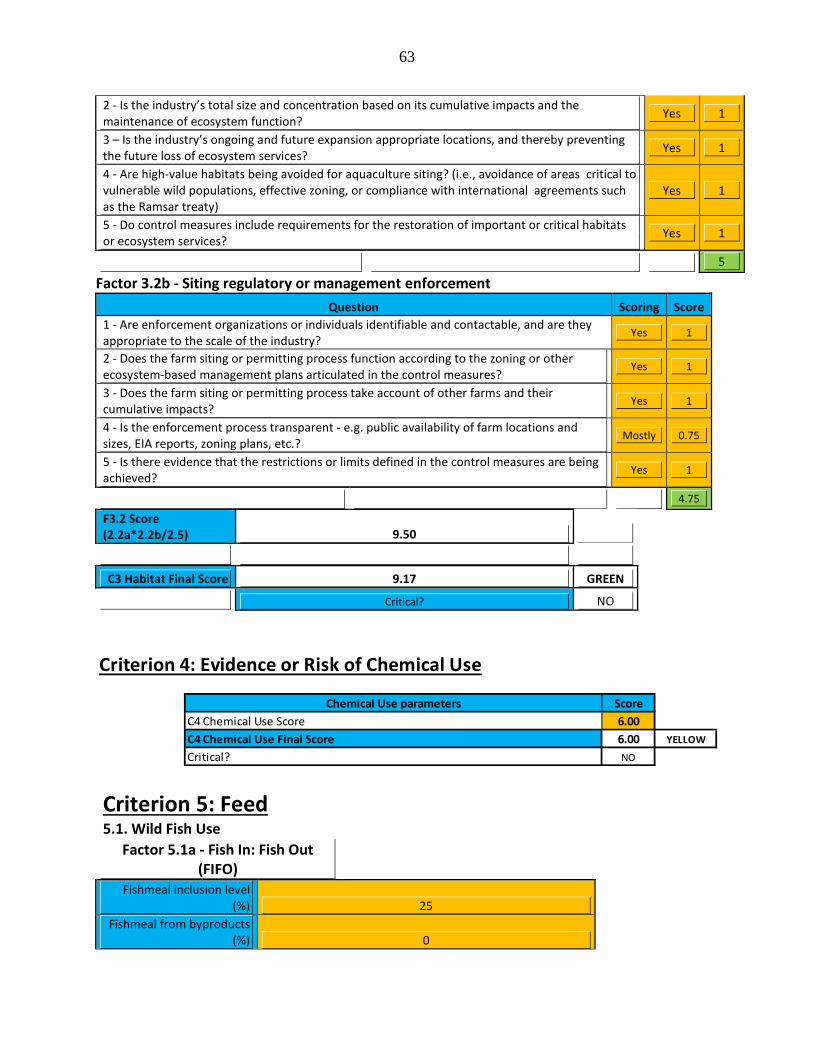
63
2 - Is the industry’s total size and concentration based on its cumulative impacts and the maintenance of ecosystem function? Yes 1
3 – Is the industry’s ongoing and future expansion appropriate locations, and thereby preventing the future loss of ecosystem services? Yes 1
4 - Are high-value habitats being avoided for aquaculture siting? (i.e., avoidance of areas critical to vulnerable wild populations, effective zoning, or compliance with international agreements such as the Ramsar treaty)
Yes 1
5 - Do control measures include requirements for the restoration of important or critical habitats or ecosystem services? Yes 1
5
Factor 3.2b - Siting regulatory or management enforcement Question Scoring Score
1 - Are enforcement organizations or individuals identifiable and contactable, and are they appropriate to the scale of the industry?
Yes 1
2 - Does the farm siting or permitting process function according to the zoning or other ecosystem-based management plans articulated in the control measures?
Yes 1
3 - Does the farm siting or permitting process take account of other farms and their cumulative impacts?
Yes 1
4 - Is the enforcement process transparent - e.g. public availability of farm locations and sizes, EIA reports, zoning plans, etc.?
Mostly 0.75
5 - Is there evidence that the restrictions or limits defined in the control measures are being achieved?
Yes 1
4.75
F3.2 Score (2.2a*2.2b/2.5) 9.50
C3 Habitat Final Score 9.17 GREEN
Critical? NO
Criterion 5: Feed 5.1. Wild Fish Use
Factor 5.1a - Fish In: Fish Out (FIFO)
Fishmeal inclusion level (%) 25
Fishmeal from byproducts (%) 0
Criterion 4: Evidence or Risk of Chemical Use
Score6.006.00 YELLOW
NOCritical?
Chemical Use parametersC4 Chemical Use ScoreC4 Chemical Use Final Score
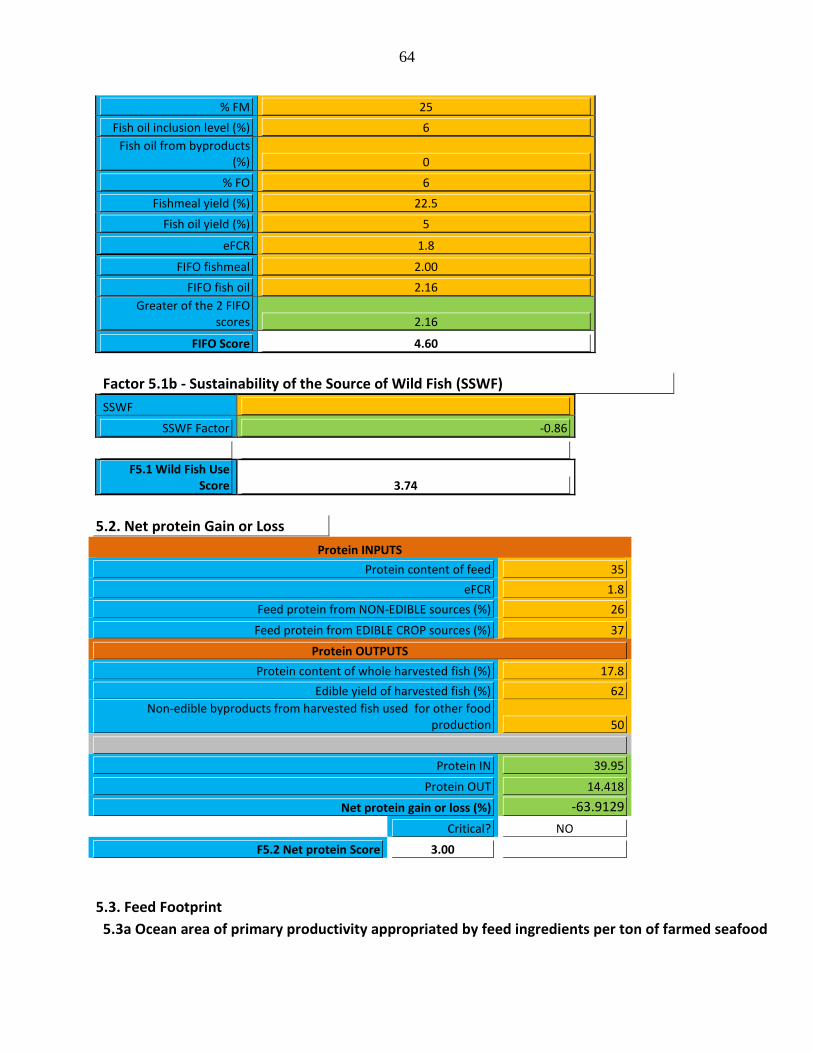
64
% FM 25 Fish oil inclusion level (%) 6
Fish oil from byproducts (%) 0
% FO 6 Fishmeal yield (%) 22.5
Fish oil yield (%) 5
eFCR 1.8
FIFO fishmeal 2.00 FIFO fish oil 2.16
Greater of the 2 FIFO scores 2.16
FIFO Score 4.60 Factor 5.1b - Sustainability of the Source of Wild Fish (SSWF)
SSWF
SSWF Factor -0.86
F5.1 Wild Fish Use
Score 3.74
5.3. Feed Footprint 5.3a Ocean area of primary productivity appropriated by feed ingredients per ton of farmed seafood
5.2. Net protein Gain or Loss Protein INPUTS
Protein content of feed 35 eFCR 1.8
Feed protein from NON-EDIBLE sources (%) 26 Feed protein from EDIBLE CROP sources (%) 37
Protein OUTPUTS Protein content of whole harvested fish (%) 17.8
Edible yield of harvested fish (%) 62 Non-edible byproducts from harvested fish used for other food
production 50
Protein IN 39.95 Protein OUT 14.418
Net protein gain or loss (%) -63.9129
Critical? NO
F5.2 Net protein Score 3.00
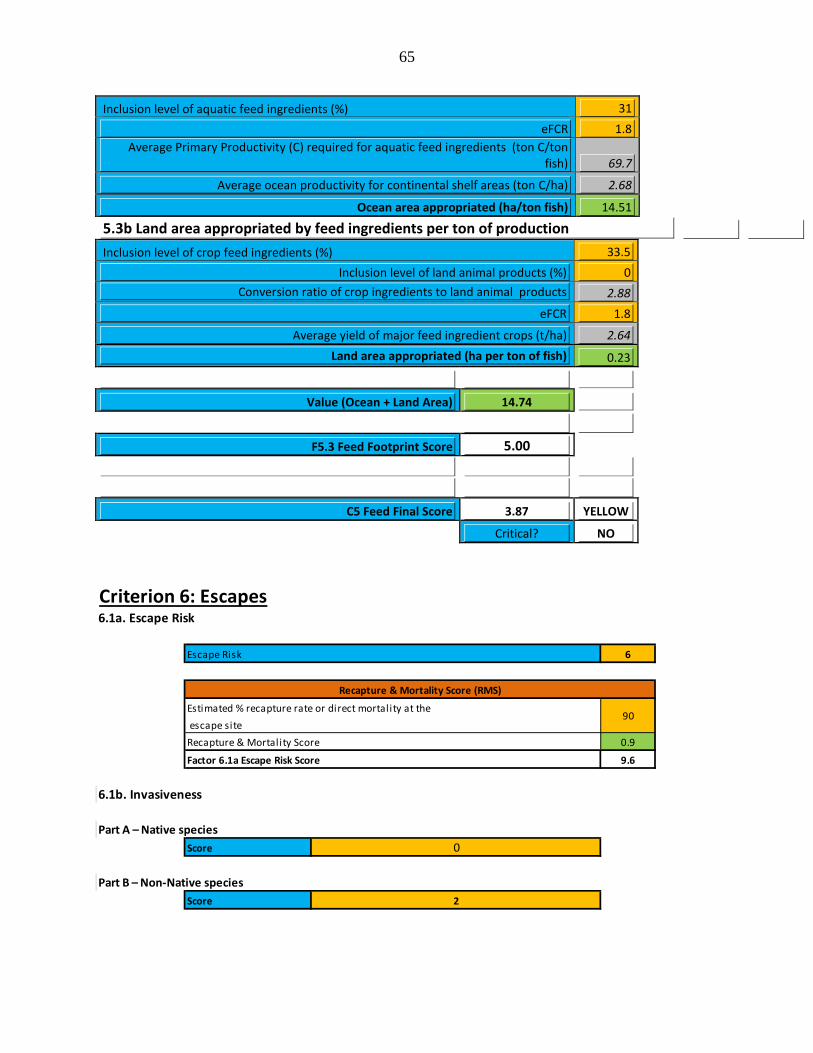
65
Inclusion level of aquatic feed ingredients (%) 31 eFCR 1.8
Average Primary Productivity (C) required for aquatic feed ingredients (ton C/ton fish) 69.7
Average ocean productivity for continental shelf areas (ton C/ha) 2.68
Ocean area appropriated (ha/ton fish) 14.51
5.3b Land area appropriated by feed ingredients per ton of production Inclusion level of crop feed ingredients (%) 33.5
Inclusion level of land animal products (%) 0 Conversion ratio of crop ingredients to land animal products 2.88
eFCR 1.8
Average yield of major feed ingredient crops (t/ha) 2.64 Land area appropriated (ha per ton of fish) 0.23
Value (Ocean + Land Area) 14.74
F5.3 Feed Footprint Score 5.00
C5 Feed Final Score 3.87 YELLOW
Critical? NO
6
escape site0.9
9.6
Score 0
Score 2
Part A – Native species
Part B – Non-Native species
Recapture & Mortality Score (RMS)
Estimated % recapture rate or direct mortality at the90
Recapture & Mortality Score
Factor 6.1a Escape Risk Score
6.1b. Invasiveness
Criterion 6: Escapes6.1a. Escape Risk
Escape Risk
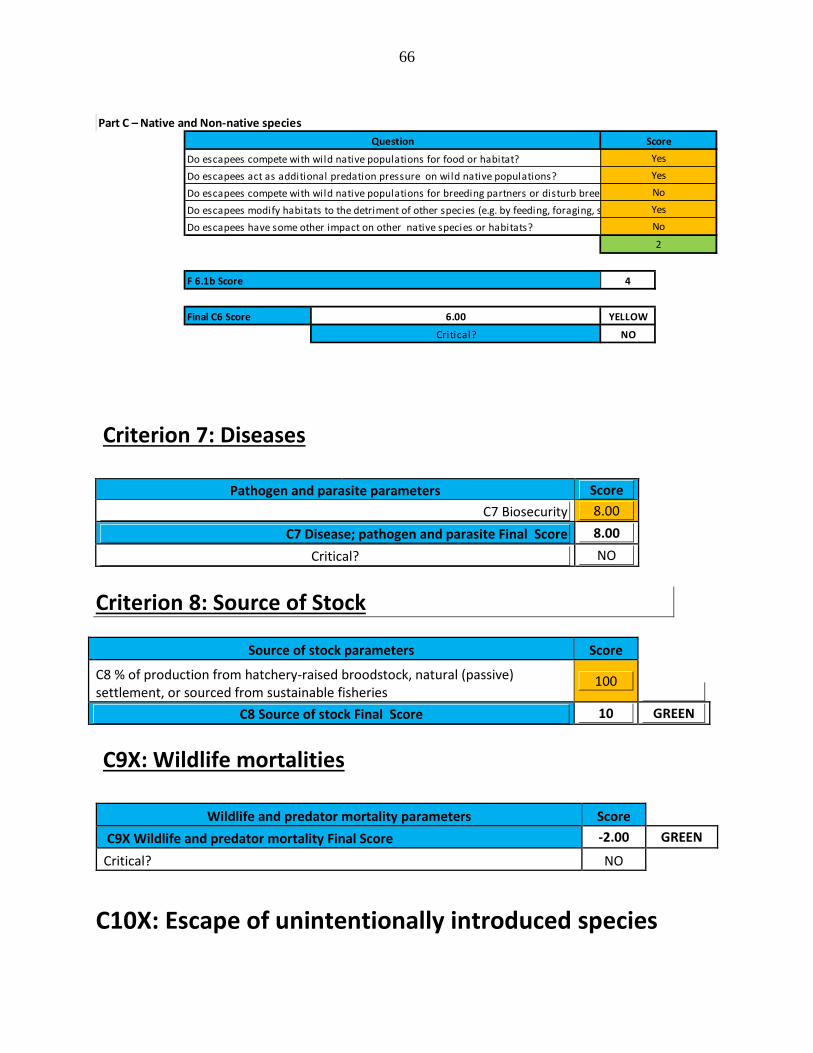
66
Criterion 7: Diseases
Pathogen and parasite parameters Score C7 Biosecurity 8.00
C7 Disease; pathogen and parasite Final Score 8.00 Critical? NO
Criterion 8: Source of Stock
Source of stock parameters Score
C8 % of production from hatchery-raised broodstock, natural (passive) settlement, or sourced from sustainable fisheries
100
C8 Source of stock Final Score 10 GREEN
C9X: Wildlife mortalities
Wildlife and predator mortality parameters Score C9X Wildlife and predator mortality Final Score -2.00 GREEN
Critical? NO
C10X: Escape of unintentionally introduced species
4
Final C6 Score 6.00 YELLOW
Critical? NO
2
F 6.1b Score
Do escapees modify habitats to the detriment of other species (e.g. by feeding, foraging, s Yes
Do escapees have some other impact on other native species or habitats? No
Do escapees act as additional predation pressure on wild native populations? Yes
Do escapees compete with wild native populations for breeding partners or disturb breed No
Part C – Native and Non-native speciesQuestion Score
Do escapees compete with wild native populations for food or habitat? Yes
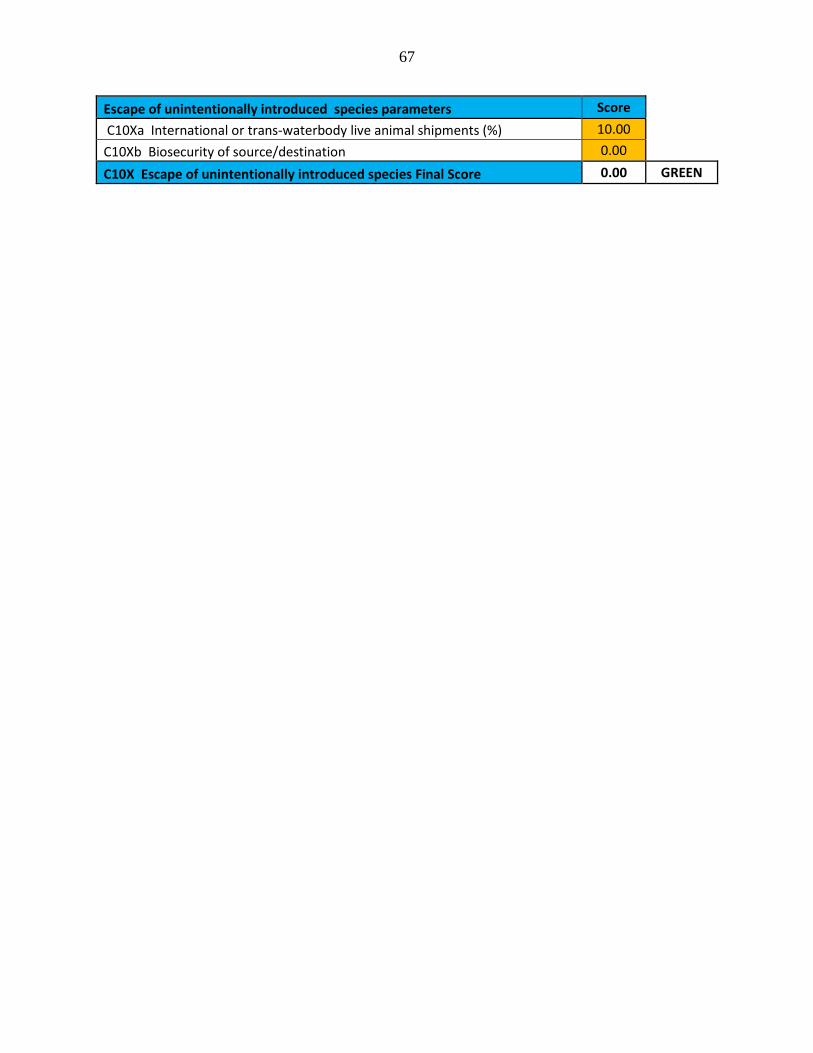
67
Escape of unintentionally introduced species parameters Score C10Xa International or trans-waterbody live animal shipments (%) 10.00 C10Xb Biosecurity of source/destination 0.00 C10X Escape of unintentionally introduced species Final Score 0.00 GREEN
68
Appendix 3: Shrimp Certification Programs World Shrimp Certification Programs 1. Alter-Trade Japan (ATJ) is a Japanese company involved in fair trade with several commodities including bananas, coffee and shrimp. The shrimp is labeled by ATJ as "eco-shrimps" based on their own standards. Since 2000, ATJ has worked with Naturland to develop a certified organic shrimp product using Naturland organic standards. The two groups merged in 2003 to form ATJNA to further work toward better management of production, processing and organic certification of shrimp.
2. Aquaculture Certification Council, Inc. (ACC) is a nongovernmental, nonprofit, nonmember public benefit corporation established to certify social, environmental and food safety standards at aquaculture facilities throughout the world. It is a certification of the process or how the shrimp were produced and not a quality certification. The ACC builds on elements of the voluntary responsible aquaculture program by Global Aquaculture Alliance (GAA) in a process certification system that combines site inspections and effluent sampling with testing and verification, sanitary controls, therapeutic controls and traceability. Guidelines for best aquaculture practices (BAP) standards can be found on the ACC URL www.aquaculturecertification.org.
The BAP mark on retail packaging means the shrimp came from a BAP-certified facility. Visit ACC web site for more detail.
3. Carrefour is the first retailer in Europe and second largest in the world. They are involved in fair trade of Carrefour Quality Line shrimp produced in Brazil and Madagascar.
4. Environmental Justice Foundation (EJF) has prepared a protocol for sustainable shrimp aquaculture as part of their campaign to encourage retailers “to only sell shrimp proven to be produced without harming natural environments, local communities or human rights.”
5. International Standards Organization (ISO) 14001 is the standard for environmental management, not for a product, but for minimizing harmful effects on the environment caused by shrimp farming. More information can be found at ISO 14001 website. ISO 14001 is
69
protected by copyright and is not free.
6. Naturland has developed standards on several aquaculture commodities and issued its standards on organic shrimp production in 1999. “Naturland Standards for organic Aquaculture” includes a specific section for pond culture of the Pacific white shrimp.
7. Safe Quality Food (SQF) is a program under the Food Marketing Institute. The certification system SQF1000 is for production and SQF2000 is for processing plants. SQF covers a global range volume of shrimp products. Thus far, processors are certified under the SQF1000 program, but not producers.
8. Shrimp Seal of Quality (SSoQ) of Bangladesh was established to certify farmed shrimp based on their own Code of Conduct. These certification standards describe the requirements that must be met by shrimp operators (hatcheries, farmers, transporters and processors) in order to receive SSoQ certification. SSoQ is a voluntary process certification and certifies that the operator is deemed to have met the minimum requirements in the areas of food safety, quality assurance, traceability, environmental sustainability, labor practices and social responsibility.
9. The Soil Association t has prepared general standards for organic aquaculture, mainly focused on salmon, trout and shrimp farming.
10. Thai Quality Shrimp (Thailand)—The Department of Fisheries of Thailand prepared the certification system for shrimp aquaculture, with the intention of producing shrimp under their Codes of Conduct. The certification covers hatchery, farm, processing plant and distributor and promotes the products under the label “Thai Quality Shrimp.”
Other Closely Related Aquaculture Certifications 1. BioGro New Zealand has developed standards for organic fish farming including fish, shellfish, crustaceans and the processing of those products.
2. Bio Suisse is an umbrella organization for organic agriculture in Switzerland. Bio Suisse is certifying farmed fish such as carp, char and perch. The standards only apply to inland and fresh- water farming and are designed for the Swiss market.
3. Fundacion Chile in cooperation with Chilean salmon farming companies prepared an Environmental Code of Practice that is intended to serve as the basis for a certification system for Chilean salmon farming. Their code of practice is translated into the English, Norwegian, Spanish, and German languages.
4. International Federation of Organic Agriculture Movements (IFOAM) is a global umbrella body for organic food and farming. IFOAM has drawn up "Basic Standards for Organic Aquaculture."
5. The U.S. Department of Agriculture (USDA) has been working on standards for organic aquaculture. They established the National Organic Standards Board and have been working toward setting standards for aquatic animal culture. URL:
70
http://www.ams.usda.gov/nosb/index.htm
There are presently some very large seafood buyers in the US (Dardin Seafoods—Red Lobster, Walmart/Sam's Club) that require their seafood suppliers to have such certifications. Others will follow. Despite these positive signs, there is no evidence that U.S. consumers will buy domestic products over foreign, especially when given the choice and when they find a superior quality product that is safe and less expensive. Seafood imports are at a historic high level and, ironically, 40%–50% are estimated to be farmed products. Therefore, the long-term outlook for the U.S. producer continues to be head-to-head competition with overseas producers. Without US government regulation, foreign competition, particularly from developing countries, will continue to offer low-priced commodities in the marketplace. This is because those nations have their own goals—to increase aquaculture production in coming years—and they have justified loans from international development banks on the lucrative seafood markets in Europe, Japan and the US. Additionally, they have plans to repay their loans through the sale of high-value products made profitable by low labor and operating costs, and a greater amount of processing to obtain the value-added benefits. Provided that their aquaculture products meet the higher standards of human health and safety now imposed by most of the world on all food products, seafood producers in the US will always face competition for market share.