Embed Size (px)
Citation preview
© 2020 Cloudleaf | All rights reserved | 20200505 1A HOLISTIC APPROACH TO SUPPLY CHAIN VISIBILITY WHITEPAPER
TM
W H I T E P A P E R
A Holistic Approach to Supply Chain Visibility
Executive Summary
Limited and rudimentary visibility in an organization’s supply chain means lost value and lost opportunities.
Fortunately, achieving 80-90% visibility is no longer a pipe dream, but both a reality and a requirement—optimal
visibility is the foundation for the Next Generation Supply Chain. Higher visibility leads to better decision making
that makes operations more efficient, resulting in higher profitability. Different approaches have been taken by
the industry to track various parameters that lead to improved supply chain visibility. From a 90% improvement
in production scheduling and $20M in annual savings, to a 20x ROI and millions of dollars saved in write downs,
there are many examples across a wide variety of industries that illustrate the power of near-optimal supply
chain visibility.
In this article, we put different tracking approaches on a common foundation and categorize them into what we
refer to as hard and soft attribute-based tracking. Then we argue why both hard and soft attribute-based track-
ing are important and how one complements the other, leading to near optimal visibility.
Importance of Supply Chain Visibility
One of the key challenges in supply chain has been the lack of visibility that leads to inaccurate predictions, poor
planning, delayed decision making, higher risks and loss of business. In fact, visibility has several value dimensions.
At the foundational level, it allows accurate and timely reporting or performance measures, which are neces-
sary for incentive alignment. Then, visibility enables prompt actions and responses if necessary, to events that
may have deviated from plan, helping in course correction. Third, visibility allows us to have the best responses,
knowing the full conditions of the supply chain beyond the event we are addressing. This is especially relevant for
risk mitigation when multiple factors interact in a complex manner resulting in the creation of a practically infinite
state space for decision making. Visibility helps in understanding the tradeoffs in various alternative decisions,
leading to the optimal choice mitigating business risks. Finally, visibility provides a means for us to improve our
predictive power, useful for pre-emptive actions or improved planning capabilities.
Sanjoy Paul, Prof. Hau Lee, Mahesh Veerina
Visibility helps in understanding the tradeoffs in various alternative decisions, leading to the optimal choice mitigating business risks.“ ”

© 2020 Cloudleaf | All rights reserved | 20200505 2A HOLISTIC APPROACH TO SUPPLY CHAIN VISIBILITY WHITEPAPER
TM
Framework for Supply Chain Visibility
There are several parameters that need to be tracked for improving supply chain visibility. Some argue that the
key to higher productivity is tracking progress in business processes, leading to the identification of exceptions in
a timely manner and orchestrating operations based on that visibility. On the other hand, some argue that track-
ing the location and condition of goods and supplies in real time as they move through the supply chain, involving
different stakeholders across organizational boundaries, is the basis for smarter decision making. Both viewpoints
have their own merit, as they both point out bottlenecks in the supply chain in their own way and identify the
points of intervention for overcoming them. We embrace both schools of thought and put them on a common
framework, as shown in Figure 1. The former school of thought banks on what we refer to as soft attributes and
the latter school banks on what we call hard attributes. We elaborate on the concept of hard and soft attributes next.
Figure 1: Framework for Supply Chain Visibility
Hard and Soft Attributes
Let us delve a little deeper into supply chain visibility. Visibility in the supply chain is aimed at providing the status
and location of the raw materials/components, from the suppliers to the factory to logistics to the shop floor to
the finished goods in the warehouse and distribution centers, and finally, to consumption.
There are two dimensions to visibility — one that involves hard attributes and the other that involves soft attributes.
Hard attributes are location, condition (vibration/shock, ambient temperature, humidity, pressure), timestamp and
count (see Figure 1) that can be captured using sensors, while the soft attributes are classified mostly as context.
There are two types of context: (1) business process context and (2) environmental context. Business process
context refers to the steps in business processes, such as requisition, approval, purchase order, invoice, payment,
picking, packing, shipping, storing, etc. that can be captured in the system during the execution of various busi-
ness processes. Enviromental context, on the other hand, refers to factors adjacent to the core functions of the
supply chain, but have an impact on the efficiency of the supply chain. These contexts are captured by systems
for purposes other than the supply chain. For example, weather conditions are captured for weather forecasts
and traffic conditions are captured for helping drivers with navigation. But both of these parameters — weather
and traffic — which are directly relevant for logistics operations — impact the supply chain.
Context
Hard Attributes
Soft Attributes
Location
Condition
Count Timestamp
V I S I B I L I T Y
BusinessProcess
Environment

© 2020 Cloudleaf | All rights reserved | 20200505 3A HOLISTIC APPROACH TO SUPPLY CHAIN VISIBILITY WHITEPAPER
TM
These attributes, whether hard or soft, signify potential changes in values or impacts to different members in the supply chain. For example, if a product is damaged (hard attribute), then the value of the product would decline for the receiving member, or another member's liability (e.g., insurance or logistics company) may go up. Similarly, if a payment term has changed (soft attribute) so that a physical product sitting in the warehouse has not changed ownership, then the balance sheets or liability risk of the potential owners could be affected. It is from such changes in values and impacts to the members of the supply chain that we derive value from visibility (accurate predictions, better planning, timely decision making, lower risk, higher revenue). Basically, hard and soft attributes are directly tied to values and consequences, making them relevant in the context of business. While the link of hard attributes to values and consequences is clear and recognized, we argue that the same is true for soft attributes, as they could fundamentally change the values and consequences of a product or an object.
Figure 2: Value Diagram when only Hard Attributes are tracked
If only the hard attributes are tracked using sensors, the Visibility Index will move through steps a-g (as shown in Figure 2) as the raw material/component moves from Supplier through Logistics to Factory and the finished good moves from Factory to Warehouse through Logistics to the Distribution Center, as there is no visibility of the soft attributes. That means there is no change in the visibility of raw material/component at the Supplier until it is in Logistics, although there have been multiple changes in soft attribute states at the Supplier. Similarly, there is no change in the visibility of raw material/component at Logistics until it reaches the Factory, although there have been multiple changes in soft attribute states at Logistics. The same thing keeps happening at the next stages as well, as the Finished Good moves from Factory to Warehouse to Distribution Center through Logistics. Thus, as the stage of Consumption is reached, the visibility is only at stage g while the actual visibility should have been at stage 6.
While the observation above is broadly true, that is not strictly true, as there are hard attribute-based events that can provide visibility during the so-called blind spots. This is captured in Figure 2 via the points in between a and b (or equivalently 0 and 1), b and c (or equivalently 1 and 2), and so on, until between f and g (or equivalently 5 and 6).
Let’s specifically look at the points between a and b along the X-axis (or equivalently, between 0 and 1). When the materials to be shipped out are loaded on pallets before transporting them to the loading zone, the sensors can capture that information and make that visible. Similarly, when the materials reach the loading zone, the sensors can detect that and make it visible. Therefore, if the material is not picked up within a pre-specified duration of time (threshold), an alert could be raised with the shipping department stakeholder at the Supplier responsible for ensuring that the materials are loaded on to the 3PL trucks so that he can inform the 3PL and follow through with them until the material leaves the Supplier’s warehouse.
VALUE
Supplier Logistics Factory Warehouse Logistics Distribution Center Consumption
c d e f ga
0
1
2
3
4
5
6
b
HARD ATTRIBUTES
Load
ed o
n P
alle
t
At
Load
ing
Z
one
Tem
p >
T
hres
hold
Insi
de
Fac
tory
Geo
fenc
e At
Sub
stat
ion
At
Lo
adin
g
Zo
ne
Tim
e o
n S
helf
>T
hres
hold
At
Lo
adin
g
Zo
ne
At
Way
po
int
Dw
ell T
ime >
Thr
esho
ld
Vib
rati
on
T
hres
hold
Insi
de
DC
Dep
art
DC
Insi
de
Sto
re

© 2020 Cloudleaf | All rights reserved | 20200505 4A HOLISTIC APPROACH TO SUPPLY CHAIN VISIBILITY WHITEPAPER
TM
One more example of fine-grained visibility based on hard attributes is at the factory (between c and d or equiv-alently between 2 and 3). Note that sensors can indicate if the materials needed for production are left unutilized for a duration of time. This is an example of the dwell time exceeding a threshold, which can trigger an alert with the production manager at the factory and ensure that the material is used for production. Typically, production involves a workflow as the materials move from one cell (or substation) to another and get transformed/assem-bled along the assembly line. Sensors are the best means to track the progress of the workflow as the work order (kept in a plastic envelope) for a specific batch moves from one cell to another. This is because a sensor kept inside the plastic envelope with the work order can be tracked. That means the location of the work order at any instant of time is visible. This is referred to as “At sub-station X” in Figure 2. Therefore, if the work order stays in a cell for more than a threshold amount of time, the line supervisor can be alerted, and actions can be triggered. Similarly, there are condition-based triggers that can make certain events of interest visible. For example, when the finished product is transported by Logistics from the Warehouse to the Distribution Center (between e and f or equiva-lently between 3 and 4), if the vibration exceeds a threshold indicating that the product could be damaged, alerts could be sent to the product owner so that the product quality could be checked before it reaches the Distribution Center and discarded (rather than stored in the Distribution Center) if damaged. Micro events triggered by hard attributes (or sensors) leading to better visibility along the X-axis are shown in Figure 2 as green dots.
In Figure 2, the Y-axis represents the Value of the system as it moves through various members of the supply chain. As the raw materials/components move from Supplier to Logistics, the Value of the system jumps from 0 to 1, but it is not obvious as to “how” the Value changed. That is, there are “blind spots” in the supply chain. Similarly, when the raw materials/components reach the Factory, the Value jumps to 2 in a step. Once again, it is unclear as to “how” the Value changed from 1 to 2. The same thing continues as the Value keeps jumping in steps 2 to 6 as the finished goods move from Factory to Consumption via Warehouse, Logistics and Distribution Center. As described earlier, there are micro-events triggered by hard attributes to provide more granular visibility during what are otherwise blind spots. However, that is not enough from a complete visibility perspective.
On the flip side, if only the soft attributes are tracked, the Visibility Index will move through steps a'-g' (as shown in Figure 3). The steps in the business processes from Supplier through Logistics to Factory are executed and the business processes from Factory to Warehouse through Logistics to Distribution Center are executed, as there is no visibility of the hard attributes. That means there is no change in the visibility of raw material/component at the Supplier until the business processes at the Logistics start to execute, although there have been multiple changes in hard attributes (location, vibration, timestamp, etc.) as the raw material/component is transported by the Logistics company from the Supplier location to the Factory location. Similarly, there is no change in visibility of raw material/component at Logistics until the business processes at the Factory start to execute, although there have been multiple changes in hard attributes (location, vibration, dwell time, ambient temperature, ambient humidity, etc.) as the raw material/component is processed by the Factory after receiving them from Logistics, until finished goods are ready and delivered to the Warehouse. The same thing keeps happening at the next stages as well, as the business processes keep transitioning from those of the Factory to those of the Warehouse to those of the Distribu-tion Center through the execution of business process of outbound Logistics. Thus, as the stage of Consumption is
reached, the visibility is only at stage g' while the actual visibility should have been at stage 6.
Hard and soft attributes are directly tied to values and consequences, making them relevant in the context of business. While the link of hard attributes
to values and consequences is clear and recognized, we argue that the same is true for soft attributes, as they could fundamentally change the values and
consequences of a product or an object.
“”
© 2020 Cloudleaf | All rights reserved | 20200505 5A HOLISTIC APPROACH TO SUPPLY CHAIN VISIBILITY WHITEPAPER
TM
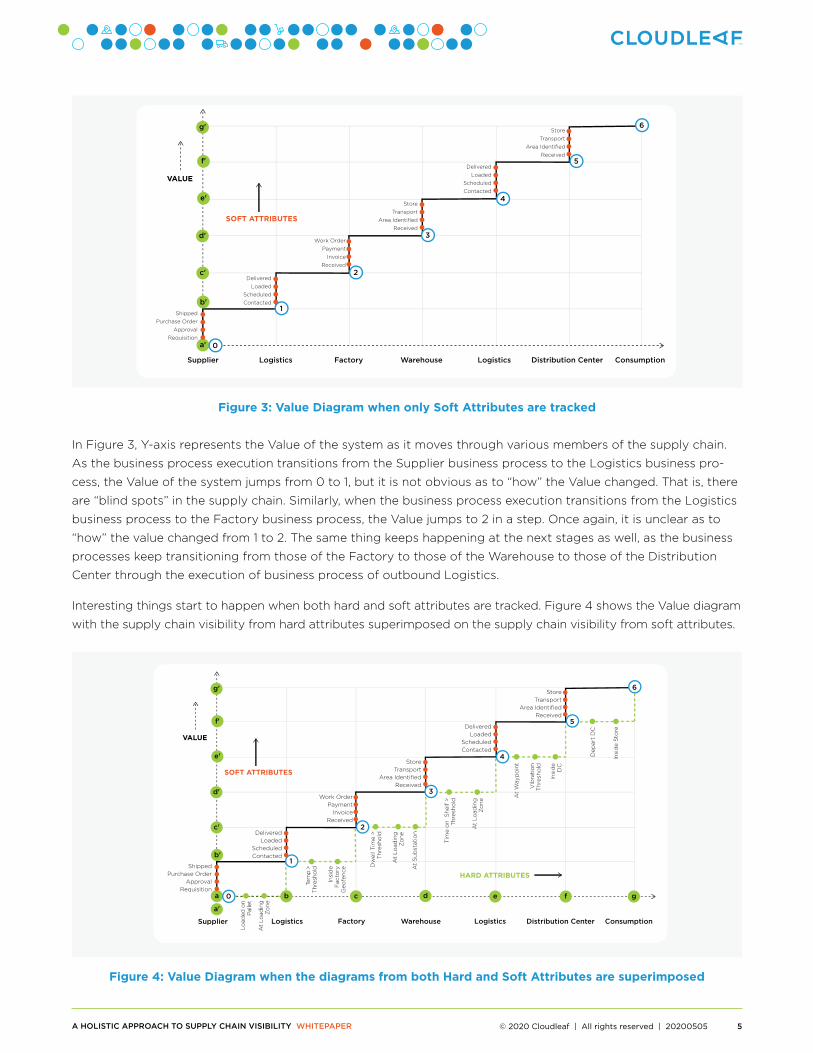
Figure 3: Value Diagram when only Soft Attributes are tracked
In Figure 3, Y-axis represents the Value of the system as it moves through various members of the supply chain.
As the business process execution transitions from the Supplier business process to the Logistics business pro-
cess, the Value of the system jumps from 0 to 1, but it is not obvious as to “how” the Value changed. That is, there
are “blind spots” in the supply chain. Similarly, when the business process execution transitions from the Logistics
business process to the Factory business process, the Value jumps to 2 in a step. Once again, it is unclear as to
“how” the value changed from 1 to 2. The same thing keeps happening at the next stages as well, as the business
processes keep transitioning from those of the Factory to those of the Warehouse to those of the Distribution
Center through the execution of business process of outbound Logistics.
Interesting things start to happen when both hard and soft attributes are tracked. Figure 4 shows the Value diagram
with the supply chain visibility from hard attributes superimposed on the supply chain visibility from soft attributes.
Figure 4: Value Diagram when the diagrams from both Hard and Soft Attributes are superimposed
VALUE
Supplier Logistics
ShippedPurchase Order
ApprovalRequisition
DeliveredLoaded
ScheduledContacted
SOFT ATTRIBUTES
Factory Warehouse Logistics Distribution Center Consumption
c'
d'
e'
f'
g'
a' 0
1
2
3
4
5
6
b'
Work OrderPayment
InvoiceReceived
StoreTransport
Area IdentifiedReceived
DeliveredLoaded
ScheduledContacted
StoreTransport
Area IdentifiedReceived
VALUE
ShippedPurchase Order
ApprovalRequisition
DeliveredLoaded
ScheduledContacted
SOFT ATTRIBUTES
c'
c
d'
d
e'
e
f'
f
g'
ga
a'
0
1
2
3
4
5
b'
b
Work OrderPayment
InvoiceReceived
StoreTransport
Area IdentifiedReceived
DeliveredLoaded
ScheduledContacted
StoreTransport
Area IdentifiedReceived
HARD ATTRIBUTES
6
Supplier Logistics Factory Warehouse Logistics Distribution Center Consumption
Load
ed o
n P
alle
t
At
Load
ing
Z
one
Tem
p >
T
hres
hold
Insi
de
Fac
tory
Geo
fenc
e At
Sub
stat
ion
At
Lo
adin
g
Zo
ne
Tim
e o
n S
helf
>T
hres
hold
At
Lo
adin
g
Zo
ne
At
Way
po
int
Dw
ell T
ime
>
Thr
esho
ld
Vib
rati
on
T
hres
hold
Insi
de
DC
Dep
art
DC
Insi
de
Sto
re
© 2020 Cloudleaf | All rights reserved | 20200505 6A HOLISTIC APPROACH TO SUPPLY CHAIN VISIBILITY WHITEPAPER
TM
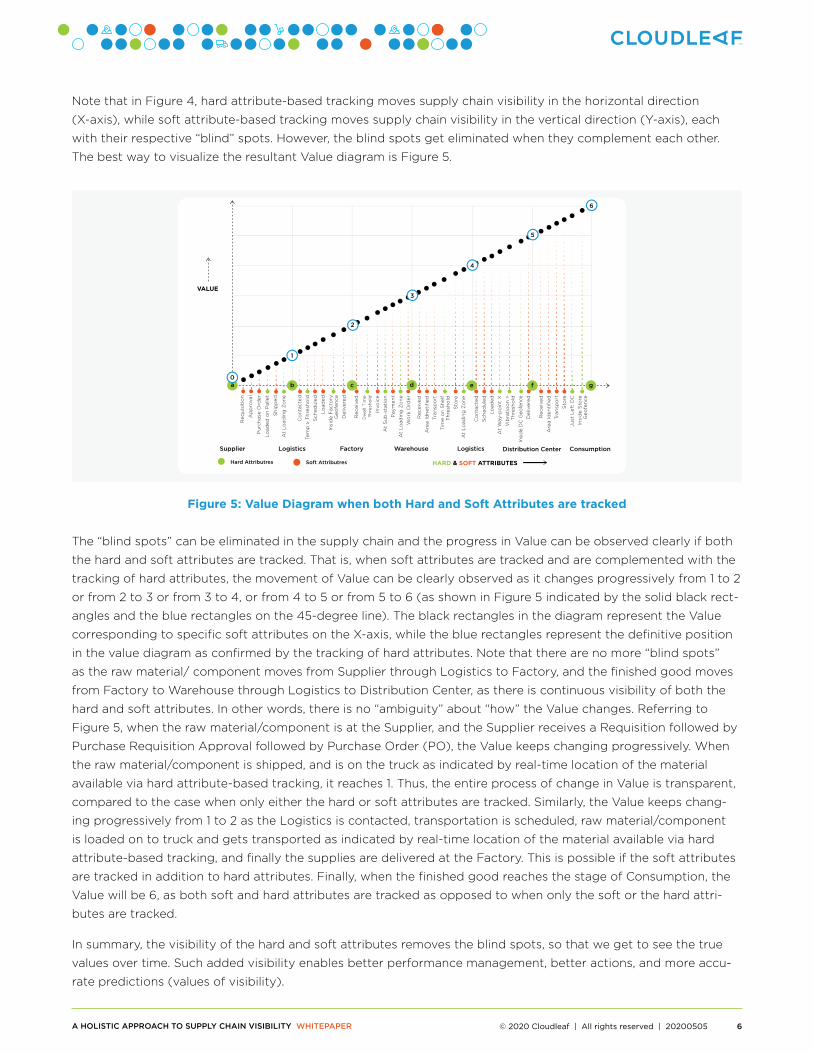
Note that in Figure 4, hard attribute-based tracking moves supply chain visibility in the horizontal direction
(X-axis), while soft attribute-based tracking moves supply chain visibility in the vertical direction (Y-axis), each
with their respective “blind” spots. However, the blind spots get eliminated when they complement each other.
The best way to visualize the resultant Value diagram is Figure 5.
Figure 5: Value Diagram when both Hard and Soft Attributes are tracked
The “blind spots” can be eliminated in the supply chain and the progress in Value can be observed clearly if both
the hard and soft attributes are tracked. That is, when soft attributes are tracked and are complemented with the
tracking of hard attributes, the movement of Value can be clearly observed as it changes progressively from 1 to 2
or from 2 to 3 or from 3 to 4, or from 4 to 5 or from 5 to 6 (as shown in Figure 5 indicated by the solid black rect-
angles and the blue rectangles on the 45-degree line). The black rectangles in the diagram represent the Value
corresponding to specific soft attributes on the X-axis, while the blue rectangles represent the definitive position
in the value diagram as confirmed by the tracking of hard attributes. Note that there are no more “blind spots”
as the raw material/ component moves from Supplier through Logistics to Factory, and the finished good moves
from Factory to Warehouse through Logistics to Distribution Center, as there is continuous visibility of both the
hard and soft attributes. In other words, there is no “ambiguity” about “how” the Value changes. Referring to
Figure 5, when the raw material/component is at the Supplier, and the Supplier receives a Requisition followed by
Purchase Requisition Approval followed by Purchase Order (PO), the Value keeps changing progressively. When
the raw material/component is shipped, and is on the truck as indicated by real-time location of the material
available via hard attribute-based tracking, it reaches 1. Thus, the entire process of change in Value is transparent,
compared to the case when only either the hard or soft attributes are tracked. Similarly, the Value keeps chang-
ing progressively from 1 to 2 as the Logistics is contacted, transportation is scheduled, raw material/component
is loaded on to truck and gets transported as indicated by real-time location of the material available via hard
attribute-based tracking, and finally the supplies are delivered at the Factory. This is possible if the soft attributes
are tracked in addition to hard attributes. Finally, when the finished good reaches the stage of Consumption, the
Value will be 6, as both soft and hard attributes are tracked as opposed to when only the soft or the hard attri-
butes are tracked.
In summary, the visibility of the hard and soft attributes removes the blind spots, so that we get to see the true
values over time. Such added visibility enables better performance management, better actions, and more accu-
rate predictions (values of visibility).
VALUE
HARD & SOFT ATTRIBUTES Hard Attributres Soft Attributres
Supplier Logistics Factory Warehouse Logistics Distribution Center Consumption
gb
6
a0
1
Req
uis
itio
n
Ap
pro
val
Pu
rch
ase
Ord
er
Lo
aded
on
Pal
let
Sh
ipp
ed
At
Lo
adin
g Z
on
e
Co
nta
cte
d
Tem
p >
Th
resh
old
Sch
edu
led
Lo
aded
Insi
de
Fac
tory
G
eofe
nce
Del
iver
ed
Rec
eive
d
Dw
ell T
ime
Th
resh
old
Invo
ice
At
Su
b-s
tati
on
Pay
men
t
At
Lo
adin
g Z
on
e
Wo
rk O
rder
Rec
eive
d
Are
a Id
net
ified
Tran
spo
rt
Tim
e o
n S
hel
f T
hre
sho
ld
Sto
re
At
Lo
adin
g Z
on
e
Co
nta
cte
d
Sch
edu
led
Lo
aded
At
Way
-po
int
X
Vib
rati
oo
n >
T
hre
sho
ld
Insi
de
DC
Geo
fenc
e
Del
iver
ed
Rec
eive
d
Are
a Id
enti
fied
Tran
spo
rt
Sto
re
Just
Lef
t D
C
Insi
de
Sto
re
Geo
fen
ce
2
3
4
c d e f
5
© 2020 Cloudleaf | All rights reserved | 20200505 7A HOLISTIC APPROACH TO SUPPLY CHAIN VISIBILITY WHITEPAPER
TM
Computing Supply Chain Visibility Index of an Enterprise
Once we have the accurate depiction of the visibility of soft and hard attributes, we can compute what is called
the Visibility Index (VI). The Visibility Index is a metric that helps an enterprise to precisely understand the level of
their maturity in tracking not only the flow of materials and finished goods, but also the progress in the execution
of business processes in their supply chain. It helps an enterprise appreciate the gaps from an agile decision-mak-
ing perspective and infer the steps needed to improve their overall business performance. Furthermore, it will
help them benchmark themselves against the competition and adopt best practices. Last but not least, visibility
is a means to the end, meaning better visibility will enable enterprises to plan better and make faster decisions,
helping them to close the gap between planning and execution, and thus giving them a competitive edge in the
industry. A supply chain that is able to merge planning and execution cycles is what we refer to as the Next Gen-
eration Supply Chain (NGSC).
The Visibility Index will vary from company to company based on the granularity of visibility of the various hard
and soft attributes. We define Visibility Index VI as a vector:
or where
X represents Hard attribute-based visibility, Y represents Soft attribute-based visibility, and i and j are vectors
along the horizontal and vertical axes respectively.
where Xi represents the visibility at step i along the X-axis in Figure 4 where i =0 through
6 corresponds to a through g and N (the number of entities in the supply chain) = 7
where Yi represents the visibility at step i along the Y-axis in Figure 4 where i =0 through
6 corresponds to a’ through g’ and N (the number of entities in the supply chain) = 7
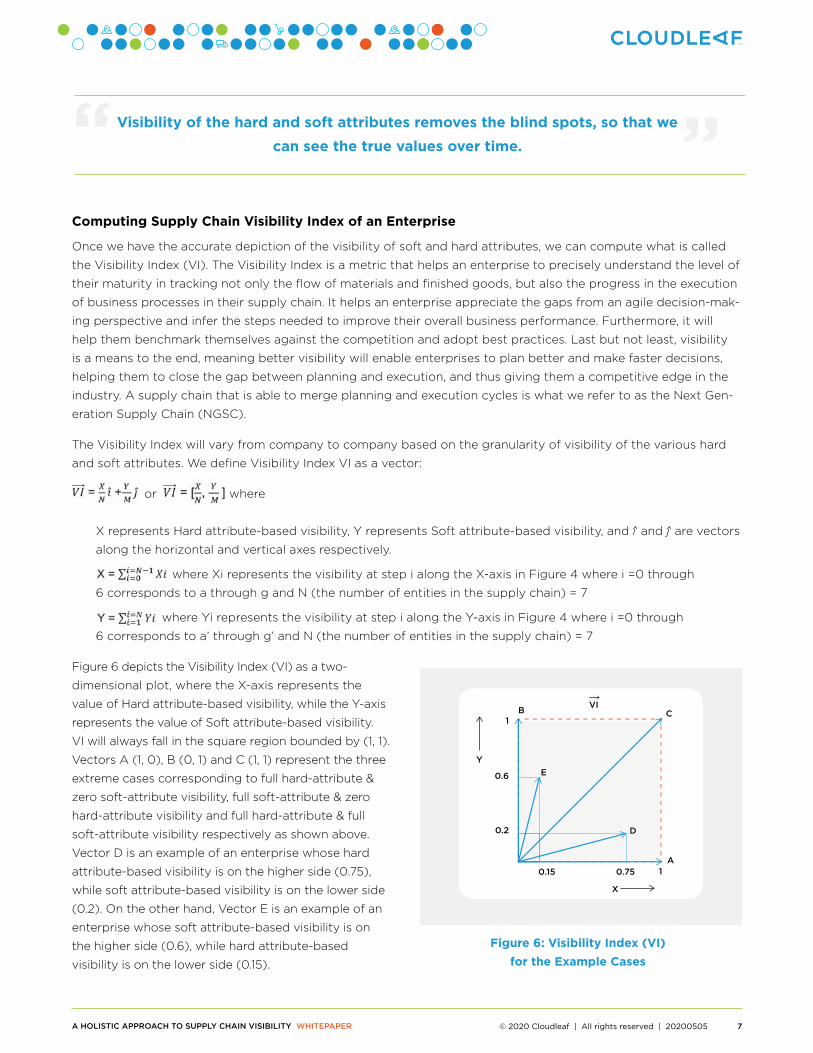
Figure 6 depicts the Visibility Index (VI) as a two-
dimensional plot, where the X-axis represents the
value of Hard attribute-based visibility, while the Y-axis
represents the value of Soft attribute-based visibility.
VI will always fall in the square region bounded by (1, 1).
Vectors A (1, 0), B (0, 1) and C (1, 1) represent the three
extreme cases corresponding to full hard-attribute &
zero soft-attribute visibility, full soft-attribute & zero
hard-attribute visibility and full hard-attribute & full
soft-attribute visibility respectively as shown above.
Vector D is an example of an enterprise whose hard
attribute-based visibility is on the higher side (0.75),
while soft attribute-based visibility is on the lower side
(0.2). On the other hand, Vector E is an example of an
enterprise whose soft attribute-based visibility is on
the higher side (0.6), while hard attribute-based
visibility is on the lower side (0.15).
1
0.6
0.2
0.15 0.75
X
Y
1A
C
D
E
B VI
Figure 6: Visibility Index (VI) for the Example Cases
Visibility of the hard and soft attributes removes the blind spots, so that we can see the true values over time. “ ”

© 2020 Cloudleaf | All rights reserved | 20200505 8A HOLISTIC APPROACH TO SUPPLY CHAIN VISIBILITY WHITEPAPER
TM
Enterprises can be categorized into four basic quadrants based on their Visibility Index as shown in Figure 7:
(1) Basic, (2) Grounded, (3) Granular and (4) Advanced. Basic indicates relative immaturity in both the hard and
soft attribute-based visibility. Grounded refers to more emphasis on sensor-based tracking, leading to higher visibility
on the hard attribute side with less emphasis on tracking business processes, leading to lower visibility on the soft
attribute side. On the other hand, Granular refers to more emphasis on business process tracking, leading to higher
visibility on the soft attribute side with less emphasis on sensor-based tracking, leading to lower visibility on the
hard attribute side. When an enterprise has a balanced emphasis on both hard and soft attribute-based tracking,
it belongs to the Advanced category. The goal of every enterprise should be to be in the top-right quadrant — the
Advanced category. To emphasize extreme behavior, we have carved out an appropriate sub-quadrant within
each quadrant.
If we superimpose the example cases on the above diagram, they look like the one shown in Figure 8, where A & D
belong to “Very Grounded” category, E belongs to “Granular” category, B belongs to “Very Granular” category
and C belongs to the “Very Advanced” category as expected, based on the visibility numbers for hard and soft
attributes for the respective cases.
Note that although we defined the Visibility Index (VI) from an end-to-end perspective, it is possible to use the
same definition for a segment (or functional entity) of the supply chain. For example, we could use the same
definition of visibility just for Sourcing/Procurement (upstream side of the supply chain) or just for Production/
Manufacturing/Factory or for just for Distribution (downstream side of the production). This will require defining
the points of observation (or visibility) for both soft attributes as well as hard attributes.
Visibility of soft attributes provides additional granularity to visibility and helps the stakeholders become more agile in their
decision making. “
”
X
Y
D
E
VI
VeryAdvanced
VeryGranular
VeryBasic
VeryGrounded
Grounded
AdvancedGranular
Basic
Figure 7: Visibility Index (VI) Categories
X
Y
D
E
B VI
VeryAdvanced
VeryGranular
VeryBasic
VeryGrounded
Grounded
AdvancedGranular
Basic
A
C
D
E
Figure 8: Visibility Index (VI) Categories for the Example Cases
© 2020 Cloudleaf | All rights reserved | 20200505 9A HOLISTIC APPROACH TO SUPPLY CHAIN VISIBILITY WHITEPAPER
TM
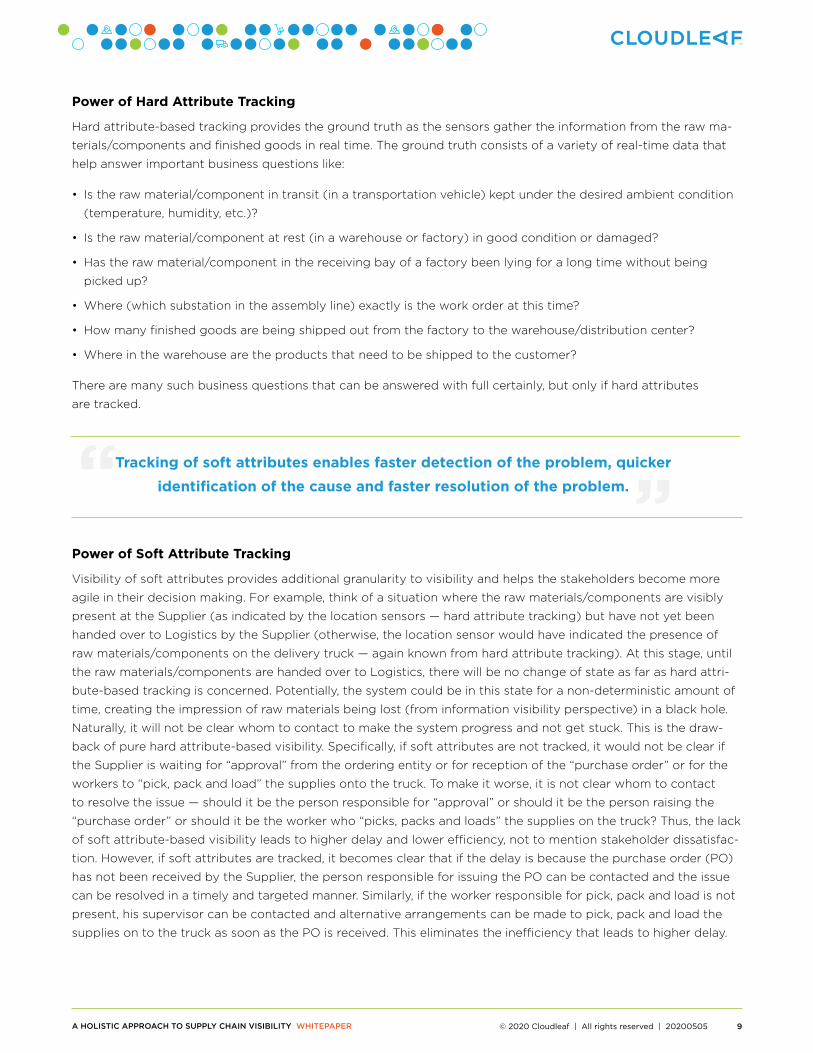
Power of Hard Attribute Tracking
Hard attribute-based tracking provides the ground truth as the sensors gather the information from the raw ma-
terials/components and finished goods in real time. The ground truth consists of a variety of real-time data that
help answer important business questions like:
• Is the raw material/component in transit (in a transportation vehicle) kept under the desired ambient condition
(temperature, humidity, etc.)?
• Is the raw material/component at rest (in a warehouse or factory) in good condition or damaged?
• Has the raw material/component in the receiving bay of a factory been lying for a long time without being
picked up?
• Where (which substation in the assembly line) exactly is the work order at this time?
• How many finished goods are being shipped out from the factory to the warehouse/distribution center?
• Where in the warehouse are the products that need to be shipped to the customer?
There are many such business questions that can be answered with full certainly, but only if hard attributes
are tracked.
Power of Soft Attribute Tracking
Visibility of soft attributes provides additional granularity to visibility and helps the stakeholders become more
agile in their decision making. For example, think of a situation where the raw materials/components are visibly
present at the Supplier (as indicated by the location sensors — hard attribute tracking) but have not yet been
handed over to Logistics by the Supplier (otherwise, the location sensor would have indicated the presence of
raw materials/components on the delivery truck — again known from hard attribute tracking). At this stage, until
the raw materials/components are handed over to Logistics, there will be no change of state as far as hard attri-
bute-based tracking is concerned. Potentially, the system could be in this state for a non-deterministic amount of
time, creating the impression of raw materials being lost (from information visibility perspective) in a black hole.
Naturally, it will not be clear whom to contact to make the system progress and not get stuck. This is the draw-
back of pure hard attribute-based visibility. Specifically, if soft attributes are not tracked, it would not be clear if
the Supplier is waiting for “approval” from the ordering entity or for reception of the “purchase order” or for the
workers to “pick, pack and load” the supplies onto the truck. To make it worse, it is not clear whom to contact
to resolve the issue — should it be the person responsible for “approval” or should it be the person raising the
“purchase order” or should it be the worker who “picks, packs and loads” the supplies on the truck? Thus, the lack
of soft attribute-based visibility leads to higher delay and lower efficiency, not to mention stakeholder dissatisfac-
tion. However, if soft attributes are tracked, it becomes clear that if the delay is because the purchase order (PO)
has not been received by the Supplier, the person responsible for issuing the PO can be contacted and the issue
can be resolved in a timely and targeted manner. Similarly, if the worker responsible for pick, pack and load is not
present, his supervisor can be contacted and alternative arrangements can be made to pick, pack and load the
supplies on to the truck as soon as the PO is received. This eliminates the inefficiency that leads to higher delay.
Tracking of soft attributes enables faster detection of the problem, quicker identification of the cause and faster resolution of the problem.
“ ”

© 2020 Cloudleaf | All rights reserved | 20200505 10A HOLISTIC APPROACH TO SUPPLY CHAIN VISIBILITY WHITEPAPER
TM
This argument holds at every stage of the supply chain. For example, if the supplies are ready to be handed over
to 3PL (3rd Party Logistics) but not done, the supplies will naturally not arrive at the factory. Without tracking
soft attributes, it will not be clear if the 3PL have been contacted or even if they have been contacted, if the 3PL
have scheduled a pickup or if there has been a delay in loading the truck. Note that the responsibility for contact-
ing 3PL lies with someone at the Supplier side, while the responsibility for scheduling a pickup lies with someone
at the 3PL, and the responsibility for loading supplies on to the truck lies with the union workers. Hence, in order
to solve the problem, it is absolutely essential to know where the situation is via soft attribute tracking and then
take a targeted action to resolve the issue on time.
The main point here is that the tracking of soft attributes enables faster detection of the problem, quicker identifi-
cation of the cause and faster resolution of the problem, leading to higher efficiency, improved throughput, lower
delay and higher stakeholder satisfaction. Moreover, soft attribute tracking enables a better and more accurate
computation of ETA and as a result, the resources for subsequent stages of the workflow can be lined up just in
time, thereby reducing, if not eliminating, any wait time leading to maximization of efficiency and higher stake-
holder satisfaction.
Benefit of Tracking both Soft and Hard Attributes
Figure 9: Supply Chain is a gigantic workflow of interlinked processes
Conceptually, every functional process, such as the Supplier process, Inbound Logistics process, Factory process,
Warehouse process, Outbound Logistics process and Distribution Center process, consists of several activities
(steps) as shown in Figure 9. The activities in each functional process can be divided into three parts: (1) Inbound
Edge, (2) Core and (3) Outbound Edge. Inbound Edge is the first activity and Outbound Edge is the last activity.
The rest of the activities are clumped into the Core. Specifically, if we take the Suppler process, it consists of the
following steps — Requisition, Approval, Purchase Order, Shipping. Here, Requisition is the Inbound Edge and
Shipping is the Outbound Edge, while Approval and Purchase Order are lumped into the Core. For the next func-
tion of Inbound Logistics, the steps are: Contacted, Scheduled, Loaded and Delivered. Contacted is the Inbound

© 2020 Cloudleaf | All rights reserved | 20200505 11A HOLISTIC APPROACH TO SUPPLY CHAIN VISIBILITY WHITEPAPER
TM
Edge and Delivered is the Outbound Edge while Scheduled and Loaded are clumped into the Core as shown in
Figure 10. The rationale for introducing the terms “Inbound Edge” and “Outbound Edge” is to show the “Trigger-
ing” of actions from an upstream functional process (say Supplier Process) to an adjacent downstream functional
process (Inbound Logistics Process) and so on along the supply chain as functional boundaries are crossed and
a change of stakeholders takes effect.
Figure 10: Activities (steps) within specific functional processes in a Supply Chain
The Outbound Edge of an upstream function feeds into the Inbound Edge of a downstream function. In this
example, the Shipping activity of Supplier Process triggers the Contacted activity of Inbound Logistics Process,
meaning that as soon as the Supplier is ready to ship, the Inbound Logistics needs to be contacted for schedul-
ing the pickup. While each functional process has a micro-level workflow linking the steps, there is a macro-level
workflow interconnecting the functional processes from upstream all the way to downstream.
Hard attribute-based tracking identifies the arrival and presence at a functional process. In other words, the macro-
level workflow can be tracked based on hard attributes. Soft attribute-based tracking identifies the transition from
one step to another within a functional process. Thus, micro-level workflow can be tracked based on soft attributes.
Once we have a mechanism for tracking both hard and soft attributes in real time, gathering the relevant data at
the appropriate level of granularity, and superimposing them on to the digital models of the various entities in the
supply chain, we can essentially create a digital twin of the supply chain, visualize the performance at different
levels of granularity in real time, and perform real-time what-if analysis for making smart decisions for risk mitiga-
tion and/or improved operations and planning.

© 2020 Cloudleaf | All rights reserved | 20200505 12A HOLISTIC APPROACH TO SUPPLY CHAIN VISIBILITY WHITEPAPER
TM
Soft and Hard Handoff
Inefficiencies happen in two main areas: (1) transition from one step to another within a function and (2) transi-
tion between functions. We call the first type of transition “soft handoff” and the second type of transition “hard
handoff.” Since soft handoffs are within a given functional entity (or an organization), they can be handled with
escalations within the hierarchy of the organization if the delay in the soft handoff is detected. However, hard
handoffs happen across organizations and hence, they need different modes of intervention rather than an esca-
lation within the organizational boundary.
Soft handoffs can be handled and streamlined by soft attribute-based tracking. Every handoff has a “from” state
and a “to” state as the workflow is executed. When a “from” state is reached, if a notification is sent to the stake-
holder of the “to” state proactively, inefficiency in the system can be reduced. For example, when “Purchase
Order” is approved in the Supplier Process (refer to Figure 10), a notification can be sent to “Shipping” so that
“Shipping” is triggered without any delay. In case “Shipping” is not triggered within a pre-specified time, a second
notification or alert can be sent to the stakeholder of “Shipping” or even escalated up the hierarchy. If and when
soft handoff is within an organization, the enterprise-wide messaging system of the organization can be used
for this purpose. However, it is possible that the soft handoff happens across organizations or companies. In fact,
we need to pay more attention when soft handoffs cross organizational or company boundaries. Blind spots are
exactly there if we do not track the “soft” attributes.
Hard-attribute based tracking can detect when hard handoffs happen but when the expected handoff does not
happen, it cannot determine why it did not happen. As an example, when say, raw material is “Loaded” on the
delivery truck of 3PL (refer to Figure 10), sensor-based tracking can detect it, but if Loading does not happen,
hard-attribute based tracking cannot determine why it did not happen and hence cannot help take appropriate
action to make it happen. However, soft attribute-based tracking, by virtue of more granular tracking, would know
exactly at what step the workflow got stuck and by messaging the right stakeholder, can make the process move.
Coming back to the same example, the moment “Shipping” is done in the Supplier process (as detected by the
soft attribute-based tracking), if a notification is proactively sent to the right stakeholder of the 3PL for “Contacted”
state (refer to Figure 10) as well as to the corresponding stakeholder of the Supplier organization, it is highly likely
that the stakeholder will take the appropriate steps assigned to him/her, and help move the process, thereby
reducing or eliminating delay. Note that this is an example of soft handoff across organizational boundaries.
One difference between a Hard and Soft handoff is that for the former, messaging must be done across organi-
zations, while for the latter, the messaging needs to be done within an organization (except in the rare cases of
cross-organization soft handoffs). Cross-organizational messaging requires a common messaging platform for
the upstream (Supplier) and downstream (3PL) organizations involved in the Hard handoff. That may not always
exist. In that case, it may make sense to notify the right stakeholder of the upstream organization (Supplier) using
enterprise-wide messaging so that the upstream organization can follow through with the downstream organi-
zation (3PL) in case the downstream organization does not execute the respective step in time. In the context
of the example being discussed, if 3PL does not respond in time, the stakeholder from the Supplier can follow
By virtue of more granular tracking, [you] would know exactly at what step the workflow got stuck and by messaging the right stakeholder,
can make the process move again.
“”

© 2020 Cloudleaf | All rights reserved | 20200505 13A HOLISTIC APPROACH TO SUPPLY CHAIN VISIBILITY WHITEPAPER
TM
through with the stakeholder of the 3PL in order to avoid delays. The same process can be followed between the
3PL and the Factory; between the Factory and the Warehouse; between the Warehouse and the Outgoing 3PL;
and between the Outgoing 3PL and the Distribution Center during Hard handoffs, making the end-to-end process
streamlined, thereby reducing inefficiency dramatically and improving the overall experience of various stakehold-
ers in the supply chain.
Further Optimizations Leveraging the Power of AI/ML
Let us revisit the concept of “Inbound Edge” and “Outbound Edge” and specifically focus on hard handoffs. The
chances of delay and inefficiency with hard handoffs are higher compared to soft handoffs, assuming every or-
ganization is efficient in executing its own processes. Since an “Outbound Edge” triggers a set of actions starting
with the “Inbound Edge” of the next downstream functional entity, it would make sense for the Outbound Edge
to give “advance” notification to the Inbound Edge and help it get ready ahead of time. This will further stream-
line the process. For example, if the Outbound Edge, namely the “Delivered” step of Inbound Logistics Process
(refer to Figure 10) informs the Inbound Edge, namely the “Received” step of Factory Process ahead of the actual
delivery, the receiving process of Factory can be triggered and the equipment and workers at the receiving dock
of the Factory can be ready to receive and move the supplies to the appropriate location within the Factory for
processing without losing any time.
The question is, how does AI/ML help in this process? With the introduction of both hard and soft attribute-based
tracking, a tremendous amount of data will be collected, not only within a functional entity/organization, but also
across organizations. That data can be analyzed using traditional AI/ML techniques to do predictions with a fair
amount of accuracy. For example, it is highly likely that the lead time to deliver supplies by the 3PL entity to the
Factory can be estimated with good accuracy, and an ETA can be provided to the “Receiving” side of the Factory
so that the appropriate resources can be lined up “just in time.” Of course, the Receiving side should be ready for
the Delivery from 3PL but should not be ready so much ahead of time that the resources are tied up when they
could be used elsewhere. Thus, “just in time” readiness is important and that is best achieved by making prudent
use of AI/ML algorithms for better estimation of ETA.
The above is just an example of estimation. Assume an ETA is being provided proactively at every step within a
functional entity as well as across functional entities, and “just in time” readiness is implemented at every step in
every process. While this might be a simplistic view of the complex supply chain processes, the fact remains, if we
implement the concept of ETA at intermediate steps in an incremental manner, we can realize business benefits
“incrementally” by reducing OPEX step by step, and that can be a journey and not a one-time exercise.
Once a company is able to optimize the operations in its supply chain, leveraging the power of hard and soft attribute-based tracking powered by AI/ML,
it can potentially offer that as a service to other companies in the industry and create a new revenue stream.
“”
© 2020 Cloudleaf | All rights reserved | 20200505 14A HOLISTIC APPROACH TO SUPPLY CHAIN VISIBILITY WHITEPAPER
TM
Optimized Supply Chain and New Revenue Stream
While we focused purely on cost savings by streamlining the processes within a supply chain, there are opportu-
nities for new revenue generation as well. By virtue of higher efficiency, Suppliers and 3PL companies will be able
to serve more customers with the same resources, and thereby generate additional revenue. By the same token,
assuming steady demand, Factories will be able to produce more finished goods leading to higher revenues for
the company.
Once a company is able to optimize the operations in its supply chain, leveraging the power of hard and soft
attribute-based tracking powered by AI/ML, it can potentially offer that as a service to other companies in the
industry and create a new revenue stream.
Summary
In this article, we have defined a framework to capture visibility in a supply chain from both hard attribute and
soft attribute perspectives, described a process for computing what is called Visibility Index and defined a way
of categorizing enterprises into four broad categories based on their Visibility Index. Keep in mind that contextual
attributes are also an essential part of how companies manage their supply chains. It’s critical that companies
understand what’s occurring both inside and outside of their supply chain so that they can successfully manage
suppliers, parts, sites and products. Organizations need to pay close attention to news and trends (e.g., industry
trends, trade disputes, tariffs, logistics, new technology such as drones, etc.) when identifying and managing risks
for each component of their supply chain. Taking hard and soft attributes into account, 90% of companies are in
the lower left (Basic) quadrant. But, with the right investments those same 90% can move to the upper right
(Advanced) quadrant. If net profit on sales is 5%, net profit can be doubled if supply chain costs can be reduced
from 9% to 4% (or from 12% to 7%) and our claim is, it is highly achievable as a company moves from the lower left
to the upper right quadrant of the Visibility Index chart. This is the big attraction and importance of cost reduction
in a supply chain: profits can be increased without having to increase sales. In the process of defining the frame-
work for Visibility Index, we laid the foundation for a digital twin of a supply chain that captures and depicts the
state of a supply chain in real time, helping in agile decision making and risk mitigation. Finally, we argued that a
Visibility Index is a means to an end, where granular and ground-truth based visibility can help enterprises close the
gap between planning and execution, creating what we refer to as the Next Generation Supply Chain.
About the Authors
Sanjoy Paul is an innovator, disruptive entrepreneur, and an industry-recognized expert in AI & IoT.
Prof. Hau Lee is a Professor at Stanford University Graduate School of Business and Co-Director of the Value Chain Initiative.
Mahesh Veerina is a seasoned Silicon Valley entrepreneur, technology executive and investor and is the President and
CEO of Cloudleaf.
Learn more at cloudleaf.com