Embed Size (px)
Citation preview

W H O ADOPTS TOTAL QUALITY MANAGEMENT (TQM): THEORY A N D AN EMPIRICAL TEST
JOHN M. BARRON Purdue University
West Lafayette, IN 47907
KATHY PAULSON GJERDE W . Averell Harriman School for Management and Policy
State University of New York Stony Brook, NY 11794
The recent emergence of total quality management ( T Q M ) in the U.S. has spawned a great deal of interest in management circles as well as i n the mass media. However, despite the growing number of firms that have adopted this management technique, few formal tests exist concerning the pattern of adop- tion as well as the changes that accompany the adoption of TQM. This paper contrasts models of production for TQM and non-TQM firms i n order to explore reasons w h y some firms but not others have adopted the TQMapproach to quality improvement. Predictions arisingfrorn such a comparison are tested using a unique data set that combines data on firms from three different suurces. O u r findings tend to support the proposed theory of systematic differ- ences between firms that find it advantageous to adopt TQM and firms that do not. We also find evidence that firms adopting TQM experience greater growth in sales, employment, and capital stock.
1. INTRODUCTION
The new buzzword in management is "quality." Firms such as Moto- rola, Xerox, and Federal Express have adopted company-wide "qual- ity efforts." Government agencies as diverse as the Norfolk Naval Shipyard and the Department of Labor's Bureau of Labor Statistics are implementing programs to ensure "product quality."' But what exactly is the appeal of "total quality management" (TQM)? Despite the current emphasis on quality in the management literature, few
We would like to thank Steve Green, Dan Kovenock, Jerry Thursby, the referees, and a coeditor for their very helpful comments and suggestions.
1. Examples of the implementation of TQM at various American manufacturers and the results in terms of cost savings and improved quality are contained in J. Dreyfus, "Victories in the Quality Crusade," (Fortune, 118 (October 10, 1988): 80-81) and J. H. Sheridan, "America's Best Plants," (Industry Week, 239 (October 15, 1990):27-64).
Q 19% The Massachusetts Institute of Technology. Journal of Economics & Management Strategy, Volume 5, Number 1, Spring 1996, 69-106

70 Journal of Economics & Management Strategy
theoretical models have been developed in economics that specifically address the use of TQM practices. Does TQM simply encompass a new set of buzzwords for standard practices, or does TQM represent a significant change in the way production is organized?2
To fully model TQM would be a daunting undertaking, one be- yond the scope of this paper, Our more modest aim is to incorporate several key features of TQM into a simple production framework. Within this framework, we address two questions: Why have some firms but not others adopted the TQM approach? What changes with respect to growth in employment, net sales, capital stock, and market value accompany the adoption of TQM? To begin to address these two questions, Section 2 develops a production model in which a generic defect rate can only be reduced by traditional quality-improve- ment efforts, such as rework and inspection. Section 3 introduces into the production model an additional "TQM' option for reducing defects. This option differs from traditional quality-related efforts in three important ways:
1. The TQM approach to quality improvement is to prevent defects
2. The TQM approach achieves quality improvements through the
3. Adoption of the TQM approach to quality improvements requires
The training costs occur in part because workers in a TQM team envi- ronment are given extensive decision-making powers concerning the allocation of their efforts across various tasks. Effective decisionmak- ing requires the principal to provide the now empowered workers with costly training concerning management tools.
Section 4 contrasts the models developed in Sections 2 and 3 in order to identify various factors that can explain why some firms but not others have embraced TQM. The general approach taken follows the analyses of technological innovation by Mansfield (1968), Davies (1979), Oster (1982), Hannan and McDowell(1984), Levin et al. (1987), and Rose and Joskow (1990), among others. Namely, we argue that TQM adoption will be by firms whose circumstances suggest a posi- tive net return to such an a d ~ p t i o n . ~ One set of predictions is that
rather than correct defects.
forma tion of "teams ."
substantial training costs.
2. TQM is sometimes referred to as CQI for continuous quality improvement. 3. In contrast to recent empirical studies concerning the diffusion of new technolo-
gies, we clearly are focusing on a different type of innovation. While many of these studies consider innovations in the context of physical capital, we focus on a more abstract type of innovation, namely a new "technology" for managing an organization.

Who Adopts Total Quality Management 71
TQM is more likely to be adopted by firms that are larger, have less turnover, and have greater access to internal financing. The common reason for these predictions is that TQM is an innovation that involves a substantial fixed investment in workers, and such an investment is less costly for larger firms (economies of scale), for firms with a more stable workforce, and for firms that can finance the training using less costly internal funds.
It is also predicted that TQM is more likely to be adopted when the proportion of defects introduced ”in house” is greater. The reason for this is that TQM can be viewed as an investment that improves quality by training workers to prevent, rather than correct, defects. Because prevention requires the direct control of workers involved in the production process, the more production is done in house, the greater the return to TQM investments in a firm’s workforce. Finally, we show that, under certain conditions, TQM is more likely to be adopted by firms that place a higher value on quality and by firms that produce output characterized by a greater base defect rate. Here, the theory is particularly useful in identifying why the advantage to adopting TQM does not unambiguously rise with an increase in the value a firm places on quality or with an increase in the base defect rate.
Section 5 tests the above predictions concerning who adopts TQM. A unique data set is constructed that combines firm-level data on management adoption of TQM from COMPACT DISCLOSURE, firm- level data on financial variables from Cornpustat, and industry data on worker turnover from the Current Population Survey. Section 5 also compares the rates of growth in net sales, as well as employment, capital stock, and market value, of firms that have adopted TQM with those of firms that have not. Section 6 summarizes our findings. To anticipate, we find a pattern to the adoption of TQM consistent with the predictions of the simple production models described in Section 4. Further, greater rates of growth in employee size, capital assets, and net sales accompany the adoption of TQM. In the conclusion, we discuss potential extensions to the analysis. At the forefront of these extensions are key incentive issues that arise in a team production setting.
2. A SIMPLE PRODUCTION MODEL
Suppose a principal employs n identical risk-neutral agents, indexed by i = 1,2, . . . , n, and that agent i divides her time between two

72 Journal of Economics & Management Strategy
tasks or action^.^ Action uiy 2 0 affects the units of output produced. Action uiq 2 0 incorporates traditional quality-related actions that re- duce defects. Each agent is characterized by the following utility func- tion, which is additively separable in income and effort:
Ui(wi, ai) = w; - (ai)&, i = 1,2, . . , , n,
where a, = ajy + uiq is the total effort of agent i, and w, denotes the wage paid to agent i. We assume that 4 > 1, indicating that there exists a rising cost to devoting additional total effort to quality-related and quantity-related actions. Note that eq. (1) captures a key interac- tion concerning actions taken by each agent, specifically that an in- crease in the level of one activity raises the marginal cost of other activities.
The principal’s return depends on the quantity and quality of goods or services produced by the n agents. With respect to the quan- tity produced, we assume a simple, linear production function. The total quantity produced from the combined actions of the n agents is thus given by
where ay = aly + a2,, + + any, and 6 is a positive constant. With respect to the quality of the good or service produced, there are at least two potential dimensions for ”defective” output. One is that the delivered product fails to perform as advertised or the service is below expectations. A second is that the product or service is delivered past the promised delivery date.5 Let D denote the rate at which such defects occur, and let €3 denote the “base rate” of defects if no quality- related actions are taken.6 The likelihood that a defect is corrected through traditional quality-related actions aiq ( i = 1, . . . , n) is given by p . In particular, we assume that p = p(aq), where aq = := lajq/
4. Naturally, the homogeneity assumption implies that agents are equally able. In the conclusion, we discuss an extension that would incorporate heterogeneous agents in the model.
5. Note that both quality dimensions have the common theme that customers’ ex- pectations have not been met.
6. Our characterization of quality simplifies the analysis in a number of ways. First, while there could be varying degrees of quality, we presume that customers perceive a product as being either good or bad. In this context, it follows naturally that quality is analogous to the likelihood that a product is not defective (bad). Second, although individual perceptions of what is a high-quality product often differ, we assume there are no differences among customers or between a firm and customers with regard to whether a particular product is good or bad. Finally, there are no random components to defects. One could assume, for instance, that the base defect likelihood is a random variable with 0 < 4 5 B 5 b < 1.

Who Adopts Total Quality Management 73
:=lai is the proportion of total work effort across the n agents de- voted to traditional quality-related action^.^ We assume that p ( 0 ) = 0, p r > 0, and p” < 0. Thus, the likelihood of a defective product or service, D, is given byR
D = B[1 - p ( ( ~ ~ ) ] . (3)
It might be helpful at this point to provide some interpretation as to how traditional quality-related actions affect the defect rate D.
In the context of delivery time, reducing the likelihood of late delivery means taking time away from the production of output for sale. For some firms, this time is used either to maintain inventory holdings of the finished product in anticipation of future customer requests or to expedite the shipment of those orders discovered to be behind schedule. Naturally, maintaining inventories or devoting special attention to late shipments means fewer delays in responding to customers’ requests (less defects), but at the cost of less production of goods offered for sale (less output). For other firms, such as those providing services, the time away from the production of output for sale takes the form of an inventory of ”labor,” or workers who are not “fully utilized.” These workers, thus, are available to reduce delays in responding to customer requests, making such delays less likely (i.e. fewer defects). For instance, in the airline industry, ticket agents may spend a certain fraction of their time as ”floaters,” filling in as needed.
In the context of performance, traditional actions by agents that can directly achieve an increase in p include the testing of completed products for defects and the fixing or “reworking” of those products discovered to be defective. Note that a key feature of traditional qual- ity-related efforts is their focus on correcting defects after production. In some cases, such costly actions are taken in response to implicit warranties provided by the producer. For instance, if a service pro- vided is defective, one can “fix” it by offering additional services. Thus, restaurants offer to recook your steak if it is underdone.
7. By assuming that p is a function of the proportion of total work effort across the n agents devoted to traditional quality-related actions instead of the level of this effort, the analysis is simplified in that, for a gwen level of effort and homogeneous agents, the number of agents does not affect the likelihood a defect is corrected through traditional quality-related actions. We discuss the implications of relaxing this assumption in a later section.
8. Note that the assumption of a rising cost to devoting additional effort to quality- related and quantity-related actions (4 > 0) limits the total effort expended. Holding total effort constant, the assumption of a linear production function for output and diminishing returns to quality-related actions implies a rising cost to devoting additional effort toward quality.

74 Journal of Economics & Management Strategy
The objective of the principal is to maximize expected net reve- nue. In the simplest case, the principal is perfectly informed as to each agent's quality and quantity actions, so that only individual rationality constraints appear in the principal's maximization problem.' Let the nonnegative parameter p reflect the extent to which the likelihood of a defective product reduces the revenue obtained per unit sold. That is, the net revenue per unit of output is given by 1 - PD, so that an increase in the likelihood of a defect, D, reduces net revenue by the amount p times the increase in the defect rate. In the context of perfor- mance defects, the reduction in net revenue reflects the fact that the price, and thus net revenue, is lower for a product that is more likely to be defective. In the context of delivery-time defects, an increase in the probability of a defective product (late delivery) similarly reduces net revenue by lowering the price consumers are willing to pay for a product that is less likely to be delivered on time. For both perfor- mance and delivery-time defects, the lower (net) price may reflect the fact that the producer must rebate part of the initial sale price if the product is defective.
Let v" denote the maximal profit for the principal when employ- ing only the traditional approach to improving quality; then
n
v" = max (1 - PD) Y - wi(.) ag.a,q'w, 1 = 1
1 = 1 , . . . ,n
(4)
with
wi(*) - (a,)+ 2 0,
ai,, 2 0 and aiq 2 0,
i = 1, . . . , n,
i = 1, . . . , n,
where D = B[1 - p(aq)], Y = Say, aq = 2 :=luzJx and al = u,,, + a,(! ( i = 1, . . . , n). Note that expected net revenues, (1 - p D ) Y , depend directly on the quantity produced (Y) and inversely on the likelihood of a defective product ( D ) .
3. THE ALTERNATIVE TQM APPROACH TO PRODUCTION
In order to determine whether or not to adopt TQM, the principal compares V" with the maximal steady-state profit if both traditional
9. We could assume that the principal receives (noisy) signals on a% and a,, i = 1,2, . . . , n, represented by szz = a,= + el=, i = 1,2, . . . , n, z = y, q, where E, , is distributed normally with mean 0 and finite variance ufz. Given risk-neutral agents, however, the first-best outcome still could be achieved through an appropriate compen- sation package based on the signals provided.

Who Adopts Total Quality Manngement 75
and TQM quality-related efforts are adopted. This section develops an expression for this TQM-generated maximal steady-state profit. To do so, we start with a review of four commonly cited principles that TQM embraces according to the management literature'':
1. Respond to the desires of customers by providing reliable, high- quality products-or, as often stated in the TQM literature, "know and meet the needs of the customer."
2. Rely on teams of workers that draw on the collective expertise of their members to increase quality through "process improvement." Allowing workers to directly influence how output is produced is sometimes referred to as the "empowerment" of workers.
3. Provide initial training in the following three areas: (1) statistical and problem-solving techniques useful if empowered workers are to make informed decisions concerning the measurement and cor- rection of defects, (2) "cross training" to increase workers' flexibil- ity in production as well as their ability to discern ways of improv- ing quality, and (3) explanations of the TQM approach (including "TQM success stories") to encourage the full participation of workers.
4. Provide ongoing "refresher" training as well as opportunities for team members to build and maintain working relationships with one another. These activities, in conjunction with appropriate com- pensation schemes, ensure that workers take into account how their quality-related actions within teams directly benefit the group and indirectly benefit themselves. The "total quality" of TQM means that all employees be involved in quality improvement.
As noted in the introduction, to fully model the above four as- pects of TQM would be a substantial undertaking, one beyond the scope of this paper. Our more modest aim is to modify the previous model of production to incorporate key features of the four principles of TQM mentioned above, with the ultimate goal of generating testa- ble hypotheses with regard to the adoption of TQM. One key feature of TQM, suggested by the first two principles outlined above, is the introduction of a new means of enhancing the quality of the good produced. As the description of TQM indicates, these quality im- provements typically arise from the collective action of the n agents as given by at = In?=, ( u , ~ / u ~ ) ] ~ ' ~ , where al l , i = 1, . . . , M, is the time
10. The gurus of TQM include W. Edward Ueming, J. M. Juran, and Philip 6. Crosby. While they differ slightly in how they describe TQM, there are common themes to the 14-point programs of Deming and Crosby. The four points below summarize these common themes and closely parallel discussions in Banks (1989), Talky (1991), and Evans and Lindsay (1993).

76 Journal of Economics & Management Strategy
contribution of worker i to the team, and u, = ury + u14 + Note that the functional form chosen for af (specifically, the fact that a2at/ adl t aa,, > 0, i f j ) captures the complementarities inherent in team production in that a given total work effort across the IZ agents achieves the greatest at if the n agents share TQM tasks equally. The potential value of team-based quality improvements likely arises for the same reasons as those cited by Jensen and Meckling (1992) to explain the gains to organizing a firm: "Bringing diverse knowledge together to bear on decisions significantly expands the opportunity set because no one person is likely to possess the set of knowledge relevant to a particular decision" (p. 260).
The second TQM principle listed above suggests not only that quality improvement is team-based, but also that it depends on "pro- cess improvement." As one interpreter of Deming's views notes, "In- spection is too late, as well as ineffective and costly. . . . Quality does not come from inspection, but from improvement of the process."12 In other words, while traditional quality-related actions focus on the correction of defects, TQM focuses on the prevention of defects. To introduce this type of quality improvement, assume that the fraction K of total base defects (BY) are outside the control of the n agents, and thus can only be corrected by the traditional quality-related efforts of testing and rework. The remaining fraction 1 - K of base defects, on the other hand, are assumed to be introduced by the n workers during production. As such, they can be corrected either by traditional quality-related efforts or, more importantly for our purposes, by TQM prevention efforts. In particular, let 8(at) denote the likelihood such defects are avoided through team actions associated with TQM. We assume that 8(0) = 0, 8' > 0, and 8" < 0. Thus, the defect rate with the addition of TQM practices is given by
D = B { K + (1 - K ) [ 1 - 8(at)]}[1 - p(a,)] . (5) Naturally, if TQM is not adopted (8 = 0), eq. (5) is identical to eq. (3).13 As in our discussion of traditional quality-improving actions, it
11. By assuming that quality improvement is a function of the proportion of total work effort across the n agents devoted to TQM quality-related actions instead of the Ievel of this effort, the analysis is simplified in that, for a given level of effort and homogeneous agents, the number of agents does not affect the likelihood a defect is corrected through TQM quality-related actions. We discuss the implications of relaxing this assumption in a later section.
12. Gitlow and Gitlow (1987). 13. Note that TQM actions, because they focus on process improvement as a means
of increasing quality, could be viewed as generating a "stock" of capital that leads to reduced defects in future as well as current production. For simplicity, we ignore this complication by focusing on a single "period" over which production occurs. In adopt-

Who Adopts Total Quality Management 77
might be helpful at this point to provide some interpretation as to how TQM actions affect the defect rate D.
In the context of improving on-time delivery, the above TQM actions that generate 8 > 0 can be interpreted as the formation of a "work team.'' Within a work team, there is "cross-training" that per- mits a more flexible assignment of tasks. Such flexibility allows work- ers to shift more easily among production stages to minimize bottle- necks that can arise in a production process and thus reduce delays in the delivery of output. Note, however, that such actions by the work team cannot address the fraction K of base defects that arise from production outside the n workers, for instance a delay in the shipment of parts from a supplier or a delay in the performance of a service by a ~upp1ier.l~
In the context of reducing performance defects, TQM team ac- tions can be interpreted as the formation of a "cross-function team." Such cross-function teams can provide new insights into how changes in one aspect of a production process can lead to reduced defect intro- duction in the overall process. Obviously, the production process may refer to the creation of either a good or a service. Note, however, that such actions are by their very nature restricted to the production activities that the n workers art engaged in, and cannot directly ad- dress the fraction K of base defects that arise from production activities done by non-team-members, for instance defects in parts delivered by an outside supplier.
The third above-cited principle of TQM is the requirement of substantial initial costs to train and indoctrinate workers. Much of the initial training associated with TQM is to introduce agents to problem- solving tools such as process mapping, fishboning, and statistical pro- cess control (SPC). In addition, initial training costs include the costs of training workers to do tasks typically done by other agents (cross training). As noted above, such cross training increases flexibility in work teams as well as facilitates agent decision-making, since resource allocation decisions must be made by team members. Let T ( n ) denote
ing a "static" model of TQM, we understate the benefits of TQM that would arise in a dynamic model that incorporates the future anticipated gains in quality induced by the current adoption of TQM.
14. Naturally, the adoption of TQM typically involves efforts to improve the quality of parts supplied by vendors. Our assumption that the adoption of TQM by a film does not alter the quality of external suppliers captures the idea that the reward to the investment in TQM is greater for workers at the firm initiating the training investment than among the workers of the external suppliers. Thus, as we will see, the greater the extent of production a t the firm (the lower K ) , the greater the gain in adopting TQM.
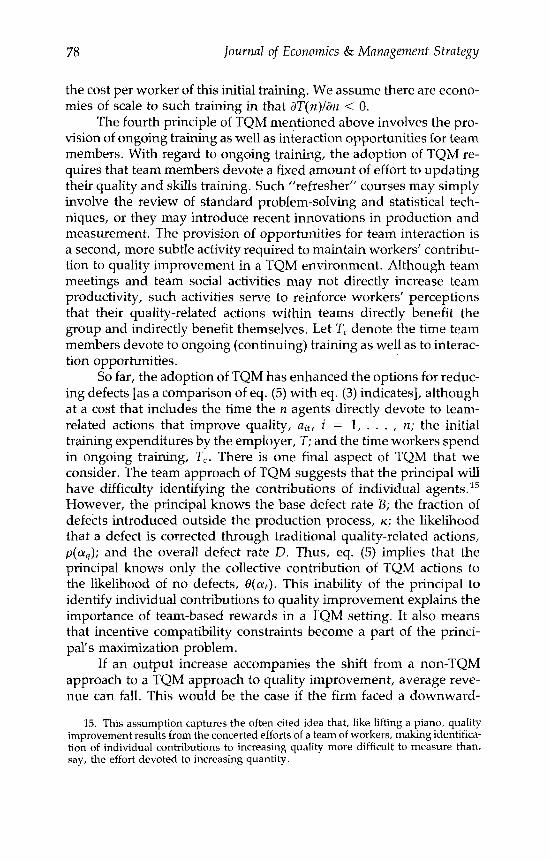
78 Journal of Economics & Management Strategy
the cost per worker of this initial training. We assume there are econo- mies of scale to such training in that dT(n)/& < 0.
The fourth principle of TQM mentioned above involves the pro- vision of ongoing training as well as interaction opportunities for team members. With regard to ongoing training, the adoption of TQM re- quires that team members devote a fixed amount of effort to updating their quality and skills training. Such “refresher” courses may simply involve the review of standard problem-solving and statistical tech- niques, or they may introduce recent innovations in production and measurement. The provision of opportunities for team interaction is a second, more subtle activity required to maintain workers’ contribu- tion to quality improvement in a TQM environment. Although team meetings and team social activities may not directly increase team productivity, such activities serve to reinforce workers’ perceptions that their quality-related actions within teams directly benefit the group and indirectly benefit themselves. Let T, denote the time team members devote to ongoing (continuing) training as well as to interac- tion opportunities.
So far, the adoption of TQM has enhanced the options for reduc- ing defects [as a comparison of eq. (5) with eq. (3) indicates], although at a cost that includes the time the n agents directly devote to team- related actions that improve quality, alt, i = 1, . . . , n; the initial training expenditures by the employer, T; and the time workers spend in ongoing training, T,. There is one final aspect of TQM that we consider. The team approach of TQM suggests that the principal will have difficulty identifying the contributions of individual agents. l5
However, the principal knows the base defect rate R; the fraction of defects introduced outside the production process, K ; the likelihood that a defect is corrected through traditional quality-related actions, p ( a $ ) ; and the overall defect rate D. Thus, eq. (5) implies that the principal knows only the collective contribution of TQM actions to the likelihood of no defects, €!(a,). This inability of the principal to identify individual contributions to quality improvement explains the importance of team-based rewards in a TQM setting. It also means that incentive compatibility constraints become a part of the princi- pal’s maximization problem.
If an output increase accompanies the shift from a non-TQM approach to a TQM approach to quality improvement, average reve- nue can fall. This would be the case if the firm faced a downward-
15. This assumption captures the often cited idea that, like lifting a piano, quality improvement results from the concerted efforts of a team of workers, making identifica- tion of individual contributions to increasing quality more difficult to measure than, say, the effort devoted to increasing quantity.

Who Adopts Total Qualify Management 79
sloping demand curve for its product. We capture this aspect by as- suming that if TQM is adopted, V T a M includes a potential reduction in average revenue g (A MY"), which depends directly on the relative increase in the number of units produced over the non-TQM level, A Y/Y", where A Y = Y - Yo. Note that g' 2 0. Then V T a ~ , the maxi- mal steady-state profit if the principal adopts both traditional and TQM quality-related efforts, is given by
with
w2(-) - (a2 + T')+ 2 0, i = 1, . . . , p z ,
i = 1, . . . , n,,
i = 1, . . . , n,
ait = argmax zui(.) - (a, + Tc)+,
uiy 2 0, and nit 2 0, uj,, 2 0,
where D = B{K + (1 - ~ ) [ 1 - O(a,)]}[l - p ( a q ) ] , Y = 6a,, aq = ~ ~ ~ l a , , / ~ , n ~ l a i , at = [ IX=~(U,JU;) ]~ '~ , and ai = ai, + aiq + ait ( i =
1, . . . , n). The expression (6) indicates that the total effort provided by agent i, uiy + ai, + uit + T,, now incorporates not only efforts associated with the production of output (a;,,) and traditional quality- related tasks (ui,?), but also efforts devoted to new TQM quality-related tasks and training (nil + Tc). The expression (6) also includes two new "steady-state" TQM training-cost terms. The first, r( y)nT( z), reflects the real interest payments associated with the financing of initial total training costs nT(n). The real interest rate r ( y ) on the funds acquired to finance these training costs is assumed to depend on the term y, which denotes the proportion of initial training costs financed using internal funds. As numerous studies suggest, informational asymme- tries can lead to higher financing costs for external funds than for internal funds.16 It follows that an increase in internal funds available to finance initial training costs, indicated by an increase in y, will reduce the real interest rate r ( y ) , so that dr(y)/ay < 0. The second training-cost term in eq. (6), 77pzT(n), reflects the costs of training the qn new workers hired each period, given a constant turnover rate of 7).
16. See, for instance, Jaffee and Russell (1976), Stiglitz and Weiss (1981), Myers and Majluf (1984), or Gale and Hellwig (1985).

80 Journal uf Economics & Management Strategy
A comparison of eqs. (4) and (6) illustrates three key elements of adopting TQM. The first is the role of TQM in preventing rather than correcting defects. The second is the initial and ongoing training costs inherent in the adoption of TQM. Finally, TQM is introduced as a team production process. This distinction appears in the form of incentive compatibility constraints in eq. (6), as the principal cannot observe the effort of individual members of quality teams, but only the overall reduction in the defect rate generated by the team, 8.
4. THE ADOPTION OF T Q M
To generate testable hypotheses associated with the adoption of TQM, we simplify by assuming that team quality-related actions sit, i =
1, . . . , n, are observable by the prin~ipa1.l~ In this case, the incentive compatibility constraints in eq. (6) are not binding. Although such an assumption eliminates key incentive issues that can arise, it facilitates a restatement of the problem in terms of aiq = aiq/ai (the proportion of work effort spent in traditional quality-related activities), ajt = sit/ ui (the proportion of work effort spent in TQM activities), and ai (the total work effort), a restatement that clarifies the quantity-quality tradeoff. Specifically, the VTQM expression (6) becomes
with
wi(.) - (ai + Tc)+ 2 0,
aiq 2 0, and ait P 0.
i = 1, . . . , n,
i = 1, . . . , n, ui 2 0,
where D = B{K + (1 - ~ ) [ 1 - 8(at)]}[1 - p(cy4)], Y = S[ci.=, (1 -
17. Given no adverse selection problem [such as in McAfee and McMillan (1991)], no collusion among members [such as in Itoh (1991)], and no moral hazard on the part of the principal [such as in Gaynor (1989)], there is a simple incentive scheme that provides the identical solution to the problem below even if the principal cannot directly observe the quality-related team actions of individual workers. This incentive scheme provides each team member with 100% of any change in the tram output, providing appropriate team effort incentives, and subtracts from such payments a fixed amount so that agents' individual rationality constraints are met with equality. However, such an outcome cannot be achieved if we introduce measurement error in observing team output and risk-averse workers. We discuss the implications of this later in the paper.

Who Adopts Total QuaZity Management 81
alt - azq)az]r aq = c :=ic~q~lIC := l a z , and at = (II:=,a,t)l'n. Differen- tiating the objective function in eq. (7) with respect to the choice vari- ables and invoking symmetry so that the optimal choice of effort is identical for each of the n identical agents, we derive the following first-order conditions which characterize18 the optimal set of actions for the representative agent i(a:, a& a;):
A Y* [l - PO" - g (yo)]s (1 - a: - a$)
Y" - g'6 (1 - a$ - a&) 7 - 4(aT + T$-' = 0, (8) Y
8p g'6a: ( P B [K + (1 - ~ ) ( 1 - 8*)] - + -
aaiq y"
where D", Y", p", 8*, and AY" denote D, Y, p , 8, and A Y evaluated at the set of optimal actions (a:, a&, az), i = 1, . . . , n. Equation (8) defines the optimal choice of work effort (total time net of ongoing training effort T,) as the effort that equates the marginal effort cost to the worker to the gain in revenue from the sale of the additional output produced. Equation (9) indicates that the optimal choice of traditional quality-related efforts by each agent (expediting deliveries, testing, and rework) weighs the loss in revenue from the sale of fewer units of output against the gain in net revenue from the sale of higher- quality output. Similarly, eq. (10) indicates that the optimal choice of
78. We assume sufficient concavity that the problem has a unique solution. In addi- tion, we assume the nonnegativity constraints on various quality-related efforts are not binding. From eqs. (8) and (9), we can see that positive TQM actions require that initial TQM actions must be substantially more productive than additional traditional quality- related actions [i.e., O'(O)(l - ~ ) ( 1 - p ) > p ' ] for this to be the case. Finally, note that symmetry across agents implies that p and O are independent of the number n of employees; specifically, p(aq) = p(a,) and O(af) = 8(ajf) , since, by symmetry, a, = ~ , ' = I r u i q a J ~ , L , a i = miq and at = (rI:2==,a;t)1"i = sit.
82 Journal of Economics & Management Strategy
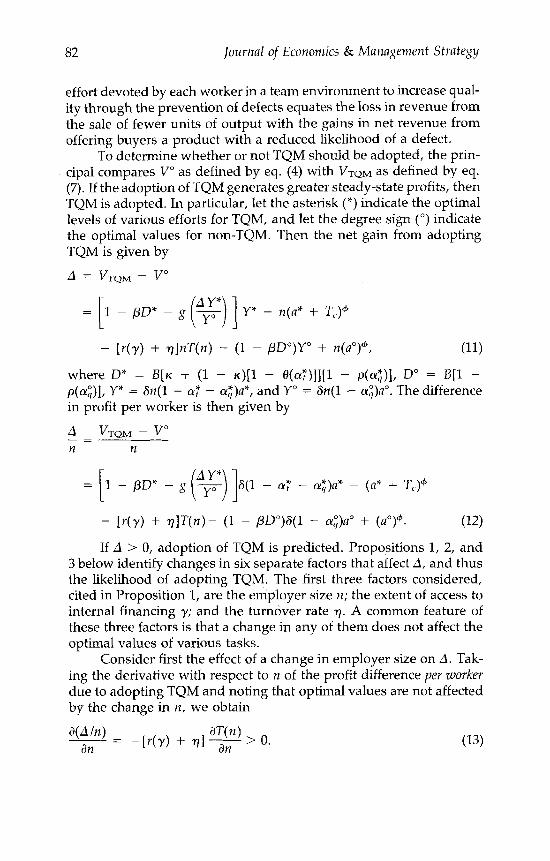
effort devoted by each worker in a team environment to increase qual- ity through the prevention of defects equates the loss in revenue from the sale of fewer units of output with the gains in net revenue from offering buyers a product with a reduced likelihood of a defect.
To determine whether or not TQM should be adopted, the prin- cipal compares V" as defined by eq. (4) with VTQM as defined by eq. (7). If the adoption of TQM generates greater steady-state profits, then TQM is adopted. In particular, let the asterisk (") indicate the optimal levels of various efforts for TQM, and let the degree sign (") indicate the optimal values for non-TQM. Then the net gain from adopting TQM is given by
A = Vt~h .1 - v"
- [r(y) + q]nT(n ) - (1 - pD")Y" + rz(a")'#', (11)
where D" = B [ K + (1 - ~ ) [ 1 - 8(a : ) ] ] [ l - p(cyq*)], Do = B[1 - p(aG)l, Y* = 6n(l - a: - a:)u*, and Y" = 6n(l - .:)a". The difference in profit per worker is then given by
A VTQM - v" _ - - n n
- [ r ( y ) + T I T ( % ) - (1 - pD")S(l - aG)ao + (ao)+. (12)
If A > 0, adoption of TQM is predicted. Propositions 1, 2, and 3 below identify changes in six separate factors that affect A, and thus the likelihood of adopting TQM. The first three factors considered, cited in Proposition 1, are the employer size n; the extent of access to internal financing 'y; and the turnover rate q. A common feature of these three factors is that a change in any of them does not affect the optimal values of various tasks.
Consider first the effect of a change in employer size on A . Tak- ing the derivative with respect to n of the profit difference per worker due to adopting TQM and noting that optimal values are not affected by the change in n, we obtain

Wlzo Adopts Total Qualify Management 83
Equation (13) indicates that the gain per worker due to adopting TQM rises with employer size, given economies of scale in the provision of the initial training. That is, there is a reduction in the per-worker initial training cost as n increases [dT(n)ldn < 01. Taking the derivative of the profit difference due to adopting TQM with respect to n, and noting that by symmetry the optimal values are not affected by the change in n, we obtain dA A a(A/n)
- - + 11- an n an '
_ - (14)
If 4 2 0, eq. (14) indicates that the difference between VTaM and V" will grow with an increase in n, given d(A/n)/dn > 0. If A < 0, the first term in eq. (14) indicates that an increase in n reduces this negative influence on dA/dn. At the same time, economies of scale in initial training expenditures contribute to the potential relative advantage of TQM as the firm grows, as the second term in eq. (14) indicates. It follows that if firms differ only in size and if A is positive for some firms and negative for others, it must be the case that the small firms are the ones with negative A and large firms are the ones with positive A . I 9
Similarly, taking the derivative of the profit difference due to adopting TQM with respect to 77 and y, and noting that the optimal choices of effort are not affected by the change in 7 or y, we obtain dA
d*rl _ - - -nT(n) < 0
19. Note that this size prediction depends on the presumption that economies of scale do not occur elsewhere in the production process. Economies of scale elsewhere are ruled out by our assumptions that output is linear in effort and that the likelihood that a defect is corrected through traditional quality-related actions ( p ) or through TQM actions (0) depends on the proportions of total work effort devoted to these activities across the n agents, not the absolute levels. It has been suggested, however, that there may be economies of scale with respect to some traditional quality-related actions, in particular with respect to inventory holdings. If that is the case, then it will introduce ambiguity concerning the effect of size on the TQM adoption decision. The reason for this is the following. With an increase in size, there would now be an increase in profits per worker exclusive of training costs, given the lower costs of improving quality using traditional quality-related actions that accompany an increase in size. Further, this increase in profits could be greater for a non-TQM firm than for a firm that has adopted TQM, as the non-TQM firm relies solely on traditional quality-related actions to achieve lower defect rates, and thus benefits relatively more from a reduction in the cost of achieving quality improvements by traditional means. On the other hand, as stressed in the text, training costs per worker also fall with increasing size, and this provides an offsetting increase in the profits per worker inclusive of training costs if a firm adopts TQM. The empirical results presented in the next section indicate larger firms are more likely to adopt TQM. This suggests that if both types of economies of scale are present, the economies of scale to training dominate the TQM adoption decision.

a4 Journal of Economics & Management Strategy
and
If firms differ only in 7, or only in y, and if A is positive for some firms and negative for others, then the firms with lower 7 [according to eq. (15)] or higher y [according to eq. (16)] will be ones with positive A . We thus have the following proposition:
PROPOSITION 1 : Employers with a larger number of employees (n) , a lower rate of turnover (q), and greater access to internal funding ( y ) are mure likely to adopt TQM.
Now consider the effect of a change in K , the fraction of total base defects that is outside the control of then agents. For an employer who is initially indifferent to the adoption of TQM, an increase in the fraction of defects preventable by the adoption of TQM (a reduction in K ) , say because a greater fraction of the production of the good is done in house, introduces a positive gain to the adoption of TQM. In particular, we have (by the envelope theorem):
dA d K - = -psO(a:)[l - p(a,*)]Y* < 0.
Note that eq. (17) indicates that an increase in K alters A only by affecting the value of adopting TQM, VTaM. It follows that the effect of a discrete change in K , say a decrease from K O to ~ 1 , on the net gain due to TQM adoption ( A ) is given by
VTQM(KI, ~ 7 ~ 1 ) ) - VTQM(KO, z * ( K o ) )
= VTQM(KI, z* (Ko) ) - VTQM(KO, z * ( K o ) ) + VTQM(KI, z*(KI))
- VTQM(Klr z*(KO))i (18)
where z*( K ) denotes the vector of optimal values (a*( K ) , a:( K ) , a,*( K ) )
associated with K , the fraction of total base defects that is outside the control of the n agents. From eq. (17), the difference between the first two terms on the right side of eq. (18) is positive given ~1 < K O . The definition of z * ( K ) as the set of optimal value implies that the difference between the second two terms on the right side of (18) is positive as well. Thus, the net gain due to adoption of TQM is greater the smaller is K . To illustrate this result for discrete changes in K , we simulated

Who Adopts Total Quality Management 85
FIGURE 2
the effect on A of changes in K when other variables are optimally chosen.20 Figure 1 depicts the results.
In Figure 1, the horizontal axis measures the proportion (1 - K) of base defects that can be prevented through the adoption of TQM. The vertical axis measures the difference in profits due to adopting TQM. A firm with a greater fraction of defects preventable by the adoption of TQM, say because a greater fraction of the production of the good is done in house, is more likely to adopt TQM. In this simula- tion, 1 - K* represents the switchpoint between v" and VTaM. At firms for which 1 - K < 1 - K*, one has A < 0, and the principal uses only traditional quality-related measures such as inventories, rework, and testing. But as 1 - K increases, the gain to TQM adoption rises. At firms for which 1 - K > 1 - K*, the net gain to adopting TQM is positive (A > 0), and thus the TQM team approach to quality is adopted. We thus have the following proposition:
PROPOSITION 2: Employers with a greater proportion of base defects that are introduced by the n workers during the production process (1 - K) are more likely to adopt TQM.
Note that we can use Figure 1 to illustrate Proposition 1, namely, the effects of changes in the training expenditures associated with the
20. The simulation and related Figure 1 are based on the following assumptions. Suppose there two agents (n = 2). Let the specific forms of the functions representing the likelihood a nondefective product is produced given quality-related team actions al t and (67, and the likelihood that a defect is corrected through individual quality- related actions ulq and a2, ( p ) , be given by @(at) = 1 - e-f"t and p(a,) = 1 - c h n q , where f and h are constants. Given symmetry, at = alf lal = azflaz and a, = al,lat = U + / U I , where u , ~ , aZq, and a, are the work efforts of agent i in traditional quality-related actions, TQM, and total work effort, respectively. For the illustration, we assume p = 0.9, the base defect rate B = 0.9, f = 20, h = 5, 6 = 1, $ = 6, ongoing TQM training cost T, equal to 0.01, and g = 0. Substituting these expressions into eq. (7), the optimal choice of agents' actions is calculated for values of K ranging from 0.2 to 0.7. We set the steady-state initial training costs ( I . + g)nT(n) so that switching to TQM (VTQM > V') occurs when K < 0.4. For a more detailed explanation of the simulation, see the appendix.

86 Journal of Economics & Management Strategy
adoption of TQM due to changes in employer size, employee turn- over, and the availability of internal funds. Such changes alter the position of the switchpoint. For instance, consider two firms, firm A and firm B. If firm A has less turnover ( T ~ < q ~ ) , in the steady state firm A will have lower training costs associated with the adoption of TQM. The result is that firm A will have a lower switchpoint at which adopting TQM would be profitable.
Now consider the effects of an increase in p, the cost of a defect in terms of reduced net revenue, or an increase in B , the base rate of defects. Note that since p and B enter the principal's problem in the same manner, the effect of a change in B is similar to that of a change in p. Somewhat surprisingly, simulations of the effect of changes in these two variables indicate ambiguity as to whether firms character- ized by a high cost of defects ( p ) or a high base rate of defects (B) would be more or less likely to adopt TQM. One might think such firms would be more likely to adopt TQM, as the improvement in quality achieved by adopting TQM is more highly valued if B (or p ) is high. The reason this may not be the case can be illustrated by focusing on the effect of a change in B on A . Differentiation of eq. (11) indicates that an increase in B results in the following change in the profit difference from adopting TQM:
ad aB - = - P { K + (1 ~ K ) [ 1 - 6(C$)]}[1 - p((Yf)] Y* + p [1 - p(cUG)] Yo.
(19)
Note that in deriving eq. (19), the optimal values of effort are not affected by the change in B, by the envelope theorem. According to eq. (19), a higher base defect rate increases the gain due to adopting TQM if and only if:
(20)
Note that the right-hand side of eq. (20) expresses the total defective sales if TQM is adopted, while the left-hand side expresses the total defective sales if TQM is not adopted.
For a firm indifferent to the adoption of TQM, eq. (20) suggests that a small increase in the base defect rate or cost of a defect ( B or p, respectively) will lead to the adoption of TQM if total defective sales are lower with the adoption of TQM. If output were identical whether or not TQM was adopted (i.e., Yo = Y"), a reduction in total defective sales would be achieved by adopting TQM, because the adoption of TQM reduces the defect rate (i.e., { K + (1 - ~ ) [ 1 -
@(a:)]}[l - ~ ( a : ) ] < 1 - p(al;) given K < 1). In this case, the intuition
[I - p(cU;)] YO > { K + (1 - K ) [ 1 ~ e(a:)]}[i - p ( a ; ) l Y*.

Who Adopts Total Quality Management 87
that a firm with a higher base defect B (or defect cost f 3 ) has a greater gain to adopting TQM is correct. However, the output changes with the adoption of TQM. In fact, as confirmed by simulation exercises, the optimal level of sales typically rises with the adoption of TQM. This follows because, once initial training costs T are incurred, and ignoring ongoing training T,, the adoption of TQM (which combines traditional and TQM quality efforts) allows the workers to achieve improved quality with less total effort. This ability induces firms that adopt TQM to allocate additional effort to increasing quantity. Accord- ing to eq. (19), the higher output that accompanies the adoption of TQM (i.e., Y* > Yo) will reduce the likelihood that an increase in the base rate of defects (B) increases the gain to adopting TQM.
Naturally, one can obtain the prediction that an increase in /3 or B increases the gain to TQM adoption if sales are held constant when moving from the non-TQM case to the TQM case. A less restrictive assumption is to make it (sufficiently) costly for the principal to in- crease sales above the non-TQM level (e.g., make the g' term suffi- ciently large). Alternatively, one can limit the sales increase by assum- ing sufficiently large on-going training costs ( Tc.). A higher T, increases the marginal cost of quantity-related effort and thus diminishes the incentive to channel the effort saved by the more efficient allocation of quality-control effort under TQM into the production of additional units of output. In sum, simulation results support the contention that if one limits the change in quantity-related effort associated with the adoption of TQM, either through sufficiently large g' or ongoing training costs T,, then an increase in P or B can lead to an increase in the gain to adopting TQM. Formally, we have:
PROPOSITION 3: Employers with a higher cost of defects fp) and a higher base rate of defects ( B ) are inore likely to adopt TQM f such an adoption results in smaller total defective sales than would be the case ofherwise.
5. EMPIRICAL EVIDENCE ON TQM
TQM is currently fully subscribed to by a minority of companies in the U.S. Proposition 1 suggests that for some companies, specifically those with high turnover rates, a small number of employees, or few internal funds, the explanation is that the steady-state training costs per employee of adopting TQM are too high relative to the benefits. For other companies, the production process provides small gain to adopting TQM because the proportion of defects introduced by the firms' workers (1 - K) is small. Finally, those firms that have low
88 Journal of Economics & Management Strategy
base defect rate ( B ) or a small loss associated with a defect fP) will be less likely to adopt TQM.”
The predictions of Propositions 1,2, and 3 are tested using data drawn from Standard and Poor’s Compustat Research Files, COMPACT
DISCLOSURE@, and the Current Population Survey. Compustat contains data on most publicly traded companies.” We begin with the full sample of active companies as reported by Compustat, which was 7603 companies in 1992. Restricting the sample to include only compa- nies for which data concerning number of employees, net sales, total assets, total debt, net income, and market value are available for 1992 reduces the sample size to 4875. Finally, limiting the sample to compa- nies for which these data are also available for 1983 results in a sample size of 2297. This reduction in sample size reflects in large part the substantial growth in the number of publicly traded companies over the 10-year period from 1983 to 1992.
To identify TQM firms in the Compustat data set, COMPACT DIS-
CLOSURE is used.23 In the Disclosure Database, financial information is supplemented with management or textual information such as the Management Discussion, the President’s Letter from the Annual Report to Shareholders, and the full text of the financial footnotes from the annual 10-K. In order to determine which companies have
21. Our &scussion views TQM as a management innovation and considers attri- butes of firms that will find such an innovation profitable to adopt. Some have claimed, however, that there was a delay before any U.S. fums adopted TQM. To explain this change in the profitability of adoption of TQM at a particular firm (rather than differ- ences in profitability of adoption by different firms), one could argue that there has been an increasing emphasis on quality that can be traced to the introduction of high- quality goods by Japanese firms. As suggested by Fatehi-Sedeh (1984), one key element that explains this predilection for quality by Japanese producers is the high cost of real estate in Japan. With expensive factory space, Japanese producers faced high costs of holding inventories. To minimize inventory holdings, these producers adopted a ”just- in-time” (J.I.T.) system of production with the stated objective of minimizing setup costs, so that batch sizes for production runs can be small and various outputs can be produced exactly when needed. With minimum or no inventory to fa11 back on, a premium is placed on each unit of product being made right the first time. Thus an important part of the J.I.T. production system is to attain a high-quality product the first time.
22. These companies include public industrial corporations, banks, utilities, and telecommunication companies. The 1992 data are the most recent annual data available on Compustat.
23. The Disclosure Databasee contains financial and management information on over 12,000 public companies. Company data is extracted from annual and periodic reports filed with the U.S. Securities and Exchange Commission (SEC). To file periodic reports with the SEC a company must have (1) at least 500 shareholders of one class of stock; (2) at least $5 million in assets. To be included in the Disclosure Database, a company must also have fiIed an SEC document containing financial data, such as a 10-K, 20-F, or Registration Statement, w i t l n the last 18 months. The set of companies included in the Disclosure Database is very similar to the set included in Compustat.

Who Adopts Total Quality Management 89
implemented TQM, all text fields were searched for the following references to TQM: Total Quality Management, empowered team, continuous quality improvement, continuous product improvement, and continuous process impr~vernent .~~ Those organizations which indicated at least once during the five-year span from 1988 to 1992 that they had adopted TQM or some similar management technique during the 1980s are identified as TQM companies in the Compustat data set. The vast majority of these companies did not report adoption of TQM until after 1988.25 As of the end of 1992, 6.6% of the firms in our sample were identified in this manner as TQM firms.26
Unfortunately, companies that indicated adoption of TQM often did not provide the exact dates of implementation. For instance, it
24. In particular, various COMPACT DISCLOSURE files for the years 1988-1992 were searched for these terms.
25. In fact, only three companies referred to TQM or related concepts in financial statements by management prior to 1988.
26. There are at least two recent studies that have looked at issues associated with workplace transformations. Ichniowski (1990) examines the effects of systems of human resource management (HRM) policies on a company’s performance. The specific prac- tices considered include flexible job design, formal training, workplace communication mechanisms, and a merit-based reward structure, among others. Using data from a 1986 survey covering a sample of COMPUSTAT II manufacturing business lines, he finds that 24.3% of the organizations can be categorized into HRM system “clusters” that include a formal training program. Although this figure is higher than our 7% of all firms adopting TQM, if we restrict our attention to the HRM system cluster that includes a number of TQM practices in addition to a formal training program (system 9), only 10.2% of the business lines are included in this category. This figure is once again higher than our 7%, but Ichniowski’s study includes only manufacturing companies. Restricting our sample to manufacturing firms does generate results comparable to Ichniowski’s, as 10.1% of manufacturing firms in our sample are identified as TQM firms. Osterman (1994) also examines the incidence of innovative work practices (teams, job rotation, quality circles, and TQM). Relying on a 1992 survey of establishments, he concludes that ”it might be reasonable to characterize an organization as ’transformed’ if there are at least two practices in place with 50% or more of CORE employees involved in each. By this definition, 36.6% of the entire sample are of the new breed.” If we focus only on those establishments that cited TQM practices, this figure drops to slightly less than 20%. But this is still substantially higher than our figure of 7% of all firms adopting TQM. Part of the difference likely reflects the fact that our sample focuses on firms that adopted TQM practices in the 1980s, while Osterman’s sample includes more recent converts during the early 1990s. One reason for these later adop- tions of TQM could be that the value of reducing the defect rate ( p ) increases if one’s competitors adopt TQM and achieve lower defect rates. A second reason for this greater adoption rate is that, over time, the risk associated with this innovation may decrease as more and more companies successfully implement TQM. A t l r d possible reason for the difference is suggested by Osterman when he notes that in his survey, ”respond- ents may tend to exaggerate, in the direction of sodally acceptable responses, their actual practices.” In contrast, our measure, as it depends on a public announcement to shareholders from the firm’s top management, likely identifies only those firms that have committed substantial resources to a company-wide adoption of TQM. As the theory assumes that true TQM adoption requires high training costs and the full com- mitment of top management, it is exactly these firms that we seek to identify as TQM adopters in testing the theory.

90 Iournal of Economics & Management Strategy
might be reported that “in recent years, several of our businesses have applied Total Quality concepts to achieve outstanding improve- ments” or ”over the last couple of years, we have been working on a concept entitled Total Quality Management (TQM)” or “we also continued to emphasize Total Quality Management in three key areas: customer service, employee involvement, and product reliability” or “we adopted the stringent criteria of the Malcolm Baldrige Quality Award.” However, there is an important advantage to the above method of identifying TQM companies from reports issued by top management. Namely, it is consistent with the claim that a key re- quirement for the successful implementation of TQM is that it be fully endorsed by top management. As stated by Talley, each of the three most noted experts on TQM (Deming, Juran, and Crosby) ”begins by emphasizing management commitment” (1991, p. 14).
To obtain a measure of the average tenure of employees at firms in the Compustat data set, we consider a 1988 Current Population Supplemental Survey of 24,691 employed workers who provide infor- mation on the number of years they have been working for their pres- ent employer. To match these data sets, companies are classified into twenty industrial ~a t egor i e s ,~~ and the mean tenure response for each category in the CPS survey is used as a proxy for the length of tenure of employees for firms within that classification in the Compustat data set.
Thus, by combining the 1983 and 1992 Compustat data with the CPS data and information extracted from COMPACT DISCLOSURF, we obtain a data set of 2297 companies with the following ten variables: (1) a zero-one dummy variable that equals one if the company reported it had adopted TQM, (2) a proxy for the average length of tenure of employees at the company (in years), (3) the value of the company’s total assets (in millions of dollars), (4) the number of company workers (in thousands) as reported to shareholders (some firms report the average number of employees, and some report the number of em-
27. This industrial breakdown assures a sufficient number of observations within each industry. The twenty categories, based on three-digit SIC codes, are: (1) agriculture (codes 011-029,071-097); (2) mining (codes 101-149); (3) construction (codes 152-179); (4) manufacturing-durable goods (codes 241-259,321-399); (5) manufacturing-non- durable goods (codes 201-239,261-319); (6) transportation (codes 401-478); (7) commu- nication (codes 481-489); (8) utilities and sanitary services (codes 491-497); (9) wholesale trade (codes 501-519); (10) retail trade (codes 521-599); (11) finance, insurance, and real estate (codes 601-655, 671-679); (12) private household services (code 881); (13) business and repair services (codes 731-769); (14) personal services, excluding private household services (codes 701-729); (15) entertainment and recreation (codes 781-799); (16) hospitals (code 806); (17) health services, excluding hospitals (codes 801-805, 807-809); (18) educational services (codes 821-829, 841-842); (19) social services (codes 832-839); and (20) other professional services (codes 811, 861-874, 899).

Who Adopts Total Quality Management 91
ployees at year end),'* (5) the market value of common equity, which is taken to be the price at the close of the calendar year (in dollars and cents) multiplied by the net number of all common shares out- standing (in millions) at year end, (6) a zero-one dummy variable which takes on the value of one if the firm is a manufacturing firm (i.e. SIC codes 201-399) and 0 otherwise, (7) a zero-one dummy vari- able which takes on the value of one for those companies that Com- pustat identifies as having a workforce that is at least 10% part-time or seasonal employees,29 (8) the company's net sales (the amount of actual billings to customers for regular sales completed during the period, reduced by cash discounts, trade discounts, and returned sales and allowances for which credit is given to customers, in millions of dollars), (9) the total debt of the company (in millions of dollars), and (10) the net income of the company (in millions of dollars).30
Before discussing the analysis of the above data set in detail, it may be helpful to examine why we are focusing on data from 1983. As mentioned previously, we are viewing TQM as an innovation in management. Given this interpretation, it is important to use data of companies prior to the innovation in order to test the various proposi- tions (Propositions 1, 2, and 3) concerning factors that would affect the probability of adoption of TQM. It has largely been during the mid and late 1980s and early 1990s that TQM has generated wide- spread interest in the U.S.31 Our review of company reports is consis-
28. This item includes all part-time and seasonal employees and all employees of consolidated subsidiaries. Contract workers, consultants, and employees of unconsoli- dated subsidiaries are excluded.
29. W l l e one would like to have information on the number of part-time employ- ees, the data set only provides this dummy-variable information on the extent of part- time workers.
30. Although the presentation of financial data and methods of disclosure vary widely among companies and businesses, one benefit of using Compustat is that it is a standardized database. In particular, Standard & Poor's Compustat Services, Inc. uses specific collection procedures, computerized validation, and balancing models designed to minimize these reporting discrepancies.
31. According to Garvin (1988), the U.S. has experienced four "quality eras." The development of mass production and the subsequent need for interchangeable parts spawned the first quality era, namely, that of formal inspection. During the early 1930s, inspection as a means of monitoring product quality evolved into the more scientific statistical quality control. Since much of the original research in this area was published in technical journals with limited circulation, however, the use of quality control in the U.S. did not become widespread until the late 1940s. During the 1950s and 1960s, the quality movement in the U.S. entered its third era, namely, that of quality assurance, and it was during this period that quality evolved from a restricted, manufacturing- based concept to one with broader implications for management. In the 1970s, three major forces, namely, an increase in foreign competition, a sharp increase in the number of product liability suits, and pressure from various government agencies, including the National Highway Traffic Safety Administration, the EPA, and the Consumer Prod- uct Safety Commission, pushed the U.S. into its fourth quality era, the era of strategic quality management, which spawned TQM.

92 Journal of Ecoiiornics & Management Strategy
tent with this timing, in that none of the companies identified as TQM firms reported adopting TQM prior to 1983. Thus, we use 1983 as our base, or "pre-TQM," year. It turns out that 1983 is, in fact, the earliest year that complete information exists for the companies in our sample. 32
In order to test the predictions of Propositions 1,2, and 3 as to the characteristics which make firms more likely to adopt a management innovation such as TQM, we estimate a probit model of TQM adop- tion in which the dependent variable is equal to 1 if the firm indicated that it had adopted TQM during the 1980s. Table I presents means and standard deviations of the vector of independent variables for the overall sample and broken down for TQM and non-TQM firms. Table I1 presents the estimates of the probit model of TQM adoption. Column 2 reports the estimated coefficients, while columns 3 and 4 interpret these coefficients in terms of the implied derivatives (column 3) and the effect on the probability of adoption of a one-standard- deviation change in the independent variable (column 4). The ration- ale for the inclusion of the various independent variables in the light of Propositions 1 through 3 follows.
With regard to employee-related characteristics that affect initial training costs, Proposition 1 indicates that the size of the company in terms of the number of workers ( n ) will affect the adoption of TQM. In particular, employers with a greater number of employees are more likely to adopt TQM, because of economies of scale to training. Intro- ducing the logarithm of the number of employees into the probit model, we predict a positive sign on this variable. Note, however, that for a given employer size, the magnitude of training costs associ- ated with the adoption of TQM will depend on the number of part- time workers. In particular, holding total worker effort constant, an increase in the number of part-time workers implies greater training costs. We thus include a dummy variable equal to one for companies with more than 10% part-time workers, and predict that such compa- nies will be less likely to adopt TQM.33
According to Proposition 1, two other variables influence the likelihood of TQM adoption. One is the rate of turnover (q), as in- creased turnover implies greater training costs to adopting TQM.
32. In particular, the net income variable is not available until 1983. Note that the results reported below hold if 1984 is used as the "pre-TQM' year. Further, if we omit net income from the analysis, similar results are obtained using earlier years (e.g., 1980).
33. While we would like to know the exact proportion of each firm's workforce that is part-time, the Compustat data set only indicates whether the proportion exceeds 10%.

TA
BL
E I
.
ME
AN
S AN
D S
TA
ND
AR
D D
EV
IAT
ION
S OF V
AR
IAB
LE
S I
N T
OM
AD
OP
TIO
N A
NA
LY
SIS
Mea
n (S
td. d
ev.)
Non
-TQ
M
Var
iabl
e E
ntir
e Sa
mpl
e TQ
M F
irms
Firm
s
One
if f
irm is
iden
tifie
d as
a T
QM
firm
0.
066
1.0
0.0
Num
ber
of e
mpl
oyee
s in
198
3 (i
n th
ousa
nds)
9.
39 (
31.5
1)
15.8
4 (6
1.02
) 8.
93 (2
8.27
) O
ne if
part
-tim
e w
orke
rs a
re a
t lea
st 1
0% of
the
wor
kfor
ce in
198
3 0.
094
(0.2
9)
0.02
6 (0
.16)
0.
099
(0.3
0)
Ave
rage
tenu
re o
f w
orke
rs (
year
s)
7.97
(1.9
7)
8.70
(1.
27)
7.92
(2.
00)
Rat
io o
f ne
t inc
ome
to t
he n
umbe
r of
empl
oyee
s in
198
3 (i
n 7.
61 (5
3.46
) 6.
94 (9
.86)
7.
65 (5
5.25
)
Rat
io o
f as
sets
to th
e nu
mbe
r of
empl
oyee
s in
198
3 (i
n th
ousa
nds
357.
56 (9
07.7
8)
129.
85 (1
61.3
9)
373.
38 (
936.
13)
Tob
in's
Q fo
r 19
83
1.47
(1.5
8)
1.69
(1.6
6)
1.46
(1.5
7)
One
if t
he f
irm
is in
the
man
ufac
turi
ng in
dust
ry
0.52
(0.
50)
0.81
(0.4
0)
0.50
(0.5
0)
Rat
io o
f ne
t sa
les
in 1
983
to n
et s
ales
in 1
979
(bot
h sa
les
figu
res
in
1.21
(0.
66)
1.32
(3.3
4)
Num
ber
of o
bser
vatio
nsa
2297
15
1 21
46
thou
sand
s of
1992
dol
lars
)
of 1
992
dolla
rs)
1.31
(3.2
3)
1992
dol
lars
)
a T
he n
umbe
r of
obse
rvat
ions
(22
97) i
s fo
r the
sam
ple
that
exc
lude
s th
e ra
tio o
f net
sal
es in
198
3 to
net
sal
es in
197
9. T
he s
ampl
e si
ze th
at in
clud
es t
his
vari
able
IS 1
860
(127
TQ
M f
irm
s an
d 17
33 n
on-T
QM
firm
s).

TA
BL
E 1
1.
PR
OB
IT A
NA
LY
SIS
OF
TQ
M A
DO
PT
ION
(3)
Cha
nge (4) in
the
C
hang
e in
Pr
obab
ility
A
dopt
ion
Prob
. (2
) (D
eriv
ativ
e) a
t the
G
iven
a O
ne-S
td.-
(1)
Coe
f. M
ean
TQM
D
ev. C
hang
e in
Ind
. In
depe
nden
t Var
iabl
e M
ean
(abs
olut
e t-
ratio
) A
dopt
ion
Prob
abili
ty
Var
iabl
e
Con
stan
t - 2.
36"
(4.9
5)
Log
of t
he n
umbe
r of
empl
oyee
s in
198
3 O
ne if
part
-tim
e w
orke
rs a
re a
t lea
st
Log
of t
he a
vera
ge te
nure
R
atio
of
net i
ncom
e to
the
num
ber
of
0.26
4 0.
094
2.04
7.
61
4.94
0.07
3 0.
52
10%
of t
he w
orkf
orce
in 1
983
empl
oyee
s in
198
3
of e
mpl
oyee
s in
198
3.
Log
of T
obin
's Q
for
1983
O
ne if
the
firm
is in
the
man
ufac
turi
ng
Chi
-squ
ared
(6)
N
umbe
r of
obs
erva
tions
Log
of t
he r
atio
of
asse
ts to
the
num
ber
indu
stry
0.08
0" (
3.57
) 0.
010
- 0.
512"
(2.3
0)
-0.0
48
0.72
7" (
2.85
) 0.
093
0.00
14 (
1.07
) 0.
0001
8
- 0.
190"
(3.
27)
- 0
.024
0.17
6" (
2.53
) 0.
023
0.27
9" (
2.27
) 0.
035
92.9
1 22
97
Dep
ende
nt v
aria
ble
mea
n 0.
066
0.02
1 - 0.
048b
0.02
7 0.
0096
- 0.
029
0.01
7 0.
035'
a O
ne-t
ail t
est
sign
ifica
nt at
the
2.5%
leve
l (a
bsol
ute
valu
e of
t-s
tatis
tic in
par
enth
eses
). Fo
r a
disc
rete
cha
nge
in t
he d
umm
ary
vari
able
fro
m 0
to
1.

Who Adopts Total Quality Management 95
Thus, we expect that employers with lower turnover, as reflected by a longer average tenure of current employees, will be more likely to adopt TQM. The second is the proportion of training costs that can be financed using internal financing (7) ; greater access to internal funding lowers the financing costs of the initial training expense re- quired for adoption of TQM. Introducing real net income per em- ployee as a proxy for the extent of internal financing, we thus predict that higher net income per employee will increase the likelihood of TQM adoption.
The reported results largely support the predictions of Proposi- tion 1 concerning the characteristics of firms which are more likely to adopt TQM. Specifically, the estimated coefficients for employer size and tenure are statistically significant and positive, and the coefficient for the part-time dummy variable is negative and statistically signifi- cant.34 These findings support the contention that TQM can be viewed as a substantial investment in the labor force, and thus is more likely to be adopted by firms with a large, stable, full-time work force. Note, however, that the positive coefficient on net income per worker, as a proxy for the ability of firms to finance this investment, is not statisti- cally significant. Given the interest in the technology-adoption litera- ture concerning the role of firm size in affecting the speed of adoption, the robustness of the firm-size effect on TQM adoption was explored by considering alternative specifications of the model. It was found that the size-effect finding was unaffected by either deleting variables or including additional industry dummy variables.35
As a measure of the proportion of base defects that are intro- duced by the firm’s employees during the production process (1 - K ) , we use the firm’s capital-to-labor ratio as measured by the log of the value of total assets per employee. We assume that the more labor- intensive the firm (i.e., the lower the capital to labor ratio), the greater the proportion of defects that are introduced by employees in house (i.e., the higher is 1 - K). Referring to Proposition 2, we thus predict that firms with a higher capital-to-labor ratio will be less likely to adopt
34. Note that, given our formulation of including the logarithm of the ratio of assets to number of employees as an independent variable, we are controlling for firm size in terms of the value of the firm’s assets when considering the effect of a change in the number of employees on TQM adoption.
35. An empirical supplement that documents these findings is available on request from the authors. It has been suggested that the size effect on TQM adoption that we identify may reflect a bias in our measure of TQM firms, with larger firms more likely to report TQM adoption in company reports than smaller firms. While this is possible, one might alternatively suggest the bias goes the other way, with larger firms less likely to mention TQM adoption given the greater variety of other topics a larger firm could mention within the limited space of an annual report.

96 Journal of Economics & Management Strategy
TQM. The results reported in Table I1 indicate a significant negative coefficient for the capital-to-labor ratio, supporting the hypothesis that firms with less in-house production of output by labor are less likely to adopt this management style.
With regard to Proposition 3, we use an empirical measure of Tobin’s Q, namely, the ratio of the sum of the market value of the firm and its debt to the value of its assets, as a measure of the value of quality to employers, 0. We take the natural interpretation that the higher Tobin’s Q, the greater the anticipated future returns available to the firm. Defective products can be thought of as damaging antici- pated future returns. As firms with a higher Tobin’s Q have larger future returns that would be put into jeopardy by a pattern of defects, it follows that such firms would place a greater value on avoiding defects. In other words, a firm with higher Q faces a high cost of a defect, p. According to Proposition 3, we thus expect such firms to be more likely to adopt the TQM innovation. There are, of course, alternative interpretations of the effect of Tobin’s Q on the adoption of TQM. One possibility is that it provides a second measure (along with net income per employee) of the ability of a firm to finance the investment in the workforce associated with the adoption of TQM.36
As the results reported in Table I1 indicate, we do find a signifi- cant positive coefficient on Tobin’s Q, suggesting that firms with a high value of quality, as measured by Tobin’s Q, are more likely to adopt TQM. However, as discussed above, there remains the alterna- tive interpretation of Tobin’s Q as reflecting the profitability of the firm, and thus its ability to finance the TQM investment. Indeed, it may be a better measure of profitability than net income per employee, which may explain the lack of significance for net income per em- ployee. To address this issue, we tried two different specifications. One was to drop Tobin’s Q from the analysis. No important changes result from doing so; in particular, net income remains statistically insignificant. Second, we tried including an additional control vari- able, the growth in net sales over the prior five years.37 While we find
36. Another interpretation of Tobin’s Q is to relate it to the adjustment cost of capital. Taking this view, a greater Tobin’s Q implies greater capital-adjustment costs. Such a firm would then face a high cost of a defect, p, in that fluctuations in demand resulting from the sale of defective products could not be as easily accommodated. This interpretation also supports the expectation that companies with a high Tobin’s Q will be more likely to adopt TQM. Naturally, as the adjustment-cost discussion involves Tobin’s “marginal” Q while the empirical work employs a measure of Tobin‘s ”average” Q, we would appeal to Hayashi (1982) for the conditions under which this ”average” Q reflects the “marginal” Q.
37. The actual results from omitting the TQM variable, as well as from including the growth in net sales, are available on request from the authors.

Who Adopfs Total Quality Management 97
that a higher prior growth rate in net sales does increase the likelihood of adopting TQM, the inclusion of this variable does not substantially change our findings concerning the other variables.
Our discussion so far has been based on the assumption that while the quality-related actions of individual agents in a team setting may not be observable, the principal achieves the first-best solution through the use of a 100% compensation rule. Alternatively, the first best can be achieved through bonus or penalty schemes. However, as discussed by Holmstrom (1982), if there is error in the measurement of a team’s contribution to reducing defects, agents are risk-averse, and both principal and agents face wealth constraints, then bonus or penalty compensation schemes that could elicit an asymptotic first- best outcome based upon a noisy signal of the team’s output may not be feasible. Further, as Holmstrom indicates, the extent of the efficiency losses due to moral hazard in a team setting can be more severe the less informative is the signal on the team’s output. We thus anticipate that employers with a less informative signal on a team’s contribution to the reduction in defects will be less likely to adopt TQM if the parties involved face wealth constraints and agents are risk-averse. The above prediction is a straightforward application of the analysis in Holmstrom (1982). Of interest with regard to the TQM phenomenon is that it suggests that a more precise signal on defect rates can play a key role in the successful adoption of TQM. In this light, it is not surprising that advocates of TQM stress the use of such techniques as statistical process control to provide better measures of defects rates.
We anticipate a systematic difference between manufacturing and nonmanufacturing companies with respect to the precision of the signal concerning contributions by teams to defect reduction. Namely, we expect quality improvements to be more accurately measured by manufacturing Krajewski and Ritzman (1993) note that: “As manufacturing systems tend to have tangible products and less customer contact, quality is easier to measure. Service systems, on the other hand, generally produce a mixture of tangibles and intangibles. Moreover, individual preferences affect assessments of quality, mak- ing objective measurement difficult” (p. 6). Thus, it follows that manu- facturing firms will be more likely to adopt TQM, for the better signals they receive on quality improvements mean less of an efficiency loss to adopting the team production process of TQM. We thus predict a positive coefficient for a dummy variable that takes the value 1 if the
38. For a more detailed discussion of TQM in service versus manufacturing compa- nies, see Main (1994).

98 Journal of Economics & Management Strategy
organization is a manufacturing firm. In fact, the dummy variable indicating manufacturing concerns is statistically significant and posi- tive in sign, suggesting that firms that can obtain a more precise mea- sure of quality improvements are more likely candidates to adopt the management innovation of TQM.
We now consider the implications of the adoption of TQM on the subsequent status of the firm. According to the above discussion, firms that adopt TQM find that the higher training costs and potential efficiency losses are more than offset by the additional flexibility in the production process for achieving quality improvements. Taking the view that TQM is an innovation, those companies that find it advantageous to adopt will thus, on net, be relatively better off than had they not adopted TQM practices. With this increased profitability comes a change in how quality is achieved, as TQM focuses on quality improvement through prevention. In particular, simulations indicate that even though firms that adopt TQM are less likely to correct a defect through traditional quality-related efforts such as inventories, rework, and testing ( p ) , this is more than offset by quality improve- ment through prevention, so that there is a reduction in the optimal defect rate D and an increase in optimal nondefective sales (1 - D ) Y . The increased profitability of TQM firms will, over time, lead to an expansion in output at such firms, as indicated by an increase in sales and the employment of labor and capital.
In order to explore the hypothesized positive relationship be- tween the adoption of TQM and the subsequent (relative) growth in the profitability, net sales, employment, and capital stock, a series of four OLS regressions are estimated. Table 111 reports these results. The dependent variables are the logarithms of one plus the rate of growth, during the 10-year period from 1983 to 1992, in market value, net sales, employees, and assets, respectively. In these regressions, we control for the same vector of (independent) variables used in the probit analysis, as well as the logarithm of one plus the growth rate of the variable in question over the preceding five-year period (1979-1983). In addition, we include as an independent variable a zero-one dummy variable which takes on the value of one if the firm reported that it had adopted TQM during the 1980s.
The results reported in Table 111 indicate that firms that are identi- fied as having adopted TQM during the 1983-1992 period experienced a greater rate of growth in net sales, employment, and capital stock (total assets) during this period of time.39 One interpretation is that
39. Note that these results are robust to the different specifications, including ones that exclude certain variables and others that add as control variables a set of seven industry dummy variables. A full report of the results for these alternative specifications is available on request from the authors.

TA
BL
E 1
11.
AN
AL
YS
IS OF
TH
E C
HA
NG
ES
TH
AT
AC
CO
MP
AN
Y T
HE
AD
OP
TIO
N O
F T
QM
Dep
ende
nt V
aria
ble
(Log
of
the
Rat
io o
f th
e D
efla
ted
1992
Val
ue to
the
1983
Val
ue)
Inde
pend
ent V
aria
bles
M
arke
t N
et
Num
ber
of V
alue
V
alue
Sa
les
Em
ploy
ees
of A
sset
s
Con
stan
t - 0
.257
(1.0
5)
One
if t
he f
irm
is i
dent
ifie
d as
a T
QM
com
pany
0.
020
(0.2
0)
Log
of th
e nu
mbe
r of
em
ploy
ees
in 1
983
One
if p
art-
time
wor
kers
are
at l
east
10%
of t
he w
orkf
orce
in 1
983
Log
of th
e av
erag
e te
nure
R
atio
of
net i
ncom
e to
the
num
ber
of em
ploy
ees
in 1
983
0.07
2” (4
.91)
0.
196b
(1.8
7)
0.36
0” (2
.89)
0.
002
(2.8
0)
Log
of th
e ra
tio o
f as
sets
to th
e nu
mbe
r of
em
ploy
ees
in 1
983
Log
of To
bin’
s Q
for
1983
O
ne if
the
firm
is in
the
man
ufac
turi
ng in
dust
ry
-0.0
71”
(2.4
3) -
- 0
.244
” (4.
66)
-0.1
49“
(2.1
0) -
Log
of t
he r
atio
of
the
real
dep
ende
nt v
aria
ble
in 1
983 t
o its
val
ue i
n 19
79
Adj
uste
d R
-squ
are
0.05
N
umbe
r of
obse
rvat
ions
(N
) 15
71
Dep
ende
nt-v
aria
ble
mea
n 0.
179
0.03
5 (0
.77)
0.01
6 (0
.08)
0.
182“
(2.0
2)
0.01
7 (1
.44)
0.
089
(1.0
0)
0.06
4 (0
.61)
0.
002”
(3.6
1)
0.01
7 (0
.69)
0.
256”
(6.2
9)
0.00
2 (0
.03)
0.
003
(0.0
7)
0.04
0.09
4 1807
0.13
5 (0
.76)
0.
132b
(1.7
0)
-0.0
33“
(3.0
8)
0.05
6 (0
.72)
-0
.257
“ (2
.78)
O.
OOlb
(1.
86)
0.09
7” (4
.42)
0.
221“
(6.1
8)
0.02
0 (0
.50)
0.
05
0.05
4
-0.0
28 (
0.52
)
1729
0.16
3 (0
.80)
0.
190”
(2.1
0)
0.05
7” (4
.69)
0.
038
(0.4
3)
0.10
6 (0
.99)
0.
002”
(4.1
8)
0.23
4“ (5
.68)
-0
.040
(1
.59)
-0.1
52“
(2.4
7)
-0.0
82
(0.8
0)
0.04
0.14
9 1821
One
-tai
l tes
t sig
nific
ant a
t th
e 2.
5% le
vel (
abso
lute
valu
e of
t-st
atis
tic in
par
enth
eses
). O
ne-t
ail t
est
sign
ifica
nt at
the
58
leve
l (ab
solu
te v
alue
of
I-st
atis
tic in
par
enth
eses
).

100 Journal of Economics & Management Strategy
these increased growth rates are the consequence of adopting TQM, especially given that we have controlled for such factors as past growth rates, as well as firm size, the capital-to-labor ratio, net in- come, the tenure of the workforce, and Tobin's Q. Alternatively, one might argue that companies that experience greater growth rates in net sales, employment, and capital stock than predicted from past growth rates, firm size, capital-to-labor ratio, tenure of workforce, and Tobin's Q are the same companies that are more likely to adopt TQM. In this case, causality runs in the opposite direction. Without a more precise timing of the adoption of TQM, our ability to disentangle this causality issue is limited, and the results reported in Table I11 should be viewed as merely ~uggestive.~'
6. CONCLUSION
The recent emergence of TQM in the U.S. has spawned a great deal of interest in management circles as well as in the mass media. Despite the growing numbers of firms which have adopted this management technique, however, little has been done to develop formal tests con- cerning the pattern of adoption and the effects of TQM. Using a simple production model, we demonstrate why some firms but not others would adopt the innovative approach to quality improvement known as TQM. In this context, we predict and find evidence that firms with a higher value placed on quality (as measured by Tobin's Q), a greater proportion of total defects that are introduced by in-house workers during the production process (as measured by the capital-to-labor ratio), and a larger, more stable workforce are more likely to adopt TQM. For firms that implement TQM, we find greater growth in em- ployment, capital assets, and net sales.
While we have developed a basic framework for modeling TQM, much remains to be done in this area. Clearly, our model of TQM makes a number of simplifying assumptions. In this regard, a first extension might focus on asymmetric information and risk aversion. In comparing the nonteam, traditional approach to production with the TQM approach, the first-best compensation scheme for TQM im- plies potentially large fluctuations in compensation to team members,
40. Note that with the one-time training costs for workers on adopting TQM, the result could be a one-time fall in earnings for a company during the period TQM is adopted. However, since firms adopting TQM will have higher future steady-state earnings that offset this one-time training cost, we should expect to see no effect of these lower earnings on its stock price. In fact, we predict the opposite. Naturally, this conclusion is modified if the adoption of TQM provides a signal that the competition faced by the company is more severe than previously anticipated, as this would lead to a reduction in stock prices if TQM is adopted.
Who Adopts Total Quality Management 101
since the defect rate is a random variable. This is of little concern as long as workers are assumed risk-neutral and there are no wealth constraints. However, as previously discussed, wealth constraints can imply efficiency losses. This suggests a new role that team members can play in addition to their traditional production role. Namely, team members are in a position to cheaply acquire information on the ac- tions of their fellow team members (mutual monitoring) and enforce the ”efficient” level of effort, provided peer pressure exists in the workplace.*l
In the context of peer pressure, a whole list of additional TQM practices become more understandable. The sharing or rotation of tasks among coworkers in a team can be seen as one way to improve the information workers have concerning the actions of their cowork- ers. To act on this information, risk-averse workers must have a clear understanding of what is expected-thus the emphasis in TQM on the building of a ”corporate culture.” These activities are important in defining a common set of standards for behavior among workers in order to increase the role of peer pressure in curtailing behavior adverse to the team. Finally, peer pressure is enhanced if disapproval by one’s coworkers implies a larger cost. This provides a rationale for the promotion of team social activities as part of TQM.
While smaller teams may mean team members receive more pre- cise signals with respect to their fellow team members’ efforts, an offsetting loss due to small teams arises in the context of herd behav- ior. Scharfstein and Stein (1990) argue that herd behavior arises from heterogeneous agents and signals that are correlated for the more able. In such circumstances, agents have an incentive to mimic the decisions of others in order to avoid being identified as less produc- tive. In small teams, where the identity of the decision makers is more clear, such herd behavior may result in fewer innovative actions. Large teams, in contrast, provide a masking of responsibility with respect to who made a particular decision, and thus are conducive to more radical changes than would occur if decisionmakers could be identified. This contrasts with Holmstrom and Milgrom’s (1991) ”prin- ciple of unity of responsibility” in which “each task should be the responsibility of just one agent.” Simply put, if I can be identified as a decisionmaker, herd behavior suggests my decisions will mimic ear- lier decisions made by others. As the very essence of TQM is the idea of continuous change, a team setting becomes a necessary element. Thus, the determination of the optimal team size is an important issue.
41. See Kandel and Lazear (1992) and Barron and Paulson Gjerde (1993) for a discus- sion of some of the issues surrounding peer pressure.
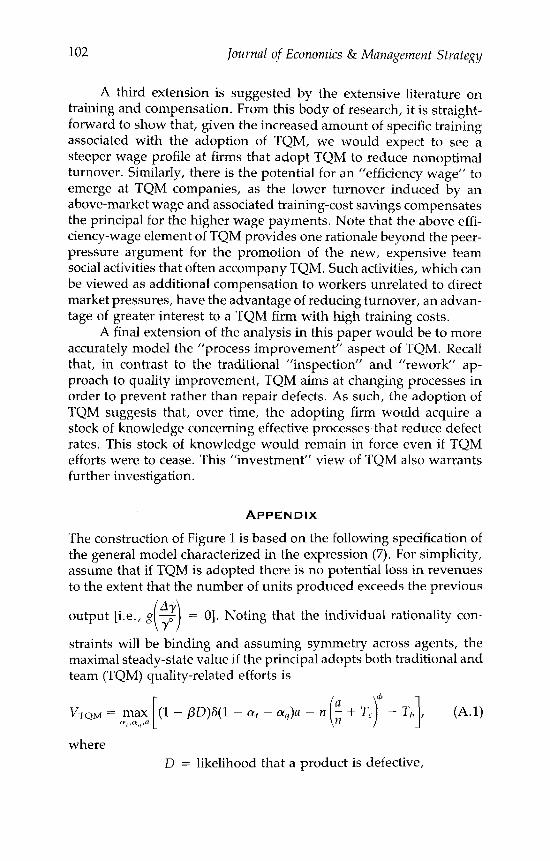
102 Journal of Economics & Management Strategy
A third extension is suggested by the extensive literature on training and compensation. From this body of research, it is straight- forward to show that, given the increased amount of specific training associated with the adoption of TQM, we would expect to see a steeper wage profile at firms that adopt TQM to reduce nonoptimal turnover. Similarly, there is the potential for an “efficiency wage” to emerge at TQM companies, as the lower turnover induced by an above-market wage and associated training-cost savings compensates the principal for the higher wage payments. Note that the above effi- ciency-wage element of TQM provides one rationale beyond the peer- pressure argument for the promotion of the new, expensive team social activities that often accompany TQM. Such activities, which can be viewed as additional compensation to workers unrelated to direct market pressures, have the advantage of reducing turnover, an advan- tage of greater interest to a TQM firm with high training costs.
A final extension of the analysis in this paper would be to more accurately model the ”process improvement” aspect of TQM. Recall that, in contrast to the traditional “inspection” and ”rework” ap- proach to quality improvement, TQM aims at changing processes in order to prevent rather than repair defects. As such, the adoption of TQM suggests that, over time, the adopting firm would acquire a stock of knowledge concerning effective processes that reduce defect rates. This stock of knowledge would remain in force even if TQM efforts were to cease. This ”investment” view of TQM also warrants further investigation.
APPENDIX
The construction of Figure 1 is based on the following specification of the general model characterized in the expression (7). For simplicity, assume that if TQM is adopted there is no potential loss in revenues to the extent that the number of units produced exceeds the previous
output [i.e., g - = 01. Noting that the individual rationality con- i3 straints will be binding and assuming symmetry across agents, the maximal steady-state value if the principal adopts both traditional and team (TQM) quality-related efforts is
(1 - PD)S(l - at - &,)a - n
where D = likelihood that a product is defective,
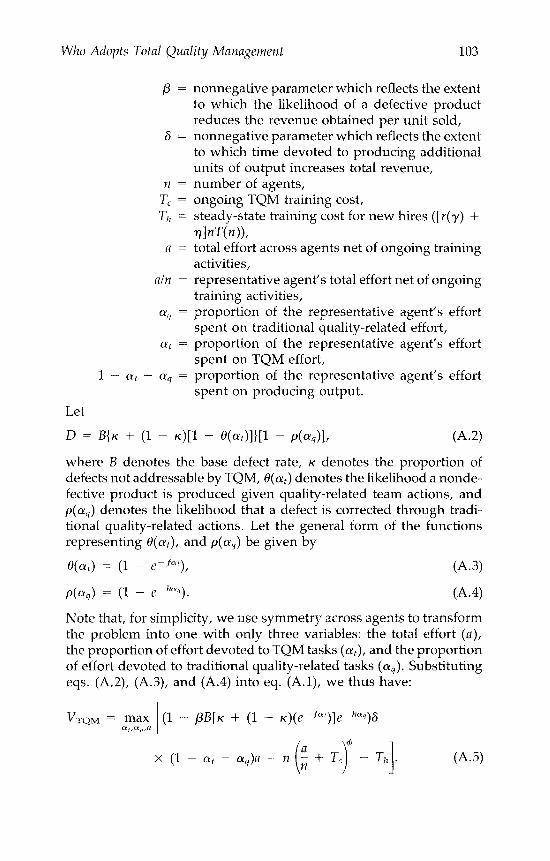
Who Adopts Total Quality Management 103
p = nonnegative parameter which reflects the extent to which the likelihood of a defective product reduces the revenue obtained per unit sold,
6 = nonnegative parameter which reflects the extent to which time devoted to producing additional units of output increases total revenue,
n = number of agents, T, = ongoing TQM training cost, Th = steady-state training cost for new hires ( [ r ( y ) +
a = total effort across agents net of ongoing training activities,
a h = representative agent's total effort net of ongoing training activities,
a4 = proportion of the representative agent's effort spent on traditional quality-related effort,
at = proportion of the representative agent's effort spent on TQM effort,
1 - at - a4 = proportion of the representative agent's effort spent on producing output.
771nT(n)),
Let
D = B{K + (1 - ~ ) [ 1 - O(aOl)[l - p(aq)lr ( A 4
where B denotes the base defect rate, K denotes the proportion of defects not addressable by TQM, O(at) denotes the likelihood a nonde- fective product is produced given quality-related team actions, and p( a4) denotes the likelihood that a defect is corrected through tradi- tional quality-related actions. Let the general form of the functions representing O(at), and p(aIl) be given by
O(a,) = (1 - e p f a t ) ,
p(a,) = (1 - ePh"'i).
(A.3)
(A.4)
Note that, for simplicity, we use symmetry across agents to transform the problem into one with only three variables: the total effort ( a ) , the proportion of effort devoted to TQM tasks (a t ) , and the proportion of effort devoted to traditional quality-related tasks (a,). Substituting eqs. (A.2), (A.3), and (A.4) into eq. (A.1), we thus have:
max (1 - ~ B [ K + (1 - ~ ) ( e - f " ' ) ] e ~ ~ " 9 ) 6 VTQM = L y , , " q , f l I
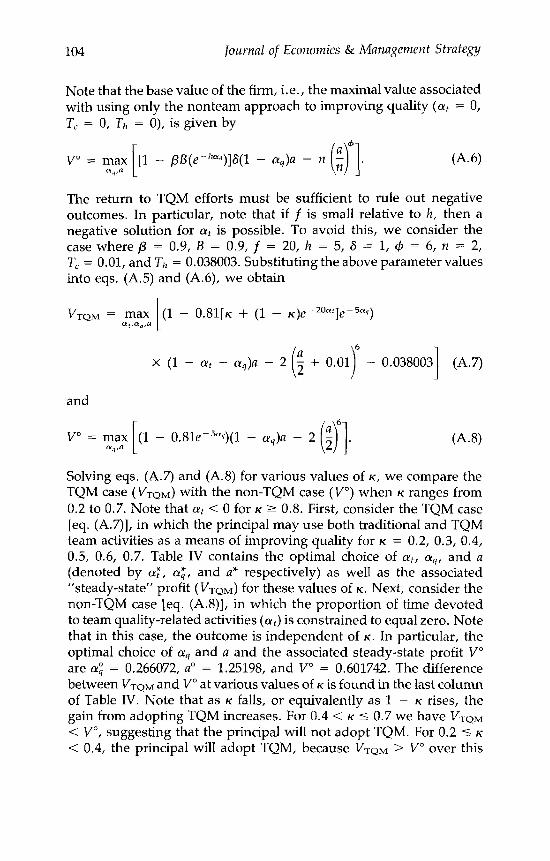
104 Journal of Economics & Management Strategy
Note that the base value of the firm, i.e. , the maximal value associated with using only the nonteam approach to improving quality (at = 0, T, = 0, Th = 0), is given by
The return to TQM efforts must be sufficient to rule out negative outcomes. In particular, note that if f is small relative to h, then a negative solution for at is possible. To avoid this, we consider the case where /3 = 0.9, B = 0.9, f = 20, h = 5, 6 = 1, + = 6, n = 2, T, = 0.01, and Th = 0.038003. Substituting the above parameter values into eqs. (A.5) and (A.6), we obtain
and
Solving eqs. (A.7) and (A.8) for various values of K , we compare the TQM case ( V T o ~ ) with the non-TQM case (V") when K ranges from 0.2 to 0.7. Note that at < 0 for K z 0.8. First, consider the TQM case [eq. (A.7)], in which the principal may use both traditional and TQM team activities as a means of improving quality for K = 0.2, 0.3, 0.4, 0.5, 0.6, 0.7. Table IV contains the optimal choice of at, aq, and a (denoted by a:, a;, and a* respectively) as well as the associated "steady-state" profit ( VTQM) for these values of K . Next, consider the non-TQM case leq. (A.8)], in which the proportion of time devoted to team quality-related activities ( a t ) is constrained to equal zero. Note that in this case, the outcome is independent of K . In particular, the optimal choice of aq and a and the associated steady-state profit V" are a1; = 0.266072, a" = 1.25198, and V" = 0.601742. The difference between VTaM and V" at various values of K is found in the last column of Table IV. Note that as K falls, or equivalently as 1 - K rises, the gain from adopting TQM increases. For 0.4 < K 5 0.7 we have V . T Q ~ < v", suggesting that the principal will not adopt TQM. For 0.2 5 K
< 0.4, the principal will adopt TQM, because VTQM > V" over this

Who Adopts Total Quality Management 105
TABLE IV. s I M U LATION RESULTS
0.2 1.27709 0.124248 0.0252217 0.692558 0.090816 0.3 1.2605 0.0973221 0.0975341 0.637231 0.035489 0.4 1.24932 0.075159 0.149138 0.601742 0 0.5 1.24136 0.0549631 0.189392 0.577703 - 0.024039 0.6 1.23555 0.0344597 0.223362 0.561883 - 0.039859 0.7 1.23244 0.0125487 0.252531 0.553398 - 0.048344
range of K . At K = 0.4, the principal is indifferent between adopting TQM and not adopting TQM in that TJrQM = V”.
REFERENCES
Banks, J . , 1989, Principles of Quality Control, New York: Wiley. Barron, J.M. and K. Paulson Gjerde, 1993, “Peer Pressure in a Game-Theoretic Setting,”
Working Paper Series, State University of New York at Stony Brook. Bettenhausen, K.L., 1991, “Five Years of Groups Research: What We Have Learned
and What Needs to be Addressed,” Journal of Management, 17(2), 345-381. -, and J.K. Murnighan, 1991, ”The Development of an Intragroup Norm and the
Effects of Interpersonal and Structural Challenges,” Administrative Science Quarterly, 36, 20-35.
Davies, S.W., 1979, ”Inter-firm Diffusion of Process Innovations,” European Economic Review, 12, 299-317.
Evans, J.R. and W.M. Lindsay, 1993, The Management and Control of Qualify, Minneapo- lis: West Publishing Company.
Fatehi-Sedeh, K., 1984, ”Conversion to a Just-in-Time Production System: Structural Considerations,” journal of Behavioral Economics, 13(2), 111-133.
Gale, D. and M. Hellwig, 1985, ”Incentive-Compatible Debt Contracts I: The One- Period Problem,” Review of Economic Studies, 52, 647-664.
Garvin, D.A., 1988, Managing Qualify: The Strategic and Competitive Edge, New York: The Free Press.
Gaynor, M., 1989, “The Presence of Moral Hazard in Budget Breaking,” Public Choice, 61, 261-267.
Gitlow, H. and S. Gitlow, 1987, The Deming Guide to Qualify and Competifive Position, Engelwood Cliffs, NJ: Prentice-Hall.
Grossman, S. and 0. Hart, 1983, “An Analysis of the Principal-Agent Problem,” Econo- rnetrica, 51, 7-45.
Hannan, T.H. and J.M. McDowell, 1984, ”The Determinants of Technology Adoption: The Case of the Banking Firm,” RAND Journal of Economics, 15, 328-335.
Harris, M. and A. Raviv, 1979, ”Optimal Incentive Contracts with Imperfect Informa- tion,” Iournal of Economic Theory, 20, 231-259.
Hayashi, F., 1982, ”Tobin’s Marginal q and Average q: A Neoclassical Interpretation,” Econornefn‘ca, 50(l), 213-224.

106 Iournal of Economics & Management Strategy
Holmstrom, B., 1979, ”Moral Hazard and Observability,” Bell ]ournu/ of Economics, 10,
-, 1982, ”Moral Hazard in Teams,” Bell journal of Economics, 13, 324-340. __ and P. Milgrom, 1987, ”Aggregation and Linearity in the Provision of Intertem-
poral Incentives.” Economefrica, 55 303-328. ~ and -, 1991, ”Multi-task Principal-Agent Analyses: Incentive Contracts, Asset
Ownership and Job Design,” Journal of Law, Economics, and Organization, 7 (special issue), 24-52.
Ichniowski, C . , 1990, “Human Resource Management Systems and the Performance of U.S. Manufacturing Business,” NBER Working Paper No. 3449, September.
Itoh, H., 1991, “Incentives to Help in Multi-agent Situations,” Econometrica, 59,611-637. Jaffee, D. and T. Russell, 1976, ”Imperfect Information, Uncertainty, and Credit Ration-
ing,“ Quarterly Iournal of Economics, 90, 651-666. Jensen, M.C. and W.H. Meckling, 1992, ”Specific and General Knowlcdge, and Organi-
zation Structure,” in L. Werin and H. Wijkander, eds., Contract Economics, Oxford: Basil Blackwell.
Kandel, E. and E.P. Lazear, 1992, ”Peer Pressure and Partnership,” Journal of Political
Kane, J.S. and E.E. Lawler 111,1978, “Methods of Peer Assessment,” Psychological Bulle- tin, 85(3), 555-586.
Krajewslu, L. J. and L.P. Ritzman, 1993, Operations Management: Stmtegy and Analysis, New York Addison-Wesley.
Levin, S.G., S.L. Levin, and J.B. Meisel, 1987, “A Dynamic Analysis of the Adoption of a New Technology: The Case of Optical Scanners,” The Review of Economics and Statistics, 69, 12-17.
Main, J . , 1994, Qualify Wars: The Triumphs and Defeats of American Business, New York: Free Press (a division of Macmillan).
Mansfield, E., 1968, Industrial Research and Technological Innovation: An Econometric Analy- sis, New York: Norton.
McAfee, R.P. and J. McMillan, 1991, ”Optimal Contracts for Teams,” International Eco- nomic Review 32(3), 561-577.
Myers, S.C. and N.S. Majluf, 1984, ”Corporate Financing and Investment Decisions When Firms Have Information That Investors Do Not Have,” Iournal of Financial Economics, 13, 187-221.
Oster, S. 1982, “The Diffusion of Innovation among Steel Firms: The Basic Oxygen Furnace,” Bell Journal of Economics, 13, 45-56.
Osterman, P., 1994, ”How Common is Workplace Transformation and Who Adopts It?” Industrial and lahor Relations Review, 47(2), 173-188.
Rose, N.L. and P.L. Joskow, 1990, ”The Diffusion of New Technologies: Evidence from the Electric Utility Industry,” RAND journal of Economics, 21(3), 354-373.
Scharfstein, D.S. and J.C. Stein, 1990, “Herd Behavior and Investment,” Ameuican Eco- nomic Review, 80(3), 465-479.
Shavell, S., 1979, “Risk Sharing and Incentive in the Principal and Agent Relationship,“ Bell Journal of Economics, 10, 55-73.
Sheridan, J.H., 1990, ”America’s Best Plants,” Industry Week, 239 (October 15), 27-64. Stiglitz, J. and A. Weiss, 1981, “Credit Rationing in Markets with Imperfect Informa-
Talley, D.J., 1991, Total Quality Management Performance and Cost Measures: The Strategy
Turk, H., 1961, ”Instrumental and Expressive Ratings Reconsidered,” Socionietry, 24,
74-91.
Economy, 100(4), 801-817.
tion,” American Economic Review, 71, 393-410.
for Economic Survival, Milwaukee ASQC Quality Press.
76-81.