Embed Size (px)
Citation preview

Who Am I?
Racial Identity and Affect Among
Biracial White-Blacks and White-Asians
Lauren Davenport ∗
Annie Franco
Shanto Iyengar
Sean Westwood
∗Corresponding author, Assistant Professor, Department of Political Science, Stanford University, [email protected]. The dataset
used in this paper was collected by the Pew Research Organization as part of their ongoing work documenting the role of multiracials
in America. We thank Ms. Kim Parker, Managing Director of Pew Social Trends, for making the data available. The analysis and
interpretations reported here do not represent the positions or views of the Pew Research Organization. This is a working draft; please
do not cite without permission of the authors.

Abstract
The multiple-race population of the U.S. currently stands at more than 9 million and is
one of the fastest-growing racial groups in the nation. In this paper, we examine the identi-
ties, affect, and attitudes of the two largest multiple-race subgroups—biracial White-Asians
and White-Blacks—and examine where they reside in the U.S. racial divide. We theorize
that biracials’ political attitudes may follow one of two paradigms: a hegemonic model, in
which biracials perceive themselves as more strongly tied to Whites; and a racial distinc-
tiveness model, wherein biracials view themselves as members of a minority group, socially
and culturally distinct from Whites. Leveraging a novel national survey that samples more
than one thousand biracial respondents, we evaluate multiple indicators of racial identity,
racial affect, and policy preferences. Our findings suggest that, overall, biracials stake out a
distinct identity that occasionally diverges from their heritage groups. On matters of racial
attachment, biracials partially bridge the difference between their monoracial White and
non-White counterparts, but overall remain close to their minority affiliation. On political
issues, however, biracials generally tilt left of monoracial minority groups. We argue that
the growth in the multiple-race population, at least in terms of the groups considered here,
seems likely to benefit the Democratic Party, unless the Republican Party abandons their
hard-line stance on issues of concern to racial minority communities.

1 Introduction
In democratic societies, politics revolves around group interests. Subjective group identifica-
tion—an internalized feeling of belonging to a group—is integral to understanding the politi-
cization of group membership (Huddy 2001, 2002, 2003). Group identification can result in a
heightened state of group consciousness, characterized by in-group solidarity, opposition to the
out-group, awareness of the group’s social status, and a commitment to action intended to achieve
the group’s goals (Jackman and Jackman 1973; Gurin, Miller and Gurin 1980; Miller et al. 1981).
In the case of the United States, the racial group cleavage has been especially influential, and
racial group interests have long been at the forefront of electoral and party politics (Mendel-
berg 2001; Hutchings and Valentino 2004; Kinder and Winter 2001). Importantly, the litera-
ture on racial identity and consciousness has traditionally assumed that the racial cleavage is
binary—pitting the interests of the dominant White group against the interests of non-Whites (Mc-
Clain et al. 2009; Kinder and Sanders 1996; Sniderman and Carmines 1997). Recent demographic
trends, however, indicate that the racial divide is becoming increasingly nuanced (Bonilla-Silva
2006; Lee and Bean 2010).
A more complex sense of identity is especially applicable to individuals of mixed-race back-
grounds, who represent the youngest and one of the fastest-growing racial demographics. At
present, the multiple-race population of the U.S. stands at more than 9 million (U.S. Bureau of
the Census 2013). Between 2000 and 2013, the number of Americans identifying with multiple
racial groups increased by 37 percent (Davenport 2015). Demographers project that by 2050,
people of mixed-racial backgrounds will account for 20 percent of the total U.S. population (Lee
and Bean 2004; Humes, Jones and Ramirez 2011).
1

In this paper, we examine the identities, affect, and attitudes of biracial Americans, and where
they reside in the U.S. racial divide. We focus on the two largest American multiple-race popula-
tions—biracial White-Blacks and biracial White-Asians—who together comprise 45 percent of the
current multiple-race population (U.S. Bureau of the Census 2013). These are also the fastest-
growing multiple-race subgroups; between 2000 and 2013, the number of Americans identifying as
White-Asian and White-Black increased by 112 percent and 207 percent, respectively—compared
to an increase of just 11.7 percent among the single-race identifying population (Davenport 2015).
We pursue two primary objectives in this paper. First, we compare the attitudinal profile
of White-Asian and White-Black biracials with the respective profiles of the monoracial groups
from which they derive. Specifically, we examine differences in strength of racial attachments
and affect between groups. Second, we explore the broader political ramifications associated with
dual ethnicity. Given the extent to which the constituencies of Democrats and Republicans are
differentiated by race, increasing numbers of biracial voters who identity more strongly as non-
White than White would seem to advantage the Democratic Party, in light of recent electoral
racial trends. On the other hand, if the preferences of biracials fall exactly in between the views
of monoracial Whites and non-Whites, both parties may reasonably appeal for their support. We
examine which of these outcomes seems more plausible.
To accomplish these objectives, we leverage a novel national survey that samples more than
one thousand biracial respondents. To the best of our knowledge, this is the first large-scale
political survey of multiple-race adults that enables such a robust assessment of particular biracial
subgroups. Previous studies, even those that oversampled multiracial individuals, did not permit a
fine-grained comparative analysis of racial attitudes, since multiracial respondents only numbered
2
a few hundred, in total (e.g., Masuoka 2011; Harris and Sim 2002).1 In contrast, our study includes
720 White-Black biracials and 509 White-Asian biracials. For purposes of comparison, we also
surveyed the three relevant constituent monoracial groups, including 800 Whites, 500 Blacks, and
500 Asians.
Our findings indicate that Biracial White-Asians locate themselves in-between Whites and
Asians on questions relating to racial identity and affect. White-Black biracials, however, show no
such ambivalence, positioning themselves with monoracial Blacks on questions of group identity.
The two groups’ sense of group identity spills over to the policy domain with both biracial groups
expressing preferences that signify a likelihood of voting for Democrats rather than Republicans.
2 Models of Racial Identity
In order to understand the political consequences of racial identity for biracial Americans, we turn
to behavioral theories in social psychology and political science. Most notably, Social Identity
Theory (SIT) argues that individuals’ sense of social identity—their subjective affiliation with
particular social groups—powerfully shapes their political attitudes and behaviors (Tajfel and
Turner 1986; Tajfel 1981; Hogg and Hardie 1992; Ellemers, Spears and Doosje 1997; Conover
1984). This would suggest that individuals of mixed-race backgrounds will adopt the ideology
of the racial group with which they most strongly identify (Tajfel and Turner 1979). Central
to explaining the political behavior and racial affect of biracial Americans, then, is mapping the
direction and intensity of their racial group attachments. Unlike most Americans, who have only
one racial identity in their repertoire of social identities, biracials are afforded some flexibility,
1Though see Davenport (2015), who examines the attitudes of biracial college students across
the United States.
3
enabling them multiple racial options and the capacity to fit into different racial memberships.
Because their background includes both minority (Asian or Black) and majority (White)
racial ancestry, we theorize that biracials’ political attitudes may follow one of two racial identity
paradigms. The first is a hegemonic model, in which biracials perceive themselves as more strongly
connected to the dominant majority group (Whites) than to their minority heritage. The second
is a racial distinctiveness model positing that biracials view themselves as members of a racial
minority group, socially and culturally distinct from Whites. We elaborate on these two models
of biracial identity below.
2.1 Hegemonic Model
The hegemonic model of identity predicts that biracials are socialized to see themselves as members
of the dominant racial group—White. The model can be traced to the early theorizing of Marx
and Gramsci on the self-perpetuating nature of social hierarchies (e.g. Borg, Buttigieg and Mayo
2002), and also to more recent empirical work on the role of pre-adult socialization processes
in maintaining system legitimacy (e.g. Easton and Dennis 1969). A closely related perspective
is Social Dominance Orientation (SDO), which theorizes that politics and society are organized
hierarchically around intergroup competition over scarce and symbolic resources (Sidanius, Sing,
Hetts and Federico 2000). According to SDO, a central role that political ideologies play is to
preserve the social hierarchy and maintain the position of the dominant group.
The hegemonic model is also consistent with Tajfel and Turner’s (1979) argument that social
identity is motivated by a need for positive distinctiveness, by which one’s own group is favorably
differentiated from out-groups. Hegemonic theory holds that group identity and in-group bias
are especially well-developed among members of high-status groups because they are positively
4

differentiated from lower-status groups (Bettencourt et al. 2001). In contrast, group identity is not
as well-developed among members of less prestigious groups, who must cultivate an affirmative
identity or seek to change the group’s negative standing in order to enhance their social status
(Tajfel and Turner 1979).
A further prediction of the hegemonic model is that individuals whose social standing is in flux
will choose to identify with the dominant group. That is, individuals for whom membership in a
low-status group is permeable can “escape” their status deprivation by affiliating with a different,
higher-status group (Tajfel and Turner 1979; Tajfel 1981; Tajfel and Turner 1986). Several studies
have found support for this strategy of upwardly mobile identity (Jackson et al. 1996, Taylor et
al. 1987, Wright, Taylor and Moghaddam 1990).
We argue that because part-White, biracial Americans have some degree of choice as to how
they racially identify, the boundaries for their classification are indeed more permeable than for
those of monoracials. Although people of mixed White, non-White backgrounds have historically
been socially and legally identified with their minority race (Snipp 2003; Davis 2001; Bureau of the
Census 1930), attitudes towards racial classification have evolved over time, such that the definition
of Whiteness has expanded to encompass racial and ethnic groups that had long-been legally
categorized as non-White (Gans 2012; Bonilla-Silva 2006). Notably, Davenport (2016b) finds
that economic prosperity, in the form of parental education, household income, and neighborhood
wealth, has an especially upwardly-mobile, racial “whitening” effect for individuals of White/non-
White parentage; in particular, affluent White-Asian biracials are, all else equal, more likely to
self-identify as White, than as Asian. These findings may be attributed to what Loveman and
Muniz (2007) characterize as “boundary crossing: as biracials obtain social status through the
acquisition of education and affluence, they are able to traverse racial boundaries and be classified
5
as White by others, which in turn shapes how they view themselves.
Thus, based on this hegemonic or dominant group model of identity, we hypothesize that
biracial Americans will more strongly align themselves with their majority race—White—because
affiliation with the higher-status group reflects well on them and is a way to enhance their social
status.
2.2 Racial Distinctiveness Model
An alternative possibility is that biracials’ identities and attitudes are more consistent with efforts
to distinguish themselves from Whites. McGuire and Padawer-Singer (1976)’s distinctiveness
theory of self perception maintains that the characteristics we observe most in ourselves are those
that are especially conspicuous in our social milieu; if an individual has a particular trait that
is distinctive, it will become a spontaneously salient component of that individual’s self-concept.
Distinctiveness theory attributes our self-consciousness to the fact that we are dissimilar from
others in some way and that we perceive ourselves in terms of these distinguishing qualities
(McGuire et al. 1978). Distinctiveness shapes the self-concept via both internal and external
comparison. That is, people notice their own uniqueness by contrasting their traits to those of
others in their social setting, and are also affected by others’ responses and perceptions regarding
their uniqueness. Individuals are more likely to notice within themselves features that are absent
among those around them. Notably, McGuire et al. (1978) show that ethnic identity is a salient
part of one’s self-concept when his or her ethnic group is in the minority in their social setting; in
an ethnically mixed environment, members of minority groups express a greater consciousness of
their ethnicity than members of the majority group.
In keeping with traditional racial norms such as the one-drop rule, the ethnic distinctiveness
6
postulate predicts that, as members of an oppressed racial group, part-White biracials will compare
themselves to the dominant (White) population and perceive themselves as a distinct group. That
is, in light of their part-Asian or part-Black heritage, biracials will distinguish themselves from
Whites, viewing White as a racial category that is closed-off to them. Biracials’ minority status
socially differentiates them from Whites, making them more conscious of being non-White than
White. Because they do not or cannot seek entry into the dominant White group, biracials’ non-
Whiteness becomes salient, and their identity with the minority side of their ancestry is reinforced.
We hypothesize that if biracials do identify as members of a marginalized racial minority group
that is distinct from Whites, they may follow one of two divergent paths, either: a.) identifying
with and behaving in a manner akin to that of their monoracial minority race, or b.) perceiving
themselves as part of a unique, multiple-race minority group whose behavior veers from both of
their component parental races.
On the one hand, historical racial norms would imply that biracials are more likely to socially
and politically identify with their minority race. In keeping with the distinctiveness model, there
is a longstanding tradition of mixed-race Americans socially and politically identifying with their
more “subordinate” minority racial group. In particular, for most of U.S. history, individuals of
African ancestry were categorized and treated in accordance with the one-drop rule, or hypodes-
cent, and considered to be singularly Black, rather than “multiracial,” “biracial,” or “part-White”
(Davis 2001). There is similarly a long tradition of individuals of Asian descent being legally
classified as non-White (Haney-Lopez 2006).
Although the one-drop rule no longer judicially delineates racial group membership in the 21st
century, it continues to informally structure how people of mixed-race are labeled. Despite their
part-White background, biracials are commonly categorized as simply “people of color” because
7

observers unconsciously draw upon hypodescent when making racial inferences. Studies have
shown, for instance, that White-Asian biracial faces and White-Black biracial faces are judged to
be relatively more “minority” than White (Ho et al. 2011). Similarly, when individuals are tasked
with classifying White-Black biracial faces that appear phenotypically ambiguous, they are more
inclined to label the target as Black (Peery and Bodenhausen 2008).
Davenport (2016b) finds that biracials who self-identify as singular racial minorities or as mul-
tiracial tend to perceive a stronger linked fate with their minority race because they see themselves
as facing similar adversities and prejudices encountered by their monoracial minority peers. Such
research underscores the endurance of the one-drop rule in structuring racial group membership.
In light of these findings, that contemporary part-White biracials tend to be externally classified
with their minority race, it would seem that such individuals would see their identities as more
closely aligned with that of their minority rather than White affiliation.
On the other hand, it is plausible that biracials identify as a racial minority group that be-
haves differently from either of their component races, in a manner consistent with the seminal
“marginal man” hypothesis. First developed in the 1920s, this hypothesis posits that “racial hy-
brids”—particularly those individuals of White-Black ancestry—straddle a fraught color line and
are in a one-of-a-kind social position wherein they are influenced by each of their parental racial
groups (Stonequist 1935). The marginal man hypothesis maintains that even if an individual has
a stronger attachment to a particular racial background, he or she is mindful of a social connection
to the other culture, in part because of a physical resemblance to both races and being identified
by others as of mixed-race heritage.
According to this view, although mixed-race people naturally reside in two distinct social
realms, they are not embraced by either. As a result, these individuals are in a perpetual “period
8

of crisis” (Park 1928, 893) and comprise their own distinctive minority group. Thus, as Stonequist
(1935, 4) argues, “the type of life he leads, the nature of his achievements or failures, his conception
of himself, and his social attitudes will inevitably reflect the fact that he is of mixed race, and
whatever that fact means in any particular community.”
2.3 Racial Subgroup Differences in Identity
We also anticipate that there will be important differences in identity and political attitudes across
biracial subgroups. Although hypodescent structures the classification of both Black and Asian
biracials, racial boundaries have always been less strictly enforced for Americans of Asian descent
(Davis 2001; Haney-Lopez 2006). As a result, we anticipate that group consciousness will manifest
itself differently among biracial White-Blacks and White-Asians.
Relative to other American racial and ethnic groups, the strength and stability of Black Amer-
ican political solidarity is exceptional, based as it is on the legacy of government-authorized en-
slavement, segregation, and discrimination (Shelby 2005; Du Bois 1903). The concept of linked
fate—the extent to which an individual believes the social status of her group is tied to her own in-
dividual achievements and welfare—has been a fundamental element for explaining Black political
behavior and attitudes (Dawson 1994). The collective experience of deprivation and suffering is an
essential component of African American group consciousness (Gay 2004), and as such, individual
Blacks generally perceive their own fate as inseparable from those of other Blacks (Dawson 1994).
The result of more than a century of racial oppression, Blacks perceive that what happens to their
group has real consequences for the individual.
Like African Americans, Asian Americans also encounter racial prejudice, and there is some
evidence that they too can be politically mobilized when their marginalization becomes salient.
9
For Asian Americans, the perception of racial discrimination is an important predictor of a pan-
ethnic group consciousness (Masuoka 2006). The racism and stereotyping that Asians encounter,
along with their collective labeling as a racial “other,” helps construct and strengthen an Asian
political identity and sense of group solidarity (Espiritu 1992).
Importantly, though, the sense of linked fate is weaker among Asian Americans than African
Americans (Bobo and Johnson 2000). Although they too are categorized as non-White, Asians
do not share in African Americans’ harsh history of enslavement and Jim Crow segregation, and
as such are less inclined to subscribe to a racially-based sense of group linked fate (Wong 2006).
Three-quarters of Asian Americans are foreign-born, immigrating from several different nations
(Krogstad and Lopez 2014; Pew 2012). Junn and Masuoka (2008) find that whereas 80 percent
of African Americans claim that their race is important to their political identity, less than 50
percent of Asians share this view. Because the Asian American population is divided by language,
ethnicity, and nationality, politicians and parties have difficulty mobilizing them as a panethnic
political constituency (Junn and Masuoka 2008; Wong 2015). Individual characteristics including
national origin, age, and gender prove more significant than racial considerations in shaping Asian
American vote choice (Ramakrishnan et al. 2009), and the extent to which Asians see themselves
as linked to their racial group fluctuates substantially by national origin (Lien 2001a).
In light of the distinct histories of these two racial groups, we anticipate that biracial White-
Blacks and White-Asians will differ significantly in the strength of their identity. There is evidence
that part-Black biracials also subscribe to a strong sense of African American linked fate, and favor
policies targeted toward helping marginalized groups (Davenport 2016a; Masuoka 2011). Daven-
port (2015) finds that, compared to biracial White-Asians and Latino-Whites, biracial White-
Blacks are more inclined to follow their minority racial background on issues of race, a result that
10

can be attributed to the fact that Black heritage has been a much stronger determinant of the
individual’s life chances than ties to other racial and ethnic minority groups.
Relative to Black Americans of mixed-race, Asian Americans of mixed-race have always been
afforded greater flexibility in their self-identification, and White-Asian biracials are more likely to
call themselves White than are White-Black biracials (Davenport 2016b).2
Zhou (2004) argues that Asian Americans, who have achieved the educational and financial
success of Whites, equate Whiteness with economic prosperity and prestige. However, Asian
Americans remain culturally differentiated from Whites and for most, who do not have any Euro-
pean ancestry, “White” is not seen as an acceptable racial identification option. But for biracial
White-Asians, who share Whites socioeconomic successes and also European ancestry, the ability
to claim a White racial identity is a real possibility.
3 Data and Methods
3.1 Defining “Biracial”
One consistent issue that researchers of racial and ethnic identity grapple with is, how should
concepts like “multiple-race,” “mixed-race,” “multiracial,” and “biracial” be defined? We recog-
nize that race is a flexible, contextual, and constructed social category, and that, as such, racial
terminology can be delineated in several ways.3 Here, we define respondents as “biracial” if they
2The percentage for both groups is nevertheless small: ten percent of White-Asian biracials
self-identify as White, compared to just five percent of White-Black biracials.3For instance, many surveys, including the U.S. Census, use the method of self-identification,
classifying individuals as “multiple-race” if they select two or more races in response to the race
question. Other survey organizations (e.g., Pew Research Center (Pew 2015)) and social science
11
report having mixed-race Asian and White, or Black and White, heritage. We thus utilize the
term “biracial” to designate individuals of mixed racial ancestry—not those who necessarily label
themselves with multiple racial groups. In characterizing “biracial” in this way, we seek to have a
more inclusive definition of the term: one that does not omit people of mixed heritage who identify
with a single racial group, or those who are “second” or “third” generation multiracials. In doing
so, we hope to avoid essentializing race by employing an expansive categorization of “biracial” that
includes people who report having any mixed-race ancestry—even if they do not mark multiple
races to designate their identity.
3.2 Sampling the Biracial Population
We overcome the scarcity problem inherent in RDD samples by oversampling biracials from the
massive online panel maintained by YouGov, an international market research firm that specializes
in online polling and has pioneered the development of web-based panels as instruments for social
scientific research (for an overview of online research panels, see Vavreck and Iyengar (2005)).
The company uses a matching methodology for delivering online samples that mirror target adult
populations on key demographic attributes. In general terms, their approach mimics a random
probability sample by taking as the population a large pool (panel) of respondents who have
agreed to participate in Internet surveys conducted by the survey organization. To ensure that
the respondents in the panel are as diverse as possible, they are recruited by multiple means,
mostly through different forms of online advertising, but also by telephone-to-web and mail-to-
researchers (e.g., Rockquemore and Brunsma 2008; Khanna 2011; Allen, Garriott, Reyes and
Hsieh 2013; Wardle 1992; Nishimura 1995) define “biracial” individuals as those who report their
parents or grandparents to be of different races.
12
web recruitment. The YouGov U.S. panel includes more than one million participants, making it
possible to recruit over one thousand mixed-race adult respondents with particular combinations
of ethnic heritage.4
3.3 Measuring Racial Identity
Since group consciousness and social identity are multifaceted concepts, there is no single standard
approach to measuring them and psychologists have developed multiple indicators (Huddy 2013,
Sanchez 2006). The relevant measures include the sense of belonging to a group, positive feelings
for the in group and negative feelings for the out group, and the importance of group membership
(Cameron 2004). For their part, political scientists have measured racial group consciousness
through feelings of closeness to in-group members, the belief in linked fate, and perceptions of
group discrimination (McClain et al. 2009).
In our study, we deploy multiple indicators of racial identity and group consciousness, and
use three different measures to assess our respondents’ subjective identification with three racial
groups – Whites, Asians, and Blacks: the degree to which they express linked fate to different
racial groups, the degree to which individuals feel close to different racial groups, and the salience
4YouGov first identified every member of their panel who had checked multiple boxes on the
Census Bureau’s racial identity question. Each of them was then asked to select the particular
pairing of their parents’ ethnicity from a list consisting of five different racial categories. Those
who selected the African-American and White, and Asian and White categories were then invited
to participate in this survey. It is important to note that the definition of Asian is limited to
people of Japanese, Chinese, Korean, and East Asian origins; we thus exclude people from the
Indian sub-continent and Sri Lanka.
13
of their racial background to their sense of identity. We describe these indicators below.
(1) Our first measure of identity derives from Dawson’s (1994) conception of linked fate. Bira-
cial White-Black and monoracial Black respondents indicated their level of agreement or disagree-
ment with the statement, “as things get better for African-Americans in general, things get better
for me.” We directed two parallel questions, referencing Asian Americans and White Americans,
to our Asian, White, and biracial White-Asian respondents (linked fate).
(2) Perceived closeness is a standard political science measure of group identification (Huddy
2013). It is also a central component of group consciousness (Miller et al. 1981). Respondents
indicated the degree to which they felt close to each racial group (closeness), with responses
ranging from not at all close to very close.
(3) Our final indicator of identity assesses the salience of race to individuals’ sense of self.
Identity salience, as proposed by the social identity theorists, is a crucial component of group
identity and solidarity (Turner et al. 1987). Children whose ethnic identity is salient are more
likely to describe themselves in terms of their ethnicity (McGuire et al. 1978). Group salience also
strengthens the political impact of group identity (Huddy 2013), and promotes the advancement
of in-group bias (Mullen, Brown, and Smith 1992). Respondents rated the importance of several
personal attributes including their racial background “to your sense of personal identity.” The
non-racial traits included gender, age, religion, political beliefs, and occupation. To assess the
relative salience of race, we took the average importance (scored on a 0-1 metric) attributed to
the non-racial attributes and subtracted it from the salience of race (salience). Positive scores
indicate that race is assigned more importance than non-racial attributes.
14
3.4 Racial Affect
We included indicators of overt and covert racism in the survey instrument. In the case of the
former, we asked respondents to rate the applicability of a series of traits to Blacks, Asians, and
Whites. The positive traits included “high achievers in school,” “value work over pleasure,” and
“self-reliant.” The pejorative traits included “lack moral values,” “involved in drugs and gangs,”
and “insist on special privileges.” We rescaled the trait ratings to range from 0-1 (where 1 means
applicability of the trait), averaged across the positive and negative ratings, and then took the
difference in the two averages (stereotyping). Positive scores indicate greater applicability of
positive over negative traits to the group in question, i.e. favorable stereotypes.
Our measure of covert racism is the standard four-item racial resentment scale (Kinder and
Sanders 1996). Respondents indicated their agreement or disagreement with statements that
Blacks were lacking in work ethic, or conversely, held back by discriminatory practices. We
rescored the items to range from 0 to 1 and calculated the average across items. The higher the
score, the more racially resentful the individual (resentment).
Disguising the racial content of survey questions is one way of eliciting an admission of racial
bias from survey respondents. But the disguised measures suffer from liabilities, most notably,
their tendency to conflate racial prejudice with political ideology.5 Not surprisingly, there are many
(e.g., Carmines, Sniderman, and Easter, 2011) who question the validity of racial resentment as
measure of racial prejudice per se.
5For example, people who obtain high scores on the resentment measure believe in the greater
efficacy of individual effort over governmental intervention, beliefs also associated with political
conservatism (Sniderman and Carmines 1997).
15
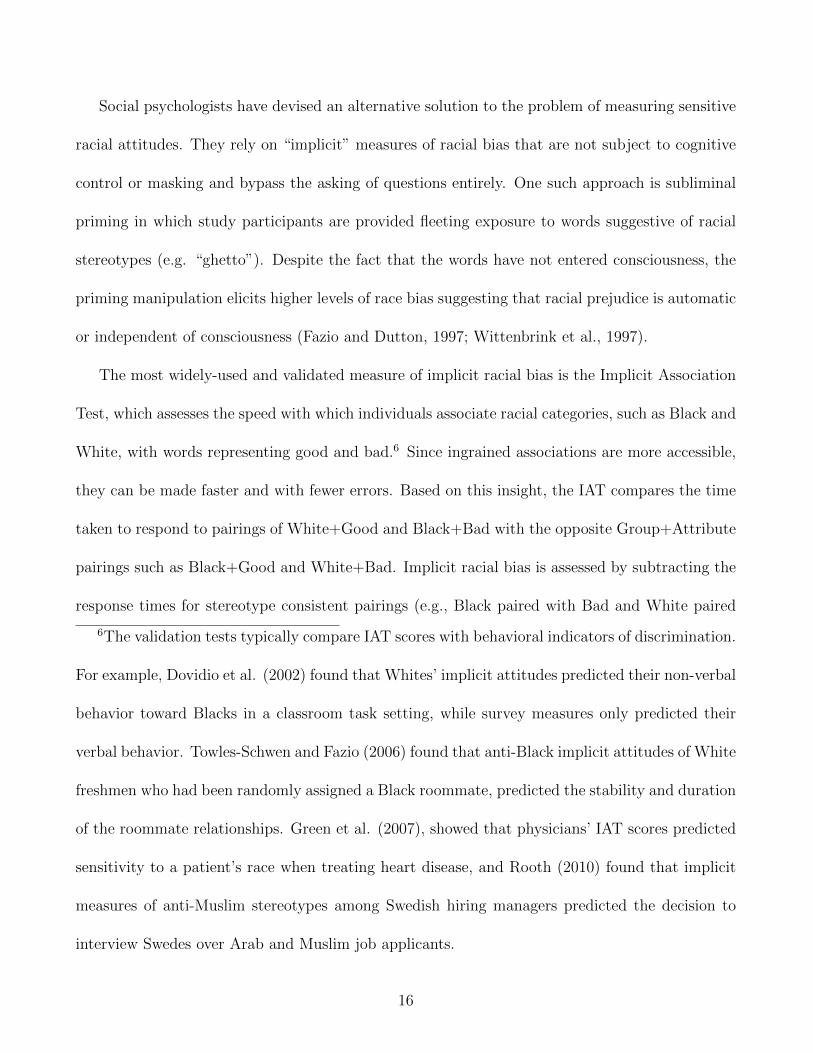
Social psychologists have devised an alternative solution to the problem of measuring sensitive
racial attitudes. They rely on “implicit” measures of racial bias that are not subject to cognitive
control or masking and bypass the asking of questions entirely. One such approach is subliminal
priming in which study participants are provided fleeting exposure to words suggestive of racial
stereotypes (e.g. “ghetto”). Despite the fact that the words have not entered consciousness, the
priming manipulation elicits higher levels of race bias suggesting that racial prejudice is automatic
or independent of consciousness (Fazio and Dutton, 1997; Wittenbrink et al., 1997).
The most widely-used and validated measure of implicit racial bias is the Implicit Association
Test, which assesses the speed with which individuals associate racial categories, such as Black and
White, with words representing good and bad.6 Since ingrained associations are more accessible,
they can be made faster and with fewer errors. Based on this insight, the IAT compares the time
taken to respond to pairings of White+Good and Black+Bad with the opposite Group+Attribute
pairings such as Black+Good and White+Bad. Implicit racial bias is assessed by subtracting the
response times for stereotype consistent pairings (e.g., Black paired with Bad and White paired
6The validation tests typically compare IAT scores with behavioral indicators of discrimination.
For example, Dovidio et al. (2002) found that Whites’ implicit attitudes predicted their non-verbal
behavior toward Blacks in a classroom task setting, while survey measures only predicted their
verbal behavior. Towles-Schwen and Fazio (2006) found that anti-Black implicit attitudes of White
freshmen who had been randomly assigned a Black roommate, predicted the stability and duration
of the roommate relationships. Green et al. (2007), showed that physicians’ IAT scores predicted
sensitivity to a patient’s race when treating heart disease, and Rooth (2010) found that implicit
measures of anti-Muslim stereotypes among Swedish hiring managers predicted the decision to
interview Swedes over Arab and Muslim job applicants.
16

with Good) from the response times for stereotype incompatible pairings (e.g., Black paired with
Good and White paired with Bad). Positive scores on the IAT represent faster associations when
Black is paired with Bad and White with Good (compared to the inverse), while negative values
represent faster sorting when Black is paired with good and White is paired with bad. In short,
positive IAT scores represent ingrained or implicit bias against Blacks. An effect size, or ”D score,”
that ranges from -2 to 2 is calculated for each participant based on this difference (for additional
details on scoring, see Greenwald et al., 2003).
In this paper, we use two different IATs: the standard version measuring implicit bias toward
Blacks, and the second substituting Asians for Blacks. In this White-Asian IAT, the target group
categories are represented by faces of Asian and White males (the identical faces used in the
White-Black IAT), while the positive and negative words remain the same. The scoring protocol
is identical across the two IATs, with positive scores representing anti-minority prejudice and
negative scores representing implicit prejudice against Whites.
The full version of the IAT takes more than 15 minutes to complete. We rely on the brief
version of the test (the BIAT) which consists of fewer trials and can be completed in less than
ten minutes. As in the full version, the D score in the BIAT focuses on the association between
positive and negative words and the target racial categories. Again, positive scores – reflecting
implicit pro-White or anti-Black (or anti-Asian) sentiment – indicate faster association of positive
words and White faces relative to positive words and Black/Asian faces, and faster association
of negative words with Black/Asian faces relative to negative words and White faces (for further
details on the BIAT scoring procedure, see Sriram & Greenwald, 2009).
In summary, we have multiple measures of two sets of racial attitudes, both assessing individu-
als’ psychological affinity toward racial groups. In all cases, we can estimate the precise attitudinal
17

gap or identity distance between multiracials, on the one hand, and the mono-racial groups that
define them, on the other. As we show below, mixed-race Blacks are much closer to Blacks than
Whites in their sense of racial identity and related evaluations of racial groups. Mixed-race Asians,
however, are somewhat more conflicted in their attitudes and often show dissimilarity with both
Whites and Asians.
3.5 Political Attitudes and Policy Preferences
Obviously, the changing ethnic diversity of the electorate can alter the electoral balance of power.
Given the strong divergence in political views between Blacks and Whites, we have strong grounds
for expecting mixed-race Blacks to tilt Democratic. Asians also lean toward the Democratic Party
and we might anticipate, given the groups under consideration, that the main partisan cleavage
will pit Whites against non-Whites.
We consider four indicators of political leanings. First, we examined the question of sorting.
Respondents were asked for their sense of party affiliation and liberal-conservative ideology. Over
the past decade, partisanship and ideology have increasingly become reinforcing rather than cross-
cutting ties as the number of conservative Democrats and liberal Republicans has dwindled. Here
we focus on sorted Democrats (there are insufficient non-White Republicans to do serious analysis
on both sides of the party divide) and define sorted Democrats as those who also identify as liberal.
We also examine two measures of policy preferences corresponding to the two major dimensions
on which the parties diverge: social welfare issues, and issues of cultural values. For the former,
we asked respondents whether they supported Obamacare and whether they preferred that the
federal government provide more or fewer social services. We combined the two questions to create
a measure of social welfare liberalism. High scorers favor Obamacare and want more services, low
18
scorers oppose both, and the middle category reflects conflicting views on these issues. We did the
same for the cultural divide, combining support for gay marriage and abortion into an indicator
of cultural liberalism.
Finally, scrutiny of police behavior and media attention toward cases of police mistreatment and
extrajudicial killings of Black individuals have increased since George Zimmerman’s 2013 acquittal
in the shooting of Trayvon Martin. In light of the concomitant growth of the “Black Lives Matter”
movement—which has been concentrated within the African-American community—we felt it
appropriate to ask respondents about their views on police treatment of minorities. Responses to
this question ranged from Excellent to Poor and were rescaled to range from 0 to 1, with higher
values indicating more negative views of police treatment.
4 Results
4.1 Racial Identity
Table 1 displays the percentage of respondents within each racial category agreeing that race is
important to their personal identity, or reporting high levels of closeness and linked fate to the
three monoracial groups. From Table 1, it is clear that race is far more salient for non-Whites and
biracials. In line with prior research, monoracial Blacks consistently report strong attachments
to their racial group. They are nearly 47 percentage points more likely than monoracial Whites
to report that race is important to their personal identity, and over 80% of Blacks report feeling
close to members of their racial group and believe their fate is linked. Monoracial Asians report
comparable levels of closeness to their racial group and the second highest levels of racial salience.
Although their sense of linked fate is weaker than that of monoracial Blacks, the difference is
19

surprisingly small when compared to findings from past research (Junn and Masuoka 2008).
Biracial White-Blacks and White-Asians are approximately 25 percentage points more likely
than Whites to report that their racial identity is important. Although they express a stronger
sense of linked fate with their minority affiliation than with Whites, they feel similarly close to
both reference groups. In contrast, monoracial Whites report the lowest salience of racial identity,7
and they are 15 percentage points less likely than monoracial Blacks to express a sense of racial
linked fate. Note, however, that the proportion of monoracial Whites who feel close to their racial
group is higher than that of monoracial Blacks.
WHITE WHITE-BLACK WHITE-ASIAN BLACK ASIANSalience of Race 35.7% 62.6% 60.3% 83.0% 68.5%Linked Fate to Whites 65.2 43.0 55.1 - -Linked Fate to Blacks - 76.7 - 80.5 -Linked Fate to Asians - - 67.3 - 75.0Closeness to Whites 89.6 76.8 81.3 54.7 63.8Closeness to Blacks 42.7 77.7 30.0 86.4 28.9Closeness to Asians 47.3 43.7 80.9 37.4 86.5
Table 1: Racial Identity by Racial Background. Percentages reflect responses that race is “Fairlyimportant” or “Very important” to one’s personal identity; agreement that one’s fate is linkedto different racial groups; and the number responding “Fairly close” or “Very close” to differentracial groups on the closeness question.
Of course, the five racial groups differ on many background characteristics other than race, and
race may not be the only salient feature of their identity. Figure 1 presents regression estimates
of the salience of racial identity relative to other background traits. Accounting for these other
features and statistically controlling for demographic differences, we find that non-Whites and
biracials are indeed more likely than monoracial Whites to see race as important to their sense of
identity. Surprisingly, when controlling for these correlates, we also find that monoracial Asians
are just as likely as monoracial Blacks to believe race is important, with biracial Asians locating
7Only 12% report that race is “Very important” to their personal identity.
20

Asian
White−Asian
White
White−Black
Black
−0.2 −0.1 0.0 0.1 0.2
●
●
●
●
●
Salience of Race
Figure 1: Regression Estimates of Relative Salience of Race to Personal Identity. Note: Highervalues of the dependent variable indicate greater relative salience of race to respondent’s personalidentity. Error bars reflect 95% confidence intervals. Bold segments represent 90% confidenceintervals.
themselves between their two affiliation groups. Although the results indicate that White-Black
and White-Asian biracials are more likely to think of themselves in racial terms than Whites,
these results alone cannot speak to whether those racial identities are singularly White, singularly
minority, or distinctly biracial.
The regression estimates of the sense of linked fate in Figure 2 shed light on this question.
Clearly, biracials are less likely than monoracial Whites to believe that their treatment as indi-
viduals is contingent on the treatment of other Whites. But biracials are also less likely than
non-Whites to link their fate to treatment of their monoracial minority group. To get a sense of
the relative strength of these identities, we can compare the predicted probability of a biracial
respondent “somewhat” or “strongly” agreeing that their fate is linked to each group. Here the
question poses a direct competition between their dual ethnicities as each biracial group compared
their personal outcomes to group outcomes accruing to both their parental groups. The results
of the competition proved quite one-sided. As expected, the sense of linked fate proved much
stronger for their minority affiliation than with their affiliation with the dominant racial group.
Biracial Asians are considerably more likely to express linked fate with monoracial Asians (.60)
21

than monoracial Whites (.36). Among biracial Blacks, the difference between these perceived ties
is even greater (.43 versus .74).
●
●
●
●
(a) Linked Fate To Whites
(b) Linked Fate To Blacks
(c) Linked Fate To Asians
White−Asian
White−Black
White−Black
White−Asian
−0.3 −0.2 −0.1 0.0 0.1 0.2
Difference from Monoracial Group
Figure 2: Ordered Logistic Regression Estimates of Linked Fate to Major Racial Groups. Note:Higher values of the dependent variable indicate greater perceived linked fate to the target group.Error bars reflect 95% confidence intervals. Bold segments represent 90% confidence intervals.
The linked fate results replicate when we consider perceived closeness to different racial groups,
in Figure 3. Biracials are less likely than monoracial Whites to feel close to Whites, and more
likely to feel close to their minority reference group. However, because all groups were asked about
closeness to each of the three major racial groups, we can compare biracial Blacks and Asians to
their monoracial minority counterparts. Both biracial groups were more likely to express feelings
of closeness to Whites than monoracial Blacks and Asians. White-Blacks were slightly less likely
than monoracial Blacks to report closeness to their racial in-group. However, the corresponding
difference between White-Asians and monoracial Asians was close to zero. The takeaway here is
that biracial groups place themselves closer to the non-White than White element of their lineage.
22

The closeness gap between biracials and Whites on closeness to Whites was considerably larger
than the gap between biracials and their non-White heritage group on closeness to Blacks and
Asians. Because Blacks register by far the lowest level of closeness to whites (.53), this is the one
indicator on which White-Blacks fall closer to Whites.
Extrapolating across the multiple indicators of identity, it is clear that biracial Blacks distin-
guish themselves from Whites and identify more as Blacks. This pattern also applies, but not as
strongly, to biracial Asians. Taken together, these results are consistent with the racial distinc-
tiveness hypothesis. When considering their racial identity, biracials align themselves with their
minority heritage. In a society with a long tradition of racial inequality, biracial Americans take
pains to avoid identifying with the “oppressor” group. However, the evidence also reveals that
biracials see themselves as dissimilar from non-White monoracial groups, suggesting that in some
cases theirs is a hybrid identity. Although biracials are more likely to resemble their non-White
minority reference group, their racial attachments are slightly weaker.
4.2 Racial Affect
The differences across the five groups in the overt and covert racial affect measures appear in Fig-
ures 4 and 5. The location of the five groups generally mirrors their positioning on the identity di-
mension, with notable differences between biracials and monoracial Blacks and Whites. Beginning
with racial stereotypes, it is clear that anti-Black prejudice is strongest among Asians, Whites, and
White-Asians, who associate Blacks with negative rather than positive traits (regression-adjusted
stereotype means between -.13 and -.12). Biracial White-Blacks, on the other hand, hold the most
favorable stereotype of Blacks (.08), suggesting that they are just as much members of the in-
group as monoracial Blacks (.07). Interestingly, biracial Blacks’ stereotypes of Blacks are slightly
23

●
●
●
●
●
●
●
●
●
●
●
●
(a) Closeness To Whites
(b) Closeness To Blacks
(c) Closeness To Asians
White−Asian
Asian
White−Black
Black
White−Asian
Asian
White−Black
Black
White−Asian
Asian
White−Black
Black
−0.4 −0.2 0.0 0.2 0.4
Difference from Monoracial Whites
Figure 3: Ordered Logistic Regression Estimates of Closeness to Major Racial Groups. Highervalues of the dependent variable indicate greater perceived closeness to the target group. Errorbars reflect 95% confidence intervals. Bold segments represent 90% confidence intervals.
more positive than their stereotype of Whites. Overall, the stereotype ratings suggest that in
their evaluations of Whites and Blacks, biracial White-Blacks cannot be distinguished from their
monoracial counterparts.
In contrast to the generally unflattering stereotype of Blacks, and in keeping with prior research
(see Masuoka & Junn, 2013), virtually everyone considers Asians a “model minority.” Once again,
in-group affect is slightly higher among the biracial group (mean = 1.10), but not significantly
more positive than that held by monoracial Asians (mean = 1.07). More generally, 4, biracial
White-Asians and Asians position themselves closer to Whites than to Blacks on affect toward
non-White groups. However, the proximity is less a symptom of “Whiteness” on the part of
biracial and monoracial Asians than it is attributable to Whites’ negative stereotype of Blacks
24

and overwhelmingly favorable stereotype of Asians (mean = 1.07). What is especially striking is
that Blacks’ and Whites’ views of Asians are far more favorable than their own in-group rating.
For Whites, views of Asians are almost ten times more favorable than their stereotype of Whites
(mean = .11)! For Blacks, the imbalance in group stereotypes is even more startling: their ratings
of Asians are fifteen times more positive than their ratings of fellow Blacks.
●
●
●
●
●
●
●
●
●
●
●
●
●
●
●
(a) White Stereotypes
(b) Black Stereotypes
(c) Asian Stereotypes
Asian
White−Asian
White
White−Black
Black
Asian
White−Asian
White
White−Black
Black
Asian
White−Asian
White
White−Black
Black
0.0 0.4 0.8 1.2
Stereotype Index
Figure 4: Regression Estimates of Overt Racial Affect. Note: Higher values of the dependentvariable indicate more positive stereotypes of the target group. Error bars reflect 95% confidenceintervals. Bold segments represent 90% confidence intervals.
Compared to the stereotype questions, racial resentment represents a less malevolent view of
Blacks. Rather than asking respondents to associate low academic achievement, immorality, and
criminality with African-Americans, the questions constituting the resentment index are limited to
Blacks’ commitment to the work ethic and self-help. Expressing resentment therefore requires less
“difficulty” than expressing a harsh stereotype. When examining the unadjusted means, Whites’
25

and Asians’ level of racial resentment easily exceeds their tendency to stereotype Blacks negatively.
Whites’ unadjusted mean resentment score of .69 is more than two-thirds of the way toward the
maximum score possible. However, their regression-adjusted mean net Black stereotype score (-
.12) and racial resentment score (.52) both fall closer to the midpoint of their respective scales. The
resentment scale also divides Asians from Blacks; on this measure of anti-Black animus, Asians
once again align themselves with Whites. Unsurprisingly, on the other side of the race divide,
Blacks and White-Blacks have half to two-thirds the level of resentment as Whites.
Finally, we turn to our implicit measures of racial bias. Recall that IAT scores greater than the
midpoint of 0 represent anti-minority implicit bias (i.e., faster associations of the minority group
and “bad” and the majority group and “good” pairings). On both IATs, Whites register positive
scores significantly higher than 0. The unadjusted difference in the average D score between
Whites and monoracial Blacks/Asians amounts to around .2 (both significant at the .001 level).
Since the practical range of the D score is -.8 through .8 (accounting for 95 percent of the cases),
the difference in implicit bias between Whites and Blacks (and Whites and Asians) amounts to
13 percent of the observed range. The .23 difference between Blacks and Whites on the IAT
would have the effect of moving an individual from the 47th to 68th percentile of IAT scores. The
regression-adjusted estimates in Figure 5 show these differences persist, albeit on a smaller scale,
when controlling for demographic correlates.
An important finding from the IAT concerns the location of White-Blacks. As Figure 5 reveals,
they fall closer to Whites on the D score than on any of the survey indicators of racial identity and
affect. Without controlling for covariates, their D score is .14 points lower than Whites (highly
significant), and .09 points higher than Blacks (also highly significant). At the level of explicit
racial attitudes, there are conscious considerations that prompt biracial Blacks to respond as
26
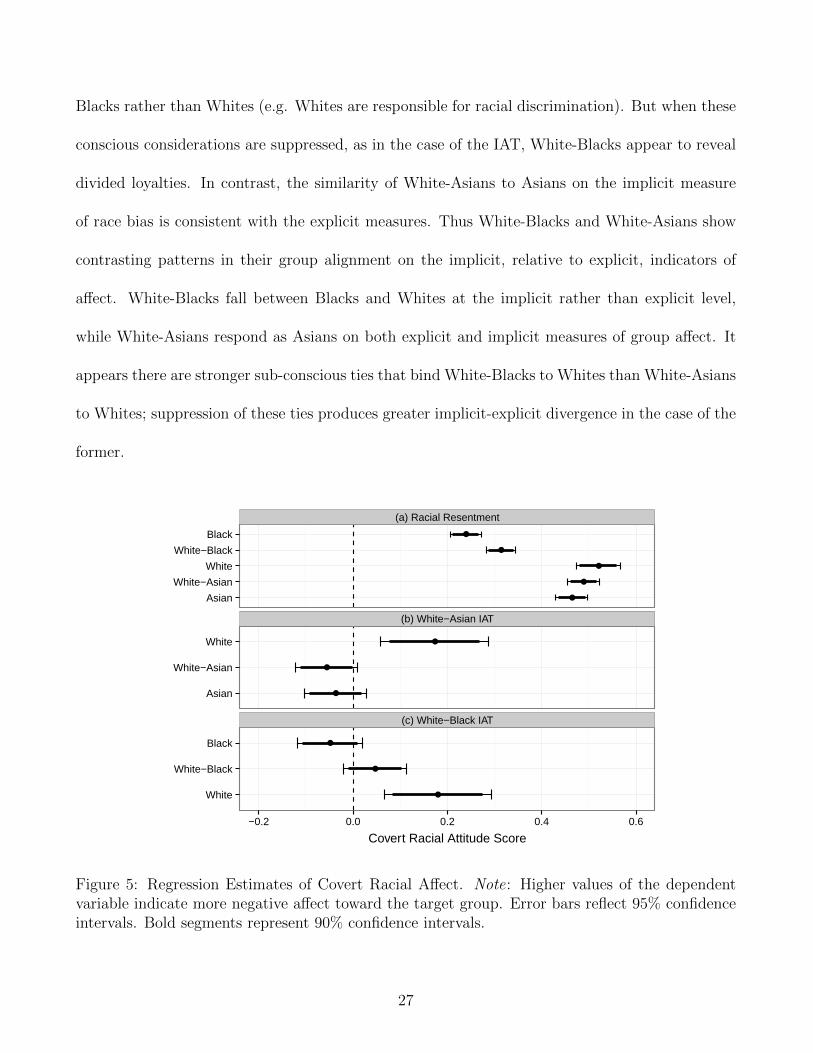
Blacks rather than Whites (e.g. Whites are responsible for racial discrimination). But when these
conscious considerations are suppressed, as in the case of the IAT, White-Blacks appear to reveal
divided loyalties. In contrast, the similarity of White-Asians to Asians on the implicit measure
of race bias is consistent with the explicit measures. Thus White-Blacks and White-Asians show
contrasting patterns in their group alignment on the implicit, relative to explicit, indicators of
affect. White-Blacks fall between Blacks and Whites at the implicit rather than explicit level,
while White-Asians respond as Asians on both explicit and implicit measures of group affect. It
appears there are stronger sub-conscious ties that bind White-Blacks to Whites than White-Asians
to Whites; suppression of these ties produces greater implicit-explicit divergence in the case of the
former.
●
●
●
●
●
●
●
●
●
●
●
(a) Racial Resentment
(b) White−Asian IAT
(c) White−Black IAT
Asian
White−Asian
White
White−Black
Black
Asian
White−Asian
White
White
White−Black
Black
−0.2 0.0 0.2 0.4 0.6
Covert Racial Attitude Score
Figure 5: Regression Estimates of Covert Racial Affect. Note: Higher values of the dependentvariable indicate more negative affect toward the target group. Error bars reflect 95% confidenceintervals. Bold segments represent 90% confidence intervals.
27

4.3 Political Views
As anticipated, with the exception of Whites, who are more likely to favor the Republicans, all the
racial groups identify disproportionately as Democrats (see Table 3). The Democratic advantage
over Republicans is largest for Blacks (50 percentage points), followed by biracial Blacks (+35),
Asians (+17) and biracial Asians (+11). These data suggest that any increase in the biracial
population is not good news for Republicans.
Ideology is a different matter. The sample is narrowly more conservative than liberal, with the
gap being largest for Whites (-.22). The liberal advantage is greatest in the two biracial groups.
While Asians are split down the middle ideologically, surprisingly, a considerable number of Blacks
in our sample see themselves as conservatives. Weighting these estimates to population bench-
marks reveals a narrow conservative plurality (-.03). As we will see shortly, Black conservatism
reflects their views on cultural issues.
WHITE WHITE-BLACK WHITE-ASIAN BLACK ASIANRepublican 28.1% 9.0% 21.6% 4.8% 20.5%Ind/Other 40.6 44.5 42.5 24.2 40.6Democrat 31.3 45.8 36.0 71.0 38.9Liberal 25.2 33.1 33.5 32.4 25.5Moderate 37.2 44.6 40.2 49.9 49.5Conservative 37.6 22.3 26.3 17.7 25.1Sorted Democrats 51.2 43.1 56.1 37.4 40.2
Table 2: Political Views by Racial Background. Percentages reflect party identification withineach group; political ideology within each group; support for both Obamacare and increasedgovernment spending; and proportion of self-reported Democrats also identifying as liberal.
Sorting is a harbinger of polarization. Democrats who also see themselves as liberals are more
likely to take more extreme left-oriented stances on the issues and also believe more strongly
in the misguidedness of their opponents. Given the tendency of Blacks to label themselves as
conservative, it is not surprising they are the least sorted Democratic racial group. As a result,
28

this is one of the few instances in which White-Blacks, who are more sorted, differ significantly
from Blacks. Interestingly, the most sorted group is White-Asians.
White−Asian
Asian
White−Black
Black
−0.4 −0.2 0.0 0.2
●
●
●
●
Difference from Monoracial Whites
Figure 6: Logistic Regression Estimates of Partisan Sorting. Note: Error bars reflect 95% confi-dence intervals. Bold segments represent 90% confidence intervals.
As Table 3 shows, White-Asians tend to be liberal “cultural warriors.” They support same-sex
marriage and abortion by a comfortable margin, and are more liberal on cultural than welfare
issues. The conservatism of Blacks on this issue produces a wide gap between monoracial and
biracial Blacks, with the latter group reporting even less support for both policy stances than
Whites. These data suggest that increasing diversity of the U.S. population alone will not neces-
sarily advantage one party over another. The form this diversity takes is more consequential. If
growth is primarily driven by increases in the mixed-race population, candidates taking conserva-
tive positions on cultural issues will be disadvantaged.8
8The findings here are being driven by the fact that people sometimes just don’t think of
abortion/same-sex marriage and Obamacare/spending as being part of the same policy domain.
Anywhere between 20-30% of each subgroup is conflicted on these issues. So while in general it
is true that at least one monoracial minority group is liberal on any of these issues–and biracials
are always more liberal than they are–combining the issues into a single measure obscures this
pattern.
29
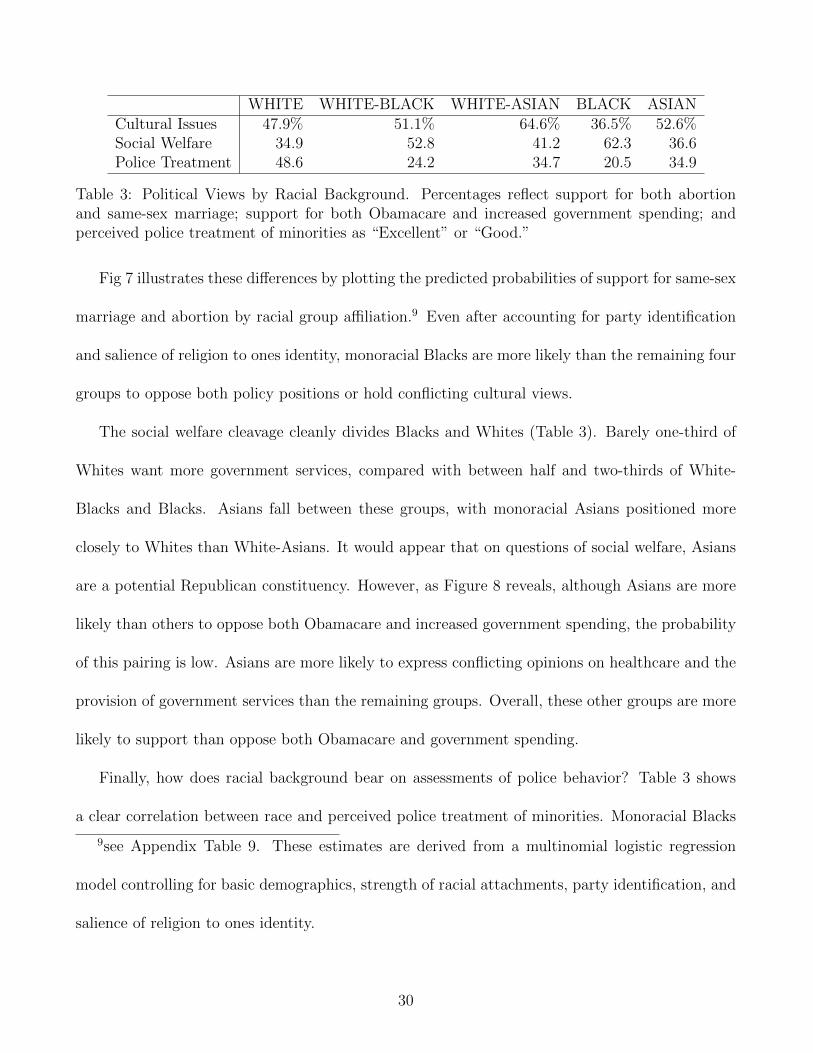
WHITE WHITE-BLACK WHITE-ASIAN BLACK ASIANCultural Issues 47.9% 51.1% 64.6% 36.5% 52.6%Social Welfare 34.9 52.8 41.2 62.3 36.6Police Treatment 48.6 24.2 34.7 20.5 34.9
Table 3: Political Views by Racial Background. Percentages reflect support for both abortionand same-sex marriage; support for both Obamacare and increased government spending; andperceived police treatment of minorities as “Excellent” or “Good.”
Fig 7 illustrates these differences by plotting the predicted probabilities of support for same-sex
marriage and abortion by racial group affiliation.9 Even after accounting for party identification
and salience of religion to ones identity, monoracial Blacks are more likely than the remaining four
groups to oppose both policy positions or hold conflicting cultural views.
The social welfare cleavage cleanly divides Blacks and Whites (Table 3). Barely one-third of
Whites want more government services, compared with between half and two-thirds of White-
Blacks and Blacks. Asians fall between these groups, with monoracial Asians positioned more
closely to Whites than White-Asians. It would appear that on questions of social welfare, Asians
are a potential Republican constituency. However, as Figure 8 reveals, although Asians are more
likely than others to oppose both Obamacare and increased government spending, the probability
of this pairing is low. Asians are more likely to express conflicting opinions on healthcare and the
provision of government services than the remaining groups. Overall, these other groups are more
likely to support than oppose both Obamacare and government spending.
Finally, how does racial background bear on assessments of police behavior? Table 3 shows
a clear correlation between race and perceived police treatment of minorities. Monoracial Blacks
9see Appendix Table 9. These estimates are derived from a multinomial logistic regression
model controlling for basic demographics, strength of racial attachments, party identification, and
salience of religion to ones identity.
30

60
40
20
100
80 60 40
60
40
20
Conflicting Views
Support Both
Oppose Both
Con
flict
ing
Support
Oppose
Racial Group
Asian
Black
White
White−Asian
White−Black
Figure 7: Predicted Probabilities of Support for Gay Marriage and Abortion.
hold the police in lowest regard. This is not surprising, as tensions between police and minority
communities have escalated in the aftermath of Ferguson and subsequent high-profile cases of
police killing unarmed black men. In contrast, monoracial Whites have the most favorable view
of law enforcement as it applies to racial minorities. They are nearly 30 percentage points more
likely than Blacks to say police treatment of non-Whites is “Excellent” or “Good,” but are still
divided on this question.
These zero-order differences in attitudes may, of course, become attenuated when factors that
influence political preferences are introduced as covariates. As Figure 9 demonstrates, perceptions
of police treatment among Blacks and Asians are not markedly dissimilar once we control for
31

60
40
20
100
80 60 40
60
40
20
Conflicting Views
Support Both
Oppose Both
Con
flict
ing
Support
Oppose
Racial Group
Asian
Black
White
White−Asian
White−Black
Figure 8: Predicted Probabilities of Support for Obamacare and Increased Government Spendingfor Provision of Services.
demographics, party identification, and strength of racial attachments and affect, with only White-
Blacks significantly departing from the views of Whites. However, differences in perceptions of
police (mis)treatment are not artifacts of age-related or educational differences across the groups.
Instead, much of the variance in responses to this question is explained by the differences in racial
identity and affect we describe above (see Appendix Table 8).
5 General Discussion and Conclusion
Historically, biracial individuals, especially those of African heritage, have generally been con-
strained to the one-drop rule, identifying exclusively with their minority race (Nobles 2000; White
32

White−Asian
Asian
White−Black
Black
−0.2 −0.1 0.0 0.1 0.2
●
●
●
●
Difference from Monoracial Whites
Figure 9: Ordered Logistic Regression Estimates of Perceptions of Police Treatment of Minorities.Note: Higher values of the dependent variable indicate more negative perceived treatment. Errorbars reflect 95% confidence intervals. Bold segments represent 90% confidence intervals.
1948; Bureau of the Census 1930). But since the changing of the U.S. Census race question in
2000, millions of Americans have begun labeling themselves with multiple races on government
forms. With intermarriage rates currently at record highs—1 in 7 new marriages are interracial
or interethnic (Wang 2012)—the overall proportion of the U.S. population that is of mixed-race
will increase steadily over the next several decades. As members of the multiple-race population
come of age, they will likely become a crucial voting bloc in the future.
Here, we have examined some of the political consequences of this changing landscape. Overall,
our findings suggest that, despite our society’s increasingly blurred racial boundaries, biracial
White-Black and White-Asian Americans continue to identify primarily as racial minorities, both
socially and politically. All told, our data provide no support whatsoever for hegemonic accounts of
racial identity, and instead are consistent with the theory that biracials view themselves as racially
distinct. Despite their mixed heritage, biracials are more similar to non-Whites than to Whites in
their racial and political attitudes. The pattern is especially pronounced for biracial Blacks who,
more often than not, exhibit more “Blackness” in their attitudes than monoracial Blacks. Clearly,
White-Blacks see themselves as not White. When biracial Asians express attitudes similar to those
33
of Whites’, monoracial Asians do as well, suggesting that individuals of White-Asian heritage align
with Whites only when it does not conflict with their minority group affiliation.
The findings presented above extend previous research on subgroup differences in strength of
racial attachments. When conscious processing of attitudes is not possible and race becomes more
a primal rather than considered identity, biracial blacks move toward the middle and show greater
affinity with Whites on the IAT than on the survey indicators of racial affect. Biracial Asians are
likely to see themselves as Asians both consciously and sub-consciously. One possible explanation
for the consistent positioning of biracial Asians on the implicit and explicit measures of affect is
that they are more distinct from Whites on multiple dimensions, including ethnicity, nationality,
and language.
In sum, we find evidence that biracials stake out a distinct identity—one which occasionally
diverges from their heritage groups. On matters of racial attachment, biracials partially bridge
the difference between their monoracial White and non-White counterparts, but overall remain
close to their minority affiliation. On political issues, however, the politics of biracial Americans
generally tilts left of monoracial minority groups.10 Overall, biracials are more likely to identify
as Democrats and liberals, favor more rather than less government services, and are in favor of
gay rights and a woman’s right to choose. Growth in the multiple-race population, at least in
terms of the biracial groups considered here, seems likely to benefit the Democratic Party. The
Democrats, as the party of civil rights, offer a clear ideological and value-based affinity that will
be difficult for Republicans to neutralize. As the size of the multiple-race population increases, it
10These findings are consistent with those of Davenport (2016a), who shows that biracials of
White-Black parentage are often more socially liberal than their monoracial White and Black
peers.
34

appears inevitable that the Republican Party will either have to abandon their hard line stance
on issues of concern to minorities or abandon any hopes of appealing for their votes.
Finally, a note on the context of this study. Coming in the aftermath of the Ferguson unrest
and the avalanche of news reports focusing on police violence targeted at minorities, it is likely
that the identity distance between biracials and Whites may have been enlarged in this relatively
charged environment. At the very least, the salience of this theme is likely to have made race and
ethnicity more central ingredients of biracials’ sense of personal identity.
35
Salience
(Intercept) −0.16 [−0.21; −0.10]Demographics
Age −0.00 [−0.00; 0.00]Some College 0.02 [−0.01; 0.05]College Grad −0.02 [−0.05; 0.02]Female 0.04 [0.02; 0.06]Income −0.00 [−0.00; 0.00]South 0.01 [−0.02; 0.03]
Racial GroupWhite-Black 0.20 [0.16; 0.24]White-Asian 0.19 [0.15; 0.23]Black 0.27 [0.23; 0.31]Asian 0.30 [0.26; 0.33]
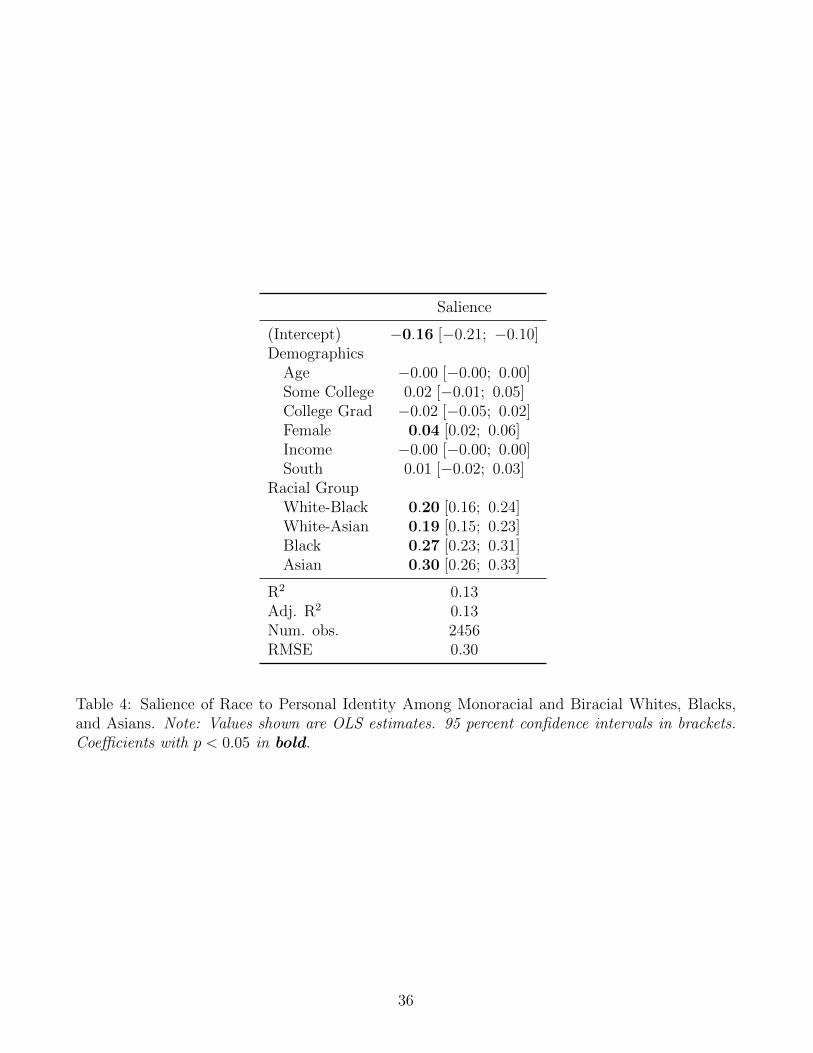
R2 0.13Adj. R2 0.13Num. obs. 2456RMSE 0.30
Table 4: Salience of Race to Personal Identity Among Monoracial and Biracial Whites, Blacks,and Asians. Note: Values shown are OLS estimates. 95 percent confidence intervals in brackets.Coefficients with p < 0.05 in bold.
36

To Whites To Blacks To Asians
DemographicsAge −0.00 [−0.01; 0.00] −0.00 [−0.01; 0.01] −0.03 [−0.04; −0.02]Some College −0.11 [−0.32; 0.10] 0.14 [−0.12; 0.39] 0.13 [−0.22; 0.48]College Grad 0.19 [−0.04; 0.42] 0.11 [−0.21; 0.44] 0.63 [0.29; 0.98]Female −0.53 [−0.70; −0.35] 0.14 [−0.09; 0.37] 0.08 [−0.18; 0.34]Income 0.05 [0.02; 0.08] −0.00 [−0.04; 0.03] 0.02 [−0.02; 0.07]South −0.03 [−0.22; 0.15] 0.03 [−0.21; 0.26] 0.01 [−0.31; 0.33]
Racial GroupWhite-Black −0.74 [−0.97; −0.51] −0.14 [−0.40; 0.11]White-Asian −0.38 [−0.62; −0.14] −0.28 [−0.55; −0.00]
AIC 4405.03 2507.38 1909.72BIC 4465.23 2556.95 1957.03Log Likelihood -2191.51 -1243.69 -944.86Deviance 4383.03 2487.38 1889.72Num. obs. 1760 1051 838
Table 5: Perceptions of Linked Fate to Major Racial Groups Among Monoracial and BiracialWhites, Blacks, and Asians. Note: Values shown are ordered logistic regression estimates with 95percent confidence intervals. Coefficients with p < 0.05 in bold.
37

To Whites To Blacks To Asians
DemographicsAge 0.01 [0.00; 0.01] 0.00 [−0.00; 0.01] 0.00 [−0.00; 0.01]Some College −0.11 [−0.29; 0.07] −0.11 [−0.29; 0.07] −0.13 [−0.31; 0.04]College Grad −0.22 [−0.41; −0.02] −0.30 [−0.49; −0.10] 0.02 [−0.17; 0.21]Female −0.04 [−0.18; 0.11] 0.25 [0.10; 0.40] −0.29 [−0.44; −0.14]Income 0.05 [0.02; 0.07] −0.02 [−0.05; 0.00] 0.03 [0.01; 0.06]South 0.06 [−0.10; 0.22] 0.22 [0.07; 0.38] −0.01 [−0.17; 0.15]
Racial GroupWhite-Black −0.70 [−0.93; −0.47] 1.87 [1.64; 2.11] 0.04 [−0.18; 0.26]White-Asian −0.67 [−0.91; −0.43] −0.33 [−0.56; −0.09] 1.61 [1.37; 1.85]Black −1.92 [−2.16; −1.67] 2.41 [2.16; 2.67] −0.31 [−0.54; −0.08]Asian −1.36 [−1.60; −1.12] −0.10 [−0.33; 0.13] 1.90 [1.66; 2.15]
AIC 5828.24 6049.96 6148.63BIC 5904.33 6126.05 6224.69Log Likelihood -2901.12 -3011.98 -3061.32Deviance 5802.24 6023.96 6122.63Num. obs. 2574 2574 2568
Table 6: Perceptions of Closeness to Major Racial Groups Among Monoracial and Biracial Whites,Blacks, and Asians. Note: Values shown are ordered logistic regression estimates with 95 percentconfidence intervals. Coefficients with p < 0.05 in bold.
38

White-Asian IAT White-Black IAT
(Intercept) 0.17 [0.06; 0.29] 0.18 [0.07; 0.29]Demographics
Age −0.00 [−0.00; 0.00] −0.00 [−0.00; 0.00]Some College −0.05 [−0.12; 0.01] 0.02 [−0.04; 0.07]College Grad 0.01 [−0.05; 0.08] 0.05 [−0.01; 0.12]Female 0.00 [−0.05; 0.05] −0.04 [−0.09; 0.01]Income 0.01 [0.00; 0.02] −0.00 [−0.01; 0.01]South 0.02 [−0.04; 0.08] 0.06 [0.01; 0.11]
Racial GroupWhite-Black −0.21 [−0.28; −0.14]Black −0.23 [−0.29; −0.16]White-Asian −0.13 [−0.20; −0.07]Asian −0.23 [−0.30; −0.16]
R2 0.06 0.04Adj. R2 0.06 0.04Num. obs. 1036 1110RMSE 0.40 0.42
Table 7: Implicit Affect Toward Major Racial Groups Among Monoracial and Biracial Whites,Blacks, and Asians. Note: Values shown are OLS point estimates with 95 percent confidenceintervals. Coefficients with p < 0.05 in bold.
39

More Negative
DemographicsAge −0.02 [−0.02; −0.01]Some College −0.31 [−0.53; −0.09]College Grad −0.23 [−0.47; 0.00]Female 0.08 [−0.11; 0.26]Income −0.01 [−0.04; 0.02]South −0.14 [−0.34; 0.06]
Racial GroupWhite-Black 0.39 [0.09; 0.69]White-Asian 0.25 [−0.06; 0.55]Black −0.18 [−0.53; 0.17]Asian 0.09 [−0.23; 0.41]
Identity and AffectLinked Fate 0.00 [−0.11; 0.11]Salience of Race 0.33 [0.23; 0.42]Closeness to Whites −0.41 [−0.53; −0.28]Closeness to Blacks 0.25 [0.13; 0.36]Closeness to Asians −0.09 [−0.20; 0.03]IAT Score −0.24 [−0.45; −0.02]
Party IdentificationIndependent/Other 1.07 [0.80; 1.34]Democrat 1.33 [1.05; 1.60]
AIC 3677.94BIC 3788.51Log Likelihood -1818.97Deviance 3637.94Num. obs. 1861
Table 8: Perceptions of Police Treatment of Minorities Among Monoracial and Biracial Whites,Blacks, and Asians. Note: Values shown are ordered logistic regression estimates with 95 percentconfidence intervals. Coefficients with p < 0.05 in bold.
40

Conflicting Views Oppose Both
(Intercept) −0.06 [−1.02; 0.89] −1.89 [−2.98; −0.79]Demographics
Age 0.00 [−0.00; 0.01] 0.02 [0.01; 0.03]Some College −0.35 [−0.65; −0.06] −0.04 [−0.39; 0.31]College Grad −0.39 [−0.71; −0.07] 0.07 [−0.30; 0.45]Female −0.30 [−0.55; −0.04] −0.37 [−0.67; −0.07]Income 0.02 [−0.02; 0.06] −0.03 [−0.08; 0.01]South 0.30 [0.03; 0.57] 0.27 [−0.04; 0.58]
Racial GroupWhite-Black 0.51 [0.10; 0.92] 0.50 [0.02; 0.97]White-Asian −0.40 [−0.83; 0.04] −0.25 [−0.74; 0.25]Black 1.09 [0.60; 1.59] 1.61 [1.06; 2.16]Asian 0.38 [−0.06; 0.82] 0.54 [0.01; 1.06]
Identity and AffectLinked Fate 0.02 [−0.13; 0.18] 0.06 [−0.11; 0.24]Salience of Race −0.23 [−0.36; −0.09] −0.41 [−0.56; −0.25]Closeness to Whites −0.03 [−0.19; 0.13] 0.01 [−0.19; 0.20]Closeness to Blacks −0.05 [−0.21; 0.10] −0.10 [−0.28; 0.08]Closeness to Asians −0.04 [−0.19; 0.12] 0.00 [−0.18; 0.19]IAT Score −0.08 [−0.38; 0.23] 0.24 [−0.12; 0.59]Salience of Religion 0.54 [0.43; 0.65] 1.14 [1.00; 1.29]
Party IdentificationIndependent/Other −1.19 [−1.58; −0.81] −1.87 [−2.28; −1.46]Democrat −1.87 [−2.27; −1.46] −2.93 [−3.40; −2.47]
AIC 3103.70 3103.70BIC 3324.45 3324.45Log Likelihood -1511.85 -1511.85Deviance 3023.70 3023.70Num. obs. 1875 1875
Table 9: Cultural Preferences Among Monoracial and Biracial Whites, Blacks, and Asians. Note:Dependent variable measures whether respondents support both abortion and same-sex marriage,oppose both, or have conflicting views on these issues. Omitted category is “Supports Both.”Values shown are multinomial logistic regression estimates with 95 percent confidence intervals.Coefficients with p < 0.05 in bold.
41
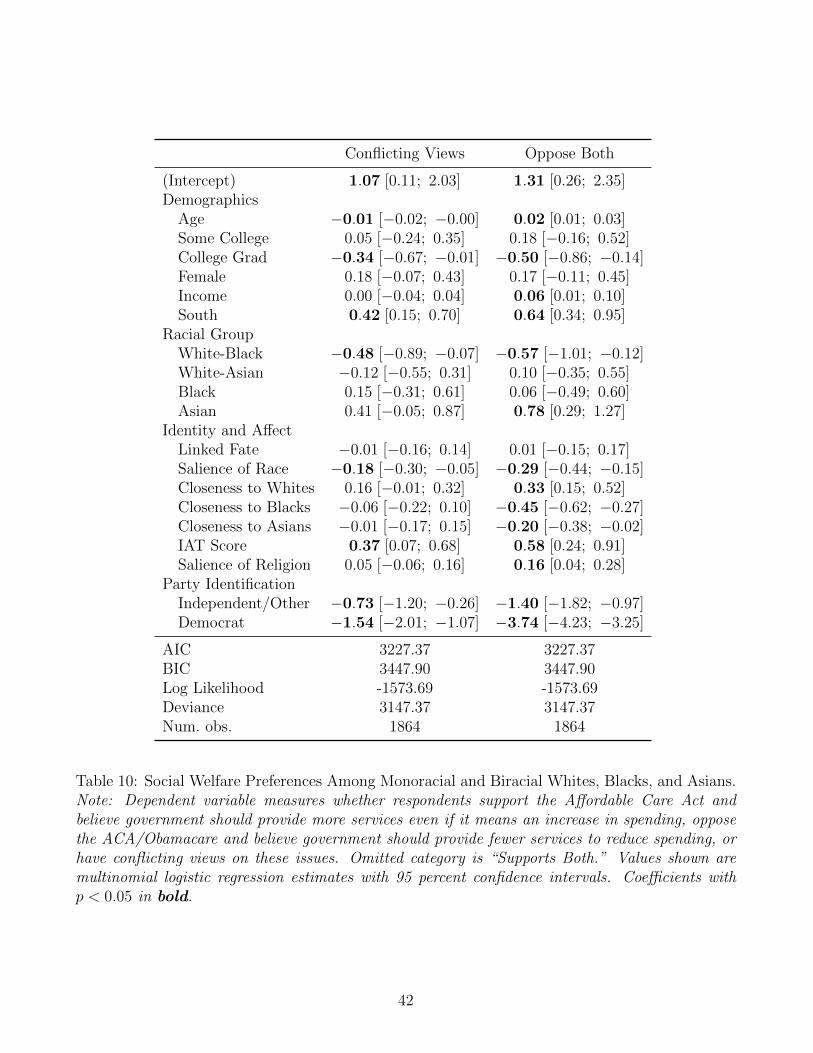
Conflicting Views Oppose Both
(Intercept) 1.07 [0.11; 2.03] 1.31 [0.26; 2.35]Demographics
Age −0.01 [−0.02; −0.00] 0.02 [0.01; 0.03]Some College 0.05 [−0.24; 0.35] 0.18 [−0.16; 0.52]College Grad −0.34 [−0.67; −0.01] −0.50 [−0.86; −0.14]Female 0.18 [−0.07; 0.43] 0.17 [−0.11; 0.45]Income 0.00 [−0.04; 0.04] 0.06 [0.01; 0.10]South 0.42 [0.15; 0.70] 0.64 [0.34; 0.95]
Racial GroupWhite-Black −0.48 [−0.89; −0.07] −0.57 [−1.01; −0.12]White-Asian −0.12 [−0.55; 0.31] 0.10 [−0.35; 0.55]Black 0.15 [−0.31; 0.61] 0.06 [−0.49; 0.60]Asian 0.41 [−0.05; 0.87] 0.78 [0.29; 1.27]
Identity and AffectLinked Fate −0.01 [−0.16; 0.14] 0.01 [−0.15; 0.17]Salience of Race −0.18 [−0.30; −0.05] −0.29 [−0.44; −0.15]Closeness to Whites 0.16 [−0.01; 0.32] 0.33 [0.15; 0.52]Closeness to Blacks −0.06 [−0.22; 0.10] −0.45 [−0.62; −0.27]Closeness to Asians −0.01 [−0.17; 0.15] −0.20 [−0.38; −0.02]IAT Score 0.37 [0.07; 0.68] 0.58 [0.24; 0.91]Salience of Religion 0.05 [−0.06; 0.16] 0.16 [0.04; 0.28]
Party IdentificationIndependent/Other −0.73 [−1.20; −0.26] −1.40 [−1.82; −0.97]Democrat −1.54 [−2.01; −1.07] −3.74 [−4.23; −3.25]
AIC 3227.37 3227.37BIC 3447.90 3447.90Log Likelihood -1573.69 -1573.69Deviance 3147.37 3147.37Num. obs. 1864 1864
Table 10: Social Welfare Preferences Among Monoracial and Biracial Whites, Blacks, and Asians.Note: Dependent variable measures whether respondents support the Affordable Care Act andbelieve government should provide more services even if it means an increase in spending, opposethe ACA/Obamacare and believe government should provide fewer services to reduce spending, orhave conflicting views on these issues. Omitted category is “Supports Both.” Values shown aremultinomial logistic regression estimates with 95 percent confidence intervals. Coefficients withp < 0.05 in bold.
42

Sorted
(Intercept) −0.99 [−1.42; −0.57]Demographics
Age −0.01 [−0.02; −0.01]Some College 0.05 [−0.18; 0.27]College Grad 0.50 [0.26; 0.74]Female 0.12 [−0.07; 0.30]Income −0.01 [−0.04; 0.02]South −0.42 [−0.62; −0.21]
Racial GroupWhite-Black 0.57 [0.29; 0.85]White-Asian 0.56 [0.27; 0.86]Black 0.42 [0.12; 0.73]Asian 0.19 [−0.11; 0.50]
AIC 2887.12BIC 2951.65Log Likelihood -1432.56Deviance 2843.63Num. obs. 2607
Table 11: Party Sorting Among Monoracial and Biracial Whites, Blacks, and Asians. Note:Values shown are logistic regression estimates with 95 percent confidence intervals. Coefficientswith p < 0.05 in bold.
43
ReferencesAllen, G.E., Patton O. Garriott, Carla J. Reyes and Catherine Hsieh. 2013. “Racial Identity,
Phenotype, and Self-Esteem Among Biracial Polynesian/White Individuals.” Family Relations62(1):82–91.
Bettencourt, B, Kelly Charlton, Nancy Dorr and Deborah L Hume. 2001. “Status Differences andIn-Group bias: a meta-analytic examination of the effects of status stability, status legitimacy,and group permeability.” Psychological bulletin 127(4):520.
Bobo, Lawrence and Devon Johnson. 2000. “Racial Attitudes in a Prismatic Metropolis: MappingIdentity, Stereotypes, Competition, and Views on Affirmative Action.” Prismatic Metropolis:Inequality in Los Angeles pp. 81–163.
Bonilla-Silva, Eduardo. 2006. Racism Without Racists: Color-blind Racism and the Persistenceof Racial Inequality in the United States. Lanham, MD: Rowman & Littlefield Pub Inc.
Borg, Carmel, Joseph A Buttigieg and Peter Mayo. 2002. Gramsci and Education. New York:Rowman & Littlefield.
Bureau of the Census. 1930. “Census History Through the Decades–1930 (Population).” U.S.Census Bureau Index of Questions .
Conover, Pamela Johnston. 1984. “The Influence of Group Identifications on Political Perceptionand Evaluation.” The Journal of Politics 46(03):760–785.
Davenport, Lauren D. 2015. Politics Between Black and White. Stanford University unpublishedmanuscript.
Davenport, Lauren D. 2016a. “Beyond Black and White: Biracial Attitudes in ContemporaryU.S. Politics.” American Political Science Review 110(1).
Davenport, Lauren D. 2016b. “The Role of Gender, SES, and Religion in Biracial AmericansRacial Labeling Decisions.” American Sociological Review .
Davis, F. James. 2001. Who is Black?: One Nation’s Definition. University Park, PA: PennsylvaniaState University Press.
Dawson, Michael C. 1994. Behind the Mule: Race and Class in African-American Politics. Prince-ton, NJ: Princeton University Press.
Du Bois, W.E.B. 1903. The Souls of Black Folk (1989 edition). New York: Bantam.
Easton, David and Jack Dennis. 1969. Children in the Political System: Origins of PoliticalLegitimacy. New York: McGraw-Hill Book Company.
Ellemers, Naomi, Russell Spears and Bertjan Doosje. 1997. “Sticking together or falling apart:In-group identification as a psychological determinant of group commitment versus individualmobility.” Journal of personality and social psychology 72(3):617.
44

Espiritu, Yen. 1992. Asian American Panethnicity: Bridging Institutions and Identities. TempleUniversity Press.
Gans, Herbert J. 2012. “?Whitening? and the Changing American Racial Hierarchy.” Du BoisReview 9(02):267–279.
Gay, C. 2004. “Putting Race in Context: Identifying the Environmental Determinants of BlackRacial Attitudes.” American Political Science Review 98(04):547–562.
Gurin, Patricia, Arthur H Miller and Gerald Gurin. 1980. “Stratum Identification and Conscious-ness.” Social Psychology Quarterly pp. 30–47.
Haney-Lopez, Ian. 2006. White By Law: The Legal Construction of Race. New York: NYU Press.
Harris, David R. and Jeremiah Joseph. Sim. 2002. “Who is Multiracial? Assessing the Complexityof Lived Race.” American Sociological Review 67(4):614–627.
Ho, Arnold K, Jim Sidanius, Daniel T Levin and Mahzarin R Banaji. 2011. “Evidence for Hy-podescent and Racial Hierarchy in the Categorization and Perception of Biracial Individuals.”Journal of Personality and Social Psychology 100(3):492.
Hogg, Michael A and Elizabeth A Hardie. 1992. “Prototypicality, conformity and depersonal-ized attraction: A self-categorization analysis of group cohesiveness.” British Journal of SocialPsychology 31(1):41–56.
Humes, Karen R., Nicholas A. Jones and Roberto R. Ramirez. 2011. “Overview of Race andHispanic Origin: 2010.” 2010 Census Briefs pp. 1–23.
Hutchings, Vincent L and Nicholas A Valentino. 2004. “The Centrality of Race in AmericanPolitics.” Annu. Rev. Polit. Sci. 7:383–408.
Jackman, Mary R. and Robert W. Jackman. 1973. “An Interpretation of the Relation BetweenObjective and Subjective Social Status.” American Sociological Review pp. 569–582.
Jackson, Linda A, Linda A Sullivan, Richard Harnish and Carole N Hodge. 1996. “Achievingpositive social identity: Social mobility, social creativity, and permeability of group boundaries.”Journal of Personality and Social Psychology 70(2):241.
Junn, Jane and Natalie Masuoka. 2008. “Asian American Identity: Shared Racial Status andPolitical Context.” Perspectives on Politics 6(4):729–740.
Khanna, Nikki. 2011. Biracial in America: Forming and Performing Racial Identity. LexingtonBooks.
Kinder, Donald R. and Lynn M. Sanders. 1996. Divided by color: Racial politics and democraticideals. Chicago: University of Chicago Press.
Kinder, Donald R. and Nicholas Winter. 2001. “Exploring the Racial Divide: Blacks, Whites, andOpinion on National Policy.” American Journal of Political Science 45(2):439–456.
45
Krogstad, Jens Manuel and Mark Hugo Lopez. 2014. “Hispanic Nativity Shift: U.S. Births DrivePopulation Growth as Immigration Stalls.” Pew Hispanic Center pp. 1–6.
Lee, Jennifer and Frank D. Bean. 2004. “America’s Changing Color Lines: Immigration,Race/Ethnicity, and Multiracial Identification.” Annual Review of Sociology 30:221–242.
Lee, Jennifer and Frank D. Bean. 2010. The Diversity Paradox: Immigration and the Color Linein Twenty-First Century America. New York: Russell Sage Foundation Publications.
Loveman, Mara and Jeronimo O Muniz. 2007. “How Puerto Rico Became White: BoundaryDynamics and Intercensus Racial Reclassification.” American Sociological Review 72(6):915–939.
Masuoka, Natalie. 2006. “Together They Become One: Examining the Predictors of Paneth-nic Group Consciousness Among Asian Americans and Latinos*.” Social Science Quarterly87(5):993–1011.
Masuoka, Natalie. 2011. “The ?Multiracial? Option: Social Group Identity and Changing Patternsof Racial Categorization.” American Politics Research 39(1):176–204.
McClain, Paula D, Jessica D Johnson Carew, Eugene Walton Jr and Candis S Watts. 2009.“Group Membership, Group Identity, and Group Consciousness: Measures of Racial Identity inAmerican Politics?” Annual Review of Political Science 12:471–485.
McGuire, William J and Alice Padawer-Singer. 1976. “Trait Salience in the Spontaneous Self-Concept.” Journal of Personality and Social Psychology 33(6):743.
McGuire, William J, Claire V McGuire, Pamela Child and Terry Fujioka. 1978. “Salience ofEthnicity in the Spontaneous Self-Concept as a Function of One’s Ethnic Distinctiveness in theSocial Environment.” Journal of Personality and Social Psychology 36(5):511.
Mendelberg, Tali. 2001. The Race Card: Campaign Strategy, Implicit Messages, and the Norm ofEquality. Princeton, NJ: Princeton University Press.
Miller, Arthur H, Patricia Gurin, Gerald Gurin and Oksana Malanchuk. 1981. “Group Conscious-ness and Political Participation.” American Journal of Political Science pp. 494–511.
Nishimura, Nancy J. 1995. “Addressing the Needs of Biracial Children: An Issue for Counselorsin a Multicultural School Environment.” The School Counselor 43(1):52–57.
Nobles, Melissa. 2000. Shades of Citizenship: Race and the Census in Modern Politics. Stanford,CA: Stanford Univ Press.
Park, Robert E. 1928. “Human Migration and the Marginal Man.” American Journal of Sociology33(6):881–893.
Peery, Destiny and Galen V Bodenhausen. 2008. “Black+ White= Black Hypodescent in ReflexiveCategorization of Racially Ambiguous Faces.” Psychological Science 19(10):973–977.
Pew. 2012. “The Rise of Asian Americans.” Pew Research Social and Demographic Trends .
46

Pew. 2015. “Multiracial in America: Proud, Diverse and Growing in Numbers.” Pew ResearchCenter Social and Demographic Trends .
Ramakrishnan, Karthick, Janelle Wong, Taeku Lee and Jane Junn. 2009. “Race-Based Consider-ations and the 2008 National Asian American Survey.” Du Bois Review 6:219–38.
Rockquemore, Kerry and David L. Brunsma. 2008. Beyond Black: Biracial Identity in America,2nd. edition. Lanham, MD: Rowman & Littlefield Pub Inc.
Shelby, Tommie. 2005. We Who are Dark: The Philosophical Foundations of Black Solidarity.Cambridge: Harvard Belknap Press.
Sniderman, Paul M. and Edward G. Carmines. 1997. Reaching Beyond Race. Cambridge, MA:Harvard University Press.
Snipp, C. Matthew. 2003. “Racial Measurement in the American Census: Past Practices andImplications for the Future.” Annual Review of Sociology pp. 563–588.
Stonequist, Everett V. 1935. “The Problem of the Marginal Man.” American Journal of Sociology41(1):1–12.
Tajfel, Henri. 1981. Human Groups and Social Categories: Studies in Social Psychology. NewYork: Cambridge University Press.
Tajfel, Henri and John C Turner. 1979. “An Integrative Theory of Intergroup Conflict.” The socialpsychology of intergroup relations 33(47):74.
Tajfel, Henri and John C. Turner. 1986. “An Integrative Theory of Intergroup Relations.” Psy-chology of Intergroup Relations pp. 7–24.
U.S. Bureau of the Census, American FactFinder. 2013. “xx-1. Race: 2013.” Census SummaryFile 1(SF1) 100-Percent Data .
Vavreck, Lynn and Shanto. Iyengar. 2005. “New Developments in Experimental Methods.” SageHandbook of Political Communication pp. 225–240.
Wang, Wendy. 2012. “The Rise of Intermarriage.” Pew Research Center .
Wardle, Francis. 1992. “Supporting Biracial Children in the School Setting.” Education andTreatment of Children 15(2):163–172.
White, Walter. 1948. A Man Called White: The Autobiography of Walter White. New York:Viking.
Wong, Janelle S. 2006. “Democracy?s Promise.” Ann Arbor, MI: University of Michigan Press .
Wong, Tom. 2015. Rights, Deportation, and Detention in the Age of Immigration Control.
Wright, Stephen C, Donald M Taylor and Fathali M Moghaddam. 1990. “Responding to member-ship in a disadvantaged group: From acceptance to collective protest.” Journal of Personalityand Social Psychology 58(6):994.
Zhou, Min. 2004. “Are Asian Americans Becoming “White?”.” Contexts 3(1):29–37.
47