Embed Size (px)
Citation preview
37
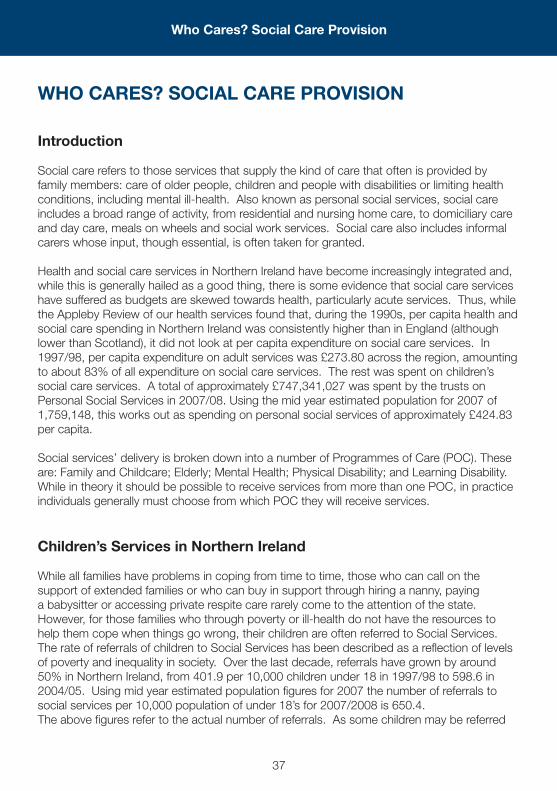
WHO CARES? SOCIAL CARE PROVISION
Introduction
Social care refers to those services that supply the kind of care that often is provided by family members: care of older people, children and people with disabilities or limiting health conditions, including mental ill-health. Also known as personal social services, social care includes a broad range of activity, from residential and nursing home care, to domiciliary care and day care, meals on wheels and social work services. Social care also includes informal carers whose input, though essential, is often taken for granted.
Health and social care services in Northern Ireland have become increasingly integrated and, while this is generally hailed as a good thing, there is some evidence that social care services have suffered as budgets are skewed towards health, particularly acute services. Thus, while the Appleby Review of our health services found that, during the 1990s, per capita health and social care spending in Northern Ireland was consistently higher than in England (although lower than Scotland), it did not look at per capita expenditure on social care services. In 1997/98, per capita expenditure on adult services was £273.80 across the region, amounting to about 83% of all expenditure on social care services. The rest was spent on children’s social care services. A total of approximately £747,341,027 was spent by the trusts on Personal Social Services in 2007/08. Using the mid year estimated population for 2007 of 1,759,148, this works out as spending on personal social services of approximately £424.83 per capita.
Social services’ delivery is broken down into a number of Programmes of Care (POC). These are: Family and Childcare; Elderly; Mental Health; Physical Disability; and Learning Disability. While in theory it should be possible to receive services from more than one POC, in practice individuals generally must choose from which POC they will receive services.
Children’s Services in Northern Ireland
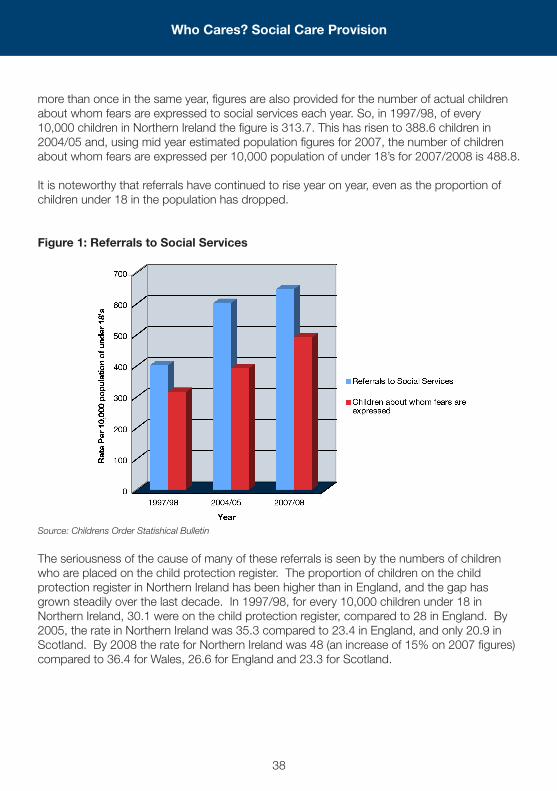
While all families have problems in coping from time to time, those who can call on the support of extended families or who can buy in support through hiring a nanny, paying a babysitter or accessing private respite care rarely come to the attention of the state. However, for those families who through poverty or ill-health do not have the resources to help them cope when things go wrong, their children are often referred to Social Services. The rate of referrals of children to Social Services has been described as a reflection of levels of poverty and inequality in society. Over the last decade, referrals have grown by around 50% in Northern Ireland, from 401.9 per 10,000 children under 18 in 1997/98 to 598.6 in 2004/05. Using mid year estimated population figures for 2007 the number of referrals to social services per 10,000 population of under 18’s for 2007/2008 is 650.4.The above figures refer to the actual number of referrals. As some children may be referred
Who Cares? Social Care Provision
38
more than once in the same year, figures are also provided for the number of actual children about whom fears are expressed to social services each year. So, in 1997/98, of every 10,000 children in Northern Ireland the figure is 313.7. This has risen to 388.6 children in 2004/05 and, using mid year estimated population figures for 2007, the number of children about whom fears are expressed per 10,000 population of under 18’s for 2007/2008 is 488.8.
It is noteworthy that referrals have continued to rise year on year, even as the proportion of children under 18 in the population has dropped.
Figure 1: Referrals to Social Services
Source: Childrens Order Statishical Bulletin
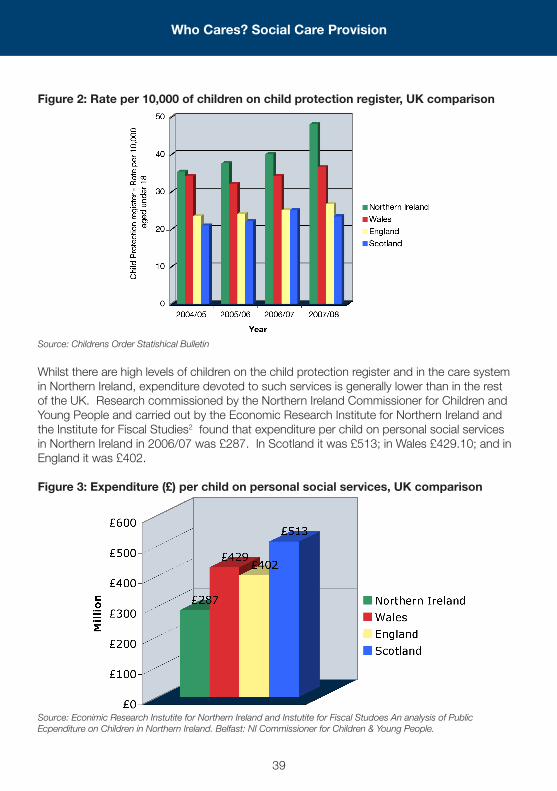
The seriousness of the cause of many of these referrals is seen by the numbers of children who are placed on the child protection register. The proportion of children on the child protection register in Northern Ireland has been higher than in England, and the gap has grown steadily over the last decade. In 1997/98, for every 10,000 children under 18 in Northern Ireland, 30.1 were on the child protection register, compared to 28 in England. By 2005, the rate in Northern Ireland was 35.3 compared to 23.4 in England, and only 20.9 in Scotland. By 2008 the rate for Northern Ireland was 48 (an increase of 15% on 2007 figures) compared to 36.4 for Wales, 26.6 for England and 23.3 for Scotland.
Who Cares? Social Care Provision
39
Figure 2: Rate per 10,000 of children on child protection register, UK comparison
Source: Childrens Order Statishical Bulletin
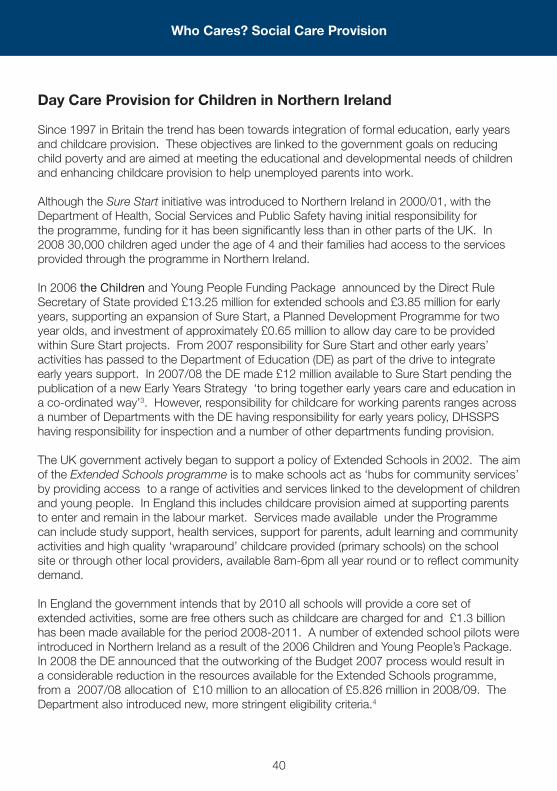
Whilst there are high levels of children on the child protection register and in the care system in Northern Ireland, expenditure devoted to such services is generally lower than in the rest of the UK. Research commissioned by the Northern Ireland Commissioner for Children and Young People and carried out by the Economic Research Institute for Northern Ireland and the Institute for Fiscal Studies2 found that expenditure per child on personal social services in Northern Ireland in 2006/07 was £287. In Scotland it was £513; in Wales £429.10; and in England it was £402.
Figure 3: Expenditure (£) per child on personal social services, UK comparison
Source: Econimic Research Instutite for Northern Ireland and Instutite for Fiscal Studoes An analysis of Public Ecpenditure on Children in Northern Ireland. Belfast: NI Commissioner for Children & Young People.
Who Cares? Social Care Provision
40
Day Care Provision for Children in Northern Ireland
Since 1997 in Britain the trend has been towards integration of formal education, early years and childcare provision. These objectives are linked to the government goals on reducing child poverty and are aimed at meeting the educational and developmental needs of children and enhancing childcare provision to help unemployed parents into work.
Although the Sure Start initiative was introduced to Northern Ireland in 2000/01, with the Department of Health, Social Services and Public Safety having initial responsibility for the programme, funding for it has been significantly less than in other parts of the UK. In 2008 30,000 children aged under the age of 4 and their families had access to the services provided through the programme in Northern Ireland.
In 2006 the Children and Young People Funding Package announced by the Direct Rule Secretary of State provided £13.25 million for extended schools and £3.85 million for early years, supporting an expansion of Sure Start, a Planned Development Programme for two year olds, and investment of approximately £0.65 million to allow day care to be provided within Sure Start projects. From 2007 responsibility for Sure Start and other early years’ activities has passed to the Department of Education (DE) as part of the drive to integrate early years support. In 2007/08 the DE made £12 million available to Sure Start pending the publication of a new Early Years Strategy ‘to bring together early years care and education in a co-ordinated way’3. However, responsibility for childcare for working parents ranges across a number of Departments with the DE having responsibility for early years policy, DHSSPS having responsibility for inspection and a number of other departments funding provision.
The UK government actively began to support a policy of Extended Schools in 2002. The aim of the Extended Schools programme is to make schools act as ‘hubs for community services’ by providing access to a range of activities and services linked to the development of children and young people. In England this includes childcare provision aimed at supporting parents to enter and remain in the labour market. Services made available under the Programme can include study support, health services, support for parents, adult learning and community activities and high quality ‘wraparound’ childcare provided (primary schools) on the school site or through other local providers, available 8am-6pm all year round or to reflect community demand.
In England the government intends that by 2010 all schools will provide a core set of extended activities, some are free others such as childcare are charged for and £1.3 billion has been made available for the period 2008-2011. A number of extended school pilots were introduced in Northern Ireland as a result of the 2006 Children and Young People’s Package. In 2008 the DE announced that the outworking of the Budget 2007 process would result in a considerable reduction in the resources available for the Extended Schools programme, from a 2007/08 allocation of £10 million to an allocation of £5.826 million in 2008/09. The Department also introduced new, more stringent eligibility criteria.4
Who Cares? Social Care Provision
41
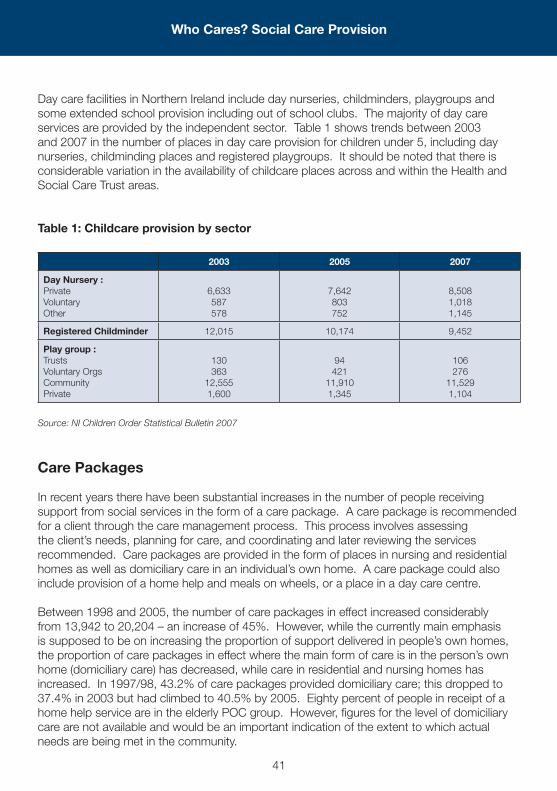
Day care facilities in Northern Ireland include day nurseries, childminders, playgroups and some extended school provision including out of school clubs. The majority of day care services are provided by the independent sector. Table 1 shows trends between 2003 and 2007 in the number of places in day care provision for children under 5, including day nurseries, childminding places and registered playgroups. It should be noted that there is considerable variation in the availability of childcare places across and within the Health and Social Care Trust areas.
Table 1: Childcare provision by sector
2003 2005 2007
Day Nursery :Private Voluntary Other
6,633 587 578
7,642 803 752
8,508 1,018 1,145
Registered Childminder 12,015 10,174 9,452
Play group : Trusts Voluntary Orgs Community Private
130 363
12,555 1,600
94 421
11,910 1,345
106 276
11,529 1,104
Source: NI Children Order Statistical Bulletin 2007
Care Packages
In recent years there have been substantial increases in the number of people receiving support from social services in the form of a care package. A care package is recommended for a client through the care management process. This process involves assessing the client’s needs, planning for care, and coordinating and later reviewing the services recommended. Care packages are provided in the form of places in nursing and residential homes as well as domiciliary care in an individual’s own home. A care package could also include provision of a home help and meals on wheels, or a place in a day care centre.
Between 1998 and 2005, the number of care packages in effect increased considerably from 13,942 to 20,204 – an increase of 45%. However, while the currently main emphasis is supposed to be on increasing the proportion of support delivered in people’s own homes, the proportion of care packages in effect where the main form of care is in the person’s own home (domiciliary care) has decreased, while care in residential and nursing homes has increased. In 1997/98, 43.2% of care packages provided domiciliary care; this dropped to 37.4% in 2003 but had climbed to 40.5% by 2005. Eighty percent of people in receipt of a home help service are in the elderly POC group. However, figures for the level of domiciliary care are not available and would be an important indication of the extent to which actual needs are being met in the community.
Who Cares? Social Care Provision
42
Older People
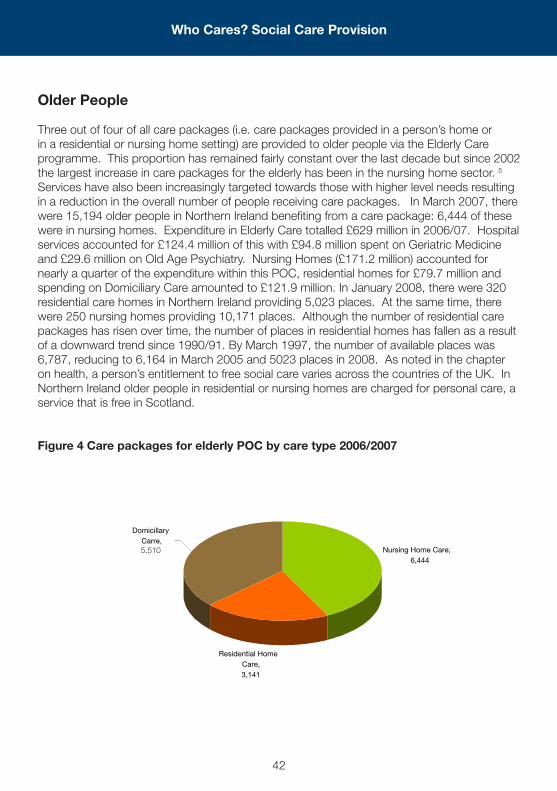
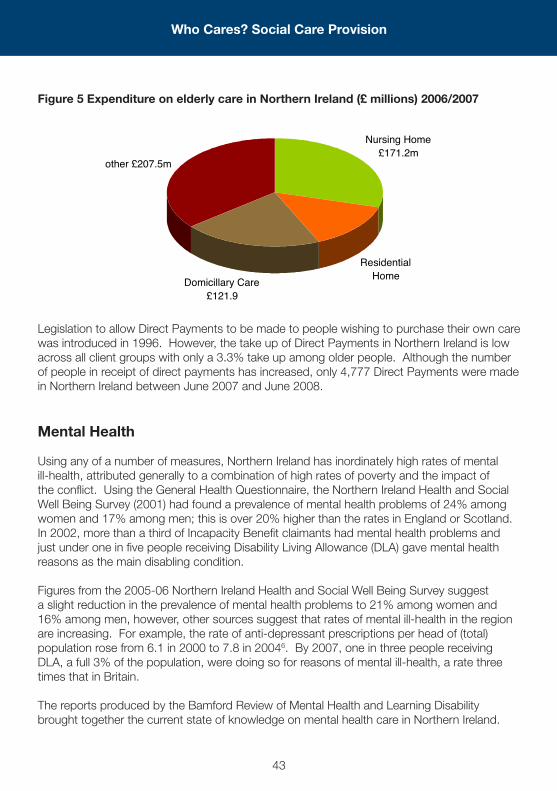
Three out of four of all care packages (i.e. care packages provided in a person’s home or in a residential or nursing home setting) are provided to older people via the Elderly Care programme. This proportion has remained fairly constant over the last decade but since 2002 the largest increase in care packages for the elderly has been in the nursing home sector. 5 Services have also been increasingly targeted towards those with higher level needs resulting in a reduction in the overall number of people receiving care packages. In March 2007, there were 15,194 older people in Northern Ireland benefiting from a care package: 6,444 of these were in nursing homes. Expenditure in Elderly Care totalled £629 million in 2006/07. Hospital services accounted for £124.4 million of this with £94.8 million spent on Geriatric Medicine and £29.6 million on Old Age Psychiatry. Nursing Homes (£171.2 million) accounted for nearly a quarter of the expenditure within this POC, residential homes for £79.7 million and spending on Domiciliary Care amounted to £121.9 million. In January 2008, there were 320 residential care homes in Northern Ireland providing 5,023 places. At the same time, there were 250 nursing homes providing 10,171 places. Although the number of residential care packages has risen over time, the number of places in residential homes has fallen as a result of a downward trend since 1990/91. By March 1997, the number of available places was 6,787, reducing to 6,164 in March 2005 and 5023 places in 2008. As noted in the chapter on health, a person’s entitlement to free social care varies across the countries of the UK. In Northern Ireland older people in residential or nursing homes are charged for personal care, a service that is free in Scotland.
Figure 4 Care packages for elderly POC by care type 2006/2007
Residential Home Care,3,141
Nursing Home Care,6,444
Domicillary Carre,5,510
Who Cares? Social Care Provision
43
Figure 5 Expenditure on elderly care in Northern Ireland (£ millions) 2006/2007
Legislation to allow Direct Payments to be made to people wishing to purchase their own care was introduced in 1996. However, the take up of Direct Payments in Northern Ireland is low across all client groups with only a 3.3% take up among older people. Although the number of people in receipt of direct payments has increased, only 4,777 Direct Payments were made in Northern Ireland between June 2007 and June 2008.
Mental Health
Using any of a number of measures, Northern Ireland has inordinately high rates of mental ill-health, attributed generally to a combination of high rates of poverty and the impact of the conflict. Using the General Health Questionnaire, the Northern Ireland Health and Social Well Being Survey (2001) had found a prevalence of mental health problems of 24% among women and 17% among men; this is over 20% higher than the rates in England or Scotland. In 2002, more than a third of Incapacity Benefit claimants had mental health problems and just under one in five people receiving Disability Living Allowance (DLA) gave mental health reasons as the main disabling condition.
Figures from the 2005-06 Northern Ireland Health and Social Well Being Survey suggest a slight reduction in the prevalence of mental health problems to 21% among women and 16% among men, however, other sources suggest that rates of mental ill-health in the region are increasing. For example, the rate of anti-depressant prescriptions per head of (total) population rose from 6.1 in 2000 to 7.8 in 20046. By 2007, one in three people receiving DLA, a full 3% of the population, were doing so for reasons of mental ill-health, a rate three times that in Britain.
The reports produced by the Bamford Review of Mental Health and Learning Disability brought together the current state of knowledge on mental health care in Northern Ireland.
other £207.5m
Domicillary Care£121.9
Residential Home
Nursing Home £171.2m
Who Cares? Social Care Provision
44
They can be accessed on www.rmhldni.gov.uk. The Review found that Health and Personal Social Services expenditure on Adult Mental Health in the year 2002/03 was £110 million, 6.1% of the total expenditure on health and social care (PSS Key Indicators records 6.7%). This represented a reduction in the proportion of H&PSS expenditure on adult mental health, down from 7.5% in 1997/08. Expenditure on mental health in England in 2002/03 accounted for 11.8% of public spending on health and social services compared with 8.4% in Northern Ireland.
The Bamford Review found that, in 2002/03, over half (57%) of the mental health expenditure was on hospital services. This remained the case in 2006/07 when over half the £191million expenditure in Mental Health services was for hospital settings (£98.7million)7.
Learning Disability
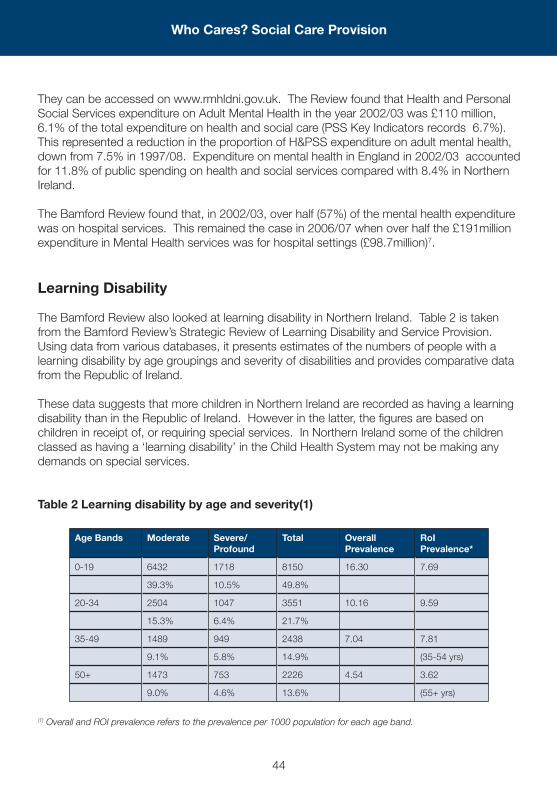
The Bamford Review also looked at learning disability in Northern Ireland. Table 2 is taken from the Bamford Review’s Strategic Review of Learning Disability and Service Provision. Using data from various databases, it presents estimates of the numbers of people with a learning disability by age groupings and severity of disabilities and provides comparative data from the Republic of Ireland.
These data suggests that more children in Northern Ireland are recorded as having a learning disability than in the Republic of Ireland. However in the latter, the figures are based on children in receipt of, or requiring special services. In Northern Ireland some of the children classed as having a ‘learning disability’ in the Child Health System may not be making any demands on special services.
Table 2 Learning disability by age and severity(1)
Age Bands Moderate Severe/Profound
Total Overall Prevalence
RoI Prevalence*
0-19 6432 1718 8150 16.30 7.69
39.3% 10.5% 49.8%
20-34 2504 1047 3551 10.16 9.59
15.3% 6.4% 21.7%
35-49 1489 949 2438 7.04 7.81
9.1% 5.8% 14.9% (35-54 yrs)
50+ 1473 753 2226 4.54 3.62
9.0% 4.6% 13.6% (55+ yrs)
(1) Overall and ROI prevalence refers to the prevalence per 1000 population for each age band.
Who Cares? Social Care Provision
45
The prevalence figures for people aged 20 years and over are broadly comparable. Similar data are not available for Great Britain although in Scotland an estimated 5.45 per 1,000 are in regular contact with services with others having occasional or short term contact. Some of this additional level of learning disability in Northern Ireland may be due to the fact that rates for congenital8 malformation at birth are much higher than in Britain.
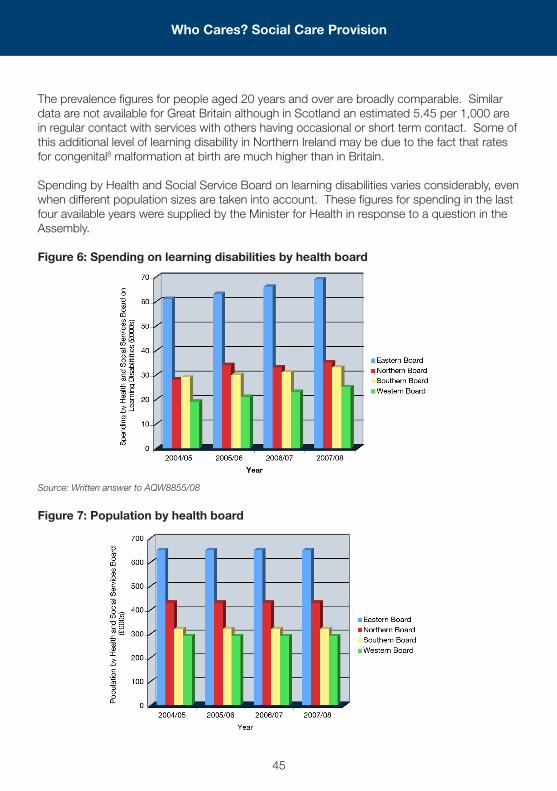
Spending by Health and Social Service Board on learning disabilities varies considerably, even when different population sizes are taken into account. These figures for spending in the last four available years were supplied by the Minister for Health in response to a question in the Assembly.
Figure 6: Spending on learning disabilities by health board
Source: Written answer to AQW8855/08
Figure 7: Population by health board
Who Cares? Social Care Provision
46
The Bamford review pointed out that Northern Ireland has the highest proportion of people resident in long-stay hospitals and also has the single largest hospital in these islands. In 2003, Northern Ireland had 264 long stay beds per 1 million population, compared to 15 beds per 1 million population in England and Wales and 163 beds per 1 million in Scotland. Further, there are many more beds provided in Northern Irish hospitals for assessment and treatment admissions (estimated 203 beds or 11.9 per 10,000 population) compared to Scotland (3.98 per 100,000 population). (Audit of Learning Disability Chapter 1, P. 36/37)
Bamford reports that in 2000, over one quarter of people with a learning disability in Northern Ireland lived in nursing homes while in England and Wales in 1997, just 7% of their places were in nursing homes. While the proportion of nursing home places varied within Northern Ireland, the NHSSB having the highest proportion (46%) and the WHSSB the lowest (21%), all relied heavily on nursing home placements. Perhaps inevitably then, the proportion of people in supported housing within Northern Ireland is lower than Great Britain although there is wide variation across the four Boards; with EHSSB having the highest proportion (31%) and WHSSB and SHSSB the lowest (4%)9. As with mental health, the Bamford Review website has a huge amount of information about learning disability in Northern Ireland. This can be accessed on www.rmhldni.gov.uk.
In February 2009 the DHSSPS announced proposed additional resources for key areas of personal social services including:
• 17%increaseformentalhealthand16%increaseforlearningdisabilitytohelpdrivethe Bamford recommendations forward.
• 13%increaseforelderlyservices;• 16%increaseforchildrenservices;and• 14%increaseforphysicalorsensorydisabilityservices.(DHSSPS,2009)
However this spending has to come from efficiency savings achieved from within the general health and social care budget and does not reflect any additional resources to health and social care in Northern Ireland.
Informal Care
Informal care refers to the care that is provided, in the main by other family members, on an unpaid basis to older persons and persons with a disability. Informal care underpins our health and social care services and is a vital contribution to maintaining the health and well being of a significant proportion of the population in Northern Ireland. It has been estimated that one in three people will become carers at some stage in their lives. Taking on a caring role can significantly change people’s lives and have an impact on their financial circumstances as well as their health and well being. The Northern Ireland Life and Times Survey asked people about caring responsibilities in 1994 and again in 2006. The 2006 Survey found, overall, that the proportion of people reporting that they have caring responsibilities in 2006 (23%) was marginally lower than the figure for 1994 (26%). While
Who Cares? Social Care Provision
47
slightly fewer people are engaged in informal care, for those that are, informal care is more intensive and more demanding. While just 13% of carers in 1994 provided 30 hours or more of care per week, 31% of carers in 2006 provided 30 or more hours. At the same time, the proportion of people caring for friends or neighbours (outside the immediate family) declined sharply from 10% to just 3% and there are fewer informal carers assisting persons in another household. Overall, the findings suggest that informal care is increasingly being provided only within and to the immediate family10.
Physical and Sensory Disability
The Northern Ireland Survey of Activity Limitation and Disability (NISALD) was carried out throughout 2006 and was completed in early 2007. It aimed to provide an up-to-date, accurate picture on the prevalence and circumstances of people in Northern Ireland with a disability. The definition of disability for the purposes of the NISALD was based on the concepts of the International Classification of Functioning, Disability and Health (ICF) which was developed and endorsed by the World Health Organisation.
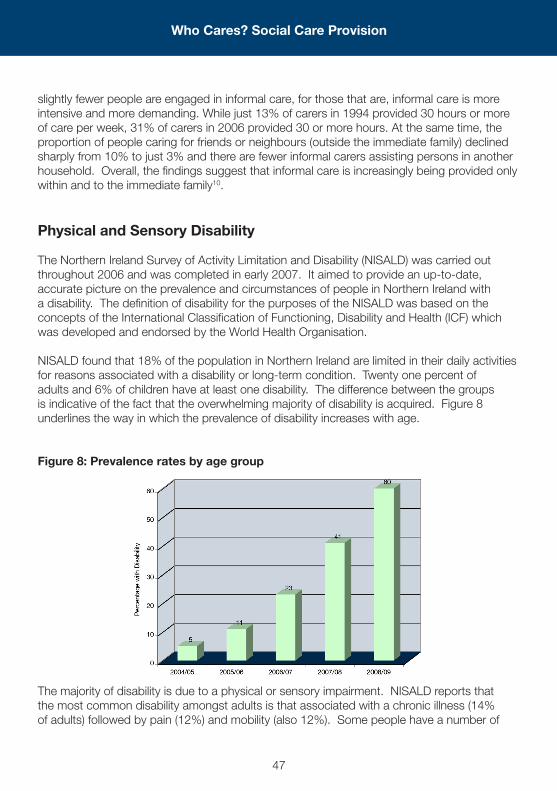
NISALD found that 18% of the population in Northern Ireland are limited in their daily activities for reasons associated with a disability or long-term condition. Twenty one percent of adults and 6% of children have at least one disability. The difference between the groups is indicative of the fact that the overwhelming majority of disability is acquired. Figure 8 underlines the way in which the prevalence of disability increases with age.
Figure 8: Prevalence rates by age group
The majority of disability is due to a physical or sensory impairment. NISALD reports that the most common disability amongst adults is that associated with a chronic illness (14% of adults) followed by pain (12%) and mobility (also 12%). Some people have a number of
Who Cares? Social Care Provision
48
disabilities which are associated with each other. For example, a person may suffer from arthritis (a chronic illness) which causes pain and associated mobility difficulties.
While 18% of the population has a limiting disability, only a small proportion of these people receive social care services. Thus, while the Royal National Institute of the Blind estimate there are over 28,000 blind or partially sighted people in Northern Ireland, about 5,400 blind and partially sighted people had contact with a Health and Social Care Trust in 2006/07. Over 6,600 people who are deaf or hard of hearing had contact with a HSC Trust in that year. Just over 10,000 people with another form of physical impairment had contact with a HSC Trust in 2006/07.
During 2006/07, 11,706 people with a physical or sensory impairment had contact with community service providers. Comparing 2006/07 with 2002/03, the number of people with a physical or sensory impairment decreased by 465 (4%).
Of 1,543 care packages in effect for people with a physical or sensory impairment in 2006/07, the majority, 1,132 were packages of domiciliary care with slightly over one third, 411, residential care packages.
At 31 March 2007, there were 4 residential homes in Northern Ireland solely for people with a physical disability / sensory impairment, providing 64 places.
Key Policy Challenges
This chapter has considered social care provision in Northern Ireland and looked at trends in social care policy and funding. The structural integration of health and social care services in Northern Ireland is generally viewed as positive but there is some evidence that social care services have suffered from greater emphasis on acute health care. Much social care provision in Northern Ireland is less developed than in other parts of the UK and has suffered from historical underfunding, despite high levels of need in areas including child protection and mental health. The low level of childcare provision for working parents remains a challenge for policy. Parents in Northern Ireland have not had access to some of the initiatives introduced elsewhere in the UK, including the availability of ‘wrap around childcare’. The review of mental health and learning disability (the Bamford Review), has resulted in an increased focus and a commitment to more funding for these areas.
Who Cares? Social Care Provision
49
References
1 Department for Health, Social Services and Public Safety (2008) Children Order Statistical Bulletin 2007/2008. Belfast: DHSSPS
2 Economic Research Institute for Northern Ireland and Institute for Fiscal Studies (2007) An Analysis of Public Expenditure on Children in Northern Ireland, Belfast: Northern Ireland Commissioner for Children and Young People
3 NI Assembly Debate on Pre-school Education 26 Feb 2008 (Statement by the Minister of Education)
4 Department of Education for Northern Ireland (2008) Extended Schools Programme, Criteria and Funding, 2008/09. Belfast: DENI
5 Northern Ireland Public Accounts Committee (2008) Report into Older People and Domiciliary Care, Report 24/07/08RFeb, 2008, NI Assembly Public Accounts Committee
6 Assembly answer to written question 65867, June 2008.7 Department for Health, Social Services and Public Safety (2008), Summary of HPSS
expenditure in Northern Ireland 2006-07. Belfast: DHSSPS8 Information and Analysis Unit, Department of Health and Social Services and Public Safety
and Northern Ireland Statistics and Research Agency (2002) Health and Social Care in Northern Ireland: a Statistical Profile. Belfast: DHSSPS and NISRA
9 Figures taken from Bamford Review of Mental Health and Learning Disability www.rmhldni.gov.uk
10 Evason,E (2007) Who Cares Now? Changes in Informal Caring 1994 and 2006, ARK Research Update No 51 – www.ark.ac.uk
Who Cares? Social Care Provision