Embed Size (px)
Citation preview
Who Moves? A Panel Logit Model Analysis of Inter-Provincial Migration in Canada
by
Ross Finnie
No. 142
11F0019MPE No. 142ISSN: 1200-5223
ISBN: 0-660-17919-9
Price: $5.00 per issue, $25.00 annually
Business and Labour Market Analysis24-F, R.H. Coats Building, Ottawa, K1A 0T6
Statistics Canada (613) 951-3962Facsimile Number: (613) 951-5403
August 2000
This research was made possible by the Applied Research Branch of Human ResourcesDevelopment Canada. The Small Area and Administrative Data Division of Statistics Canadaprovided access to the LAD data (including the related human resources) upon which the study isbased, related background file development and support, and comments on the analysis. The authoralso gratefully acknowledges a Social Sciences and Humanities Research Council Research Grantwhich was critical in earlier stages of the research with the LAD data. Useful comments have beereceived from John Burbidge, Tom Courchene, Pierre Fortin, Gaétan Garneau, Stéphane Gascon,Michael Hatfield, Lars Osberg, Roger Sceviour, François Vaillancourt, and Allen Zeesman, withZeesman providing the initial ideas for the general direction of the project. Gaétan Garneau andRoger Sceviour provided excellent research assistance.
This paper represents the views of the authors and does not necessarily reflect the opinions ofStatistics Canada.
Aussi disponible en français

Table of Contents
I. Introduction.................................................................................................................................. 1II. The Data........................................................................................................................................ 3
An Overview of the Longitudinal Administrative Database (LAD) .........................................................3
The Sample Selection Rules ......................................................................................................................4
III. The Econometric Model................................................................................................................ 4The Panel Logit Model Specification ........................................................................................................4
The Endogenous Variable: Province of Residence and the Identification of Inter-Provincial Moves......5
Province, Language, and Area Size of Residence .....................................................................................5
Age and Family Status ...............................................................................................................................7
Unemployment, Social Assistance, and Earnings......................................................................................7
Current Year ...............................................................................................................................................8
IV. The Empirical Findings................................................................................................................. 8Province, Language, and Area Size of Residence .....................................................................................9
Age and Family Status .............................................................................................................................10
Unemployment and Income Effects......................................................................................................... 11
Year Effects ..............................................................................................................................................12
V. Conclusion ................................................................................................................................... 13Summary of the Findings.........................................................................................................................13
Implications of the Findings.....................................................................................................................14
Directions for Future Work ......................................................................................................................15
Final Remarks ..........................................................................................................................................16
References .......................................................................................................................................... 24

Abstract
This paper addresses the topic of inter-provincial migration in terms of the basic question: “whomoves?”. Panel logit models of the probability of moving from one year to the next are estimatedusing samples derived from the Longitudinal Administrative Database covering the period 1982-95.Explanatory variables include “environmental” factors, personal characteristics, labour marketattributes, and a series of year variables. Separate models are estimated for eight age-sex groups.
The major findings include that: i) migration rates have been inversely related to the size of theprovince, presumably capturing economic conditions, labour market scale effects, and puregeographical distance, while language has also played an important role; ii) residents of smallercities, towns, and especially rural areas have been less likely to move than individuals in largercities; iii) age, marriage, and the presence of children have been negatively related to mobility, forboth men and women; iv) migration has been positively related to the provincial unemployment rate,the individuals’ receipt of unemployment insurance (except Entry Men), having no market income(except for Entry Men and Entry Women), and the receipt of social assistance (especially for men);v) beyond the zero earnings point, migration has been positively related to earnings levels for primeaged men, but not for others, and these effects are generally small (holding other factors constant);vi) there were no dramatic shifts in migration rates over time, but men’s rates dropped off a bit in the1990s while women’s rates (except for the Entry group) generally held steadier or rose slightly,indicating a divergence in trends along gender lines.
Keywords: Mobility, Unemployment, Social Assistance and Gains

Analytical Studies Branch – Research Paper Series Statistics Canada No. 11F0019MPE No.142- 1 -
I. Introduction
Inter-provincial migration is an interesting and important phenomenon for many reasons. Relevantlabour market issues include the relationships between mobility and individuals’ earnings,productivity in the source and destination provinces, and labour market efficiency more generally.Migration also has important implications for various social insurance and income supportprogrammes, such as unemployment insurance, social assistance, and health care, in that theportability of benefits must be assured for those who move, while adverse incentives whichencourage mobility of the unwanted sort (e.g., moving to a particular province because it offersmore generous social assistance payments) or barriers which inhibit mobility of a more desirabletype (e.g., not moving from a high unemployment region because unemployment benefits might beless generous elsewhere) should be minimised. Third, mobility is relevant to various humanresource issues; for example, the returns to public investments in education and training—theformer completely under provincial jurisdiction and the latter partially (and increasingly) so—depend on local employment opportunities and are embodied in individuals and therefore movewhen they do, thus twisting the benefit-cost ratios of these programmes along provincial lines.Migration is also an item of concern in the context of certain regulatory rules, such as thosepertaining to professional certification and licensing and certain commercial regulations, which aresometimes alleged to represent barriers to the free flow of citizens to where their employmentopportunities—or quality of life—might be greatest. Finally, inter-provincial migration is of centralimportance to the most fundamental issues of nationhood facing Canada, with inter-provincialmobility presumably reflecting some of the important benefits of being a country.
Given this importance, it is not surprising that there is by now a fairly substantial literature on inter-provincial mobility, based on both micro and aggregate data and using various analyticalapproaches. We thus now know a fair amount regarding the general extent and direction of inter-provincial mobility, some of the determinants of these flows, certain implications for economicadjustment, the broad effects on individuals’ earnings, and so on.1
1 Anderson [1966], Courchene [1974], Grant and Vanderkamp [1976], Lin [1995], Osberg, Gordon and Lin
[1994], Robinson and Tomes [1982], Statistics Canada [1993], Stone [1969], and Vachon and Vaillancourt [1998]collectively provide evidence on gross outflows, gross inflows, net flows, and the specific province-to-provincepatterns of inter-provincial mobility, as well as the basic characteristics of movers and non-movers and theassociated income patterns. The different “types” of migration (primary, return, onward), are focused on inHiscott [1987], Grant and Vanderkamp [1984, 1986], Newbold and Liaw [1990], Rosenbaum [1988, 1993], andVanderkamp [1971, 1972]; Hiscott [1987] and Hou and Beaujot [1995] concentrate on migration betweenAtlantic Canada and Ontario; and Day and Grafton [1998] look at students. Econometric studies of thedeterminants of inter-provincial mobility, including an important sub-literature on the role of fiscal variables(including relative wage structures), can be found in Courchene [1970], Day [1992], Day and Winer [1994],Dean [1992], Grant and Vanderkamp [1976], Lin [1995], Mills, Percy, and Wilson [1983], Osberg, Gordon, andLin [1994], Robinson and Tomes [1982], Shaw [1986], Vachon and Vaillancourt [1998], and Winer and Gauthier[1982]. The effects of inter-provincial mobility on provincial wage structures and related policy issues arefocused on in Courchene [1974], Graham [1964], Rosenbluth [1996], Shaw [1986], and Vanderkamp [1988].Finally, the effects of migration on individuals’ incomes are addressed in Courchene [1974], Grant andVanderkamp [1976, 1980], and Marr and Millard [1980], as well as in more of a passing manner in Osberg,Gordon, and Lin [1994] and Robinson and Tomes [1982]. Important U.S. work includes Gallway [1969],Greenwood [1975], Laber and Chase [1971]. Mincer [1978], Nakosteen and Zimmer [1980] Polachek andHorvath [1977], Schwartz [1973], and Sjaastad [1962].
Analytical Studies Branch – Research Paper Series Statistics Canada No. 11F0019MPE No.142- 2 -
Previous research has, however, been limited by the unavailability of the sort of general andextended Canadian longitudinal database which is best suited to the topic of inter-provincialmigration which—being a dynamic process—requires similarly dynamic data to be properlystudied. The purpose of this paper is, therefore, to shed new light on the topic by presenting theresults of an empirical analysis of inter-provincial migration in Canada based on the LongitudinalAdministrative Database (“LAD”) which has been constructed by Statistics Canada from RevenueCanada tax filer records
More specifically, this research addresses the question: “Who moves?”. It does so by estimating apanel logit model where the probability that a person moves from one province to another from anyone year to the next is taken to be a function of various “environmental” factors (current province ofresidence, the provincial unemployment rate, the area size of residence), personal characteristics(language, age, marital status, the presence of children), some key labour market attributes (earningslevel, the receipt of unemployment insurance and social assistance), and a series of year variables tocapture any shifts over time. All non-student adults aged 20-54 are included in the analysis, withseparate models estimated for eight different age-sex groups to facilitate comparisons across thesedifferent segments of the population.2
As far as this author is aware, this is the first Canadian study to address the “who moves” issueeconometrically using a broad-based longitudinal database over an extended period of time andshould, therefore, contribute to our understanding of who benefits from migration, the determinantsof these movements, and the trends over time, with associated implications regarding the spatialstructure of labour markets, the relationship between migration and social programme participation,the role of gender in migration patterns, and so on.3
2 This paper is one of a series on the topic based on the LAD data. Finnie [1998a, b, and c] provide descriptive
(non-econometric) analysis of migration patterns and longitudinal migration profiles and the associated incomedynamics, while Finnie [1998d] exploits the longitudinal aspect of the LAD to estimate fixed effects modelswhich control for pre-move earning levels and other individual attributes in order to isolate the effects of inter-provincial mobility on individuals’ earnings.
3 Most previous research on the characteristics of movers and the determinants of moving, including econometricmodels similar to those estimates here (e.g., Vachon and Vaillancourt [1998], have used census data, which havenumerous important limitations. First, only the individual’s current province of residence and that as of theprevious census is known, resulting in incomplete, biased samples of all moves which occur over time (e.g.,return moves and multiple moves which occur over the inter-census period are missed). Second, there is verylittle information on the earlier (“pre-move”) situation, meaning that any analysis of the effects of individualcharacteristics or environmental factors is significantly limited to such basic items as the individual’s age.Finally, the limit of the data to a given five-year inter-census period precludes any direct testing for shifts in thestructure of inter-provincial migration over time. (Census data includes, on the other hand, the individual’sprovince of birth, which is not available from tax files.)
Alternatively, previous studies based on longitudinal data—notably the earlier Labour Market Activity Survey(e.g., Osberg et al., [1994] , Lin [1995])—have been limited by the small number of years over which individualswere followed and the relatively small sample sizes, which has limited the generalisability of the results in termsof the period of time covered and (again) precluded tests for shifts over time, while requiring the analysis to becarried out at an aggregate level which cuts across groups with distinctly different mobility behaviour (e.g., thepooling of men and women of different ages).
Finally, previous research based on tax-based longitudinal files (i.e., the work by Courchene and Grant andVanderkamp) is now simply dated in terms of the period covered and the methods used.
Analytical Studies Branch – Research Paper Series Statistics Canada No. 11F0019MPE No.142- 3 -
While obviously based on the Canadian situation, the paper might also have some relevance at theinternational level, providing the basis for comparisons with inter-jurisdictional movementselsewhere, and perhaps having certain implications for comparable inter-state or inter-regionalmovements in the U.S. or even cross-national movements in the New Europe.
The next section of the paper describes the LAD data and the construction of the samples used inthe analysis; the third section describes the econometric model; the fourth section presents theempirical findings; and the concluding section provides a summary of the major findings, identifiessome implications of the results, and offers some ideas for future work.
II. The Data
Since the LAD data are new and relatively unknown, this section begins with a general descriptionof the database in the context of the topic of inter-provincial mobility, then describes the specificsamples and variables used in the estimation.4
An Overview of the Longitudinal Administrative Database (LAD)
The Longitudinal Administrative Database (LAD) is a ten percent representative sample ofCanadian tax filers (and identified spouses) followed as individuals over time and matched intofamily units on an annual basis, thereby providing individual and family-level information onincomes, taxes, and basic demographic characteristics, including province of residence, in adynamic framework. The first year of LAD data is 1982 and the file ran through 1995 at the timethis project was undertaken, thus determining the period covered by the analysis.
The LAD is constructed from Revenue Canada tax files, with individuals selected into the LADaccording to a random number generator based on Social Insurance Numbers and followed overtime through a SIN-based linking of records across years. Individuals drop out of the LAD if theybecome non-filers, the principal reasons being that they have a low income and are, therefore, notrequired to file (and choose not to do so—see below); are out of the country; or have died. (Drop-outs are picked up again if they begin filing anew—so attrition is not necessarily permanent.) Newfilers (young people, immigrants, etc.) automatically refresh the database in the basic one-in-tenratio.)
The LAD’s coverage of the adult population is very good since, unlike some other countries (suchas the U.S.) the rate of tax filing in Canada is very high: higher income Canadians are required to doso, while lower income individuals have incentives to file in order to recover income tax and otherpayroll tax deductions made throughout the year and, especially since 1986, to receive various taxcredits. The full sets of annual tax files from which the LAD is constructed are estimated to coverfrom 91 to 95 percent of the target adult population (official population estimates), thus comparingfavourably with other survey-based databases in this regard.
Furthermore, given that most individuals file tax forms every year (or are identified by other filers),attrition from the LAD is quite low, meaning that it remains representative on a longitudinal basis aswell as cross-sectionally. This compares to the situation for survey databases, which typically havegreater problems than administrative data in locating—or, in the case of longitudinal data, 4 See Finnie [1997a-g] for further discussions of the LAD data and their use in other contexts.
Analytical Studies Branch – Research Paper Series Statistics Canada No. 11F0019MPE No.142- 4 -
following—individuals, especially those who move, potentially resulting in serious endogenoussampling problems in the context of any study of inter-provincial mobility. In short, the LAD is agood performer in terms of its representativeness on both a cross-sectional basis and longitudinally.5
The large number of records available on the LAD (roughly two million per year) means that eventhe one-in-ten sub-sample of the full LAD used in the estimation of the models used here (samplesderived from the full LAD were intractably large) provides enough observations to identify allparameters for each age-sex group.
The Sample Selection Rules
Individuals were included in the estimation samples if they met the following criteria for anyconsecutive pair of years—the unit of observation of the analysis. (Individuals could be included forcertain pairs of years but not others, depending on their inclusion in the LAD and whether theypassed the sample selection criteria for the given years.)
First, as well as being a tax filer or the imputed spouse of a tax filer with a trackable SIN (asprovided by the filer) and thus being included on the LAD file, the individual had to be between theages of 20 and 54 (inclusive) in the first of each pair of years. The lower age cut-off was adopted toeliminate the majority of pre-university/college students and other young people still living at homeand to generally restrict the analysis to decision making “adults”. The upper age limit focuses theanalysis on the working age population while avoiding issues related to the transition toretirement—a dynamic worthy of its own study.
Second, full-time post-secondary students were excluded from the analysis on the grounds that theirmobility decisions are driven by different factors than those obtaining for the rest of the populationand would be better investigated using other data sources. This exclusion was accomplished byimputing student status based on the relevant tax deductions available in the LAD data.6
III. The Econometric Model
In this section, the panel logit model used in the analysis is introduced, the precise nature of thedependent variable is explained, and the regressors included in the model are discussed.
The Panel Logit Model Specification
A panel logit model framework is employed, with the endogenous variable defined as whether ornot the individual’s province of residence changed from one year to the next. The relationshipsbetween the explanatory variables and the probability of moving are then estimated using maximumlikelihood techniques with the underlying stochastic process assumed to follow an extreme valuedistribution.
5 Atkinson et al., [1992] and OECD [1996] discuss the typically better coverage and lower attrition of
administrative databases over survey databases. See Finnie [1998a] for evidence on attrition from the LAD andthe relationship of this attrition to migration behaviour over selected intervals.
6 See Finnie [1997a, c, d, e] for further discussion of the identification of post-secondary students.

Analytical Studies Branch – Research Paper Series Statistics Canada No. 11F0019MPE No.142- 5 -
The regressors are meant to capture various costs and benefits—broadly interpreted—associatedwith moving, and are entered in terms of the values holding as of the first year (the “pre-move”year) for each pair of years passing the selection criteria enumerated above. This specificationrepresents a stochastically well behaved conditional expectation function which well suits ourpurposes of identifying the various individual characteristics, labour market attributes,environmental factors, and year effects associated with inter-provincial mobility for differentsegments of the population.
The model essentially comprises a reduced form formulation where the coefficient estimates reflectthe total/net effects of the regressors on the probability of moving. For example, marital statusgenerally affects both the costs and benefits of moving (see below), and the coefficient estimatesrepresent the overall effect of these influences.
The Endogenous Variable: Province of Residence and the Identification of Inter-ProvincialMoves
The individual’s province is taken to be that in which taxes were payable—essentially where theindividual was residing at year end. This variable is well-suited to the analysis due to its beingconceptually appropriate, tightly defined (including its year-end specificity—corresponding to theother tax-based information contained in the records), and verified by Revenue Canada. An inter-provincial move is then identified as a change in the individual’s tax province from one year to thenext.7
Province, Language, and Area Size of Residence
The models include a set of dummy variables representing the individual’s province of residence.(Ontario is the omitted category.) These will capture, first of all, general economic conditions nototherwise captured by the provincial unemployment rate and the individual-based unemploymentand income variables included in the models (see below). Second, the province indicators will pickup labour market scale effects, with the smaller population jurisdictions providing fewer jobopportunities, at least for certain types of workers, than the larger ones.8 Third, there is also a purelygeographical distance effect, in that a move of a given distance will leave an individual in a largerprovince in the original jurisdiction but take another person in a smaller province across a provincialborder. Fourth, each province has its own specific geography, climate, cultural make-up, and othercharacteristics which will affect migration behaviour. Finally, the province variables will pick upany other effects which vary along this dimension and are not otherwise accounted for in themodels.
Integral to the province indicators are two minority language variables representing anglophones inQuebec and francophones outside of that province. The province variables thus actually representprovince-cum-language variables. Given the precise specification adopted here, Ontario 7 See Vanderkamp and Grant [1988] for a discussion of the various ways of identifying inter-provincial migration
in different databases and the advantages of tax-based data in this regard.
8 For example, individuals in the retail service sector will generally face relatively local markets with arepresentative distribution of employment opportunities nearby, whereas certain professionals (and otherworkers) often face markets which are more national in scope, meaning that within-province employmentopportunities will depend on the province’s size.
Analytical Studies Branch – Research Paper Series Statistics Canada No. 11F0019MPE No.142- 6 -
anglophones are the general omitted province-language category. The province indicators other thanQuebec imply the use of English (omitted) and capture the differences between anglophones inthose provinces and the baseline English-speaking Ontario group. The Quebec variable(representing all Quebec residents), on the other hand, implicitly captures the effect of being afrancophone in that province relative to the omitted Ontario anglophone baseline group, since theEnglish-Quebec variable allows for differences between anglophones and francophones in thatprovince, and the total of the Quebec and English-Quebec coefficients represents the effect of beingan anglophone in that province relative to the Ontario anglophone benchmark. Finally, the English-ROC (“Rest of Canada”) variable captures the differences between francophones and anglophonesin whichever province the individual resides outside of Quebec (with that effect assumed to beconstant across all provinces).
This joint treatment of province and language has certain advantages over the more typicalspecification where province and language effects typically enter independently (variousprovince/region indicators and a single variable to represent francophones regardless of where theylive). The conventional specification does not, in particular, capture any specific differencesbetween the anglophone minority and francophone majority in Quebec, while the typical omnibus“French” variable captures an amalgam of what may be quite diverse effects for francophonesinside and outside Quebec—differences which would seem to be especially important to inter-provincial migration. It should be noted that language pertains to that used to complete the tax form,meaning that it measured with some error, while bilingualism and the use of non-official languagesare not captured.9
A series of dummy variables representing the individual’s area size of residence is included tocapture various economic, cultural, and other influences similar to those represented by theprovince variables. The effects of these variables are not necessarily predictable ex ante. Forexample, individuals living in rural areas might have fewer local job opportunities, thus increasingthe probability of leaving; but might also be more tied—economically, culturally, or on a morepersonal level—to the local situation, such as owning the family farm, being the member of a tightlyknit small town or rural community, or having close family ties in an environment where suchrelations might be particularly important, thus reducing the probability of a move. The omittedcategory is large urban areas (500,000 or more), with the series of five dummy variables indicatingsmaller urban centres, towns, villages, and rural areas.10
9 This might be especially important in the case of Quebec, where the substantial proportion of allophones (close
to the number of anglophones in the most recent census) will be included in one of the official language groups,depending on the language in which individuals decide to file their tax forms. The English-Quebec variabletherefore includes anglophones and some allophones, while the Quebec variable on its own represents not justfrancophones, but also those allophones who file their tax forms in French—thus blurring the “French-English”interpretation of the results to some degree. In other provinces, individuals who speak a third language areprobably most likely to file their tax forms in English, leaving the French-ROC variable to reflect a purerminority (official) language effect.
10 This variable is constructed by linking the postal code information included on the LAD to the relevant censusbased information. There are a relatively small number of individuals for whom the area size of residencevariable is incorrect: individuals who had changed their place of residence—and area size—between the end ofthe relevant tax year and their latest correspondence with Revenue Canada in the following year (i.e., the year taxforms are filed), since it is the postal code information in the latter which is the basis for identifying the area sizeof residence. In the vast majority of cases, however—including virtually all individuals who do not move, thepostal code information will generate the correct area size of residence.
Analytical Studies Branch – Research Paper Series Statistics Canada No. 11F0019MPE No.142- 7 -
Age and Family Status
Age is handled in two ways. First, separate models are estimated by age group for each sex: “Entry”(20-24 inclusive), “Younger” (25-34), “Prime-Younger” (35-44), and “Prime-Older” (45-54). Thereasons for restricting the analysis to those aged 20-54 have been discussed above, while thespecific categories chosen are simply meant to split individuals into various major phases of the lifecycle.
Age is also entered as a quadratic in each of the separate age-sex models, thus allowing for furtherwithin-group effects. Age should generally have a negative effect on moving, reflecting both theincreased costs (psychological and economic) and decreased expected future benefits (shorter timehorizon) of moving for older individuals. These effects would, however, not necessarily be verystrong over the relatively narrow ranges corresponding to the four age categories used here.
Marital status and the presence of children are expected to affect both the costs and benefits ofmoving, and perhaps differently for men and women. For example, an increased income flowresulting from a move might, on the one hand, typically imply a greater benefit for those with largerfamilies, but moving costs will also be higher. The effects of these variables are, therefore, notnecessarily predictable ex ante. The effects of children are allowed to vary by marital status throughthe inclusion of a lone parent indicator along with variables indicating couples and couples withchildren (the omitted category is not married and no children).
Unemployment, Social Assistance, and Earnings
A series of labour market and income variables are included to reflect local labour marketconditions and individuals’ specific labour market situations. First, “local” labour marketopportunities (in the context of inter-provincial moves) are captured by the provincialunemployment rate, with variation over time and across jurisdictions identifying the relevant effects.
At the more individual level, whether or not the person received unemployment insurance benefitswill capture a number of effects on the probability of moving. On the one hand, the receipt of UI(now “EI”) might indicate the absence of good job opportunities—presumably at a more local leveland more specific to the individual’s own skills than the provincial unemployment rate variablementioned above. On the other hand, individuals might hesitate to move if this would place theirunemployment benefits at risk—currently or in the future. (The variation in qualification periodsand benefits according to current place of residence have often been cited as a deterrent to labourmobility in Canada (e.g., Courchene [1970])). Unemployment insurance might also be correlatedwith other personal characteristics or situational factors related to job market opportunities and theindividual’s desire and/or ability to capitalise on such opportunities which might affect thepropensity to move. The effects of the unemployment insurance variable is, therefore, notpredictable ex ante.
Although the relationship between the receipt of social assistance and migration is an interestingone, social assistance income is separately identified on the LAD only since 1992.11 As a result, the
11 Social assistance has been a separate item on individuals’ general T-1 tax forms (where it enters tax credit
calculations) and the corresponding “T-5 SA” forms have been sent out to individuals by the provinces only since1992. From 1986 to 1991, social assistance was supposed to be included on T-1 forms (again affecting tax credit
Analytical Studies Branch – Research Paper Series Statistics Canada No. 11F0019MPE No.142- 8 -
model is re-estimated over the 1992-95 period with an indicator of having received social assistanceincluded in order to provide estimates of the SA-mobility relationship. This variable should, like theUI measure, reflect a mix of programme effects and individual characteristics.
The individual’s earnings level (and earnings squared to allow for a quadratic effect) should capture,in reduced form, the degree to which employment opportunities in the current province versus otherprovinces vary by earnings level, as well as individual characteristics not captured by othervariables. We eschew, at this point, any more sophisticated statistical approach to estimating therelevant relationships between earnings and mobility at the individual level, such as adopting aformal mover-stayer econometric framework or constructing the sorts of measures of alternativeincome opportunities across provinces at the aggregate level which characterises much of theliterature on aggregate flows, thus reflecting the focus of this paper on the “who moves” question.(These other possibilities are discussed in the concluding section of the paper.)
The relevant income concept employed is labour market earnings: wage and salary income plus netself-employment income, expressed in constant 1995 dollars, and capped at the average incomelevel of the top one-tenth percentile in each year. This measure is consistent with the general focusin this paper on the relationship between inter-provincial mobility and labour market outcomes.12
Finally, an indicator that the individual was a non-filer and his or her record was imputed from aspouse’s tax form in the given year (a relatively small number of observations) is included as acontrol variable.
Current Year
Finally, the models include a series of year indicators, running from 1983 through 1994 (1982 is theomitted category). These allow the probability of moving to shift in a general way over time due toboth cyclical influences not otherwise captured by the various unemployment and income variablesincluded in the models, as well as any general shifts in the tendency for individuals to move fromone province to another over the period covered by the analysis.
IV. The Empirical Findings
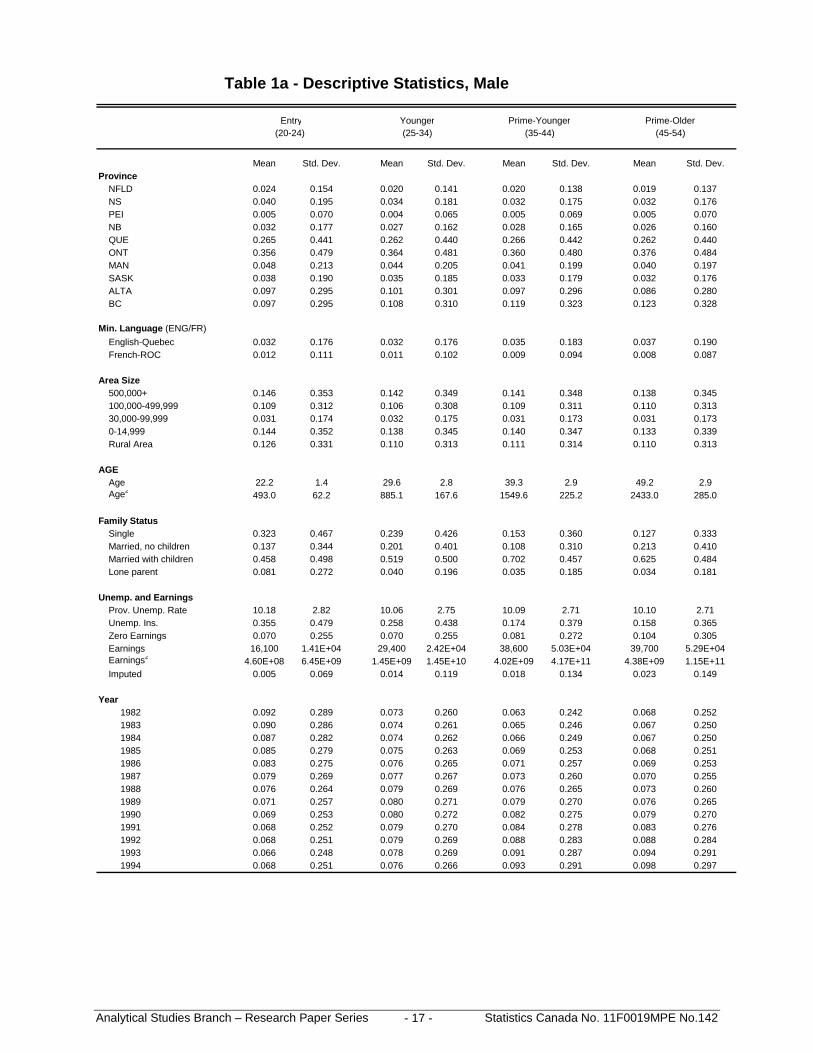
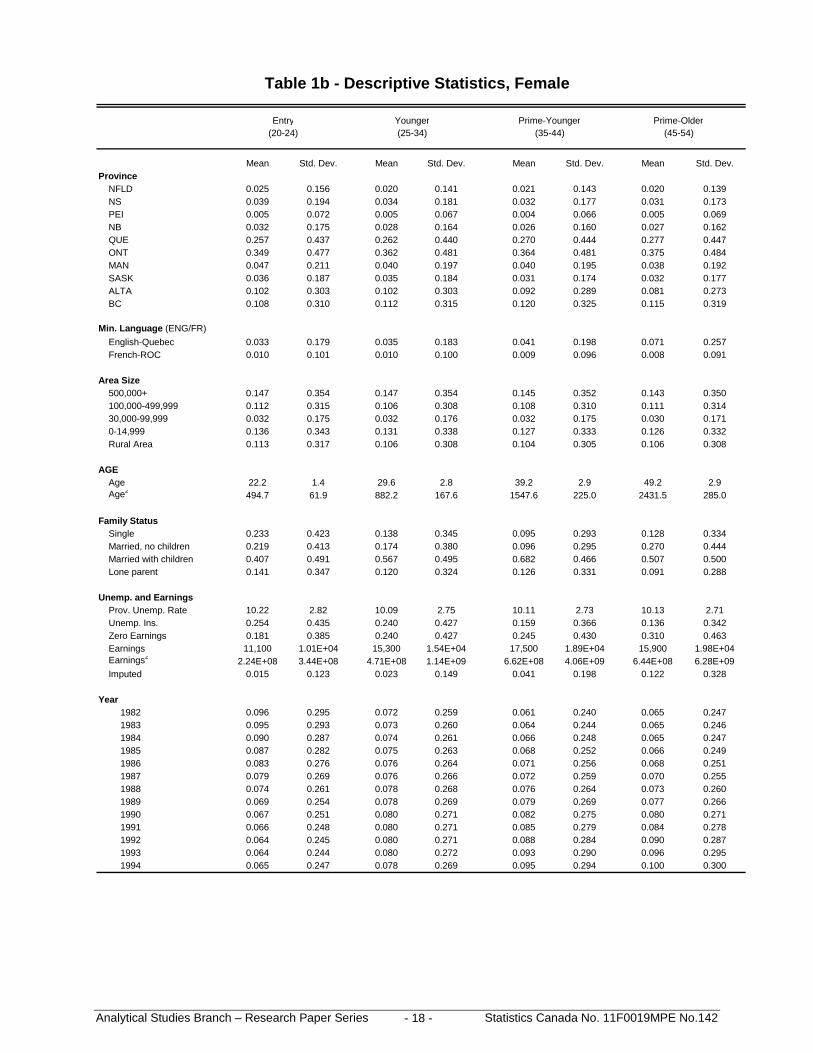
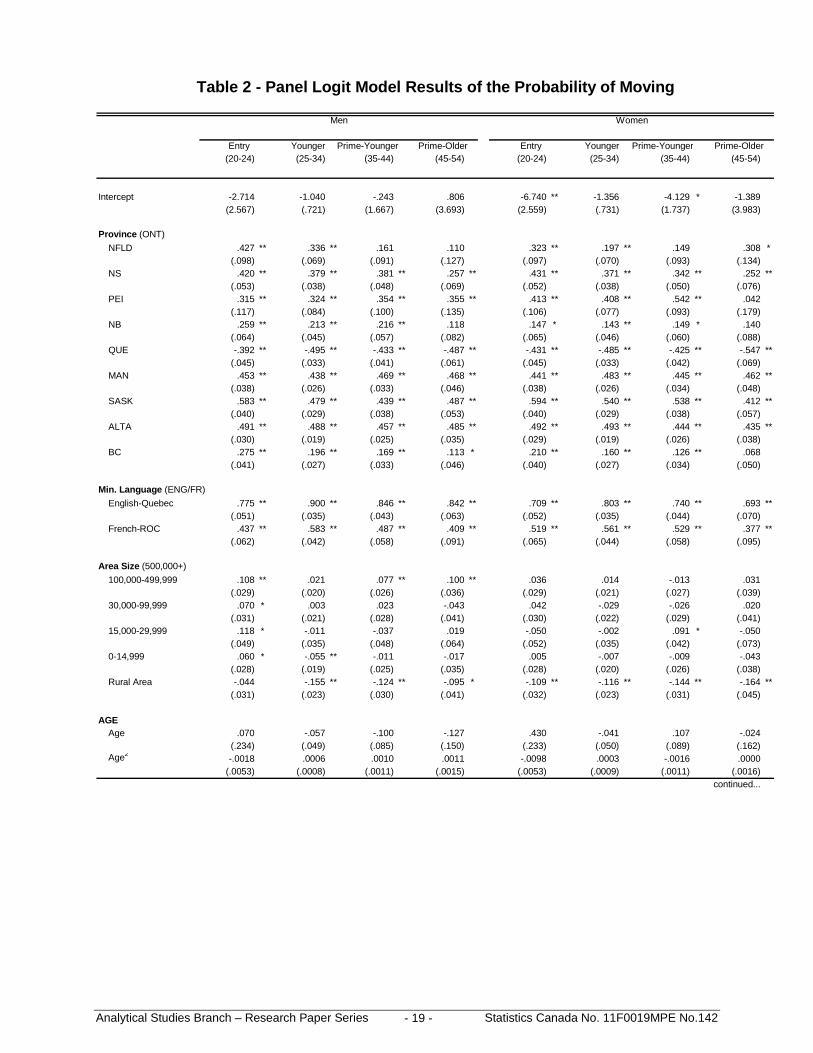
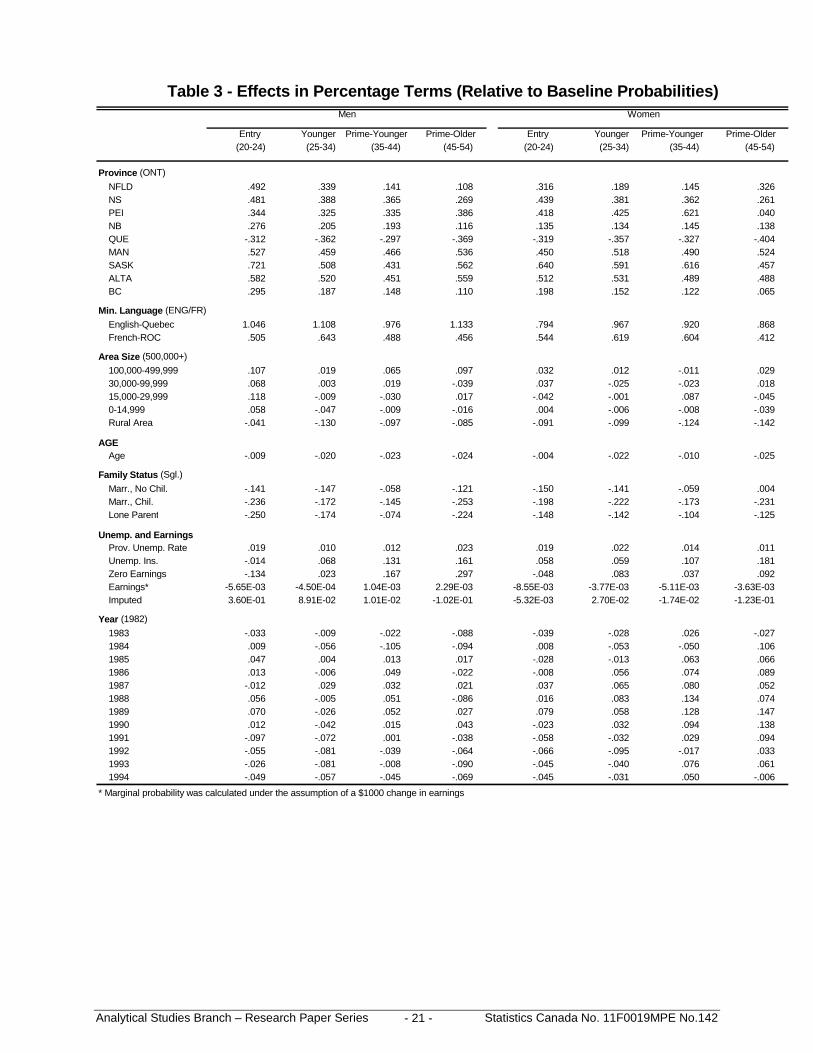
Table 1a, and 1b present the basic characteristics of the samples used in the estimation. Table 2shows the relevant coefficient estimates and associated standard errors for the estimated models foreach of the age-sex groups. Table 3 shows the effects of each of the variables on the probability ofmoving in percentage terms relative to the baseline levels.13
calculations), but in an income category which included other non-taxable government transfers (workers’compensation, GIS) and T-5 forms were not sent out. Before 1986, social assistance was not included in anymanner on individuals’ tax forms.
12 The models have also been estimated using a broader “market income” measure. The results are generally verysimilar to those reported below based on the earnings measure.
13 These are calculated as the change in the probability of moving associated with each of the variables divided bythe base line probability—that is, the percentage effect of “switching on” each of the indicator variablesindividually in turn, or a change in earnings of $1,000 for that particular variable. (The baseline probabilities are

Analytical Studies Branch – Research Paper Series Statistics Canada No. 11F0019MPE No.142- 9 -
Province, Language, and Area Size of Residence
Relative to the (omitted) Ontario baseline, living in Quebec has had a strong, negative effect oninter-provincial mobility for all age-sex groups, while living in other provinces has been associatedwith a higher probability of moving (positive, statistically significant coefficients in almost allcases). Thus, even after controlling for the provincial unemployment rate, individuals’ earningslevels and receipt of unemployment insurance, and so forth, rates of out-migration have varied to asignificant degree by province, shifting the probability of moving by 50 percent or more acrossjurisdictions (Table 3).
More specifically, the pattern of coefficients generally indicates a strong negative population effect(i.e., higher migration rates for the smaller provinces), presumably reflecting the importance ofeconomic conditions (which have been generally correlated with population) and labour marketscale effects along with the purely geographical distance factor.
There are, however, some interesting deviations within the general size-mobility rule. Perhaps mostobvious in this regard is Quebec: it is considerably smaller than Ontario, yet its associated rates ofout-migration are (ceteris paribus) considerably lower, rather than higher as the size rule wouldpredict. British Columbia comes after the two largest provinces in terms of mobility rates, thuscorresponding to its population rank, but then the coefficients for Alberta are in the same generalrange as those of the other smaller provinces, indicating that mobility out of Alberta has been higherthan its size alone might have predicted, presumably reflecting the boom-bust nature of its energysector driven economy.14 Finally, New Brunswick has, like Quebec, been characterised by less thanexpected out-migration given its size—and perhaps for similar reasons, given its relatively largefrancophone community.
The “minority language” effects are very important as well. A very sharp divide between themigration behaviour of anglophone Quebecers and the French-speaking majority in that province isindicated by the strongly positive coefficients on the English-Quebec interactions for all age-sexgroups, with “English” speakers in some cases more than twice as likely to leave as francophones ofsimilar characteristics (with language inferred from tax forms, as discussed above).
Furthermore, summing the English-Quebec interaction terms and the general Quebec coefficients(which apply to both language communities) generate exit rates for anglophone Quebecers (holdingother factors constant) more like those of the smaller, lower income provinces in Atlantic Canadaand the Prairies than those of Ontario or British Columbia.15 In short, francophone Québecois havetended to move to other provinces at inordinately low rates, English-speaking Quebecers at fairlyhigh ones.
calculated using the omitted categories for the categorical variables and the means for each sex-age group forage, earnings, and the unemployment rate.)
14 Finnie [1998a, b] shows that the simple rates of out-migration from Alberta were the highest of all provinces inthe earlier years covered by the data and then declined steadily thereafter to finish in the middle rank.
15 The total of the Quebec and English-Quebec coefficient estimates in the eight equations are: .383, .405, .413,.355 (men); and .278, .318, .315, and .146 (women).
Analytical Studies Branch – Research Paper Series Statistics Canada No. 11F0019MPE No.142- 10 -
The large positive coefficient estimates on the French-ROC variable indicate that francophonesliving outside of Quebec have—much like anglophone Quebecers—also been more likely to moverelative to the majority language group—in this case the baseline English speaking group in eachprovince—although the differences are not as great as in the case of Quebec. This model does not,however, tell us anything further about the underlying flows, such as where precisely theseindividuals were moving to or from. Such questions are interesting, but beyond the scope of thepresent paper.16
As for area size of residence, the clearest and most interesting result is that living in a rural area hasbeen associated with lower rates of inter-provincial mobility than all other area types—for all age-sex groups, and significantly so in every case except Entry Men. On the other hand, the magnitudesof these effects are not especially great, shifting the probability of moving no more than 15 percentin any case. The coefficient estimates for the other area size categories are more mixed, but somegeneral patterns can be discerned: the coefficients on the variables representing the second tier cities(100,000 - 500,000) are positive for almost all groups and significantly so in the case of Entry,Prime-Younger, and Prime-Older Men, and then there is a tendency towards progressively lessmobility from the smaller cities, towns, and villages—culminating in the more uniform rural effectsjust mentioned.
Age and Family Status
Age is of course strongly related to inter-provincial mobility, with related work Finnie [1998a, b, c]finding the anticipated pattern that younger individuals are generally more mobile than older ones,consistent with the standard life-cycle model discussed above. Here, however, we are looking at theeffects within each of the age groups which define the separate models, so it is perhaps notsurprising that none of the coefficients (age, age squared) are statistically significant—although thegeneral patterns make sense, with age negatively related to mobility for all age-sex groups.
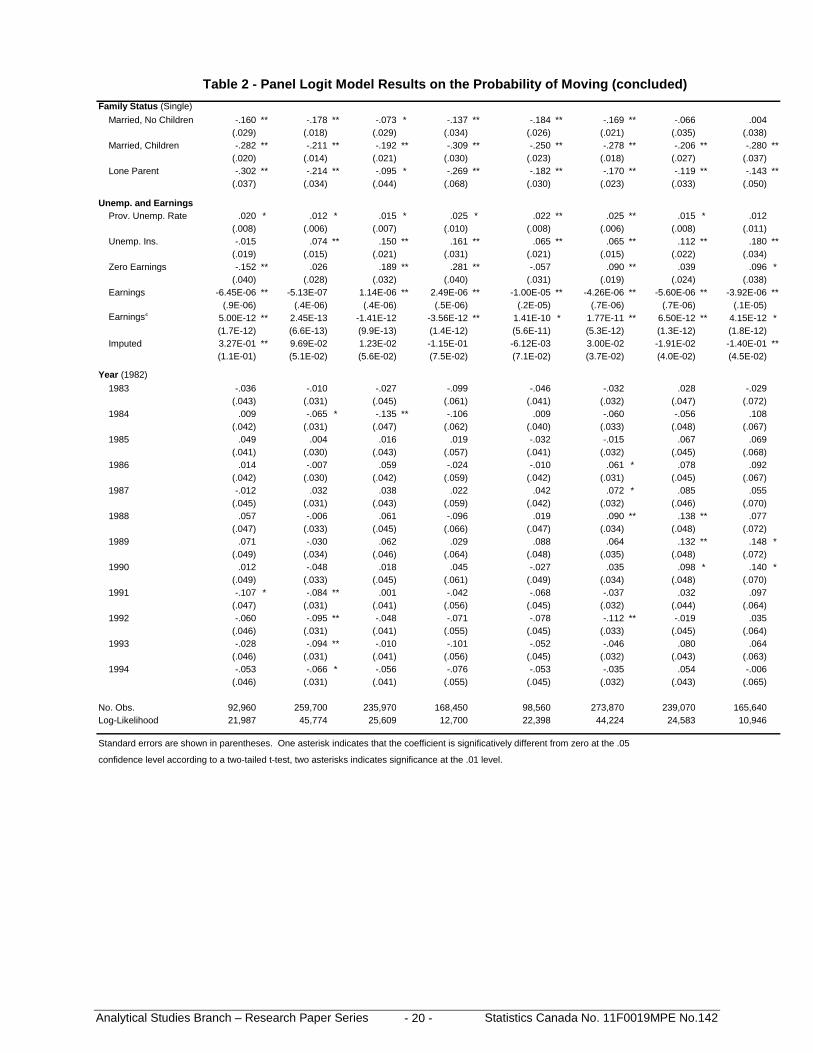
Relative to being single and having no children, being married (legally or common law) hasgenerally had a significantly negative effect on inter-provincial mobility, the two exceptions being astill negative but not significant effect for Prime-Younger Women and essentially no impact forPrime-Older Women. Being married and having children has had even stronger negative effects,while being a single parent has also been associated with a lower probability of moving than thebenchmark single/childless category, although the patterns relative to the other two categories aresomewhat mixed (sometimes stronger, sometimes weaker).17
16 See Finnie [1998a, b, c] for descriptive evidence regarding the specific directions of the flows and the
classification of individuals according to their longitudinal profiles into one-time movers, multiple movers, andthose who eventually returned to their province of origin.
It might also be interesting to investigate the issue of linguistic assimilation by, for example, following migrantfrancophones who moved to see where they moved to and what happened thereafter, such as the number thatmarried non-francophones, switched to filing their tax forms in English, had their children file their own taxforms in English, and so on, perhaps with the aid of linking the individual (and family) level data provided on theLAD with census track information to look at the effect of neighbourhood characteristics on the assimilationprocess.
17 The benchmark “single” category includes never married, widowed, separated, and divorced individuals,corresponding to the information directly available in the LAD data in this respect.
Analytical Studies Branch – Research Paper Series Statistics Canada No. 11F0019MPE No.142- 11 -
It would thus appear that being married and/or having children increases the costs of inter-provincialmobility more than any associated benefits. Interestingly, the effects are stronger for men thanwomen in more than half the cases, suggesting that the influences of family responsibilities aregenerally as great for the former as the latter—which is not typically the case for other labourmarket related outcomes, such as the effects of marriage and children on annual earnings.
Unemployment and Income Effects
As anticipated, mobility has been positively related to the provincial unemployment rate, andsignificantly so for all groups of men and all women except the Prime-Older group. Mobility would,therefore, appear to have in many cases been the response to generally poor employmentopportunities and—presumably—part of the search process for better ones.18
Consistent with this finding, individuals who have themselves received unemployment insurance ina given year have, ceteris paribus, been more likely to move, presumably to seek employmentopportunities elsewhere. These effects have been particularly strong for the Prime groups, aged 35-44 and 45-54 (both men and women). For Younger Men and Women (25-34) and Entry Women(20-24), the effects have been smaller, but still negative and statistically significant. The effect forEntry Men is, however actually negatively signed, and although the effect is small and notstatistically significant, it is perhaps somewhat worrying from the point of view of labour marketefficiency and longer-term employment prospects that this particular group of workers has been lesslikely to move in the face of being unemployed.
Having zero labour market earnings has also been positively related to the probability of moving inmost cases, further indicating that individuals have tended to move in the absence of goodemployment opportunities in their current province of residence. Entry Men are, however, onceagain an exception: for this group, the estimated coefficient on zero earnings is negative, of asizeable magnitude, and statistically significant, again suggesting a different set of responses tobeing out of the labour market in terms of inter-provincial mobility. They are, furthermore, joinedhere by Entry Women, for whom the coefficient estimate is also negative, although the effect is notnearly as large as for Entry Men and is not statistically significant.
After allowing for a discontinuity at the origin, inter-provincial mobility has been negatively relatedto individuals’ earnings levels for Entry and Younger Men, while earnings and mobility have beenpositively correlated for Prime-Younger and Prime-Older males—presumably reflecting differencesin the local-national structure of labour markets for these groups.19
For women, the earnings-mobility relationship has been negative for all age groups except theyoungest—offering an interesting contrast to the case of men. That is, women of almost all ageswho have had “better” (i.e., higher paying) jobs have been less likely to move than those with lowerearnings, whereas this was true only for the younger men’s groups, while mid-career men withhigher earnings were more likely to move.
18 The specific province-to-province mobility patterns reported in Finnie [1998a, b] provide further evidence in
support of this.
19 These assessments reflect the joint effects of the linear and quadratic earnings terms.

Analytical Studies Branch – Research Paper Series Statistics Canada No. 11F0019MPE No.142- 12 -
The coefficient estimates on the variable which controls for an individual being a non-filer issignificant in just two of the eight cases and would seem to carry no special meaning.
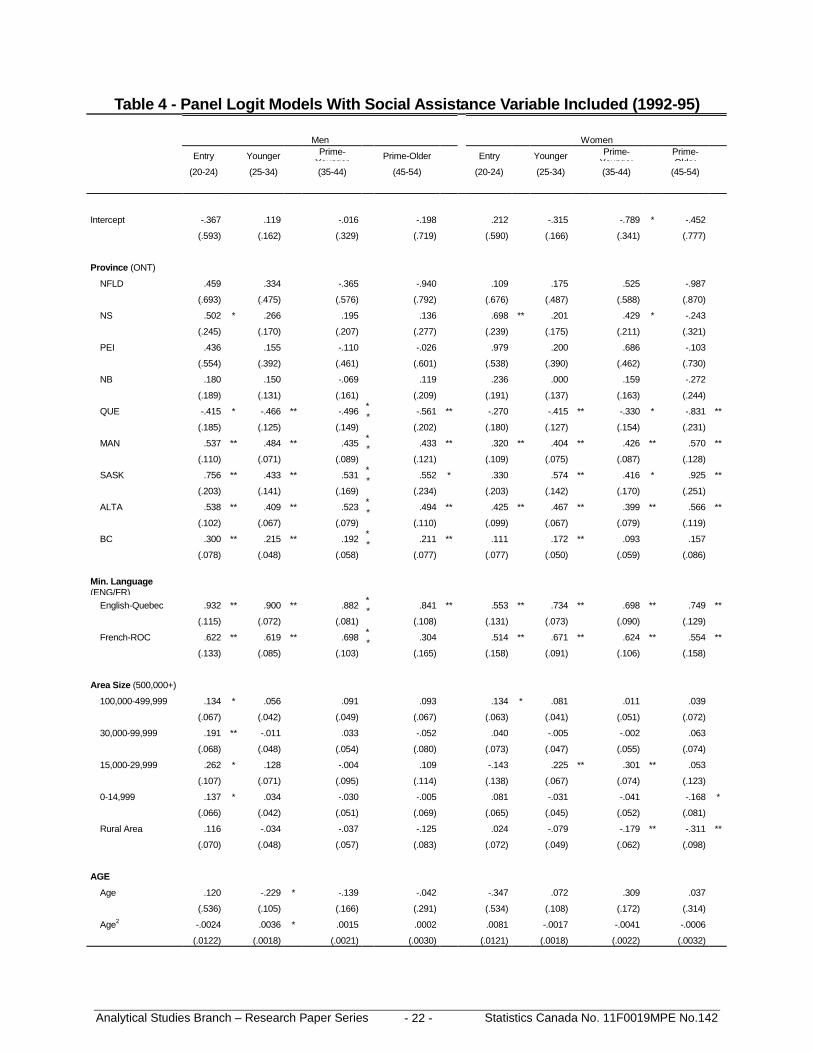
Table 4 shows the results for the model estimated over the 1992-95 period with the social assistanceindicator included. Again generally consistent with the unemployment and zero earnings effects,receiving social assistance in one year is positively related to the probability of moving in thefollowing months for all the male groups, and the magnitude of this effect is generally substantial(although less so for the Prime Older group). For women, however, the effects are generally muchsmaller or even negative, except for the Prime Older group, for whom the effect is more like that ofthe various male groups.20
Year Effects
The year variables capture the general shifts in migration behaviour which occurred after controllingfor the other influences captured by the models (e.g., changes in the provincial unemployment rate,the receipt of UI, having zero earnings, etc.). The results suggest there has been no great generalshift in mobility patterns over the 1982-95 period covered by the data: of the 96 parameter estimatesrepresenting the year variables, only 16 are statistically significant.
On the other hand, the coefficients are mostly negative through the early 1990s for all of the malegroups (and significantly so in the case of Younger Men), as well as in the Entry and YoungerWomen equations, suggesting there may indeed have been a more subtle shift towards less mobilityin the later years for these groups.
The fact that there is no evidence of an early-1990s downward shift in inter-provincial mobility ratesfor the Prime-Younger and Prime-Older Women groups, for whom the coefficient estimates forthese years were mostly positive, if not statistically significant, is interesting.21 Furthermore, thisdivergence occurred as the gender earnings gap was narrowing significantly, with women’s earningsgenerally rising (except for the Entry group), despite the recession, while men’s earnings fell.22
Furthermore, those shifts in gender earnings patterns as measured on a cross-sectional basis wereaccompanied by similar divergences in earnings mobility patterns from one year to the next, with allthe women’s groups (again except the youngest group), enjoying increased upward earningsmobility right through the early 1990s, while men’s rates of earnings growth fell off.23
The differences in male and female trends for inter-provincial mobility thus appear to be consistentwith certain other important labour market changes, and it is natural to speculate as to what degreethe two developments might be related. For example, perhaps women were gradually moving more 20 It would be interesting to know if these “social assistance leavers” are moving into jobs or—as is sometimes
alleged—simply collecting better social assistance payments in other provinces. The LAD data could certainlysupport such an analysis, but this is left to another project (as discussed in the conclusion).
21 The generally opposite signs of the male and female coefficients might indicate statistically significantdivergences—even if the direction of the changes for each group, as represented in the standard errors and t-tests,were not.
22 Finnie [1997a, b].23 Finnie [1997c, d, e].
Analytical Studies Branch – Research Paper Series Statistics Canada No. 11F0019MPE No.142- 13 -
and enjoying the economic benefits of those moves in the form of higher earnings as part of morefundamental changes in their labour market behaviour and related outcomes.
V. Conclusion
This paper has presented the findings of the estimation of a panel logit model of inter-provincialmobility 1982-95 where the probability that an individual changed province from one year to thenext is assumed to be a function of various situational factors and personal attributes.
Summary of the Findings
The major findings may be summarized as follows:
• Mobility rates were generally inversely related to the size of the province, presumablyreflecting general economic conditions, labour market scale effects, and the distancesinvolved. Language effects were also important, seen in the extra low rates of out-migration of francophones in Quebec, the relatively high mobility rates of anglophoneQuebecers, and the positive effects of being a francophone (versus anglophone) in therest of Canada. Alberta also had relatively high rates of out-migration, presumablyreflecting the boom and bust nature of its economy over the period in question.
• Individuals in small cities, towns, and especially rural areas were generally less likely to
move than were those in larger cities. • Age has been negatively related to mobility, although the greatest effects in this regard
are captured by the cross-group patterns seen in related research—as opposed to thesmallish within-group effects found here. Being married and having children havegenerally had significantly negative effects on inter-provincial mobility, with the effectsbeing—interestingly—generally as strong for men as women.
• Inter-provincial mobility has been positively related to the provincial unemployment rate
for both men and women; the receipt of unemployment insurance has had a positiveeffect on out-migration for all groups except Entry Men; and moving has generally beenpositively related to having no market income for all age-sex groups except (again) EntryMen and (now also) Entry Women. Beyond this discontinuity at zero, mobility has beenpositively related to the individuals’ earnings levels in the case of Prime Men, butnegatively related to earnings for the other age-sex groups, but these effects are generallynot large. Finally, the receipt of social assistance has been positively related to movingfor men, but not for women, except for the Prime Older group.
• There appear to have no dramatic shifts in mobility behaviour over the 1982-95 period
covered by the data, but while men’s rates hint at a moderate falling off in the 1990s,women’s rates (except for the Entry group) generally held steadier or rose slightly,pointing to a moderate divergence in trends along gender lines which appear to be relatedto other improvements in women’s labour market outcomes over this period.
Analytical Studies Branch – Research Paper Series Statistics Canada No. 11F0019MPE No.142- 14 -
Implications of the Findings
These results indicate that the decision to move from one province to another has been affected by avariety of influences: the size of the province, cultural factors (language in particular), generallabour market conditions, various personal attributes, and the labour market situation at theindividual level.
Regarding the relationship between inter-provincial mobility and the various labour marketindicators, it is perhaps encouraging—at least from an efficiency standpoint—to find that inter-provincial mobility has generally been positively related to the provincial unemployment rate, thereceipt of unemployment insurance, having no market income, and (at least for the male groups) thereceipt of social assistance, while the higher flows out of the smaller provinces might also bepresumed to represent (at least to some degree) the efficient flow of human resources from wheretheir value (as determined by labour markets) is lower to where it is higher.
It is worth noting, however, the potentially worrying finding that receiving unemployment insuranceor having zero earnings have not been similarly related to higher rates of out-migration for EntryMen or, to a lesser degree, Entry Women. Why is this? Are there generally fewer employmentopportunities in other provinces for more youthful workers or, alternatively, are such individualsless likely to take advantage of the opportunities which are there? Finding the answers to these andrelated questions—begged by the results reported here—could have potentially significant benefitsin terms of improving labour market efficiency and enhancing the long-run career profiles of youngworkers, especially those who start off badly.
The general implication, however, is that inter-provincial mobility has been driven to a significantdegree by individuals seeking better economic opportunities, with presumably beneficial results forboth the individuals involved and labour market efficiency more generally. (The hypothesis ofpositive earnings effects of inter-provincial mobility is strongly supported in a companion paper(Finnie [1998d].) Thanks to this analysis, we now have a better idea of who those individualbeneficiaries are, and the proximate factors which have been influencing their moves.
From a political/cultural perspective, however, these results might be seen to illuminate a problemwhich dates back to at least the time of Confederation—the steady net population lossesexperienced by the smaller Atlantic and Prairie provinces, with commensurately negative effects onthe economic, social, and cultural vitality of these regions.
The positive relationship between mobility and earnings levels for prime-aged men—beyond thezero income effect noted above—suggests, on the other hand, that the benefits of inter-provincialmobility for such men already in the labour market have more commonly accrued to those in theupper labour market echelons, presumably reflecting the spatial elements of various labour sub-markets. For example, higher income professionals almost certainly face wider labour marketswhich are more commonly associated with movements across provincial boundaries. There thusappear to have been two groups of men who have benefited most from inter-provincial mobility:those completely shut out of the labour market (“economic refugees”) and those in its higherreaches.
For women, we tend to observe the first type (benefits to those out of the labour market), but not thesecond; in particular, migration has not been more concentrated amongst women at higher earningslevels, suggesting that the underlying job-migration dynamic has differed in an important way along
Analytical Studies Branch – Research Paper Series Statistics Canada No. 11F0019MPE No.142- 15 -
gender lines, presumably reflecting women’s traditional secondary labour market roles. (Again, theevidence on the effects of inter-provincial migration on earnings reported in Finnie [1998d] supportsthis finding.)
Directions for Future Work
Future research could go in many directions. Possibilities would include the following:
• Push the analysis of the relationship between inter-provincial mobility and the receipt ofunemployment insurance and social assistance further, ranging from simple cross-tabulations of inter-provincial mobility and the receipt of unemployment insurance and/orsocial assistance (the latter just for the years since 1992 that it is reliably measured in theLAD) in the years before and after any move, to tight econometric modelling of theserelationships in the context of the probability of moving (as here) and the related incomedynamics (as in Finnie [1998d]). There is no doubt that this would be a feasible,interesting, and useful line of research for which the LAD data are very well suited.
• Break the analysis down completely by province (or region)—estimating separate models
along these lines. This is technically feasible with the LAD data (due to its large numberof observations) and would certainly be an interesting undertaking, but would obviouslyresult in a rather great quantity of findings which would be challenging to present anddiscuss in a compact fashion. (Other authors have estimated separate models by provinceor region, but at the cost of pooling individuals by age and sex together—precisely thelevel of detail focused on here and found to be necessary.)
• Short of such a fully disaggregated approach, specific province-language effects couldperhaps be investigated further by adding to the general models specified here separateyear variables by province and language group to see how closely these track variouseconomic and political changes: the boom and bust of the various provincial economies,political developments in Québec, and so on.
• Address the interesting and important topic of intra-provincial migration. Although the
number of observations and detailed locational information available on the LAD wouldin many ways make it ideal for such a study, the critical postal code variable on the filerepresents the address of the last communication between the individual and RevenueCanada (typically where a refund was sent) which usually occurs well into the followingyear—that is, the place of residence will not necessarily correspond to where theindividual lived in the relevant tax year and to which the other information on the filecorresponds. Any analysis of intra-provincial would obviously have to deal with thisproblem.
• Take fuller account of the longitudinal profiles. One could, for example, restrict the
analysis to individuals who appear in the LAD all years and then follow thecategorisation adopted in Finnie [1998a, c] to classify individuals into stayers, one-timemovers, multiple movers, and returners, and estimate models of these profiles or theparticular kind of move in any given year. On the other hand, the pre-1982 province isnot known in the LAD, meaning that the suggested categorisations are defined onlyrelative to the longitudinal window opened at that point, which would significantly
Analytical Studies Branch – Research Paper Series Statistics Canada No. 11F0019MPE No.142- 16 -
complicate and limit the analysis (e.g., a “one time mover” might actually be someonereturning to the pre-1982 province, a “single mover” might have had previous moves,and so on.)
• Pursue the income effects further. This could include the development of a full mover-
stayer model, involving the multi-stage estimation of earnings in the current province andpotential earnings in other provinces and including the relevant difference terms in themove models (e.g., Robinson and Tomes [1982]), although such modelling would be achallenging exercise in a multi-jurisdictional and dynamic time framework and it is notclear if the limited range of variables available on the LAD file would support such anundertaking in terms of providing the critical identifying variables. An alternativeapproach would be to add the sorts of matrices representing earnings opportunities,general labour market conditions, and other provincial characteristics which characterisesome of the aggregate level analyses into the individual level model used here (assuggested in Day [1992]), but this would comprise an elaborate exercise requiring thecareful construction of such indicators and/or their addition to the LAD from othersources for every province in every year and the specification of the appropriate choicevariables and model structure which takes all possible choice sets into account.
Final Remarks
The goal of this paper was to provide new empirical evidence on inter-provincial migration basedon a broadly based longitudinal database, and it is hoped that it has enhanced our understanding of“who moves”—helping identify the sorts of individuals who have been benefiting from inter-provincial migration and the factors which have been affecting those movements, with implicationsfor our understanding of labour market structures, the interaction between migration and some ofthe country’s basic social programmes, gender outcomes, and more. At the same time, there aremany avenues for further research, including those listed above and perhaps some to be exploredwith the LAD data used here, and so it is also hoped that while providing new evidence, this paperalso represents a useful point of departure for such further investigations.
Analytical Studies Branch – Research Paper Series Statistics Canada No. 11F0019MPE No.142- 17 -
Table 1a - Descriptive Statistics, Male
Entry Younger Prime-Younger Prime-Older (20-24) (25-34) (35-44) (45-54)
Mean Std. Dev. Mean Std. Dev. Mean Std. Dev. Mean Std. Dev.Province NFLD 0.024 0.154 0.020 0.141 0.020 0.138 0.019 0.137 NS 0.040 0.195 0.034 0.181 0.032 0.175 0.032 0.176 PEI 0.005 0.070 0.004 0.065 0.005 0.069 0.005 0.070 NB 0.032 0.177 0.027 0.162 0.028 0.165 0.026 0.160 QUE 0.265 0.441 0.262 0.440 0.266 0.442 0.262 0.440 ONT 0.356 0.479 0.364 0.481 0.360 0.480 0.376 0.484 MAN 0.048 0.213 0.044 0.205 0.041 0.199 0.040 0.197 SASK 0.038 0.190 0.035 0.185 0.033 0.179 0.032 0.176 ALTA 0.097 0.295 0.101 0.301 0.097 0.296 0.086 0.280 BC 0.097 0.295 0.108 0.310 0.119 0.323 0.123 0.328
Min. Language (ENG/FR) English-Quebec 0.032 0.176 0.032 0.176 0.035 0.183 0.037 0.190 French-ROC 0.012 0.111 0.011 0.102 0.009 0.094 0.008 0.087
Area Size 500,000+ 0.146 0.353 0.142 0.349 0.141 0.348 0.138 0.345 100,000-499,999 0.109 0.312 0.106 0.308 0.109 0.311 0.110 0.313 30,000-99,999 0.031 0.174 0.032 0.175 0.031 0.173 0.031 0.173 0-14,999 0.144 0.352 0.138 0.345 0.140 0.347 0.133 0.339 Rural Area 0.126 0.331 0.110 0.313 0.111 0.314 0.110 0.313
AGE Age 22.2 1.4 29.6 2.8 39.3 2.9 49.2 2.9 Age2 493.0 62.2 885.1 167.6 1549.6 225.2 2433.0 285.0
Family Status Single 0.323 0.467 0.239 0.426 0.153 0.360 0.127 0.333 Married, no children 0.137 0.344 0.201 0.401 0.108 0.310 0.213 0.410 Married with children 0.458 0.498 0.519 0.500 0.702 0.457 0.625 0.484 Lone parent 0.081 0.272 0.040 0.196 0.035 0.185 0.034 0.181
Unemp. and Earnings Prov. Unemp. Rate 10.18 2.82 10.06 2.75 10.09 2.71 10.10 2.71 Unemp. Ins. 0.355 0.479 0.258 0.438 0.174 0.379 0.158 0.365 Zero Earnings 0.070 0.255 0.070 0.255 0.081 0.272 0.104 0.305 Earnings 16,100 1.41E+04 29,400 2.42E+04 38,600 5.03E+04 39,700 5.29E+04 Earnings2 4.60E+08 6.45E+09 1.45E+09 1.45E+10 4.02E+09 4.17E+11 4.38E+09 1.15E+11 Imputed 0.005 0.069 0.014 0.119 0.018 0.134 0.023 0.149
Year 1982 0.092 0.289 0.073 0.260 0.063 0.242 0.068 0.2521983 0.090 0.286 0.074 0.261 0.065 0.246 0.067 0.2501984 0.087 0.282 0.074 0.262 0.066 0.249 0.067 0.2501985 0.085 0.279 0.075 0.263 0.069 0.253 0.068 0.2511986 0.083 0.275 0.076 0.265 0.071 0.257 0.069 0.2531987 0.079 0.269 0.077 0.267 0.073 0.260 0.070 0.2551988 0.076 0.264 0.079 0.269 0.076 0.265 0.073 0.2601989 0.071 0.257 0.080 0.271 0.079 0.270 0.076 0.2651990 0.069 0.253 0.080 0.272 0.082 0.275 0.079 0.2701991 0.068 0.252 0.079 0.270 0.084 0.278 0.083 0.2761992 0.068 0.251 0.079 0.269 0.088 0.283 0.088 0.2841993 0.066 0.248 0.078 0.269 0.091 0.287 0.094 0.2911994 0.068 0.251 0.076 0.266 0.093 0.291 0.098 0.297
Analytical Studies Branch – Research Paper Series Statistics Canada No. 11F0019MPE No.142- 18 -
Table 1b - Descriptive Statistics, Female
Entry Younger Prime-Younger Prime-Older (20-24) (25-34) (35-44) (45-54)
Mean Std. Dev. Mean Std. Dev. Mean Std. Dev. Mean Std. Dev.Province NFLD 0.025 0.156 0.020 0.141 0.021 0.143 0.020 0.139 NS 0.039 0.194 0.034 0.181 0.032 0.177 0.031 0.173 PEI 0.005 0.072 0.005 0.067 0.004 0.066 0.005 0.069 NB 0.032 0.175 0.028 0.164 0.026 0.160 0.027 0.162 QUE 0.257 0.437 0.262 0.440 0.270 0.444 0.277 0.447 ONT 0.349 0.477 0.362 0.481 0.364 0.481 0.375 0.484 MAN 0.047 0.211 0.040 0.197 0.040 0.195 0.038 0.192 SASK 0.036 0.187 0.035 0.184 0.031 0.174 0.032 0.177 ALTA 0.102 0.303 0.102 0.303 0.092 0.289 0.081 0.273 BC 0.108 0.310 0.112 0.315 0.120 0.325 0.115 0.319
Min. Language (ENG/FR) English-Quebec 0.033 0.179 0.035 0.183 0.041 0.198 0.071 0.257 French-ROC 0.010 0.101 0.010 0.100 0.009 0.096 0.008 0.091
Area Size 500,000+ 0.147 0.354 0.147 0.354 0.145 0.352 0.143 0.350 100,000-499,999 0.112 0.315 0.106 0.308 0.108 0.310 0.111 0.314 30,000-99,999 0.032 0.175 0.032 0.176 0.032 0.175 0.030 0.171 0-14,999 0.136 0.343 0.131 0.338 0.127 0.333 0.126 0.332 Rural Area 0.113 0.317 0.106 0.308 0.104 0.305 0.106 0.308
AGE Age 22.2 1.4 29.6 2.8 39.2 2.9 49.2 2.9 Age2 494.7 61.9 882.2 167.6 1547.6 225.0 2431.5 285.0
Family Status Single 0.233 0.423 0.138 0.345 0.095 0.293 0.128 0.334 Married, no children 0.219 0.413 0.174 0.380 0.096 0.295 0.270 0.444 Married with children 0.407 0.491 0.567 0.495 0.682 0.466 0.507 0.500 Lone parent 0.141 0.347 0.120 0.324 0.126 0.331 0.091 0.288
Unemp. and Earnings Prov. Unemp. Rate 10.22 2.82 10.09 2.75 10.11 2.73 10.13 2.71 Unemp. Ins. 0.254 0.435 0.240 0.427 0.159 0.366 0.136 0.342 Zero Earnings 0.181 0.385 0.240 0.427 0.245 0.430 0.310 0.463 Earnings 11,100 1.01E+04 15,300 1.54E+04 17,500 1.89E+04 15,900 1.98E+04 Earnings2 2.24E+08 3.44E+08 4.71E+08 1.14E+09 6.62E+08 4.06E+09 6.44E+08 6.28E+09 Imputed 0.015 0.123 0.023 0.149 0.041 0.198 0.122 0.328
Year 1982 0.096 0.295 0.072 0.259 0.061 0.240 0.065 0.2471983 0.095 0.293 0.073 0.260 0.064 0.244 0.065 0.2461984 0.090 0.287 0.074 0.261 0.066 0.248 0.065 0.2471985 0.087 0.282 0.075 0.263 0.068 0.252 0.066 0.2491986 0.083 0.276 0.076 0.264 0.071 0.256 0.068 0.2511987 0.079 0.269 0.076 0.266 0.072 0.259 0.070 0.2551988 0.074 0.261 0.078 0.268 0.076 0.264 0.073 0.2601989 0.069 0.254 0.078 0.269 0.079 0.269 0.077 0.2661990 0.067 0.251 0.080 0.271 0.082 0.275 0.080 0.2711991 0.066 0.248 0.080 0.271 0.085 0.279 0.084 0.2781992 0.064 0.245 0.080 0.271 0.088 0.284 0.090 0.2871993 0.064 0.244 0.080 0.272 0.093 0.290 0.096 0.2951994 0.065 0.247 0.078 0.269 0.095 0.294 0.100 0.300
Analytical Studies Branch – Research Paper Series Statistics Canada No. 11F0019MPE No.142- 19 -
Table 2 - Panel Logit Model Results of the Probability of Moving
Men Women
Entry Younger Prime-Younger Prime-Older Entry Younger Prime-Younger Prime-Older(20-24) (25-34) (35-44) (45-54) (20-24) (25-34) (35-44) (45-54)
Intercept -2.714 -1.040 -.243 .806 -6.740 ** -1.356 -4.129 * -1.389(2.567) (.721) (1.667) (3.693) (2.559) (.731) (1.737) (3.983)
Province (ONT) NFLD .427 ** .336 ** .161 .110 .323 ** .197 ** .149 .308 *
(.098) (.069) (.091) (.127) (.097) (.070) (.093) (.134) NS .420 ** .379 ** .381 ** .257 ** .431 ** .371 ** .342 ** .252 **
(.053) (.038) (.048) (.069) (.052) (.038) (.050) (.076) PEI .315 ** .324 ** .354 ** .355 ** .413 ** .408 ** .542 ** .042
(.117) (.084) (.100) (.135) (.106) (.077) (.093) (.179) NB .259 ** .213 ** .216 ** .118 .147 * .143 ** .149 * .140
(.064) (.045) (.057) (.082) (.065) (.046) (.060) (.088) QUE -.392 ** -.495 ** -.433 ** -.487 ** -.431 ** -.485 ** -.425 ** -.547 **
(.045) (.033) (.041) (.061) (.045) (.033) (.042) (.069) MAN .453 ** .438 ** .469 ** .468 ** .441 ** .483 ** .445 ** .462 **
(.038) (.026) (.033) (.046) (.038) (.026) (.034) (.048) SASK .583 ** .479 ** .439 ** .487 ** .594 ** .540 ** .538 ** .412 **
(.040) (.029) (.038) (.053) (.040) (.029) (.038) (.057) ALTA .491 ** .488 ** .457 ** .485 ** .492 ** .493 ** .444 ** .435 **
(.030) (.019) (.025) (.035) (.029) (.019) (.026) (.038) BC .275 ** .196 ** .169 ** .113 * .210 ** .160 ** .126 ** .068
(.041) (.027) (.033) (.046) (.040) (.027) (.034) (.050)
Min. Language (ENG/FR) English-Quebec .775 ** .900 ** .846 ** .842 ** .709 ** .803 ** .740 ** .693 **
(.051) (.035) (.043) (.063) (.052) (.035) (.044) (.070) French-ROC .437 ** .583 ** .487 ** .409 ** .519 ** .561 ** .529 ** .377 **
(.062) (.042) (.058) (.091) (.065) (.044) (.058) (.095)
Area Size (500,000+) 100,000-499,999 .108 ** .021 .077 ** .100 ** .036 .014 -.013 .031
(.029) (.020) (.026) (.036) (.029) (.021) (.027) (.039) 30,000-99,999 .070 * .003 .023 -.043 .042 -.029 -.026 .020
(.031) (.021) (.028) (.041) (.030) (.022) (.029) (.041) 15,000-29,999 .118 * -.011 -.037 .019 -.050 -.002 .091 * -.050
(.049) (.035) (.048) (.064) (.052) (.035) (.042) (.073) 0-14,999 .060 * -.055 ** -.011 -.017 .005 -.007 -.009 -.043
(.028) (.019) (.025) (.035) (.028) (.020) (.026) (.038) Rural Area -.044 -.155 ** -.124 ** -.095 * -.109 ** -.116 ** -.144 ** -.164 **
(.031) (.023) (.030) (.041) (.032) (.023) (.031) (.045)
AGE Age .070 -.057 -.100 -.127 .430 -.041 .107 -.024
(.234) (.049) (.085) (.150) (.233) (.050) (.089) (.162) Age2 -.0018 .0006 .0010 .0011 -.0098 .0003 -.0016 .0000
(.0053) (.0008) (.0011) (.0015) (.0053) (.0009) (.0011) (.0016)continued...
Analytical Studies Branch – Research Paper Series Statistics Canada No. 11F0019MPE No.142- 20 -
Table 2 - Panel Logit Model Results on the Probability of Moving (concluded)Family Status (Single) Married, No Children -.160 ** -.178 ** -.073 * -.137 ** -.184 ** -.169 ** -.066 .004
(.029) (.018) (.029) (.034) (.026) (.021) (.035) (.038) Married, Children -.282 ** -.211 ** -.192 ** -.309 ** -.250 ** -.278 ** -.206 ** -.280 **
(.020) (.014) (.021) (.030) (.023) (.018) (.027) (.037) Lone Parent -.302 ** -.214 ** -.095 * -.269 ** -.182 ** -.170 ** -.119 ** -.143 **
(.037) (.034) (.044) (.068) (.030) (.023) (.033) (.050)
Unemp. and Earnings Prov. Unemp. Rate .020 * .012 * .015 * .025 * .022 ** .025 ** .015 * .012
(.008) (.006) (.007) (.010) (.008) (.006) (.008) (.011) Unemp. Ins. -.015 .074 ** .150 ** .161 ** .065 ** .065 ** .112 ** .180 **
(.019) (.015) (.021) (.031) (.021) (.015) (.022) (.034) Zero Earnings -.152 ** .026 .189 ** .281 ** -.057 .090 ** .039 .096 *
(.040) (.028) (.032) (.040) (.031) (.019) (.024) (.038) Earnings -6.45E-06 ** -5.13E-07 1.14E-06 ** 2.49E-06 ** -1.00E-05 ** -4.26E-06 ** -5.60E-06 ** -3.92E-06 **
(.9E-06) (.4E-06) (.4E-06) (.5E-06) (.2E-05) (.7E-06) (.7E-06) (.1E-05) Earnings2 5.00E-12 ** 2.45E-13 -1.41E-12 -3.56E-12 ** 1.41E-10 * 1.77E-11 ** 6.50E-12 ** 4.15E-12 *
(1.7E-12) (6.6E-13) (9.9E-13) (1.4E-12) (5.6E-11) (5.3E-12) (1.3E-12) (1.8E-12) Imputed 3.27E-01 ** 9.69E-02 1.23E-02 -1.15E-01 -6.12E-03 3.00E-02 -1.91E-02 -1.40E-01 **
(1.1E-01) (5.1E-02) (5.6E-02) (7.5E-02) (7.1E-02) (3.7E-02) (4.0E-02) (4.5E-02)
Year (1982) 1983 -.036 -.010 -.027 -.099 -.046 -.032 .028 -.029
(.043) (.031) (.045) (.061) (.041) (.032) (.047) (.072) 1984 .009 -.065 * -.135 ** -.106 .009 -.060 -.056 .108
(.042) (.031) (.047) (.062) (.040) (.033) (.048) (.067) 1985 .049 .004 .016 .019 -.032 -.015 .067 .069
(.041) (.030) (.043) (.057) (.041) (.032) (.045) (.068) 1986 .014 -.007 .059 -.024 -.010 .061 * .078 .092
(.042) (.030) (.042) (.059) (.042) (.031) (.045) (.067) 1987 -.012 .032 .038 .022 .042 .072 * .085 .055
(.045) (.031) (.043) (.059) (.042) (.032) (.046) (.070) 1988 .057 -.006 .061 -.096 .019 .090 ** .138 ** .077
(.047) (.033) (.045) (.066) (.047) (.034) (.048) (.072) 1989 .071 -.030 .062 .029 .088 .064 .132 ** .148 *
(.049) (.034) (.046) (.064) (.048) (.035) (.048) (.072) 1990 .012 -.048 .018 .045 -.027 .035 .098 * .140 *
(.049) (.033) (.045) (.061) (.049) (.034) (.048) (.070) 1991 -.107 * -.084 ** .001 -.042 -.068 -.037 .032 .097
(.047) (.031) (.041) (.056) (.045) (.032) (.044) (.064) 1992 -.060 -.095 ** -.048 -.071 -.078 -.112 ** -.019 .035
(.046) (.031) (.041) (.055) (.045) (.033) (.045) (.064) 1993 -.028 -.094 ** -.010 -.101 -.052 -.046 .080 .064
(.046) (.031) (.041) (.056) (.045) (.032) (.043) (.063) 1994 -.053 -.066 * -.056 -.076 -.053 -.035 .054 -.006
(.046) (.031) (.041) (.055) (.045) (.032) (.043) (.065)
No. Obs. 92,960 259,700 235,970 168,450 98,560 273,870 239,070 165,640Log-Likelihood 21,987 45,774 25,609 12,700 22,398 44,224 24,583 10,946
Standard errors are shown in parentheses. One asterisk indicates that the coefficient is significatively different from zero at the .05
confidence level according to a two-tailed t-test, two asterisks indicates significance at the .01 level.
Analytical Studies Branch – Research Paper Series Statistics Canada No. 11F0019MPE No.142- 21 -
Table 3 - Effects in Percentage Terms (Relative to Baseline Probabilities)Men Women
Entry Younger Prime-Younger Prime-Older Entry Younger Prime-Younger Prime-Older(20-24) (25-34) (35-44) (45-54) (20-24) (25-34) (35-44) (45-54)
Province (ONT) NFLD .492 .339 .141 .108 .316 .189 .145 .326 NS .481 .388 .365 .269 .439 .381 .362 .261 PEI .344 .325 .335 .386 .418 .425 .621 .040 NB .276 .205 .193 .116 .135 .134 .145 .138 QUE -.312 -.362 -.297 -.369 -.319 -.357 -.327 -.404 MAN .527 .459 .466 .536 .450 .518 .490 .524 SASK .721 .508 .431 .562 .640 .591 .616 .457 ALTA .582 .520 .451 .559 .512 .531 .489 .488 BC .295 .187 .148 .110 .198 .152 .122 .065
Min. Language (ENG/FR) English-Quebec 1.046 1.108 .976 1.133 .794 .967 .920 .868 French-ROC .505 .643 .488 .456 .544 .619 .604 .412
Area Size (500,000+) 100,000-499,999 .107 .019 .065 .097 .032 .012 -.011 .029 30,000-99,999 .068 .003 .019 -.039 .037 -.025 -.023 .018 15,000-29,999 .118 -.009 -.030 .017 -.042 -.001 .087 -.045 0-14,999 .058 -.047 -.009 -.016 .004 -.006 -.008 -.039 Rural Area -.041 -.130 -.097 -.085 -.091 -.099 -.124 -.142
AGE Age -.009 -.020 -.023 -.024 -.004 -.022 -.010 -.025
Family Status (Sgl.) Marr., No Chil. -.141 -.147 -.058 -.121 -.150 -.141 -.059 .004 Marr., Chil. -.236 -.172 -.145 -.253 -.198 -.222 -.173 -.231 Lone Parent -.250 -.174 -.074 -.224 -.148 -.142 -.104 -.125
Unemp. and Earnings Prov. Unemp. Rate .019 .010 .012 .023 .019 .022 .014 .011 Unemp. Ins. -.014 .068 .131 .161 .058 .059 .107 .181 Zero Earnings -.134 .023 .167 .297 -.048 .083 .037 .092 Earnings* -5.65E-03 -4.50E-04 1.04E-03 2.29E-03 -8.55E-03 -3.77E-03 -5.11E-03 -3.63E-03 Imputed 3.60E-01 8.91E-02 1.01E-02 -1.02E-01 -5.32E-03 2.70E-02 -1.74E-02 -1.23E-01
Year (1982) 1983 -.033 -.009 -.022 -.088 -.039 -.028 .026 -.027 1984 .009 -.056 -.105 -.094 .008 -.053 -.050 .106 1985 .047 .004 .013 .017 -.028 -.013 .063 .066 1986 .013 -.006 .049 -.022 -.008 .056 .074 .089 1987 -.012 .029 .032 .021 .037 .065 .080 .052 1988 .056 -.005 .051 -.086 .016 .083 .134 .074 1989 .070 -.026 .052 .027 .079 .058 .128 .147 1990 .012 -.042 .015 .043 -.023 .032 .094 .138 1991 -.097 -.072 .001 -.038 -.058 -.032 .029 .094 1992 -.055 -.081 -.039 -.064 -.066 -.095 -.017 .033 1993 -.026 -.081 -.008 -.090 -.045 -.040 .076 .061 1994 -.049 -.057 -.045 -.069 -.045 -.031 .050 -.006* Marginal probability was calculated under the assumption of a $1000 change in earnings
Analytical Studies Branch – Research Paper Series Statistics Canada No. 11F0019MPE No.142- 22 -
Table 4 - Panel Logit Models With Social Assistance Variable Included (1992-95)
Men Women
Entry Younger Prime-Younger
Prime-Older Entry Younger Prime-Younger
Prime-Older
(20-24) (25-34) (35-44) (45-54) (20-24) (25-34) (35-44) (45-54)
Intercept -.367 .119 -.016 -.198 .212 -.315 -.789 * -.452
(.593) (.162) (.329) (.719) (.590) (.166) (.341) (.777)
Province (ONT)
NFLD .459 .334 -.365 -.940 .109 .175 .525 -.987
(.693) (.475) (.576) (.792) (.676) (.487) (.588) (.870)
NS .502 * .266 .195 .136 .698 ** .201 .429 * -.243
(.245) (.170) (.207) (.277) (.239) (.175) (.211) (.321)
PEI .436 .155 -.110 -.026 .979 .200 .686 -.103
(.554) (.392) (.461) (.601) (.538) (.390) (.462) (.730)
NB .180 .150 -.069 .119 .236 .000 .159 -.272
(.189) (.131) (.161) (.209) (.191) (.137) (.163) (.244)
QUE -.415 * -.466 ** -.496 ** -.561 ** -.270 -.415 ** -.330 * -.831 **
(.185) (.125) (.149) (.202) (.180) (.127) (.154) (.231)
MAN .537 ** .484 ** .435 ** .433 ** .320 ** .404 ** .426 ** .570 **
(.110) (.071) (.089) (.121) (.109) (.075) (.087) (.128)
SASK .756 ** .433 ** .531 ** .552 * .330 .574 ** .416 * .925 **
(.203) (.141) (.169) (.234) (.203) (.142) (.170) (.251)
ALTA .538 ** .409 ** .523 ** .494 ** .425 ** .467 ** .399 ** .566 **
(.102) (.067) (.079) (.110) (.099) (.067) (.079) (.119)
BC .300 ** .215 ** .192 ** .211 ** .111 .172 ** .093 .157
(.078) (.048) (.058) (.077) (.077) (.050) (.059) (.086)
Min. Language(ENG/FR) English-Quebec .932 ** .900 ** .882 *
* .841 ** .553 ** .734 ** .698 ** .749 **
(.115) (.072) (.081) (.108) (.131) (.073) (.090) (.129)
French-ROC .622 ** .619 ** .698 ** .304 .514 ** .671 ** .624 ** .554 **
(.133) (.085) (.103) (.165) (.158) (.091) (.106) (.158)
Area Size (500,000+)
100,000-499,999 .134 * .056 .091 .093 .134 * .081 .011 .039
(.067) (.042) (.049) (.067) (.063) (.041) (.051) (.072)
30,000-99,999 .191 ** -.011 .033 -.052 .040 -.005 -.002 .063
(.068) (.048) (.054) (.080) (.073) (.047) (.055) (.074)
15,000-29,999 .262 * .128 -.004 .109 -.143 .225 ** .301 ** .053
(.107) (.071) (.095) (.114) (.138) (.067) (.074) (.123)
0-14,999 .137 * .034 -.030 -.005 .081 -.031 -.041 -.168 *
(.066) (.042) (.051) (.069) (.065) (.045) (.052) (.081)
Rural Area .116 -.034 -.037 -.125 .024 -.079 -.179 ** -.311 **
(.070) (.048) (.057) (.083) (.072) (.049) (.062) (.098)
AGE Age .120 -.229 * -.139 -.042 -.347 .072 .309 .037
(.536) (.105) (.166) (.291) (.534) (.108) (.172) (.314)
Age2 -.0024 .0036 * .0015 .0002 .0081 -.0017 -.0041 -.0006
(.0122) (.0018) (.0021) (.0030) (.0121) (.0018) (.0022) (.0032)
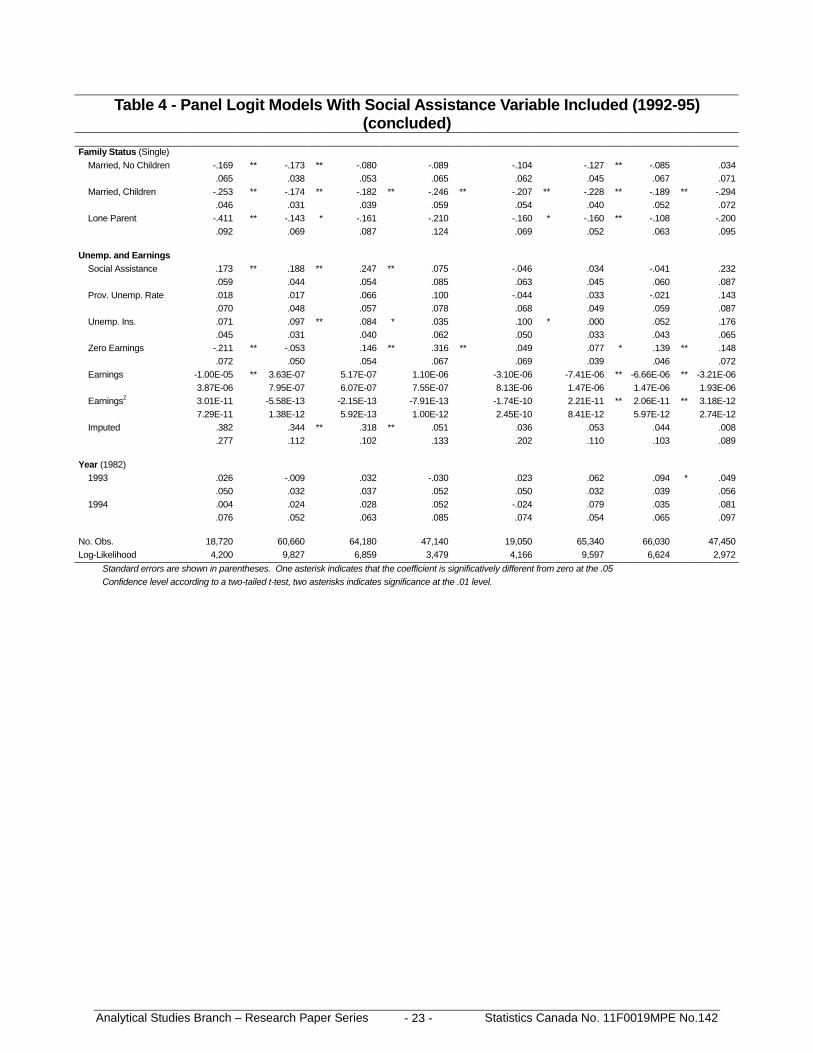
Analytical Studies Branch – Research Paper Series Statistics Canada No. 11F0019MPE No.142- 23 -
Table 4 - Panel Logit Models With Social Assistance Variable Included (1992-95)(concluded)
Family Status (Single) Married, No Children -.169 ** -.173 ** -.080 -.089 -.104 -.127 ** -.085 .034
.065 .038 .053 .065 .062 .045 .067 .071 Married, Children -.253 ** -.174 ** -.182 ** -.246 ** -.207 ** -.228 ** -.189 ** -.294
.046 .031 .039 .059 .054 .040 .052 .072 Lone Parent -.411 ** -.143 * -.161 -.210 -.160 * -.160 ** -.108 -.200
.092 .069 .087 .124 .069 .052 .063 .095
Unemp. and Earnings Social Assistance .173 ** .188 ** .247 ** .075 -.046 .034 -.041 .232
.059 .044 .054 .085 .063 .045 .060 .087 Prov. Unemp. Rate .018 .017 .066 .100 -.044 .033 -.021 .143
.070 .048 .057 .078 .068 .049 .059 .087 Unemp. Ins. .071 .097 ** .084 * .035 .100 * .000 .052 .176
.045 .031 .040 .062 .050 .033 .043 .065 Zero Earnings -.211 ** -.053 .146 ** .316 ** .049 .077 * .139 ** .148
.072 .050 .054 .067 .069 .039 .046 .072 Earnings -1.00E-05 ** 3.63E-07 5.17E-07 1.10E-06 -3.10E-06 -7.41E-06 ** -6.66E-06 ** -3.21E-06
3.87E-06 7.95E-07 6.07E-07 7.55E-07 8.13E-06 1.47E-06 1.47E-06 1.93E-06 Earnings2 3.01E-11 -5.58E-13 -2.15E-13 -7.91E-13 -1.74E-10 2.21E-11 ** 2.06E-11 ** 3.18E-12
7.29E-11 1.38E-12 5.92E-13 1.00E-12 2.45E-10 8.41E-12 5.97E-12 2.74E-12 Imputed .382 .344 ** .318 ** .051 .036 .053 .044 .008
.277 .112 .102 .133 .202 .110 .103 .089
Year (1982) 1993 .026 -.009 .032 -.030 .023 .062 .094 * .049
.050 .032 .037 .052 .050 .032 .039 .056 1994 .004 .024 .028 .052 -.024 .079 .035 .081
.076 .052 .063 .085 .074 .054 .065 .097
No. Obs. 18,720 60,660 64,180 47,140 19,050 65,340 66,030 47,450Log-Likelihood 4,200 9,827 6,859 3,479 4,166 9,597 6,624 2,972
Standard errors are shown in parentheses. One asterisk indicates that the coefficient is significatively different from zero at the .05Confidence level according to a two-tailed t-test, two asterisks indicates significance at the .01 level.
Analytical Studies Branch – Research Paper Series Statistics Canada No. 11F0019MPE No.142- 24 -
References
Anderson, Isabel B. [1966], Internal Migration in Canada, 1921-1961, Economic Council ofCanada, Staff Study No. 13 (Ottawa: The Queen’s Printer).
Atkinson, A.B., F. Bourguignon, and C. Morrison [1992], Empirical Studies of Earnings Mobility(Switzerland: Harwood Academic Publishers).
Courchene, Thomas J. [1970], “Interprovincial Migration and Economic Adjustment”, CanadianJournal of Economics, V.3, N. 4 (November), pp. 550-76.
_____________________ [1974] “Migration, Income and Employment” (Toronto: C.D. HoweInstitute).
Day, Kathleen [1992], “Interprovincial Migration and Local Public Goods”, Canadian Journal ofEconomics, V. XXV, N. 1 (February), pp. 123-44.
Day, Kathleen and R.Q. Grafton [1998], “Interprovincial student mobility in Canada”, Ottawa:Dept. of Economics, University of Ottawa.
Day, Kathleen and Stan Winer [1994], “Internal Migration and Public Policy: An Introduction to theIssues and a Review of Empirical Research in Canada”, in A. Maslove (ed.), Issues in theTaxation of Individuals (Toronto: University of Toronto Press).
Dean, James M. [1992], “Tax-Induced Migration in Canada 1972-79”, Western Economic Review,V. 1, N. 2, pp. 17-31.
Finnie, Ross [1997a], “Earnings Patterns by Age and Sex in Canada, 1982-92”, Human ResourcesDevelopment Canada (Applied Research Branch) Research Paper R-97-11E. See also“Earnings Patterns by Age and Sex” (with Gaétan Garneau), Canadian Economic Observer,Ottawa: Statistics Canada, October, 1997.
___________ [1997b], “Stasis and Change: Trends in Earnings Levels and Inequality, 1982-92”,Canadian Business Economics, Vol. 5, No. 4 (October-December/Fall 1997), pp. 84-107.
___________ [1997c], “Earnings Mobility in Canada, 1982-92”, Human Resources DevelopmentCanada (Applied Research Branch) Working Paper W-97-3Ea.
___________ [1997d], “The Distribution of Earnings in a Dynamic Context in Canada, 1982-92”,Human Resources Development Canada (Applied Research Branch) Working Paper W-97-3Eb.
___________ [1997e], “The Correlation of Individuals’ Earnings Over Time in Canada, 1982-92”,Human Resources Development Canada (Applied Research Branch) Working Paper W-97-3Ec.
Analytical Studies Branch – Research Paper Series Statistics Canada No. 11F0019MPE No.142- 25 -
___________ [1997f], “A Dynamic Analysis of Low Market incomes (“Market Poverty”) ofCanadian Families With Children 1982-93”, Human Resources Development Canada(Applied Research Branch) Working Paper W-97-3Ed.
___________ [1997g], “Unequal Inequality: The Distribution of Individuals’ Earnings by Province1982-94”, forthcoming, Human Resources Development Canada (Applied ResearchBranch) Working Paper.
___________ [1998a], “Inter-Provincial Mobility in Canada: A Longitudinal Analysis”,forthcoming Human Resources Development Canada (Applied Research Branch) WorkingPaper and School of Policy Studies at Queen’s University mimeo.
___________ [1998b], “The Patterns of Inter-Provincial Migration in Canada 1982-95: Evidencefrom Longitudinal Tax-Based Data”, School of Policy Studies at Queen’s Universitymimeo.
____________ [1998c], “Inter-Provincial Migration: A Longitudinal Analysis of Movers andStayers”, School of Policy Studies at Queen’s University mimeo.
____________ [1998d], “The Effects of Inter-Provincial Mobility on Individuals’ Earnings: PanelModel Estimates for Canada”, forthcoming, Human Resources Development Canada(Applied Research Branch) Working Paper and School of Policy Studies at Queen’sUniversity mimeo.
Gallway, L.E. [1969], “The Effect of Geographic Labour Mobility on Income: A Brief Comment”,Journal of Human Resources, V. 4, pp. 103-9.
Graham, John [1964], “Fiscal Adjustment in a Federal Country”, in Inter-government FiscalRelationships, Canadian Tax Papers No. 40 (Toronto: Canadian Tax Foundation).
Grant, E. Kenneth and John Vanderkamp [1976], The Economic Causes and Effects of Migration:Canada, 1965-71”, The Economic Council of Canada (Ottawa: The Queen’s Printer).
____________ [1980], The Effects of Migration on Income: A Micro Study with Canadian Data1965-71”, The Canadian Journal of Economics, V. 13, N. 3 (August), pp. 381-406.
____________ [1984], “A Descriptive Analysis of the Incidence and Nature of Repeat MigrationWithin Canada, 1968-71”, Canadian Studies in Population, V. 11, No. 1 (1984), pp. 61-78.
_____________ [1986], “Repeat Migration and Disappointment”, Canadian Journal of RegionalScience, V. IX, No. 3 (Autumn), pp. 299-321.
Greenwood, Michael [1975] “Research on Internal Migration in the United States: A Survey”,Journal of Economic Literature, V. 13, pp. 397-433.
Hiscott, Robert D. [1987], “Recent Migration from Ontario to Atlantic Canada: A comparison ofReturning and Non-Return Migrants”, Canadian Review of Sociology and Anthropology, V.24, N. 4, pp. 586-599.
Analytical Studies Branch – Research Paper Series Statistics Canada No. 11F0019MPE No.142- 26 -
Hou, Feng, and Roderic Beaujot [1995], “A Study of Interregional Migration Between Ontario andAtlantic Canada: 1981-1991”, Canadian Journal of Regional Science, Vol. XVIII 11, No. 2(Summer), pp. 147-160.
Laber, Gene and R.X. Chase [1971], “Interprovincial Migration in Canada as a Human CapitalInvestment”, Journal of Political Economy, V. 79, pp. 795-804.
Lin, Zhengxi [1995], “Interprovincial Labour Mobility in Canada: The Role of UnemploymentInsurance and Social Assistance”, Human Resources Development Canada, EvaluationBranch.
Marr, William L. and Frank W. Millard [1980], “Employment and Income Levels of Inter-Provincial Migrants Versus Non-Migrants”, Canada 1971”, IN J.L. Simon and J. DaVanzo(eds.), Research in Population Economics, Vol. 2 (Greenwich, Conn.: JAI Press).
Mills, K. E., M. Percy and L. S. Wilson [1983], “The Influence of Fiscal Incentives on InterregionalMigration: Canada 1961-78”, The Canadian Journal of Regional Science, V. VI, N. 2(Autumn), pp. 207-229.
Mincer, Jacob [1978], “Family Migration Decisions”, Journal of Political Economy, V. 86, N, pp.749-73.
Nakosteen, Robert A. and Michael Zimmer [1980], Migration and Income: the Question of Self-Selection”, Southern Economic Journal, V. 46, pp. 840-51.
Newbold, Bruce and Kao-Lee Liaw [1990], “Characterization of Primary, Return, and OnwardInterprovincial Migration in Canada: Overall and Age-Specific Patterns”, Canadian Journalof Regional Science, V. XIII, No. 1 (Spring), pp. 17-33.
OECD [1996], Employment Outlook, Chapter 3: “Earnings Inequality, Low-Paid Employment andEarnings Mobility”, pp. 59-108 (Paris: Organization for Economic Cooperation andDevelopment).
Osberg, Lars, Daniel Gordon and Zhengxi Lin [1994], “Interregional Migration and InterindustryLabour Mobility in Canada: A Simultaneous Approach”, Canadian Journal of Economics,V. XXVII, N. 1 (February), pp. 58-80.
Polachek, Soloman and Francis Horvath [1977], “A Lifecycle Approach to Migration: Analysis ofthe Perspicacious Peregrinator”, in R.G. Ehrenberg (ed.), Research in Labor Economics, V.1(Greenwich, Conn.: JAI Press).
Robinson, Chris and Nigel Tomes [1982], “Self-Selection and Interprovincial Migration inCanada”, Canadian Journal of Economics, V. XV, N. 3 (August), pp. 474-502.
Rosenbaum, Harry, [1993] “Return Inter-Provincial Migration in Canada, 1966-1971”, CanadianStudies in Population, V. 15, No. 1, pp. 51-65.
____________, [1988] “Selectivity Among Various Types of Inter-Provincial Migrants, Canada1976-1981”, Canadian Studies in Population, V. 20, No. 1 (1993), pp. 85-106.
Analytical Studies Branch – Research Paper Series Statistics Canada No. 11F0019MPE No.142- 27 -
Rosenbluth, Gideon [1996], “Interprovincial Migration and the Efficacy of Provincial Job CreationPolicies”, Canadian Business Economics, Vol. 4, No. 2 (January-March/Winter), pp. 22-35.
Schwartz, Abba [1973], “Interpreting the Effect of Distance on Migration”, Journal of PoliticalEconomy, V. 81, pp. 1153-69.
Shaw, R. Paul [1986], “Fiscal Versus Traditional Market Variables in Canadian Migration”,Journal of Political Economy, V. 94, N. 3, pp. 648-666.
Sjaastad, Larry [1962], “The Costs and Returns of Human Migration”, Journal of PoliticalEconomy (Supplement), V. 70, pp. 80-93.
Statistics Canada [1993]: Mobility and Migration: The Nation, Cat. 93-322, Table 1b (Ottawa:Supply and Services Canada).
Stone, Leroy O. [1969], Migration in Canada: some Regional Aspects (Ottawa: Dominion Bureauof Statistics).
Vachon, Marc and François Vaillancourt [1998], “Interprovincial Mobility in Canada, 1961-1996:Trends and Determinants”, forthcoming in Lazar, Harvey (ed.), Canada: the State of theFederation, 1997, Centre for Intergovernmental Relations, Queen’s University at Kingston,Ontario.
Vanderkamp, John [1971], “Migration Flows, Their Determinants and the Effects of ReturnMigration”, Journal of Political Economy, V. 79, p. 1012-31.
________________ [1972], “Return Migration: Its Significance and Behavior”, Western EconomicJournal, 10:460-465.
________________ [1977], “Industrial Mobility: Some Further Results”, Canadian Journal ofEconomics, V. X, N. 3 (August), pp. 462-71.
________________ [1988], “Regional Disparities: A Model with Some Econometric Results forCanada”, pp. 269-96 in Higgins, B. and D. J. Savoie (eds.), Regional EconomicDevelopment: Essays in Honour of François Penoux (Boston: Unwin Hyman).
Vanderkamp, John and John Grant [1988], “Canadian Internal Migration Statistics: SomeComparisons and Evaluations”, Canadian Journal of Regional Science, V. XI, No. 1(Spring) pp. 9-32.
Winer, Stanley L. and Denis Gauthier [1982], “Internal Migration and Fiscal Structure”, studyprepared for the Economic Council of Canada (Ottawa: Supply and Services Canada).