Embed Size (px)
Citation preview
Who needs a guidance from a financial adviser?
Japanese survey evidenceDecember 25, 2018
Hiroshi FUJIKI
Chuo University
1
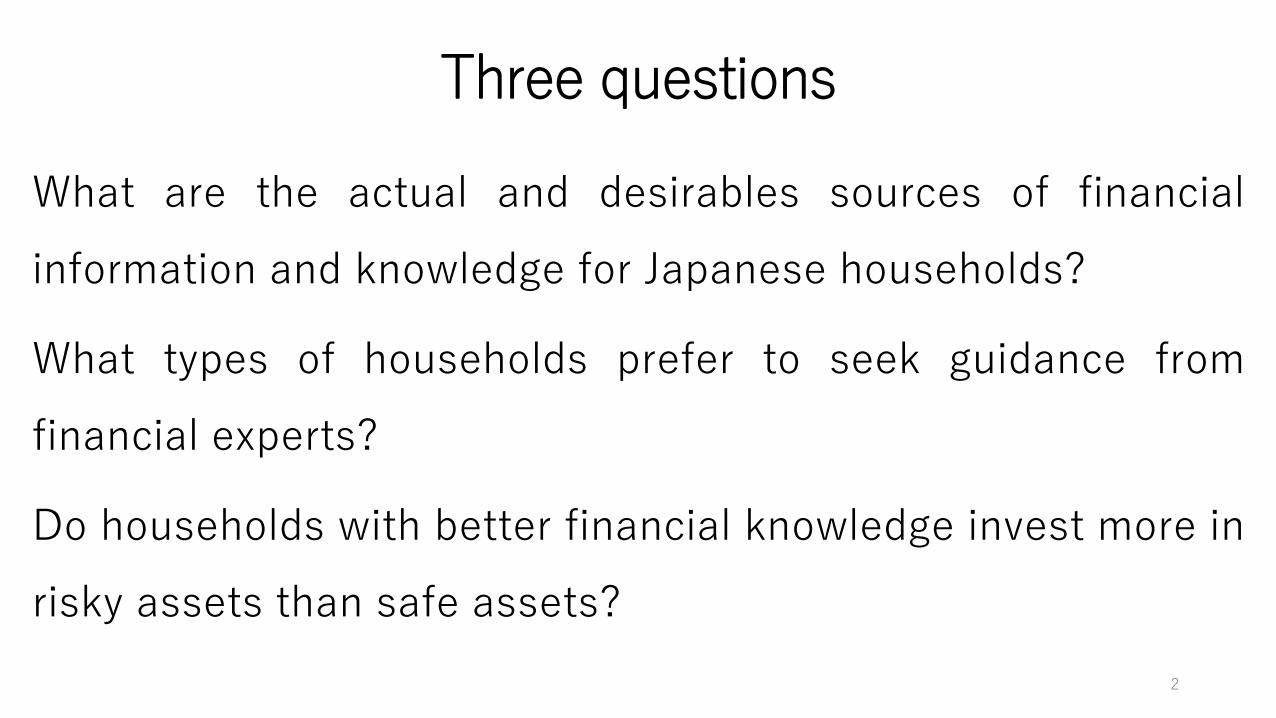
Three questions
What are the actual and desirables sources of financial
information and knowledge for Japanese households?
What types of households prefer to seek guidance from
financial experts?
Do households with better financial knowledge invest more in
risky assets than safe assets?
2
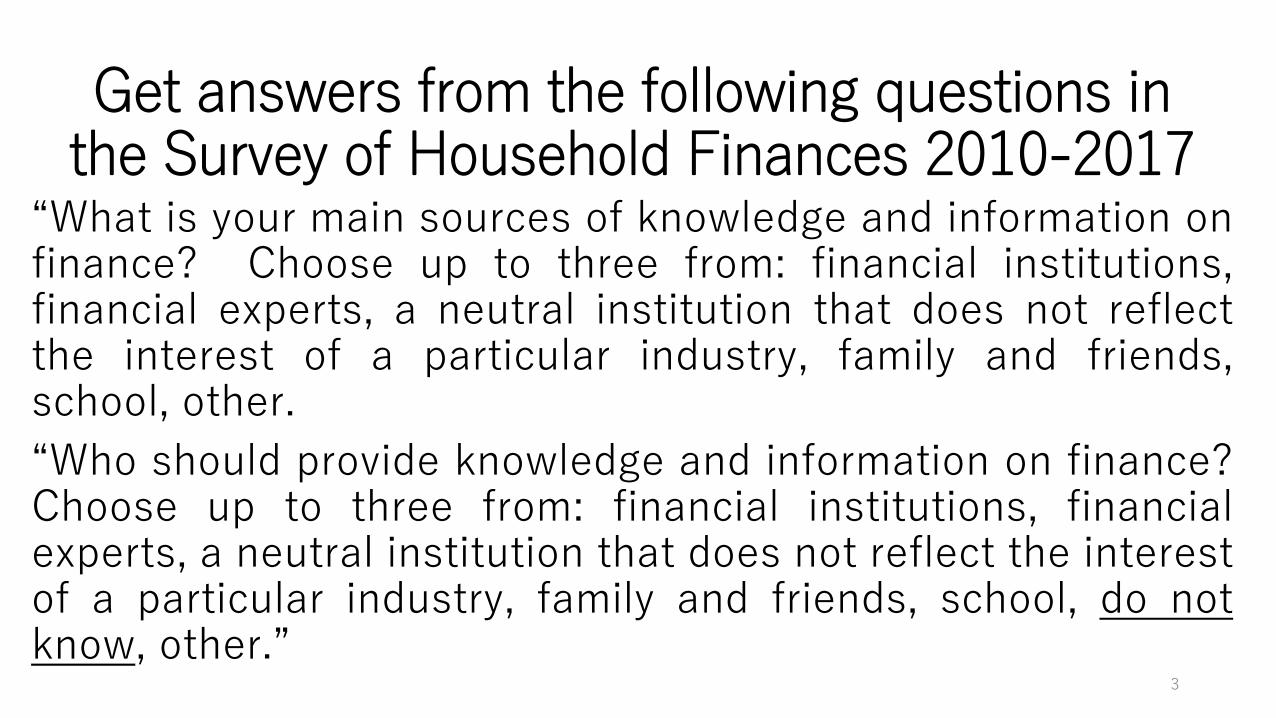
Get answers from the following questions in the Survey of Household Finances 2010-2017
“What is your main sources of knowledge and information onfinance? Choose up to three from: financial institutions,financial experts, a neutral institution that does not reflectthe interest of a particular industry, family and friends,school, other.
“Who should provide knowledge and information on finance?Choose up to three from: financial institutions, financialexperts, a neutral institution that does not reflect the interestof a particular industry, family and friends, school, do notknow, other.”
3
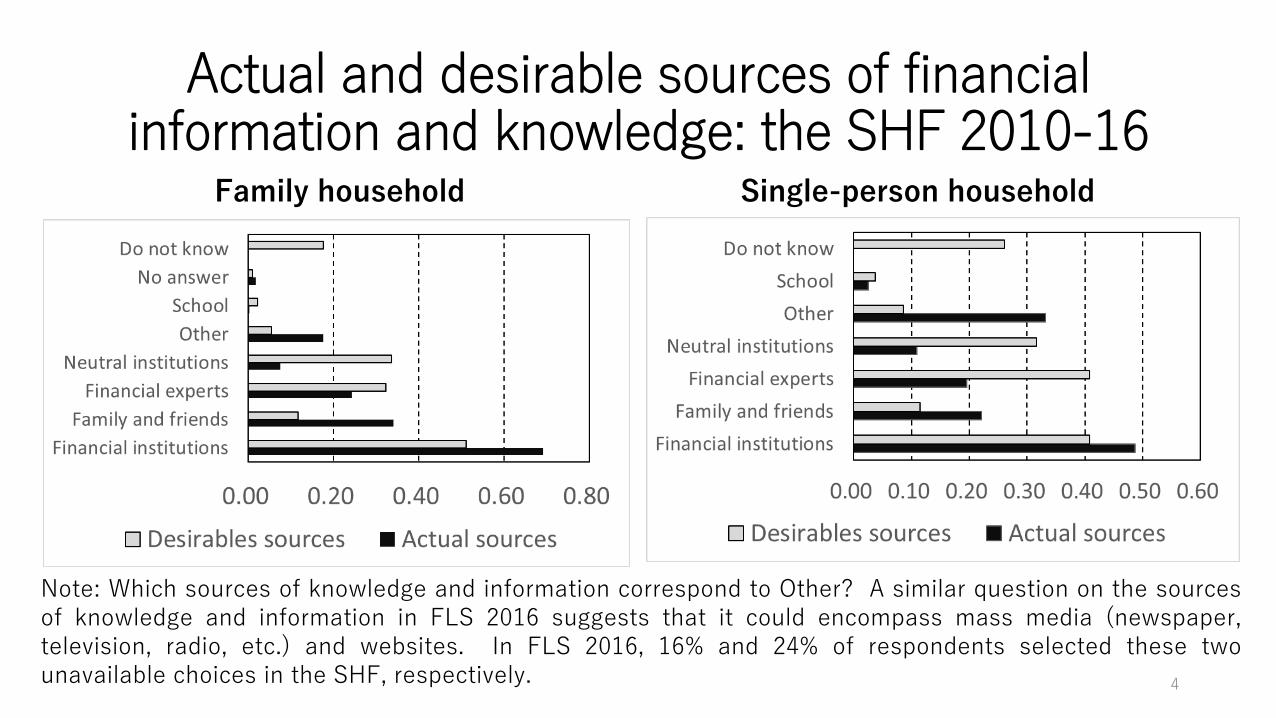
Actual and desirable sources of financialinformation and knowledge: the SHF 2010-16
Family household Single-person household
4
Note: Which sources of knowledge and information correspond to Other? A similar question on the sourcesof knowledge and information in FLS 2016 suggests that it could encompass mass media (newspaper,television, radio, etc.) and websites. In FLS 2016, 16% and 24% of respondents selected these twounavailable choices in the SHF, respectively.
Better financial knowledge, more guidance
Households choosing actual sources of financial informationand knowledge involving financial experts have betterfinancial knowledge, as measured by knowledge about theDeposit Insurance Corporation of Japan (DICJ), and are morewilling to purchase high-yielding financial products entailingthe possibility of a capital loss within one to two years.
Households choosing desirable sources involving financialexperts and neutral institutions also have better financialknowledge.
5
Better financial knowledge, more guidance, but not necessarily higher ratio of risky assets
It is unclear whether households seeking guidance fromfinancial experts tend to have a higher ratio of stocks to totalfinancial assets than households selecting financialinstitutions as their source of financial information andknowledge.
For example, in the single-person household data, the ATEs on theratio of stocks to total financial assets for choosing exclusivelyexperts, exclusively family and friends, and exclusively othercompared with those for choosing financial institutions are allpositive and statistically significant.
6
Note on the measurement of household’s financial knowledge
Economists measure financial literacy by a financial literacy indexthat counts the number of correct answers to three questions oncompound interest rates, inflation and the real value of financialassets, and diversified investment (Lusardi and Mitchell (2014)) .
Are the dummy variables for households that know or have heardabout the role of the DICJ good proxy variables for a household’sfinancial knowledge ?
Fujiki (2018) finds that the imputed financial literacy variables usingfour different matching methods yield high values for agents withbetter knowledge about the DICJ.
7
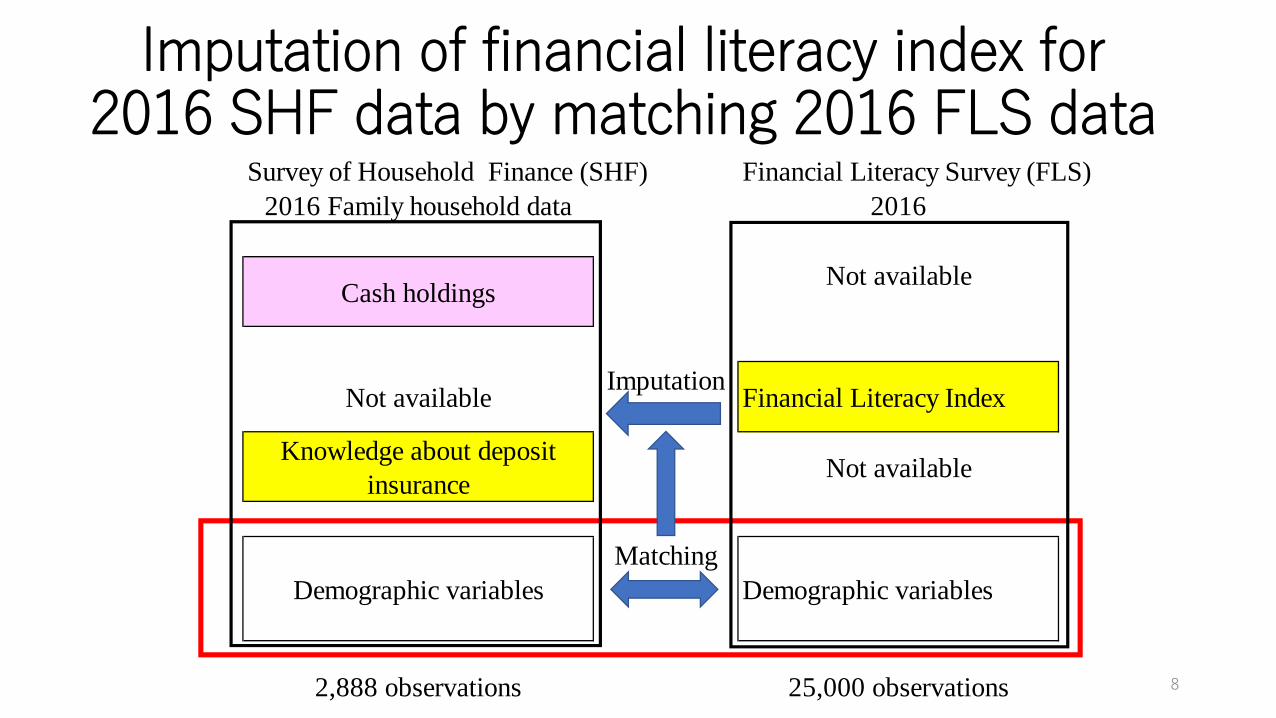
Imputation of financial literacy index for 2016 SHF data by matching 2016 FLS data
Survey of Household Finance (SHF) Financial Literacy Survey (FLS)
2016 Family household data 2016
Not available
Imputation
Knowledge about deposit
insuranceNot available
Matching
Demographic variables
2,888 observations 25,000 observations
Financial Literacy Index
Cash holdings
Demographic variables
Not available
8
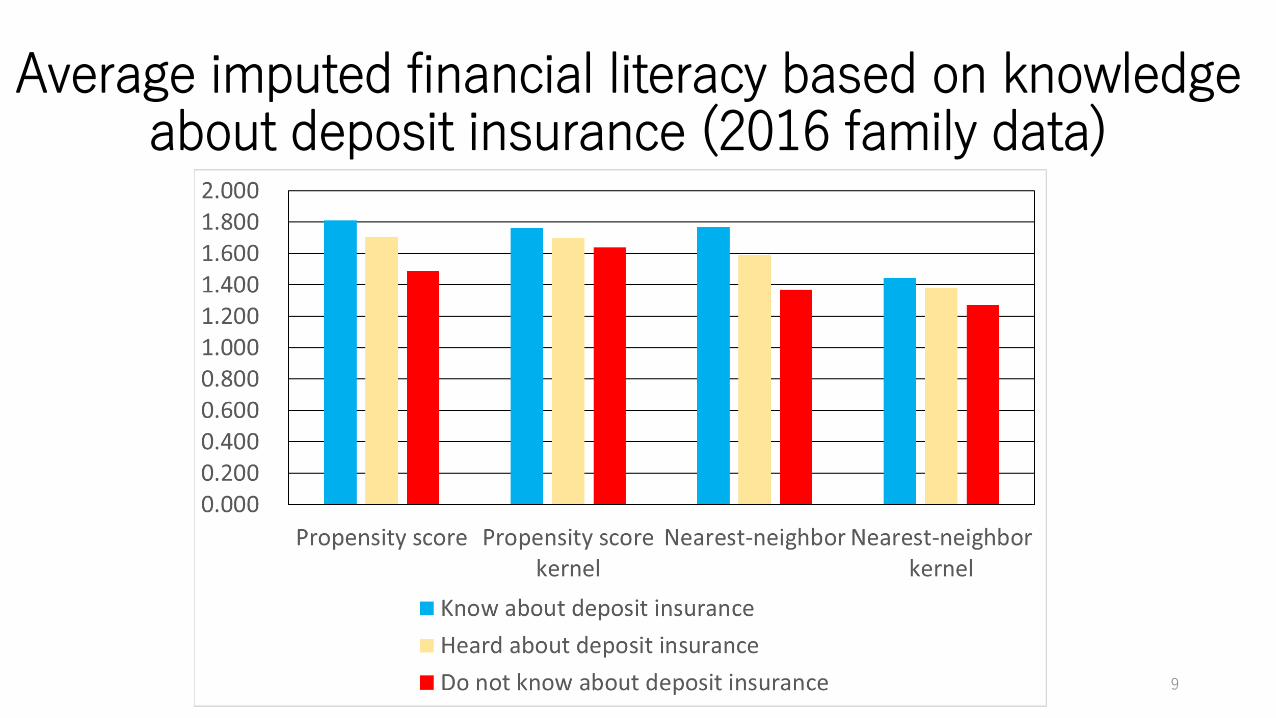
Average imputed financial literacy based on knowledge about deposit insurance (2016 family data)
9
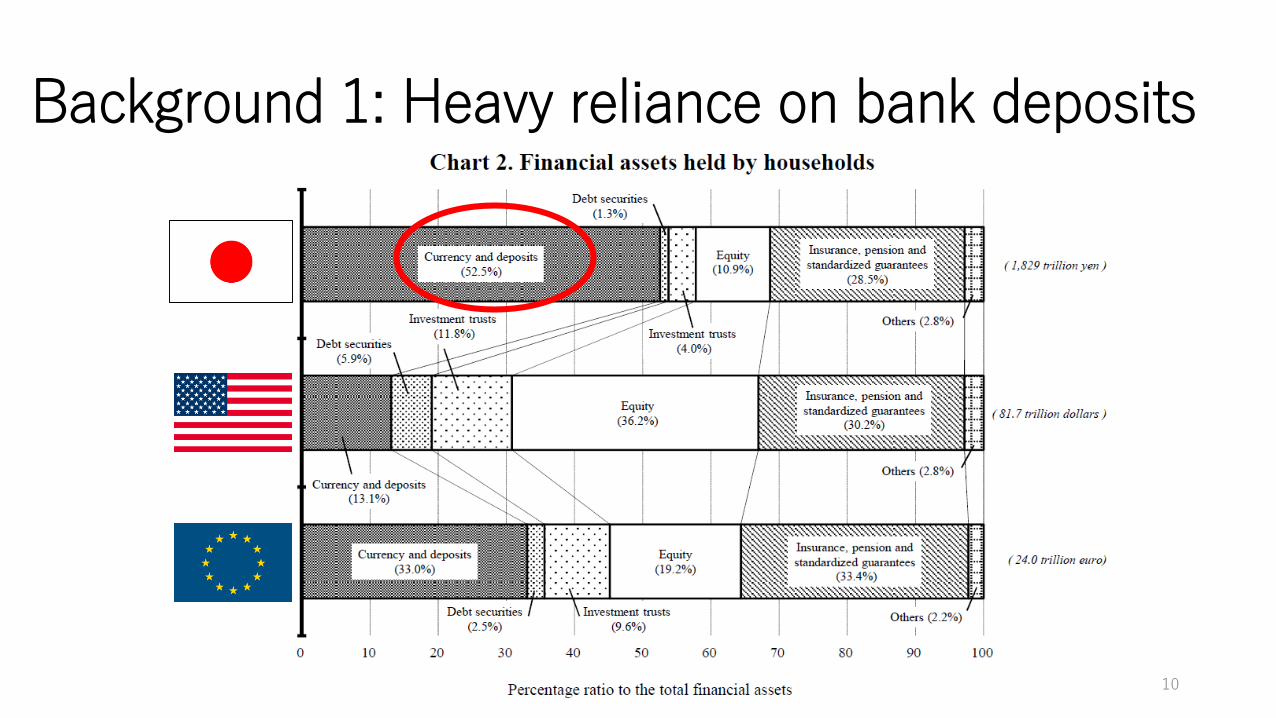
Background 1: Heavy reliance on bank deposits
10
Background 2: Changing landscape of retirement savings in Japan
The prolonged period of low economic growth and interest rates thathas accompanied rapid population aging in Japan over the past twodecades
Very low investment return from conventional safe assets
Many Japanese corporations have begun to implement defined contributioncorporate pension plans
The Financial Services Agency (FSA) of Japan has been activelypromoting investment in FSA-selected no-load and simple investmenttrusts through tax exemptions on dividend and interest earnings onsecurities, up to 400,000 yen per year for up to 20 years.
Are Japanese households ready to purchase risky assets?
11
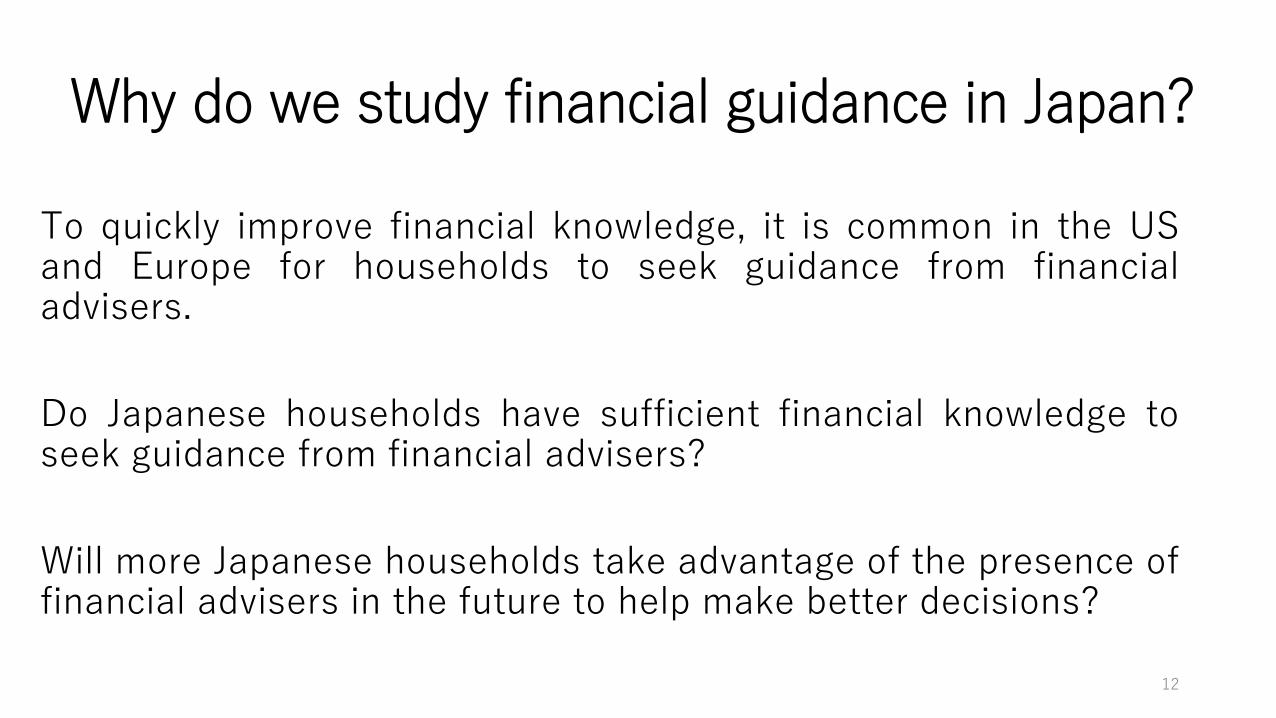
Why do we study financial guidance in Japan?
To quickly improve financial knowledge, it is common in the USand Europe for households to seek guidance from financialadvisers.
Do Japanese households have sufficient financial knowledge toseek guidance from financial advisers?
Will more Japanese households take advantage of the presence offinancial advisers in the future to help make better decisions?
12
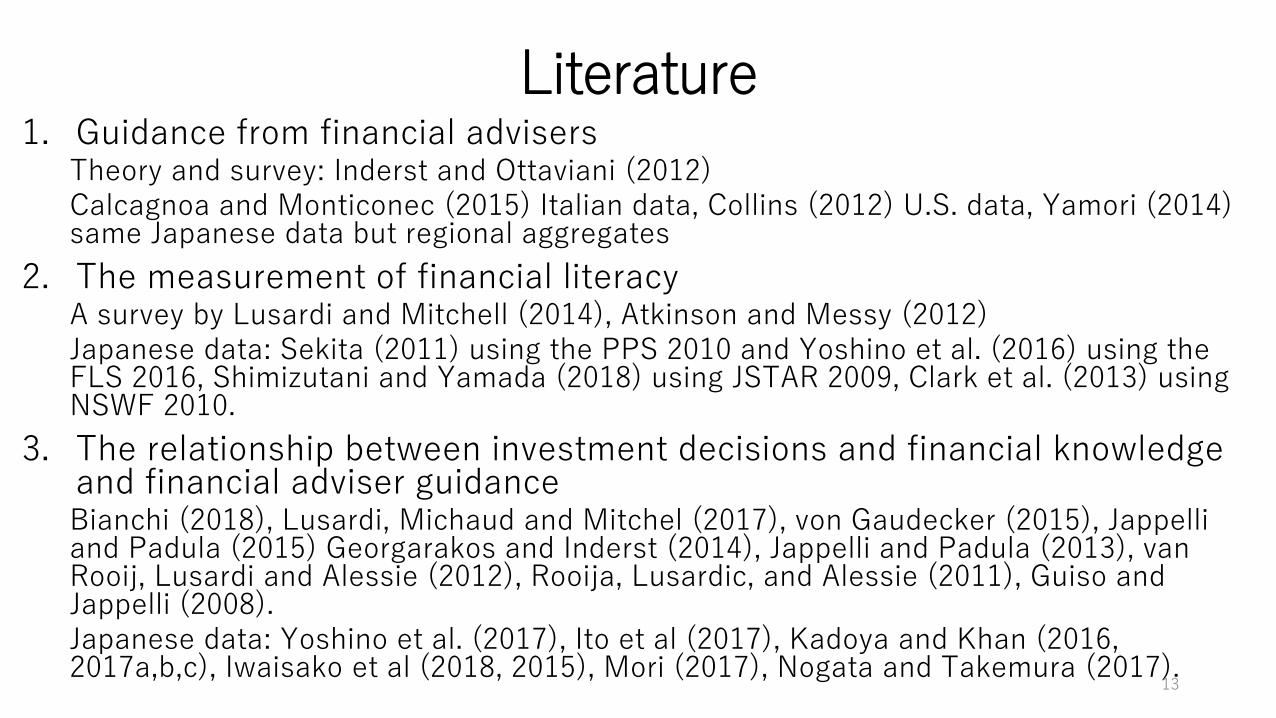
Literature1. Guidance from financial advisers
Theory and survey: Inderst and Ottaviani (2012)Calcagnoa and Monticonec (2015) Italian data, Collins (2012) U.S. data, Yamori (2014) same Japanese data but regional aggregates
2. The measurement of financial literacyA survey by Lusardi and Mitchell (2014), Atkinson and Messy (2012)Japanese data: Sekita (2011) using the PPS 2010 and Yoshino et al. (2016) using the FLS 2016, Shimizutani and Yamada (2018) using JSTAR 2009, Clark et al. (2013) using NSWF 2010.
3. The relationship between investment decisions and financial knowledge and financial adviser guidanceBianchi (2018), Lusardi, Michaud and Mitchel (2017), von Gaudecker (2015), Jappelli and Padula (2015) Georgarakos and Inderst (2014), Jappelli and Padula (2013), van Rooij, Lusardi and Alessie (2012), Rooija, Lusardic, and Alessie (2011), Guiso and Jappelli (2008).Japanese data: Yoshino et al. (2017), Ito et al (2017), Kadoya and Khan (2016, 2017a,b,c), Iwaisako et al (2018, 2015), Mori (2017), Nogata and Takemura (2017).
13
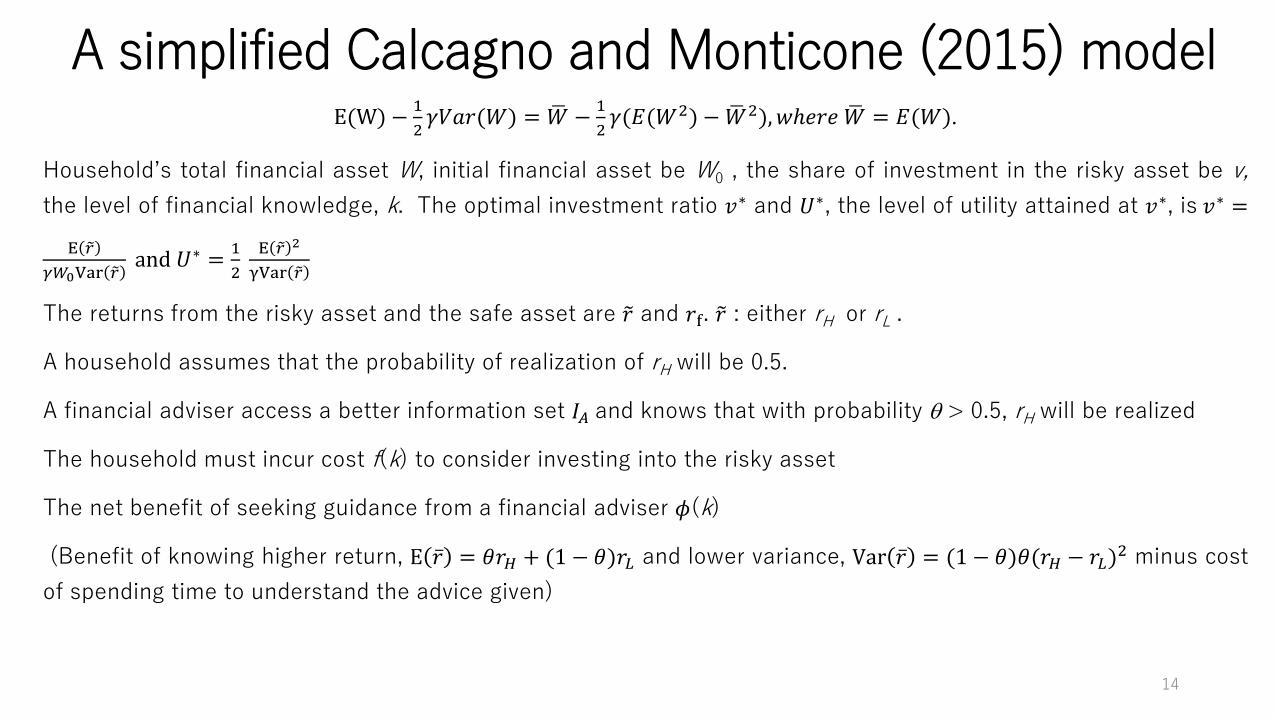
A simplified Calcagno and Monticone (2015) modelE(W) −
1
2𝛾𝑉𝑎𝑟(𝑊) = ഥ𝑊 −
1
2𝛾(𝐸(𝑊2) − ഥ𝑊2), 𝑤ℎ𝑒𝑟𝑒 ഥ𝑊 = 𝐸(𝑊).
Household’s total financial asset W, initial financial asset be W0 , the share of investment in the risky asset be v,
the level of financial knowledge, k. The optimal investment ratio 𝑣∗ and 𝑈∗, the level of utility attained at 𝑣∗, is 𝑣∗ =
E 𝑟
𝛾𝑊0Var 𝑟and 𝑈∗ =
1
2
E 𝑟 2
γVar 𝑟
The returns from the risky asset and the safe asset are 𝑟 and 𝑟f. 𝑟 : either rH or rL .
A household assumes that the probability of realization of rH will be 0.5.
A financial adviser access a better information set 𝐼𝐴 and knows that with probability > 0.5, rH will be realized
The household must incur cost f(k) to consider investing into the risky asset
The net benefit of seeking guidance from a financial adviser 𝜙(k)
(Benefit of knowing higher return, E ҧ𝑟 = 𝜃𝑟𝐻 + (1 − 𝜃)𝑟𝐿 and lower variance, Var ҧ𝑟 = (1 − 𝜃)𝜃(𝑟𝐻 − 𝑟𝐿)2 minus cost
of spending time to understand the advice given)
14
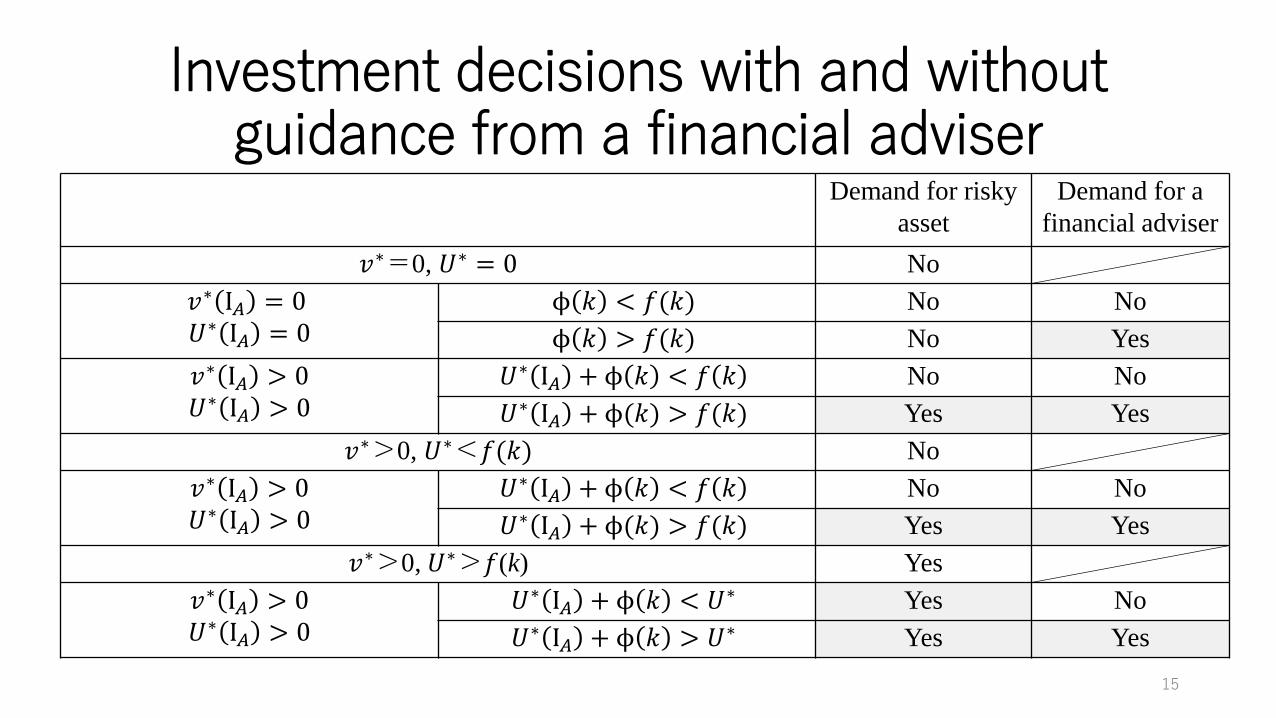
Investment decisions with and without guidance from a financial adviser
Demand for risky
asset
Demand for a
financial adviser
𝑣∗=0, 𝑈∗ = 0 No
𝑣∗ I𝐴 = 0𝑈∗ I𝐴 = 0
ϕ 𝑘 < 𝑓(𝑘) No No
ϕ 𝑘 > 𝑓(𝑘) No Yes
𝑣∗ I𝐴 > 0𝑈∗ I𝐴 > 0
𝑈∗ I𝐴 + ϕ 𝑘 < 𝑓 𝑘 No No
𝑈∗ I𝐴 + ϕ(𝑘) > 𝑓(𝑘) Yes Yes
𝑣∗>0, 𝑈∗<𝑓(𝑘) No
𝑣∗ I𝐴 > 0𝑈∗ I𝐴 > 0
𝑈∗ I𝐴 + ϕ 𝑘 < 𝑓 𝑘 No No
𝑈∗ I𝐴 + ϕ(𝑘) > 𝑓(𝑘) Yes Yes
𝑣∗>0, 𝑈∗>𝑓(k) Yes
𝑣∗ I𝐴 > 0𝑈∗ I𝐴 > 0
𝑈∗ I𝐴 + ϕ 𝑘 < 𝑈∗ Yes No
𝑈∗ I𝐴 + ϕ 𝑘 > 𝑈∗ Yes Yes
15
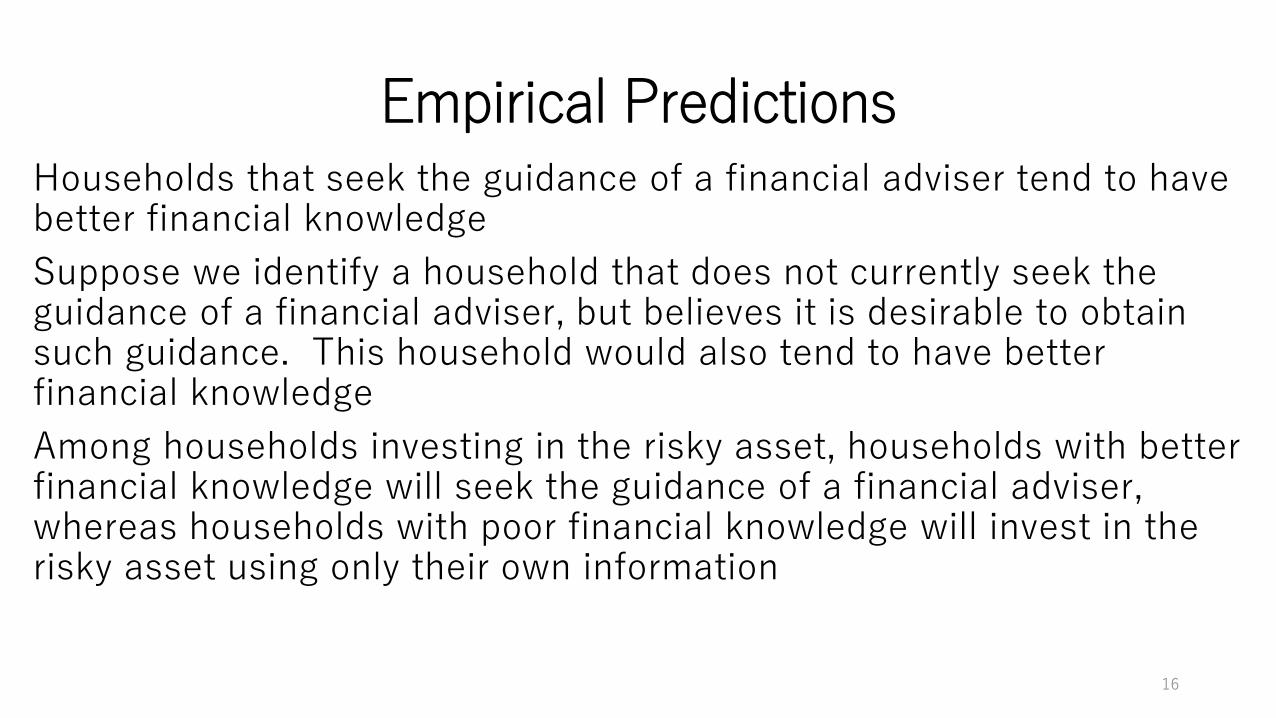
Empirical PredictionsHouseholds that seek the guidance of a financial adviser tend to have better financial knowledge
Suppose we identify a household that does not currently seek the guidance of a financial adviser, but believes it is desirable to obtain such guidance. This household would also tend to have better financial knowledge
Among households investing in the risky asset, households with better financial knowledge will seek the guidance of a financial adviser, whereas households with poor financial knowledge will invest in the risky asset using only their own information
16
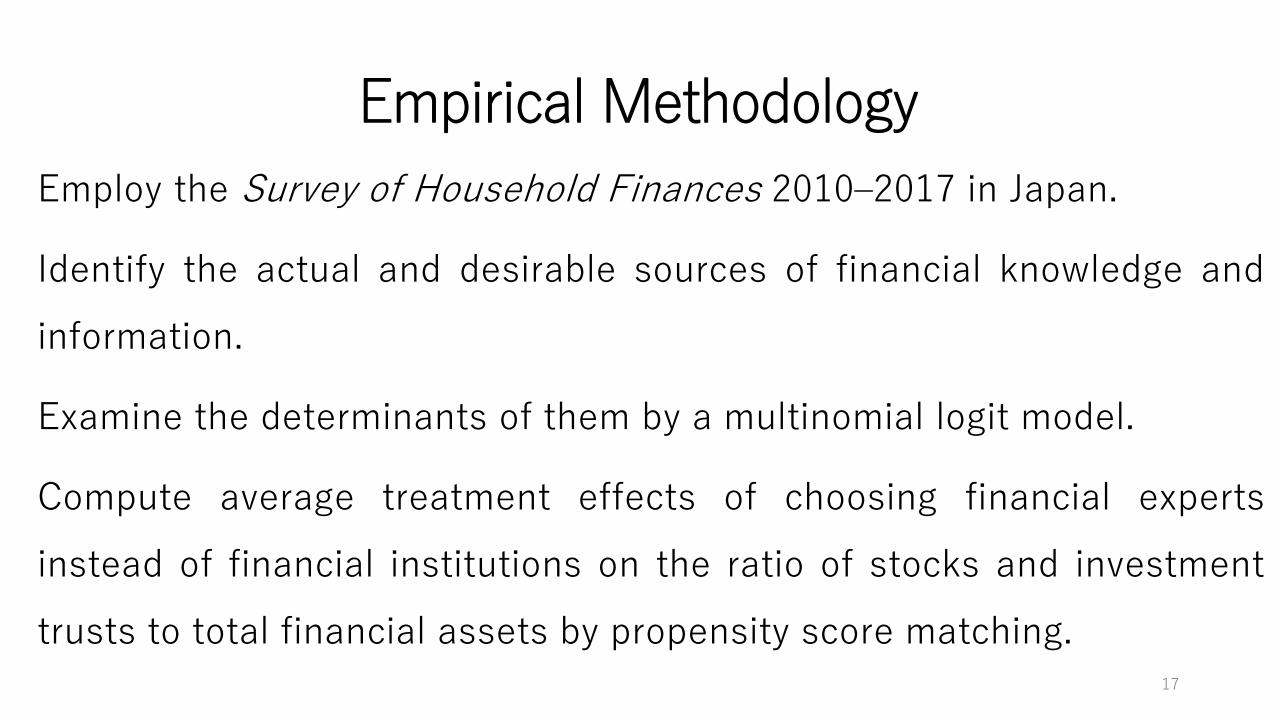
Empirical Methodology
Employ the Survey of Household Finances 2010–2017 in Japan.
Identify the actual and desirable sources of financial knowledge and
information.
Examine the determinants of them by a multinomial logit model.
Compute average treatment effects of choosing financial experts
instead of financial institutions on the ratio of stocks and investment
trusts to total financial assets by propensity score matching.17
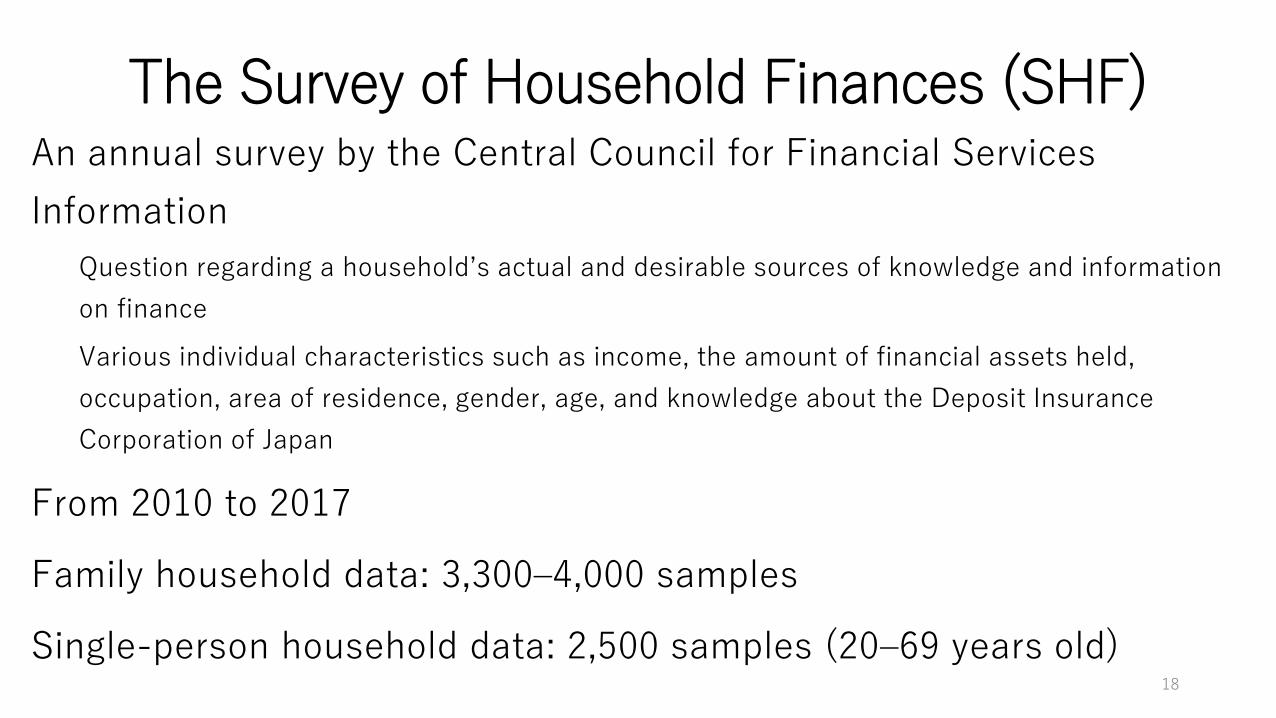
The Survey of Household Finances (SHF) An annual survey by the Central Council for Financial Services
Information
Question regarding a household’s actual and desirable sources of knowledge and information
on finance
Various individual characteristics such as income, the amount of financial assets held,
occupation, area of residence, gender, age, and knowledge about the Deposit Insurance
Corporation of Japan
From 2010 to 2017
Family household data: 3,300–4,000 samples
Single-person household data: 2,500 samples (20–69 years old) 18
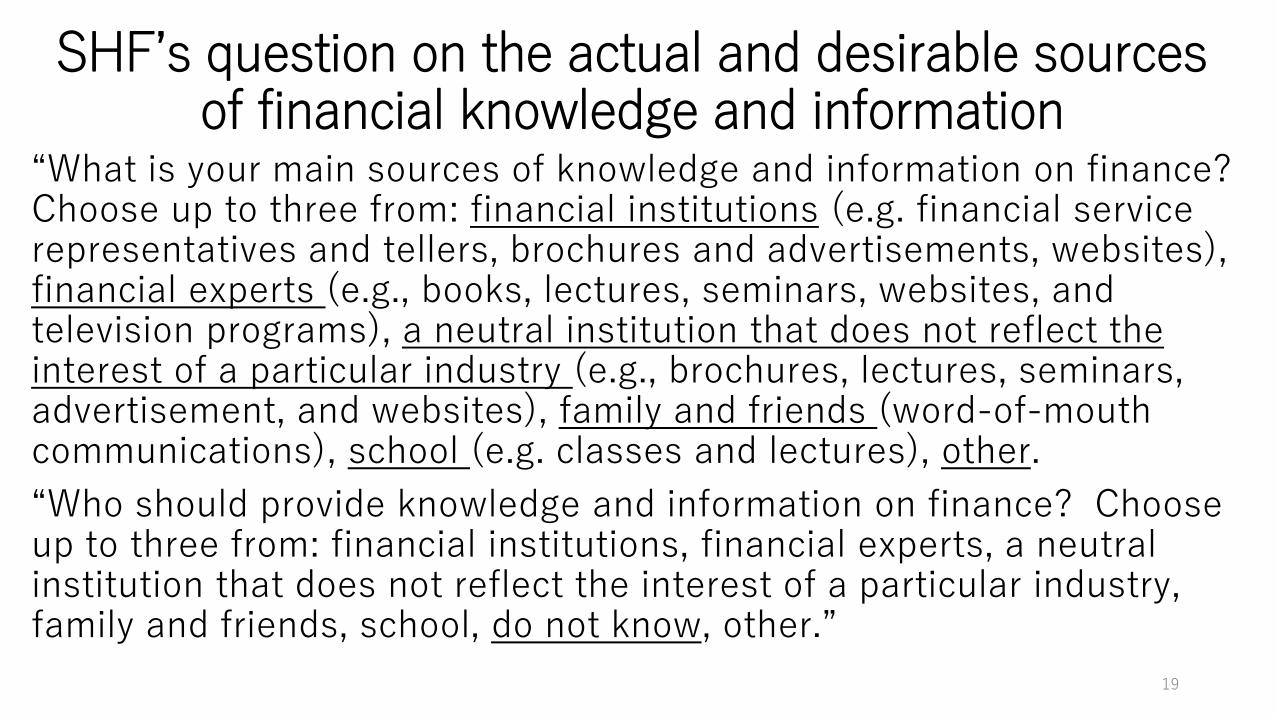
SHF’s question on the actual and desirable sources of financial knowledge and information
“What is your main sources of knowledge and information on finance? Choose up to three from: financial institutions (e.g. financial service representatives and tellers, brochures and advertisements, websites), financial experts (e.g., books, lectures, seminars, websites, and television programs), a neutral institution that does not reflect the interest of a particular industry (e.g., brochures, lectures, seminars, advertisement, and websites), family and friends (word-of-mouth communications), school (e.g. classes and lectures), other.
“Who should provide knowledge and information on finance? Choose up to three from: financial institutions, financial experts, a neutral institution that does not reflect the interest of a particular industry, family and friends, school, do not know, other.”
19
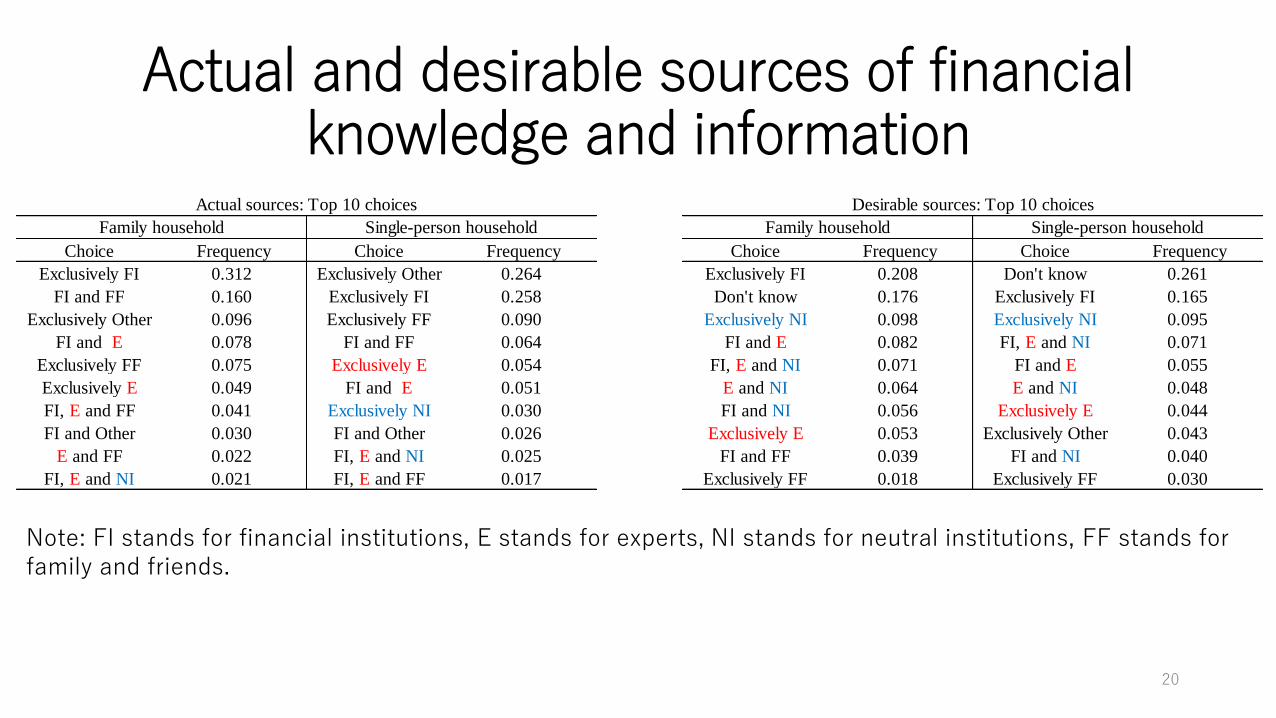
Actual and desirable sources of financialknowledge and information
Note: FI stands for financial institutions, E stands for experts, NI stands for neutral institutions, FF stands for family and friends.
20
Choice Frequency Choice Frequency Choice Frequency Choice Frequency
Exclusively FI 0.312 Exclusively Other 0.264 Exclusively FI 0.208 Don't know 0.261
FI and FF 0.160 Exclusively FI 0.258 Don't know 0.176 Exclusively FI 0.165
Exclusively Other 0.096 Exclusively FF 0.090 Exclusively NI 0.098 Exclusively NI 0.095
FI and E 0.078 FI and FF 0.064 FI and E 0.082 FI, E and NI 0.071
Exclusively FF 0.075 Exclusively E 0.054 FI, E and NI 0.071 FI and E 0.055
Exclusively E 0.049 FI and E 0.051 E and NI 0.064 E and NI 0.048
FI, E and FF 0.041 Exclusively NI 0.030 FI and NI 0.056 Exclusively E 0.044
FI and Other 0.030 FI and Other 0.026 Exclusively E 0.053 Exclusively Other 0.043
E and FF 0.022 FI, E and NI 0.025 FI and FF 0.039 FI and NI 0.040
FI, E and NI 0.021 FI, E and FF 0.017 Exclusively FF 0.018 Exclusively FF 0.030
Family household Single-person householdFamily household Single-person household
Actual sources: Top 10 choices Desirable sources: Top 10 choices
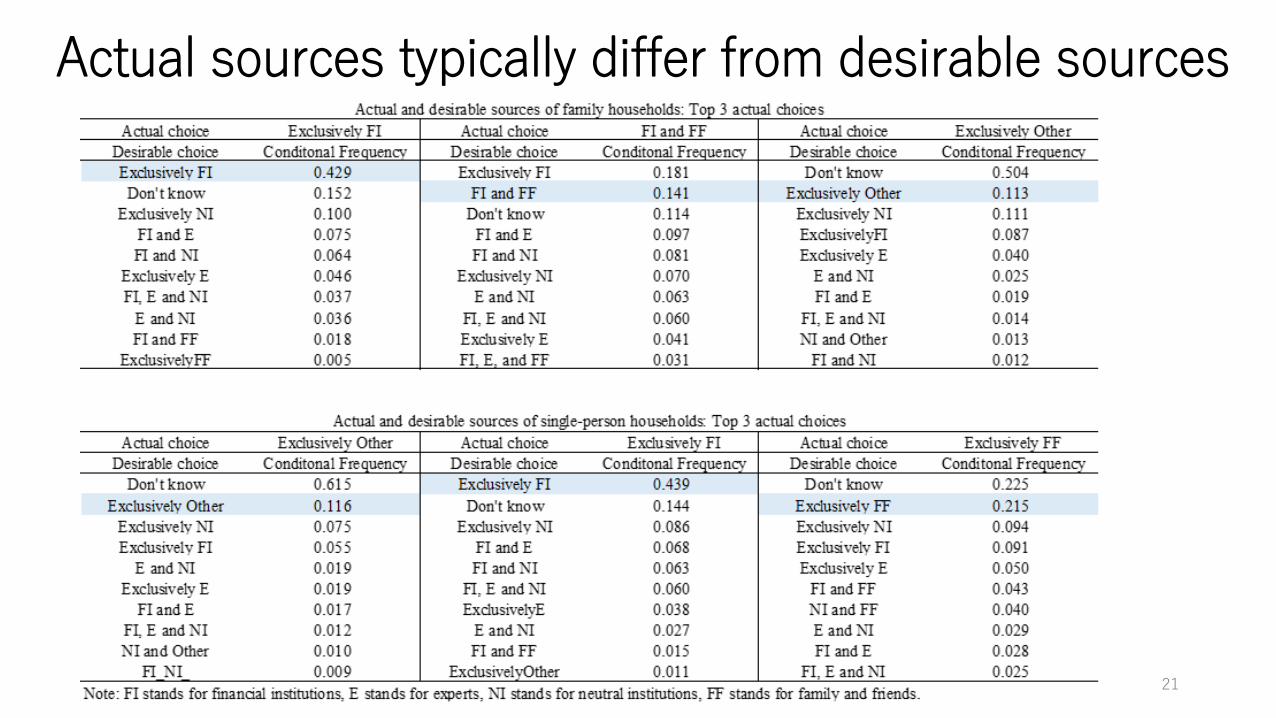
Actual sources typically differ from desirable sources
21
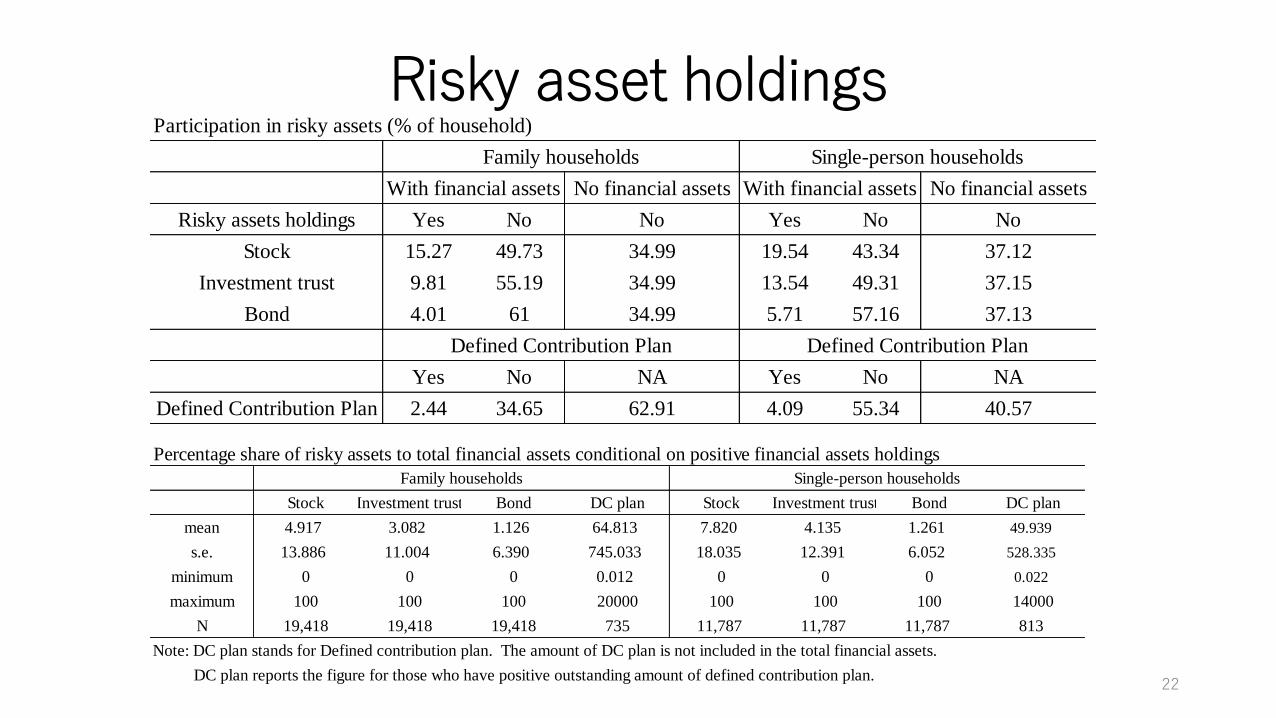
Risky asset holdings
22
Participation in risky assets (% of household)
No financial assets No financial assets
Risky assets holdings Yes No No Yes No No
Stock 15.27 49.73 34.99 19.54 43.34 37.12
Investment trust 9.81 55.19 34.99 13.54 49.31 37.15
Bond 4.01 61 34.99 5.71 57.16 37.13
Yes No NA Yes No NA
Defined Contribution Plan 2.44 34.65 62.91 4.09 55.34 40.57
Family households
Defined Contribution Plan Defined Contribution Plan
With financial assets With financial assets
Single-person households
Percentage share of risky assets to total financial assets conditional on positive financial assets holdings
Stock Investment trust Bond DC plan Stock Investment trust Bond DC plan
mean 4.917 3.082 1.126 64.813 7.820 4.135 1.261 49.939
s.e. 13.886 11.004 6.390 745.033 18.035 12.391 6.052 528.335
minimum 0 0 0 0.012 0 0 0 0.022
maximum 100 100 100 20000 100 100 100 14000
N 19,418 19,418 19,418 735 11,787 11,787 11,787 813
Note: DC plan stands for Defined contribution plan. The amount of DC plan is not included in the total financial assets.
DC plan reports the figure for those who have positive outstanding amount of defined contribution plan.
Family households Single-person households
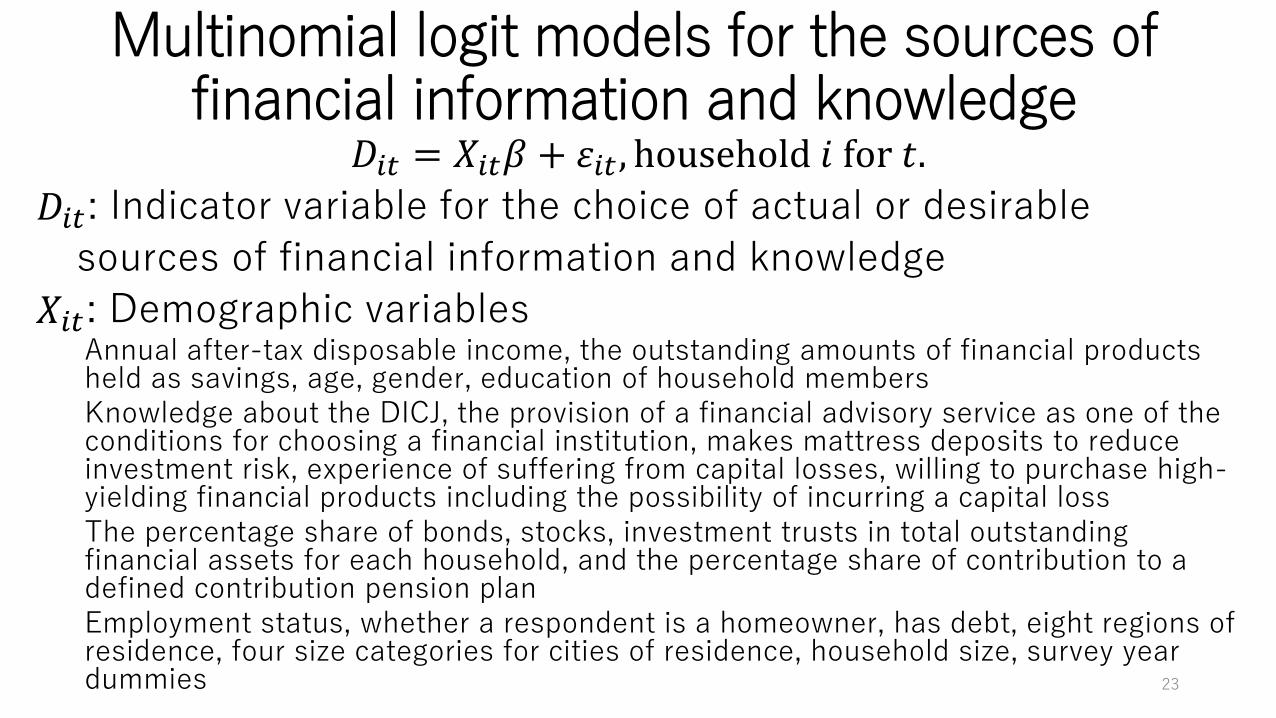
Multinomial logit models for the sources of financial information and knowledge
𝐷𝑖𝑡 = 𝑋𝑖𝑡𝛽 + 𝜀𝑖𝑡 , household 𝑖 for 𝑡.
𝐷𝑖𝑡: Indicator variable for the choice of actual or desirable
sources of financial information and knowledge
𝑋𝑖𝑡: Demographic variablesAnnual after-tax disposable income, the outstanding amounts of financial products held as savings, age, gender, education of household membersKnowledge about the DICJ, the provision of a financial advisory service as one of the conditions for choosing a financial institution, makes mattress deposits to reduce investment risk, experience of suffering from capital losses, willing to purchase high-yielding financial products including the possibility of incurring a capital lossThe percentage share of bonds, stocks, investment trusts in total outstanding financial assets for each household, and the percentage share of contribution to a defined contribution pension planEmployment status, whether a respondent is a homeowner, has debt, eight regions of residence, four size categories for cities of residence, household size, survey year dummies 23
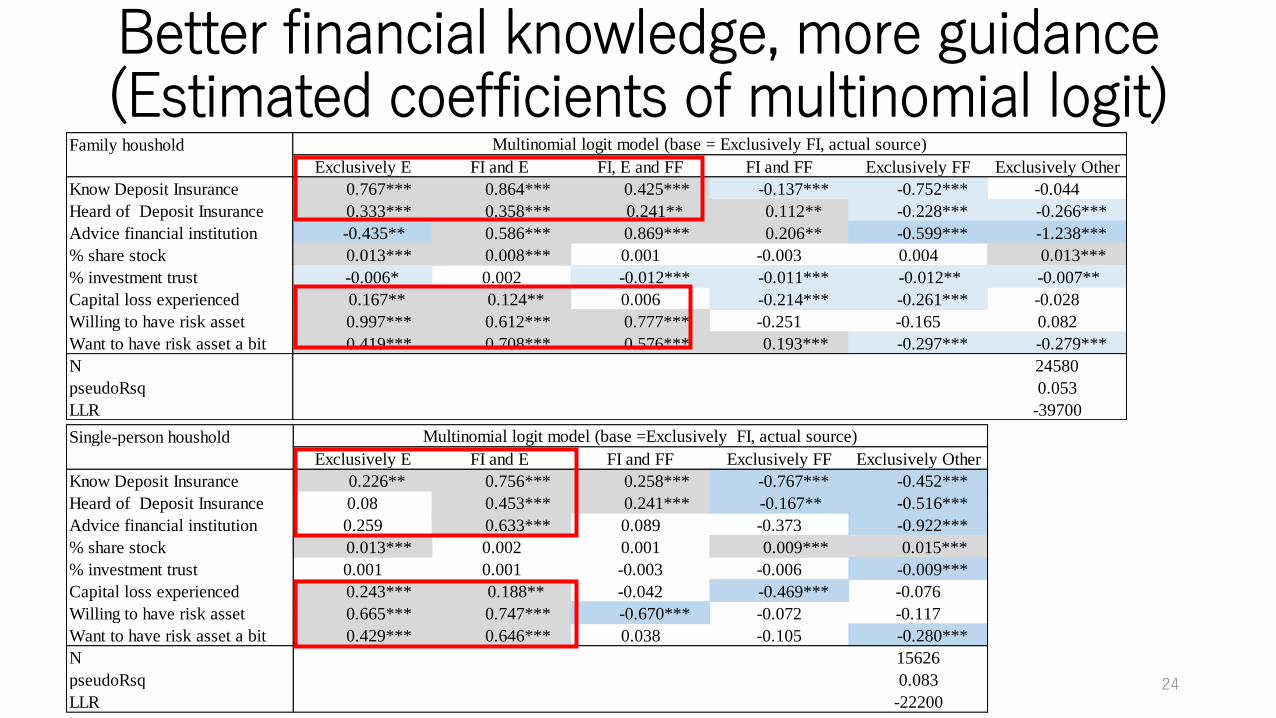
Family houshold
Exclusively E FI and E FI, E and FF FI and FF Exclusively FF Exclusively Other
Know Deposit Insurance 0.767*** 0.864*** 0.425*** -0.137*** -0.752*** -0.044
Heard of Deposit Insurance 0.333*** 0.358*** 0.241** 0.112** -0.228*** -0.266***
Advice financial institution -0.435** 0.586*** 0.869*** 0.206** -0.599*** -1.238***
% share stock 0.013*** 0.008*** 0.001 -0.003 0.004 0.013***
% investment trust -0.006* 0.002 -0.012*** -0.011*** -0.012** -0.007**
Capital loss experienced 0.167** 0.124** 0.006 -0.214*** -0.261*** -0.028
Willing to have risk asset 0.997*** 0.612*** 0.777*** -0.251 -0.165 0.082
Want to have risk asset a bit 0.419*** 0.708*** 0.576*** 0.193*** -0.297*** -0.279***
N 24580
pseudoRsq 0.053
LLR -39700
Multinomial logit model (base = Exclusively FI, actual source)
Better financial knowledge, more guidance(Estimated coefficients of multinomial logit)
24
Single-person houshold
Exclusively E FI and E FI and FF Exclusively FF Exclusively Other
Know Deposit Insurance 0.226** 0.756*** 0.258*** -0.767*** -0.452***
Heard of Deposit Insurance 0.08 0.453*** 0.241*** -0.167** -0.516***
Advice financial institution 0.259 0.633*** 0.089 -0.373 -0.922***
% share stock 0.013*** 0.002 0.001 0.009*** 0.015***
% investment trust 0.001 0.001 -0.003 -0.006 -0.009***
Capital loss experienced 0.243*** 0.188** -0.042 -0.469*** -0.076
Willing to have risk asset 0.665*** 0.747*** -0.670*** -0.072 -0.117
Want to have risk asset a bit 0.429*** 0.646*** 0.038 -0.105 -0.280***
N 15626
pseudoRsq 0.083
LLR -22200
Multinomial logit model (base =Exclusively FI, actual source)
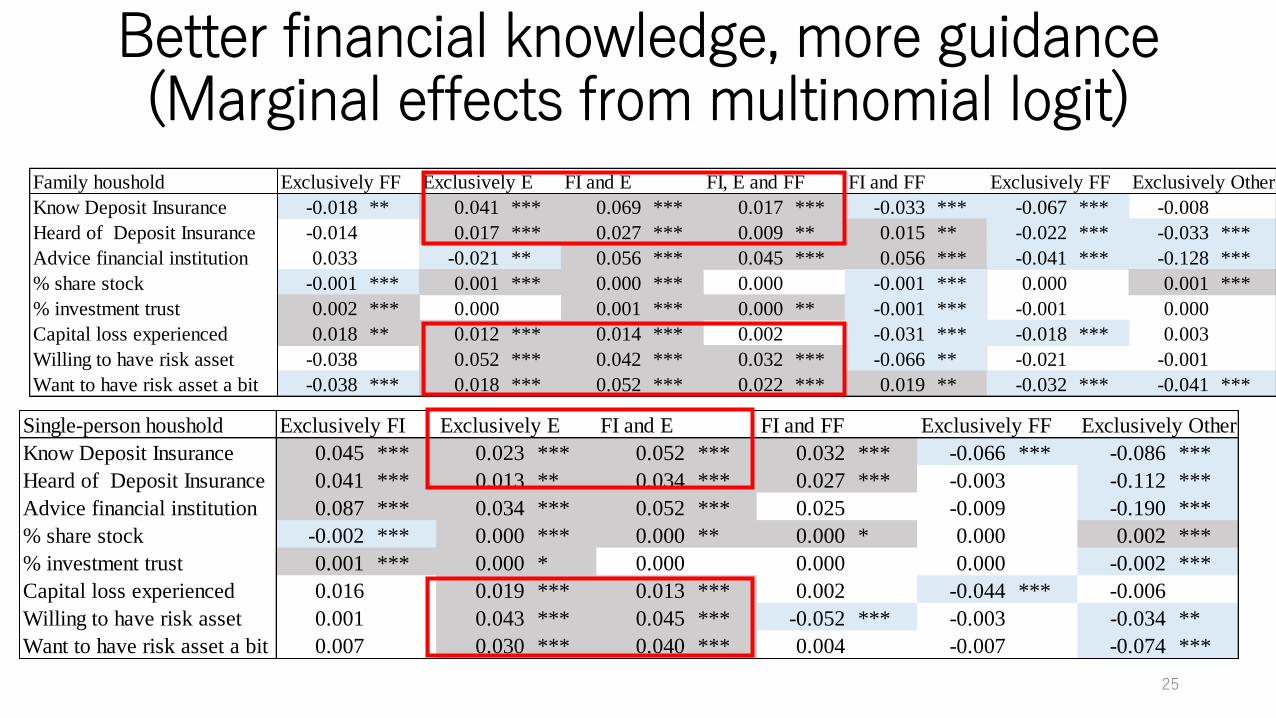
Family houshold Exclusively FF Exclusively E FI and E FI, E and FF FI and FF Exclusively FF Exclusively Other
Know Deposit Insurance -0.018 ** 0.041 *** 0.069 *** 0.017 *** -0.033 *** -0.067 *** -0.008
Heard of Deposit Insurance -0.014 0.017 *** 0.027 *** 0.009 ** 0.015 ** -0.022 *** -0.033 ***
Advice financial institution 0.033 -0.021 ** 0.056 *** 0.045 *** 0.056 *** -0.041 *** -0.128 ***
% share stock -0.001 *** 0.001 *** 0.000 *** 0.000 -0.001 *** 0.000 0.001 ***
% investment trust 0.002 *** 0.000 0.001 *** 0.000 ** -0.001 *** -0.001 0.000
Capital loss experienced 0.018 ** 0.012 *** 0.014 *** 0.002 -0.031 *** -0.018 *** 0.003
Willing to have risk asset -0.038 0.052 *** 0.042 *** 0.032 *** -0.066 ** -0.021 -0.001
Want to have risk asset a bit -0.038 *** 0.018 *** 0.052 *** 0.022 *** 0.019 ** -0.032 *** -0.041 ***
Single-person houshold Exclusively FI Exclusively E FI and E FI and FF Exclusively FF Exclusively Other
Know Deposit Insurance 0.045 *** 0.023 *** 0.052 *** 0.032 *** -0.066 *** -0.086 ***
Heard of Deposit Insurance 0.041 *** 0.013 ** 0.034 *** 0.027 *** -0.003 -0.112 ***
Advice financial institution 0.087 *** 0.034 *** 0.052 *** 0.025 -0.009 -0.190 ***
% share stock -0.002 *** 0.000 *** 0.000 ** 0.000 * 0.000 0.002 ***
% investment trust 0.001 *** 0.000 * 0.000 0.000 0.000 -0.002 ***
Capital loss experienced 0.016 0.019 *** 0.013 *** 0.002 -0.044 *** -0.006
Willing to have risk asset 0.001 0.043 *** 0.045 *** -0.052 *** -0.003 -0.034 **
Want to have risk asset a bit 0.007 0.030 *** 0.040 *** 0.004 -0.007 -0.074 ***
Better financial knowledge, more guidance (Marginal effects from multinomial logit)
25
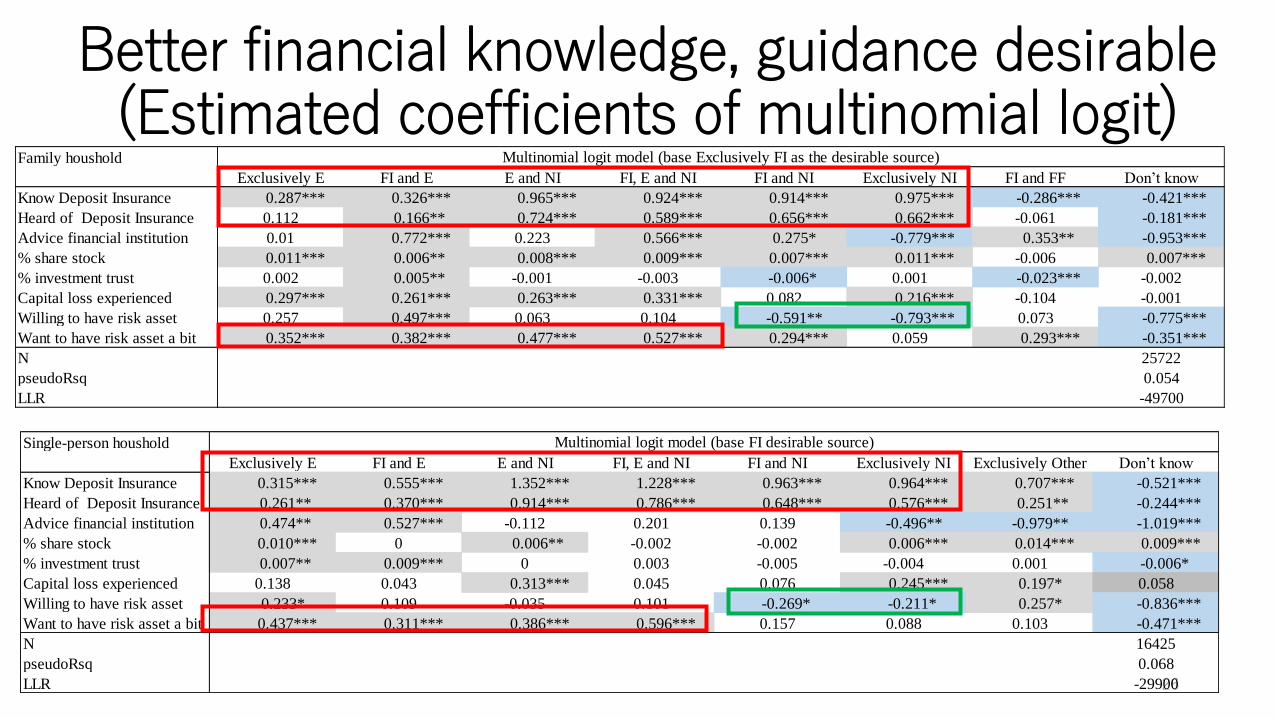
Better financial knowledge, guidance desirable (Estimated coefficients of multinomial logit)
26
Family houshold
Exclusively E FI and E E and NI FI, E and NI FI and NI Exclusively NI FI and FF Don’t know
Know Deposit Insurance 0.287*** 0.326*** 0.965*** 0.924*** 0.914*** 0.975*** -0.286*** -0.421***
Heard of Deposit Insurance 0.112 0.166** 0.724*** 0.589*** 0.656*** 0.662*** -0.061 -0.181***
Advice financial institution 0.01 0.772*** 0.223 0.566*** 0.275* -0.779*** 0.353** -0.953***
% share stock 0.011*** 0.006** 0.008*** 0.009*** 0.007*** 0.011*** -0.006 0.007***
% investment trust 0.002 0.005** -0.001 -0.003 -0.006* 0.001 -0.023*** -0.002
Capital loss experienced 0.297*** 0.261*** 0.263*** 0.331*** 0.082 0.216*** -0.104 -0.001
Willing to have risk asset 0.257 0.497*** 0.063 0.104 -0.591** -0.793*** 0.073 -0.775***
Want to have risk asset a bit 0.352*** 0.382*** 0.477*** 0.527*** 0.294*** 0.059 0.293*** -0.351***
N 25722
pseudoRsq 0.054
LLR -49700
Multinomial logit model (base Exclusively FI as the desirable source)
Single-person houshold
Exclusively E FI and E E and NI FI, E and NI FI and NI Exclusively NI Exclusively Other Don’t know
Know Deposit Insurance 0.315*** 0.555*** 1.352*** 1.228*** 0.963*** 0.964*** 0.707*** -0.521***
Heard of Deposit Insurance 0.261** 0.370*** 0.914*** 0.786*** 0.648*** 0.576*** 0.251** -0.244***
Advice financial institution 0.474** 0.527*** -0.112 0.201 0.139 -0.496** -0.979** -1.019***
% share stock 0.010*** 0 0.006** -0.002 -0.002 0.006*** 0.014*** 0.009***
% investment trust 0.007** 0.009*** 0 0.003 -0.005 -0.004 0.001 -0.006*
Capital loss experienced 0.138 0.043 0.313*** 0.045 0.076 0.245*** 0.197* 0.058
Willing to have risk asset 0.233* 0.109 -0.035 0.101 -0.269* -0.211* 0.257* -0.836***
Want to have risk asset a bit 0.437*** 0.311*** 0.386*** 0.596*** 0.157 0.088 0.103 -0.471***
N 16425
pseudoRsq 0.068
LLR -29900
Multinomial logit model (base FI desirable source)
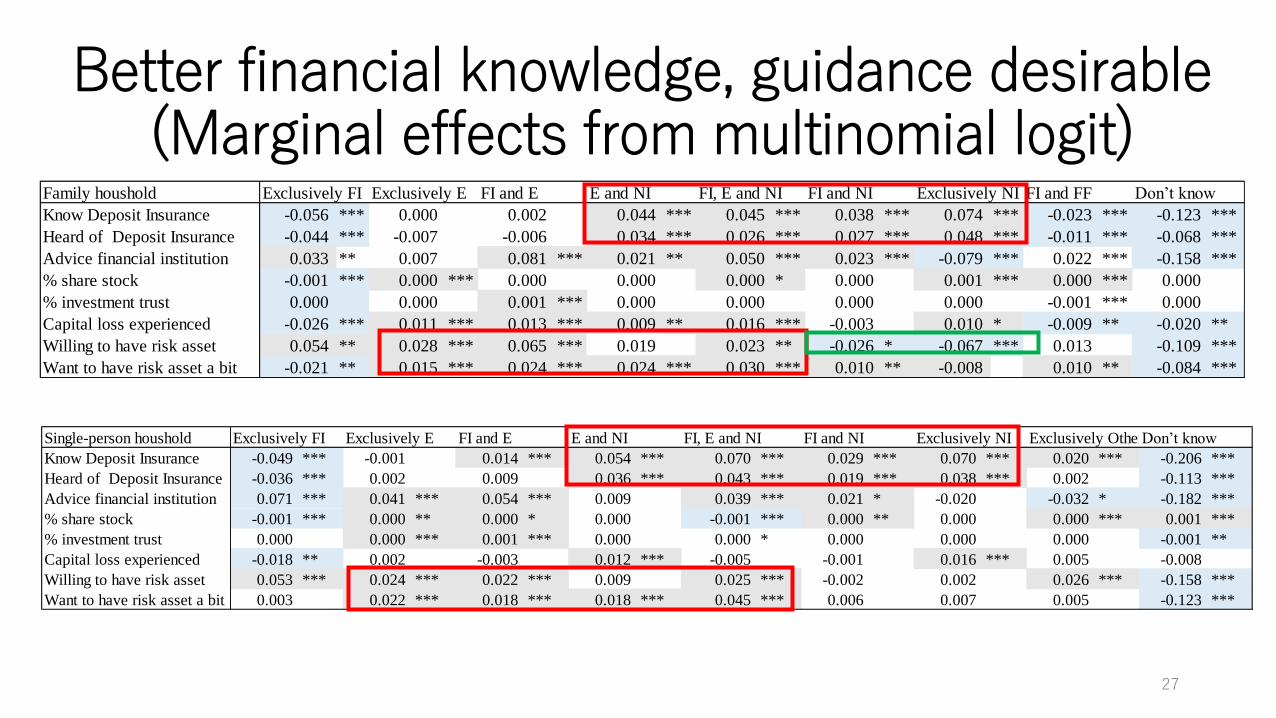
Family houshold Exclusively FI Exclusively E FI and E E and NI FI, E and NI FI and NI Exclusively NI FI and FF Don’t know
Know Deposit Insurance -0.056 *** 0.000 0.002 0.044 *** 0.045 *** 0.038 *** 0.074 *** -0.023 *** -0.123 ***
Heard of Deposit Insurance -0.044 *** -0.007 -0.006 0.034 *** 0.026 *** 0.027 *** 0.048 *** -0.011 *** -0.068 ***
Advice financial institution 0.033 ** 0.007 0.081 *** 0.021 ** 0.050 *** 0.023 *** -0.079 *** 0.022 *** -0.158 ***
% share stock -0.001 *** 0.000 *** 0.000 0.000 0.000 * 0.000 0.001 *** 0.000 *** 0.000
% investment trust 0.000 0.000 0.001 *** 0.000 0.000 0.000 0.000 -0.001 *** 0.000
Capital loss experienced -0.026 *** 0.011 *** 0.013 *** 0.009 ** 0.016 *** -0.003 0.010 * -0.009 ** -0.020 **
Willing to have risk asset 0.054 ** 0.028 *** 0.065 *** 0.019 0.023 ** -0.026 * -0.067 *** 0.013 -0.109 ***
Want to have risk asset a bit -0.021 ** 0.015 *** 0.024 *** 0.024 *** 0.030 *** 0.010 ** -0.008 0.010 ** -0.084 ***
Single-person houshold Exclusively FI Exclusively E FI and E E and NI FI, E and NI FI and NI Exclusively NI Exclusively OtherDon’t know
Know Deposit Insurance -0.049 *** -0.001 0.014 *** 0.054 *** 0.070 *** 0.029 *** 0.070 *** 0.020 *** -0.206 ***
Heard of Deposit Insurance -0.036 *** 0.002 0.009 0.036 *** 0.043 *** 0.019 *** 0.038 *** 0.002 -0.113 ***
Advice financial institution 0.071 *** 0.041 *** 0.054 *** 0.009 0.039 *** 0.021 * -0.020 -0.032 * -0.182 ***
% share stock -0.001 *** 0.000 ** 0.000 * 0.000 -0.001 *** 0.000 ** 0.000 0.000 *** 0.001 ***
% investment trust 0.000 0.000 *** 0.001 *** 0.000 0.000 * 0.000 0.000 0.000 -0.001 **
Capital loss experienced -0.018 ** 0.002 -0.003 0.012 *** -0.005 -0.001 0.016 *** 0.005 -0.008
Willing to have risk asset 0.053 *** 0.024 *** 0.022 *** 0.009 0.025 *** -0.002 0.002 0.026 *** -0.158 ***
Want to have risk asset a bit 0.003 0.022 *** 0.018 *** 0.018 *** 0.045 *** 0.006 0.007 0.005 -0.123 ***
Better financial knowledge, guidance desirable (Marginal effects from multinomial logit)
27
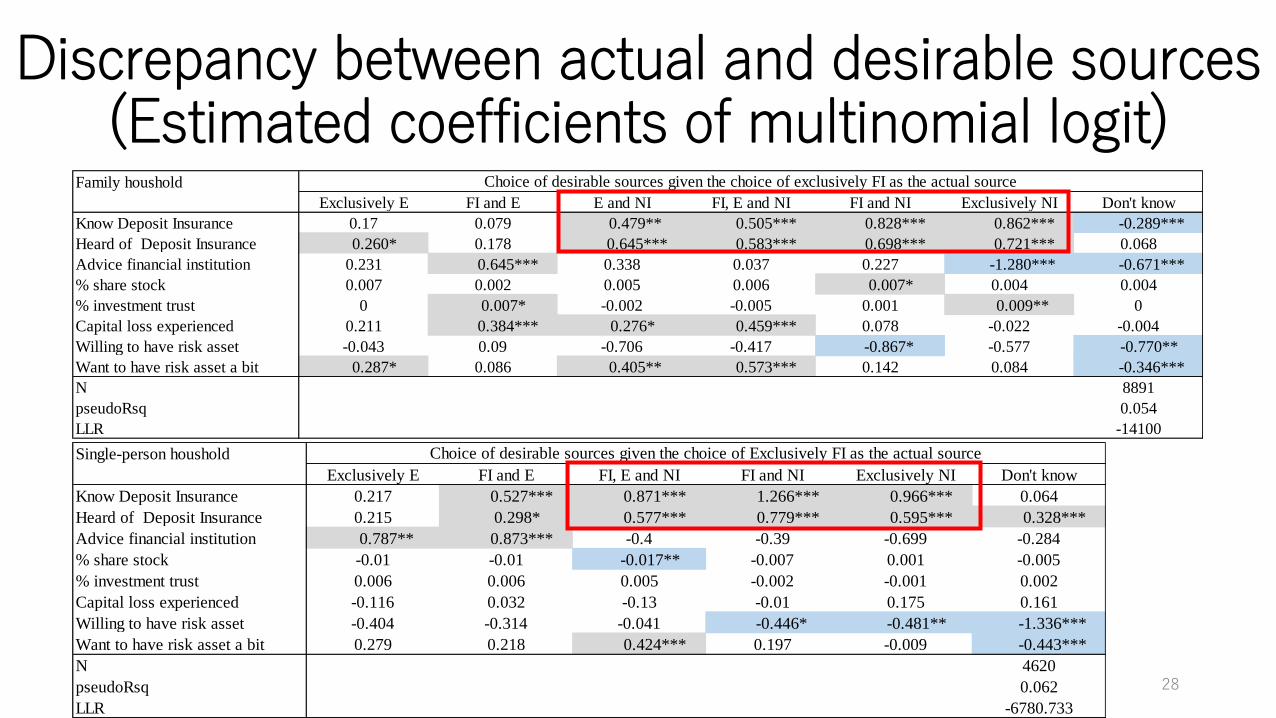
Discrepancy between actual and desirable sources (Estimated coefficients of multinomial logit)
28
Family houshold
Exclusively E FI and E E and NI FI, E and NI FI and NI Exclusively NI Don't know
Know Deposit Insurance 0.17 0.079 0.479** 0.505*** 0.828*** 0.862*** -0.289***
Heard of Deposit Insurance 0.260* 0.178 0.645*** 0.583*** 0.698*** 0.721*** 0.068
Advice financial institution 0.231 0.645*** 0.338 0.037 0.227 -1.280*** -0.671***
% share stock 0.007 0.002 0.005 0.006 0.007* 0.004 0.004
% investment trust 0 0.007* -0.002 -0.005 0.001 0.009** 0
Capital loss experienced 0.211 0.384*** 0.276* 0.459*** 0.078 -0.022 -0.004
Willing to have risk asset -0.043 0.09 -0.706 -0.417 -0.867* -0.577 -0.770**
Want to have risk asset a bit 0.287* 0.086 0.405** 0.573*** 0.142 0.084 -0.346***
N 8891
pseudoRsq 0.054
LLR -14100
Choice of desirable sources given the choice of exclusively FI as the actual source
Single-person houshold
Exclusively E FI and E FI, E and NI FI and NI Exclusively NI Don't know
Know Deposit Insurance 0.217 0.527*** 0.871*** 1.266*** 0.966*** 0.064
Heard of Deposit Insurance 0.215 0.298* 0.577*** 0.779*** 0.595*** 0.328***
Advice financial institution 0.787** 0.873*** -0.4 -0.39 -0.699 -0.284
% share stock -0.01 -0.01 -0.017** -0.007 0.001 -0.005
% investment trust 0.006 0.006 0.005 -0.002 -0.001 0.002
Capital loss experienced -0.116 0.032 -0.13 -0.01 0.175 0.161
Willing to have risk asset -0.404 -0.314 -0.041 -0.446* -0.481** -1.336***
Want to have risk asset a bit 0.279 0.218 0.424*** 0.197 -0.009 -0.443***
N 4620
pseudoRsq 0.062
LLR -6780.733
Choice of desirable sources given the choice of Exclusively FI as the actual source
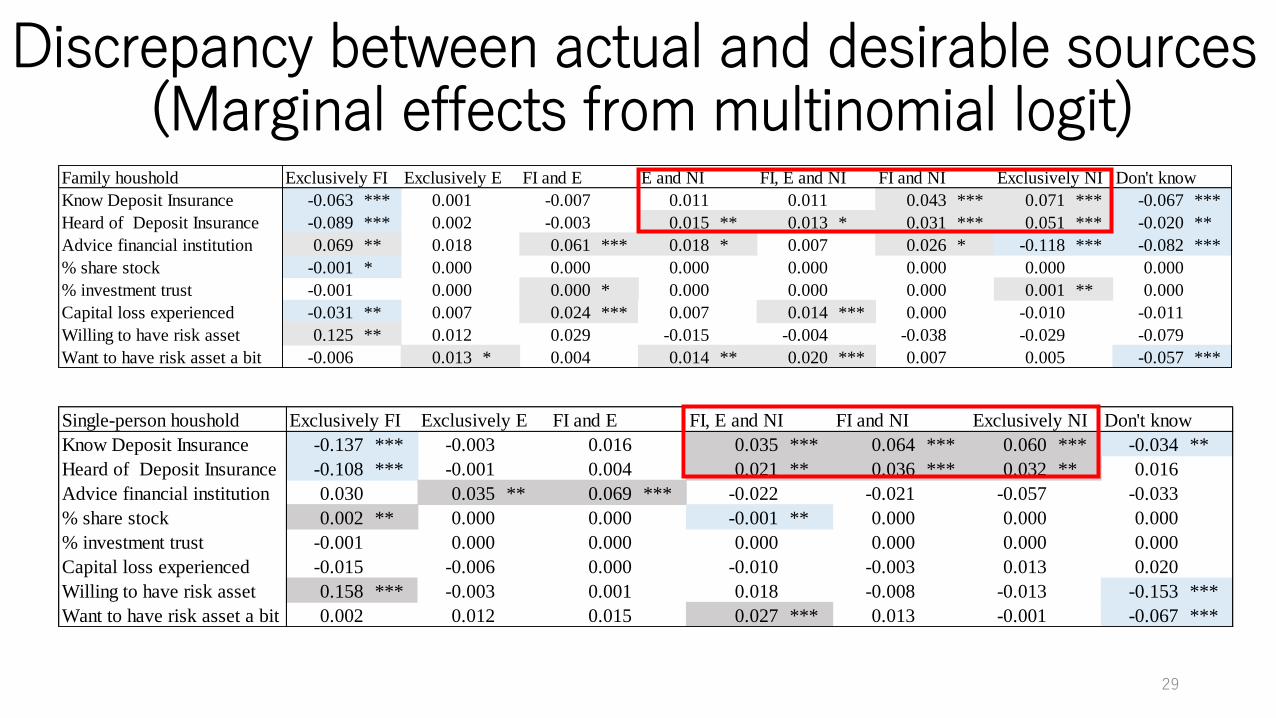
Single-person houshold Exclusively FI Exclusively E FI and E FI, E and NI FI and NI Exclusively NI Don't know
Know Deposit Insurance -0.137 *** -0.003 0.016 0.035 *** 0.064 *** 0.060 *** -0.034 **
Heard of Deposit Insurance -0.108 *** -0.001 0.004 0.021 ** 0.036 *** 0.032 ** 0.016
Advice financial institution 0.030 0.035 ** 0.069 *** -0.022 -0.021 -0.057 -0.033
% share stock 0.002 ** 0.000 0.000 -0.001 ** 0.000 0.000 0.000
% investment trust -0.001 0.000 0.000 0.000 0.000 0.000 0.000
Capital loss experienced -0.015 -0.006 0.000 -0.010 -0.003 0.013 0.020
Willing to have risk asset 0.158 *** -0.003 0.001 0.018 -0.008 -0.013 -0.153 ***
Want to have risk asset a bit 0.002 0.012 0.015 0.027 *** 0.013 -0.001 -0.067 ***
Family houshold Exclusively FI Exclusively E FI and E E and NI FI, E and NI FI and NI Exclusively NI Don't know
Know Deposit Insurance -0.063 *** 0.001 -0.007 0.011 0.011 0.043 *** 0.071 *** -0.067 ***
Heard of Deposit Insurance -0.089 *** 0.002 -0.003 0.015 ** 0.013 * 0.031 *** 0.051 *** -0.020 **
Advice financial institution 0.069 ** 0.018 0.061 *** 0.018 * 0.007 0.026 * -0.118 *** -0.082 ***
% share stock -0.001 * 0.000 0.000 0.000 0.000 0.000 0.000 0.000
% investment trust -0.001 0.000 0.000 * 0.000 0.000 0.000 0.001 ** 0.000
Capital loss experienced -0.031 ** 0.007 0.024 *** 0.007 0.014 *** 0.000 -0.010 -0.011
Willing to have risk asset 0.125 ** 0.012 0.029 -0.015 -0.004 -0.038 -0.029 -0.079
Want to have risk asset a bit -0.006 0.013 * 0.004 0.014 ** 0.020 *** 0.007 0.005 -0.057 ***
Discrepancy between actual and desirable sources(Marginal effects from multinomial logit)
29
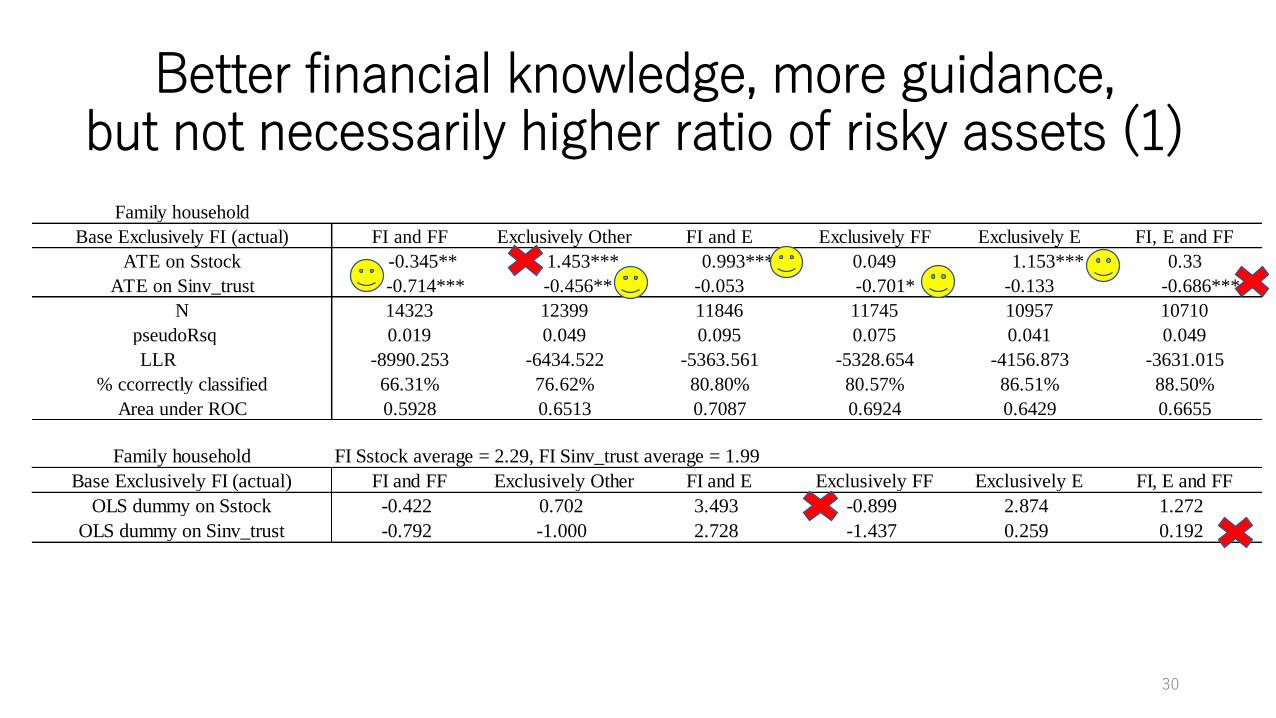
Family household FI Sstock average = 2.29, FI Sinv_trust average = 1.99
Base Exclusively FI (actual) FI and FF Exclusively Other FI and E Exclusively FF Exclusively E FI, E and FF
OLS dummy on Sstock -0.422 0.702 3.493 -0.899 2.874 1.272
OLS dummy on Sinv_trust -0.792 -1.000 2.728 -1.437 0.259 0.192
Family household
Base Exclusively FI (actual) FI and FF Exclusively Other FI and E Exclusively FF Exclusively E FI, E and FF
ATE on Sstock -0.345** 1.453*** 0.993*** 0.049 1.153*** 0.33
ATE on Sinv_trust -0.714*** -0.456** -0.053 -0.701* -0.133 -0.686***
N 14323 12399 11846 11745 10957 10710
pseudoRsq 0.019 0.049 0.095 0.075 0.041 0.049
LLR -8990.253 -6434.522 -5363.561 -5328.654 -4156.873 -3631.015
% ccorrectly classified 66.31% 76.62% 80.80% 80.57% 86.51% 88.50%
Area under ROC 0.5928 0.6513 0.7087 0.6924 0.6429 0.6655
Better financial knowledge, more guidance, but not necessarily higher ratio of risky assets (1)
30
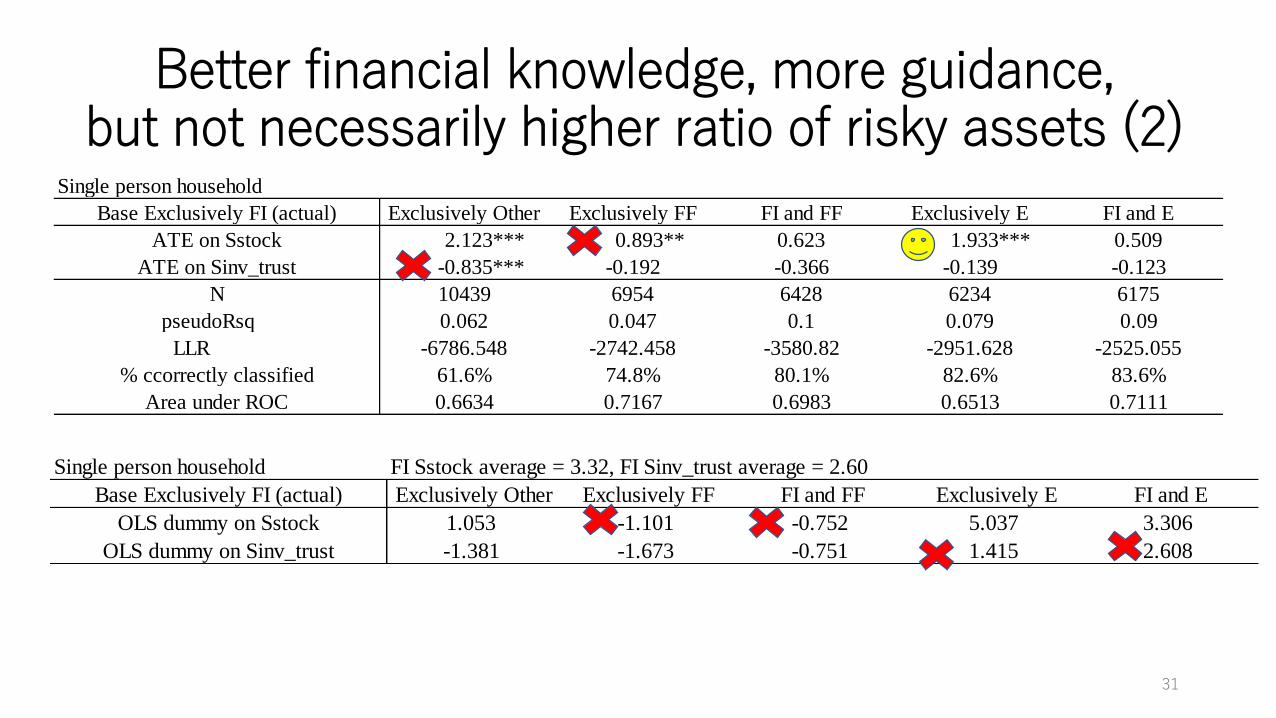
Single person household FI Sstock average = 3.32, FI Sinv_trust average = 2.60
Base Exclusively FI (actual) Exclusively Other Exclusively FF FI and FF Exclusively E FI and E
OLS dummy on Sstock 1.053 -1.101 -0.752 5.037 3.306
OLS dummy on Sinv_trust -1.381 -1.673 -0.751 1.415 2.608
Single person household
Base Exclusively FI (actual) Exclusively Other Exclusively FF FI and FF Exclusively E FI and E
ATE on Sstock 2.123*** 0.893** 0.623 1.933*** 0.509
ATE on Sinv_trust -0.835*** -0.192 -0.366 -0.139 -0.123
N 10439 6954 6428 6234 6175
pseudoRsq 0.062 0.047 0.1 0.079 0.09
LLR -6786.548 -2742.458 -3580.82 -2951.628 -2525.055
% ccorrectly classified 61.6% 74.8% 80.1% 82.6% 83.6%
Area under ROC 0.6634 0.7167 0.6983 0.6513 0.7111
Better financial knowledge, more guidance, but not necessarily higher ratio of risky assets (2)
31
RecapHouseholds choosing actual sources of information involving financialexperts have better financial knowledge as measured by knowledge ofthe DICJ, and are willing to purchase high-yield financial products.
Households choosing desirable sources involving financial expertsand neutral institutions also have better financial knowledge.
Among households whose actual sources differ from their desirablesources, households that regard a financial expert and a neutralinstitutions as a more desirable source tend to have better financialknowledge.
It is unclear whether households that seek guidance from a financialexpert have a higher ratio of stock to total financial assets than thoseselecting financial institutions as their source of financial informationand knowledge.
32
Policy Implications
Our results suggest that family households willing to purchase risky assets would benefit from the guidance of a financial expert, and a family household that would only like to receive information about a relatively safe investment would benefit most from a neutral institution.
Need to match the various types of financial advisers and households if we wish more Japanese households to seek financial adviser guidance.
The National Consumer Affairs Center of Japan or The CCFSI might be the candidates for NI, but one of the SHF questions highlighted that about 90% of respondents from 2010 to 2017 only came to know about the CCFSI when they were invited to complete the survey.
We do not provide any causal evidence, thus we should not overstate this claim.
33

Supplemental slides
34

The Japan Association for Financial Planners (JAFP)
Established in 1987 to enlighten and promote financial planning to the general public and to foster financial planners as financial planning professionals
Certified Financial Planner® (CFP)® certification (a globally credential)
Affiliated Financial Planner (AFP) certification (a domestic credential)
As of July 2017, 21,228 individuals have CFP® certification and 155,568 individuals have AFP certification
About 50% of certified members work for financial institutions
Many of these financial institutions joined JAFP as corporate members to support JAFP's activities
See details at https://www.jafp.or.jp/eng/
35
36
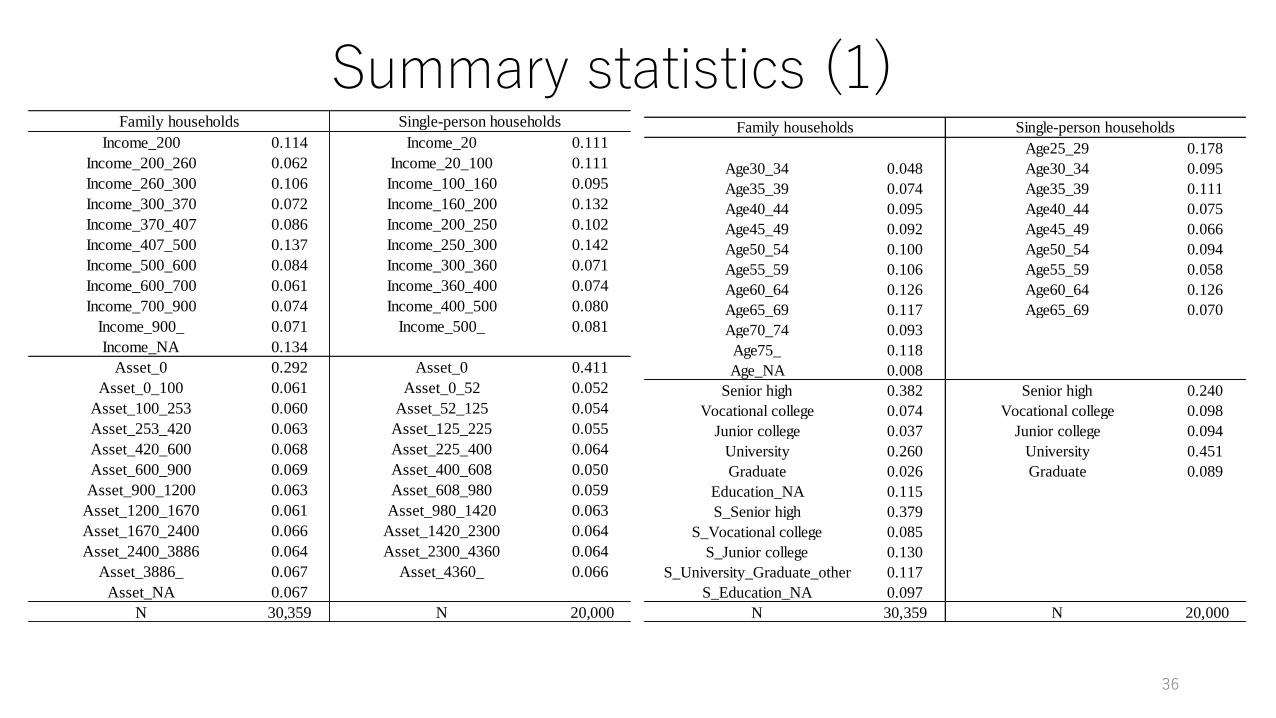
Age25_29 0.178
Age30_34 0.048 Age30_34 0.095
Age35_39 0.074 Age35_39 0.111
Age40_44 0.095 Age40_44 0.075
Age45_49 0.092 Age45_49 0.066
Age50_54 0.100 Age50_54 0.094
Age55_59 0.106 Age55_59 0.058
Age60_64 0.126 Age60_64 0.126
Age65_69 0.117 Age65_69 0.070
Age70_74 0.093
Age75_ 0.118
Age_NA 0.008
Senior high 0.382 Senior high 0.240
Vocational college 0.074 Vocational college 0.098
Junior college 0.037 Junior college 0.094
University 0.260 University 0.451
Graduate 0.026 Graduate 0.089
Education_NA 0.115
S_Senior high 0.379
S_Vocational college 0.085
S_Junior college 0.130
S_University_Graduate_other 0.117
S_Education_NA 0.097
N 30,359 N 20,000
Family households Single-person households
Summary statistics (1)Income_200 0.114 Income_20 0.111
Income_200_260 0.062 Income_20_100 0.111
Income_260_300 0.106 Income_100_160 0.095
Income_300_370 0.072 Income_160_200 0.132
Income_370_407 0.086 Income_200_250 0.102
Income_407_500 0.137 Income_250_300 0.142
Income_500_600 0.084 Income_300_360 0.071
Income_600_700 0.061 Income_360_400 0.074
Income_700_900 0.074 Income_400_500 0.080
Income_900_ 0.071 Income_500_ 0.081
Income_NA 0.134
Asset_0 0.292 Asset_0 0.411
Asset_0_100 0.061 Asset_0_52 0.052
Asset_100_253 0.060 Asset_52_125 0.054
Asset_253_420 0.063 Asset_125_225 0.055
Asset_420_600 0.068 Asset_225_400 0.064
Asset_600_900 0.069 Asset_400_608 0.050
Asset_900_1200 0.063 Asset_608_980 0.059
Asset_1200_1670 0.061 Asset_980_1420 0.063
Asset_1670_2400 0.066 Asset_1420_2300 0.064
Asset_2400_3886 0.064 Asset_2300_4360 0.064
Asset_3886_ 0.067 Asset_4360_ 0.066
Asset_NA 0.067
N 30,359 N 20,000
Family households Single-person households
Summary statistics (2)Family households Single-person households
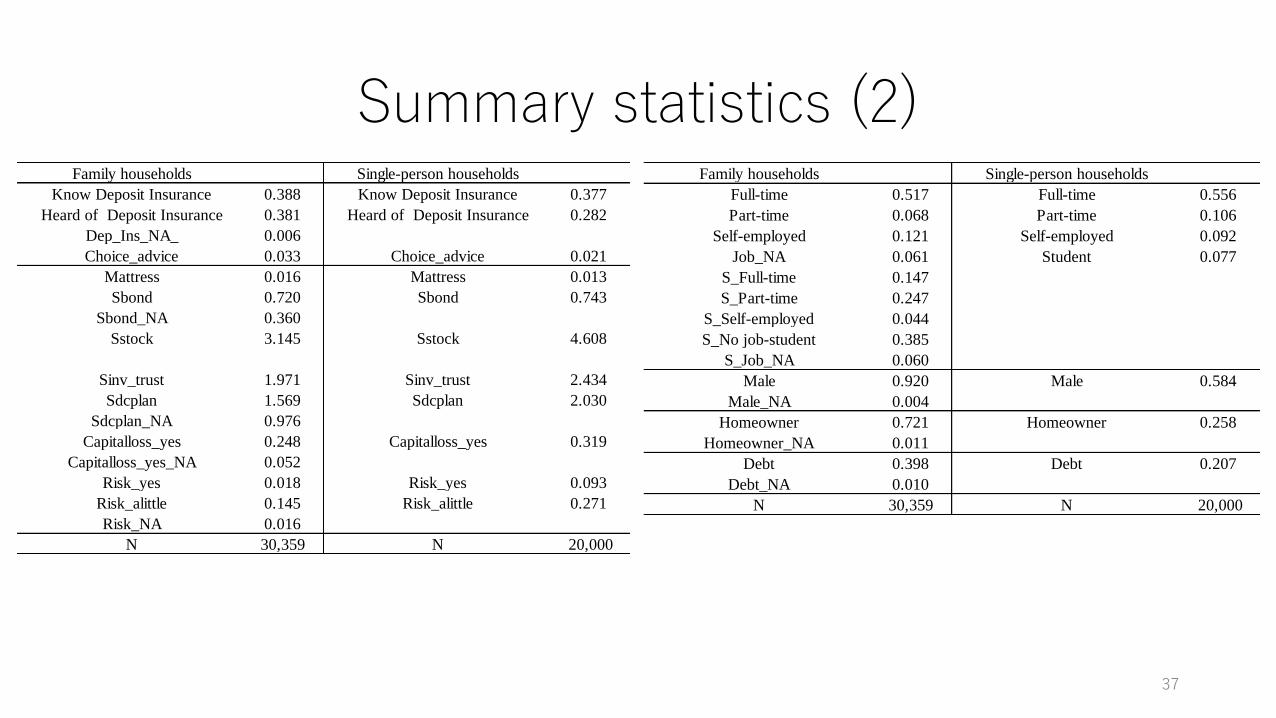
Know Deposit Insurance 0.388 Know Deposit Insurance 0.377
Heard of Deposit Insurance 0.381 Heard of Deposit Insurance 0.282
Dep_Ins_NA_ 0.006
Choice_advice 0.033 Choice_advice 0.021
Mattress 0.016 Mattress 0.013
Sbond 0.720 Sbond 0.743
Sbond_NA 0.360
Sstock 3.145 Sstock 4.608
Sinv_trust 1.971 Sinv_trust 2.434
Sdcplan 1.569 Sdcplan 2.030
Sdcplan_NA 0.976
Capitalloss_yes 0.248 Capitalloss_yes 0.319
Capitalloss_yes_NA 0.052
Risk_yes 0.018 Risk_yes 0.093
Risk_alittle 0.145 Risk_alittle 0.271
Risk_NA 0.016
N 30,359 N 20,000
37
Family households Single-person households
Full-time 0.517 Full-time 0.556
Part-time 0.068 Part-time 0.106
Self-employed 0.121 Self-employed 0.092
Job_NA 0.061 Student 0.077
S_Full-time 0.147
S_Part-time 0.247
S_Self-employed 0.044
S_No job-student 0.385
S_Job_NA 0.060
Male 0.920 Male 0.584
Male_NA 0.004
Homeowner 0.721 Homeowner 0.258
Homeowner_NA 0.011
Debt 0.398 Debt 0.207
Debt_NA 0.010
N 30,359 N 20,000
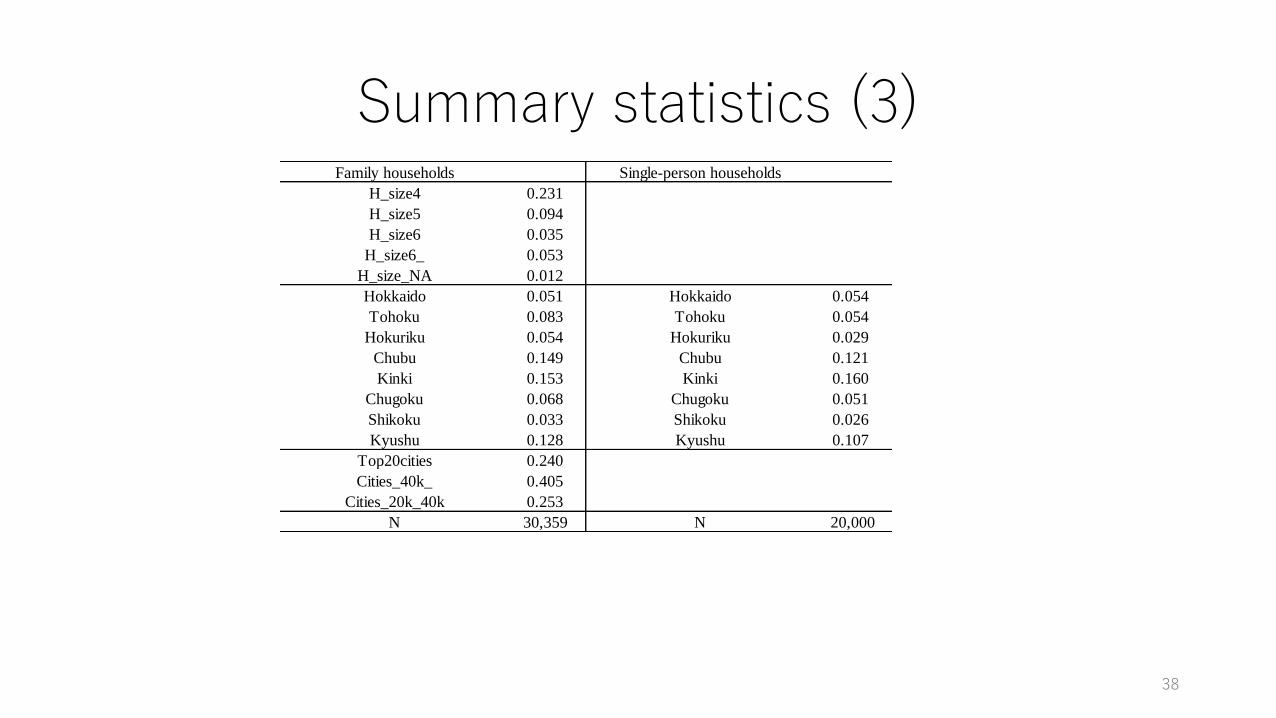
Summary statistics (3)Family households Single-person households
H_size4 0.231
H_size5 0.094
H_size6 0.035
H_size6_ 0.053
H_size_NA 0.012
Hokkaido 0.051 Hokkaido 0.054
Tohoku 0.083 Tohoku 0.054
Hokuriku 0.054 Hokuriku 0.029
Chubu 0.149 Chubu 0.121
Kinki 0.153 Kinki 0.160
Chugoku 0.068 Chugoku 0.051
Shikoku 0.033 Shikoku 0.026
Kyushu 0.128 Kyushu 0.107
Top20cities 0.240
Cities_40k_ 0.405
Cities_20k_40k 0.253
N 30,359 N 20,000
38