Embed Size (px)
Citation preview

Who Serves in the U.S. Military? Demographic Characteristics of
Enlisted Troops and Of�cers
Shanea J. Watkins, Ph.D., and James Sherk
Center for Data AnalysisACD
0
5
10
15
20
25%
2006 2007
Poorest Quintile($0–$33,267)
2006 2007
Next PoorestQuintile
($33,268–$42,039)
2006 2007
Middle Quintile($42,040–$51,127)
2006 2007
Next RichestQuintile
($51,128–$65,031)
2006 2007
Richest Quintile($65,032–$246,333)
Enlisted Recruits Are More Likely to Come from Middle- and Upper-Class Neighborhoods
Enlistees’ Neighborhood Income Levels
Percentage of Total Recruits
10.6 10.7
18.3 18.3
21.7 21.7
25.0 24.924.3 24.4
CDA08-05 August 21, 2008
Over- represented
Under- represented

A Report
of The Heritage Center
for Data Analysis
A Report
of The Heritage Center
for Data Analysis
214 Massachusetts Avenue, NE • Washington, DC 20002 • (202) 546-4400 • heritage.org
NOTE: Nothing written here is to be construed as necessarily reflecting the views of The Heritage Foundation or as an attempt to aid or hinder the passage of any bill before Congress.
WHO SERVES IN THE U.S. MILITARY? THE DEMOGRAPHICS OF ENLISTED
TROOPS AND OFFICERS
SHANEA J. WATKINS, PH.D., AND JAMES SHERK
CDA08-05 August 21, 2008
CDA04—01 November 9, 2004CDA08-05 August 19, 2008
1
WHO SERVES IN THE U.S. MILITARY? THE DEMOGRAPHICS OF ENLISTED
TROOPS AND OFFICERS
SHANEA J. WATKINS, PH.D., AND JAMES SHERK
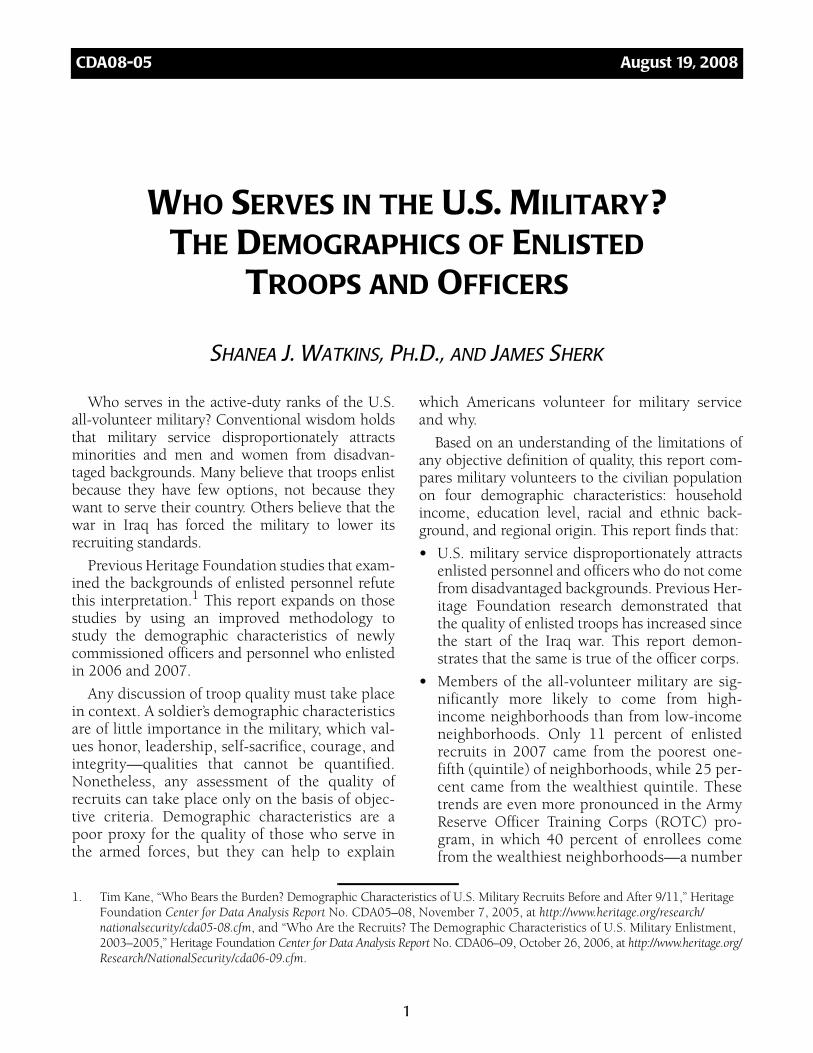
Who serves in the active-duty ranks of the U.S.all-volunteer military? Conventional wisdom holdsthat military service disproportionately attractsminorities and men and women from disadvan-taged backgrounds. Many believe that troops enlistbecause they have few options, not because theywant to serve their country. Others believe that thewar in Iraq has forced the military to lower itsrecruiting standards.
Previous Heritage Foundation studies that exam-ined the backgrounds of enlisted personnel refutethis interpretation.1 This report expands on thosestudies by using an improved methodology tostudy the demographic characteristics of newlycommissioned officers and personnel who enlistedin 2006 and 2007.
Any discussion of troop quality must take placein context. A soldier’s demographic characteristicsare of little importance in the military, which val-ues honor, leadership, self-sacrifice, courage, andintegrity—qualities that cannot be quantified.Nonetheless, any assessment of the quality ofrecruits can take place only on the basis of objec-tive criteria. Demographic characteristics are apoor proxy for the quality of those who serve inthe armed forces, but they can help to explain
which Americans volunteer for military serviceand why.
Based on an understanding of the limitations ofany objective definition of quality, this report com-pares military volunteers to the civilian populationon four demographic characteristics: householdincome, education level, racial and ethnic back-ground, and regional origin. This report finds that:
• U.S. military service disproportionately attractsenlisted personnel and officers who do not comefrom disadvantaged backgrounds. Previous Her-itage Foundation research demonstrated thatthe quality of enlisted troops has increased sincethe start of the Iraq war. This report demon-strates that the same is true of the officer corps.
• Members of the all-volunteer military are sig-nificantly more likely to come from high-income neighborhoods than from low-incomeneighborhoods. Only 11 percent of enlistedrecruits in 2007 came from the poorest one-fifth (quintile) of neighborhoods, while 25 per-cent came from the wealthiest quintile. Thesetrends are even more pronounced in the ArmyReserve Officer Training Corps (ROTC) pro-gram, in which 40 percent of enrollees comefrom the wealthiest neighborhoods—a number
1. Tim Kane, “Who Bears the Burden? Demographic Characteristics of U.S. Military Recruits Before and After 9/11,” Heritage Foundation Center for Data Analysis Report No. CDA05–08, November 7, 2005, at http://www.heritage.org/research/nationalsecurity/cda05-08.cfm, and “Who Are the Recruits? The Demographic Characteristics of U.S. Military Enlistment, 2003–2005,” Heritage Foundation Center for Data Analysis Report No. CDA06–09, October 26, 2006, at http://www.heritage.org/Research/NationalSecurity/cda06-09.cfm.
THE HERITAGE CENTER FOR DATA ANALYSIS
2
that has increased substantially over the pastfour years.
• American soldiers are more educated than theirpeers. A little more than 1 percent of enlisted per-sonnel lack a high school degree, compared to 21percent of men 18–24 years old, and 95 percent ofofficer accessions have at least a bachelor’s degree.
• Contrary to conventional wisdom, minoritiesare not overrepresented in military service.Enlisted troops are somewhat more likely to bewhite or black than their non-military peers.Whites are proportionately represented in theofficer corps, and blacks are overrepresented,but their rate of overrepresentation has declinedeach year from 2004 to 2007. New recruits arealso disproportionately likely to come from theSouth, which is in line with the history of South-ern military tradition.
The facts do not support the belief that manyAmerican soldiers volunteer because society offersthem few other opportunities. The average enlistedperson or officer could have had lucrative careeropportunities in the private sector. Those whoargue that American soldiers risk their livesbecause they have no other opportunities belittlethe personal sacrifices of those who serve out oflove for their country.
This report proceeds in two parts.
First, it examines the demographic characteristicsof the enlisted personnel in 2006 and 2007, usingnew data from the Defense Manpower Data Center.
Second, it examines the same demographic char-acteristics for 2007 graduates from the United StatesMilitary Academy (USMA) at West Point2 and formembers of the Army ROTC who were commis-sioned between 2004 and 2007 or enrolled in theArmy ROTC as of March 2007. Officers who werecommissioned in 2004 would have enrolled beforethe start of the war on terrorism, while thoseenrolled in 2007 were well aware that they weresigning up during wartime. This makes it possibleto assess whether the war in Iraq has degraded theofficer corps’ standards.
ENLISTED PERSONNELThe Defense Manpower Data Center provided
The Heritage Foundation with data on enlistedrecruits for all branches of the military in 2006and 2007.3 These data included the recruits’ racialand ethnic background, their educational attain-ment when they enlisted, and information con-necting recruits to their home census tracts. Usingcensus tracts enables a more precise analysis ofthe recruits’ family income than previous HeritageFoundation reports, which had data available onlyat the three-digit and five-digit Zip code tabula-tion area level.
Household Income. Enlisted recruits in 2006 and2007 came primarily from middle-class and upper-middle-class backgrounds. Low-income neighbor-hoods were underrepresented among enlisted troops,while middle-class and high-income neighborhoodswere overrepresented.
Individual or family income data on enlistees donot exist. The Defense Department does not main-tain records on the household income of recruits orofficers. Examining the earnings of most recruitsbefore they joined the military is not possiblebecause, for most of them, their first full-time job isin the military.
Instead, we approximated the recruits’ house-hold incomes by assigning each recruit the medianhousehold income of the census tract in which theylived. This approximates their parents’ economicstatus. For example, 10 recruits in 2006 came fromcensus tract 013306 in San Diego. Accordingly, weassigned to each of these 10 recruits a medianhousehold income of $57,380 per year (in 2008dollars), the median income of that tract in the2000 Census.
Census tracts are far smaller and morehomogenous than five-digit Zip code tabulationareas. While the average five-digit Zip code tabula-tion area contains almost 10,000 residents, censustracts average approximately 4,000 residents.4
Using census tract data consequently allows for amore precise imputation of household income than
2. This report does not cover the demographic characteristics of the graduates from other military academies or senior mili-tary colleges. The Heritage Foundation was given data only on recent West Point graduates.
3. The data used in this analysis may be requested from The Heritage Foundation, but due to privacy concerns, any release of the data must be approved by the Office of the Under Secretary of Defense for Personnel and Readiness.
4. U.S. Census Bureau, American Factfinder Glossary, s.v. “Census tract,” at http://factfinder.census.gov/home/en/epss/glossary_c.html (July 25, 2008).

3
THE HERITAGE CENTER FOR DATA ANALYSIS
was possible in previous reports and,correspondingly, a more accurateanalysis of how the recruits differfrom the civilian population.
Using the median householdincomes in their census tracts, theaverage household income for all2006 recruits was $54,834 per year(in 2008 dollars).5 The averageenlisted recruit in 2007 had a house-hold income of $54,768. This is mod-estly above the national average of$50,428. Chart 1 shows the distribu-tion among enlisted recruits and thepopulation as a whole by householdincome quintile.
As Chart 1 shows, low-incomefamilies are underrepresented in themilitary, and high-income families areoverrepresented. Individuals from thebottom household income quintilemake up 20.0 percent of the popula-tion of those who are 18–24 years oldbut only 10.6 percent of the 2006recruits and 10.7 percent of the 2007recruits. Individuals in the top twoquintiles make up 40.0 percent of thepopulation, but 49.3 percent of therecruits in both years.
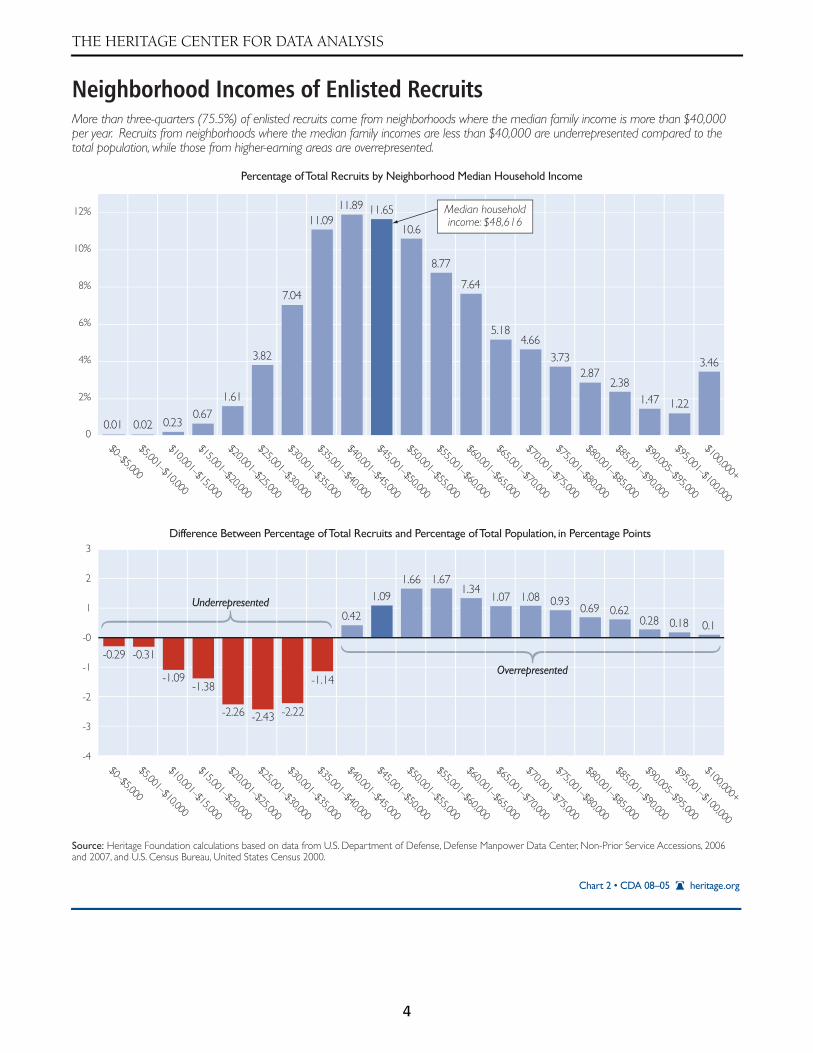
Chart 2 shows the household in-come distribution of enlisted recruitsfor 2006 and 2007 in more detail. It also shows thedifference in income distribution between enlistedforces and the overall civilian population.
Every income category above $40,000 per year isoverrepresented in the active-duty enlisted force,while every income category below $40,000 a yearis underrepresented. Low-income families are sig-nificantly underrepresented in the military. U.S.military enlistees disproportionately come fromupper-middle-class families.
Members of America’s volunteer army are notenlisting because they have no other economicopportunities. Most recruits come from relativelyaffluent families and would likely earn above-aver-age wages if they did not join the military.
Education. Contrary to popular perceptions,America’s enlisted troops are not poorly educated.Previous Heritage Foundation studies found thatenlisted troops were significantly more likely tohave a high school education than their peers. Thisis still the case. Only 1.4 percent of enlisted recruitsin 2007 had not graduated from high school orcompleted a high school equivalency degree, com-pared to 20.8 percent of men ages 18 to 24. Amer-ica’s soldiers are less likely than civilians to be highschool dropouts.
The military requires at least 90 percent ofenlisted recruits to have high school diplomas.6
Most enlisted recruits do not have a college degreebecause they enlist before they would attend col-
5. For details of these calculations, see the Technical Appendix. All figures are adjusted for inflation using the personal con-sumption expenditure (PCE) deflator and expressed in 2008 dollars.
6. A General Education Development (GED) credential does not count toward this requirement.
0
5
10
15
20
25%
2006 2007
Quintile 1($0–
$33,267)
2006 2007
Quintile 2($33,268–$42,039)
2006 2007
Quintile 3($42,040–$51,127)
2006 2007
Quintile 4($51,128–$65,031)
2006 2007
Quintile 5($65,032–$246,333)
Over- represented
Under- represented
heritage.orgChart 1 • CDA 08–05
Enlisted Recruits Are More Likely to Come from Middle- and Upper-Class NeighborhoodsOne-quarter of enlisted recruits come from the wealthiest fifth of U.S. neighborhoods. Less than 11 percent come from the poorest quintile.
Source: Heritage Foundation calculations based on data from U.S. Department of Defense, Defense Manpower Data Center, Non-Prior Service Accessions, 2006 and 2007, and U.S. Census Bureau, United States Census 2000.
Enlistees’ Neighborhood Income Levels
Percentage of Total Recruits
10.6 10.7
18.3 18.3
21.7 21.7
25.0 24.924.3 24.4
THE HERITAGE CENTER FOR DATA ANALYSIS
4
0.01 0.02 0.230.67
1.61
3.82
7.04
11.0911.89 11.65
10.6
8.77
7.64
5.184.66
3.732.87
2.381.47 1.22
3.46
-0.29 -0.31
-1.09-1.38
-2.26 -2.43 -2.22
-1.14
0.42
1.091.66 1.67
1.341.07 1.08 0.93
0.69 0.620.28 0.18 0.1
0
2%
-4
-2
-0
2
3
1
-1
-3
$95,001–$100,000
$90,005–$95,000
$85,001–$90,000
$80,001–$85,000
$75,001–$80,000
$70,001–$75,000
$65,001–$70,000
$60,001–$65,000
$55,001–$60,000
$50,001–$55,000
$45,001–$50,000
$40,001–$45,000
$35,001–$40,000
$30,001–$35,000
$25,001–$30,000
$20,001–$25,000
$15,001–$20,000
$10,001–$15,000
$5,001–$10,000
$0–$5,000
$100,000+
4%
6%
8%
10%
12%
heritage.orgChart 2 • CDA 08–05
Neighborhood Incomes of Enlisted RecruitsMore than three-quarters (75.5%) of enlisted recruits come from neighborhoods where the median family income is more than $40,000 per year. Recruits from neighborhoods where the median family incomes are less than $40,000 are underrepresented compared to the total population, while those from higher-earning areas are overrepresented.
Source: Heritage Foundation calculations based on data from U.S. Department of Defense, Defense Manpower Data Center, Non-Prior Service Accessions, 2006 and 2007, and U.S. Census Bureau, United States Census 2000.
Percentage of Total Recruits by Neighborhood Median Household Income
Difference Between Percentage of Total Recruits and Percentage of Total Population, in Percentage Points
Underrepresented
Overrepresented
Median household income: $48,616
5
THE HERITAGE CENTER FOR DATA ANALYSIS
lege. However, many recruits use the educationalbenefits offered by the military to attend collegeafter they leave the armed forces.
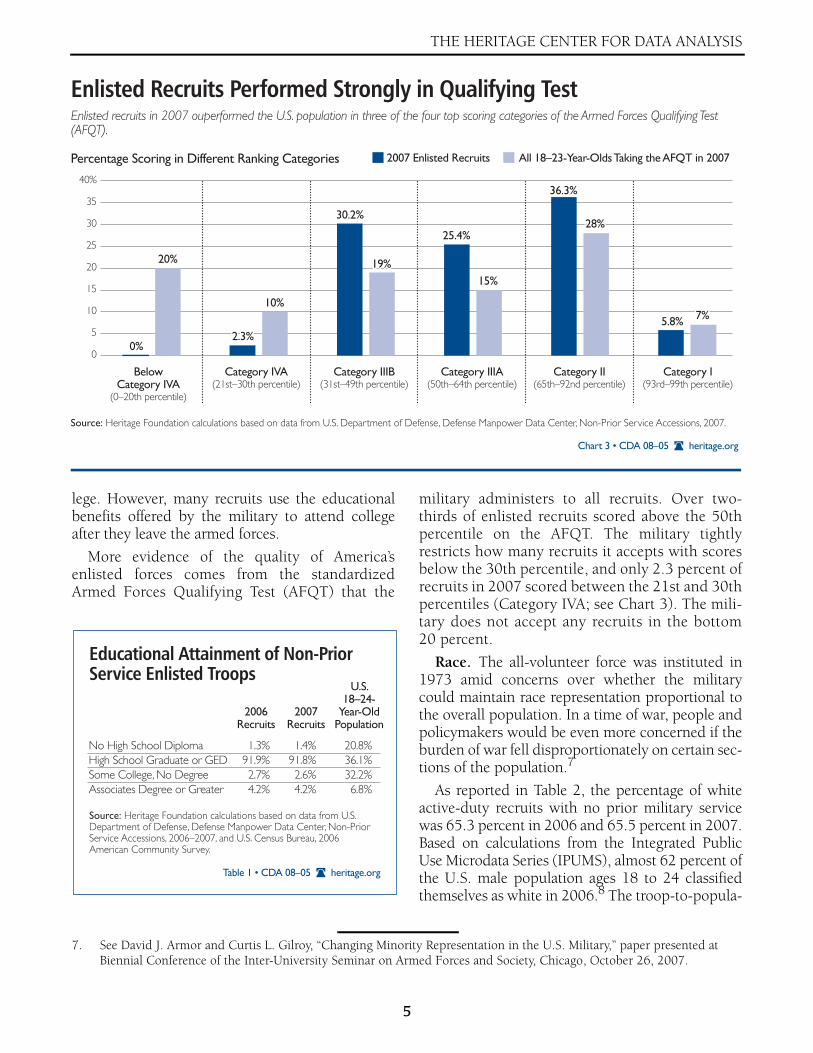
More evidence of the quality of America’senlisted forces comes from the standardizedArmed Forces Qualifying Test (AFQT) that the
military administers to all recruits. Over two-thirds of enlisted recruits scored above the 50thpercentile on the AFQT. The military tightlyrestricts how many recruits it accepts with scoresbelow the 30th percentile, and only 2.3 percent ofrecruits in 2007 scored between the 21st and 30thpercentiles (Category IVA; see Chart 3). The mili-tary does not accept any recruits in the bottom20 percent.
Race. The all-volunteer force was instituted in1973 amid concerns over whether the militarycould maintain race representation proportional tothe overall population. In a time of war, people andpolicymakers would be even more concerned if theburden of war fell disproportionately on certain sec-tions of the population.7
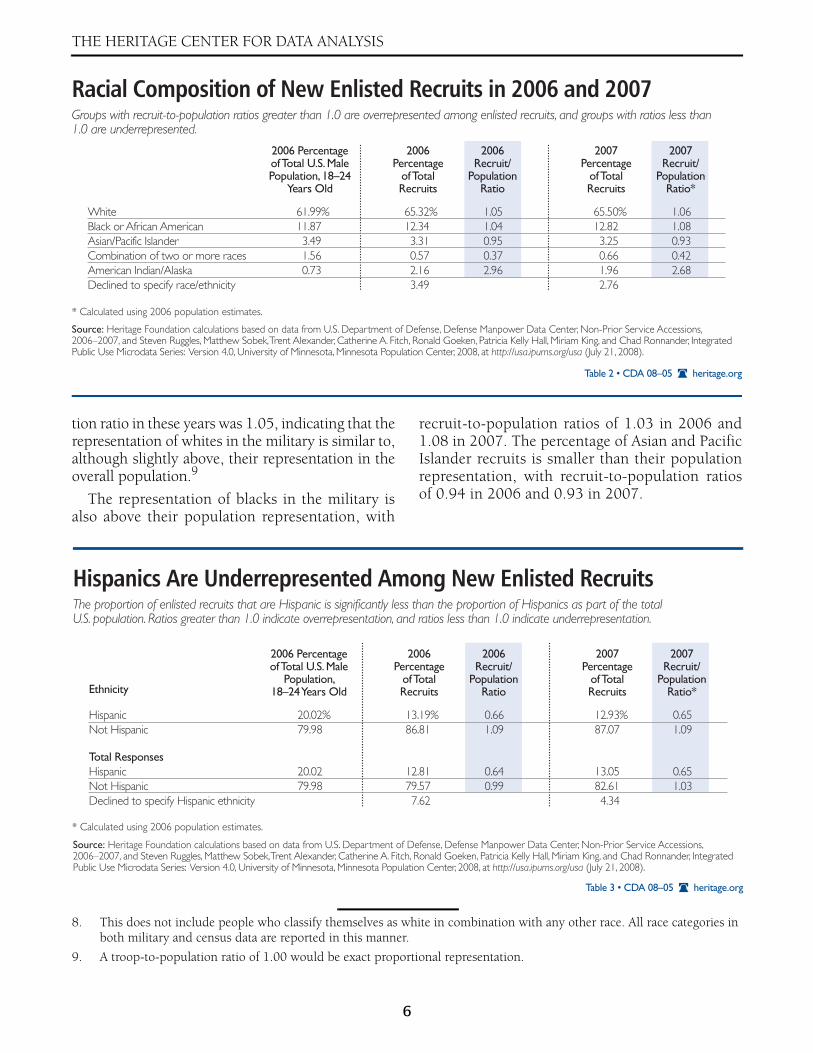
As reported in Table 2, the percentage of whiteactive-duty recruits with no prior military servicewas 65.3 percent in 2006 and 65.5 percent in 2007.Based on calculations from the Integrated PublicUse Microdata Series (IPUMS), almost 62 percent ofthe U.S. male population ages 18 to 24 classifiedthemselves as white in 2006.8 The troop-to-popula-
7. See David J. Armor and Curtis L. Gilroy, “Changing Minority Representation in the U.S. Military,” paper presented at Biennial Conference of the Inter-University Seminar on Armed Forces and Society, Chicago, October 26, 2007.
No High School Diploma 1.3% 1.4% 20.8%High School Graduate or GED 91.9% 91.8% 36.1%Some College, No Degree 2.7% 2.6% 32.2%Associates Degree or Greater 4.2% 4.2% 6.8%
U.S.18–24-
Year-Old Population
2007Recruits
2006Recruits
heritage.orgTable 1 • CDA 08–05
Educational Attainment of Non-Prior Service Enlisted Troops
Source: Heritage Foundation calculations based on data from U.S. Department of Defense, Defense Manpower Data Center, Non-Prior Service Accessions, 2006–2007, and U.S. Census Bureau, 2006 American Community Survey.
Source: Heritage Foundation calculations based on data from U.S. Department of Defense, Defense Manpower Data Center, Non-Prior Service Accessions, 2007.
0
5
10
15
20
25
30
35
40%
BelowCategory IVA
(0–20th percentile)
30.2%
19%
25.4%
15%
36.3%
28%
5.8% 7%
2.3%
10%
0%
20%
30.2%
19%
25.4%
15%
36.3%
28%
5.8% 7%
2.3%
10%
0%
20%
Category IVA(21st–30th percentile)
Category IIIB(31st–49th percentile)
Category IIIA(50th–64th percentile)
Category II(65th–92nd percentile)
Category I(93rd–99th percentile)
heritage.orgChart 3 • CDA 08–05
Enlisted Recruits Performed Strongly in Qualifying TestEnlisted recruits in 2007 ouperformed the U.S. population in three of the four top scoring categories of the Armed Forces Qualifying Test (AFQT).
Percentage Scoring in Different Ranking Categories 2007 Enlisted Recruits All 18–23-Year-Olds Taking the AFQT in 2007
THE HERITAGE CENTER FOR DATA ANALYSIS
6
tion ratio in these years was 1.05, indicating that therepresentation of whites in the military is similar to,although slightly above, their representation in theoverall population.9
The representation of blacks in the military isalso above their population representation, with
recruit-to-population ratios of 1.03 in 2006 and1.08 in 2007. The percentage of Asian and PacificIslander recruits is smaller than their populationrepresentation, with recruit-to-population ratiosof 0.94 in 2006 and 0.93 in 2007.
8. This does not include people who classify themselves as white in combination with any other race. All race categories in both military and census data are reported in this manner.
9. A troop-to-population ratio of 1.00 would be exact proportional representation.
White 61.99% 65.32% 1.05 65.50% 1.06Black or African American 11.87 12.34 1.04 12.82 1.08Asian/Pacific Islander 3.49 3.31 0.95 3.25 0.93Combination of two or more races 1.56 0.57 0.37 0.66 0.42American Indian/Alaska 0.73 2.16 2.96 1.96 2.68Declined to specify race/ethnicity 3.49 2.76
2006 Percentage of Total U.S. Male Population, 18–24
Years Old
2006Percentage
of Total Recruits
2006Recruit/
Population Ratio
2007Percentage
of Total Recruits
2007Recruit/
Population Ratio*
heritage.orgTable 2 • CDA 08–05
Racial Composition of New Enlisted Recruits in 2006 and 2007
Source: Heritage Foundation calculations based on data from U.S. Department of Defense, Defense Manpower Data Center, Non-Prior Service Accessions, 2006–2007, and Steven Ruggles, Matthew Sobek, Trent Alexander, Catherine A. Fitch, Ronald Goeken, Patricia Kelly Hall, Miriam King, and Chad Ronnander, Integrated Public Use Microdata Series: Version 4.0, University of Minnesota, Minnesota Population Center, 2008, at http://usa.ipums.org/usa (July 21, 2008).
* Calculated using 2006 population estimates.
Groups with recruit-to-population ratios greater than 1.0 are overrepresented among enlisted recruits, and groups with ratios less than 1.0 are underrepresented.
Hispanic 20.02% 13.19% 0.66 12.93% 0.65Not Hispanic 79.98 86.81 1.09 87.07 1.09
Total ResponsesHispanic 20.02 12.81 0.64 13.05 0.65Not Hispanic 79.98 79.57 0.99 82.61 1.03Declined to specify Hispanic ethnicity 7.62 4.34
2006 Percentage of Total U.S. Male
Population, 18–24 Years OldEthnicity
2006Percentage
of Total Recruits
2006Recruit/
Population Ratio
2007Percentage
of Total Recruits
2007Recruit/
Population Ratio*
heritage.orgTable 3 • CDA 08–05
Hispanics Are Underrepresented Among New Enlisted RecruitsThe proportion of enlisted recruits that are Hispanic is significantly less than the proportion of Hispanics as part of the total U.S. population. Ratios greater than 1.0 indicate overrepresentation, and ratios less than 1.0 indicate underrepresentation.
Source: Heritage Foundation calculations based on data from U.S. Department of Defense, Defense Manpower Data Center, Non-Prior Service Accessions, 2006–2007, and Steven Ruggles, Matthew Sobek, Trent Alexander, Catherine A. Fitch, Ronald Goeken, Patricia Kelly Hall, Miriam King, and Chad Ronnander, Integrated Public Use Microdata Series: Version 4.0, University of Minnesota, Minnesota Population Center, 2008, at http://usa.ipums.org/usa (July 21, 2008).
* Calculated using 2006 population estimates.
7
THE HERITAGE CENTER FOR DATA ANALYSIS
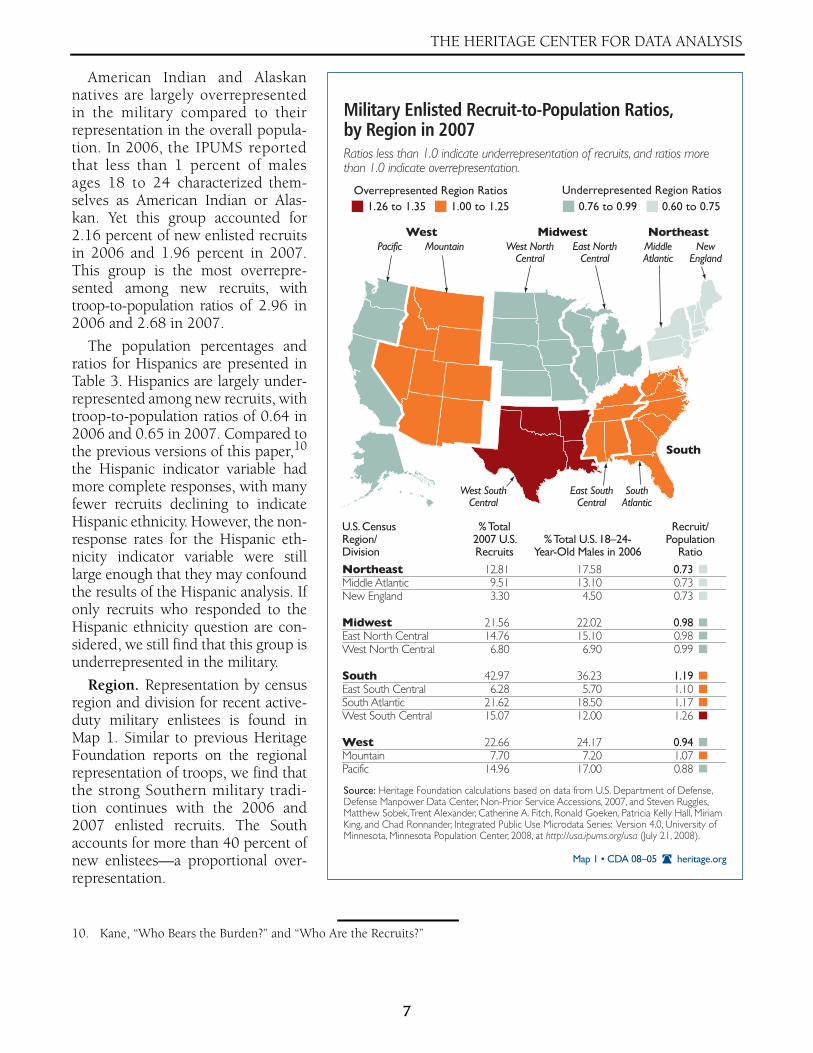
American Indian and Alaskannatives are largely overrepresentedin the military compared to theirrepresentation in the overall popula-tion. In 2006, the IPUMS reportedthat less than 1 percent of malesages 18 to 24 characterized them-selves as American Indian or Alas-kan. Yet this group accounted for2.16 percent of new enlisted recruitsin 2006 and 1.96 percent in 2007.This group is the most overrepre-sented among new recruits, withtroop-to-population ratios of 2.96 in2006 and 2.68 in 2007.
The population percentages andratios for Hispanics are presented inTable 3. Hispanics are largely under-represented among new recruits, withtroop-to-population ratios of 0.64 in2006 and 0.65 in 2007. Compared tothe previous versions of this paper,10
the Hispanic indicator variable hadmore complete responses, with manyfewer recruits declining to indicateHispanic ethnicity. However, the non-response rates for the Hispanic eth-nicity indicator variable were stilllarge enough that they may confoundthe results of the Hispanic analysis. Ifonly recruits who responded to theHispanic ethnicity question are con-sidered, we still find that this group isunderrepresented in the military.
Region. Representation by censusregion and division for recent active-duty military enlistees is found inMap 1. Similar to previous HeritageFoundation reports on the regionalrepresentation of troops, we find thatthe strong Southern military tradi-tion continues with the 2006 and2007 enlisted recruits. The Southaccounts for more than 40 percent ofnew enlistees—a proportional over-representation.
10. Kane, “Who Bears the Burden?” and “Who Are the Recruits?”
NortheastMiddle AtlanticNew England
MidwestEast North CentralWest North Central
SouthEast South CentralSouth AtlanticWest South Central
WestMountainPacific
17.5813.104.50
22.0215.106.90
36.235.70
18.5012.00
24.177.20
17.00
12.819.513.30
21.5614.766.80
42.976.28
21.6215.07
22.667.70
14.96
U.S. Census Region/ Division
% Total U.S. 18–24-Year-Old Males in 2006
% Total 2007 U.S. Recruits
Recruit/Population
Ratio
Overrepresented Region Ratios Underrepresented Region Ratios1.26 to 1.35 1.00 to 1.25 0.76 to 0.99 0.60 to 0.75
West Midwest Northeast
South
Pacific
West SouthCentral
West NorthCentral
Mountain MiddleAtlantic
East NorthCentral
SouthAtlantic
NewEngland
East SouthCentral
heritage.orgMap 1 • CDA 08–05
Military Enlisted Recruit-to-Population Ratios, by Region in 2007Ratios less than 1.0 indicate underrepresentation of recruits, and ratios more than 1.0 indicate overrepresentation.
Source: Heritage Foundation calculations based on data from U.S. Department of Defense, Defense Manpower Data Center, Non-Prior Service Accessions, 2007, and Steven Ruggles, Matthew Sobek, Trent Alexander, Catherine A. Fitch, Ronald Goeken, Patricia Kelly Hall, Miriam King, and Chad Ronnander, Integrated Public Use Microdata Series: Version 4.0, University of Minnesota, Minnesota Population Center, 2008, at http://usa.ipums.org/usa (July 21, 2008).
0.730.730.73
0.980.980.99
1.191.101.171.26
0.941.070.88
THE HERITAGE CENTER FOR DATA ANALYSIS
8
0.880.880.880.870.850.800.750.740.730.680.630.620.600.580.560.530.25
States Ranked from Highest Recruit-to-Population Ratio to Lowest
MontanaNevadaOregonMaineArkansasOklahomaAlabamaFloridaTexasIdahoMissouriGeorgiaWest VirginiaSouth CarolinaTennesseeAlaskaVirginia
KansasArizonaNorth CarolinaNew HampshireWyomingHawaiiWashingtonColoradoOhioMichiganKentuckyNew MexicoIndianaWisconsinIowaNebraskaSouth Dakota
State State StateRatio% U.S. Pop.*
% Total Enlisted Ratio
% U.S. Pop.*
% Total Enlisted Ratio
% U.S. Pop.*
% Total Enlisted
LouisianaMarylandPennsylvaniaIllinoisMississippiCaliforniaVermontMinnesotaDelawareNew YorkConnecticutNew JerseyMassachusettsRhode IslandUtahNorth DakotaDC
1234567891011121314151617
1819202122232425262728293031323334
3536373839404142434445464748495051
0.50% 1.05 1.53 0.54 1.19 1.58 1.96 7.08 10.89 0.64 2.39 3.91 0.60 1.79 2.14 0.35 2.98
1.14% 2.26 3.40 0.44 0.22 0.43 2.26 1.71 3.92 3.41 1.33 0.70 2.04 1.75 0.95 0.65 0.27
1.41% 1.59 3.53 3.64 0.85 10.39 0.15 1.25 0.22 4.38 0.69 1.61 1.25 0.23 0.62 0.16 0.05
1.6% 1.8 4.0 4.2 1.0 13.0 0.2 1.7 0.2 6.4 1.1 2.6 2.1 0.4 1.1 0.3 0.3
1.0% 2.0 3.0 0.4 0.2 0.4 2.1 1.6 3.7 3.3 1.3 0.7 2.1 1.8 1.0 0.7 0.3
0.3% 0.7 1.1 0.4 0.9 1.2 1.5 5.4 8.3 0.5 1.9 3.2 0.5 1.5 1.8 0.3 2.6
1.141.131.131.101.101.081.081.071.061.031.021.000.970.970.950.930.90
1.671.501.391.351.321.321.311.311.311.281.261.221.201.191.191.171.15
Equally andOverrepresentedStates
UnderrepresentedStates
1.26 to 1.701.00 to 1.25
0.76 to 0.990.25 to 0.75
heritage.orgMap 2 • CDA 08–05
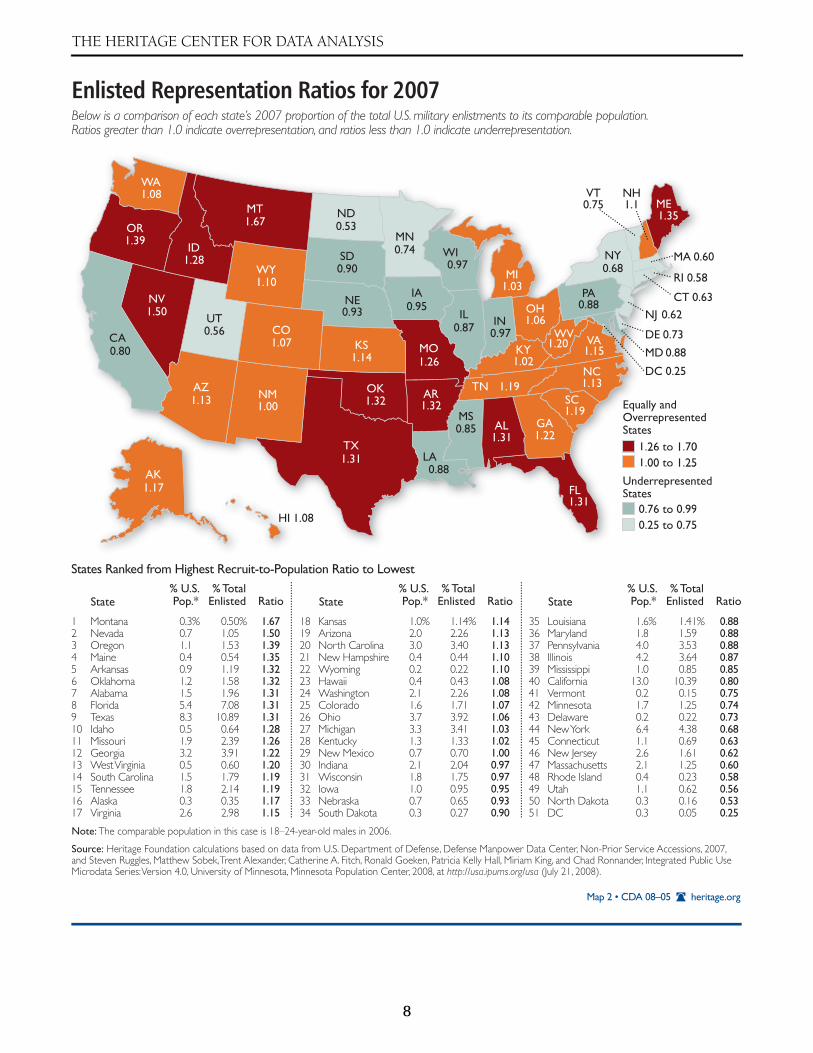
Enlisted Representation Ratios for 2007Below is a comparison of each state’s 2007 proportion of the total U.S. military enlistments to its comparable population. Ratios greater than 1.0 indicate overrepresentation, and ratios less than 1.0 indicate underrepresentation.
Source: Heritage Foundation calculations based on data from U.S. Department of Defense, Defense Manpower Data Center, Non-Prior Service Accessions, 2007, and Steven Ruggles, Matthew Sobek, Trent Alexander, Catherine A. Fitch, Ronald Goeken, Patricia Kelly Hall, Miriam King, and Chad Ronnander, Integrated Public Use Microdata Series: Version 4.0, University of Minnesota, Minnesota Population Center, 2008, at http://usa.ipums.org/usa (July 21, 2008).
Note: The comparable population in this case is 18–24-year-old males in 2006.
Equally andOverrepresentedStates
UnderrepresenteStates
1.26 to 1.701.00 to 1.25
0.76 to 0.990.25 to 0.75
1.10
1.20
0.97
1.080.75
1.15
0.56
1.31
1.19
0.90
1.19
0.58
0.88
1.39
1.32
1.06
0.68
1.50
1.00
0.62
1.1
0.93
0.53
1.13
1.67
0.85
1.26
0.74
1.03
1.35
0.88
0.60
0.88
1.021.14
0.970.87
1.28
0.95
1.08
1.22
1.31
0.73
0.25
0.63
1.070.80
1.13 1.32
1.17
1.31
WY
WV
WI
WAVT
VA
UT
TX
TN
SD
SC
RIPA
OR
OK
OH
NY
NV
NM
NJ
NH
NE
ND
NC
MT
MS
MO
MN
MI
ME
MD
MA
LA
KYKS
INIL
ID
IA
HI
GA
FL
DE
DC
CT
COCA
AZ AR
AK
AL
9
THE HERITAGE CENTER FOR DATA ANALYSIS
The Northeast is underrepresented in theenlisted population, while the Midwest and Westare roughly proportionally represented. Map 2shows the enlisted representation ratios for eachstate for 2007 enlistees with no prior military ser-vice. The figures for 2006 are in Table A1 in theAppendix.
THE OFFICER CORPSThe conventional wisdom, which mistakenly
holds that Americans soldiers enlist because they aredisadvantaged and have limited opportunities, doesnot extend to the officer corps. The stereotypicalmilitary officer is highly educated and comes froman affluent family. This stereotype is largely correct.
The Defense Manpower Data Center providedThe Heritage Foundation with data on officers whowere commissioned in the Army Reserve OfficerTraining Corps between 2004 and 2007 and cadetswho were enrolled in the Army ROTC as of March27, 2007. The military also provided informationon the 2007 graduates of the U.S. Military Acad-emy at West Point. Although these data do notrepresent all officers, they provide significantinsight into the demographic characteristics of theofficer corps: 39 percent of active-duty officerswere commissioned through the ROTC,11 and 25percent of new army lieutenants graduated fromWest Point.12
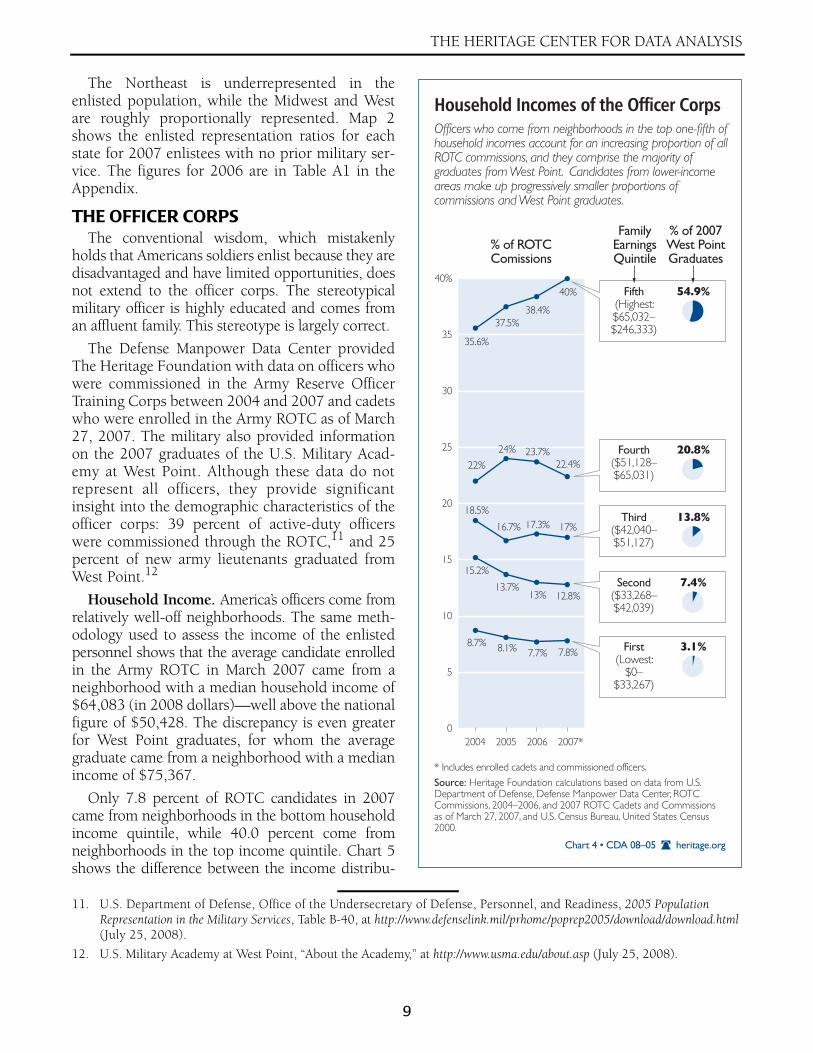
Household Income. America’s officers come fromrelatively well-off neighborhoods. The same meth-odology used to assess the income of the enlistedpersonnel shows that the average candidate enrolledin the Army ROTC in March 2007 came from aneighborhood with a median household income of$64,083 (in 2008 dollars)—well above the nationalfigure of $50,428. The discrepancy is even greaterfor West Point graduates, for whom the averagegraduate came from a neighborhood with a medianincome of $75,367.
Only 7.8 percent of ROTC candidates in 2007came from neighborhoods in the bottom householdincome quintile, while 40.0 percent come fromneighborhoods in the top income quintile. Chart 5shows the difference between the income distribu-
11. U.S. Department of Defense, Office of the Undersecretary of Defense, Personnel, and Readiness, 2005 Population Representation in the Military Services, Table B-40, at http://www.defenselink.mil/prhome/poprep2005/download/download.html (July 25, 2008).
12. U.S. Military Academy at West Point, “About the Academy,” at http://www.usma.edu/about.asp (July 25, 2008).
* Includes enrolled cadets and commissioned officers.
heritage.orgChart 4 • CDA 08–05
Household Incomes of the Officer CorpsOfficers who come from neighborhoods in the top one-fifth of household incomes account for an increasing proportion of all ROTC commissions, and they comprise the majority of graduates from West Point. Candidates from lower-income areas make up progressively smaller proportions of commissions and West Point graduates.
Source: Heritage Foundation calculations based on data from U.S. Department of Defense, Defense Manpower Data Center, ROTC Commissions, 2004–2006, and 2007 ROTC Cadets and Commissions as of March 27, 2007, and U.S. Census Bureau, United States Census 2000.
2004 2005 2006 2007*0
10
20
30
5
15
25
35
40%
% of ROTCComissions
FamilyEarnings Quintile
% of 2007 West Point Graduates
Fifth (Highest: $65,032–$246,333)
54.9%
Fourth ($51,128–$65,031)
20.8%
Third ($42,040–$51,127)
13.8%
35.6%
37.5%38.4%
40%
22%
24% 23.7%22.4%
18.5%
16.7% 17.3% 17%
15.2%
13.7%13% 12.8%
8.7% 8.1% 7.7% 7.8%
Second($33,268–$42,039)
7.4%
First (Lowest:
$0–$33,267)
3.1%
THE HERITAGE CENTER FOR DATA ANALYSIS
10
ROTC
U.S. Military Academy
heritage.orgChart 5 • CDA 08–05
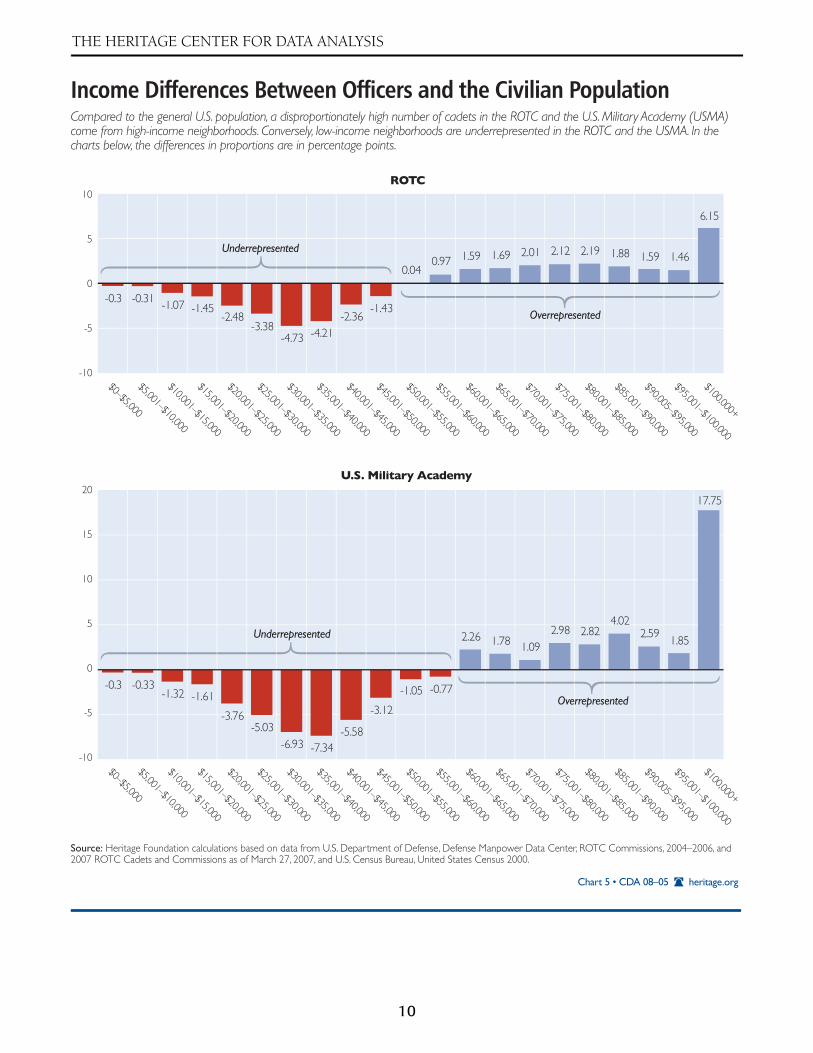
Income Differences Between Officers and the Civilian PopulationCompared to the general U.S. population, a disproportionately high number of cadets in the ROTC and the U.S. Military Academy (USMA) come from high-income neighborhoods. Conversely, low-income neighborhoods are underrepresented in the ROTC and the USMA. In the charts below, the differences in proportions are in percentage points.
Source: Heritage Foundation calculations based on data from U.S. Department of Defense, Defense Manpower Data Center, ROTC Commissions, 2004–2006, and 2007 ROTC Cadets and Commissions as of March 27, 2007, and U.S. Census Bureau, United States Census 2000.
20
15
10
5
0
-5
-10
10
5
0
-5
-10$95,001–$100,000
$90,005–$95,000
$85,001–$90,000
$80,001–$85,000
$75,001–$80,000
$70,001–$75,000
$65,001–$70,000
$60,001–$65,000
$55,001–$60,000
$50,001–$55,000
$45,001–$50,000
$40,001–$45,000
$35,001–$40,000
$30,001–$35,000
$25,001–$30,000
$20,001–$25,000
$15,001–$20,000
$10,001–$15,000
$5,001–$10,000
$0–$5,000
$100,000+
$95,001–$100,000
$90,005–$95,000
$85,001–$90,000
$80,001–$85,000
$75,001–$80,000
$70,001–$75,000
$65,001–$70,000
$60,001–$65,000
$55,001–$60,000
$50,001–$55,000
$45,001–$50,000
$40,001–$45,000
$35,001–$40,000
$30,001–$35,000
$25,001–$30,000
$20,001–$25,000
$15,001–$20,000
$10,001–$15,000
$5,001–$10,000
$0–$5,000
$100,000+
-0.3 -0.33-1.32 -1.61
-3.76-5.03
-6.93 -7.34-5.58
-3.12
-1.05 -0.77
2.26 1.78 1.092.98 2.82
4.022.59
1.85
17.75
-0.3 -0.31 -1.07 -1.45-2.48
-3.38-4.73 -4.21
-2.36-1.43
0.040.97 1.59 1.69 2.01 2.12 2.19 1.88 1.59 1.46
6.15
Underrepresented
Overrepresented
Underrepresented
Overrepresented
11
THE HERITAGE CENTER FOR DATA ANALYSIS
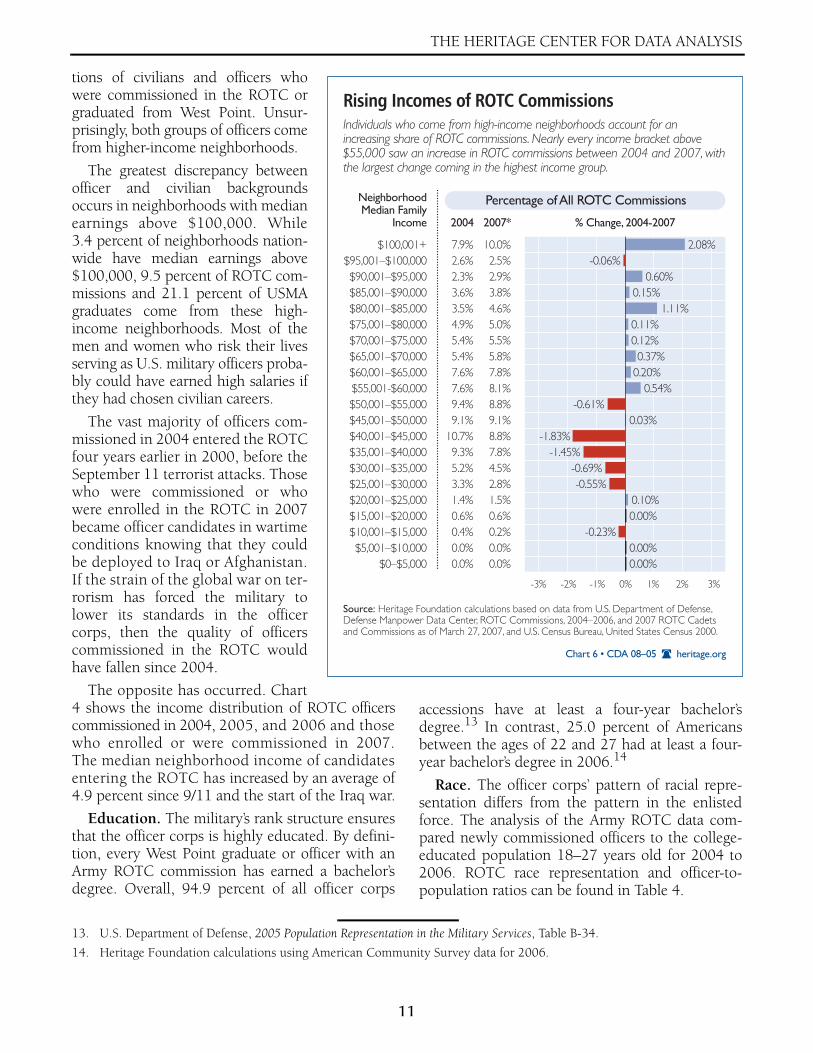
tions of civilians and officers whowere commissioned in the ROTC orgraduated from West Point. Unsur-prisingly, both groups of officers comefrom higher-income neighborhoods.
The greatest discrepancy betweenofficer and civilian backgroundsoccurs in neighborhoods with medianearnings above $100,000. While3.4 percent of neighborhoods nation-wide have median earnings above$100,000, 9.5 percent of ROTC com-missions and 21.1 percent of USMAgraduates come from these high-income neighborhoods. Most of themen and women who risk their livesserving as U.S. military officers proba-bly could have earned high salaries ifthey had chosen civilian careers.
The vast majority of officers com-missioned in 2004 entered the ROTCfour years earlier in 2000, before theSeptember 11 terrorist attacks. Thosewho were commissioned or whowere enrolled in the ROTC in 2007became officer candidates in wartimeconditions knowing that they couldbe deployed to Iraq or Afghanistan.If the strain of the global war on ter-rorism has forced the military tolower its standards in the officercorps, then the quality of officerscommissioned in the ROTC wouldhave fallen since 2004.
The opposite has occurred. Chart4 shows the income distribution of ROTC officerscommissioned in 2004, 2005, and 2006 and thosewho enrolled or were commissioned in 2007.The median neighborhood income of candidatesentering the ROTC has increased by an average of4.9 percent since 9/11 and the start of the Iraq war.
Education. The military’s rank structure ensuresthat the officer corps is highly educated. By defini-tion, every West Point graduate or officer with anArmy ROTC commission has earned a bachelor’sdegree. Overall, 94.9 percent of all officer corps
accessions have at least a four-year bachelor’sdegree.13 In contrast, 25.0 percent of Americansbetween the ages of 22 and 27 had at least a four-year bachelor’s degree in 2006.14
Race. The officer corps’ pattern of racial repre-sentation differs from the pattern in the enlistedforce. The analysis of the Army ROTC data com-pared newly commissioned officers to the college-educated population 18–27 years old for 2004 to2006. ROTC race representation and officer-to-population ratios can be found in Table 4.
13. U.S. Department of Defense, 2005 Population Representation in the Military Services, Table B-34.
14. Heritage Foundation calculations using American Community Survey data for 2006.
Neighborhood Median Family
Income
7.9%2.6%2.3%3.6%3.5%4.9%5.4%5.4%7.6%7.6%9.4%9.1%
10.7%9.3%5.2%3.3%1.4%0.6%0.4%0.0%0.0%
2004
10.0%2.5%2.9%3.8%4.6%5.0%5.5%5.8%7.8%8.1%8.8%9.1%8.8%7.8%4.5%2.8%1.5%0.6%0.2%0.0%0.0%
2007*
0.00%0.00%
-0.23%0.00%0.10%
-0.55%-0.69%
-1.45%-1.83%
0.03%-0.61%
0.54%0.20%0.37%
0.12%0.11%
1.11%0.15%
0.60%-0.06%
2.08%
% Change, 2004-2007
-2%-3% -1% 0% 1% 2% 3%
Percentage of All ROTC Commissions
heritage.orgChart 6 • CDA 08–05
Rising Incomes of ROTC CommissionsIndividuals who come from high-income neighborhoods account for an increasing share of ROTC commissions. Nearly every income bracket above $55,000 saw an increase in ROTC commissions between 2004 and 2007, with the largest change coming in the highest income group.
Source: Heritage Foundation calculations based on data from U.S. Department of Defense, Defense Manpower Data Center, ROTC Commissions, 2004–2006, and 2007 ROTC Cadets and Commissions as of March 27, 2007, and U.S. Census Bureau, United States Census 2000.
$100,001+$95,001–$100,000$90,001–$95,000$85,001–$90,000$80,001–$85,000$75,001–$80,000$70,001–$75,000$65,001–$70,000$60,001–$65,000$55,001-$60,000$50,001–$55,000$45,001–$50,000$40,001–$45,000$35,001–$40,000$30,001–$35,000$25,001–$30,000$20,001–$25,000$15,001–$20,000$10,001–$15,000$5,001–$10,000
$0–$5,000

THE HERITAGE CENTER FOR DATA ANALYSIS
12
When compared to the relevant populationgroup, whites are roughly proportionally repre-sented in the ROTC in all four years, similar towhat was observed in the enlisted military popula-tion. Blacks are overrepresented in all four years,but this overrepresentation decreases in each suc-cessive year.
The percentage of Hispanics completing col-lege is roughly equal to the proportion partici-pating in the ROTC, indicating proportionalrepresentation of this demographic group. Thisis true of all years, except 2007 when Hispanicsare largely underrepresented in ROTC programs,with a cadet-to-population ratio of just 0.68.However, the 2007 ROTC numbers should beinterpreted cautiously because they include allcurrent ROTC participants and ROTC cadetswho were commissioned in 2007. These figuresmay be misleading because they do not accountfor attrition among current cadets, and futureanalysis may find that Hispanic representation inthe ROTC in 2007 was proportional when com-pared to Hispanics in the general population
with college degrees. This caveat should beapplied to all 2007 ROTC findings.
The proportion of Asians in the ROTC popula-tion is smaller than in the comparison group, indi-cating that fewer Asians are participating in theROTC than are attending and completing college.The percentage of American Indian and Alaskannatives who participate in the ROTC is small, but itmore than doubled between 2004 and 2005, mov-ing from being proportionally represented in 2004to being overrepresented since 2005.
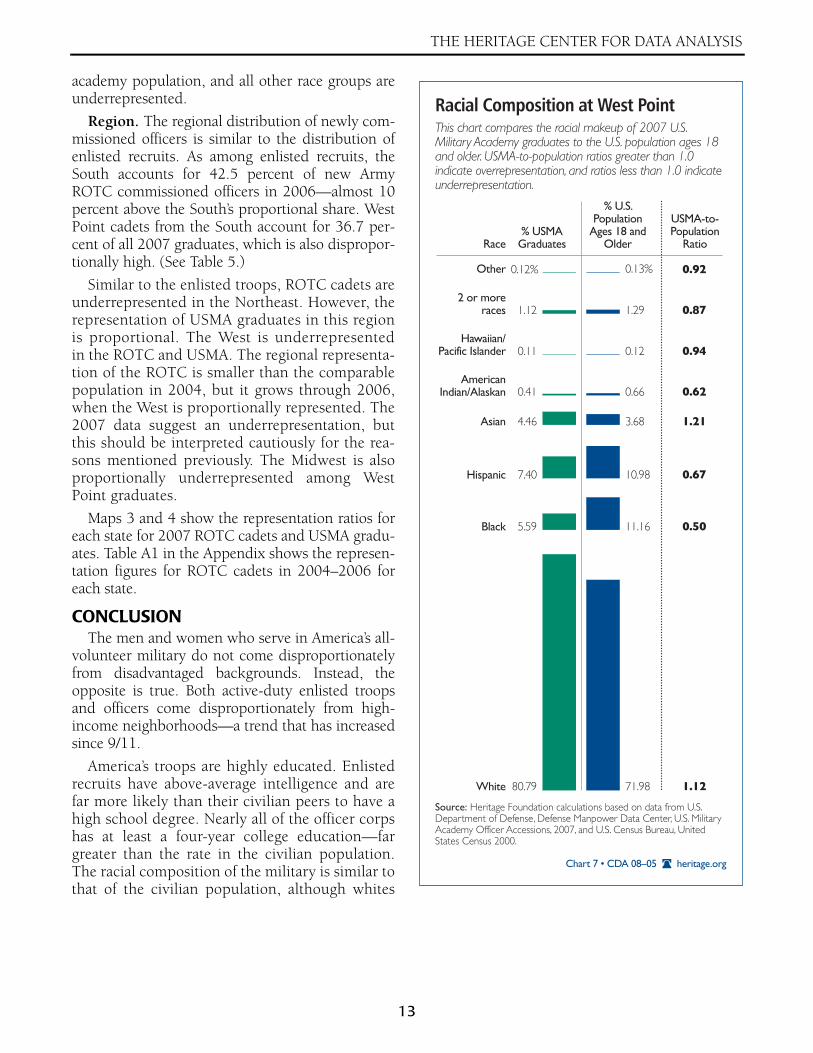
The data on cadets attending West Point do notinclude information on race, so race was imputedusing census tract demographic information foreach cadet’s home of record. The race representationat the census tract level was computed using Census2000 data for the population 18 and older. Chart 7reports the race results for the census tracts with atleast one USMA cadet along with the overallobserved percentage of adults ages 18 and older byrace category. Based on census tract informationfrom the decennial census, white and Asian demo-graphic groups are overrepresented in the military
heritage.orgTable 4 • CDA 08–05
Racial Composition of ROTC CommissionsRacial groups with recruit-to-population ratios greater than 1.0 are overrepresented, and groups with ratios less than 1.0 are underrepresented.
* Comparable populations. For 2004 through 2006, the comparable population is 18–27-year-old males of the same race with at least a college education. For 2007, the comparable population is 18–27-year-old males of the same race in 2006 with at least some college education.** Includes those enrolled and commissioned. Ratios for 2007 were calculated using estimated population data from 2006.
Sources: U.S. Department of Defense, Defense Manpower Data Center, ROTC Commissions, 2004–2006, and 2007 ROTC Cadets and Commissions as of March 27, 2007, and Steven Ruggles, Matthew Sobek, Trent Alexander, Catherine A. Fitch, Ronald Goeken, Patricia Kelly Hall, Miriam King, and Chad Ronnander, Integrated Public Use Microdata Series: Version 4.0, University of Minnesota, Minnesota Population Center, 2008, at http://usa.ipums.org/usa (July 21, 2008).
% U.S. Population*
% ROTC CommissionsRatio
0.229.676.51
75.131.68
93.206.80
RaceAmerican Indian/AlaskaAsian/Pacific IslanderBlack or African AmericanWhiteOther
Hispanic IndicatorNot HispanicHispanic
0.234.47
12.2173.372.84
93.106.90
1.050.461.880.981.69
1.001.01
2004
% U.S. Population*
% ROTC CommissionsRatio
0.319.826.83
73.751.48
92.207.80
0.574.98
11.0872.712.82
92.177.83
1.840.511.620.991.91
1.001.00
2005
% U.S. Population*
% ROTC CommissionsRatio
0.2810.056.94
73.481.5
92.267.74
0.425.06
10.0274.522.37
92.407.60
1.500.501.441.011.58
1.000.98
2006
% U.S. Population*
% ROTC CommissionsRatio
0.505.739.96
70.181.89
88.2711.73
0.594.93
12.0471.892.58
92.027.98
1.180.861.211.021.37
1.040.68
2007**
13
THE HERITAGE CENTER FOR DATA ANALYSIS
academy population, and all other race groups areunderrepresented.
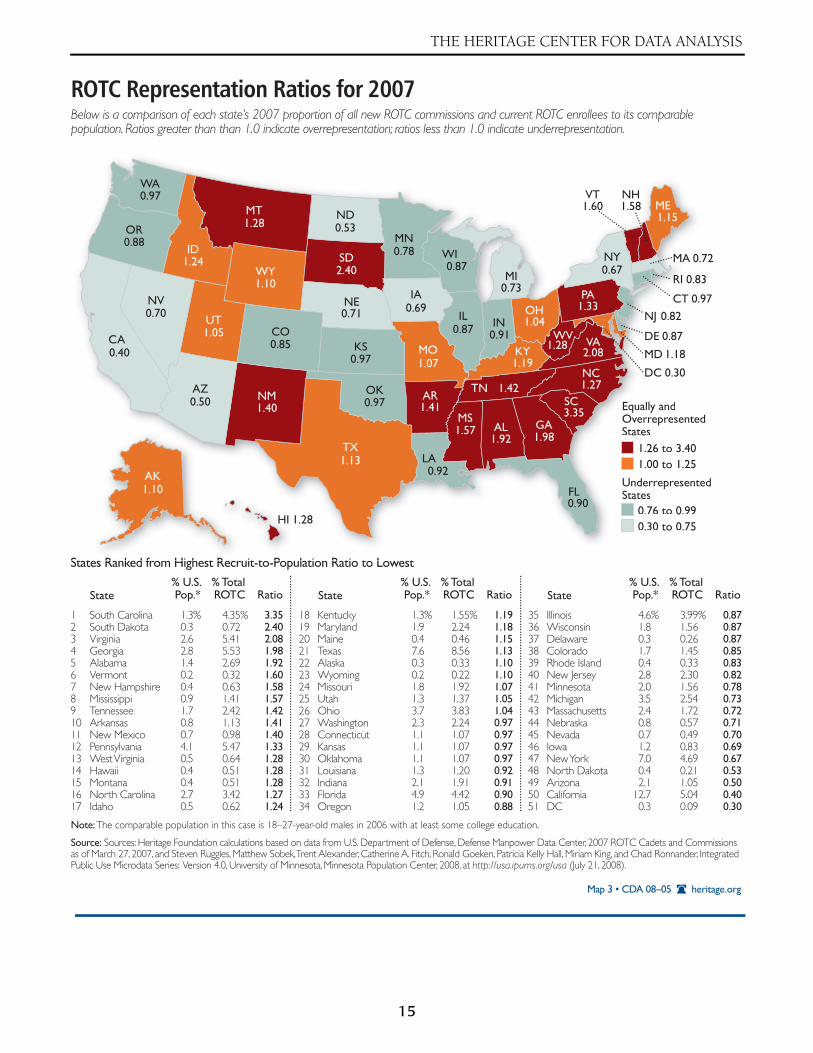
Region. The regional distribution of newly com-missioned officers is similar to the distribution ofenlisted recruits. As among enlisted recruits, theSouth accounts for 42.5 percent of new ArmyROTC commissioned officers in 2006—almost 10percent above the South’s proportional share. WestPoint cadets from the South account for 36.7 per-cent of all 2007 graduates, which is also dispropor-tionally high. (See Table 5.)
Similar to the enlisted troops, ROTC cadets areunderrepresented in the Northeast. However, therepresentation of USMA graduates in this regionis proportional. The West is underrepresentedin the ROTC and USMA. The regional representa-tion of the ROTC is smaller than the comparablepopulation in 2004, but it grows through 2006,when the West is proportionally represented. The2007 data suggest an underrepresentation, butthis should be interpreted cautiously for the rea-sons mentioned previously. The Midwest is alsoproportionally underrepresented among WestPoint graduates.
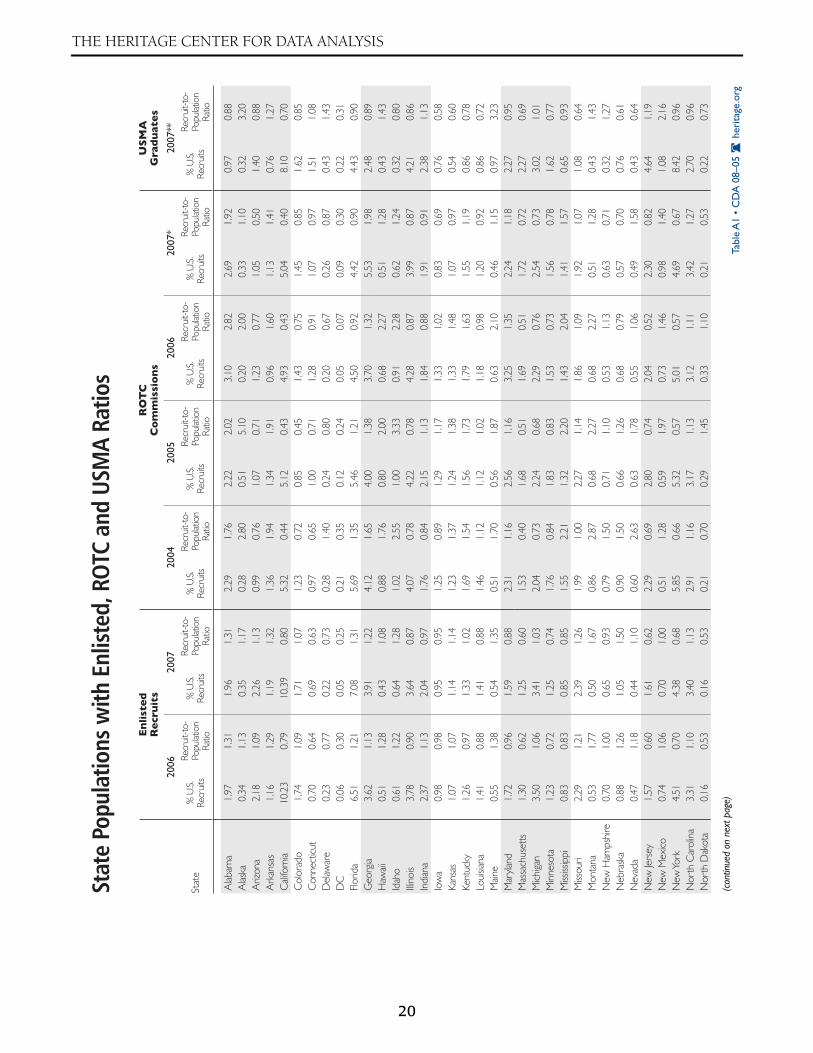
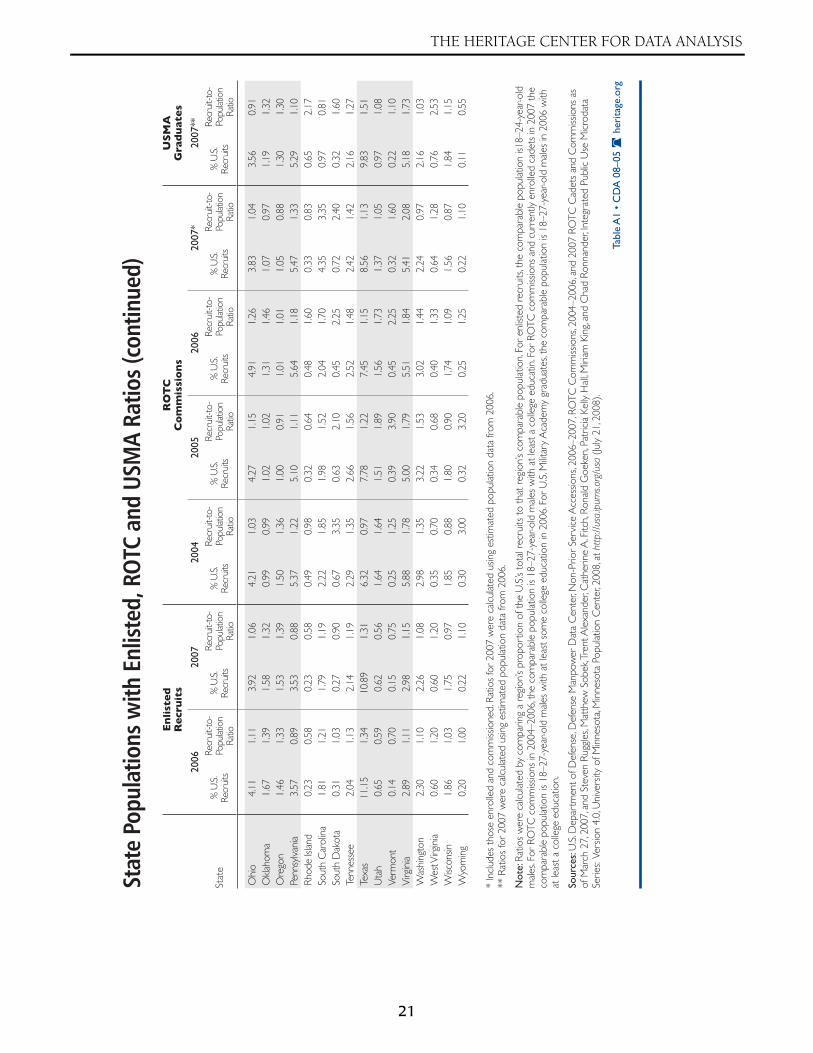
Maps 3 and 4 show the representation ratios foreach state for 2007 ROTC cadets and USMA gradu-ates. Table A1 in the Appendix shows the represen-tation figures for ROTC cadets in 2004–2006 foreach state.
CONCLUSIONThe men and women who serve in America’s all-
volunteer military do not come disproportionatelyfrom disadvantaged backgrounds. Instead, theopposite is true. Both active-duty enlisted troopsand officers come disproportionately from high-income neighborhoods—a trend that has increasedsince 9/11.
America’s troops are highly educated. Enlistedrecruits have above-average intelligence and arefar more likely than their civilian peers to have ahigh school degree. Nearly all of the officer corpshas at least a four-year college education—fargreater than the rate in the civilian population.The racial composition of the military is similar tothat of the civilian population, although whites
White
Black
American Indian/Alaskan
Asian
Hawaiian/Pacific Islander
Hispanic
Other
2 or more races
Race
1.12
0.50
0.62
1.21
0.94
0.67
0.92
71.98
11.16
0.66
3.68
0.12
10.98
0.13%
1.29
80.79
5.59
0.41
4.46
0.11
7.40
0.12%
1.12 0.87
heritage.orgChart 7 • CDA 08–05
Racial Composition at West PointThis chart compares the racial makeup of 2007 U.S. Military Academy graduates to the U.S. population ages 18 and older. USMA-to-population ratios greater than 1.0 indicate overrepresentation, and ratios less than 1.0 indicate underrepresentation.
Source: Heritage Foundation calculations based on data from U.S. Department of Defense, Defense Manpower Data Center, U.S. Military Academy Officer Accessions, 2007, and U.S. Census Bureau, United States Census 2000.
% U.S. Population
Ages 18 and Older
% USMA Graduates
USMA-to-Population
Ratio

THE HERITAGE CENTER FOR DATA ANALYSIS
14
and blacks are slightly overrepresented amongenlisted recruits.
The popular impression that many soldiers jointhe military because they lack better opportunitiesis wrong. In all likelihood, our soldiers would havehad many lucrative career opportunities in the pri-vate sector. The officers and enlisted men and
women of the armed forces have made sacrifices toserve in the U.S. military.
—Shanea J. Watkins, Ph.D., is Policy Analyst inEmpirical Studies and James Sherk is Bradley Fellow inLabor Policy in the Center for Data Analysis at TheHeritage Foundation.
U.S. CensusRegion and Division
Recruit Percent
Recruit/ Population
RatioRecruit Percent
Recruit/ Population
RatioRecruit Percent
Recruit/ Population
RatioRecruit Percent
Recruit/ Population
RatioRecruit Percent
Recruit/ Population
Ratio
ROTC Commissions USMA
2004 2005 2006 2007* 2007**
heritage.orgTable 5 • CDA 08–05
ROTC and USMA Officer Representation by Geographic RegionOfficer-to-population ratios greater than 1.0 indicate overrepresentation, and ratios less than 1.0 indicate underrepresentation.
* Includes those enrolled and commissioned. Ratios for 2007 were calculated using estimated population data from 2006.** Ratios for 2007 were calculated using estimated population data from 2006.
Note: Ratios were calculated by comparing a region’s proportion of the U.S.’s total recruits to that region’s comparable population. For ROTC commissions in 2004–2006, the comparable population is 18–27-year-old males with at least a college education. For ROTC commissions and currently enrolled cadets in 2007 the comparable population is 18–27-year-old males with at least some college education in 2006. For U.S. Military Academy graduates, the comparable population is 18–27-year-old males in 2006 with at least a college education.
Sources: U.S. Department of Defense, Defense Manpower Data Center, ROTC Commissions, 2004–2006, and 2007 ROTC Cadets and Commissions as of March 27, 2007, and Steven Ruggles, Matthew Sobek, Trent Alexander, Catherine A. Fitch, Ronald Goeken, Patricia Kelly Hall, Miriam King, and Chad Ronnander, Integrated Public Use Microdata Series: Version 4.0, University of Minnesota, Minnesota Population Center, 2008, at http://usa.ipums.org/usa (July 21, 2008).
Northeast 18.04% 0.77 17.88% 0.76 17.74% 0.75 16.97% 0.90 24.30% 1.03Middle Atlantic 13.51 0.81 13.22 0.75 12.68 0.72 12.46 0.89 18.36 1.05New England 4.53 0.68 4.66 0.78 5.06 0.84 4.51 0.92 5.94 0.99
Midwest 21.93 0.92 22.90 0.97 22.57 1.00 20.74 0.89 20.30 0.90East North Central 13.93 0.85 14.68 0.90 15.05 0.97 13.84 0.88 15.01 0.97West North Central 8.00 1.07 8.22 1.11 7.52 1.06 6.89 0.91 5.29 0.75
South 41.92 1.33 41.90 1.33 42.50 1.32 46.42 1.39 36.72 1.14East South Central 7.82 1.63 7.76 1.85 8.83 1.92 8.08 1.55 4.64 1.01South Atlantic 23.96 1.40 22.88 1.28 22.77 1.24 26.37 1.52 19.44 1.06West South Central 10.13 1.07 11.27 1.21 10.90 1.18 11.98 1.10 12.63 1.37
West 18.11 0.85 17.32 0.82 17.19 0.79 15.87 0.65 18.68 0.86Mountain 7.15 1.32 6.66 1.15 7.35 1.13 6.70 0.89 6.37 0.98Pacific 10.96 0.69 10.66 0.69 9.84 0.65 9.17 0.54 12.31 0.82
15
THE HERITAGE CENTER FOR DATA ANALYSIS
0.870.870.870.850.830.820.780.730.720.710.700.690.670.530.500.400.30
1.191.181.151.131.101.101.071.051.040.970.970.970.970.920.910.900.88
3.352.402.081.981.921.601.581.571.421.411.401.331.281.281.281.271.24
States Ranked from Highest Recruit-to-Population Ratio to Lowest
South CarolinaSouth DakotaVirginiaGeorgiaAlabamaVermontNew HampshireMississippiTennesseeArkansasNew MexicoPennsylvaniaWest VirginiaHawaiiMontanaNorth CarolinaIdaho
KentuckyMarylandMaineTexasAlaskaWyomingMissouriUtahOhioWashingtonConnecticutKansasOklahomaLouisianaIndianaFloridaOregon
State State StateRatio% U.S. Pop.*
% Total ROTC Ratio
% U.S. Pop.*
% Total ROTC Ratio
% U.S. Pop.*
% Total ROTC
IllinoisWisconsinDelawareColoradoRhode IslandNew JerseyMinnesotaMichiganMassachusettsNebraskaNevadaIowaNew YorkNorth DakotaArizonaCaliforniaDC
1234567891011121314151617
1819202122232425262728293031323334
3536373839404142434445464748495051
4.35% 0.72 5.41 5.53 2.69 0.32 0.63 1.41 2.42 1.13 0.98 5.47 0.64 0.51 0.51 3.42 0.62
1.55% 2.24 0.46 8.56 0.33 0.22 1.92 1.37 3.83 2.24 1.07 1.07 1.07 1.20 1.91 4.42 1.05
3.99% 1.56 0.26 1.45 0.33 2.30 1.56 2.54 1.72 0.57 0.49 0.83 4.69 0.21 1.05 5.04 0.09
4.6% 1.8 0.3 1.7 0.4 2.8 2.0 3.5 2.4 0.8 0.7 1.2 7.0 0.4 2.1 12.7 0.3
1.3% 1.9 0.4 7.6 0.3 0.2 1.8 1.3 3.7 2.3 1.1 1.1 1.1 1.3 2.1 4.9 1.2
1.3% 0.3 2.6 2.8 1.4 0.2 0.4 0.9 1.7 0.8 0.7 4.1 0.5 0.4 0.4 2.7 0.5
Equally andOverrepresentedStates
UnderrepresentedStates
1.26 to 3.401.00 to 1.25
0.76 to 0.990.30 to 0.75
heritage.orgMap 3 • CDA 08–05
ROTC Representation Ratios for 2007Below is a comparison of each state’s 2007 proportion of all new ROTC commissions and current ROTC enrollees to its comparable population. Ratios greater than than 1.0 indicate overrepresentation; ratios less than 1.0 indicate underrepresentation.
Source: Sources: Heritage Foundation calculations based on data from U.S. Department of Defense, Defense Manpower Data Center, 2007 ROTC Cadets and Commissions as of March 27, 2007, and Steven Ruggles, Matthew Sobek, Trent Alexander, Catherine A. Fitch, Ronald Goeken, Patricia Kelly Hall, Miriam King, and Chad Ronnander, Integrated Public Use Microdata Series: Version 4.0, University of Minnesota, Minnesota Population Center, 2008, at http://usa.ipums.org/usa (July 21, 2008).
Note: The comparable population in this case is 18–27-year-old males in 2006 with at least some college education.
St t R k d f Hi h t R it t P l ti R ti t L t
Equally andOverrepresentedStates
UnderrepresenteStates
1.26 to 3.401.00 to 1.25
0.76 to 0.990.30 to 0.75
1.10
1.28
0.87
0.971.60
2.08
1.05
1.13
1.42
2.40
3.35
0.83
1.33
0.88
0.97
1.04
0.67
0.70
1.40
0.82
1.58
0.71
0.53
1.27
1.28
1.57
1.07
0.78
0.73
1.15
1.18
0.72
0.92
1.190.97
0.910.87
1.24
0.69
1.28
1.98
0.90
0.87
0.30
0.97
0.850.40
0.50 1.41
1.10
1.92
WY
WV
WI
WAVT
VA
UT
TX
TN
SD
SC
RIPA
OR
OK
OH
NY
NV
NM
NJ
NH
NE
ND
NC
MT
MS
MO
MN
MI
ME
MD
MA
LA
KYKS
INIL
ID
IA
HI
GA
FL
DE
DC
CT
COCA
AZ AR
AK
AL

THE HERITAGE CENTER FOR DATA ANALYSIS
16
States Ranked from Highest Recruit-to-Population Ratio to Lowest
MaineAlaskaWest VirginiaRhode IslandNew MexicoVirginiaSouth DakotaTexasDelawareHawaiiMontanaOklahomaOregonTennesseeArkansasNebraskaNew Jersey
WisconsinIndianaPennsylvaniaVermontConnecticutUtahWashingtonMichiganNorth CarolinaNew YorkMarylandMississippiOhioFloridaGeorgiaAlabamaArizona
State State StateRatio% U.S. Pop.*
% Total Enlisted Ratio
% U.S. Pop.*
% Total Enlisted Ratio
% U.S. Pop.*
% Total Enlisted
IllinoisColoradoSouth CarolinaIdahoKentuckyMinnesotaNorth DakotaLouisianaCaliforniaMassachusettsNew HampshireMissouriNevadaKansasIowaWyomingDC
1234567891011121314151617
1819202122232425262728293031323334
3536373839404142434445464748495051
0.97% 0.32 0.76 0.65 1.08 5.18 0.32 9.83 0.43 0.43 0.43 1.19 1.30 2.16 0.76 0.76 4.64
1.84% 2.38 5.29 0.22 1.51 0.97 2.16 3.02 2.70 8.42 2.27 0.65 3.56 4.43 2.48 0.97 1.40
4.21% 1.62 0.97 0.32 0.86 1.62 0.22 0.86 8.10 2.27 0.32 1.08 0.43 0.54 0.76 0.11 0.22
4.9% 1.9 1.2 0.4 1.1 2.1 0.3 1.2 11.6 3.3 0.5 1.7 0.7 0.9 1.3 0.2 0.7
1.6% 2.1 4.8 0.2 1.4 0.9 2.1 3.0 2.8 8.8 2.4 0.7 3.9 4.9 2.8 1.1 1.6
0.3% 0.1 0.3 0.3 0.5 3.0 0.2 6.5 0.3 0.3 0.3 0.9 1.0 1.7 0.6 0.6 3.9
0.860.850.810.800.780.770.730.720.700.690.640.640.610.600.580.550.31
1.151.131.101.101.081.081.031.010.960.960.950.930.910.900.890.880.88
3.233.202.532.172.161.731.601.511.431.431.431.321.301.271.271.271.19
Equally andOverrepresentedStates
UnderrepresentedStates
1.26 to 3.251.00 to 1.25
0.76 to 0.990.30 to 0.75
heritage.orgMap 4 • CDA 08–05
U.S. Military Academy Representation Ratios for 2007Below is a comparison of each state’s proportion of 2007 USMA graduates to it comparable population. Ratios greater than 1.0 indicate overrepresentation, and ratios less than 1.0 indicate underrepresentation.
Source: Heritage Foundation calculations based on data from U.S. Department of Defense, Defense Manpower Data Center, U.S. Military Academy Officer Accessions, 2007, and Steven Ruggles, Matthew Sobek, Trent Alexander, Catherine A. Fitch, Ronald Goeken, Patricia Kelly Hall, Miriam King, and Chad Ronnander, Integrated Public Use Microdata Series: Version 4.0, University of Minnesota, Minnesota Population Center, 2008, at http://usa.ipums.org/usa (July 21, 2008).
Note: The comparable population in this case is 18–27-year-old males in 2006 with at least a college education.
Equally andOverrepresentedStates
UnderrepresenteStates
1.26 to 3.251.00 to 1.25
0.76 to 0.990.30 to 0.75
0.55
2.53
1.15
1.031.10
1.73
1.08
1.51
1.27
1.60
0.81
2.17
1.10
1.30
1.32
0.91
0.96
0.61
2.16
1.19
0.64
1.27
0.73
0.96
1.43
0.93
0.64
0.77
1.01
3.23
0.95
0.69
0.72
0.780.60
1.130.86
0.80
0.58
1.43
0.89
0.90
1.43
0.31
1.08
0.850.70
0.88 1.27
3.20
0.88
WY
WV
WI
WAVT
VA
UT
TX
TN
SD
SC
RIPA
OR
OK
OH
NY
NV
NM
NJ
NH
NE
ND
NC
MT
MS
MO
MN
MI
ME
MD
MA
LA
KYKS
INIL
ID
IA
HI
GA
FL
DE
DC
CT
COCA
AZ AR
AK
AL

17
THE HERITAGE CENTER FOR DATA ANALYSIS
TECHNICAL APPENDIX
This paper uses data on enlisted personnel andofficers and cadets in the Army Reserve OfficersTraining Corps (ROTC) and United States MilitaryAcademy (USMA) at West Point. The data were pro-vided by the Defense Manpower Data Center at therequest of The Heritage Foundation. The troop dataincluded the full home-of-record address for eachrecruit, which was used to merge the data withdemographic data at the census tract level from theCensus Bureau. Analysis of the data on enlisted per-sonnel focuses on the demographic characteristicsof troops who reported no previous military service(non–prior service accessions).
The analysis presented here updates a previousHeritage Foundation paper with data on U.S.enlisted recruits during 2006 and 2007.15 In addi-tion, it presents some new analysis on military offic-ers based on data from 2004–2007 Army ROTCprograms and 2007 data on officer commissionsfrom the USMA (West Point).
Populations were compared using data fromCensus 2000; the 2006 American Community Sur-vey (ACS); and the Integrated Public Use MicrodataSeries (IPUMS).16 All analyses at the census tractlevel used data from the 2000 Census because theseare the most recent census tract data available. Sta-tistics reported at the national or state level used2006 ACS data or IPUMS data. Since the majority ofnew enlisted recruits are between the ages of 18 and24,17 comparisons to the general population usingCensus, ACS, or IPUMS data were made using thisage group when possible.
Recruit DataThe recruitment data from the U.S. Department
of Defense consist of three sets of data: recentenlisted accessions, commissioned officers from andcurrent participants in the Army ROTC, and recentgraduates from West Point. The enlisted data covertwo years of recruits: non–prior service enlistedaccessions from October 2005–September 2006(2006 data) and from October 2006–September2007 (2007 data). The 2006 data cover 166,299
recruits, and the 2007 data cover 158,069 recruits.Each recruit record includes full address informa-tion, race, Hispanic ethnicity, and educationalcodes. The data include accessions for the Army,Navy, Marine Corps, and Air Force.
The analysis presented in this paper considersonly the demographic characteristics of the active-duty component of the military. Data on the Reserveand National Guard recruits were not included.
The Army ROTC data cover four years of ROTCcadets, including officers commissioned in 2004,2005, and 2006 and those commissioned as ofMarch 27, 2007. The data also include informationon all cadets participating in the ROTC in 2007.The data on 2007 commissioned officers and cur-rent ROTC participants were combined into onegroup for purposes of analysis. There were 4,408officer accessions in 2004, 4,178 in 2005, and4,050 in 2006. As of March 2007, there were 675officer accessions, and 25,789 cadets were partici-pating in the ROTC, bringing the ROTC populationsize for 2007 data to 26,464 cadets. Similar to theenlisted data, the ROTC data included each cadet’sfull address, race, and Hispanic ethnicity.
The USMA data cover officer commissions fromWest Point in 2007. In 2007, 1,011 officers werecommissioned from West Point, and the datainclude each cadet’s home-of-record address.
Race DataCensus race categories allow for any combination
of six races (American Indian or Alaskan Native,Asian, Native Hawaiian or Pacific Islander, black orAfrican–American, white, and other). The data onenlisted personnel include race categories thatreflected census coding. The ROTC data includedone category for Asian. The census categories forAsian and Hawaiian and Pacific Islander were com-bined in order to compare the ROTC Asian categoryto the general population.
The enlisted, ROTC, and census data also includeHispanic ethnicity indicators, and the race catego-
15. Kane, “Who are the Recruits?”
16. With the exception of the ROTC race analyses, which use data from the 2004, 2005, and 2006 American Community Surveys.
17. The Office of the Under Secretary of Defense for Personnel and Readiness reports that 87 percent of new recruits are between these ages. U.S. Department of Defense, Office of the Under Secretary of Defense, Personnel and Readiness, 2006 Popula-tion Representation in the Military Services, at http://www.defenselink.mil/prhome/PopRep_FY06/download.html (June 10, 2008).
THE HERITAGE CENTER FOR DATA ANALYSIS
18
ries analyzed in this paper identify Hispanics as adistinct race group. Therefore, in this categoriza-tion, all other races (e.g., white, black, and Asian)are represented as non-Hispanic race.
Invalid Recruit AddressesAddress information in each file was used to
match each recruit to his or her census tract usingArcGIS spatial match procedures. In some cases, theprovided address could not be matched to a specificcensus tract because it could not be located in theaddress locator database supplied by Environmen-tal Systems Research Institute (ESRI). This occurredmost often when the address was a post office boxor general delivery location.
These unmatched records were rematched byZip code and randomly assigned to a census tractbased on the five-digit Zip. Any remainingunmatched records were excluded from the analy-sis. Troops with home addresses outside of the 50states and the District of Columbia were excludedfrom the analysis.
Census DataThe census data methodology used in this paper
is similar to the methodology used in previous Her-itage Foundation reports on troop demographics.18
Data were taken from the United States Census2000, Summary File 1 and Summary File 3, and theUnited States Census 2004, 2005, and 2006 ACS.The data from Summary File 1 are collected for thewhole population, and Summary File 3 and the2004 ACS contain estimates from sample data.
Income analysis for all recruit years used datafrom Census 2000, Summary File 3, Table P53(Median Household Income). More recent data bycensus tract are not publicly available.
Educational analysis for the recruit cohorts useddata for the population ages 18–24 from the 2006ACS Summary File 3, Table PCT25 (Sex by Age byEducational Attainment for the Population 18 Yearsand Over), and used the age breakdown in this tableto focus on the population ages 18–24.
Race analysis for the 2004 and 2005 recruitcohorts used data based on the authors’ calculationsbased on data from the 2004 through 2006 IPUMSdata to assess proportionality on a national level,not by census tract.
The regional analysis used data based on theauthors’ calculations from the 2004 through 2006IPUMS data to assess proportionality at the stateand region levels.
The population count for ages 18–24 refers to theestimate of 27,067,510 for Census 2000. The morerecent sample data in 2006 ACS give a sample-based estimate of 29,700,518 for the populationages 18–24. Summary File 1, which is representa-tive of the whole population for Census 2000,reports the total population 18 years and over as209,128,094. The 2006 ACS race reports a sample-based population estimate of 225,633,342.
Income AnalysisThe recruit data did not include any information
on recruits’ incomes. The average householdincome calculations performed in this paper weredone by assigning each recruit the median house-hold income value in 1999 for his or her censustract. These dollar values were adjusted for inflationand expressed in 2008 dollars. The income analysiswas weighted by the total population ages 18–24 ineach census tract to adjust for uneven populationdistribution among census tracts.
Educational AnalysisThe educational analysis compared educational
attainment of non–prior service enlisted recruits toeducational attainment data of the U.S. male popu-lation ages 18–24 from the 2006 ACS, TableB15001. Due to inconsistencies in the coding of theeducation data supplied by the Defense ManpowerData Center, and in order to match more closely theofficial Department of Defense education statisticson the non–prior service enlisted recruit popula-tion, some educational categories were removedfrom consideration in the educational analysis.
Race Analysis
The race analysis for the enlisted troops com-pared the race distribution of these troops to therace distribution of males 18–24 years old in thegeneral population, calculated using the 2006IPUMS data. Similarly, the ROTC race distribu-tions were compared to race distributions ofmales 18–27 years old with at least a college edu-cation in the general population, using the 2004,2005, and 2006 IPUMS data. The 2007 ROTC
18. Kane, “Who Bears the Burden?” and “Who Are the Recruits?”
19
THE HERITAGE CENTER FOR DATA ANALYSIS
data included information on currently enrolledcadets as well as recent accessions and was com-pared to males 18–27 years old with at least somecollege education using the 2006 IPUMS data.The 2006 data are the most recent available andwere used as the point of comparison for both the2007 enlisted and ROTC data.
Race information for the USMA officer commis-sions was not available. Race analysis for this groupwas conducted by using the race characteristics ofthe census tracts where the cadets lived. Once racewas established using census tract information, thisgroup was compared to the total population 18 andolder using Table P6 from Census 2000 SummaryFile 1.
Regional Analysis
The census region, census division, and statecomparisons in this paper used the authors’ calcula-tions of state population data from the 2004
through 2006 IPUMS. The IPUMS population var-ied depending on the military population beingconsidered.
The population comparison for the 2006 and2007 enlisted active-duty military was done usingcalculations from the 2006 IPUMS data for the malepopulation ages 18 to 24.
The 2004–2006 IPUMS data for males ages 18 to27 with at least a bachelor’s degree were used for thecomparisons of ROTC proportionality for 2004through 2006. The 2006 IPUMS data for males ages18–27 with at least some college education wereused as the relevant comparison population for the2007 ROTC data because these data included grad-uates and currently enrolled ROTC participants.
The 2007 USMA population was compared tocalculated population numbers from the 2006IPUMS for males 18–27 years old with at least acollege education.
THE HERITAGE CENTER FOR DATA ANALYSIS
20
Stat
e Po
pula
tions
with
Enl
iste
d, R
OTC
and
USM
A Ra
tios
Tabl
e A
1 •
CD
A 0
8–05
Tabl
e A
1 •
CD
A 0
8–05
heri
tage
.org
heri
tage
.org
En
list
ed
Re
cru
its
RO
TC
Co
mm
issi
on
sU
SM
AG
rad
uat
es
2006
2007
2004
2005
2006
2007
*20
07**
Stat
e%
U.S
. Re
crui
ts
Recr
uit-t
o-Po
pulat
ion
Ratio
% U
.S.
Recr
uits
Recr
uit-t
o-Po
pulat
ion
Ratio
% U
.S.
Recr
uits
Recr
uit-t
o-Po
pulat
ion
Ratio
% U
.S.
Recr
uits
Recr
uit-t
o-Po
pulat
ion
Ratio
% U
.S.
Recr
uits
Recr
uit-t
o-Po
pulat
ion
Ratio
% U
.S.
Recr
uits
Recr
uit-t
o-Po
pulat
ion
Ratio
% U
.S.
Recr
uits
Recr
uit-t
o-Po
pulat
ion
Ratio
Ala
bam
a1.
971.
311.
961.
312.
291.
762.
222.
023.
102.
822.
691.
920.
970.
88A
lask
a0.
341.
130.
351.
170.
282.
800.
515.
100.
202.
000.
331.
100.
323.
20A
rizon
a2.
181.
092.
261.
130.
990.
761.
070.
711.
230.
771.
050.
501.
400.
88A
rkan
sas
1.16
1.29
1.19
1.32
1.36
1.94
1.34
1.91
0.96
1.60
1.13
1.41
0.76
1.27
Cal
iforn
ia10
.23
0.79
10.3
90.
805.
320.
445.
120.
434.
930.
435.
040.
408.
100.
70C
olor
ado
1.74
1.09
1.71
1.07
1.23
0.72
0.85
0.45
1.43
0.75
1.45
0.85
1.62
0.85
Con
nect
icut
0.70
0.64
0.69
0.63
0.97
0.65
1.00
0.71
1.28
0.91
1.07
0.97
1.51
1.08
Del
awar
e0.
230.
770.
220.
730.
281.
400.
240.
800.
200.
670.
260.
870.
431.
43D
C0.
060.
300.
050.
250.
210.
350.
120.
240.
050.
070.
090.
300.
220.
31Fl
orid
a6.
511.
217.
081.
315.
691.
355.
461.
214.
500.
924.
420.
904.
430.
90G
eorg
ia3.
621.
133.
911.
224.
121.
654.
001.
383.
701.
325.
531.
982.
480.
89H
awai
i0.
511.
280.
431.
080.
881.
760.
802.
000.
682.
270.
511.
280.
431.
43Id
aho
0.61
1.22
0.64
1.28
1.02
2.55
1.00
3.33
0.91
2.28
0.62
1.24
0.32
0.80
Illino
is3.
780.
903.
640.
874.
070.
784.
220.
784.
280.
873.
990.
874.
210.
86In
dian
a2.
371.
132.
040.
971.
760.
842.
151.
131.
840.
881.
910.
912.
381.
13Io
wa
0.98
0.98
0.95
0.95
1.25
0.89
1.29
1.17
1.33
1.02
0.83
0.69
0.76
0.58
Kans
as1.
071.
071.
141.
141.
231.
371.
241.
381.
331.
481.
070.
970.
540.
60Ke
ntuc
ky1.
260.
971.
331.
021.
691.
541.
561.
731.
791.
631.
551.
190.
860.
78Lo
uisia
na1.
410.
881.
410.
881.
461.
121.
121.
021.
180.
981.
200.
920.
860.
72M
aine
0.55
1.38
0.54
1.35
0.51
1.70
0.56
1.87
0.63
2.10
0.46
1.15
0.97
3.23
Mar
yland
1.72
0.96
1.59
0.88
2.31
1.16
2.56
1.16
3.25
1.35
2.24
1.18
2.27
0.95
Mas
sach
uset
ts1.
300.
621.
250.
601.
530.
401.
680.
511.
690.
511.
720.
722.
270.
69M
ichig
an3.
501.
063.
411.
032.
040.
732.
240.
682.
290.
762.
540.
733.
021.
01M
inne
sota
1.23
0.72
1.25
0.74
1.76
0.84
1.83
0.83
1.53
0.73
1.56
0.78
1.62
0.77
Miss
issip
pi0.
830.
830.
850.
851.
552.
211.
322.
201.
432.
041.
411.
570.
650.
93M
issou
ri2.
291.
212.
391.
261.
991.
002.
271.
141.
861.
091.
921.
071.
080.
64M
onta
na0.
531.
770.
501.
670.
862.
870.
682.
270.
682.
270.
511.
280.
431.
43N
ew H
amps
hire
0.70
1.00
0.65
0.93
0.79
1.50
0.71
1.10
0.53
1.13
0.63
0.71
0.32
1.27
Neb
rask
a0.
881.
261.
051.
500.
901.
500.
661.
260.
680.
790.
570.
700.
760.
61N
evad
a0.
471.
180.
441.
100.
602.
630.
631.
780.
551.
060.
491.
580.
430.
64N
ew Je
rsey
1.57
0.60
1.61
0.62
2.29
0.69
2.80
0.74
2.04
0.52
2.30
0.82
4.64
1.19
New
Mex
ico0.
741.
060.
701.
000.
511.
280.
591.
970.
731.
460.
981.
401.
082.
16N
ew Yo
rk4.
510.
704.
380.
685.
850.
665.
320.
575.
010.
574.
690.
678.
420.
96N
orth
Car
olin
a3.
311.
103.
401.
132.
911.
163.
171.
133.
121.
113.
421.
272.
700.
96N
orth
Dak
ota
0.16
0.53
0.16
0.53
0.21
0.70
0.29
1.45
0.33
1.10
0.21
0.53
0.22
0.73
(con
tinue
d on
nex
t pag
e)
21
THE HERITAGE CENTER FOR DATA ANALYSIS
Stat
e Po
pula
tions
with
Enl
iste
d, R
OTC
and
USM
A Ra
tios
(con
tinue
d)
* In
clud
es th
ose
enro
lled
and
com
miss
ione
d. R
atio
s fo
r 20
07 w
ere
calc
ulat
ed u
sing
estim
ated
pop
ulat
ion
data
from
200
6.**
Rat
ios
for
2007
wer
e ca
lcul
ated
usin
g es
timat
ed p
opul
atio
n da
ta fr
om 2
006.
Not
e: R
atio
s w
ere
calc
ulat
ed b
y co
mpa
ring
a re
gion
’s pr
opor
tion
of th
e U
.S.’s
tota
l rec
ruits
to th
at r
egio
n’s
com
para
ble
popu
latio
n. Fo
r en
liste
d re
crui
ts, t
he c
ompa
rabl
e po
pula
tion
is18–
24-y
ear-o
ld
mal
es. F
or R
OTC
com
miss
ions
in 2
004–
2006
, the
com
para
ble
popu
latio
n is
18–2
7-ye
ar-o
ld m
ales
with
at l
east
a c
olle
ge e
duca
tin. F
or R
OTC
com
miss
ions
and
cur
rent
ly e
nrol
led
cade
ts in
200
7 th
e co
mpa
rabl
e po
pula
tion
is 18
–27-
year
-old
mal
es w
ith a
t lea
st s
ome
colle
ge e
duca
tion
in 2
006.
For
U.S
. Milit
ary
Aca
dem
y gr
adua
tes,
the
com
para
ble
popu
latio
n is
18–2
7-ye
ar-o
ld m
ales
in 2
006
with
at
leas
t a c
olle
ge e
duca
tion.
Sour
ces:
U.S
. Dep
artm
ent o
f Def
ense
, Def
ense
Man
pow
er D
ata
Cen
ter,
Non
-Prio
r Se
rvic
e A
cces
sions
, 200
6–20
07, R
OTC
Com
miss
ions
, 200
4–20
06, a
nd 2
007
ROTC
Cad
ets
and
Com
miss
ions
as
of M
arch
27,
200
7, a
nd S
teve
n Ru
ggle
s, M
atth
ew S
obek
, Tre
nt A
lexa
nder
, Cat
herin
e A
. Fitc
h, Ro
nald
Goe
ken,
Patr
icia
Kel
ly H
all, M
iriam
Kin
g, an
d C
had
Ronn
ande
r, In
tegr
ated
Pub
lic U
se M
icro
data
Se
ries:
Ver
sion
4.0,
Uni
vers
ity o
f Min
neso
ta, M
inne
sota
Pop
ulat
ion
Cen
ter,
2008
, at h
ttp://
usa.
ipum
s.org
/usa
(Ju
ly 2
1, 2
008)
.
Tabl
e A
1 •
CD
A 0
8–05
Tabl
e A
1 •
CD
A 0
8–05
heri
tage
.org
heri
tage
.org
En
list
ed
Re
cru
its
RO
TC
Co
mm
issi
on
sU
SM
AG
rad
uat
es
2006
2007
2004
2005
2006
2007
*20
07**
Stat
e%
U.S
. Re
crui
ts
Recr
uit-t
o-Po
pulat
ion
Ratio
% U
.S.
Recr
uits
Recr
uit-t
o-Po
pulat
ion
Ratio
% U
.S.
Recr
uits
Recr
uit-t
o-Po
pulat
ion
Ratio
% U
.S.
Recr
uits
Recr
uit-t
o-Po
pulat
ion
Ratio
% U
.S.
Recr
uits
Recr
uit-t
o-Po
pulat
ion
Ratio
% U
.S.
Recr
uits
Recr
uit-t
o-Po
pulat
ion
Ratio
% U
.S.
Recr
uits
Recr
uit-t
o-Po
pulat
ion
Ratio
Ohi
o4.
111.
113.
921.
064.
211.
034.
271.
154.
911.
263.
831.
043.
560.
91O
klah
oma
1.67
1.39
1.58
1.32
0.99
0.99
1.02
1.02
1.31
1.46
1.07
0.97
1.19
1.32
Ore
gon
1.46
1.33
1.53
1.39
1.50
1.36
1.00
0.91
1.01
1.01
1.05
0.88
1.30
1.30
Penn
sylv
ania
3.57
0.89
3.53
0.88
5.37
1.22
5.10
1.11
5.64
1.18
5.47
1.33
5.29
1.10
Rhod
e Isl
and
0.23
0.58
0.23
0.58
0.49
0.98
0.32
0.64
0.48
1.60
0.33
0.83
0.65
2.17
Sout
h C
arol
ina
1.81
1.21
1.79
1.19
2.22
1.85
1.98
1.52
2.04
1.70
4.35
3.35
0.97
0.81
Sout
h D
akot
a0.
311.
030.
270.
900.
673.
350.
632.
100.
452.
250.
722.
400.
321.
60Te
nnes
see
2.04
1.13
2.14
1.19
2.29
1.35
2.66
1.56
2.52
1.48
2.42
1.42
2.16
1.27
Texa
s11
.15
1.34
10.8
91.
316.
320.
977.
781.
227.
451.
158.
561.
139.
831.
51U
tah
0.65
0.59
0.62
0.56
1.64
1.64
1.51
1.89
1.56
1.73
1.37
1.05
0.97
1.08
Verm
ont
0.14
0.70
0.15
0.75
0.25
1.25
0.39
3.90
0.45
2.25
0.32
1.60
0.22
1.10
Virg
inia
2.89
1.11
2.98
1.15
5.88
1.78
5.00
1.79
5.51
1.84
5.41
2.08
5.18
1.73
Was
hing
ton
2.30
1.10
2.26
1.08
2.98
1.35
3.22
1.53
3.02
1.44
2.24
0.97
2.16
1.03
Wes
t Virg
inia
0.60
1.20
0.60
1.20
0.35
0.70
0.34
0.68
0.40
1.33
0.64
1.28
0.76
2.53
Wisc
onsin
1.86
1.03
1.75
0.97
1.85
0.88
1.80
0.90
1.74
1.09
1.56
0.87
1.84
1.15
Wyo
min
g0.
201.
000.
221.
100.
303.
000.
323.
200.
251.
250.
221.
100.
110.
55