Embed Size (px)
Citation preview

Chapter 7Whole-brain atrophy rate and CSF biomarker levels
in MCI and AD: a longitudinal study
Neurobiology of Aging 2010
J.D. SluimerF.H. BouwmanH. VrenkenM.A. BlankensteinF. BarkhofW.M. van der FlierPh. Scheltens
124
Chapter 7
AbstractObjectives: To assess associations between cerebrospinal fluid (CSF) biomarker
levels and MRI-based whole-brain atrophy rate in mild cognitive impairment
(MCI) and Alzheimer’s disease (AD).
Methods: We included 99 patients (47 AD, 29 MCI, 23 controls) who
underwent lumbar puncture at baseline and repeat MRI. A subgroup of 48
patients underwent a second lumbar puncture. CSF levels of beta-amyloid1-42
(Aß1-42
), tau and tau phosphorylated at threonine-181 (P-tau181
), and whole-
brain atrophy rate were measured.
Results: Across groups, baseline Aß1-42
and tau were modestly associated with
whole-brain atrophy rate. Adjusted for age, sex and diagnosis, we found no
association between Aß1-42
or tau, and whole-brain atrophy rate. By contrast,
high CSF levels of P-tau181
showed a mild association with a lower whole-brain
atrophy rate in AD but not in controls or MCI patients. Finally, whole-brain
atrophy rate was associated with change in MMSE, but change in CSF biomarker
levels was not.
Conclusions: Whole-brain atrophy rate and CSF levels of Aß1-42
, tau or P-tau181
provide complementary information in patients with MCI and AD.

125
Longitudinal MRI and CSF biomarkers
IntroductionBoth cerebrospinal fluid biomarkers and magnetic resonance imaging are
increasingly used to detect and characterise brain changes associated with
Alzheimer’s disease in vivo. In CSF, decreased Aß1-42
levels and increased
tau, and P-tau181
levels are thought to reflect the presence of AD pathology.1
These CSF biomarkers have been shown to differentiate patients with AD from
control subjects with reasonable accuracy.37 Moreover, these changes can be
detected in patients with mild cognitive impairment (MCI) who will progress to
AD.2;15 Brain tissue loss (atrophy) secondary to the neurodegenerative disease
process can be visualized and measured using MRI. Whole-brain atrophy rate,
measured from serial MRI, correlates well with disease and clinical progression
in patients with MCI and AD.10;11;18
Although both MRI and CSF biomarkers have been shown to be valuable
markers of disease in MCI and AD36,37, the relation between these markers
has been less well studied. In cross-sectional studies, CSF biomarkers have
been reported not to be related to MRI measures of atrophy, suggesting that
these markers reflect different aspects of Alzheimer type neuropathology.25,26
However, longitudinal studies are needed, to clarify the relationship between
these markers. The few studies that have reported CSF biomarkers and MRI
measures in a longitudinal design, have used relatively small sample sizes,
and have shown conflicting results in terms of whether or not these markers
are associated.7,13,35
The objective of the present investigation was to assess whether MRI measures
and CSF biomarkers are related or provide independent information. We
therefore assessed the relationship between baseline levels of CSF Aß1-42
,
tau, and P-tau181
and whole-brain atrophy rate in patients with AD, MCI, and
controls. In addition, we studied the association between longitudinal change
of these CSF biomarker levels, whole-brain atrophy rates, and change in
cognitive function.
126
Chapter 7
Material and methodsPatientsWe included 47 patients with AD, 29 patients with MCI and 23 controls with
baseline CSF and repeat MRI scans from our memory clinic. All patients
underwent lumbar puncture (LP) at baseline and MRI at baseline and follow
up. At follow-up, 48 patients (20 AD, 17 MCI, 11 controls) agreed to undergo
a second lumbar puncture. Follow-up time was defined as time between the
two MRI scans (mean interval 1.7 years, standard deviation 0.7; range 11m-4y).
Patients underwent a standardized clinical assessment including medical
history, physical and neurological examination, psychometric evaluation,
and brain MRI. The Mini-Mental State Examination (MMSE) was used as a
measure of general cognitive function.9 Diagnoses were established during a
multidisciplinary consensus meeting according to the Petersen criteria for MCI23
and the NINCDS-ADRDA (National Institute of Neurological and Communicative
Diseases and Stroke/Alzheimer’s Disease and Related Disorders Association)
criteria for probable AD.19 The team involved in the diagnostic work-up was
not aware of the results of the CSF analyses or the whole-brain atrophy rates.
The control group consisted of 18 patients who presented to our memory
clinic with subjective complaints, but who –after careful investigation- were
considered to be cognitively normal. Additionally, we included 5 volunteers
without cognitive complaints, who underwent the same diagnostic procedure
as patients attending our memory clinic. The study was approved by the
institutional ethical review board and all subjects gave written informed
consent.
Clinical assessment at follow-upNon-demented subjects (MCI and controls) visited the memory clinic annually
(maximum: 4 visits). Diagnostic classification was re-evaluated at follow-up.
The clinical diagnosis of dementia was determined according to published
consensus criteria.19,21 Within the MCI group, 12 patients remained stable, and
17 progressed to AD19, one to fronto-temporal lobar degeneration (FTLD).21
Within the control group two patients with subjective complaints progressed
to MCI, two to AD and one to FTLD, while 14 controls remained stable. Among
the 48 patients with repeated LP, one control progressed to MCI (10 remained
stable), and 11 patients with MCI progressed to AD, while 6 remained stable.
The two patients converting to FTLD were excluded from analysis, leaving a
sample size of 99 patients.

127
Longitudinal MRI and CSF biomarkers
MRIMR imaging was performed on a 1.0-T Siemens Magnetom Impact Expert
scanner (Siemens AG, Erlangen, Germany) and included coronal T1-weighted
3D MPRAGE volumes (magnetization prepared rapid acquisition gradient echo;
single slab 168 slices; matrix 256x256; FOV 250mm; voxel size 1x1x1.5 mm;
repetition time=15ms; echo time=7ms; inversion time=300ms; flip angle 15°).
All subjects included had two scans of adequate quality, performed on the
same scanner using an identical imaging protocol. Scans were reviewed by
a radiologist to exclude non-neurodegenerative pathology that could explain
the cognitive impairment. Scans that fulfilled radiological criteria of the NINDS-
AIREN for vascular dementia were excluded.32
Whole-brain atrophy rates were measured with SIENA (Structural Image
Evaluation, using Normalisation, of Atrophy), a fully automated technique part
of FSL (for a detailed explanation see: www.fmrib.ox.ac.uk/analysis/research/
siena).31 Briefly, the brain was extracted using the brain extraction tool.30
Compared to standard SIENA, the procedure to remove non-brain tissue was
slightly modified, because the brain extraction tool often leaves significant
amounts of non-brain tissue (e.g. skull, meninges), while also removing
cortex in some areas.16 To remove all non-brain tissue without losing cortex,
we incorporated in the procedure the registration of a template mask to the
individual scans. After this modified brain extraction procedure, the standard
SIENA pipeline was continued. Using affine registration, the two scans were
resampled in a common space to allow the change analysis. The skull was used
as a scaling constraint in this step, in order to prevent the registration from
introducing differences in head size between the two time points. The change
analysis was then performed by applying automated tissue type segmentation,
identifying edge points between brain tissue and other substances, and then
estimating the perpendicular motion of the brain edge at these edge points.
Finally, the average edge motion was converted to a percentage brain volume
change (PBVC) between the two time points. For SIENA, an error of 0.15 to
0.20% on the PBVC scale has been reported.31 All individual scans, registration
results, and SIENA output were reviewed by a rater who was blinded to the
diagnosis.

128
Chapter 7
CSFCSF was obtained by LP between the L3/L4 or L4/L5 intervertebral space,
using a 25-gauge needle, and collected in 12-mL polypropylene tubes. Within
two hours, CSF samples were centrifuged at 2100g for 10 minutes at 4˚C.
A small amount of CSF was used for routine analysis, including total cells
(leucocytes and erythrocytes), total protein and glucose. CSF was aliquoted in
polypropylene tubes of 0.5 or 1 ml, and stored at -80˚C until further analysis.
CSF Aß1-42
, tau and P-tau181
were measured as described previously.3 The intra-
assay coefficient of variation (CV) was 2.8% for Aß1-42
, 3.7% for tau and 1.6%
for P-tau181
. The inter-assay coefficient of variation (CV) was 13.5% for Aß1-42
,
10.2% for tau and 12.8% for P-tau181
. To circumvent inter-assay variability,
baseline and follow-up samples were run in the same assay at the time of the
second spinal tap.4
StatisticsStatistical analysis was performed with SPSS 12.0 (2003, Chicago, IL). Whole-
brain atrophy rate (PBVC), change in CSF biomarker levels, and change in
MMSE over time were annualized by dividing by the time interval in years.
A more negative whole-brain atrophy rate represents a larger relative brain
volume loss per year. CSF biomarker levels were log-transformed. Frequency
distributions for sex were compared with chi-squared tests. One way Analysis
of Variance (ANOVA) adjusted for age and sex, with post hoc Bonferroni tests
was used to compare continuous variables between the diagnostic groups.
To assess associations between baseline CSF biomarker levels and whole-
brain atrophy rate, we first calculated Pearson’s correlations across the whole
group. We then used linear regression analyses with baseline CSF biomarkers
as independent variables, and whole-brain atrophy rate as dependent variable.
We used three models, one for each CSF biomarker. Age, sex and diagnosis
(using dummy variables) were entered as covariates. To check if associations
with CSF biomarker levels differed according to diagnostic group, interaction
terms (dummy-diagnosis * CSF biomarker) were included in the model. If there
was a significant interaction between diagnosis and CSF biomarker (p≤0.05),
ß[SE] are displayed for each diagnostic group separately. When no significant
interaction was found, the overall ß is reported. Finally, associations between

129
Longitudinal MRI and CSF biomarkers
annualized whole-brain atrophy rate, annualized change in CSF biomarker
levels, and annualized change in MMSE score were assessed using bivariate
correlations (available for 46 patients).
ResultsDemographic and clinical data are presented by patient group in Table 1. MCI
patients were older when compared to AD patients. We found no difference in
sex or follow-up time. Annualized whole-brain atrophy rate differed between
diagnostic groups (p<0.001). We also found group differences for baseline Aß1-
42 (p<0.001), tau, and P-tau
181 (both p<0.01). By contrast, annualized change in
CSF c, tau, and P-tau181
levels over time did not differ between patient groups
(all p>0.49).
To investigate associations between baseline CSF levels of Aß1-42
, tau, and
P-tau181
and whole-brain atrophy rate, we first performed bivariate correlations
across the whole sample, as shown in Figure 1. Lower baseline CSF levels
of Aß1-42
(r=0.36, p<0.001) and higher tau levels (r=-0.27, p<0.01) were
associated with a higher whole-brain atrophy rate, while CSF P-tau181
levels
were not (r=-0.16, p=0.10). After adjustment for age, sex, and diagnosis in
linear regression analyses we found no association between Aß1-42
and whole-
brain atrophy rate (ß[SE] 0.34[0.26], p=0.19). The interaction terms for CSF
biomarker and diagnosis were significant for tau (p=0.02) and P-tau181
(p=0.02),
implying that associations of these CSF biomarkers and whole-brain atrophy
rate were different for the diagnostic groups. In the control group there was
a trend for increased tau to be associated with a higher whole-brain atrophy
rate (ß[SE] -0.62 [0.32], p=0.06), however after exclusion of the two patients
who progressed to AD the effect disappeared. Furthermore, this effect was not
observed in MCI (ß[SE] -0.39 [0.33], p=0.24), or AD (ß[SE] 0.43 [0.27], p=0.11).
By contrast, increased P-tau181
levels were associated with a lower whole-brain
atrophy rate (ß[SE] 0.78 [0.35], p=0.03) in the AD group. The effects in the
control group (ß[SE] -0.54[0.40], p=0.18) and MCI group (ß[SE] -0.52 [0.40],
p=0.19), though not significant, were in the opposite direction of that in the
AD group.
130
Chapter 7
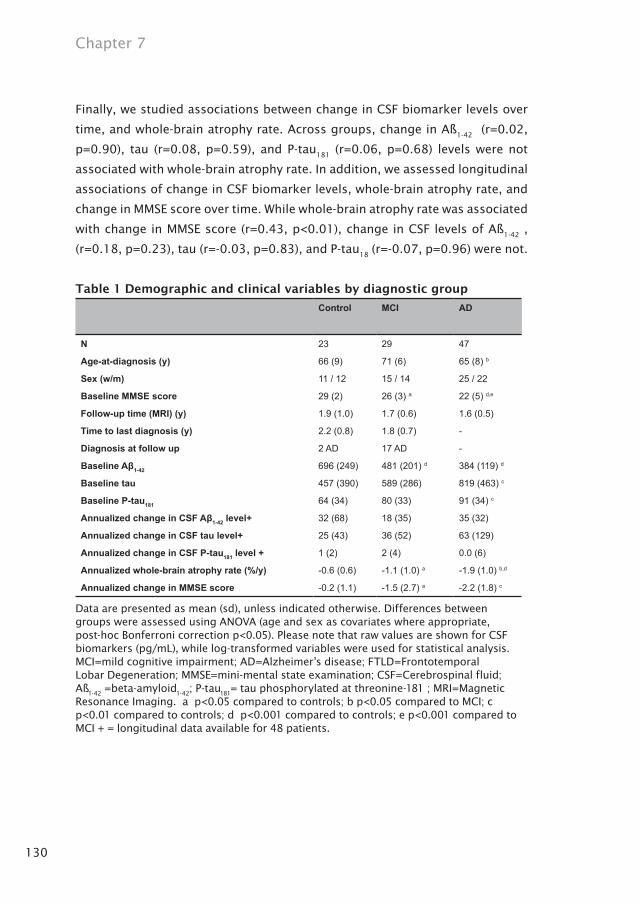
Finally, we studied associations between change in CSF biomarker levels over
time, and whole-brain atrophy rate. Across groups, change in Aß1-42
(r=0.02,
p=0.90), tau (r=0.08, p=0.59), and P-tau181
(r=0.06, p=0.68) levels were not
associated with whole-brain atrophy rate. In addition, we assessed longitudinal
associations of change in CSF biomarker levels, whole-brain atrophy rate, and
change in MMSE score over time. While whole-brain atrophy rate was associated
with change in MMSE score (r=0.43, p<0.01), change in CSF levels of Aß1-42
,
(r=0.18, p=0.23), tau (r=-0.03, p=0.83), and P-tau18
(r=-0.07, p=0.96) were not.
Table 1 Demographic and clinical variables by diagnostic group
Control MCI AD
N 23 29 47
Age-at-diagnosis (y) 66 (9) 71 (6) 65 (8) b
Sex (w/m) 11 / 12 15 / 14 25 / 22
Baseline MMSE score 29 (2) 26 (3) a 22 (5) d,e
Follow-up time (MRI) (y) 1.9 (1.0) 1.7 (0.6) 1.6 (0.5)
Time to last diagnosis (y) 2.2 (0.8) 1.8 (0.7) -
Diagnosis at follow up 2 AD 17 AD -
Baseline Aβ1-42 696 (249) 481 (201) d 384 (119) d
Baseline tau 457 (390) 589 (286) 819 (463) c
Baseline P-tau181 64 (34) 80 (33) 91 (34) c
Annualized change in CSF Aβ1-42 level+ 32 (68) 18 (35) 35 (32)
Annualized change in CSF tau level+ 25 (43) 36 (52) 63 (129)
Annualized change in CSF P-tau181 level + 1 (2) 2 (4) 0.0 (6)
Annualized whole-brain atrophy rate (%/y) -0.6 (0.6) -1.1 (1.0) a -1.9 (1.0) b,d
Annualized change in MMSE score -0.2 (1.1) -1.5 (2.7) a -2.2 (1.8) c
Data are presented as mean (sd), unless indicated otherwise. Differences between groups were assessed using ANOVA (age and sex as covariates where appropriate, post-hoc Bonferroni correction p<0.05). Please note that raw values are shown for CSF biomarkers (pg/mL), while log-transformed variables were used for statistical analysis. MCI=mild cognitive impairment; AD=Alzheimer’s disease; FTLD=Frontotemporal Lobar Degeneration; MMSE=mini-mental state examination; CSF=Cerebrospinal fluid; Aß
1-42 =beta-amyloid
1-42; P-tau
181= tau phosphorylated at threonine-181 ; MRI=Magnetic
Resonance Imaging. a p<0.05 compared to controls; b p<0.05 compared to MCI; c p<0.01 compared to controls; d p<0.001 compared to controls; e p<0.001 compared to MCI + = longitudinal data available for 48 patients.

131
Longitudinal MRI and CSF biomarkers
Figure 1. CSF biomarker levels and annualized whole-brain atrophy rates. Scatter plots of baseline CSF biomarker levels versus annualized whole-brain atrophy rate. (A.) Across diagnostic groups baseline Aß
1-42 levels and whole-brain atrophy
rate were associated (r=0.36, p<0.001). In diagnostic groups no association was found. (B.) Across diagnostic groups tau levels and whole-brain atrophy rate were associated (r=-0.27, p=0.01). In the control group there was a trend for increased tau to be associated with a higher whole-brain atrophy rate (ß[SE] -0.62 [0.32], p=0.06). However, this effect disappeared when the three patients, who progressed to dementia were excluded. (C.) Across diagnostic groups P-tau
181 levels were
not associated (r=-0.16, p=0.10). By contrast, there was a modest effect of an increased P-tau
181 level in the AD group (ß[SE] 0.78
[0.35], p=0.03) being associated with a lower whole-brain atrophy rate.
_ = fit line across groups∆ = controls; □ = MCI; ○ = AD
A B
C

132
Chapter 7
DiscussionThe major finding of this study is that, notwithstanding modest correlations
of baseline CSF biomarker levels and whole-brain atrophy rate across groups,
hardly any association within diagnostic groups was found. Whole-brain
atrophy rate was associated with clinical progression, measured by change
in MMSE score, but longitudinal changes in the CSF biomarker levels were
not. Thus, MRI and CSF biomarkers appear to reflect different aspects of AD:
whole-brain atrophy rate appears to be linked to the clinical progression of the
disease, whereas CSF biomarkers seem to reflect disease state rather than rate
of progression.
Both CSF biomarker levels and atrophy on MRI are used in the diagnostic
work-up of AD.10,36,37 Moreover, both marker types are predictive of dementia
in patients with MCI.2,8,15,17 Previous studies typically report lowered CSF
levels of Aß1-42
, and elevated tau and P-tau, and higher rates of whole brain
atrophy in MCI and AD.1,27 Our study confirms these results, which have been
published previously in overlapping samples, derived from the same memory
clinic population.3,29 Relatively few studies have combined CSF biomarker
levels and atrophy measured from MRI, using a cross-sectional design2,25,26 or
a longitudinal design.7,13,35 Of the longitudinal studies, one study described
positive correlations between baseline CSF biomarkers and change in MRI
measures in a group with a wide variation in cognitive impairment.35 A
second study described the relation between increase in tau phosphorylated
at threonine-231 (P-tau231
) and Aß1-42
and decrease in hippocampal volume
in seven patients with MCI.7 Finally, a study involving 22 AD patients found
high baseline CSF levels of P-tau231
to be associated with a higher rate of
hippocampal atrophy.13 In the present study, however, we were not able to
confirm these findings despite our larger patient sample.
For tau we found an association across groups with, as expected, higher
levels of tau being related to a faster rate of atrophy; however we did not
find this association within diagnostic groups. A trend towards higher tau
being associated with higher whole-brain atrophy rates within the control
group, could be ascribed to a few subjects showing clinical progression,
since the effect disappeared after exclusion of three subjects who progressed
to dementia. It might be argued that these subjects should not have been

133
Longitudinal MRI and CSF biomarkers
included in the control group. However, because the risk of dementia increases
with age, healthy elderly may progress to dementia.33 Moreover, the cognitive
continuum of dementia shows a gradual decline, and boundaries between
AD and MCI are somewhat arbitrary.12 We therefore think by including these
progressing patients, we included the whole cognitive spectrum and studied a
typical heterogeneous memory clinic population.
In contrast to Aß1-42
and tau, baseline P-tau181
was weakly associated with
whole-brain atrophy rate within the AD group, but not across groups. When we
started this study, we hypothesised that patients with a larger load of senile
plaques and neurofibrillary tangles (reflected by CSF biomarker levels), would
have a higher rate of neuronal loss, consequently leading to a higher whole-
brain atrophy rate. Our study did not confirm this. In fact, we found a modest
effect in the opposite direction, with a higher (more abnormal) P-tau181
being
related to a lower (less abnormal) whole-brain atrophy rate. We are unsure how
to interpret this finding. We cannot exclude the possibility that some of our
AD patients were misdiagnosed, especially since no post mortem verification
of diagnosis was available. However, all patients fulfilled NINDS-ADRDA clinical
criteria for probable AD, which was confirmed both at baseline and at follow-
up in multidisciplinary consensus meetings. Our findings might suggest the
existence of subtypes of AD with differential combinations of levels of p-tau
and atrophy rates. These results are comparable to our finding that, while
for MCI patients the APOEε4 genotype is a predictor of faster subsequent
progression, we observe the opposite in AD patients, as APOE ε4 positive
patients show a slower atrophy rate.28 These results suggest that patients
who – despite their favourable APOE ε3 status – still develop AD, have a more
aggressive form of the disease. Likewise, it seems that those who show clinical
AD in spite of relatively low levels of p-tau, are likely to have slightly higher
atrophy rates.
Post mortem studies have shown considerable overlap in the neuropathological
features associated with AD, regardless of whether or not dementia was
actually present during life.20 This implies that other factors than senile
plaques and neurofibrillary tangles must be involved in the development of the
clinical syndrome of dementia. Indeed, it has been reported that brain volume
134
Chapter 7
by itself is a good predictor of dementia, independent of senile plaque and
neurofibrillary tangle load.20 Our results are in line with these neuropathological
findings, since we hardly found any association of whole-brain atrophy rates
and CSF biomarker levels. This could imply that brain volume loss in vivo,
measured with MRI, and CSF biomarker levels, which are thought to represent
senile plaque and neurofibrillary tangle load, reflect different aspects of AD.
Among the strengths of this study is that we investigated the association of two
widely used markers (CSF and MRI) in a large cohort of MCI, AD patients and
controls derived from a memory clinic, in a prospective longitudinal fashion.
For every patient, baseline CSF and longitudinal MRI were available. Follow up
CSF data were available for a large subgroup. A limitation of this study may be
that we used MRI scans that were obtained on a 1T scanner. We feel however
that T1 scans have sufficient contrast of parenchyma-CSF, while the gain of
scans obtained at a higher field strenght largely lies in increased gray-white
matter contrast. As we assessed the whole-brain, rather than gray and white
matter separately, we feel that our scans had sufficient quality. In addition, it
could be argued that hippocampal atrophy is a more specific marker for AD
than whole-brain atrophy rate24, which is increased in a number of different
diseases that cause dementia.6,22 However, senile plaques and neurofibrillary
tangles accumulate throughout the brain, and are not exclusively found in the
medial temporal lobe.5 Our control group that included patients with subjective
complaints may limit the generalisability of the results, since patients with
subjective complaints are known to have an increased risk of progression to
dementia.34 However, the present study did not focus on differences between
groups, but rather, on associations between two different types of biomarkers.
We deliberately included the entire cognitive spectrum, and showed that –
across the entire cognitive spectrum, MRI atrophy rate and CSF biomarkers
were modestly correlated. Within diagnostic groups however, there was hardly
any relationship. When healthy controls only would have been included, these
results would be unaltered. Another possible limitation is our relatively high
number of converters. All patients were assessed in a standardized way and
diagnosed according to the criteria of Petersen.23 Compared to the conversion
rate of 12% per year reported by Petersen et al, the conversion rate of 59% over
a period of almost two years in our group of MCI patients seems rather high.

135
Longitudinal MRI and CSF biomarkers
However, our results are comparable to the conversion rate of other memory
clinics14, while the conversion rate reported by Petersen et al was found in a
general community setting.
In contrast to whole-brain atrophy rates which were associated with change
in MMSE score over time, longitudinal changes in CSF biomarker levels were
not. These results suggest that for tracking the rate of progression of AD,
whole-brain atrophy rates are more useful than CSF levels of Aß1-42
, tau, and
P-tau181
; by contrast these CSF markers can be considered to be disease state
markers, which may be more sensitive as diagnostic tools, possibly in earlier
stages of AD.

136
Chapter 7
1. Blennow K, Hampel H. - CSF markers for
incipient Alzheimer’s disease. - Lancet
Neurol 2003 Oct;2(10):605-13.
2. Bouwman FH, Schoonenboom SNM, van
Der Flier WM, Van Elk EJ, Kok A, Barkhof
F, Blankenstein MA, Scheltens P. CSF
biomarkers and medial temporal lobe
atrophy predict dementia in mild cognitive
impairment. Neurobiol Aging 2007; 28:
1070-1074.
3. Bouwman FH, van Der Flier WM,
Schoonenboom NS, Van Elk EJ, Kok A,
Rijmen F, Blankenstein MA, Scheltens P.
Longitudinal changes of CSF biomarkers in
memory clinic patients. - Neurology 2007
Sep 4;69(10):1006-11 2007.
4. Bouwman FH, van Der Flier WM,
Schoonenboom NS, Van Elk EJ, Kok A,
Scheltens P, Blankenstein MA. - Usefulness
of longitudinal measurements of
beta-amyloid1-42
in cerebrospinal fluid
of patients with various cognitive and
neurologic disorders. - Clin Chem 2006
Aug;52(8):1604-6.
5. Braak H, Braak E. - Neuropathological
stageing of Alzheimer-related changes. -
Acta Neuropathol (Berl) 1991;82(4):239-59.
6. Chan D, Fox NC, Jenkins R, Scahill RI,
Crum WR, Rossor MN. - Rates of global
and regional cerebral atrophy in AD and
frontotemporal dementia. - Neurology
2001 Nov 27;57(10):1756-63.
7. de Leon MJ, DeSanti S, Zinkowski R, Mehta
PD, Pratico D, Segal S, Rusinek H, Li J, Tsui
W, Saint Louis LA, Clark CM, Tarshish C, Li
Y, Lair L, Javier E, Rich K, Lesbre P, Mosconi
L, Reisberg B, Sadowski M, DeBernadis
JF, Kerkman DJ, Hampel H, Wahlund LO,
Davies P. - Longitudinal CSF and MRI
biomarkers improve the diagnosis of mild
cognitive impairment. - Neurobiol Aging
2006 Mar;27(3):394-401 Epub 2005 Aug
26.
8. Erten-Lyons D, Howieson D, Moore MM,
Quinn J, Sexton G, Silbert L, Kaye J. - Brain
volume loss in MCI predicts dementia. -
Neurology 2006 Jan 24;66(2):233-5.
9. Folstein MF, Folstein SE, Mchugh PR. -
“Mini-mental state”. A practical method
for grading the cognitive state of patients
for the clinician. - J Psychiatr Res 1975
Nov;12(3):189-98.
10. Fox NC, Black RS, Gilman S, Rossor MN,
Griffith SG, Jenkins L, Koller M. Effects of
A beta immunization (AN1792) on MRI
measures of cerebral volume in Alzheimer
disease. Neurology 2005; 64: 1563-1572.
11. Fox NC, Scahill RI, Crum WR, Rossor MN. -
Correlation between rates of brain atrophy
and cognitive decline in AD. - Neurology
1999 May 12;52(8):1687-9.
12. Gauthier S, Reisberg B, Zaudig M, Petersen
RC, Ritchie K, Broich K, Belleville S, Brodaty
H, Bennett D, Chertkow H, Cummings JL,
de LM, Feldman H, Ganguli M, Hampel H,
Reference list

137
Longitudinal MRI and CSF biomarkers
Scheltens P, Tierney MC, Whitehouse P,
Winblad B. - Mild cognitive impairment. -
Lancet 2006 Apr 15;367(9518):1262-70.
13. Hampel H, Burger K, Pruessner JC,
Zinkowski R, DeBernardis J, Kerkman D,
Leinsinger G, Evans AC, Davies P, Moller
HJ, Teipel SJ. - Correlation of cerebrospinal
fluid levels of tau protein phosphorylated
at threonine 231 with rates of hippocampal
atrophy in Alzheimer disease. - Arch Neurol
2005 May;62(5):770-3.
14. Hampel H, Teipel SJ, Fuchsberger T,
Andreasen N, Wiltfang J, Otto M, Shen
Y, Dodel R, Du Y, Farlow M, Moller HJ,
Blennow K, Buerger K. Value of CSF
beta-amyloid1-42
and tau as predictors of
Alzheimer’s disease in patients with mild
cognitive impairment. Mol Psychiatry 2004;
9: 705-710.
15. Hansson O, Zetterberg H, Buchhave
P, Londos E, Blennow K, Minthon
L. - Association between CSF biomarkers
and incipient Alzheimer’s disease in
patients with mild cognitive impairment:
a follow-up study. - Lancet Neurol 2006
Mar;5(3):228-34.
16. Hartley SW, Scher AI, Korf ESC, White
LR, Launer LJ. Analysis and validation
of automated skull stripping tools: A
validation study based on 296 MR images
from the Honolulu Asia aging study.
Neuroimage 2006; 30: 1179-1186.
17. Herukka SK, Helisalmi S, Hallikainen
M, Tervo S, Soininen H, Pirttila T. - CSF
Abeta42, Tau and phosphorylated Tau,
APOE epsilon4 allele and MCI type in
progressive MCI. - Neurobiol Aging 2007
Apr;28(4):507-14 Epub 2006 Mar 20.
18. Jack CR, Shiung MM, Gunter JL, O’Brien
PC, Weigand SD, Knopman DS, Boeve BF,
Ivnik RJ, Smith GE, Cha RH, Tangalos EG,
Petersen RC. Comparison of different MRI
brain atrophy, rate measures with clinical
disease progression in AD. Neurology
2004; 62: 591-600.
19. McKhann G, Drachman D, Folstein M,
Katzman R, Price D, Stadlan EM. - Clinical
diagnosis of Alzheimer’s disease: report
of the NINCDS-ADRDA Work Group under
the auspices of Department of Health
and Human Services Task Force on
Alzheimer’s Disease. - Neurology 1984
Jul;34(7):939-44.
20. MRC CFAS. Pathological correlates of
late-onset dementia in a multicentre,
community-based population in England
and Wales. Neuropathology Group of
the Medical Research Council Cognitive
Function and Ageing Study (MRC CFAS).
- Lancet 2001 Jan 20;357(9251):169-75
2001.
21. Neary D, Snowden JS, Gustafson L, Passant
U, Stuss D, Black S, Freedman M, Kertesz
A, Robert PH, Albert M, Boone K, Miller BL,
Cummings J, Benson DF. - Frontotemporal

138
Chapter 7
lobar degeneration: a consensus on clinical
diagnostic criteria. - Neurology 1998
Dec;51(6):1546-54.
22. O’Brien JT, Paling S, Barber R, Williams ED,
Ballard C, McKeith IG, Gholkar A, Crum WR,
Rossor MN, Fox NC. - Progressive brain
atrophy on serial MRI in dementia with
Lewy bodies, AD, and vascular dementia. -
Neurology 2001 May 22;56(10):1386-8.
23. Petersen RC, Stevens JC, Ganguli M,
Tangalos EG, Cummings JL, DeKosky
ST. - Practice parameter: early detection
of dementia: mild cognitive impairment
(an evidence-based review). Report of
the Quality Standards Subcommittee of
the American Academy of Neurology. -
Neurology 2001 May 8;56(9):1133-42.
24. Ridha BH, Barnes J, Bartlett JW, Godbolt A,
Pepple T, Rossor MN, Fox NC. Tracking
atrophy progression in familial Alzheimer’s
disease: a serial MRI study. Lancet
Neurology 2006; 5: 828-834.
25. Schonknecht P, Pantel J, Hartmann T,
Werle E, Volkmann M, Essig M, Amann
M, Zanabili N, Bardenheuer H, Hunt A,
Schroder J. - Cerebrospinal fluid tau
levels in Alzheimer’s disease are elevated
when compared with vascular dementia
but do not correlate with measures of
cerebral atrophy. - Psychiatry Res 2003 Oct
15;120(3):231-8.
26. Schoonenboom NS, van Der Flier WM,
Blankenstein MA, Bouwman FH, Van Kamp
GJ, Barkhof F, Scheltens P. - CSF and MRI
markers independently contribute to
the diagnosis of Alzheimer’s disease. -
Neurobiol Aging 2007 Jan 4.
27. Silbert LC, Quinn JF, Moore MM, Corbridge
E, Ball MJ, Murdoch G, Sexton G, Kaye
JA. - Changes in premorbid brain volume
predict Alzheimer’s disease pathology. -
Neurology 2003 Aug 26;61(4):487-92.
28. Sluimer JD, Vrenken H, Blankenstein
MA, Fox NC, Scheltens P, Barkhof F, van
der Flier WM. Whole-brain atrophy rate
in Alzheimer disease: Identifying fast
progressors. Neurology 2008.
29. Sluimer JD, van Der Flier WM, Karas G,
Fox N, Scheltens P, Barkhof F, Vrenken H.
Whole-brain atrophy rate and cognitive
decline: a longitudinal MRI study of
memory clinic patients. In. 2007.
30. Smith SM, Jenkinson M, Woolrich MW,
Beckmann CF, Behrens TE, Johansen-Berg
H, Bannister PR, De LM, Drobnjak I,
Flitney DE, Niazy RK, Saunders J, Vickers J,
Zhang Y, De SN, Brady JM, Matthews PM.
- Advances in functional and structural MR
image analysis and implementation as FSL.
- Neuroimage 2004;23 Suppl 1:S208-19.
31. Smith SM, Zhang Y, Jenkinson M,
Chen J, Matthews PM, Federico A, De
SN. - Accurate, robust, and automated
longitudinal and cross-sectional brain
change analysis. - Neuroimage 2002
Sep;17(1):479-89.
32. van Straaten EC, Scheltens P, Knol DL,
van Buchem MA, van Dijk EJ, Hofman PA,
Karas G, Kjartansson O, de Leeuw FE, Prins

139
Longitudinal MRI and CSF biomarkers
ND, Schmidt R, Visser MC, Weinstein HC,
Barkhof F. - Operational definitions for the
NINDS-AIREN criteria for vascular dementia:
an interobserver study. - Stroke 2003
Aug;34(8):1907-12 Epub 2003 Jul 10.
33. Visser PJ, Kester A, Jolles J, Verhey F. - Ten-
year risk of dementia in subjects with mild
cognitive impairment. - Neurology 2006
Oct 10;67(7):1201-7.
34. Visser PJ, Kester A, Jolles J, Verhey F. - Ten-
year risk of dementia in subjects with mild
cognitive impairment. - Neurology 2006
Oct 10;67(7):1201-7.
35. Wahlund LO, Blennow K. - Cerebrospinal
fluid biomarkers for disease stage and
intensity in cognitively impaired patients. -
Neurosci Lett 2003 Mar 20;339(2):99-102.
36. Waldemar G, Dubois B, Emre M, Georges J,
McKeith IG, Rossor M, Scheltens P, Tariska
P, Winblad B. - Recommendations for the
diagnosis and management of Alzheimer’s
disease and other disorders associated
with dementia: EFNS guideline. - Eur J
Neurol 2007 Jan;14(1):e1-26.
37. Wiltfang J, Lewczuk P, Riederer P,
Grunblatt E, Hock C, Scheltens P, Hampel
H, Vanderstichele H, Iqbal K, Galasko D,
Lannfelt L, Otto M, Esselmann H, Henkel
AW, Kornhuber J, Blennow K. - Consensus
paper of the WFSBP Task Force on
Biological Markers of Dementia: the role
of CSF and blood analysis in the early and
differential diagnosis of dementia. - World J
Biol Psychiatry 2005;6(2):69-84.


![Elecsys CSF biomarker immunoassays demonstrate concordance … · 2020. 3. 31. · 18F-Florbetapir (FBP). Methodology for each tracer has been previously described [23]. Briefly,](https://img.pdfslide.net/doc/110x75/60eb240a9404d73e644f251b/elecsys-csf-biomarker-immunoassays-demonstrate-concordance-2020-3-31-18f-florbetapir.jpg)