Embed Size (px)
Citation preview
Whole genome methylation profiling difference in PBMC between responder and nonresponder of acute exacerbations of COPD patients treated with corticosteroid
Lawrence Wu, Ph.D
Associate Professor
Institute of Medical Sciences
Tzu Chi University
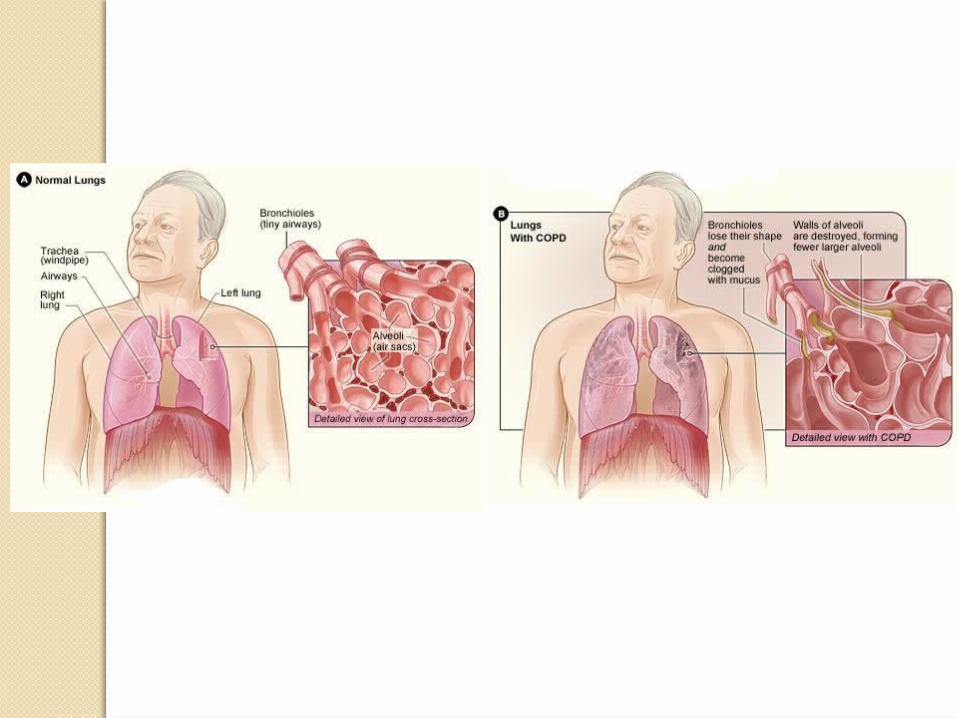
COPD Chronic obstructive pulmonary disease (COPD) is a major cause
of morbidity and mortality throughout the world, and further increases in its prevalence and mortality can be predicted in the coming decades.
The World Health Organization has predicted that it will be the
third leading cause of death in the world by the year 2020.
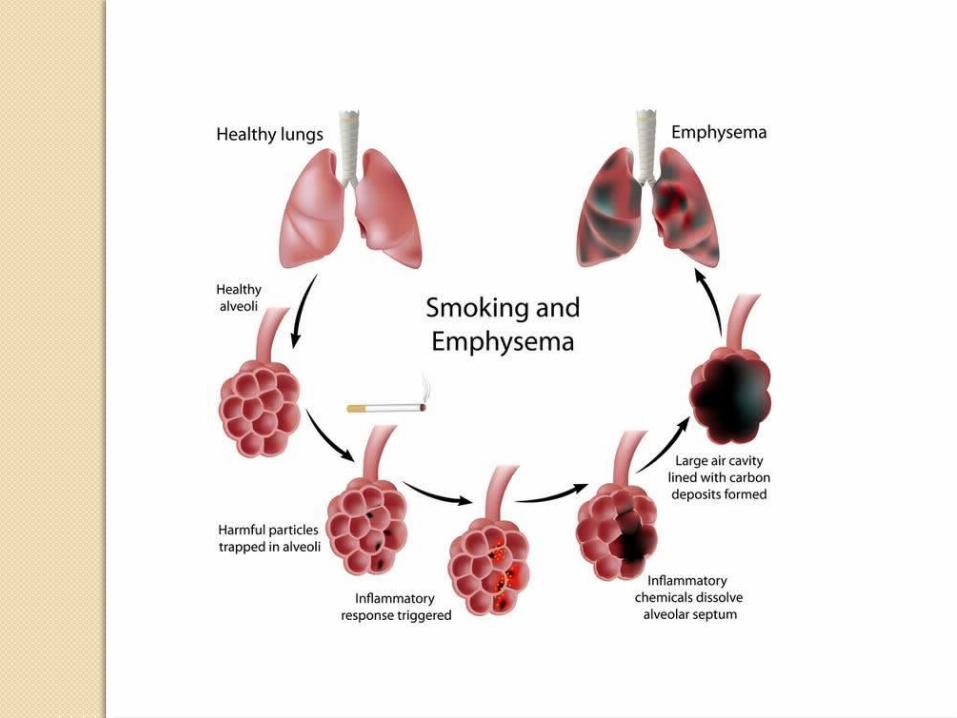
The clinical course of the disease is characterized by progressive, irreversible airflow obstruction associated with chronic inflammation of the respiratory tract.
However, there are still no effective drug therapies for COPD that alter disease progression.
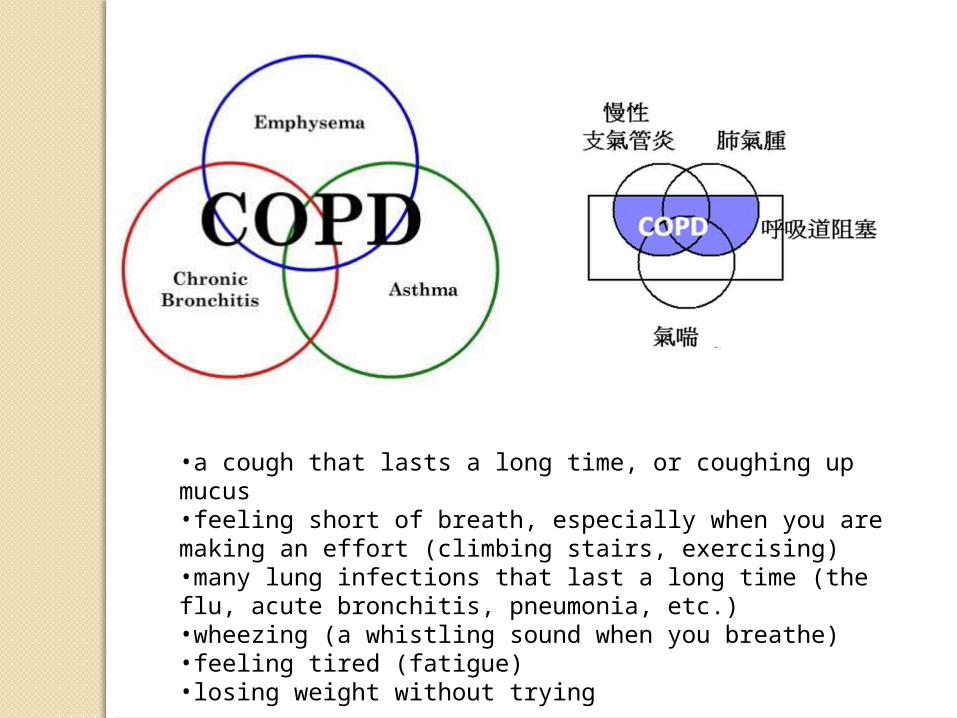
•a cough that lasts a long time, or coughing up mucus•feeling short of breath, especially when you are making an effort (climbing stairs, exercising)•many lung infections that last a long time (the flu, acute bronchitis, pneumonia, etc.)•wheezing (a whistling sound when you breathe)•feeling tired (fatigue)•losing weight without trying
AECOPD
Acute exacerbations are triggered mainly by respiratory tract infections.
According to evidence-based reviews and current guidelines, systemic glucocorticoid therapy is an integral part of the management of COPD exacerbations
Steroids treatmentSteroids are often used in the treatment of AECOPD.
Use of corticosteroids has been shown to shorten recovery time, hasten improvement in lung function, reduce the risk of early relapse and reduce length of hospital stay.
The existing guidelines suggest that oral administration of corticosteroids in a dose of 30–40 mg prednisolone per day for 10–14 days is preferable.
Study subjectsAll 60 enrolled patients with COPD exacerbation were
received medicine including Predisolone 2 tablet (5mg/tablet) three times a day, Medicon 1 tablet three times a day, Ventolin 1 tablet three times a day, and Bisolvon 1 tablet three time a day. The treatment duration is two weeks (14 days).
Subjects were improved all evaluation (CAT, spirometry test) after treatment and defined as responder of corticosteroid treatment. Other subjects without improved CAT and spirometry test after treatment were defined as non-responder of corticosteroid treatment.
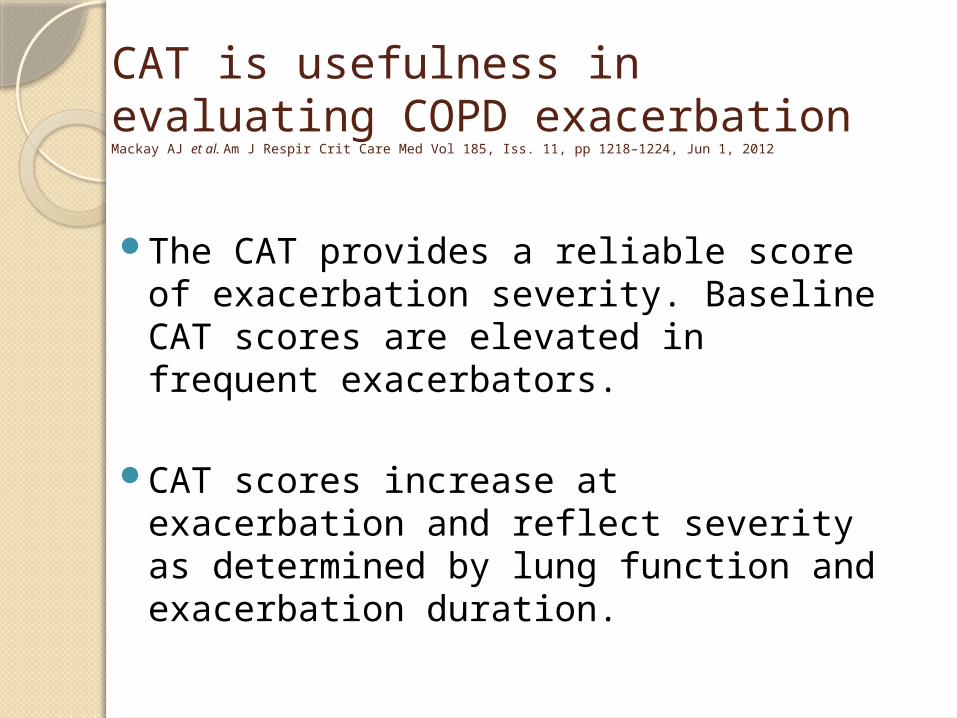
CAT is usefulness in evaluating COPD exacerbation Mackay AJ et al. Am J Respir Crit Care Med Vol 185, Iss. 11, pp 1218–1224, Jun 1, 2012
The CAT provides a reliable score of exacerbation severity. Baseline CAT scores are elevated in frequent exacerbators.
CAT scores increase at exacerbation and reflect severity as determined by lung function and exacerbation duration.
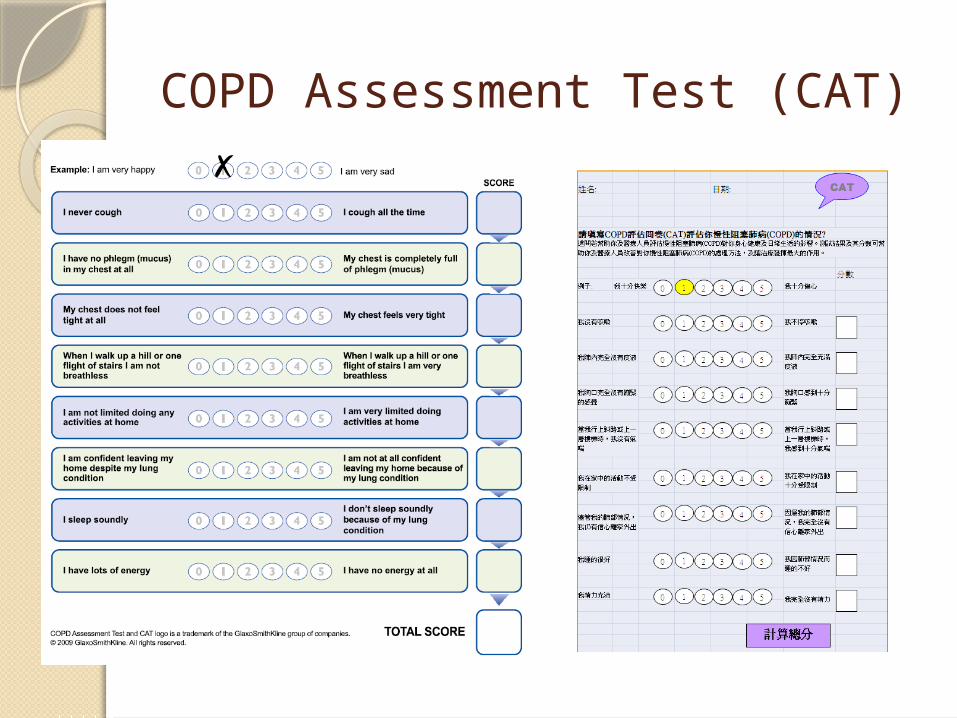
COPD Assessment Test (CAT)
COPD is progressive disease, the FEV1and FVC is no significant alteration in many COPD patients in acute exacerbation during the two-week medical treatment
FEV1, FEV1% and FVC are objective measurements. CAT is subjective questionnaire. Patients with better FEV1, FVC and CAT score (more than 5 points decrease) after treatment were defined as response to corticosteroid.
The poor response group was defined as that FEV1 and FVC after 2 week treatment did not better than before treatment and CAT score didn’t decrease (more than 5 points) or increased after treatment.
ResultsSubjects charactersThe total 24 COPD patients were enrolled and DNA
samples were obtained from subjects’ PBMC.
The good response group included 9 males and 3 females and the poor response group was all males.
All subjects were diagnosis to COPD at first time and never treated with corticosteroid before.
The subject counts with different lung function in good and poor response groups are mild 4/5, moderate 5/4 and severe obstruction 3/3, respectively.
The average age of two groups was no significant difference.
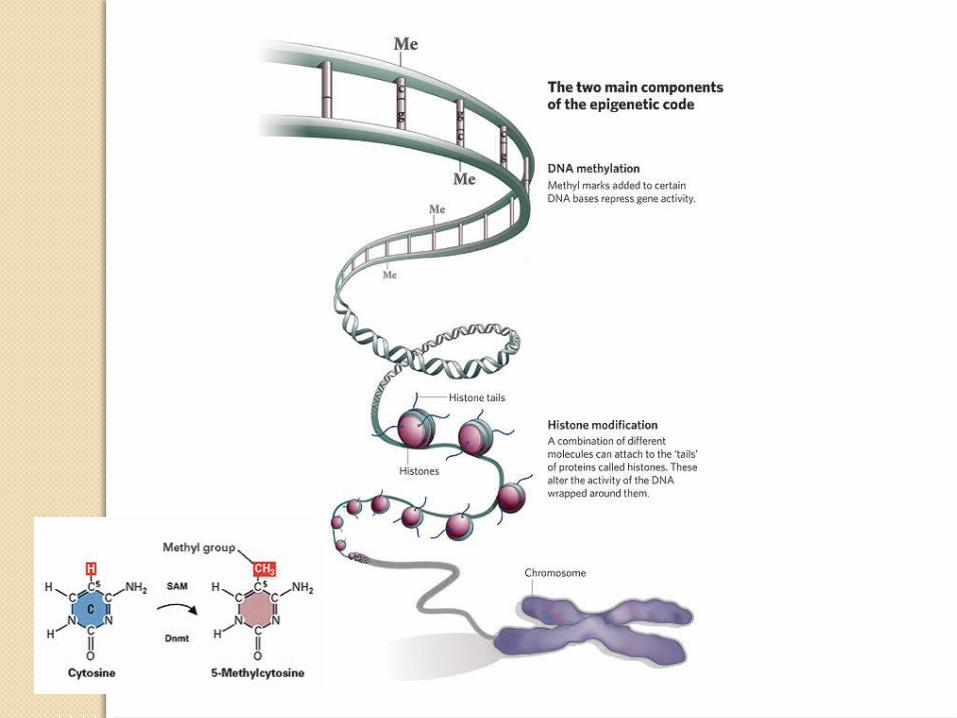
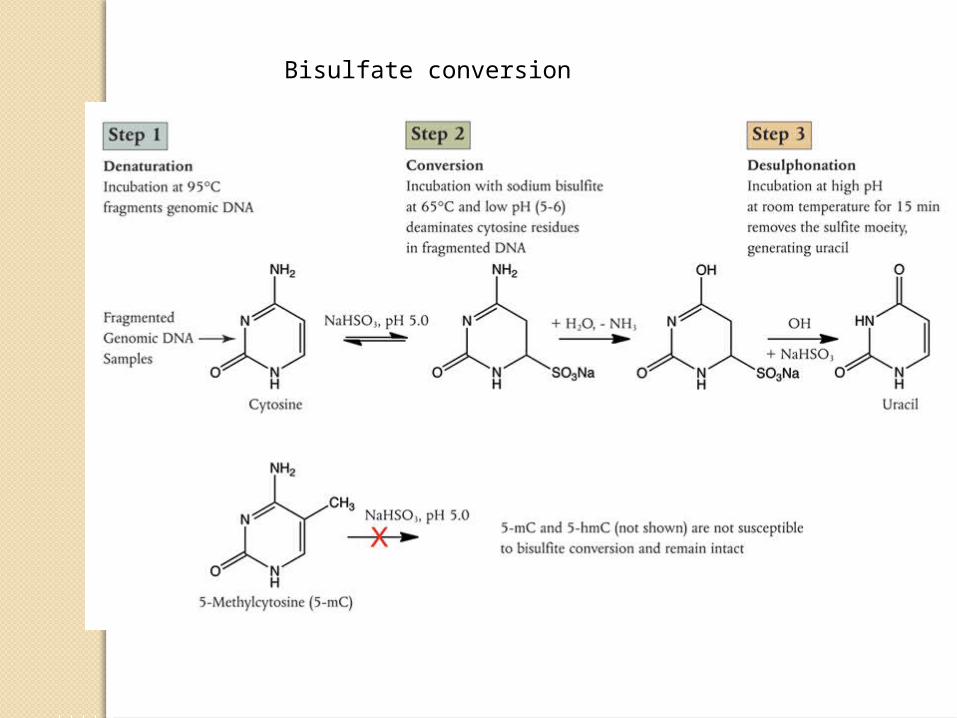
Bisulfate conversion
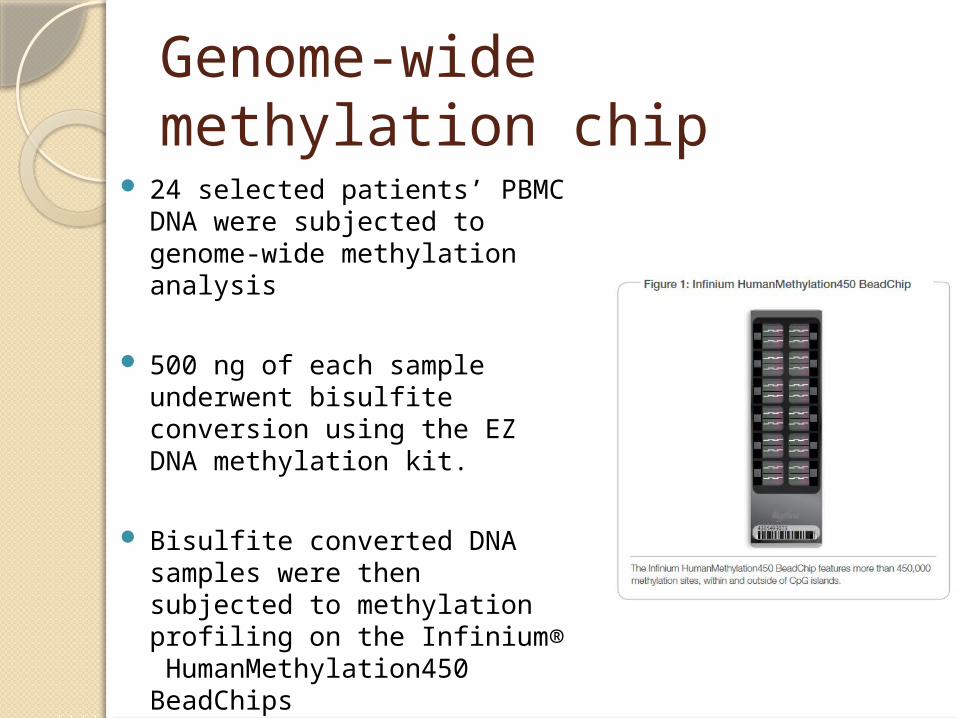
Genome-wide methylation chip
24 selected patients’ PBMC DNA were subjected to genome-wide methylation analysis
500 ng of each sample underwent bisulfite conversion using the EZ DNA methylation kit.
Bisulfite converted DNA samples were then subjected to methylation profiling on the Infinium® HumanMethylation450 BeadChips
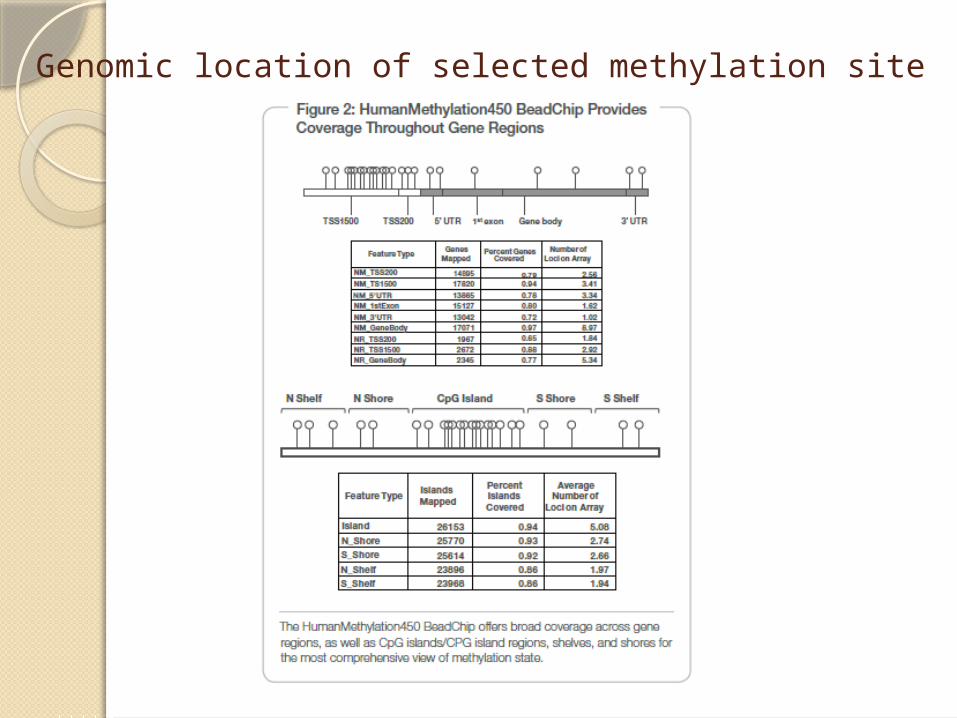
Genomic location of selected methylation site
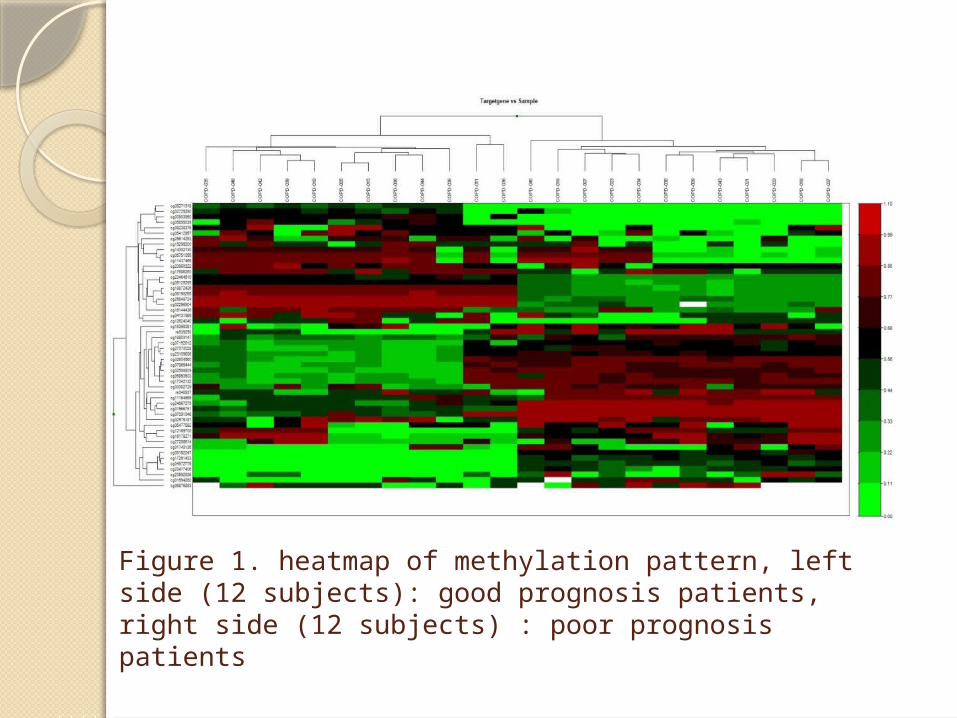
Figure 1. heatmap of methylation pattern, left side (12 subjects): good prognosis patients, right side (12 subjects) : poor prognosis patients
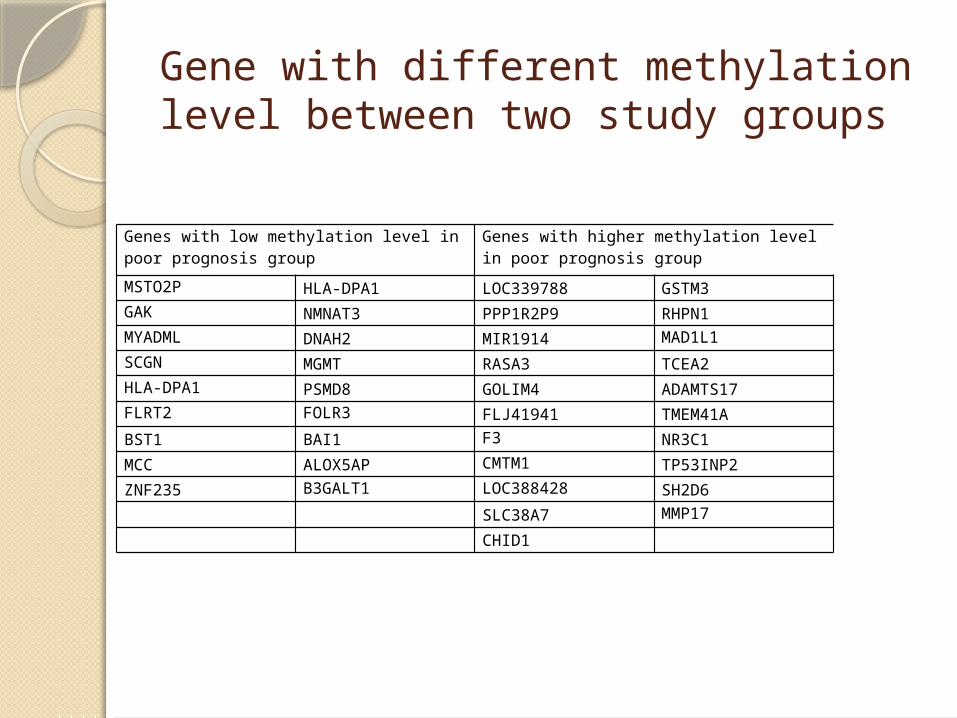
Gene with different methylation level between two study groups
Genes with low methylation level in poor prognosis group
Genes with higher methylation level in poor prognosis group
MSTO2P HLA-DPA1 LOC339788 GSTM3GAK NMNAT3 PPP1R2P9 RHPN1MYADML DNAH2 MIR1914 MAD1L1
SCGN MGMT RASA3 TCEA2HLA-DPA1 PSMD8 GOLIM4 ADAMTS17FLRT2 FOLR3 FLJ41941 TMEM41A
BST1 BAI1 F3 NR3C1
MCC ALOX5AP CMTM1 TP53INP2
ZNF235 B3GALT1 LOC388428 SH2D6
SLC38A7 MMP17
CHID1
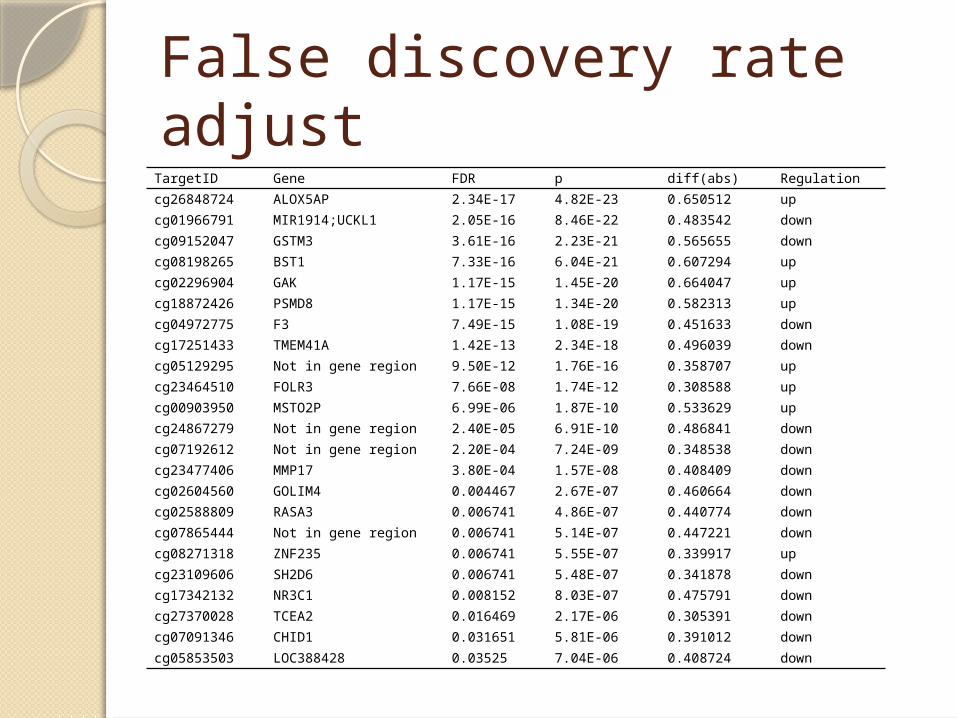
False discovery rate adjust TargetID Gene FDR p diff(abs) Regulation
cg26848724 ALOX5AP 2.34E-17 4.82E-23 0.650512 up
cg01966791 MIR1914;UCKL1 2.05E-16 8.46E-22 0.483542 down
cg09152047 GSTM3 3.61E-16 2.23E-21 0.565655 down
cg08198265 BST1 7.33E-16 6.04E-21 0.607294 up
cg02296904 GAK 1.17E-15 1.45E-20 0.664047 up
cg18872426 PSMD8 1.17E-15 1.34E-20 0.582313 up
cg04972775 F3 7.49E-15 1.08E-19 0.451633 down
cg17251433 TMEM41A 1.42E-13 2.34E-18 0.496039 down
cg05129295 Not in gene region 9.50E-12 1.76E-16 0.358707 up
cg23464510 FOLR3 7.66E-08 1.74E-12 0.308588 up
cg00903950 MSTO2P 6.99E-06 1.87E-10 0.533629 up
cg24867279 Not in gene region 2.40E-05 6.91E-10 0.486841 down
cg07192612 Not in gene region 2.20E-04 7.24E-09 0.348538 down
cg23477406 MMP17 3.80E-04 1.57E-08 0.408409 down
cg02604560 GOLIM4 0.004467 2.67E-07 0.460664 down
cg02588809 RASA3 0.006741 4.86E-07 0.440774 down
cg07865444 Not in gene region 0.006741 5.14E-07 0.447221 down
cg08271318 ZNF235 0.006741 5.55E-07 0.339917 up
cg23109606 SH2D6 0.006741 5.48E-07 0.341878 down
cg17342132 NR3C1 0.008152 8.03E-07 0.475791 down
cg27370028 TCEA2 0.016469 2.17E-06 0.305391 down
cg07091346 CHID1 0.031651 5.81E-06 0.391012 down
cg05853503 LOC388428 0.03525 7.04E-06 0.408724 down
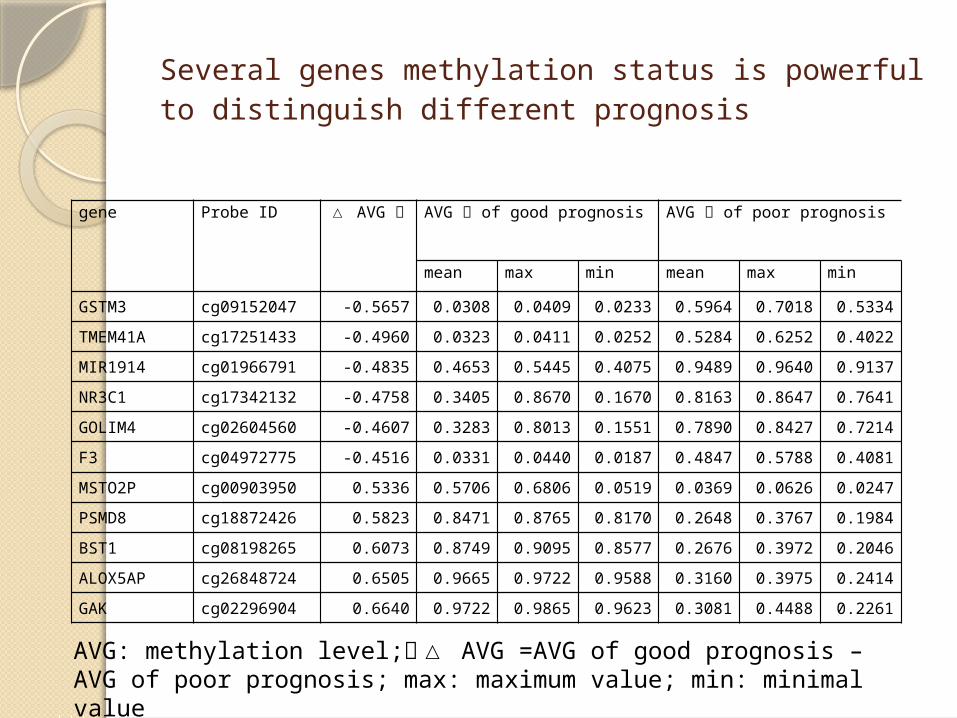
Several genes methylation status is powerful to distinguish different prognosis
gene Probe ID △ AVG AVG of good prognosis AVG of poor prognosis
mean max min mean max min
GSTM3 cg09152047 -0.5657 0.0308 0.0409 0.0233 0.5964 0.7018 0.5334
TMEM41A cg17251433 -0.4960 0.0323 0.0411 0.0252 0.5284 0.6252 0.4022
MIR1914 cg01966791 -0.4835 0.4653 0.5445 0.4075 0.9489 0.9640 0.9137
NR3C1 cg17342132 -0.4758 0.3405 0.8670 0.1670 0.8163 0.8647 0.7641
GOLIM4 cg02604560 -0.4607 0.3283 0.8013 0.1551 0.7890 0.8427 0.7214
F3 cg04972775 -0.4516 0.0331 0.0440 0.0187 0.4847 0.5788 0.4081
MSTO2P cg00903950 0.5336 0.5706 0.6806 0.0519 0.0369 0.0626 0.0247
PSMD8 cg18872426 0.5823 0.8471 0.8765 0.8170 0.2648 0.3767 0.1984
BST1 cg08198265 0.6073 0.8749 0.9095 0.8577 0.2676 0.3972 0.2046
ALOX5AP cg26848724 0.6505 0.9665 0.9722 0.9588 0.3160 0.3975 0.2414
GAK cg02296904 0.6640 0.9722 0.9865 0.9623 0.3081 0.4488 0.2261
AVG: methylation level;△ AVG =AVG of good prognosis – AVG of poor prognosis; max: maximum value; min: minimal value
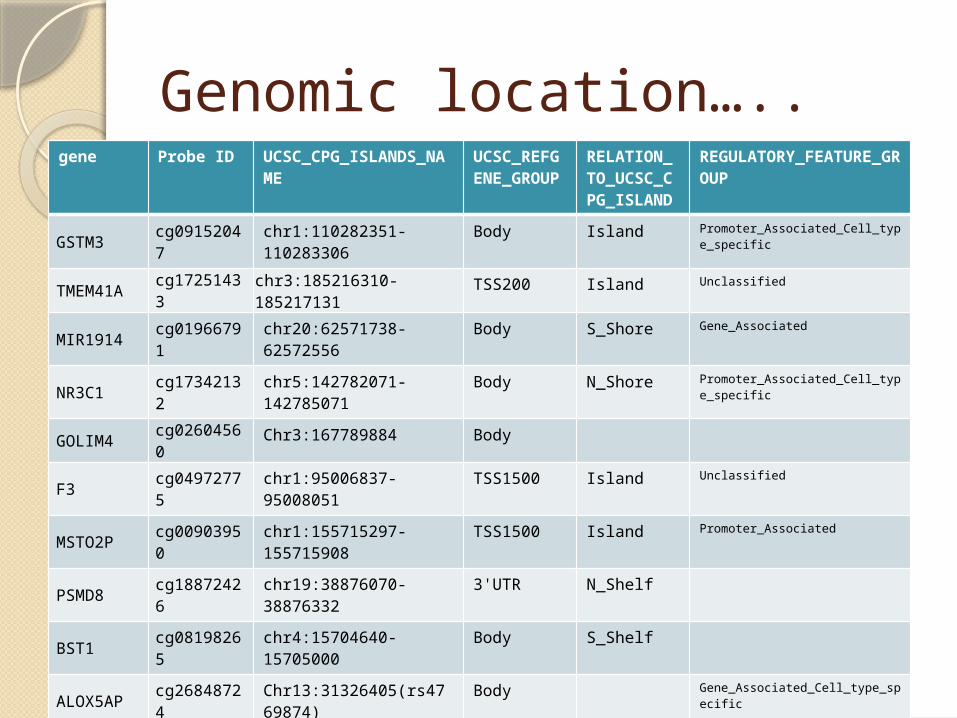
Genomic location…..gene Probe ID UCSC_CPG_ISLANDS_N
AMEUCSC_REFGENE_GROUP
RELATION_TO_UCSC_CPG_ISLAND
REGULATORY_FEATURE_GROUP
GSTM3 cg09152047 chr1:110282351-110283306 Body Island Promoter_Associated_Cell_type_specific
TMEM41A cg17251433 chr3:185216310-185217131 TSS200 Island Unclassified
MIR1914 cg01966791 chr20:62571738-62572556 Body S_Shore Gene_Associated
NR3C1 cg17342132 chr5:142782071-142785071 Body N_Shore Promoter_Associated_Cell_type_specific
GOLIM4 cg02604560 Chr3:167789884 Body
F3 cg04972775 chr1:95006837-95008051 TSS1500 Island Unclassified
MSTO2P cg00903950 chr1:155715297-155715908 TSS1500 Island Promoter_Associated
PSMD8 cg18872426 chr19:38876070-38876332 3'UTR N_Shelf
BST1 cg08198265 chr4:15704640-15705000 Body S_Shelf
ALOX5AP cg26848724 Chr13:31326405(rs4769874) Body Gene_Associated_Cell_type_specific
GAK cg02296904 chr4:878714-878917 Body N_Shore Gene_Associated
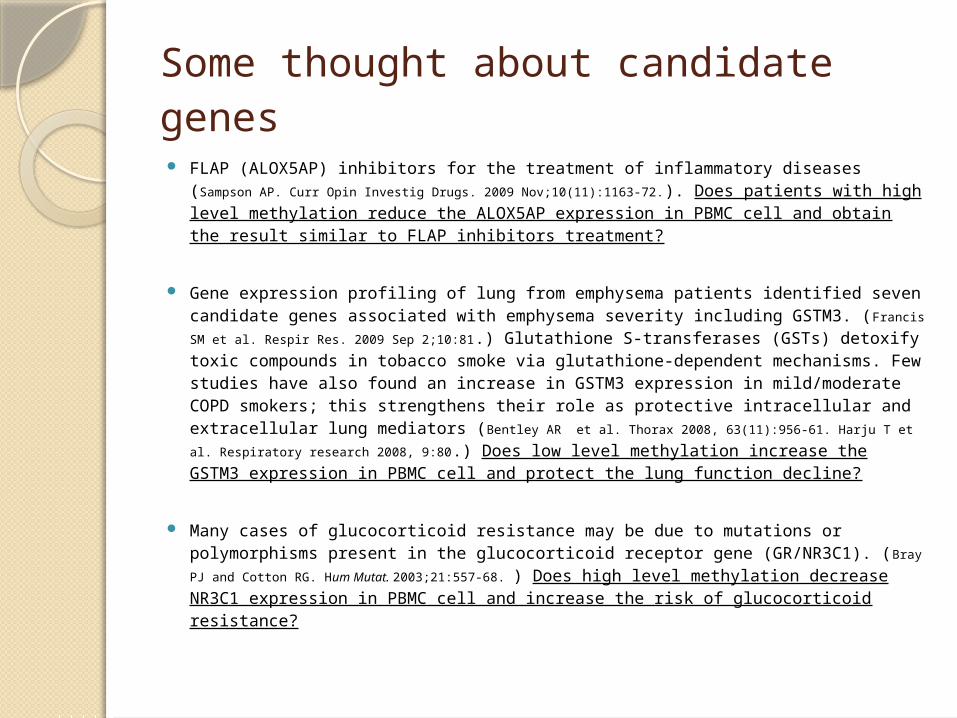
Some thought about candidate genes FLAP (ALOX5AP) inhibitors for the treatment of inflammatory diseases (Sampson AP.
Curr Opin Investig Drugs. 2009 Nov;10(11):1163-72.). Does patients with high level methylation reduce the ALOX5AP expression in PBMC cell and obtain the result similar to FLAP inhibitors treatment?
Gene expression profiling of lung from emphysema patients identified seven candidate genes associated with emphysema severity including GSTM3. (Francis SM et
al. Respir Res. 2009 Sep 2;10:81.) Glutathione S-transferases (GSTs) detoxify toxic compounds in tobacco smoke via glutathione-dependent mechanisms. Few studies have also found an increase in GSTM3 expression in mild/moderate COPD smokers; this strengthens their role as protective intracellular and extracellular lung mediators (Bentley AR et al. Thorax 2008, 63(11):956-61. Harju T et al. Respiratory research 2008, 9:80.) Does low level methylation increase the GSTM3 expression in PBMC cell and protect the lung function decline?
Many cases of glucocorticoid resistance may be due to mutations or polymorphisms present in the glucocorticoid receptor gene (GR/NR3C1). (Bray PJ and Cotton RG. Hum
Mutat. 2003;21:557-68. ) Does high level methylation decrease NR3C1 expression in PBMC cell and increase the risk of glucocorticoid resistance?
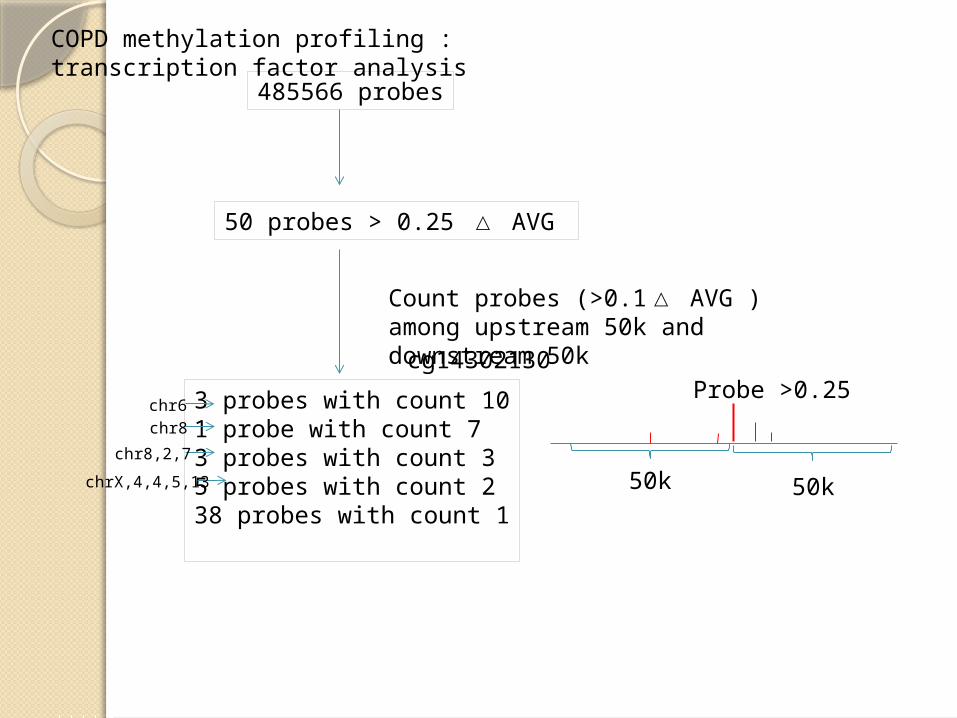
COPD methylation profiling : transcription factor analysis
50k 50k
485566 probes
50 probes > 0.25 △ AVG
Probe >0.25
Count probes (>0.1△ AVG ) among upstream 50k and downstream 50k
3 probes with count 101 probe with count 73 probes with count 35 probes with count 238 probes with count 1
cg14302130
chr6chr8
chr8,2,7
chrX,4,4,5,13
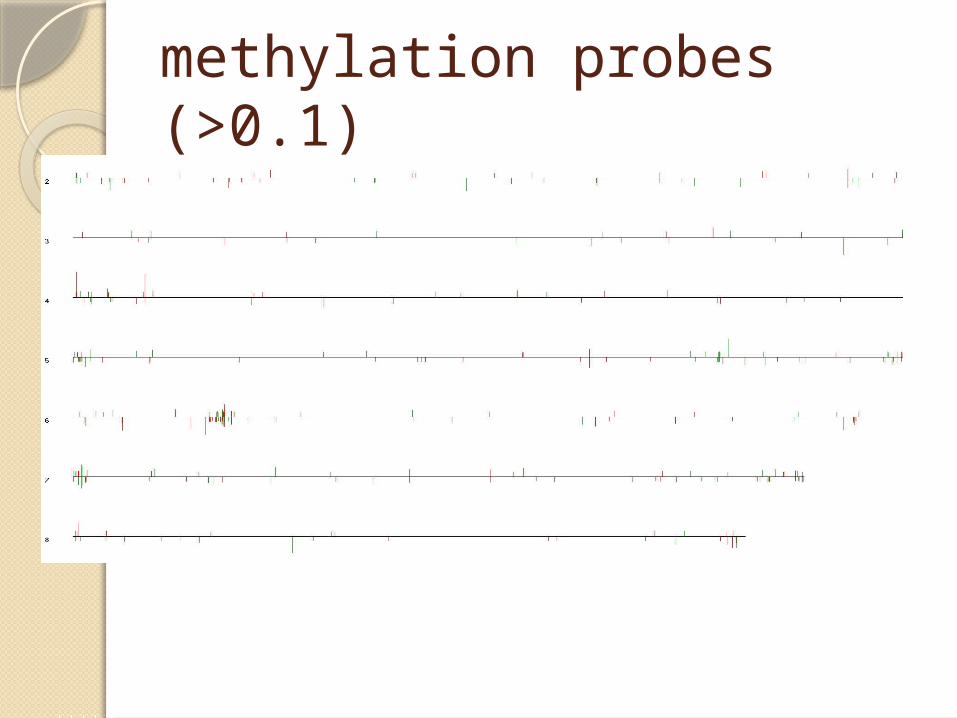
methylation probes (>0.1)
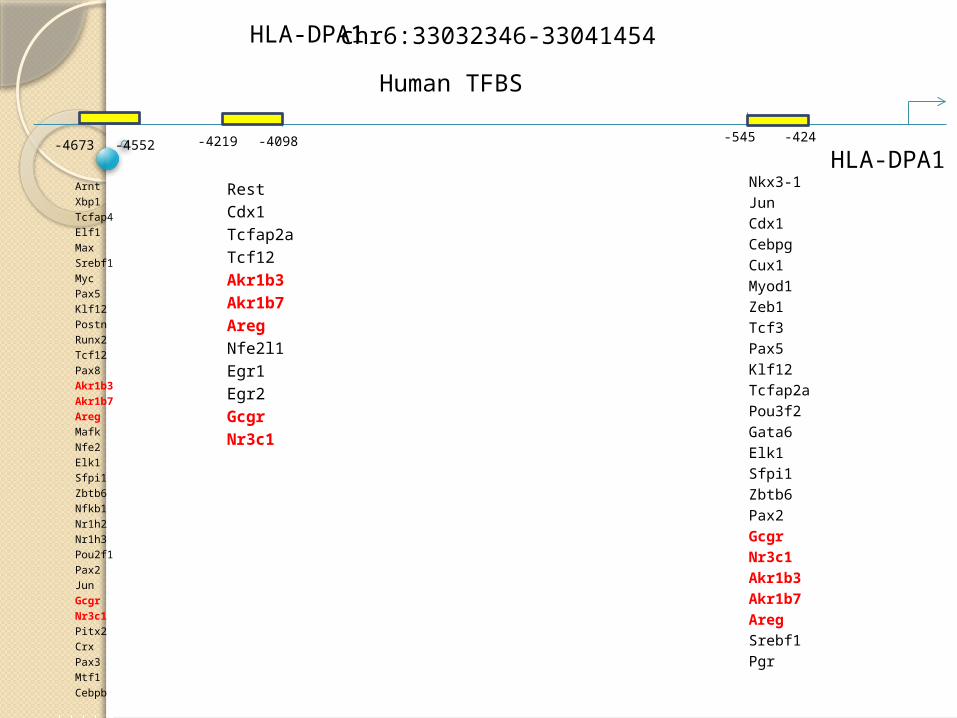
ArntXbp1Tcfap4Elf1MaxSrebf1MycPax5Klf12PostnRunx2Tcf12Pax8Akr1b3Akr1b7AregMafkNfe2Elk1Sfpi1Zbtb6Nfkb1Nr1h2Nr1h3Pou2f1Pax2JunGcgrNr3c1Pitx2CrxPax3Mtf1Cebpb
RestCdx1Tcfap2aTcf12Akr1b3Akr1b7AregNfe2l1Egr1Egr2GcgrNr3c1
Nkx3-1JunCdx1CebpgCux1Myod1Zeb1Tcf3Pax5Klf12Tcfap2aPou3f2Gata6Elk1Sfpi1Zbtb6Pax2GcgrNr3c1Akr1b3Akr1b7AregSrebf1Pgr
HLA-DPA1
chr6:33032346-33041454 HLA-DPA1
-4552-4673 -4098-4219 -424-545
Human TFBS
Further thinking…….
Do the different response groups indicate two subtypes of COPD?
Is the pharmacoepigenetics helpful to reveal heterogeneity of COPD?
HLA-DPA1 vs. COPD: MHC class II antigen involving pathological mechanism of COPD?
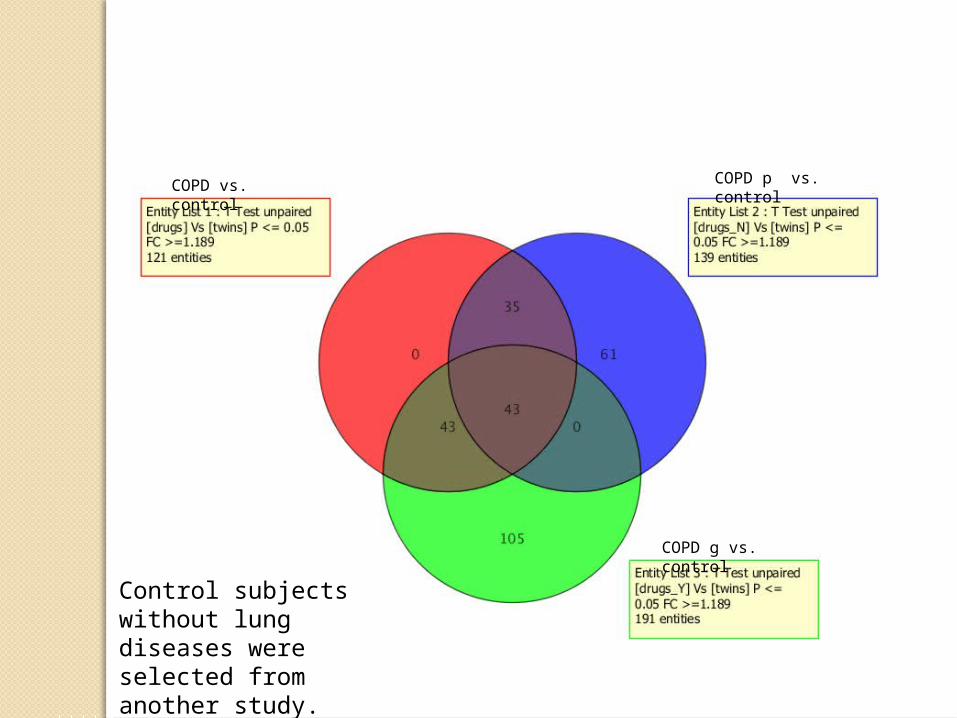
COPD vs. control
COPD p vs. control
COPD g vs. control
Control subjects without lung diseases were selected from another study.
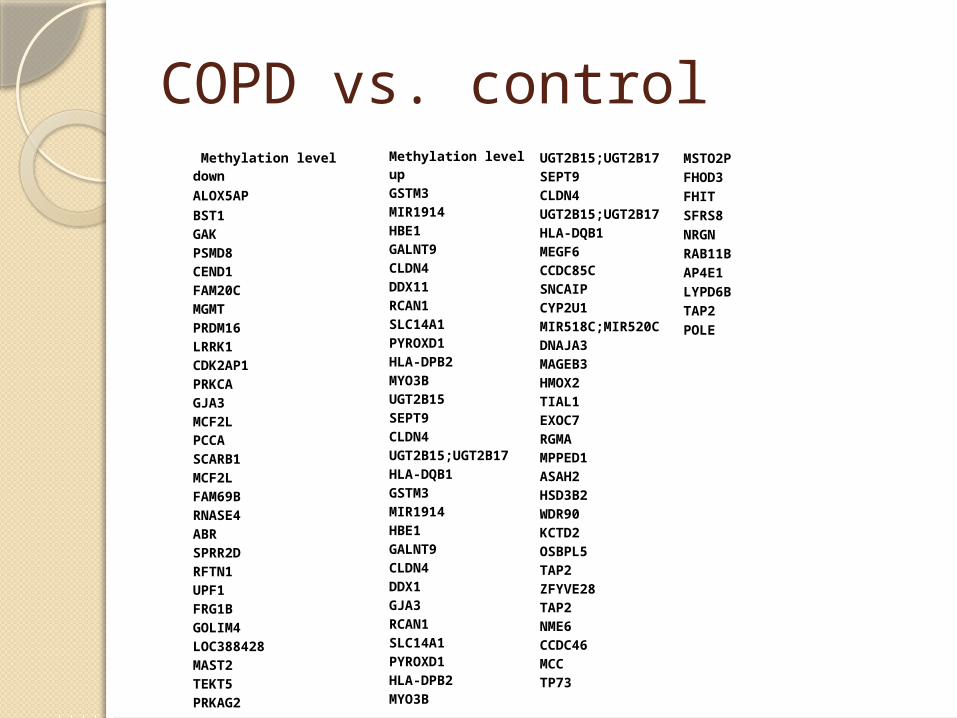
COPD vs. control Methylation level down
ALOX5AP
BST1GAKPSMD8CEND1FAM20CMGMTPRDM16LRRK1CDK2AP1PRKCAGJA3MCF2LPCCASCARB1MCF2LFAM69BRNASE4ABRSPRR2DRFTN1UPF1FRG1BGOLIM4LOC388428MAST2TEKT5PRKAG2
Methylation level upGSTM3MIR1914HBE1GALNT9CLDN4DDX11RCAN1SLC14A1PYROXD1HLA-DPB2MYO3BUGT2B15SEPT9CLDN4UGT2B15;UGT2B17HLA-DQB1GSTM3MIR1914HBE1GALNT9CLDN4DDX1GJA3RCAN1SLC14A1PYROXD1HLA-DPB2MYO3B
UGT2B15;UGT2B17SEPT9CLDN4UGT2B15;UGT2B17HLA-DQB1MEGF6CCDC85CSNCAIPCYP2U1MIR518C;MIR520CDNAJA3MAGEB3HMOX2TIAL1EXOC7RGMAMPPED1ASAH2HSD3B2WDR90KCTD2OSBPL5TAP2ZFYVE28TAP2NME6CCDC46MCCTP73
MSTO2PFHOD3FHITSFRS8NRGNRAB11BAP4E1LYPD6BTAP2POLE
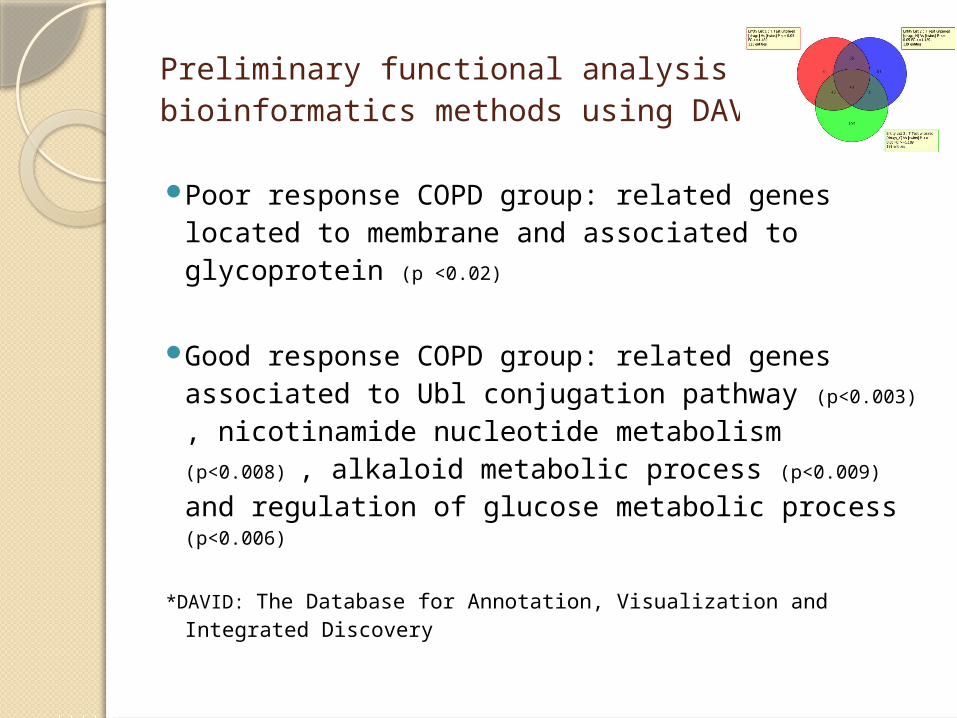
Preliminary functional analysis by bioinformatics methods using DAVID
Poor response COPD group: related genes located to membrane and associated to glycoprotein (p <0.02)
Good response COPD group: related genes associated to Ubl conjugation pathway (p<0.003) , nicotinamide nucleotide metabolism (p<0.008) , alkaloid metabolic process (p<0.009) and regulation of glucose metabolic process (p<0.006)
*DAVID: The Database for Annotation, Visualization and Integrated Discovery
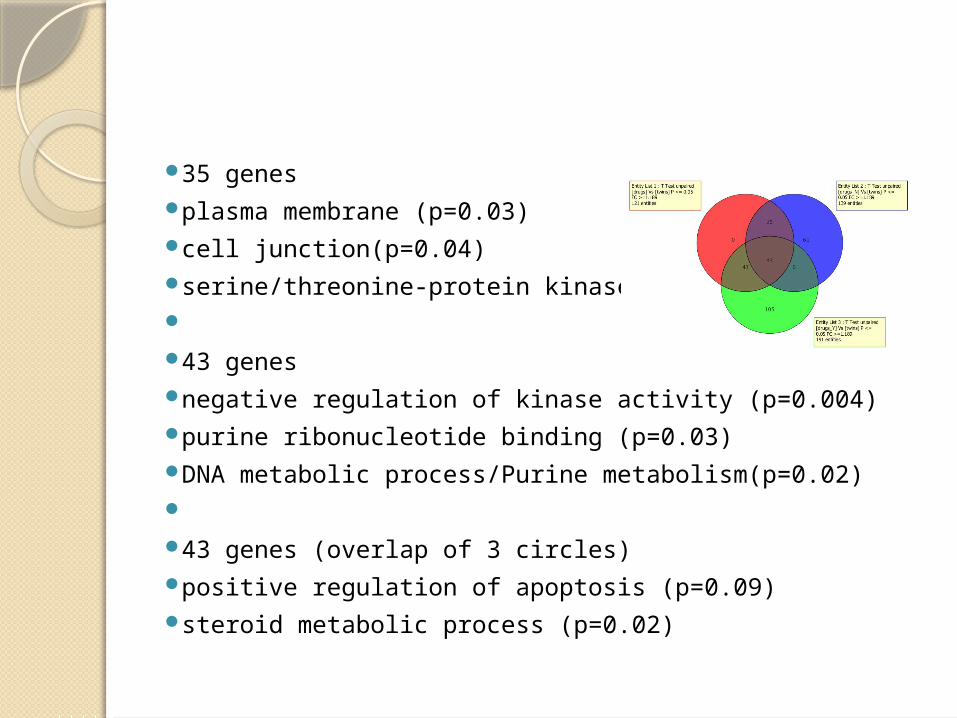
35 genes plasma membrane (p=0.03) cell junction(p=0.04) serine/threonine-protein kinase (p=0.04) 43 genes negative regulation of kinase activity (p=0.004) purine ribonucleotide binding (p=0.03) DNA metabolic process/Purine metabolism(p=0.02) 43 genes (overlap of 3 circles) positive regulation of apoptosis (p=0.09) steroid metabolic process (p=0.02)
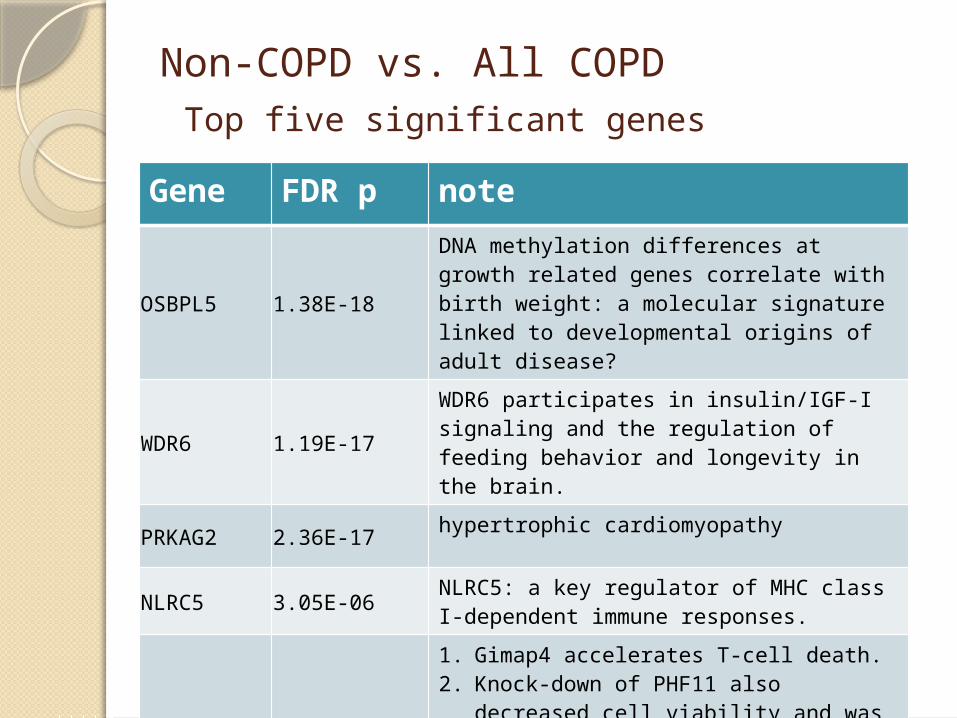
Non-COPD vs. All COPD Top five significant genes
Gene FDR p note
OSBPL5 1.38E-18DNA methylation differences at growth related genes correlate with birth weight: a molecular signature linked to developmental origins of adult disease?
WDR6 1.19E-17WDR6 participates in insulin/IGF-I signaling and the regulation of feeding behavior and longevity in the brain.
PRKAG2 2.36E-17hypertrophic cardiomyopathy
NLRC5 3.05E-06NLRC5: a key regulator of MHC class I-dependent immune responses.
GIMAP4 1.53E-05
1. Gimap4 accelerates T-cell death. 2. Knock-down of PHF11 also decreased cell
viability and was accompanied by reduced expression of GIMAP4 and 5 genes required for T-cell differentiation, viability and homeostasis.
ConclusionThe DNA methylation should be a good biomarker for
investigating the pharmaco-epigenetics of COPD.
Methylation status of COPD susceptibility gene(s), inflammatory gene(s) and glucocorticoid receptor gene associate to outcome of 2-week corticosteroid treatment in AECOPD patients
Responsiveness of corticosteroids, should reflect COPD heterogeneity, especially in pathology involving DNA methylation.
Future worksTo link the prognosis of COPD and
DNA methylation.
To find the new candidate gene(s) or pathological mechanism of COPD by DNA methylation approach

AcknowledgementDr. Shih-Wei Lee (General
Taoyuan Hospital)
Dr. Paul Wei-Che Hsu (Bioinformatics service center, IMB, Academia Sinica)
Dr. Jiu-Yao Wang (NCKU)

Thank you for your attention