Embed Size (px)
Citation preview

Prepared by: McDowell Group
Wholesale
Market Profiles
for Alaska Groundfish
and Crab Fisheries
May 2016

Authors and Contributions:From NMFS-Alaska Fisheries Science Center: Ben Fissel (PI, project oversight, project design, and editor), Ron Felthoven (project oversight, project design), Brian Garber-Yonts (editor). From McDowell Group, Inc.: Jim Calvin (project oversight and editor), Andy Wink (lead author/analyst), Stephanie Warpinski (author/analyst), Garrett Evridge (author/analyst), Dan Lesh (author/analyst). From Pacific States Marine Fisheries Commission: Bob Ryznar (project oversight and sub-contractor management), Jean Lee (data compilation and analysis)
This report was produced and funded by the National Marine Fisheries Service’s Alaska Fisheries Science Center. Funding was awarded through competitive contracts to the Pacific States Marine Fisheries Commission and McDowell Group, Inc.
The analysis was conducted during the summer and fall of 2015, based primarily on 2014 harvest and market data. A final review by Alaska Fisheries Science Center staff was completed in February 2016 and the document was finalized in March 2016. Data throughout the report was compiled in July-Sept. 2015. Revisions to source data after this time may not be reflected in this report. Typically, revisions to economic fisheries data are not substantial and data presented here accurately reflect the trends in the analyzed markets. For data sourced from NMFS and the Alaska Fisheries Information Network (AKFIN) the reader should refer to the Economic Status Report of the Groundfish Fisheries Off Alaska, 2014 and Economic Status Report of the BSAI King and Tanner Crab Fisheries Off Alaska, 2014 for the official and most recent data publicly available at (http://www.afsc.noaa.gov/REFM/Socioeconomics/SAFE/default.php).
The findings and conclusions in the paper are those of the author(s) and do not necessarily represent the views of the National Marine Fisheries Service, NOAA.
Reference to trade names does not imply endorsement by the National Marine Fisheries Service, NOAA.
All images are for illustrative and informational purposes only and their use does not imply endorsement by the National Marine Fisheries Service, NOAA. With regards to images obtained through the World Wide Web (e.g., Wikipedia, Wikimedia) every attempt has been made to comply with the stated use standards and give appropriate attribution. The National Marine Fisheries Service, NOAA, is a not for profit organization.
This document should be cited as follows:Alaska Fisheries Science Center. 2016. Wholesale market profiles for Alaska groundfish and crab fisheries. 134 p. Alaska Fish. Sci. Cent., NOAA, Natl. Mar. Fish. Serv., 7600 Sand Point Way NE, Seattle WA 98115.

Alaska Groundfish and Crab Wholesale Market Profiles NOAA/NMFS • iii
Table of Contents
Table of Contents ........................................................................................................................................ iii List of Tables .................................................................................................................................... v List of Figures .................................................................................................................................. vii Executive Summary ............................................................................................................... ix Key Markets for Alaska Groundfish and Crab .....................................................................xi Glossary of Terms and Abbreviations ............................................................................................... xiv Abbreviations and Acronyms ......................................................................................................... xiv Glossary of Terms ........................................................................................................................... xv Global Groundfish Production and Key Markets .................................................................................. 1 Alaska Groundfish Production and Market Summary ..................................................................... 1 Global Whitefish and Other Marine Fish Production ...................................................................... 1 Alaska’s Position in the Global Whitefish Market ............................................................................ 3 Summary of Key Alaska Groundfish Markets .................................................................................. 5 Wholesale Market Profiles for Alaska Pollock Products ....................................................................... 7 Fishery Summary.............................................................................................................................. 7 Alaska Pollock Production ................................................................................................................ 9 Wholesale Market Profile of Alaska Pollock Fillets ........................................................................ 13 Wholesale Market Profile of Alaska Pollock Surimi ....................................................................... 23 Wholesale Market Profile of Alaska Pollock Roe ........................................................................... 30 Wholesale Market Profile of Alaska H&G Pollock.......................................................................... 35 Global Pollock Production and Competing Supply ........................................................................ 39 Wholesale Market Profile for Pacific Cod .......................................................................................... 42 Fishery Summary............................................................................................................................ 42 Production Summary ..................................................................................................................... 44 Production Volume and Value of H&G and Fillets ......................................................................... 45 Product Description and Supply Chain of H&G and Fillets ............................................................ 47 Key Markets for Pacific Cod ........................................................................................................... 50 Global Production and Competing Supply ..................................................................................... 54 Wholesale Market Profile for Yellowfin Sole ..................................................................................... 57 Fishery Summary............................................................................................................................ 57 Product Description and Supply Chain .......................................................................................... 58 Production Volume and Value ....................................................................................................... 59 Wholesale Market Profile for Rock Sole ............................................................................................ 60 Fishery Summary............................................................................................................................ 60 Product Description and Supply Chain .......................................................................................... 61 Production Volume and Value ....................................................................................................... 62 Key Markets for Alaska Sole Species .............................................................................................. 63 Global Production and Competing Supply ..................................................................................... 67 Wholesale Market Profile for Atka Mackerel .................................................................................... 69 Fishery Summary............................................................................................................................ 69 Product Description and Supply Chain .......................................................................................... 71 Production Volume and Value ....................................................................................................... 71 Key Markets for Atka Mackerel ..................................................................................................... 72 Global Production and Competing Supply ..................................................................................... 73 Wholesale Market Profile for Pacific Ocean Perch ............................................................................. 75 Fishery Summary............................................................................................................................ 75 Product Description and Supply Chain .......................................................................................... 76 Production Volume and Value ....................................................................................................... 77

Alaska Groundfish and Crab Wholesale Market Profiles NOAA/NMFS • iv
Key Markets for Pacific Ocean Perch ............................................................................................. 78 Global Production and Competing Supply ..................................................................................... 80 Wholesale Market Profile for Sablefish ............................................................................................. 81 Fishery Summary............................................................................................................................ 81 Product Description and Supply Chain .......................................................................................... 83 Production Volume and Value ....................................................................................................... 84 Key Markets for Alaska Sablefish ................................................................................................... 86 Global Production and Competing Supply ..................................................................................... 89 Wholesale Market Profile for Pacific Halibut ..................................................................................... 90 Fishery Summary............................................................................................................................ 90 Product Description and Supply Chain .......................................................................................... 91 Production Volume and Value ....................................................................................................... 93 Key Markets for Pacific Halibut ...................................................................................................... 94 Global Production and Competing Supply ..................................................................................... 96 Wholesale Market Profile for Ancillary Products ............................................................................... 98
Key Products Analysis ............................................................................................................................ 100 Fish Meal ...................................................................................................................................... 101 Fish Oil .......................................................................................................................................... 104 Other Groundfish Ancillary Products ........................................................................................... 107 Wholesale Market Profile for Snow Crab ........................................................................................ 109
Fishery Summary ................................................................................................................................... 109 Product Description and Supply Chain ........................................................................................ 111 Production Volume and First Wholesale Value ........................................................................... 112 Production Analysis ...................................................................................................................... 114 Key Markets for Snow Crab ......................................................................................................... 115 Global Production and Competing Supply ................................................................................... 118 Wholesale Market Profile for King Crab .......................................................................................... 120
Fishery Summary ................................................................................................................................... 120 Product Description and Supply Chain ........................................................................................ 122 Production Volume and First Wholesale Value ........................................................................... 123 Production Analysis ...................................................................................................................... 125 Key Markets for King Crab ........................................................................................................... 126 Global Production and Competing Supply ................................................................................... 128
References .......................................................................................................................... 131

Alaska Groundfish and Crab Wholesale Market Profiles NOAA/NMFS • v
List of Tables Executive Summary Tables
Executive Summary Table 1. Average First Wholesale Value per Metric Ton, 2010-2014................................................................ xi Executive Summary Table 2. Primary Sales of First Wholesale Alaska Groundfish and Crab Products by Market, 2010-2014 ............................................................................................................................................... xi Executive Summary Table 3. Alaska Groundfish and Crab Production and Market Summary, 2014............................................... xii Executive Summary Table 4. Changes in Relevant Currency Exchange Rates, October 2013 vs. October 2015 ............................. xiii Tables Table 1. Alaska Groundfish Production and Market Summary, 2014 ............................................................................................... 1 Table 2. Global Whitefish and Other Marine Fish Species Production (mt), 2013 ............................................................................ 2 Table 3. Imports of Tilapia and Pangasius Products, United States and Europe vs. Other Markets, 2012-2014 .............................. 5 Table 4. Wholesale Sales of Alaska Groundfish Meat Products (mt), 2014 ...................................................................................... 6 Table 5. Summary Profile of Alaska Pollock Wholesale Production and Markets, 2014 ................................................................... 7 Table 6. Alaska Pollock Harvest Volume in Federal and State Fisheries (mt), 2010-2014 ................................................................ 8 Table 7. Production Volumes and Recovery Rates for Common Alaska Pollock Products, 2014 .................................................... 10 Table 8. Alaska Pollock Production Composition, by First Wholesale Volume, 2005-2014 ............................................................ 11 Table 9. Alaska Pollock Production Composition, by First Wholesale Value, 2005-2014................................................................ 12 Table 10. Unit Value per Metric Ton for Major Alaska Pollock Products, 2005-2014 ..................................................................... 12 Table 11. First Wholesale Value, Alaska Pollock Fillets, $Millions .................................................................................................. 16 Table 12. Alaska Pollock Fillet Unit Value per Metric Ton and Production Composition, 2010-2014 ............................................. 16 Table 13. Sales of Alaska Pollock Fillets to Key Markets (mt), 2010-2014 ...................................................................................... 17 Table 14. European Imports of Pollock Fillets from Major Producers (mt), 2010-2014 ................................................................. 19 Table 15. Estimated U.S. Pollock Fillet Market Supply (mt), 2010-2014 ......................................................................................... 21 Table 16. Brazil Imports of Frozen Pollock and Salted/Dried Fish from China and United States................................................... 22 Table 17. Pollock Fillet Production from Alaska and Russia (mt), 2010-2014 ................................................................................. 23 Table 18. First Wholesale Value, Alaska Pollock Surimi, $Millions ................................................................................................. 25 Table 19. U.S. Exports of Alaska Pollock Surimi by Country (mt), 2010-2014 ................................................................................. 26 Table 20. Japan Surimi Imports from Major Producers (mt), 2010-2014 ....................................................................................... 27 Table 21. Total and Unit Value of Japan Surimi Imports, 2010-2014 .............................................................................................. 28 Table 22. Global Surimi Production (mt), 2010-2014 ..................................................................................................................... 29 Table 23. First Wholesale Value, Alaska Pollock Roe, $Millions...................................................................................................... 31 Table 24. Exports of Alaska Pollock Roe by Country (mt), 2010-2014 ............................................................................................ 33 Table 25. Japan Pollock Roe Imports (mt), 2010-2014 ................................................................................................................... 33 Table 26. Value of Japan Pollock Roe Imports, 2010-2014 ............................................................................................................. 34 Table 27. South Korean Pollock Roe Trade (mt), 2012-2014 .......................................................................................................... 35 Table 28. First Wholesale Value, Frozen H&G Alaska Pollock, $Millions ........................................................................................ 36 Table 29. Imports of Alaska H&G Pollock by Country (mt), 2012-2014 .......................................................................................... 38 Table 30. China Imports of Frozen H&G Pollock by Country (mt), 2012-2014 ................................................................................ 38 Table 31. Chinese Re-exports of Frozen Alaska Pollock Fillets, by Market, 2014............................................................................ 39 Table 32. Global Pollock Harvest by Major Producer (mt), 2010-2014 ........................................................................................... 40 Table 33. Competing Whitefish Supply Trends ............................................................................................................................... 41 Table 34. Summary Profile of Pacific Cod Wholesale Production and Markets, 2014 .................................................................... 42 Table 35. Pacific Cod Harvest Volume for Federal and State Fisheries (mt), 2010-2014 ................................................................ 43 Table 36. First Wholesale Value, Alaska Pacific Cod, $Millions ....................................................................................................... 44 Table 37. Alaska Pacific Cod Production Volume and First Wholesale Value, by Region, 2014 ...................................................... 46 Table 38. Common Pacific Cod Products, Alaska Production, and Recovery Rates, 2014 .............................................................. 47 Table 39. Sales of H&G Alaska Pacific Cod to Key Markets (mt), 2010-2014 .................................................................................. 51 Table 40. Sales of Alaska Pacific Cod Fillets to Key Markets (mt), 2010-2014 ................................................................................ 51 Table 41. Total Cod Imports into U.S. Market, Volume and Value, 2010-2014 .............................................................................. 52 Table 42. Total Imports and Price/kg for Cod Fillets into the U.S. Market, 2012-2014 .................................................................. 52 Table 43. Primary Export Markets for Chinese Twice-Frozen Cod Fillets (mt), 2012-2014 ............................................................. 53 Table 44. Alaska Pacific Cod Export Volume to Major Asian Markets (mt), 2010-2014 .................................................................. 53 Table 45. European Imports of Cod Fillets from Major Producers (mt), 2012-2014 ....................................................................... 54 Table 46. Major Cod Producing Nations (Thousands mt), 2012-2014 ............................................................................................ 55 Table 47. Summary Profile of Yellowfin Sole Wholesale Production and Markets, 2014 ............................................................... 57 Table 48. Yellowfin Sole Harvest Volume in Federal Fisheries (mt), 2010-2014 ............................................................................. 58 Table 49. First Wholesale Value of Alaska Yellowfin Sole, in $Millions ........................................................................................... 59 Table 50. Summary Profile of Rock Sole Wholesale Production and Markets, 2014 ...................................................................... 60 Table 51. Rock Sole Harvest Volume in Federal Fisheries (mt), 2010-2014 .................................................................................... 61 Table 52. Alaska Rock Sole Production Volume and Value, 2014 ................................................................................................... 62

Alaska Groundfish and Crab Wholesale Market Profiles NOAA/NMFS • vi
Table 53. U.S. Yellowfin Sole Exports by Major Country (mt), 2013-2014 ...................................................................................... 64 Table 54. U.S. Rock Sole Exports by Major Country (mt), 2013-2014 ............................................................................................. 64 Table 55. China Flatfish Exports, by Value and Volume, 2012-2014 ............................................................................................... 64 Table 56. U.S. Rock Sole Exports to Japan (mt), 2010-2014 ............................................................................................................ 65 Table 57. Summary Profile of Atka Mackerel Wholesale Production and Markets, 2014 .............................................................. 69 Table 58. Atka Mackerel Harvest Volume in Federal Fisheries (mt), 2010-2014 ............................................................................ 70 Table 59. Atka Mackerel TACs in All Federal Fisheries (mt), 2010-2016 ......................................................................................... 71 Table 60. First Wholesale Value of Atka Mackerel, in $Millions, 2005-2014 .................................................................................. 72 Table 61. Alaska Atka Mackerel Exports by Major Country (mt), 2010-2014 ................................................................................. 72 Table 62. Summary Profile of Pacific Ocean Perch Wholesale Production and Markets, 2014 ...................................................... 75 Table 63. Pacific Ocean Perch Harvest Volume in Federal Fisheries (mt), 2010-2014 .................................................................... 76 Table 64. Pacific Ocean Perch TACs in All Alaska Federal Fisheries (mt), 2012-2016 ..................................................................... 76 Table 65. First Wholesale Value of Alaska Rockfish Species, in $Millions, 2005-2014 .................................................................... 78 Table 66. Alaska Rockfish Exports by Major Country (mt), 2014 .................................................................................................... 79 Table 67. Japan Imports of Rockfish by Major Trading Partner (mt), 2013 and 2014..................................................................... 80 Table 68. Summary Profile of Sablefish Wholesale Production and Markets, 2014 ....................................................................... 81 Table 69. Sablefish Harvest Volume for Federal and State Fisheries (mt), 2010-2014 ................................................................... 82 Table 70. Common Sablefish Products, 2014 Alaska Production Volume, and Recovery Rates (Pct.) ............................................ 83 Table 71. First Wholesale Value, Alaska Sablefish, $Millions .......................................................................................................... 84 Table 72. Alaska Sablefish First Wholesale Volume and Value by Top Ports, 2014 ........................................................................ 86 Table 73. U.S. Sablefish Exports to Global Markets, 2014 .............................................................................................................. 86 Table 74. Japan Frozen H&G Sablefish Imports, by Major Trade Partner, 2009-2014 .................................................................... 87 Table 75. Estimated U.S. Sablefish Market Supply (mt), 2010-2014 ............................................................................................... 88 Table 76. Summary Profile of Pacific Halibut Wholesale Production, 2014 .................................................................................... 90 Table 77. Alaska Commercial Halibut Landings, in Metrics Tons, 2010-2014 ................................................................................. 91 Table 78. Common Halibut Products: 2014 Alaska Production Volume and Recovery Rates (Pct.) ............................................... 92 Table 79. Alaska Halibut First Wholesale Volume and Value by Top Ports/Regions, 2014 ............................................................. 94 Table 80. Estimated U.S. Halibut Market Supply (mt), 2010-2014 ................................................................................................. 96 Table 81. Summary Profile of Ancillary Products Wholesale Production and Markets, 2014......................................................... 98 Table 82. First Wholesale Value and Ancillary Products as Percent of Total Wholesale Value, 2005-2014 ................................... 99 Table 83. Alaska Groundfish Fish Meal First Wholesale Value, in $Millions, 2005-2014 .............................................................. 102 Table 84. First Wholesale Value per Metric Ton of Alaska Fish Meal Products, by Species, 2014 ................................................ 102 Table 85. Exports of Alaska Fish Meal, 2010-2014 ........................................................................................................................ 103 Table 86. Total First Wholesale Value of Alaska Groundfish Oil Production, in $Millions, 2005-2014 ......................................... 105 Table 87. First Wholesale Value of Select Ancillary Products, in $Millions, 2010-2014 ................................................................ 107 Table 88. Summary Profile of Alaska Snow Crab Wholesale Production and Markets ................................................................. 109 Table 89. Alaska Snow Crab Harvest/TAC for Federal and State Fisheries, in Millions lb., 2011-2016 ......................................... 111 Table 90. Alaska Snow Crab Volume and Wholesale Value by Region, 2014 ................................................................................ 113 Table 91. Volume and Wholesale Value of Snow Crab Products, 2014 ........................................................................................ 114 Table 92. First Wholesale Value of Snow Crab Sections, in $Millions, 2005-2014 ........................................................................ 115 Table 93. Estimated Sales of Alaska Snow Crab to Key Markets, in Millions lb., 2010-2014 ........................................................ 115 Table 94. Estimated U.S. Snow Crab Market Supply, in Millions lb., 2010-2014 .......................................................................... 116 Table 95. Japanese Imports of Snow Crab, 2010-2014 ................................................................................................................. 117 Table 96. Summary Profile of Alaska King Crab Wholesale Production and Markets, 2014 ......................................................... 120 Table 97. Alaska King Crab Harvest/TAC in Federal and State Fisheries, in Millions lb., 2010-2015 ............................................. 122 Table 98. King Crab Section Sizing ................................................................................................................................................ 122 Table 99. Alaska King Crab First Wholesale Volume and Value by Region, 2014 .......................................................................... 124 Table 100. Production Volume and First Wholesale Value of King Crab Products, 2014 .............................................................. 125 Table 101. First Wholesale Value of Alaska King Crab Sections, in $Millions, 2004-2014 ............................................................ 125 Table 102. Estimated Sales of Alaska King Crab to Key Markets, in Millions lb., 2010-2014 ........................................................ 126 Table 103. Estimated U.S. King Crab Market Supply, in Millions lb., 2010-2014 .......................................................................... 127 Table 104. Japanese Imports of King Crab, 2010-2014 ................................................................................................................. 128

Alaska Groundfish and Crab Wholesale Market Profiles NOAA/NMFS • vii
List of Figures Executive Summary Figures
Executive Summary Figure 1. Composition of Total First Wholesale Volume and Value for Alaska Seafood, by Species, 2014 ...... ix Executive Summary Figure 2. Total First Wholesale Volume and Value of Alaska Groundfish and Crab, by Product Type, 2014 ..... x Executive Summary Figure 3. First Wholesale Volume and Value of Alaska Groundfish and Crab Species, 2010-2014 ................... x Figures Figure 1. Total Farmed Tilapia and Pangasius Production (mt), 1990-2013 ..................................................................................... 4 Figure 2. Pollock Harvest Volume in Alaska (mt), 1977-2014 ........................................................................................................... 8 Figure 3. First Wholesale Volume and Value for Alaska Pollock, 1992-2014 .................................................................................... 9 Figure 4. Alaska Pollock First Wholesale Production Volume and Value, by Product Type, 2014 .................................................. 10 Figure 5. Alaska Pollock Fillet Supply Chain .................................................................................................................................... 15 Figure 6. First Wholesale Volume and Value for Alaska Pollock Fillets, 2005-2014 ........................................................................ 16 Figure 7. Alaska Pollock Fillets Volume and Value by Processing Sector, 2005-2014 ..................................................................... 17 Figure 8. Exports of Alaska Pollock Fillets to Major European Markets, 2010-2014 ....................................................................... 19 Figure 9. Alaska Pollock Surimi Supply Chain .................................................................................................................................. 24 Figure 10. First Wholesale Volume and Value for Alaska Pollock Surimi, 2005-2014 ..................................................................... 25 Figure 11. Alaska Pollock Surimi First Wholesale Volume and Value by Processing Sector, 2004-2014. ........................................ 25 Figure 12. Alaska Pollock Roe Supply Chain .................................................................................................................................... 31 Figure 13. First Wholesale Volume and Value for Alaska Pollock Roe, 2005-2014 ......................................................................... 31 Figure 14. Alaska Pollock First Wholesale Value and Roe as Percent of Total Value, 1992-2014 ................................................... 32 Figure 15. Alaska Pollock Roe Production and Harvest Volume (mt), 2010-2014 .......................................................................... 32 Figure 16. Alaska Pollock Head & Gut Supply Chain ....................................................................................................................... 36 Figure 17. First Wholesale Volume and Value for Frozen H&G Alaska Pollock, 2005-2014 ............................................................ 36 Figure 18. Head and Gut Production Share, 2003-2014 ................................................................................................................. 37 Figure 19. Alaska Pollock H&G Volume and Value, by Processing Sector, 2004-2014 .................................................................... 37 Figure 20. Global Harvest Volume of Alaska Pollock (mt), 1977-2014 ............................................................................................ 40 Figure 21. Pacific Cod Harvest Volume in Alaska (mt), 1977-2014 ................................................................................................. 43 Figure 22. Share of Alaska Pacific Cod Harvest by Gear Type, 2014 ............................................................................................... 44 Figure 23. First Wholesale Volume and Value for Alaska Pacific Cod, 2005-2014 .......................................................................... 44 Figure 24. Volume and Value of Pacific Cod Wholesale Production in Alaska, by Product Type, 2014 .......................................... 45 Figure 25. Pacific Cod H&G Production in Alaska, by Volume and Value, 1992-2014 .................................................................... 46 Figure 26. Alaska Pacific Cod Supply Chain (Meat Products Only) .................................................................................................. 47 Figure 27. Alaska Pacific Cod H&G Wholesale Production and Exports, 2007-2014 ....................................................................... 48 Figure 28. H&G as Percent of Total Alaska Pacific Cod Exports, 2007-2014 ................................................................................... 49 Figure 29. First Wholesale and Export Values for Alaska Pacific Cod Fillets, in $Thousands, 2010-2014 ....................................... 50 Figure 30. Total Alaska Pacific Cod Exports, by Volume and Value, 2007-2014.............................................................................. 50 Figure 31. U.S. Imports of Cod Fillets from Major Trading Partners (mt), 2012-2014 .................................................................... 52 Figure 32. Global Supply of Pacific Cod (mt), 1950-2013 ................................................................................................................ 55 Figure 33. Global Supply of Pacific and Atlantic Cod (mt), 1950-2013 ............................................................................................ 56 Figure 34. Comparison of Shatterpack Cod Value between Alaska and Competitors, 2005-2014 ................................................. 56 Figure 35. Yellowfin Sole Harvest Volume in Alaska (mt), 1983-2014 ............................................................................................ 58 Figure 36. First Wholesale Volume and Value of Alaska Yellowfin Sole, 2010-2014 ...................................................................... 59 Figure 37. Rock Sole Harvest Volume in Alaska (mt), 1985-2014 ................................................................................................... 61 Figure 38. Alaska Rock Sole Supply Chain ....................................................................................................................................... 62 Figure 39. First Wholesale Volume and Value for Alaska Rock Sole, 2010-2014 ............................................................................ 63 Figure 40. Share of U.S. Imports of Sole, by Region/Country, 2014 ............................................................................................... 65 Figure 41. Cost/Value Added to Sole by Chinese Secondary Processors, 2007-2015 ..................................................................... 66 Figure 42. Composition of Alaska Flatfish Production, by Species, by First Wholesale Volume, 2010-2014 .................................. 67 Figure 43. Average Composition of Global Production of Flatfish, by Species, by Volume, 2010-2013 ......................................... 68 Figure 44. Global Flatfish Supply and Alaska Harvest of Yellowfin and Rock Sole, 1975-2013 ....................................................... 68 Figure 45. Atka Mackerel Harvest Volume in Alaska (mt), 1986-2014............................................................................................ 70 Figure 46. First Wholesale Volume and Value for Atka Mackerel, 2005-2014 ................................................................................ 72 Figure 47. Global Atka Mackerel Harvest (mt), 1980-2013 ............................................................................................................. 74 Figure 48. Pacific Ocean Perch Harvest Volume in Alaska (mt), 1977-2014 ................................................................................... 75 Figure 49. First Wholesale Volume and Value for Alaska Rockfish Species, 2005-2014 ................................................................. 78 Figure 50. Global Rockfish (Sebastes spp.) Harvest (mt), 1980-2013 ............................................................................................. 80 Figure 51. Alaska Sablefish Supply Chain ........................................................................................................................................ 84 Figure 52. First Wholesale Volume and Value of Alaska Sablefish, 2005-2014............................................................................... 84 Figure 53. Alaska Wholesale and Ex-Vessel Prices per Pound, 1995-2014 ..................................................................................... 85

Alaska Groundfish and Crab Wholesale Market Profiles NOAA/NMFS • viii
Figure 54. U.S. Exports of Sablefish by Top 5 Asia Countries (excluding Japan), in $Thousands, 2009-2014 ................................. 88 Figure 55. Global Supply of Sablefish (mt), 2003-2014 ................................................................................................................... 89 Figure 56. Alaska Halibut Harvests/TACs (mt), 1950-2014 ............................................................................................................. 91 Figure 57. Alaska Halibut Supply Chain ........................................................................................................................................... 92 Figure 58. First Wholesale Volume and Value of Pacific Halibut in Alaska, 1985-2014 .................................................................. 93 Figure 59. Alaska Halibut First Wholesale and Ex-Vessel Price per Pound, 1995-2014 ................................................................. 94 Figure 60. North American Halibut Supply and Wholesale Price, 2005-2015 ................................................................................. 95 Figure 61. Global Supply of Pacific Halibut (mt), 1950-2013 .......................................................................................................... 96 Figure 62. Pacific and Atlantic Halibut Harvest Volume (mt), 2004-2013 ....................................................................................... 97 Figure 63. First Wholesale Volume and Value of Ancillary Products from Alaska Groundfish, 2005-2014..................................... 99 Figure 64. Alaska Ancillary Product Wholesale Production Value, by Key Species, 2005-2014 ...................................................... 99 Figure 65. Alaska Ancillary Product First Wholesale Value and Volume, by Key Groundfish Species, 2014 ................................. 100 Figure 66. Alaska Groundfish Ancillary Product First Wholesale Value, by Product Type, 2005-2014 ......................................... 100 Figure 67. Alaska Ancillary Product First Wholesale Value and Volume, by Product Type, 2014 ................................................. 101 Figure 68. Alaska Fish Meal Production and Value, 2005-2014 .................................................................................................... 102 Figure 69. Exports of Alaska Fish Meal, 2010-2014 ...................................................................................................................... 103 Figure 70. First Wholesale Value and Volume of Alaska Groundfish Fish Oil Production, 2005-2014 .......................................... 105 Figure 71. Exports of Alaska Fish Oil, 2010-2014 .......................................................................................................................... 106 Figure 72. First Wholesale Value of Other Ancillary Products from Alaska Groundfish, 2005-2014............................................. 107 Figure 73. Annual Snow and King Crab Harvests in Alaska, in Millions lb., 1967-2014 ................................................................. 110 Figure 74. Alaska Snow Crab Supply Chain ................................................................................................................................... 112 Figure 75. First Wholesale Production Volume of Alaska Snow Crab, in Millions lb., 2005-2014 ................................................. 113 Figure 76. First Wholesale Production Value of Alaska Snow Crab, in $Millions, 2005-2014 ....................................................... 114 Figure 77. First Wholesale Value and Volume of Snow Crab Sections, 2005-2014 ....................................................................... 115 Figure 78. Estimated Source of Snow Crab Consumed in the United States, 2014 ...................................................................... 116 Figure 79. U.S. Snow Crab Exports to China, 2007-2014............................................................................................................... 117 Figure 80. Global Harvest Volume of Snow Crab, in Millions lb., 2005-2013 ................................................................................ 119 Figure 81. Global Snow Crab Harvest by Country, 2013 ............................................................................................................... 119 Figure 82. Annual King Crab Landings in Alaska, in Millions lb., 1950-2014 ................................................................................. 121 Figure 83. Alaska King Crab Supply Chain ..................................................................................................................................... 123 Figure 84. First Wholesale Production Volume Alaska King Crab, in Millions lb., 2004-2014 ....................................................... 124 Figure 85. First Wholesale Value of Alaska King Crab, in $Millions, 2004-2014 ........................................................................... 124 Figure 86. First Wholesale Volume and Value of King Crab Sections, 2004-2014 ......................................................................... 125 Figure 87. Estimated Source of King Crab Consumed in the United States, 2014 ........................................................................ 127 Figure 88. U.S. Red King Crab Exports to Japan, 2005-2014 ......................................................................................................... 128 Figure 89. Estimated Global Supply of King Crab, in Millions lb., 2004-2013 ............................................................................... 129 Figure 90. Estimated Proportions of Global King Crab Supply, 2013 ............................................................................................ 130

Alaska Groundfish and Crab Wholesale Market Profiles NOAA/NMFS • ix
Pollock45%
Pacific Cod12%
Salmon18%
Halibut/ Sablefish
1%
Crab2%
Flatfish14%
Other8%
Volume
Executive Summary
This comprehensive series of wholesale market profiles examines federally managed groundfish and crab species caught in Alaska commercial fisheries. Each profile summarizes the fishery and provides in-depth information of wholesale production volume and value, product mix, supply chain, competing supply, and key markets.
Alaska’s commercial fisheries are the most productive in the Nation, accounting for 60 percent of total 2014 U.S. commercial fishery harvest volume. In 2014, first wholesale production of 1.28 million metric tons of all Alaska species combined was valued at $4.27 billion (Executive Summary Figure 1).1 The majority of Alaska seafood is exported, with overall exports estimated at 1.12 million metric tons valued at $3.28 billion.2 Alaska groundfish and crab species covered in this report accounted for 78 percent of Alaska’s total wholesale production volume in 2014, and 65 percent of the first wholesale value. Alaska pollock is the most plentiful and most valuable species, accounting for 45 percent of total production volume and 33 percent of the total production value.
Executive Summary Figure 1. Composition of Total First Wholesale Volume and Value for Alaska Seafood, by Species, 2014
In 2014, the Bering Sea/Aleutian Islands (BSAI) region produced 86 percent of total wholesale groundfish production volume and 83 percent of the value. The Gulf of Alaska (GOA) and Southeast Alaska region
1 See glossary defining first wholesale volume/value and other terms commonly used in this report. 2 Here, export volume (shipping weight) includes the weight of packaging materials, while production volume (net weight) excludes the weight of packaging materials). Export value is the value upon exiting the country, including costs/profits associated with shipping. First wholesale value is generally equal to the value of product as it leaves Alaska.
Pollock33%
Pacific Cod11%
Salmon33%
Halibut/Sablefish
5% Crab9%
Flatfish5%
Other5%
Value 1.28 million mt $4.27 billion

Alaska Groundfish and Crab Wholesale Market Profiles NOAA/NMFS • x
H&G/Whole Fish42%
Surimi18%
Fillets20%
Roe3%
Ancillary/Other14%
Crab Sections
3%
Volume
produced the remainder: 13 percent of total wholesale groundfish production volume and 16 percent of the volume.
The majority of these products are considered intermediate products, which undergo secondary processing outside Alaska to create finished products for retail and food service buyers around the world. Executive Summary Figure 2 summarizes first wholesale production volume and value of key groundfish and crab products by general product type.
Executive Summary Figure 2. Total First Wholesale Volume and Value of Alaska Groundfish and Crab, by Product Type, 2014
Executive Summary Figure 3. First Wholesale Volume and Value of Alaska Groundfish and Crab Species, 2010-2014
Source: AKFIN.
The total value of Alaska groundfish and crab has remained steady over the last 5 years (2010-2014, see Executive Summary Figure 3). Value per metric ton for each species category are shown below in Executive Summary Table 1. Changes in value are the result of numerous factors, summarized on page xii and examined in greater detail in this report.
1 million mt $2.79 billion
$2,000
$2,200
$2,400
$2,600
$2,800
$3,000
$3,200
0
200,000
400,000
600,000
800,000
1,000,000
1,200,000
2010 2011 2012 2013 2014
Valu
e ($
mill
ions
)
Volu
me
(mt)
Volume (in mt) Value (in $millions)
H&G/Whole Fish34%
Surimi15%
Fillets25%
Roe6%
Ancillary/Other7%
Crab Sections
13%
Value

Alaska Groundfish and Crab Wholesale Market Profiles NOAA/NMFS • xi
Executive Summary Table 1. Average First Wholesale Value per Metric Ton, 2010-2014
2010 2011 2012 2013 2014 Pct. Change in 2014 from Prior 4-yr. Avg.
Alaska Pollock $2,906 $2,772 $2,874 $2,443 $2,425 -12%
Pacific Cod 3,042 3,484 3,154 2,735 3,053 -2%
Yellowfin Sole 1,154 1,400 1,387 1,287 1,043 -20%
Rock Sole 1,368 1,705 1,990 1,333 1,290 -19%
Pacific Halibut 14,659 17,693 15,508 14,419 17,194 10%
Sablefish 15,247 19,220 14,316 12,250 14,776 -3%
Pacific Ocean Perch 2,459 3,560 3,137 2,259 2,578 -10%
Atka Mackerel 1,861 2,292 2,480 2,705 3,032 30%
Snow Crab 7,277 12,054 10,559 11,052 11,650 14%
King Crab 25,273 32,573 27,144 24,370 23,968 -12%
Source: AKFIN.
Key Markets for Alaska Groundfish and Crab The United States, Europe, and Japan are the largest markets for finished products derived from Alaska groundfish and crab, typically accounting for more than 80 percent of first wholesale value. Approximately one-third of the Alaska groundfish and crab production volume is reprocessed in China (Executive Summary Table 2). After secondary processing in China a large share of these products are re-exported to markets in Europe, the United States, and Japan. A significant amount of product exported to South Korea is held in cold storage facilities or reprocessed before re-exported to Japan and Europe.
Executive Summary Table 2. Primary Sales of First Wholesale Alaska Groundfish and Crab Products by Market, Estimated Annual Average Volume and Value, 2010-2014
Market First Wholesale Value ($millions)
Est. Pct. of Market Share (Value) Sales Volume (mt)
Est. Pct. of Market Share (Volume)
China* $615 22% 281,533 33%
Japan 454 16% 144,936 17%
Europe 495 17% 168,026 19%
South Korea* 313 11% 108,432 13%
Other Countries 220 8% 60,030 7%
Export Markets Total $2,097 74% 762,957 89%
Est. Domestic Market $736 26% 99,779 11%
*Primarily re-export markets.Source: AKFIN, ADF&G (COAR), ASMI Alaska Seafood Export Database, and McDowell Group estimates.
Species profiled in this report represent a significant proportion of the global seafood trade between nations; however, most species face market competition from fisheries in other countries. Executive Summary Table 3 summarizes first wholesale production volume and value of Alaska groundfish and crab products, the percent of global harvest volume, and key initial markets for each species.

Alaska Groundfish and Crab Wholesale Market Profiles NOAA/NMFS • xii
Executive Summary Table 3. Alaska Groundfish and Crab Production and Market Summary, 2014
Species/Product First Wholesale Value ($millions)
Alaska Production Volume (mt)
Pct. of Global Harvest (2013) ---------- Key Markets ----------
Alaska Pollock $1,407 580,120 43% Japan Europe U.S.
Pacific Cod $472 154,580 18% China* Europe U.S.
Flatfish $209 172,510 32% China* U.S. Europe
Pacific Halibut $109 6,160 57% U.S. Canada --
Sablefish $99 6,700 78% Japan China U.S.
Atka Mackerel $63 32,280 19% Japan China* Korea
Rockfish $81 20,880 28% China* Japan U.S.
King Crab $117 4,870 15% U.S. Japan --
Snow Crab $233 20,020 15% U.S. Japan China
*Denotes re-export market. Source: AKFIN, ADF&G (COAR), and McDowell Group estimates.
Current Market Issues The value of Alaska seafood is affected by a range of market forces. Species profiles contain detailed information about how these forces impact the value of Alaska production; noteworthy market factors are summarized by species below.
ALASKA POLLOCK • Marine Stewardship Council (MSC)
certification of Russia’s largest pollock fishery has depressed prices for pollock fillets in Europe, a market where certification is required by many large retailers.
• Increasing production volume and changing consumer preferences in Japan have reduced the value of pollock roe — an important high-margin product for Alaska pollock producers.
• Prices for Alaska pollock surimi blocks are trending up, due to lower production of competing products.
PACIFIC COD • Traditionally, markets in Europe substituted Pacific cod for declining Atlantic cod stocks. In recent
years, Atlantic cod production has rebounded. Larger supplies of competing product, a stronger U.S. dollar, and protective tariffs in the European Union (EU) has reduced the value of Pacific cod in recent years.
HALIBUT AND SABLEFISH • Halibut and sablefish processors have noted that moving inventory is not a problem due to high
demand. Prices have risen as harvest has been reduced for both fish.
• Prices for halibut and sablefish peaked in 2011, but remain high. Sablefish, traditionally sold almost exclusively to Japanese buyers, has seen increased demand from other markets.
Photo Courtesy of ASMI.

Alaska Groundfish and Crab Wholesale Market Profiles NOAA/NMFS • xiii
FLATFISH • Wholesale prices for Alaska flatfish products have been reduced as the value of the euro has fallen
and secondary processing costs have increased.
• Global flatfish and other competing whitefish production is up in recent years, putting downward pressure on prices for Alaska sole.
PACIFIC OCEAN PERCH AND ATKA MACKEREL • Declining harvests of Atka mackerel in Japan have increased prices for Alaska product.
• Reduced value of Asian currencies has decreased seafood imported for reprocessing, an important market for Pacific ocean perch and other rockfish species harvested in Alaska.
CRAB • The largest impact on market demand for crab from Alaska has been linked to changes in illegal,
unreported, and unregulated (IUU) fishing from Russia, which has historically produced a large volume of illegal crab products. King crab prices are most responsive to total Russian production volume, but snow crab prices are also affected.
• Increased king crab harvests in Argentina and Chile are adding more production to global supply, impacting the market value of Alaska’s king crab harvest.
ANCILLARY PRODUCTS • The global aquaculture industry is increasingly using plant-based feeds instead of higher priced fish
meals and oils. However, prices are expected to remain strong as Alaska’s groundfish meal is a unique product in high demand for eel and turtle farming.
• Increased use of fish oil for human consumption helps drive strong prices for fish oil. Strong demand, coupled with new product development by Alaska processors, is expected to result in increased sales of nutritional supplements made from Alaska groundfish.
Implication of Currency Exchange Rates In addition to the market issues described above, prices for Alaska groundfish and crab products have been negatively impacted by a stronger U.S. dollar in recent years. A stronger dollar, relative to the currencies of key export markets and competing suppliers, generally makes Alaska seafood more expensive and competing product less expensive from foreign consumers’ point of view. Over the past 5 years, approximately 89 percent of the state’s groundfish and crab production was sold to export markets – primarily in Europe and Japan.
Executive Summary Table 4 summarizes changes in foreign currency rates for key buyers and major competitors, versus the U.S. dollar, between 2013 and 2015. Exchange rates vary from year to year, but movements of this magnitude are unusual.
Executive Summary Table 4. Changes in Relevant Currency Exchange Rates, October 2013 vs. October 2015
Country/Market Currency Primary Role Pct. Change vs. U.S. Dollar
European Union Euro Buyer -17.6%
Japan Yen Buyer -18.6%
Canada Canadian Dollar Buyer and Competitor -20.8%
Russia Ruble Competitor -49.2%
Norway Kroner Competitor -28.1%
U.S. Dollar Index (value relative to a basket of foreign currencies) +20.9%
Source: OANDA Average Foreign Exchange Rates and Investing.com DXY historical data.

Alaska Groundfish and Crab Wholesale Market Profiles NOAA/NMFS • xiv
Glossary of Terms and Abbreviations
Abbreviations and Acronyms ADF&G Alaska Department of Fish and Game AKFIN Alaska Fisheries Information Network AFA American Fisheries Act BSAI Bering Sea/Aleutian Islands CDQ Community Development Quota COAR Commercial Operators Annual Report (published by Alaska Dept. of Fish and Game) DFO Canadian Department of Fisheries and Oceans EEZ Exclusive Economic Zone FAO United Nations Fisheries and Aquaculture Organization GOA Gulf of Alaska H&G Headed and gutted IFQ Individual Fishing Quota IPHC International Pacific Halibut Commission IQF Individual Quick Frozen mt Metric tons MSA Magnuson-Stevens Act of 1976 MSC Marine Stewardship Council NMFS National Marine Fisheries Service NPFMC North Pacific Fishery Management Council PACFIN Pacific Fisheries Information Network TAC Total Allowable Catch

Alaska Groundfish and Crab Wholesale Market Profiles NOAA/NMFS • xv
Glossary of Terms Demersal Fish Marine fishes that live near the bottom of the ocean, also known as
groundfish.
Exclusive Economic Zone Ocean area that extends past 3 nautical off the coast of Alaska to 200 miles off the coast of the United States, where exclusive federal fishery management occurs.
Export Value The free alongside (FOB) value of an export product as it leaves a U.S. port, including all transport/etc. costs needed to create and move the product to the port of exit.
Export Volume The weight of exported product in “product weight” terms, generally including the weight of all product and packaging, as it leaves a U.S. port.
Ex-Vessel Value/Price The amount paid to fishermen by a processor for harvested seafood, typically per pound round weight.
Fillet Blocks Frozen product that is uniformly skinless, boneless, or minced fish which is quick frozen in a plate freezer intended for further processing.
First Wholesale Value The value of a processed product when sold by a processor to an entity outside of their affiliate network. Typically refers to the value of product as it leaves Alaska.
First Wholesale Volume The weight of processed or packaged product, in net weight terms, produced for sale to another buyer outside of the primary processor’s affiliate network. Typically refers to the volume of processed product leaving Alaska.
Fixed Gear Refers to pot/trap or longline commercial fishing gear.
Landings The amount of seafood harvested by fishermen.
Net Weight A term commonly used to measure halibut harvest volume. Whereas harvests of most other species are counted in round weight terms, halibut harvests are tallied in net weight, which is equal to an average headed and gutted weight of the fish.
Production Volume/Value The term “production” is occasionally used as short-hand for first wholesale volume and value in this report.
Round Weight The weight of a whole seafood species as it is delivered to the processor in an unprocessed and uncut state.
Shatterpack Fillets Frozen fillets separate by a sheet that can be easily separated by dropping or shattering the carton.
Stock A species that can be managed as a single unit.
Surimi Frozen, minced seafood that is blended with other ingredients to create molded products, such as imitation crab meat.
Total Allowable Catch The total amount of a target species that can be harvested in a given time period.

Alaska Groundfish and Crab Wholesale Market Profiles NOAA/NMFS • xvi

Alaska Groundfish and Crab Wholesale Market Profiles NOAA/NMFS • 1
Global Groundfish Production and Key Markets
This chapter provides a broad overview of competing supply and key markets related to primary Alaska groundfish species and/or products. Each profile in this series contains detailed information about markets and competing supply for individual species or products, while this chapter contextualizes Alaska groundfish production and versus the rest of the world.
Alaska Groundfish Production and Market Summary Table 1 summarizes production volume, value, key markets, and the percentage of global production for Alaska groundfish species and products. Overall, the largest markets for Alaska groundfish are Europe, Japan, and the United States. Although Alaska accounts for a significant share of production for many groundfish species, the state produced only 2.9 percent of global whitefish and other marine fish harvests in 2013.
Table 1. Alaska Groundfish Production and Market Summary, 2014
Species/Product First Wholesale Value ($millions)
Alaska Production (mt)
Pct. of Global Production (2013) ---------- Key Markets ----------
Pollock – Fillets $557 183,960 30% Europe U.S. Brazil
Pollock – Surimi 441 183,640 23% Japan Europe Korea
Pollock – Roe 148 24,120 N/A Japan Korea --
Pacific Cod 472 154,580 18% China* Europe U.S.
Flatfish 209 172,510 32% China* U.S. Europe
Pacific Halibut 109 6,160 57% U.S. Canada --
Sablefish 99 6,700 78% Japan China U.S.
Rockfish 81 32,280 28% China* Japan U.S.
Atka Mackerel 63 20,880 19% Japan China* Korea
*Denotes re-export market.Note: Alaska harvest/production volume from 2013 was compared to 2013 global harvest/production estimates. Global harvest/production data for 2014 is not yet available. Alaska production figures are rounded. Source: AKFIN, ADF&G (COAR), and McDowell Group estimates.
Global Whitefish and Other Marine Fish Production Whitefish generally refers to cod, pollock, haddock, hake, whiting, and benthic flatfish species, such as sole, plaice, flounder, and halibut. These species - primarily caught in wild fisheries - also compete in global seafood markets with notable aquaculture species such as tilapia and pangasius. Depending on the market, the scope of these whitefish species may be narrowed or supplemented with other local varieties. Although global fisheries harvest significant volumes of whitefish, there are many other marine species with significant harvest volumes. For the purposes of this section, these species are generally referred to as “other marine fish species.”
Capture fisheries and aquaculture production yielded 74 million metric tons of whitefish and other marine fish species in 2013 (round weight terms). The majority of production is used for meat, but fish meal, fish oil, and surimi production also utilize significant volumes of wild marine fish species. Fish meal and fish oil production required 16.3 million metric tons of wild capture fish species in 2012; however, about 35 percent of fish meal production was created using fish residues (ancillary products and waste rather than the whole fish).1
1 (Green, Stahl, Vaughn, Carroll, & Baldwin, 2014)

Alaska Groundfish and Crab Wholesale Market Profiles NOAA/NMFS • 2
Table 2. Global Whitefish and Other Marine Fish Species Production (mt), 2013 Species Harvest Volume (mt) Primary Uses
Alaska Pollock 3,239,719 Meat, Surimi, Meal/Oil
Hakes, Hoki, and Whiting 2,209,131 Meat, Surimi, Meal/Oil
Cod and Haddock 2,169,226 Meat
Other Flatfish (Sole/Flounder/etc.) 882,063 Meat
Saithe 318,371 Meat
Other Whitefish 221,986 -
Halibuts and Turbots 157,824 Meat
Total Wild Whitefish (Capture Fisheries) 9,198,320 -
Anchovies, Shads, and Menhaden 9,411,729 Meal/Oil
Herring and Sardines 8,056,155 Meal/Oil, Meat, Roe, and Bait
Mackerel and Saury 5,716,215 Meat and Meal/Oil
Jacks, Scads, and Carangids 2,582,584 Meat and Meal/Oil
Other Coastal Species 2,556,069 -
Eels, Congers, and Hairtails 2,439,811 Meat and Surimi
Croakers and Drums 1,761,530 Meat and Bait
Breams, Lizardfish, and Pomfrets 1,539,437 Surimi and Meat
Mullets and Goatfish 778,322 Meat
Capelin 758,735 Roe and Meal/Oil
Other Demersal Species 590,858 -
Other Pelagic Species 529,231 -
Groupers and Seabass 317,542 Meat
Snappers 264,286 Meat
Rockfish 213,337 Meat
Atka Mackerels 130,448 Meat
Mahi-mahi (Dolphin) 102,986 Meat
Monkfish 92,768 Meat
Sablefish and Patagonian Toothfish 46,508 Meat
Other Misc. Species - Capture Fisheries 20,422,968 -
Total Other Marine Species 58,311,519 -
Tilapias (Farmed) 4,823,312 Meat
Pangasius (Farmed) 1,671,825 Meat
Total - Tilapias and Pangasius 6,495,137 -
Total Whitefish and Other Marine Species 74,004,976 -
Total Alaska Groundfish Harvest (2013)* 2,169,200 Pct of Total: 2.9%
*Includes herring harvests, to make the figure more comparable to the broader range of groundfish included in the table. Note: Red-fleshed fish species (e.g. tuna) and diadromous fish (e.g. salmon) are not included in these figures. Source: FAO, compiled by McDowell Group.
The vast majority of fish shown in Table 2 can be processed into white fillets, and could represent a substitute for key Alaska groundfish species on a general level. However, culinary traditions and local tastes tend to limit the number of species palatable to individual markets. For example, cod is a staple fish in Europe but virtually non-existent in Southeast Asia, where it would be more common to find carp or milkfish

Alaska Groundfish and Crab Wholesale Market Profiles NOAA/NMFS • 3
filling the whitefish role. Cost is always a primary concern as well. Consumers generally will not substitute imported whitefish species for less expensive and traditionally palatable domestic species. There are also significant differences in the way different cultures prepare whitefish. Countries in emerging markets are generally more likely to cook fish whole while developed countries tend to use fillets or steaks. Differences in availability, price, taste, and fish size limit actual consumer substitution, despite the fact that most species listed in Table 2 could generally be categorized as white-fleshed fish.
Alaska’s Position in the Global Whitefish Market Alaska accounted for 2.9 percent of total global whitefish and other marine fish production in 2013. However, globally wild whitefish species (which constitute the majority of Alaska’s groundfish harvest) only accounted for 12.4 percent of total production in 2013. Alaska plays a bigger role in global production if the whitefish scope is narrowed to wild and farmed whitefish species (i.e. tilapias and pangasius). In 2013, Alaska production accounted for 13.5 percent of global wild and farmed whitefish production, a substantial figure in a global context.2 This is a notable comparison because wild whitefish species, such as cod, pollock, and sole, as well as farmed tilapias and pangasius, are more likely to be exported than other wild fish species, which are mainly sold into domestic markets or transformed into fish meal, fish oil, or surimi.
Alaska’s commercial fisheries produce larger harvests than every other U.S. state combined and 80 percent of Alaska’s harvest volume came from high-volume whitefish fisheries (pollock, cod, and flatfish) in 2013. Despite the impressive scale of its high-volume whitefish fisheries, Alaska is only a fractional part of global whitefish production. As a result, Alaska’s groundfish industry is a usually a price taker where the value of its cod, pollock, and flatfish are impacted by competing suppliers and competing whitefish species. Russia (cod/pollock/flatfish), China (tilapia), Norway (cod), Japan (pollock/cod), New Zealand (hoki), and Vietnam (pangasius) are the biggest competitors for Alaska’s groundfish industry, in terms of high-volume whitefish species.
Low volume Alaska whitefish species like halibut, sablefish, rockfish, and Atka mackerel have much more defined markets where Alaska is the primary export supplier and generally account for a larger percent of global supply in these niche markets. As a result, species substitution is less common in markets for these species and price is mostly a function of Alaska or local harvest volume.
Tradition, taste preferences, and familiarity are hurdles in developing new markets for Alaska groundfish species. However, culinary influences are blending and crossing borders faster than perhaps any other time in human history. Modern urban centers like Singapore, Sao Paulo, San Francisco, Sydney, Seoul provide a growing supply of unique seafood options. Expanding culinary options presents new marketing opportunities for Alaska’s seafood industry. Particularly since Alaska has a reputation for quality and a strong distribution network, having been in the business of exporting fish for decades. However, it may also present challenges in existing markets in years to come as consumers gain more exposure to seafood from other cultures.
Competition from Tilapia and Pangasius Tilapia and pangasius, also known as basa, swai, tra, or catfish have become dominant species many global seafood markets. Combined aquaculture production of the two species reached nearly 6.5 million metric tons in 2013 (Figure 1).
2 Whitefish in this comparison includes tilapia, pangasius, cod, haddock, pollock, hakes, hoki, whiting, flatfish, and other wild cod-like groundfish species.

Alaska Groundfish and Crab Wholesale Market Profiles NOAA/NMFS • 4
Tilapia production continues to grow rapidly and consistently. China (including Hong Kong and Taiwan) produced 1.73 million metric tons, accounting for 35 percent of total tilapia production, in 2013. Several other countries have established themselves as major producers, such as Egypt (16 percent), Indonesia (15 percent), and the Philippines (5 percent). Tilapia production in Indonesia, Bangladesh, Brazil, and Mexico is growing especially fast. The vast majority of tilapia product imported by the United States and Europe consists of frozen fillets from China.
Pangasius production flattened out in 2013 after increasing nearly 10-fold during the previous decade. Vietnam is by far the largest producer of pangasius products, accounting for 81 percent of all
production. Industry reports suggest Vietnamese production remained stunted in 2014 and 2015 as high feed costs, weak demand in major markets, and low prices have led to a reduction in the number of farms. Production and domestic market demand is increasing in other Southeast Asian countries, such as Indonesia.3
Figure 1. Total Farmed Tilapia and Pangasius Production (mt), 1990-2013
Source: FAO.
Tilapia and pangasius fillets are major whitefish imports in the United States and Europe. Sourced primarily from China and Vietnam, imported frozen fillets of these two fish were worth $1.6 billion in 2014. The United States is the primary market for tilapia while Europe, collectively, is a slightly larger pangasius market than the United States.
Demand for tilapia fillets is strong in the United States and Europe, as evidenced by rising volumes and rising import prices in 2014 (Table 3). Total U.S. and Europe import value of frozen tilapia fillets was up 8.6 percent while the average value/mt increased 6.8 percent to $4,935. Meanwhile, western market demand for pangasius appears to be waning despite flat to declining supply. The average import value/mt was up slightly, but import volumes of pangasius fell 7.2 percent in the United States and Europe (combined) in 2014.
Tilapia and pangasius are becoming popular seafood choices in markets outside of the United States and Europe. The fastest growing major markets are Brazil (pangasius, +100 percent growth in volume during 2014), Iran (tilapia, +284 percent), Mexico (tilapia, +5 percent), Thailand (pangasius, +19 percent), and
3 (FAO Globefish Market Reports, 2014-2015)
0
1,000,000
2,000,000
3,000,000
4,000,000
5,000,000
6,000,000
7,000,000
1990
1991
1992
1993
1994
1995
1996
1997
1998
1999
2000
2001
2002
2003
2004
2005
2006
2007
2008
2009
2010
2011
2012
2013
Volu
me
(mt)
Tilapias and Other Cichlids Pangasius

Alaska Groundfish and Crab Wholesale Market Profiles NOAA/NMFS • 5
Columbia (pangasius, +11 percent). India and Indonesia, with a combined population of approximately 1.5 billion people, are also developing domestic supplies of farmed tilapia and pangasius. In contrast to western markets, the amount of pangasius imported by developing markets grew faster than tilapia in 2014. Outside of Brazil, Alaska exports relatively little groundfish product to these tilapia/pangasius markets.
Table 3. Imports of Tilapia and Pangasius Products, United States and Europe vs. Other Markets, 2012-2014
2012 2013 2014 YOY Pct. Change
U.S. & Europe (Combined)
Import Value ($millions)
Tilapia – Frozen Fillets $803.9 $845.3 $918.0 8.6%
Tilapia – Frozen Fish 54.9 82.5 92.4 12.0%
Pangasisus – Frozen Fillets 778.0 717.4 694.3 -3.2%
Import Volume (mt)
Tilapia – Frozen Fillets 187,130 182,956 186,021 1.7%
Tilapia – Frozen Fish 29,796 41,776 40,674 -2.6%
Pangasisus – Frozen Fillets 260,126 267,260 248,078 -7.2%
Import Value/mt
Tilapia – Frozen Fillets $4,296 $4,620 $4,935 6.8%
Tilapia – Frozen Fish 1,841 1,975 2,271 15.0%
Pangasisus – Frozen Fillets 2,991 2,684 2,799 4.3%
2012 2013 2014 YOY Pct. Change
Other Markets
Import Value ($millions)
Tilapia – Frozen Fillets $158.9 $282.4 $307.3 8.8%
Tilapia – Frozen Fish 24.2 53.0 46.3 -12.6%
Pangasisus – Frozen Fillets 310.0 428.3 500.6 16.9%
Import Volume (mt)
Tilapia – Frozen Fillets 43,796 73,238 76,246 4.1%
Tilapia – Frozen Fish 13,518 27,965 23,207 -17.0%
Pangasisus – Frozen Fillets 133,980 205,243 240,478 17.2%
Import Value/mt
Tilapia – Frozen Fillets $3,629 $3,856 $4,031 4.5%
Tilapia – Frozen Fish 1,790 1,894 1,994 5.3%
Pangasisus – Frozen Fillets 2,313 2,087 2,082 -0.2%
Source: Global Trade Atlas.
Summary of Key Alaska Groundfish Markets Export markets buy about 90 percent of Alaska groundfish meat products, and an even larger percentage of surimi, roe, and ancillary groundfish products are exported. China is the largest wholesale market for meat products, accounting for 44 percent of estimated sales volume in 2014 (Table 4). However, with the exception of sablefish, the vast majority of Alaska groundfish exported to China is re-exported to Europe, the United States, and Japan. Europe is the largest overall market for Alaska groundfish, due to the high volume of pollock and cod

Alaska Groundfish and Crab Wholesale Market Profiles NOAA/NMFS • 6
which eventually enters European markets. Japan is likely the second largest market followed by the United States, in terms of final sales volume.
Table 4. Wholesale Sales of Alaska Groundfish Meat Products (mt), 2014
Wholesale Production
United States (Est.) Europe China Japan Other Total
Exports
Alaska Pollock 252,809 39,961 137,209 53,390 4,512 17,737 212,848
Pacific Cod 134,206 30,394 20,975 57,195 16,571 9,071 103,812
Flatfish 167,185 40,045 717 107,486 5,356 13,581 127,140
Rockfish 32,192 8,390 58 15,566 6,861 1,317 23,802
Atka Mackerel 20,888 1,361 15 3,741 12,627 3,144 19,527
Sablefish 6,696 593 173 559 4,648 723 6,103
Pacific Halibut 6,159 4,093 0 16 0 2,050 2,066
Unknown Species - -58,740* 310 36,950 7,401 14,079 58,740
Total 620,134 66,096 159,457 274,903 57,976 61,702 554,038
Pct. of Total - 11% 26% 44% 9% 10% 89%
Note: Wholesale production of high-volume whitefish species only includes whole fish, H&G, and fillet production. Virtually all halibut and sablefish consists of edible products. *Unknown species likely represent exports of Alaska flatfish and other high-volume whitefish species, this non-specific volume is debited from estimates of U.S. supply. This amount could also represent part of the difference between how product weight is reported in export and production statistics. Source: AKFIN, ADF&G (COAR), and ASMI Alaska Seafood Export Database.

Alaska Groundfish and Crab Wholesale Market Profiles NOAA/NMFS • 7
Wholesale Market Profiles for Alaska Pollock Products
Note: Differentiating pollock by its place of origin, primarily Russia or Alaska, can be confusing due to the official species name (Alaska pollock). To avoid confusion, we typically use the term “pollock” to refer to Alaska pollock (Gadus chalcogrammus) from any country/place. References to pollock from a specific place are called out by name (e.g. “Alaska pollock” or “Russian pollock”).
Alaska pollock or walleye pollock (Gadus chalcogrammus) is currently the largest single species fishery in the world, with stocks concentrated in the North Pacific Ocean. Pollock are commercially harvested by several countries, but Alaska and Russia are the largest producers by a wide margin. Alaska pollock harvests are large on a national scale, accounting for 33 percent of total U.S. commercial fishery landings and 14 percent of wholesale production value in 2014.
Pollock is the single most valuable and plentiful species in Alaska’s seafood industry, accounting for 45 percent of production volume and 32 percent of first wholesale value in 2014. Alaska pollock is processed into fillets, surimi, roe, headed and gutted (H&G), fish meal, fish oil, and other products. Europe, Japan, and United States are the primary consumer markets. This market profile summarizes key products and markets for pollock fisheries in Alaska.
Table 5. Summary Profile of Alaska Pollock Wholesale Production and Markets, 2014
Value and Volume Key Products Fillets Surimi Roe H&G Other
First Wholesale Production (mt) 580,120 Pct. of Value 39% 31% 11% 7% 12%
Pct. of Global Pollock Harvest (2013) 43% Key Markets Japan Europe U.S. Korea Other
First Wholesale Value ($millions) $1,407 Pct. of Final Sales 36% 40% 11% 6% 6%
Pct. Change in Value from Prior 4 yr Avg. 5.5% YOY Change 24% 11% N/A 12% N/A
Pct. of Alaska Groundfish Value 58% Competing Species: Russian Pollock, hake, hoki, tropical surimi, & cod.
Fishery Summary Alaska pollock are primarily harvested using mid-water trawl gear in the Bering Sea and Gulf of Alaska. In the 1960s, Japanese and other foreign fishermen initially fished for pollock until the 200-mile Exclusive Economic Zone (EEZ) was established by the Magnuson-Stevens Act of 1977, eliminating foreign fishing vessels in U.S. waters. Commercial fishing efforts remained a joint venture with Japanese vessels until the late 1980s when the fishing fleet became entirely U.S. based. Fishing efforts between 1977 and 1986 were minimal, with an average of 30,000 mt landed. In comparison, landings averaged 1.1 million mt in the last 10 years (Figure 2). The Alaska pollock total allowable catch (TAC) in 2014 was 1.46 million mt and 1.53 million mt in 2015, an increase of 4.6 percent.
Photo Courtesy of Alaska Seafood.

Alaska Groundfish and Crab Wholesale Market Profiles NOAA/NMFS • 8
Figure 2. Pollock Harvest Volume in Alaska (mt), 1977-2014
Source: NMFS OST (1977-2004) and NMFS Economic SAFE 2014 (2005-2014).
In 1998, the American Fisheries Act (AFA) created participation requirements for entry into the Bering Sea Aleutian Islands (BSAI) pollock fishery through a cooperative. The allocations under the AFA, which went into effect in 1999 for the inshore and mothership sectors and 2000 for the offshore sector, distribute 50 percent of the TAC to the inshore sector (catcher vessels delivering onshore), 40 percent to the offshore sector (catcher processors), and 10 percent to motherships (floating processors which receive pollock primarily from catcher vessels). AFA catcher processors are the largest fishing vessels in Alaska and range from 200 feet to 344 feet in length.4 In 2014, there were 3 motherships, 21 catcher processors, and 104 catcher vessels permitted in the Alaska pollock fisheries.5
Table 6. Alaska Pollock Harvest Volume in Federal and State Fisheries (mt), 2010-2014 2010 2011 2012 2013 2014
Federal-Gulf of Alaska 75,072 79,821 101,355 93,728 140,260
610 Shumagin 26,051 20,597 27,893 7,711 13,364
620 Chirikof 28,250 37,225 45,095 53,115 83,082
630 Kodiak 19,134 19,728 25,986 29,962 42,757
West Yakutat/Southeast 1,637 2,271 2,381 2,940 1,057
Federal-BS/AI 811,677 1,200,450 1,206,252 1,273,766 1,300,211
AFA Inshore 351,684 519,093 525,185 548,975 555,518
AFA Catcher Processor 282,750 423,680 423,161 440,591 445,178
AFA Mothership 70,576 109,856 105,384 110,020 111,000
CDQ 81,275 116,978 121,854 126,538 128,549
Incidental Catch/Other 25,392 30,843 30,668 47,642 59,966
State Waters
Prince William Sound 1,661 1,532 2,624 2,621 2,368
Total 888,410 1,281,803 1,310,231 1,370,115 1,442,839
Source: NMFS Alaska Region Catch Reports, ADF&G Groundfish Reports.
4 (North Pacific Fishery Management Council, 2012) 5 https://alaskafisheries.noaa.gov/ram/afa.htm
0
200,000
400,000
600,000
800,000
1,000,000
1,200,000
1,400,000
1,600,000
1977
1978
1979
1980
1981
1982
1983
1984
1985
1986
1987
1988
1989
1990
1991
1992
1993
1994
1995
1996
1997
1998
1999
2000
2001
2002
2003
2004
2005
2006
2007
2008
2009
2010
2011
2012
2013
2014
Harv
est V
olum
e (m
t)

Alaska Groundfish and Crab Wholesale Market Profiles NOAA/NMFS • 9
The majority of commercial pollock fisheries are located in federal jurisdiction (Table 6). There is a state-managed trawl fishery in Prince William Sound, with a 5 year harvest average of 2,160 mt.6 A federally mandated Community Development Quota program allocates 10 percent of the BSAI quota to eligible rural communities in western Alaska before quota is divided amongst the commercial sectors. The pollock season is split into two distinct seasons. “A” season runs from January to April and “B” season runs from June through October.
Alaska Pollock Production This section summarizes the value and volume of primary Alaska pollock products. In total, Alaska pollock accounted for 58 percent of Alaska’s groundfish production volume and 60 percent of first wholesale value in 2014.7
Wholesale Production and Value Summary Pollock is one of the most valuable fisheries in Alaska, and even the world, due to its tremendous volume, production versatility, and white, mild-flavored flesh. Virtually all edible pollock products are frozen before being sold into wholesale markets. Alaska pollock harvests yielded 580,120 mt of processed product in 2014, with a first wholesale value of $1.41 billion (Figure 3).
Figure 3. First Wholesale Volume and Value for Alaska Pollock, 1992-2014
Source: AKFIN. Alaska pollock yield five primary product types: surimi, fillets, H&G, roe, and fish meal/oil. In 2014, of the 580,120 mt of pollock products produced, 183,960 mt were used in fillets, 183,640 mt in surimi, 67,170 mt in H&G, 24,120 mt in roe, and other products (including fish meal, minced meat, and fish oil) adding up to 121,230 mt. Fish meal, oil, and other ancillary products are discussed in greater detail in a separate profile (Figure 4).
6 (Wessel, Rumble, Goldman, Russ, Byerly and Russ, 2014) 7 Based on AKFIN and ADF&G COAR Reports.
$200
$400
$600
$800
$1,000
$1,200
$1,400
$1,600
-
100,000
200,000
300,000
400,000
500,000
600,000
700,000
1992
1993
1994
1995
1996
1997
1998
1999
2000
2001
2002
2003
2004
2005
2006
2007
2008
2009
2010
2011
2012
2013
2014
Valu
e ($
mill
ions
)
Volu
me
(mt)
Volume (mt) Value ($Millions)
0

Alaska Groundfish and Crab Wholesale Market Profiles NOAA/NMFS • 10
Figure 4. Alaska Pollock First Wholesale Production Volume and Value, by Product Type, 2014
Fillets provide the most revenue of any product type in most years, with surimi usually in second place. Together fillets and surimi accounted for 70 percent of Alaska pollock’s first wholesale value in 2014 (Figure 4 and Table 7). Although roe is only 4 percent of the production volume, it accounts for 11 percent of the fish’s value and used to be a more valuable piece of the pie. Fish meal/oil, minced meat, and other ancillary products account for 12 percent of the value, while head/gut production is 7 percent.
Table 7. Production Volumes and Recovery Rates for Common Alaska Pollock Products, 2014
2014 Production Volume
(mt)
2014 Production Value
($thousands)
Recovery Rate Range Pct. from
Round Weight
Average Price/kg
Fillets 184,000 $556,800 20-35% $3.03
Surimi 183,600 441,300 20-30% $2.40
Head and Gut 67,200 93,900 52-72% $1.40
Roe 24,100 148,200 *1.2-1.9% $6.14
Other Products 121,200 166,700 - $1.38
Total Wholesale Production 580,100 $1,406,900 41% -
Total Retained Harvest 1,426,800 - - -
*Actual range of roe recovery rate from 2010 to 2014 compared to total harvest volume; however, roe recovery rates can vary significantly depending on when fish are harvested - from virtually 0 to 8 percent. Note: Production volume is shown in product-weight terms. Source: AKFIN, NMFS Alaska Region Catch Reports, ADF&G Groundfish Report, industry interviews, and Crapo, 2013.
Roe typically has the highest profit margin per unit of production. Its current price levels are at historic lows at $6.14/kg (Table 7). In comparison, fillets and surimi have first wholesale prices of $3.00/kg and $2.29/kg, respectively. Head and gut products, which are typically processed into fillets or surimi outside of Alaska, had a unit value of $1.40/kg per pound in 2014.
Fillets40%
Surimi31%
Roe11%
Head/gut7%Minced
2%Fish meal
7%Other
3%
Value
Fillets32%
Surimi32%
Roe4%
Head/gut12%
Minced5%
Fish meal10%
Other7%
Volume 580,120 mt $1.41 billion
Note: Percentages may not sum to 100 percent due to rounding. Source: AKFIN.

Alaska Groundfish and Crab Wholesale Market Profiles NOAA/NMFS • 11
ALASKA POLLOCK PRODUCTION MIX U.S. pollock producers generally convert raw material into frozen fillets, surimi, or head and gut products, then seek to add value from roe and other ancillary products such as fish meal and fish oil. Production volume of the latter are dictated by harvest volume, technology employed to transform unused parts of the fish into additional products, and other factors like fish size or harvest timing. Producers have more choice over product volume derived from pollock meat (fillets, surimi, and head and gut) rather than roe or ancillary products. Production decisions about meat products are made based on numerous factors affecting expected overall profit margins. Production capacity and flexibility is the largest consideration for individual processors as most facilities are unable to shift all production into either fillet or surimi production. Incremental production adjustments are made in response to demand from sales contracts, currency exchange rates, and wholesale pricing trends. Table 8 summarizes the production mix over the past decade (2005-2014).
The share of fillet production has been fairly steady over the past decade, with the exception of 2010 and 2012. In both years, wholesale prices for surimi product increased significantly likely incentivizing a greater emphasis on surimi production. Fillet production increased substantially in 2013, coinciding with a weakening Japanese yen (a prominent surimi market). Surimi production averaged 31.2 percent over the past decade. Production fell sharply in 2009 coinciding with a 32 percent decline in average surimi unit values and lower TACs. Head and gut production has increased nearly three-fold since 2005, possibly a signal that value-added processing costs in Alaska are rising faster than other areas where product can be transformed by secondary processors, such as China. The trend also supports industry claims about declining premiums for once-frozen product. Roe accounted for 4.6 percent of first wholesale production volume over the past decade. Roe yields, compared to round-weight harvest volume, averaged 1.8 percent and are dictated by harvest timing and fish size rather than market factors.
Total production yields compared to round-weight harvest volume have generally increased over the past decade, likely as a result of capital investments, other gains in processing efficiencies, and possibly other factors. Yields increased significantly from 2008 through 2010 as TACs declined. Processors had more time and incentive to maximize recovery rates from a smaller harvest. Yields declined after 2010 as TACs rebounded but are substantially higher than levels seen prior to 2009.
Table 8. Alaska Pollock Production Composition, by First Wholesale Volume, 2005-2014 Fillets as Pct. Surimi as Pct. H&G as Pct. Roe Yield Total Yield Harvest
Year of Total Production
of Total Production
of Total Production
vs. Harvest Volume
vs. Harvest Volume
Volume in mt
2005 30.2% 37.6% 4.1% 1.7% 34.0% 1,565,600
2006 32.4% 33.9% 4.5% 1.9% 33.7% 1,561,800
2007 33.7% 31.9% 6.1% 2.2% 36.0% 1,409,700
2008 32.2% 33.2% 6.4% 2.0% 36.2% 1,044,400
2009 32.5% 24.0% 15.8% 2.2% 42.3% 856,800
2010 29.3% 27.2% 16.0% 1.9% 42.8% 888,400
2011 32.5% 28.8% 11.6% 1.5% 40.1% 1,281,800
2012 29.8% 32.7% 9.4% 1.4% 39.0% 1,310,200
2013 32.3% 31.1% 11.4% 1.2% 39.9% 1,370,100
2014 31.7% 31.6% 11.6% 1.7% 40.2% 1,442,800
Sources: AKFIN, NMFS (OST), NMFS Alaska Region Catch Reports, and ADF&G Groundfish Reports.
First wholesale value of Alaska pollock has been relatively stable over the past decade in nominal terms, outside of 2009 and 2010 when TACs fell sharply. Value peaked in 2012 but declined in recent years despite

Alaska Groundfish and Crab Wholesale Market Profiles NOAA/NMFS • 12
larger harvests. In general, the Alaska pollock sector is likely a less profitable industry than it was a decade ago. Nominal figures, like those shown in Table 9, do not account for the effects of inflation. The inflation-adjusted first wholesale value of Alaska pollock production was $1.60 billion in 2005, or 12.1 percent less than 2014.8
Lower pollock roe values are big reason for lower first wholesale values, in real terms. Roe accounted for more than 20 percent of production value prior to 2008, but declining prices have made the category relatively less valuable. Fillets and surimi provide the bulk of pollock value, typically between 65 and 71 percent. Head and gut product has gained a larger share of the value with rising production, while other products have become a more important part of the total value due to rising prices for fish meal and fish oil.
Table 9. Alaska Pollock Production Composition, by First Wholesale Value, 2005-2014 Fillets as Pct. Surimi as Pct. Roe as Pct. H&G as Pct. Other Products Total
Year of Total Value of Total Value
of Total Value of Total Value as Pct. of Total
Value Value $millions
2005 31.2% 32.2% 26.7% 2.2% 7.6% $1,323
2006 36.4% 28.0% 22.4% 2.3% 10.8% $1,301
2007 38.3% 27.6% 20.5% 3.5% 10.1% $1,277
2008 33.2% 38.2% 17.4% 3.1% 8.1% $1,378
2009 43.3% 23.4% 15.3% 8.0% 9.9% $1,065
2010 38.2% 32.3% 8.9% 8.8% 11.9% $1,106
2011 40.0% 29.4% 10.7% 7.7% 12.2% $1,424
2012 35.5% 35.6% 11.5% 4.8% 12.5% $1,469
2013 42.2% 28.3% 8.7% 7.5% 13.4% $1,336
2014 39.6% 31.4% 10.5% 6.7% 11.8% $1,407
Sources: AKFIN.
The total value of Alaska pollock production has been relatively stable over the past decade but unit values for key products have been more volatile (Table 10). Market factors driving changes in prices for key products are examined in more detail in later sections.
Table 10. Unit Value per Metric Ton for Major Alaska Pollock Products, 2005-2014 Year Fillets Surimi H&G Roe Fish Meal Fish Oil Total
2005 $2,568 $2,128 $1,342 $13,522 $731 $436 $2,484
2006 2,781 2,043 1,247 9,716 1,004 789 2,470
2007 2,865 2,181 1,436 8,608 1,041 718 2,519
2008 3,745 4,187 1,734 11,567 1,109 1,099 3,640
2009 3,917 2,868 1,496 8,806 1,204 728 2,937
2010 3,789 3,448 1,595 5,957 1,576 912 2,906
2011 3,416 2,823 1,830 7,926 1,559 1,147 2,772
2012 3,414 3,134 1,479 9,317 1,499 1,179 2,874
2013 3,193 2,217 1,607 7,173 1,726 1,210 2,443
2014 3,027 2,403 1,398 6,145 1,709 1,135 2,424
Sources: AKFIN.
8 Inflation adjustments based on consumer price index.

Alaska Groundfish and Crab Wholesale Market Profiles NOAA/NMFS • 13
DISCUSSION OF RECOVERY RATES FOR ALASKA POLLOCK Pollock yields a lower percentage of processed product (in first wholesale terms) compared to most other Alaska seafood products, but historically pollock has been processed more intensely and efficiently than any other major Alaska species utilizing residues and waste to produce fish meal, fish oil, and other ancillary products. Therefore, an important question arises from analyzing production and harvest volume of Alaska seafood species: if pollock processing is so efficient, why does it result in lower production yields than other species?
Several factors explain this paradox. First, the majority of primary processing for Alaska pollock consists of skinless/boneless fillets or surimi, which are relatively finished products compared to the more head and gut format for other fish species. Frozen fillets and surimi made from pollock generally yield 22 to 26 percent of product volume compared to the round weight of the fish. Larger fish and/or bone-in fillets can yield more production volume but make up a small share of total fillet production volume. Deep-skinned fillets have even lower yields due to the removal of additional flesh. Secondly, the majority of pollock retained in Alaska fisheries are generally between 4 and 6 years old, and weigh between 1 and 2 lb. Regardless of the species, small fish tend to have less fillet yield than large fish. Thirdly, in addition to the primary meat products (fillets and surimi), processors use other parts of the fish to produce roe and ancillary products. These products create more production volume, but also have relatively low recovery rates. Finally, not all processing facilities in Alaska have the ability to create ancillary pollock products, thereby lowering the sector’s overall yield.
Pollock is an abundant, rationalized fishery allowing for a highly efficient processing sector. Production volume generally reflects the most economically-feasible yield attainable, given the nature of the resource. The difference between harvest volume and production volume for other Alaska seafood species would be greater if more volume was converted to finished product, as is the case with pollock. Therefore, the significant difference in harvest volume compared to in-state production volume for pollock generally indicates a higher degree of value-added processing taking place in Alaska compared to many other Alaska fisheries.
Wholesale Market Profile of Alaska Pollock Fillets Fillets accounted for 40 percent of the total Alaska pollock production value in 2014. Pollock fillets function as a whitefish commodity for fish sticks/fingers, patties, and other value-added frozen whitefish fillet products. The two primary markets for fillets are Europe and the United States. Prices have trended downward in recent years due to increased supply and a stronger U.S. dollar.
Product Description The majority of Alaska pollock fillets are processed into frozen blocks of skinless or deep-skinned fillets due to the long slender fillet shape of pollock. Fillets are also packaged as individually quick frozen (IQF) portions or shatterpacks (blocks of frozen fillets with each fillet separated by plastic). Key fillet products are summarized below.
Fillet Blocks – The dominant fillet product form is composed of whole fillets that are frozen in frames under pressure. Each standard frozen block weighs 16.5 lb. and are packaged in sets of three yielding a 49.5 lb. case. Blocks can contain pinbone-out (PBO) or pinbone-in (PBI) fillets. Most Alaska product consists of PBO, skinless blocks.
Deep-Skinned Fillet Blocks – Composed of whole skinless/boneless fillets that also have the fat line removed. These products are packaged in the same standard sizes as fillet blocks.

Alaska Groundfish and Crab Wholesale Market Profiles NOAA/NMFS • 14
Shatterpacks – Whole fillets which have been interleaved with plastic then frozen as a block. The plastic interleaf allows users to break apart individual fillets without thawing the product. Each standard shatterpack weighs 15 lb and comes three to a case.
IQF Fillets – Individually quick frozen (IQF) whole fillets are glazed and frozen separately, often packaged into bags and/or boxes for transport. Standard sizes are 10, 15, and 25 pound boxes.
Alaska pollock fillets are produced primarily by catcher-processors and shoreside production facilities. These Alaska producers manufacture once-frozen products. Pollock fillets are also produced at secondary processing facilities in China and Europe using imported H&G product. However, the fish must be thawed and often re-frozen after processed, creating what is known as twice-frozen fillets. Once-frozen and twice-frozen Alaska pollock fillets compete in most of the same markets, but once-frozen product sells at a premium due to its higher quality. Whether the fish is processed in Alaska or abroad, the primary processing forms are skinless fillets (PBO or PBI) and deep-skinned fillets.
The average commercially harvested Alaska pollock weighs 2 lb and yields fillets ranging from 2 to 4 oz. Deep-skinned fillets refers to the additional removal of the dark fatty layer of flesh, and results in a lower recovery rate and higher average price. Finished products made from deep-skinned filets are often sold to fast food chains and multi-unit restaurants. Other regular-skinned fillet blocks are usually used in casual “fish and chips” restaurants, or in retail as breaded products.9
Pollock fillets are primarily used in frozen, generic whitefish products, such as fish sticks/fingers, breaded fish fillets/patties, and other value-added frozen products. They are popular in quick service restaurants such as McDonald’s and Long John Silver’s. Frozen products made from pollock fillets are widely available in most European and North American grocery stores.
Supply Chain When pollock is landed in Alaska, it enters one of the most complex supply chains of any groundfish species. Landed fish are first headed and gutted. Heads and other offal is turned into fish meal/oil or retained for other niche markets. Pollock meat is generally used to make either surimi or fillets. The fillet supply chain is summarized in Figure 5.
9 (National Marine Fisheries Service, 2001)
Photo Courtesy of ASMI.
Photo Credits: Genuine Alaska Pollock Producers.

Alaska Groundfish and Crab Wholesale Market Profiles NOAA/NMFS • 15
Figure 5. Alaska Pollock Fillet Supply Chain
Note: The diagram above depicts the movement of major product volumes, and does not reflect supply channels for smaller volumes of product.
The majority of Alaska’s once-frozen fillet production is exported to secondary processing companies in Europe, while a lesser amount goes to similar companies in the United States. Most head/gut production is exported to China for twice-frozen fillet production. European processors also import significant volumes of twice-frozen fillets, made from both Russian and Alaska pollock. Brazil is also a major importer of twice frozen fillets from China. Secondary processors manufacture a range of breaded, coated, salted or unaltered products, mostly for high-volume retail, foodservice, or distribution companies.
Fillet Production Analysis Fillets accounted for 32 percent of all Alaska pollock production volume in 2014. Fillets were the most valuable pollock product form in 2014 in terms of total revenue. Fillet production declined from 2007 to 2010, due to smaller harvests. The average wholesale price of fillets increased 36 percent during that period, but higher prices were not enough to offset lower production volume and total revenue fell 11 percent. Conversely, larger pollock harvests since 2010 have led to expanded fillet production, lower prices, and rising total fillet revenue (Figure 6 and Table 11). Fillet prices have declined substantially since 2009 after adjusting for inflation, although recent fillet revenue (2012-2014) has been about equal to the 2005-2007 period (in real terms).
Alaska Catcher Vessels
Amendment 80 Catcher-Processors
Motherships (Floating Processors)
Shoreside Processors
AFA Catcher-Processors
H&G Pollock
Once-Frozen Fillets
Chinese Secondary Processors
(Twice frozen fillets)
European Secondary Processors
U.S. Secondary Processors
Secondary Processors in Other Countries
European Retail & Foodservice Buyers
U.S. Retail & Foodservice Buyers

Alaska Groundfish and Crab Wholesale Market Profiles NOAA/NMFS • 16
Figure 6. First Wholesale Volume and Value for Alaska Pollock Fillets, 2005-2014
Table 11. First Wholesale Value, Alaska Pollock Fillets, $Millions 2005 2006 2007 2008 2009 2010 2011 2012 2013 2014
$413 $474 $489 $457 $462 $422 $570 $521 $564 $557
Source: AKFIN.
Skinless/boneless fillets account for the majority of production. Deep-skinned fillets are the next most common product (Table 12). In 2014, 73 percent of pollock fillets produced in Alaska were skinless fillets without ribs, while deep-skinned fillets accounted for 24 percent of production volume. Fillet production has grown in recent years, generally tracking increases in harvest volume.
Table 12. Alaska Pollock Fillet Unit Value per Metric Ton and Production Composition, by Primary Fillet Type, 2010-2014
Fillet Type 2010 2011 2012 2013 2014
Skinless/Boneless $3,735 $3,316 $3,260 $3,050 $2,850
Pct. of Production 60% 69% 60% 68% 73%
Deep-Skinned $3,934 $3,702 $3,721 $3,577 $3,484
Pct. of Production 36% 28% 36% 29% 24%
Source: AKFIN.
Shoreside plants often produce the most pollock fillets in Alaska, but the at-sea sector is typically not far behind (Figure 7). One area where the two sectors differ is production of deep-skin fillets. The at-sea sector produces between two-thirds to three-quarters of Alaska’s deep-skin pollock production, with shoreside plants accounting for the balance. Deep-skinned fillets accounted for 24 percent of total fillet production volume in 2014. Not surprisingly, deep-skinned fillets sell for higher prices; however, actual fillet production is largely dictated by market demand for different types of fillets. Skinless/boneless fillet production increased 102 percent between 2010 and 2014, while deep-skinned fillet production increased only 8 percent. First wholesale prices for all pollock fillet products have declined in recent years due to larger production volumes and competition from Russian pollock.10 Once-frozen fillets processed by catcher processors in both Alaska and Russia fetch the highest prices in global markets, followed by on-shore processing plants in Alaska.11
10 (Vovchenko, 2015) 11 (Pacific Seafood, 2014a)
$2,200
$2,400
$2,600
$2,800
$3,000
$3,200
$3,400
$3,600
$3,800
$4,000
$4,200
0
20,000
40,000
60,000
80,000
100,000
120,000
140,000
160,000
180,000
200,000
2005 2006 2007 2008 2009 2010 2011 2012 2013 2014
Valu
e/m
t
Volu
me
(mt)
Volume (in mt) Value/mt

Alaska Groundfish and Crab Wholesale Market Profiles NOAA/NMFS • 17
Figure 7. Alaska Pollock Fillets Volume and Value by Processing Sector, 2005-2014
Source: AKFIN.
Key Fillet Market Analysis Export markets are critically important to Alaska’s pollock industry. It is estimated that export markets buy approximately two-thirds of all Alaska pollock fillet production (Table 13). More than half of all Alaska pollock fillets go directly to European markets. In addition, the majority of Alaska pollock fillets exported to China are eventually re-exported to Europe. Germany is the largest single market for Alaska pollock fillets while the United States is the second-largest market.
Table 13. Sales of Alaska Pollock Fillets to Key Markets (mt), 2010-2014
Market 2010 2011 2012 2013 2014 Pct. of Total (5-yr. Avg.)
Europe1 59,576 96,133 85,114 102,330 119,809 59%
China* 12,479 11,238 8,802 4,632 4,526 5%
South Korea* 6,907 3,374 1,602 848 839 2%
Other Countries 2,644 3,226 4,404 7,078 7,078 3%
Total Exports 81,605 113,971 99,921 114,888 132,252 69%
U.S. (Estimated)2 29,886 52,956 52,629 61,829 51,718 31%
Total Production 111,491 166,927 152,550 176,717 183,970 - Est. Production to Export Markets 73% 68% 66% 65% 72% -
* Denotes countries which primarily re-process and/or re-export product to other markets. 1 Does not include Russia, Ukraine, or some minor European markets. 2 Estimated based on annual production less calendar year exports. Note: Data pertains to primary exports only, does not portray product which may be re-exported to other markets. Source: NMFS Trade Data, ASMI Alaska Seafood Export Database, and McDowell Group estimates.
The percentage of Alaska pollock fillet production exported directly to Europe increased to 65 percent in 2014, from 58 percent in the previous year. Due to a lack of data, sales to the domestic market must be estimated by subtracting production from exports. These estimates suggest domestic market purchases increased significantly in 2011; however, given the sharp increase in production it is likely that some of that year’s volume went into inventory and was sold the following year.
$0
$50
$100
$150
$200
$250
$300
$350
0
20,000
40,000
60,000
80,000
100,000
120,000
2005 2006 2007 2008 2009 2010 2011 2012 2013 2014
Valu
e ($
mill
ions
)
Volu
me
(mt)
Shoreside Volume At-Sea Volume Shoreside Value At-Sea Value

Alaska Groundfish and Crab Wholesale Market Profiles NOAA/NMFS • 18
EUROPE Europe is the world’s largest market for pollock fillets and is also the largest market for any Alaska groundfish or crab product, in terms of first wholesale value. Export markets typically consume half to two-thirds of Alaska’s pollock fillet production, and European countries account for 80 to 90 percent of all U.S. pollock fillet export value. European markets imported 119,809 mt of Alaska pollock fillets in 2014, worth $348 million.
Pollock fillets are generally exported to Europe as frozen fillet blocks and processed by regional manufacturers into breaded/battered fish fingers or products similar to schlemmerfilets.12 Food service operators purchase a mix of value-added products and plain frozen pollock fillets (disaggregated into smaller units). Pollock fillets are utilized as a whitefish commodity, and primarily function as raw material for secondary processors. Although it is not possible to quantify precisely, industry interviews suggest pollock fillets are more often sold to European consumers via retailers, with less production entering the foodservice sector. Some common types of retail pollock products sold in Europe are shown below.
Germany is the largest consumer of pollock fillets, although France and the U.K. are also major consumer markets in Europe. Europe has a long history of whitefish consumption, so the presence of pollock as an affordable substitute to cod is common in most countries. Overall consumption of finished product is mostly a function of population, the prevalence of modern grocery stores, and median household incomes. Pollock is sometimes processed into a salted product for markets in Portugal and Spain.
Most secondary processing into finished products occurs in Germany, France, and Poland. Frozen retail products sold in the U.K. are a mix of domestic production and offerings from central Europe (using Alaska and Russian pollock).
Alaska pollock fillets are primarily exported to Europe via Germany and the Netherlands. Germany’s Hamburg and the Netherlands’ Rotterdam are major ports. Overall, these two countries accounted for nearly 90 percent of total Alaska pollock fillet exports to European markets in 2014 (Figure 8). The total volume and
12 A pre-packaged frozen fish dinner with a coating of toppings consisting of breadcrumbs, herbs, spices, and/or sauces.

Alaska Groundfish and Crab Wholesale Market Profiles NOAA/NMFS • 19
value of Alaska pollock fillets exported to Europe has increased substantially in recent years; however, the export value/mt was down 16 percent in 2014 compared to 2010.
Figure 8. Exports of Alaska Pollock Fillets to Major European Markets, 2010-2014
2010 2011 2012 2013 2014
Export Volume (mt) 59,576 96,133 85,115 102,330 119,809
Export Value ($thousands) $205,860 $304,019 $267,796 $306,382 $347,635
Average Export Value per Metric Ton ($US) $3,455 $3,162 $3,146 $2,994 $2,902
Source: ASMI Alaska Seafood Export database, compiled by McDowell Group.
Alaska once-frozen pollock fillets accounted for about a third of all pollock fillets imported into Europe, over the past 5 years (2010-2014)(Table 14). However, Alaska’s market share increased to 39 percent in 2014. The balance comes from China - mostly re-processed, twice-frozen fillet block made from Russian pollock - or directly from Russia as a single-frozen fillet blocks.
Europe imports between 240,000 and 300,000 metric tons of pollock fillets per year from China, Alaska, and Russia. Import volumes have been steady in recent years around 300,000 mt.
Table 14. European Imports of Pollock Fillets from Major Producers (mt), 2010-2014
Exporter 2010 2011 2012 2013 2014 Pct. of Total (5-yr. Avg.)
China* 163,165 178,318 166,402 169,966 164,117 59%
U.S. (Alaska) 59,576 96,133 85,115 102,330 119,809 32%
Russia 23,475 23,893 19,917 29,862 23,940 8%
Total 246,216 298,344 271,434 302,158 307,866 -
*Consists primarily of Alaska pollock caught in Russia and the United States Note: China and Russia exports includes pollock fillet sales to all European Union countries, plus Norway, Switzerland, and Belarus. Source: Global Trade Atlas and ASMI Alaska Seafood Export Database.
Secondary processors are the largest buyers of pollock fillets in Europe. These companies transform frozen blocks of pollock fillets into ready-to-heat products for retail customers, package fillets into smaller quantities (typically in bags), and sell frozen fillets in smaller quantities to foodservice distributors. Unlike surimi and roe products, large European buyers do not own any significant stake in companies producing Alaska pollock.
Germany68%
Netherlands21%
France4%
United Kingdom
4%Other Countries
3%
$0
$50,000
$100,000
$150,000
$200,000
$250,000
$300,000
$350,000
$400,000
0
20,000
40,000
60,000
80,000
100,000
120,000
140,000
2010 2011 2012 2013 2014
Expo
rt V
alue
($00
0s)
Volu
me
(mt)
Export Volume (mt) Export Value ($000s)

Alaska Groundfish and Crab Wholesale Market Profiles NOAA/NMFS • 20
Major European buyers of Alaska pollock fillets include:
• Aldi (private label) • Bofrost • Carrefour • Findus Group (including Young’s brand) • Frosta • Iglo Foods Group (including BirdsEye brand) • Lidl • McDonalds Europe
• Metro (private label) • Netto (private label) • Pickenpack Europe • Sainsburys (private label) • Sodexo (distributor) • Tesco (private label) • Waitrose (private label)
Note: Data on exports of Alaska pollock fillets to Europe includes shipments to Germany, Poland, France, U.K., Netherlands, Belgium, Denmark, Czech Republic, Sweden, Italy, Spain, Finland, and Portugal. These countries align with European regions in the ASMI Alaska Seafood Export Database, compiled by McDowell Group. Exports of Alaska pollock fillets to other European countries are negligible and have not been included in this profile to maintain consistency with existing data sources. Pollock fillet import data from China and Russia includes all European Union countries, as well as Norway, Switzerland, and Belarus.
EUROPEAN MARKET IMPACT OF RUSSIAN POLLOCK CERTIFICATION
Several major European retailers have committed to only selling certain seafood products from sustainable fisheries, certified by the Marine Stewardship Council (MSC). Until Russia’s Sea of Okhotsk pollock fishery was certified in September 2013, Alaska’s pollock fisheries were the only source for certified pollock fillets. This effectively gave Alaska producers sole access to a sizeable, premium market. Once-frozen Alaska pollock fillets used to sell at a significant premium to twice-frozen Russian pollock, typically on the order of $300 to $500 per ton or more due to Alaska’s certification status but also based on the intrinsic difference in quality for once-frozen product. Russian certification, along with larger harvests in both countries, has roughly doubled the supply of pollock fillets available to “MSC-only” buyers in Europe. The result has been a steady decline in wholesale prices for both Alaska and Russian pollock fillets, as well as a declining premium for once-frozen Alaska product. In addition, discount retailers in Germany (the largest consumer of pollock fillets) continue to gain market share by competing on price. While there have been normal increases in fishing and processing costs, this trend has put pressure on retailers to keep retail prices low causing secondary processors to minimize raw material costs as much as possible.
UNITED STATES Home to McDonalds’ Filet-O-Fish sandwich, the domestic market is the second-largest consumer of Alaska pollock fillets in the world. In contrast to Europe, Americans consume more pollock through foodservice channels than retail outlets. Pollock is the primary whitefish species used in most generic fried fish sandwiches, although it is becoming more common to see the species name identified in product messaging. Fish sandwich patties sold by foodservice operators are typically made using minced pollock meat and/or whole fillets. Breaded and/or battered pollock fillets are also common foodservice fare in the United States; these products utilize either whole fillets or fillet portions. Frozen fish sticks are common retail products; also made from pollock fillets and minced meat.
Wikimedia Commons, lic: Public domain, by Evan Amos.

Alaska Groundfish and Crab Wholesale Market Profiles NOAA/NMFS • 21
It is possible to estimate the U.S. supply of pollock fillets by subtracting Alaska pollock fillet exports from domestic production, and adding this figure to imports of pollock fillets. Although the process provides some visibility about the nature and size of the U.S. market, it cannot account for the impact of Alaska pollock fillet inventories. Changes to the inventory of Alaska pollock fillets are added or subtracted to the U.S. supply estimate. Large supply estimates in 2011 and 2012 are outliers and likely the result of increasing inventory due to growing Alaska fillet production. However, when averaged over several years, it is a reasonable method for estimating market share and supply, given the lack of data.
The U.S. market consumes approximately 110,000 mt of pollock fillets per year (Table 15). Although the species name implies the product comes from Alaska, a significant percentage of pollock fillets consumed by Americans likely come from Russian fisheries. The United States imports large volumes of pollock fillets from China, which primarily utilize Russian pollock as a raw material. U.S. import volume and total supply estimates declined sharply from 2010 to 2014, suggesting a weakening market for fillet products.
Table 15. Estimated U.S. Pollock Fillet Market Supply (mt), 2010-2014
Year Alaska Pollock
Fillet Production
Imports Exports Est. U.S. Supply
Est. Once-Frozen Product
from Alaska
Pct. Alaska
2010 111,491 70,278 81,605 100,164 29,886 30%
2011 166,927 72,938 113,971 125,894 52,956 42%
2012 152,550 51,845 99,921 104,474 52,629 50%
2013 176,717 55,104 114,888 116,933 61,829 53%
2014 183,970 49,817 132,252 101,535 51,718 51%
Five-year Avg. 158,331 59,996 108,527 109,800 49,804 45%
Source: NMFS Foreign Trade Data, AKFIN, ASMI Alaska Seafood Export Database, and McDowell Group estimates.
Pollock fillets are usually put through a secondary manufacturing process before reaching American consumers. Most fillets are bought by companies unaffiliated with harvesting companies in Alaska or Russia. However, there is some integration in the U.S. market. Alaska’s largest producer of pollock products, Trident Seafoods, sells finished product to retailers (in addition to wholesale customers). Unisea, Alaska’s third-largest pollock producer, is owned by NISSUI and supplies raw material to Gorton’s – a popular brand for frozen whitefish products. Foodservice operators utilizing Alaska pollock typically own or contract with processing facilities.
Major U.S. buyers of Alaska pollock fillets and minced meat, which are not affiliated with Alaska producers, include:
• Burger King • Costco • Kroger (private label) • McDonalds • Pinnacle Foods Group (Van de Kamps brand) • Target (private label) • Walmart (private label)
OTHER MARKETS Russia and Brazil are also key markets for pollock; however, the majority of pollock consumed in these countries comes from Russia or consists of head/gut Alaska pollock processed in China. Alaska producers exported just over 1,000 mt of pollock fillets directly to the two countries in 2014 – a relatively small figure compared to sales in Europe and the United States. Brazil and Russia access and use pollock in very different ways.

Alaska Groundfish and Crab Wholesale Market Profiles NOAA/NMFS • 22
RUSSIA
As the world’s largest producer of pollock products, it is not surprising that Russians consume significant quantities of pollock. Estimates about market size vary, but recent claims made by Russian fishing companies suggest demand for pollock rivals that of the United States, perhaps even exceeding it. The Russian market is expected to grow due to rising costs for imported seafood, larger Russian pollock harvests, and government directives which advocate consumption of domestically-produced food products. Russia imported 13,300 mt of pollock fillets from China in 2014, but the majority of Russian consumption comes from product caught and processed domestically. Exports of Alaska pollock fillets to Russia have increased in recent years, but the trade embargo on U.S. frozen seafood products has effectively closed the Russian market for Alaska pollock.
Wholesale Russian pollock prices out of Vladivostok are up by approximately a third in 2015 over the previous year, mostly due to the weakness of the Russian ruble.13 With a weaker Russian ruble, Russian buyers must pay higher prices (in rubles) to prevent product from being sold into the export market. Russian consumers often fry pollock or use it in soups.
BRAZIL
Brazil is the fourth-largest consumer of pollock fillets, in most years. The South American nation seems an odd place to find large volumes of a North Pacific whitefish, but the nation’s culinary heritage and population create a match for pollock. Most of Brazil’s 200 million residents trace their ancestry back to Portuguese and Spanish settlers. Salted cod, called bacalhau in Brazil, is a popular dish in both Portuguese and Spanish cuisine. Although cod is preferred, pollock again functions as a more affordable substitute in the Brazilian salt cod market. Bacalhau is commonly used in fish balls (bolinhos de bacalhau), salads, and soups.
Virtually all of Brazil’s pollock products are imported from China, although Alaska producers are making progress in accessing the market directly (Table 16). Imports of frozen pollock fillets from China fell in 2014, but salted pollock imports have grown steadily since 2010.
Table 16. Brazil Imports of Frozen Pollock and Salted/Dried Fish from China and United States (mt), 2010-2014
Product/Country 2010 2011 2012 2013 2014
Imports from China
Frozen Pollock Fillets 21,822 58,953 61,569 64,507 36,158
Salted/Dried Fish (Mostly Pollock & Cod) 5,308 9,143 12,511 14,696 16,150
Total China Imports 27,130 68,096 74,080 79,203 52,308
Direct Exports from U.S.
Frozen Pollock (H/G) 0 0 518 54 65
Frozen Pollock Fillets 0 0 0 119 387
Total U.S. Exports 0 0 518 173 452
Source: Global Trade Atlas and ASMI Alaska Seafood Export Database.
Competing Supply Alaska pollock’s primary competition comes from twice-frozen Russian pollock fillets. The vast majority of Russian pollock production is exported as a frozen head/gutted block product to China, where it is thawed, filleted, then re-frozen and exported to other countries. Since nearly all Russian pollock are eventually turned into fillet products, rather than surimi or other forms, it is possible to estimate fillet supply from Russia by applying an average recovery rate to the round weight harvest.
13 www.fishnotice.com/prices/vladivostok?pid=155 (accessed 09/09/2015).

Alaska Groundfish and Crab Wholesale Market Profiles NOAA/NMFS • 23
Total production of pollock fillets increased an estimated 17 percent between 2010 and 2014. While Russian harvests remained steady, Alaska harvests and fillet production rose substantially (Table 17). As a result, Alaska accounted for an increasing share of global pollock fillet production over the past 5 years.
Table 17. Pollock Fillet Production from Alaska and Russia (mt), 2010-2014 Exporter 2010 2011 2012 2013 2014
Pollock Fillet Production (Metric Tons)
Russian Fillet Production1 443,668 442,342 457,137 436,442 432,880
Alaska Fillet Production 111,491 166,927 152,550 176,717 183,970
Total AP Fillet Production 527,291 610,727 613,150 645,717 616,850
Pct. Alaska Production 21% 27% 25% 27% 30%
Pollock Fillet Production (YOY Percent Change)
Russian Fillet Production 19% 0% 3% -5% -1%
Alaska Fillet Production -5% 50% -9% 16% 4%
Total AP Fillet Production 11% 16% <1% 5% -4% Avg. Alaska Pollock First Wholesale Value/mt $3,789 $3,416 $3,414 $3,158 $3,305
1 Estimated production, based on a 28 percent recovery rate from total round weight harvest. Note: China and Russia exports includes pollock fillet sales to all European Union countries, plus Norway, Switzerland, and Belarus. Source: NMFS Production data, ADF&G (COAR), and McDowell Group estimates (based on FAO and Groundfish Forum harvest estimates).
With rising Alaska fillet production, prices for pollock fillets have declined. The average first wholesale value/mt in 2014 was down 13 percent versus the average value/mt in 2010; however, due to increased production overall first wholesale value for Alaska fillet production increased 44 percent.
Other whitefish species such as cod, haddock, saithe, hake, hoki, sole, tilapia, and pangasius also impact the market for Alaska pollock fillets. For information about production of other whitefish species see the competing production and supply section on page 51.
Wholesale Market Profile of Alaska Pollock Surimi Surimi accounted for 32 percent of Alaska pollock’s first wholesale volume and 31 percent of first wholesale value in 2014. Nearly 184,000 mt of pollock surimi was processed in Alaska, with a first wholesale value of $441 million in 2014. Japan, Europe, South Korea, and the United States are key surimi markets.
Product Description Surimi is an odorless, protein-rich white paste that is an intermediate product used in a variety of surimi seafood products (such as imitation crab sticks). Pollock are first filleted and then minced. Blood and other odorous substances are removed through rinsing with water. Surimi blocks are produced when the washed and pulverized minced meat is mixed with additives such as salt, starch, egg white, and sugar, and then frozen and packaged. The commercial grade of surimi depends on the length of the process and the purity of the product. Surimi technology has improved over the years, with the yield increasing from 12 percent to over 30 percent.14
The general Alaska pollock surimi production process is as follows:15
• De-heading, gutting, de-boning, skinning, and filleting the fish to separate the flesh • Mincing the fish flesh
14 (Park, 2014) 15 (Vidal-Giraud, Chateau, FAO and GLOBEFISH, 2007)

Alaska Groundfish and Crab Wholesale Market Profiles NOAA/NMFS • 24
• Washing the fish flesh (several times) to remove undesirable water-soluble materials such as fats, inorganic salts, and some proteins
• Refining the fish flesh to remove any residual materials such as skin, bones, and scales • De-watering the fish flesh in a screw press • Mixing the fish flesh with cryoprotective compounds such as sugar and sorbitol • Freezing the fish flesh into blocks and packing it
Surimi has been used to preserve and consume whitefish for almost a thousand years in Japan, but it wasn’t until after World War II that surimi production became industrialized.16 It can be made from a variety of fish, but Alaska pollock surimi is sought after for its white color, binding ability, and meat quality. Alaska surimi production started in 1984 and it continues in on-shore and at-sea operations today.
There are hundreds of surimi seafood product varieties. The broad categories include: kamaboko (steamed), chikuma (broiled), satsuma-age (fried), and seafood analogs (e.g. imitation crab sticks). The quality of surimi is determined by a few main characteristics including its gel-forming properties, color (the whiter, the better), and purity.
Supply Chain Alaska pollock surimi blocks are produced by two main vessel types: catcher-processors with onboard surimi processing capacity and catcher vessels that deliver unprocessed pollock to shoreside surimi plants. Alaska processors sell frozen surimi blocks to secondary processors, some of which may be affiliated with the primary processing company, and distribution companies in Asia, Europe, and the United States. Secondary processors use surimi blocks from Alaska to create surimi seafood products tailored to various end markets (Figure 9).
Figure 9. Alaska Pollock Surimi Supply Chain
16 (Park, 2014)
Photo Courtesy of ASMI.
Alaska Catcher Vessels
Shoreside Processors
Motherships Floating Processors
AFA Catcher Processors
Frozen Surimi Blocks
Surimi Seafood Processors in Japan,
Korea, Europe, Former Soviet States,
& U.S.
Retailers & Distributors

Alaska Groundfish and Crab Wholesale Market Profiles NOAA/NMFS • 25
Alaska Production Analysis In 2014, surimi accounted for 32 percent of Alaska pollock production volume and 31 percent of first wholesale value. Surimi production reached 183,600 mt last year and had a value of $441 million. Production volume has been relatively consistent outside of 2008 to 2010, typically ranging from about 150,000 to 200,000 mt (Figure 10 and Table 18).
Figure 10. First Wholesale Volume and Value for Alaska Pollock Surimi, 2005-2014
Table 18. First Wholesale Value, Alaska Pollock Surimi, $Millions 2005 2006 2007 2008 2009 2010 2011 2012 2013 2014
$426 $365 $353 $526 $250 $357 $418 $524 $378 $441
Source: AKFIN.
First wholesale value is more variable, as the price of Alaska pollock surimi can vary widely from year to year depending on global surimi market conditions. Average surimi material prices were $2.40/kg in 2014, up 8.4 percent from the previous year.
Figure 11. Alaska Pollock Surimi First Wholesale Volume and Value by Processing Sector, 2004-2014
Source: AKFIN.
$2,000
$2,500
$3,000
$3,500
$4,000
$4,500
0
50,000
100,000
150,000
200,000
250,000
2005 2006 2007 2008 2009 2010 2011 2012 2013 2014
Valu
e/m
t
Volu
me
(mt)
Volume (in mt) Value/mt
$0
$50
$100
$150
$200
$250
$300
0
20,000
40,000
60,000
80,000
100,000
120,000
2004 2005 2006 2007 2008 2009 2010 2011 2012 2013 2014
Valu
e ($
mill
ions
)
Volu
me
(mt)
At-Sea Volume Shoreside Volume At-Sea Value Shoreside Value

Alaska Groundfish and Crab Wholesale Market Profiles NOAA/NMFS • 26
Alaska pollock surimi production is split almost evenly between shoreside plants and at-sea processors, and this relationship has been relatively consistent over time. Surimi produced at-sea tends to command a premium price (Figure 11).
Key Market Analysis Approximately 90 percent of Alaska pollock surimi is sold to export markets (Table 19). In 2014, Japan and South Korea imported 70 percent of all Alaska pollock surimi production. The remaining markets included Europe, United States, China, Russia, and former Soviet-bloc countries. Europe is a larger market than the export data below suggests, importing significant volumes of surimi from South Korea (containing Alaska pollock as well as surimi made from other species). U.S. surimi exports in 2014 were 20 percent above the previous 4 year average.
Table 19. U.S. Exports of Alaska Pollock Surimi by Country (mt), 2010-2014
Country 2010 2011 2012 2013 2014
Pct. Change over
2010-2013 Average
Pct. of Total
(5-yr. Avg.)
Japan 45,377 53,810 67,609 56,292 71,870 29% 38%
South Korea 33,671 41,332 44,788 61,516 56,804 25% 31%
Europe 10,992 28,391 32,568 35,359 25,920 -3% 17%
Russia 1,689 3,851 3,457 3,592 2,235 -29% 2%
China 515 1,144 370 1,466 1,281 47% 1%
Other Countries 1,629 4,978 2,407 4,127 4,534 38% 2%
Total Surimi Exports 93,358 132,363 150,829 160,886 161,363 20% -
U.S. (Estimated) 10,237 15,709 16,214 9,373 22,278 73% 10%
Total Production 103,595 148,072 167,043 170,259 183,641 25% -
Pct. Exported 90% 89% 90% 94% 88% - -
Note: Reflects direct exports only. Does not reflect final market destination. Source: ASMI Alaska Seafood Export Database and AKFIN.
The global production of raw surimi material in 2013 was approximately 820,000 metric tons, which was converted into approximately 3 million metric tons of surimi seafood products.17 Alaska’s pollock fishery accounts for 20 and 25 percent of global surimi production. Japan is the largest market; however, other Asian countries such as China and Korea are also important surimi consumers.
JAPAN As the birthplace of surimi and its associated food science technology, Japan is the world’s largest end market for surimi seafood products, consuming 40 percent of global surimi production. Large companies and artisanal shops in Japan process over 1,000 different surimi products. Consumption has declined since the mid-1970s, but has stabilized since 2010 at roughly 570,000 mt of surimi seafood products per year.18
Surimi, known as neri in Japan, is a popular, convenient protein that is prepared in numerous ways, including fried, boiled, steamed, baked, and broiled. The image below depicts 14 different types of surimi products in Japan. Consumption and popularity of various surimi products is often specific to locales within Japan.
Japan directly imported 38 percent of Alaska pollock surimi produced from 2010 to 2014, averaging 88,000 mt of direct imports worth $269 million per year. Including product routed through Korea and other countries, 55 to 60 percent of Alaska’s total pollock surimi production goes to the Japanese market.
17 (Seaman, 2014) 18 (Park, 2014)

Alaska Groundfish and Crab Wholesale Market Profiles NOAA/NMFS • 27
Alaska accounted for 36 percent of Japan’s imported surimi volume between 2010 and 2014, and including domestic surimi production Alaska product comprises 25 to 30 percent of the total market share in Japan (Table 20). Competing suppliers include Thailand, India, China, and Vietnam. Thailand’s tropical surimi production has declined in recent years and India has increased market share as a lower cost producer (see Competing Supply section on page 51 for information about tropical surimi).
Table 20. Japan Surimi Imports from Major Producers (mt), 2010-2014
Exporter 2010 2011 2012 2013 2014 Pct. of Total (5-yr. Avg.)
U.S. (Alaska) 62,194 79,817 93,990 94,070 109,957 36%
Thailand 55,055 57,723 50,782 36,661 34,159 19%
India 25,334 28,895 29,174 28,083 33,969 12%
China 29,163 26,817 14,535 13,459 19,078 8%
Vietnam 23,691 18,756 18,576 12,122 16,753 7%
All Others 38,233 35,870 37,771 34,875 37,599 15%
Total 240,171 252,093 249,403 224,725 259,386 -
Pct. from Alaska 26% 32% 38% 42% 42% -
Source: Japan Trade Statistics (Ministry of Finance), compiled by McDowell Group.
Imported surimi prices have trended up in Japan during recent years, partly due to lower domestic production and a weaker Japanese yen (Table 21). Alaska pollock surimi prices were lower than tropical surimi, on average, in Japan during recent years. This is due primarily to changes in supply patterns rather than the intrinsic quality of the product. Alaska pollock surimi production has increased significantly since 2010 while tropical surimi production declined in 2013 after years of steady growth. In addition, prices for common types of fish used in tropical surimi have increased.
Photo Courtesy of Genuine Alaska Pollock Producers.

Alaska Groundfish and Crab Wholesale Market Profiles NOAA/NMFS • 28
Table 21. Total and Unit Value of Japan Surimi Imports, 2010-2014
2010 2011 2012 2013 2014 Pct. Change
from 4 yr. Avg.
Total Import Value - millions yen ¥72,321 ¥69,913 ¥77,436 ¥71,924 ¥88,979 22%
Total Import Value - Yen/kg ¥301 ¥277 ¥310 ¥320 ¥343 14%
Alaska Surimi Import Value – millions yen ¥20,723 ¥19,580 ¥26,441 ¥23,452 ¥30,693 36%
Alaska Surimi Import Value – millions USD $236 $246 $331 $240 $290 10%
Alaska Surimi Import Value – Yen/kg. ¥333 ¥245 ¥281 ¥249 ¥279 1%
Alaska Surimi Import Value – USD/kg. $3.80 $3.08 $3.53 $2.55 $2.64 -19%
Average Exchange Rate (Yen/USD) 87.8 79.7 79.8 97.6 105.9 23%
Note: Value figures are CIF Japan. U.S. dollar conversions were made using average annual exchange rates from OANDA.com. Source: Japan Trade Statistics (Ministry of Finance), compiled by McDowell Group.
EUROPE AND RUSSIA Europe and former Soviet states are the second largest market for Alaska pollock surimi. Alaska producers exported 28,200 mt of surimi worth $61.2 million to Europe and Russia in 2014. Alaska surimi accounts for approximately half (33,000 mt) of the market’s total surimi consumption, including Alaska product routed through other countries.
Russia, France, and Spain are the market’s largest surimi consumers, accounting for 71 percent of the region’s total consumption.19 The majority of Europeans consume surimi as imitation crab stick products, although numerous other surimi product forms are sold. A surimi-based substitute for baby eels, known as angulas, is popular in Spain and Portugal.
SOUTH KOREA The United States exported 56,804 mt of Alaska pollock surimi to South Korea in 2014, which accounted for 44 percent of Alaska pollock surimi exports. However, Korean import statistics suggest only 18,715 mt actually entered the country. The balance is likely held in bonded, duty-free cold storage warehouses before being shipped to other markets (primarily Japan, Europe, and Russia). Despite the prevalent re-export trade, South Korea is the second-largest buyer of Alaska surimi in terms of a single country (in most years). The 2012 Korea-U.S. Free Trade Agreement has deepened the economic ties between Korea and the United States and increased consumption of U.S. pollock surimi.20 However, Korea has played the role of the North Pacific’s chest freezer for decades.
South Korea imported 128,200 mt of all surimi varieties in 2014 worth $226.4 million, or about half as much import volume as Japan. Vietnam and China are the country’s top surimi suppliers, while Alaska accounted for 15 percent of total surimi imports. Korea is one of the largest manufacturers of surimi seafood products after Japan, supplying its own domestic market and other international markets.21
Surimi products are traditionally consumed in Korea as eomuk (fried) or as crabsticks. Eomuk bars (pictured to the right) are a popular street food in Korea with
19 (Welling, 2014) 20 (Yoo, 2013) 21 (Park, 2014)
Eomuk fish cake, a popular Korean street food. Wikimedia Commons, CC-BY-SA 3.0 lic., Junho Jung

Alaska Groundfish and Crab Wholesale Market Profiles NOAA/NMFS • 29
hundreds of variations. The bars, who’s closest American translation might be the corn dog, are usually served on a stick or accompanied by broth or sauces.
Competing Supply It is important to note that there are two tiers in which Alaska pollock surimi has competition. One is the raw material, which is minced fish. The second is surimi production, which requires advanced food science technology to produce a variety of surimi products.
Pollock surimi accounted for 26 percent of total surimi production over the past 5 years (2010-2014). Virtually all pollock surimi is produced in Alaska or comes from Alaska fisheries. Tropical surimi dominates global surimi production, accounting for about two-thirds of total production. China, Vietnam, Thailand, and India are the largest tropical surimi producers.
Table 22. Global Surimi Production (mt), 2010-2014
Surimi Type 2010 2011 2012 2013 2014 5 Yr. Avg. Pct. of Surimi Supply
Major Producers
Alaska Pollock 160,900 208,800 227,100 216,000 213,000 26% Alaska
Cold Water 34,000 30,700 34,100 37,000 37,500 5% WA/OR, Argentina, Chile
Tropical Fish 485,000 537,000 576,600 528,000 550,000 68% China, Vietnam, Thailand, India
Other 33,000 19,000 20,500 8,500 4,500 1% -
Total 712,900 795,500 858,300 789,500 805,000 - -
Source: Future Seafood Group (via Undercurrent News).
Surimi is made from a variety of fish species. Alaska pollock is the most widely used species, but other types of surimi utilize a range of other fish. Some common species used in surimi production are listed below.
Tropical Surimi Species
• Threadfin bream (Nemipterus japonicus), also known as ‘itoyori’ – most common tropical species • Lizardfish (Saurida tumbil), also known as ‘eso’ • Big Eye (Priacanthus spp.), also known as ‘kinmedai’
Cold Water Surimi Species
• Pacific hake (Merluccius productus), also known as Pacific whiting • Hoki (Macruronus novaezelandiae) • Northern/Southern blue whiting (Micromesistius poutassou/australis) • Jack mackerel (Trachurus murphyi) • Atka mackerel (Pleurogrammus monopterygius)
Many countries have active fisheries that support surimi production. In terms of a single country, the United States is the second-largest surimi producer in the world. Most U.S. surimi production comes from Alaska (pollock) and the Pacific hake fishery off the coast of Washington and Oregon. As shown in Table 22, pollock accounts for 26 percent of surimi supply, a small share compared to tropical fish species which account for 68 percent of surimi production. Russia occasionally produces a relatively insignificant volume of surimi, relative to other producers. China, India, and Southeast Asia (including Thailand and Vietnam), are key tropical surimi producers, with China typically claiming the title of world’s largest surimi producer. Argentina, Chile, and the Faroe Islands are important cold water surimi producers. It should be noted that surimi production statistics are not universally tracked. Although FAO compiles data on minced fish and surimi production, the manner in which data is categorized do not allow for comprehensive production accounting. As a result, industry estimates (which are based on public and private data) are a more reliable source of information.

Alaska Groundfish and Crab Wholesale Market Profiles NOAA/NMFS • 30
Wholesale Market Profile of Alaska Pollock Roe Pollock roe commands the highest price of all major pollock products at $6.14/kg and was worth $148 million in total first wholesale value in 2014. It accounted for 11 percent of Alaska pollock’s total first wholesale value but only 4 percent of production volume (24,120 mt). Pollock roe is widely consumed as a condiment and during holidays in Japan. South Korea is the world’s only other sizeable market.
Product Description and Supply Chain Pollock roe production occurs when the fish are spawning. Due to the variety of spawning timing within pollock stocks, the spawning season extends from November to May but most production occurs during the late winter and early spring. After the fish is headed, roe is extracted during the gutting process and rapidly frozen before deterioration occurs. Roe prices are tied to the quality of the roe, which varies greatly. Lower grade roe might have defects such as discoloring, broken skeins, or be discounted due to roe maturity (eggs are too young or too old). Product caught and processed at sea tends to command the highest prices with average prices of $7.50/kg compared to $4.90/kg shoreside.22 Pollock roe is traditionally sold to wholesale buyers in frozen block form, packed into 49.5 lb cases each containing three blocks of roe.
Pollock roe is an export product. Frozen Alaska pollock roe is sold at auctions in Seattle, WA,23 while Russian pollock roe is often sold at auctions held in Busan, South Korea. However, larger volumes of Alaska product is sold directly to buyers through negotiated contracts. “Direct sales” have become more common in recent years, based on pricing discovered through the auction process. The pollock roe supply chain is vertically integrated for large companies that maintain a pipeline from the raw material all the way to distribution in markets in Japan and South Korea. In fact, 80 percent of Alaska’s pollock quota is shared by four large vertically-integrated companies: Trident Seafoods, Maruha Nichiro, Nissui, and American Seafoods.24 Each of these companies own stakes in Alaska fishing vessels, Alaska shoreside plants, and distributors in Japan and South Korea.
After frozen pollock roe is exported to Asia, it eventually undergoes secondary processing. Japan, Korea, China, and in Thailand are common destinations, where it is processed by defrosting and brining the roe in spices or salt.25 In Japan, pollock roe is often sold in the skein and consumed as salted roe (tarako) or spicy/marinated roe (karashi mentaiko). The product is commonly utilized as a condiment and as an ingredient in soups, rice balls (onigiri), rice dishes, and pastas. High quality pollock roe is a popular gift during holidays and consumed individually with sake.
22 AFKIN 23 (Stewart, 2013) 24 (The Fish Site, 2015) 25 Interview with domestic seafood company wholesale representative.
Photo from NMFS (AFSC).
Mentaiko gift box, Japanese pollock roe retail product.

Alaska Groundfish and Crab Wholesale Market Profiles NOAA/NMFS • 31
Figure 12. Alaska Pollock Roe Supply Chain
Alaska Production Analysis Alaska pollock roe is an important element of the pollock product mix. Although it is a low-volume product, roe assumes the highest unit price of any pollock product. In 2014, only 24,120 metric tons was produced, but the wholesale value $148.2 million (11 percent of the species’ wholesale value) (Figure 13 and Table 23).
Figure 13. First Wholesale Volume and Value for Alaska Pollock Roe, 2005-2014
Table 23. First Wholesale Value, Alaska Pollock Roe, $Millions 2005 2006 2007 2008 2009 2010 2011 2012 2013 2014
$353 $291 $262 $240 $163 $98 $153 $169 $116 $148
Source: AKFIN.
Historically (prior to 2007), roe often accounted for one-third to one-fifth of Alaska pollock’s total first wholesale value. It was a consistently valuable market. However, the percentage of roe value compared to all Alaska pollock products has declined significantly in recent years (Figure 14). Since 2010, roe has only generated 9 to 12 percent of total first wholesale value. This market development has an even deeper impact
$5,000
$6,000
$7,000
$8,000
$9,000
$10,000
$11,000
$12,000
$13,000
$14,000
0
5,000
10,000
15,000
20,000
25,000
30,000
35,000
2005 2006 2007 2008 2009 2010 2011 2012 2013 2014
Valu
e/m
t
Volu
me
(mt)
Volume (in mt) Value/mt
Alaska Catcher Vessels
Motherships (Floating Processors)
Shoreside Processors
Catcher Processors
Pollock Roe Auctions in Seattle & Direct Sales
Secondary Processors & Trading Companies in
Japan
Secondary Processors & Trading Companies in
South Korea
Japanese Consumer Market
South Korean Consumer Market
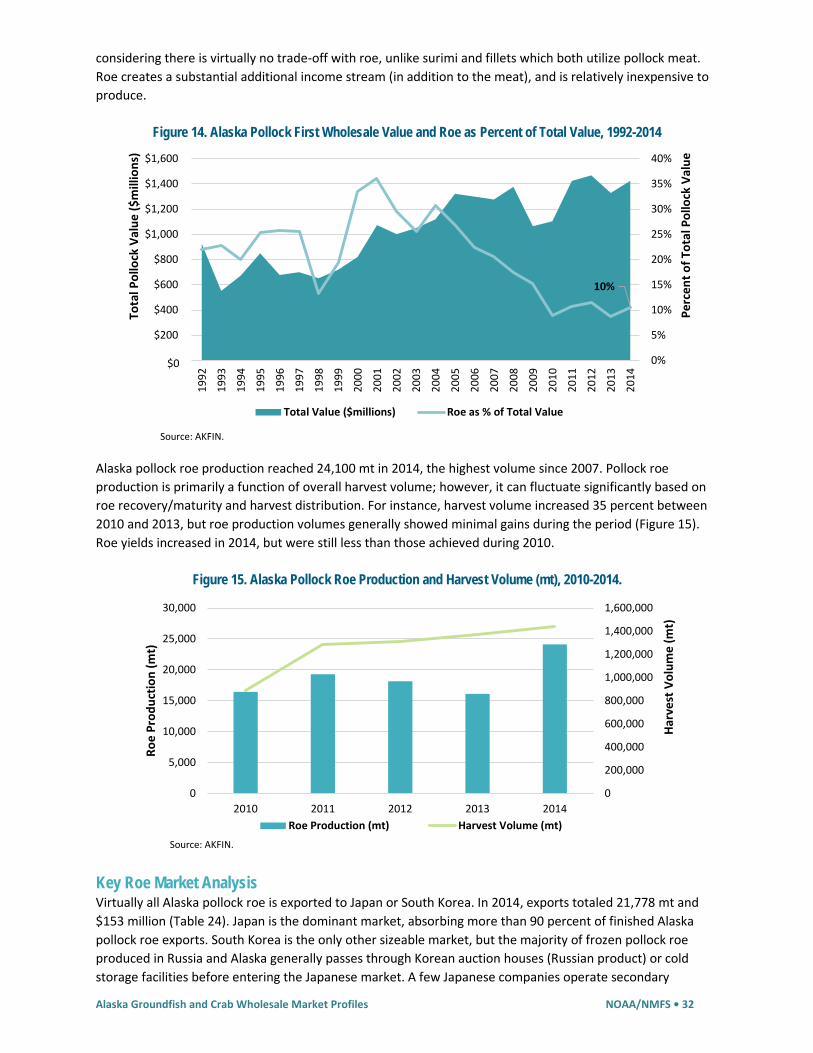
Alaska Groundfish and Crab Wholesale Market Profiles NOAA/NMFS • 32
considering there is virtually no trade-off with roe, unlike surimi and fillets which both utilize pollock meat. Roe creates a substantial additional income stream (in addition to the meat), and is relatively inexpensive to produce.
Figure 14. Alaska Pollock First Wholesale Value and Roe as Percent of Total Value, 1992-2014
Alaska pollock roe production reached 24,100 mt in 2014, the highest volume since 2007. Pollock roe production is primarily a function of overall harvest volume; however, it can fluctuate significantly based on roe recovery/maturity and harvest distribution. For instance, harvest volume increased 35 percent between 2010 and 2013, but roe production volumes generally showed minimal gains during the period (Figure 15). Roe yields increased in 2014, but were still less than those achieved during 2010.
Figure 15. Alaska Pollock Roe Production and Harvest Volume (mt), 2010-2014.
Key Roe Market Analysis Virtually all Alaska pollock roe is exported to Japan or South Korea. In 2014, exports totaled 21,778 mt and $153 million (Table 24). Japan is the dominant market, absorbing more than 90 percent of finished Alaska pollock roe exports. South Korea is the only other sizeable market, but the majority of frozen pollock roe produced in Russia and Alaska generally passes through Korean auction houses (Russian product) or cold storage facilities before entering the Japanese market. A few Japanese companies operate secondary
0
200,000
400,000
600,000
800,000
1,000,000
1,200,000
1,400,000
1,600,000
0
5,000
10,000
15,000
20,000
25,000
30,000
2010 2011 2012 2013 2014
Harv
est V
olum
e (m
t)
Roe
Prod
uctio
n (m
t)
Roe Production (mt) Harvest Volume (mt)
10%
0%
5%
10%
15%
20%
25%
30%
35%
40%
$-
$200
$400
$600
$800
$1,000
$1,200
$1,400
$1,600
1992
1993
1994
1995
1996
1997
1998
1999
2000
2001
2002
2003
2004
2005
2006
2007
2008
2009
2010
2011
2012
2013
2014
Perc
ent o
f Tot
al P
ollo
ck V
alue
Tota
l Pol
lock
Val
ue ($
mill
ions
)
Total Value ($millions) Roe as % of Total Value
$0
Source: AKFIN.
Source: AKFIN.

Alaska Groundfish and Crab Wholesale Market Profiles NOAA/NMFS • 33
processing facilities in China, but domestic seafood industry contacts report very little product actually enters the vast Chinese consumer market.
Efforts to develop other pollock roe markets outside of Japan have been largely unsuccessful, but given stagnant Japanese consumption patterns and the weaker yen, finding additional roe markets is extremely important to the long-term health of Alaska’s pollock industry. The industry is exploring opportunities to utilize more mentaiko and tarako in sushi preparations, as well as marketing it as an ingredient in pasta sauces and investigating new products which might find appeal in other caviar markets.
Pollock roe supply has increased faster than demand in recent years. Larger production volumes, as well as a weaker yen and shifting Japanese consumer preferences, have resulted in lower prices and lower overall value for Alaska pollock roe. Large inventories and a sharp increase in supply led to declining prices in 2014, and trade press reports suggest prices fell further during the spring 2015 roe auction in Seattle.
Table 24. Exports of Alaska Pollock Roe by Country (mt), 2010-2014
Export Destination 2010 2011 2012 2013 2014 Pct. Change from 4 Yr. Avg.
Japan 5,535 8,027 7,621 6,544 11,212 62%
South Korea 5,601 9,196 7,560 7,414 9,792 32%
China 138 312 554 901 764 61%
Other 3 4 172 108 10 -86%
Total Export Volume 11,276 17,539 15,907 14,967 21,778 46%
Total Export Value ($millions) $107.1 $158.4 $117.9 $114.2 $152.8 23%
Avg. Export Price per kg $9.16 $9.48 $6.34 $8.96 $7.07 -17%
Source: ASMI Alaska Seafood Export database, compiled by McDowell Group.
During the spring and fall, large volume pollock roe buyers come from Japan and South Korea to buy roe from Alaska producers in auction markets held in Seattle. Spring auctions produce significantly higher sales volumes. The same buyers also purchase Russian pollock roe at large auctions in Busan and Tokyo.26
JAPAN Japan is the world’s primary pollock roe market with imports of 44,800 mt in 2014, worth $330 million (Table 25 and 26). Pollock roe is consumed in a variety of ways in Japan, including in sushi rolls, rice balls, soups, noodle dishes, or by itself. High-grade roe traditionally is used in gift boxes for holidays and special occasions. In the retail market, mid-grade is sold as salted roe. Food service purchases tend to purchase lower quality roe for rice and noodle dishes.27 Pollock roe is a traditional product in Japanese food culture, with consumption dating back to the mid-1900s.
Table 25. Japan Pollock Roe Imports (mt), 2010-2014
Exporter 2010 2011 2012 2013 2014 Pct. of Total (5-yr. Avg.)
Russia 25,379 23,736 25,179 21,008 24,916 61%
U.S. (Alaska) 13,368 14,520 15,260 13,158 19,720 39%
Others 59 151 180 237 164 <1%
Total 38,806 38,407 40,619 34,403 44,800 -
Pct. from Alaska 34% 38% 38% 38% 44% -
Source: Japan Trade Statistics (Ministry of Finance), compiled by McDowell Group.
26 (Nissui Group, n.d.) 27 Interview with domestic seafood company wholesale representative.

Alaska Groundfish and Crab Wholesale Market Profiles NOAA/NMFS • 34
Alaska product accounted for 39 percent of the import volume between 2010 and 2014. Russia is the country’s largest pollock roe supplier. Imports of Alaska product increased 40 percent in 2014 versus the prior 4 year average due to better roe yields and slightly higher TACs in Alaska pollock fisheries. Total imports increased 18 percent versus the prior 4 year average.
In yen terms, total Japanese pollock roe imports tend to range from 30 to 35 billion yen but the value of the market in dollar terms fluctuates with exchange rates (Table 26). Despite a 17 percent increase in import volume and a 7 percent increase in value (in yen terms) during 2014, Japan’s import value of all pollock roe in U.S. dollar terms decreased 10 percent compared to the prior 4 year average.
Import volume and prices spiked in 2012. The March 2011 tsunami, which devastated many coastal Japanese communities, affected inventories, and led to a significantly weaker yen – a trend that continued until early 2013. Prices in both yen and dollars terms have declined substantially since 2012.
Table 26. Value of Japan Pollock Roe Imports, 2010-2014
2010 2011 2012 2013 2014 Pct. Change from 4 Yr. Avg.
Total Import Value – millions USD $318 $357 $482 $309 $330 -10%
Total Import Value - millions yen ¥28,931 ¥28,849 ¥38,715 ¥30,567 ¥33,878 7%
Total Import Value - Yen/kg ¥746 ¥751 ¥953 ¥888 ¥756 -9%
Alaska Surimi Import Value – millions yen ¥8,896 ¥10,886 ¥13,640 ¥10,206 ¥13,916 28%
Alaska Surimi Import Value – millions USD $98 $135 $170 $103 $136 7%
Alaska Surimi Import Value – Yen/kg. ¥666 ¥750 ¥894 ¥776 ¥706 -8%
Alaska Surimi Import Value – USD/kg. $7.34 $9.32 $11.13 $7.84 $6.88 -23%
Average Exchange Rate (Yen/USD) 87.8 79.7 79.8 97.6 105.9 23%
Note: Value figures are CIF Japan. U.S. dollar figures are from Global Trade Atlas. Average exchange rates are from OANDA.com. Source: Japan Trade Statistics (Ministry of Finance) and Global Trade Atlas, compiled by McDowell Group.
The Japanese pollock roe market – and by extension, the value of the pollock roe resource – is well defined with relatively steady demand. The value of roe is function of production volume in Russia and Alaska, as well as the strength or weakness of the yen. However, due to static (even slightly declining) demand, the product’s unique niche, and a lack of alternative markets and uses, the upside potential of the Japanese market appears limited unless the consumer base can be expanded.
SOUTH KOREA South Korea is the second largest consumer of pollock roe, but it also is an intermediary buyer. An average of 14,222 mt of pollock roe imports were registered by the Korean Customs and Trade Development Institution between 2012 and 2014. However, Russia and Alaska sent 48,494 mt of pollock roe to South Korea per year during this period (Table 27). Trade statistic discrepancies are likely due to product which is sent to Korea for auction, storage, or secondary processing. Export figures represent all product shipped to Korea, while import statistics refer to product entering the Korean market. Korean import statistics suggest the Korean market consumes approximately a quarter of total pollock roe volume. Alaska supplies an estimated 21 percent of the Korean domestic market.
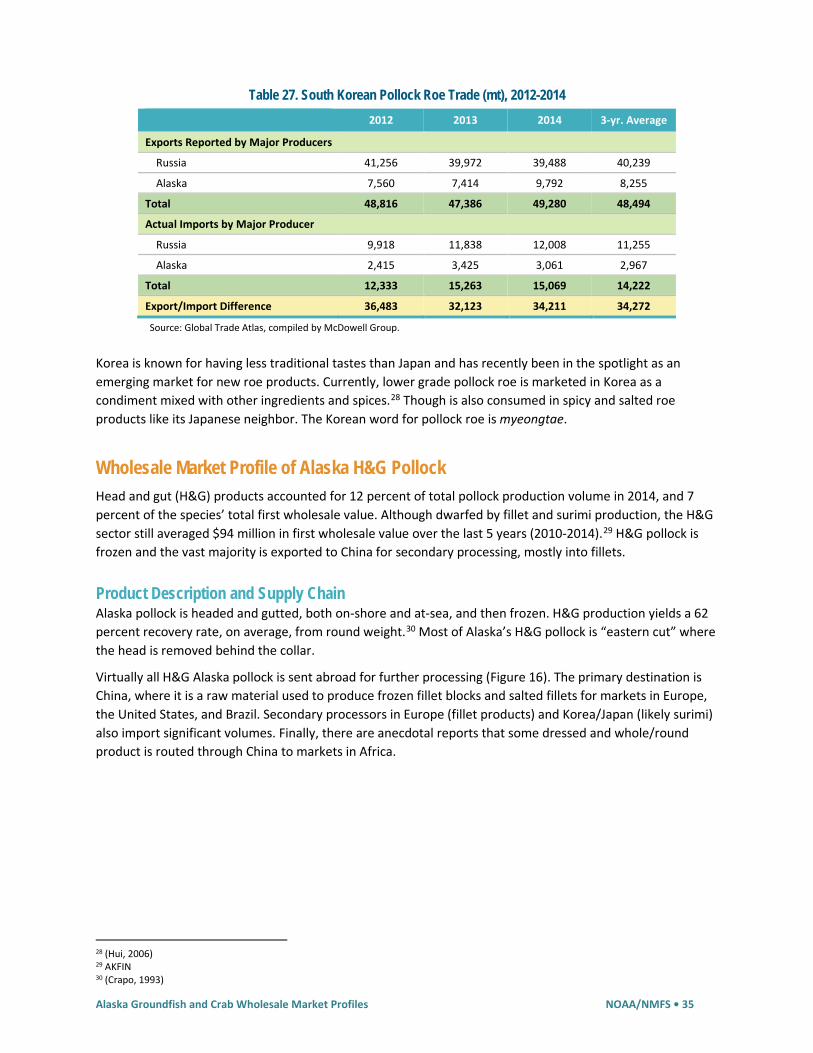
Alaska Groundfish and Crab Wholesale Market Profiles NOAA/NMFS • 35
Table 27. South Korean Pollock Roe Trade (mt), 2012-2014 2012 2013 2014 3-yr. Average
Exports Reported by Major Producers
Russia 41,256 39,972 39,488 40,239
Alaska 7,560 7,414 9,792 8,255
Total 48,816 47,386 49,280 48,494
Actual Imports by Major Producer
Russia 9,918 11,838 12,008 11,255
Alaska 2,415 3,425 3,061 2,967
Total 12,333 15,263 15,069 14,222
Export/Import Difference 36,483 32,123 34,211 34,272
Source: Global Trade Atlas, compiled by McDowell Group.
Korea is known for having less traditional tastes than Japan and has recently been in the spotlight as an emerging market for new roe products. Currently, lower grade pollock roe is marketed in Korea as a condiment mixed with other ingredients and spices.28 Though is also consumed in spicy and salted roe products like its Japanese neighbor. The Korean word for pollock roe is myeongtae.
Wholesale Market Profile of Alaska H&G Pollock Head and gut (H&G) products accounted for 12 percent of total pollock production volume in 2014, and 7 percent of the species’ total first wholesale value. Although dwarfed by fillet and surimi production, the H&G sector still averaged $94 million in first wholesale value over the last 5 years (2010-2014).29 H&G pollock is frozen and the vast majority is exported to China for secondary processing, mostly into fillets.
Product Description and Supply Chain Alaska pollock is headed and gutted, both on-shore and at-sea, and then frozen. H&G production yields a 62 percent recovery rate, on average, from round weight.30 Most of Alaska’s H&G pollock is “eastern cut” where the head is removed behind the collar.
Virtually all H&G Alaska pollock is sent abroad for further processing (Figure 16). The primary destination is China, where it is a raw material used to produce frozen fillet blocks and salted fillets for markets in Europe, the United States, and Brazil. Secondary processors in Europe (fillet products) and Korea/Japan (likely surimi) also import significant volumes. Finally, there are anecdotal reports that some dressed and whole/round product is routed through China to markets in Africa.
28 (Hui, 2006) 29 AKFIN 30 (Crapo, 1993)

Alaska Groundfish and Crab Wholesale Market Profiles NOAA/NMFS • 36
Figure 16. Alaska Pollock Head & Gut Supply Chain
Production Analysis In 2014, H&G pollock production increased to 67,200 mt and was worth $94 million in first wholesale terms (Figure 17 and Table 28). H&G has increased its share of pollock production and the 2014 volume was significantly higher than its 10-year average of 40,700 mt - an increase of 65 percent (Figure 18).
Figure 17. First Wholesale Volume and Value for Frozen H&G Alaska Pollock, 2005-2014
Table 28. First Wholesale Value, Frozen H&G Alaska Pollock, $Millions 2005 2006 2007 2008 2009 2010 2011 2012 2013 2014
$29 $30 $45 $42 $86 $97 $109 $71 $100 $94
Source: AKFIN.
Alaska Pollock Catch
At-Sea & On-Shore Primary Processing
Frozen H&GPollock
China Secondary Processors
European Secondary Processors
Fillet Markets Surimi End Markets
Other Secondary Processors
$1,200
$1,300
$1,400
$1,500
$1,600
$1,700
$1,800
$1,900
$2,000
0
10,000
20,000
30,000
40,000
50,000
60,000
70,000
80,000
2005 2006 2007 2008 2009 2010 2011 2012 2013 2014
Valu
e/m
t
Volu
me
(mt)
Volume (in mt) Value/mt

Alaska Groundfish and Crab Wholesale Market Profiles NOAA/NMFS • 37
With declining prices for pollock fillets (and a dissipating premium for once-frozen fillets), the share of H&G production has increased. Average prices for fillets and H&G are $3.00/kg and $1.40/kg, respectively. Additional processing costs are exported to international processors. At-sea and shoreside production volume of H&G fish are roughly equivalent but the price for at-sea product is $1.42/kg, compared to a shoreside price of $1.06/kg in 2014 (Figure 19).31
Figure 18. Head and Gut Production Share, 2003-2014
Source: AKFIN.
Figure 19. Alaska Pollock H&G Volume and Value, by Processing Sector, 2004-2014
Source: AKFIN.
Key Head and Gut Market Analysis Headed and gutted Alaska pollock is primarily exported to China for reprocessing; the country bought 82 percent of exported Alaska product between 2012 and 2014. Thailand, South Korea, and Ukraine also import substantial volumes of H&G Alaska pollock (Table 29). Virtually all of Alaska’s H&G pollock production is sold to export markets, primarily to countries that perform secondary processing to produce whitefish fillets or surimi.
31 AKFIN
$0
$10,000
$20,000
$30,000
$40,000
$50,000
$60,000
$70,000
$80,000
$90,000
-
10,000
20,000
30,000
40,000
50,000
60,000
70,000
80,000
2004 2005 2006 2007 2008 2009 2010 2011 2012 2013 2014
Valu
e ($
000s
)
Volu
me
(mt)
At-Sea Volume Shoreside Volume At-Sea Value Shoreside Value
0%
2%
4%
6%
8%
10%
12%
14%
16%
18%
2003 2004 2005 2006 2007 2008 2009 2010 2011 2012 2013 2014
Perc
ent o
f Tot
al P
rodu
ctio
n Vo
lum
e
0

Alaska Groundfish and Crab Wholesale Market Profiles NOAA/NMFS • 38
Table 29. Imports of Alaska H&G Pollock by Country (mt), 2012-2014 Country 2012 2013 2014 China 34,966 47,767 50,476 Thailand 4,590 4,226 4,310 South Korea 1,456 1,285 3,498 Ukraine/Russia 22 2 5,571 Other 1,195 765 2,533 Total Exports 42,229 54,045 66,388 Total Production 48,153 62,258 67,167
Source: Global Trade Atlas and AKFIN.
Data in this section relies on import statistics from trading partners because tracking Alaska H&G pollock with U.S. export statistics presents some unique challenges. The first issue is that U.S. exports of the product tend to be about 15,000 mt higher than imports reported by global trading partners. This is likely due to a mischaracterization of fillet blocks as H&G product by some producers. In addition, the H.S. codes for pollock changed in 2012 and it is possible that buyers and sellers are using different codes in some cases.32 Generally, the data quality of U.S. export statistics is very good, but in this case data the total U.S. exports of H&G Alaska pollock is well above what is actually produced in Alaska – suggesting an issue with U.S. export statistics. Further, the U.S. imports very little H&G pollock from other countries, so the issue cannot be related to re-exports of non-Alaska product.
CHINA The majority of Alaska H&G pollock is sent to China for secondary processing due to lower production costs and more favorable tariff treatment. In 2014, China imported 50,476 mt of Alaska H&G pollock (Table 30). This product, along with Russian H&G pollock is processed into fillets and other salted or breaded products for re-export to Europe, the United States, and Brazil. At this point, most product joins the global pollock fillet supply as a twice-frozen product. U.S. exports of H&G pollock to China have increased in recent years due to increasing H&G production.
Table 30. China Imports of Frozen H&G Pollock by Country (mt), 2012-2014 Country 2012 2013 2014
Russia 574,013 563,792 514,497
U.S. 34,966 47,767 50,476
Japan 33,146 44,247 39,945
South Korea 7,189 8,349 1,890
Other 43 158 8,417
Total 649,357 664,447 615,268
Source: Global Trade Atlas.
Half of China’s frozen pollock fillets are re-exported to Europe. The United States is the next largest market, accounting for 15 percent of re-exports while Brazil ranks third at 14 percent (Table 31). China imports frozen pollock from the United States, Russia, and South Korea. In addition, China exported 62,190 mt of salted, smoked, or dried fish in 2013 worth $329 million. H.S. codes are generally less specific about the species of these products; however, the majority is likely cod and pollock. Brazil, the United States, and Portugal are the largest importers of Chinese salted, smoked, or dried fish products.
32 The Harmonized Commodity Description and Coding System, also known as the Harmonized System (HS), is an internationally standardized system of names and numbers (product codes) used to classify internationally traded products.

Alaska Groundfish and Crab Wholesale Market Profiles NOAA/NMFS • 39
Table 31. Chinese Re-exports of Frozen Alaska Pollock Fillets, by Market, 2014
Markets Volume (mt)
Value ($millions)
Pct. of Total China Pollock Fillet Re-
Exports
Germany 85,578 $256.1 29%
United States 42,686 121.5 15%
Brazil 39,896 92.8 14%
Europe (not including Germany) 58,767 172.7 20%
South Korea 13,973 38.6 5%
Russia 11,646 23.3 4%
Japan 5,997 22.3 2%
Total Re-Exports 291,686 $813.2 -
Notes: Totals may not sum due to rounding. Does not include salted, smoked, dried, or other value-added products. Source: Global Trade Atlas.
OTHER MARKETS One of the fastest-growing regions that pollock producers have their eye on is Africa, which has been an emerging market for whole round fish. With a population of 1.1 billion and a GDP growth rate of 5.2 percent in 2014, Africa is a growing market for seafood.33 Russian fishing companies are producing more whole round pollock destined for Nigeria, one of the larger African economies.34
Competing Supply Overall, H&G pollock is an intermediate product and most of it eventually joins the global supply of frozen pollock fillet blocks. H&G supply is a function of total harvest volume, surimi production, fillet processing costs, shipping costs, and the difference in prices for once-frozen versus twice-frozen fillet products.
The largest pollock harvests come from Alaska and Russia, with combined TACs over 3 million metric tons. The vast majority of Russian pollock is exported or sold to domestic buyers as an H&G product, while most Alaska pollock is filleted directly or used in surimi production. Alaska H&G pollock supply is somewhat dictated by relative value of once-frozen pollock fillets over twice-frozen pollock and other whitefish fillets, as well as processing production costs in Alaska relative to other areas. As shown in Table 31, Chinese imports of frozen Alaska H&G pollock have substantially increased in recent years.
Global Pollock Production and Competing Supply Alaska pollock is fished almost entirely by Alaska and Russia, due to its distribution in the North Pacific Ocean. Japan, South Korea, and North Korea also harvest pollock, though in smaller volumes than Alaska or Russia.
Pollock production has increased in recent years, from 2.83 million mt in 2010 to an estimated 3.39 million mt in 2014. Alaska harvested 1.44 million mt in 2014 and accounted for 43 percent of global supply. Despite increasing harvest volumes in recent years and providing the fish’s namesake, Alaska is currently the world’s second-largest pollock producer behind Russia (Table 32).
33 World Bank (GDP growth rate) 34 (Seaman, 2015)

Alaska Groundfish and Crab Wholesale Market Profiles NOAA/NMFS • 40
Table 32. Global Pollock Harvest by Major Producer (mt), 2010-2014
Producer 2010 2011 2012 2013 2014
Pct. Change over
2010-2013 Average
Russia 1,584,527 1,579,792 1,632,631 1,558,721 1,625,000 2%
U.S. (Alaska) 888,410 1,281,803 1,310,231 1,370,115 1,442,839 19%
Japan 251,166 238,920 229,823 228,200 228,200 -4%
South Korea 46,795 48,793 39,026 24,342 24,300 -39%
Others 62,167 64,593 67,132 66,243 66,200 2%
Total 2,833,065 3,213,901 3,278,843 3,247,621 3,386,539 8%
Pct. from Alaska 31% 40% 40% 42% 43% -
Source: FAO, Groundfish Forum, NMFS Alaska Region Catch Reports, ADF&G Groundfish Reports, and McDowell Group estimates.
Pollock has been harvested for many decades, but the United States did not play a significant role in the fishery until the passage of the Magnuson-Stevens Fishery and Conservation Act (MSA) in 1976. The legislation laid the groundwork for consolidating control over territorial waters, and along with later amendments and other international agreements, provided unfettered access for U.S. fishing companies to Alaska pollock fisheries within 200 nautical miles of U.S. soil.
U.S. harvests began ramping up in the mid-1980s, displacing Japanese vessels in newly designated Alaska waters (Figure 20). U.S. pollock harvests have been relatively consistent since 1989, producing an average of 1.30 million mt per year. Overall, pollock harvests have declined since the 1970s and 1980s due to tighter control over fishery access and the application of responsible fishery management practices.
Figure 20. Global Harvest Volume of Alaska Pollock (mt), 1977-2014
Source: FAO (1977-2013, non-Alaska), NMFS (1977-2014), and McDowell Group estimates (2014, non-Alaska).
0
1,000,000
2,000,000
3,000,000
4,000,000
5,000,000
6,000,000
7,000,000
1977
1978
1979
1980
1981
1982
1983
1984
1985
1986
1987
1988
1989
1990
1991
1992
1993
1994
1995
1996
1997
1998
1999
2000
2001
2002
2003
2004
2005
2006
2007
2008
2009
2010
2011
2012
2013
2014
Volu
met
(mt)
Alaska Russia Japan South Korea Other

Alaska Groundfish and Crab Wholesale Market Profiles NOAA/NMFS • 41
COMPETING SPECIES Several other species impact the market for pollock fillets and surimi, including (in order of importance for each category):
Fillets • Atlantic and Pacific cod • Haddock • Saithe • Hake • Tilapia • Pangasius
Surimi • Tropical species (including threadfin bream, lizardfish, and big eye) • Hake
Pollock supply likely increased in 2015, but supplies of most other competing wild whitefish species are expected to decline (Table 33). Cod and haddock production in Europe likely declined in 2015, which would have been supportive for the pollock fillet market but the weak euro and larger pollock TACs more than offset the effects of less competing whitefish species.
Table 33. Competing Whitefish Supply Trends
Species 2013 Harvest (thousands mt)
2014-2015 Expected Trend
Cod 1,821 Down 5%
Haddock 309 Down 3%
Hakes1 1,019 Down 6%
Saithe 309 Flat
Russian Pollock 1,559 Up 5%
Alaska Pollock 1,370 Up 5% 1 Includes major hake fisheries only. Source: FAO (2013) and Groundfish Forum (2014-2015 Expected Trends).

Alaska Groundfish and Crab Wholesale Market Profiles NOAA/NMFS • 42
Wholesale Market Profile for Pacific Cod
Pacific cod35 (Gadus macrocephalus), also known as Alaska cod, is a whitefish found in the coastal Pacific Ocean from Alaska to California with the largest concentration found in the Gulf of Alaska and the Bering Sea. The largest of the Alaska groundfish species, Pacific cod can reach a length of 6 feet. In 2014, Alaska Pacific cod accounted for 18 percent of total global cod harvest, with 154,584 metric tons in 2014. The first wholesale production was worth $472 million, or 19 percent of total Alaska groundfish value in 2014. Highly valued for their mild, white flesh, Pacific cod are primarily processed into fillet and H&G products.
Table 34. Summary Profile of Pacific Cod Wholesale Production and Markets, 2014
Value and Volume Key Products H&G Fillet Other
First Wholesale Production (mt) 154,584 Pct. of Value 70% 21% 9%
Pct. of Global Cod Harvest (2013) 18% Key Markets China Europe U.S. Other
First Wholesale Value ($millions) $472 Pct. of Final Sales 37% 14% 31% 18%
Pct. of Alaska Groundfish Value 19% YOY Change 14% -6% 31% -11%
Production Volume Exported 67% Competing Species: Russian Pacific cod and Atlantic cod
Fishery Summary A transoceanic species with distribution from southern California to the Bering Strait, Pacific cod are found at depths up to 500m and are heavily distributed in Alaska waters. Due to their habitat distribution, Pacific cod are harvested predominantly with longlines and bottom trawl gear. Smaller amounts of Pacific cod are harvested by pot gear and jigs. Japanese and other foreign fishermen fished for cod in Alaska waters from the 1960s to 1977 when the 200-mile Exclusive Economic Zone (EEZ) was established by the Magnuson-Stevens Act, eliminating foreign fishing vessels in U.S. waters. Commercial fishing efforts remained a joint venture with Japanese vessels until the late 1980s when the fishing fleet became entirely U.S. based.
Fishing efforts between 1977 and 1987 were minimal, with an average of 23,000 mt landed. In comparison, landings averaged 262,000 mt annually over the past 10 years (Figure 21). The annual Total Allowable Catch (TAC) is determined by the National Marine Fisheries Services (NMFS) and quotas are set by the North Pacific Fishery Management Council. Community Development Quotas (CDQs) are allocated to eligible rural communities and account for approximately 10 percent of the BSAI TAC each year. There are three distinct fisheries for cod: federal, state-managed parallel season, and state waters fisheries. Over the past 5 years, more than 90 percent of total harvest volume came from federally managed fisheries (Table 35).
35 All references to cod or Alaska cod equate to Pacific Cod.
Photo Courtesy of ASMI.

Alaska Groundfish and Crab Wholesale Market Profiles NOAA/NMFS • 43
Figure 21. Pacific Cod Harvest Volume in Alaska (mt), 1977-2014
Source: NMFS OST (1977-2004) and NMFS Economic SAFE 2014 (2005-2014).
Table 35. Pacific Cod Harvest Volume for Federal and State Fisheries (mt), 2010-2014
Source: NMFS Alaska Region Catch Reports, ADF&G Groundfish Reports, and AKFIN.
In 2014, the longline fishery for cod accounted for 48 percent of the federal harvests statewide (Figure 22). Across Alaska, 35 percent of Pacific cod caught in federal fisheries was caught using trawl gear, however, this proportion varies by region. In the Gulf of Alaska, trawl gear accounted for 42 percent of total cod harvests. In the Bering Sea Aleutian Islands (BSAI) region, trawl gear accounted for 33 percent of cod harvests. Most of the catcher processor fleet produces frozen headed and gutted (H&G) product. Motherships tend to produce
2010 2011 2012 2013 2014
Federal
West GOA 21,005 22,317 18,352 19,247 21,686
Central GOA 36,848 39,754 37,775 32,025 40,219
East GOA 944 711 340 520 318
Total GOA 58,797 62,782 56,467 51,792 62,223 Catcher Processor (Amendment 80)
24,028 6,422 27,991 32,262 27,716
Catcher Processor (AFA) 4,041 24,743 6,332 6,678 4,427
Catcher Processor (Trawl) 28,177 39,816 46,419 43,698 42,085
Fixed Gear 93,645 125,853 140,402 136,681 137,302
Other (includes CDQ) 18,148 23,008 24,524 26,163 25,375
Total BSAI 168,039 219,842 245,668 245,482 236,905
State
Southeast/Yakutat 421 273 207 363 344
PWS 373 878 815 939 982
Cook Inlet 1,601 2,341 2,811 1,884 1,846
BSAI/AK Pen./Kodiak 27,101 28,239 30,071 18,069 31,551
Total State 29,497 31,731 33,904 21,254 34,723
Total Harvest 256,333 314,355 336,039 318,528 333,851
Pct. Federal 88% 90% 90% 93% 90%
0
50,000
100,000
150,000
200,000
250,000
300,000
350,000
1977
1978
1979
1980
1981
1982
1983
1984
1985
1986
1987
1988
1989
1990
1991
1992
1993
1994
1995
1996
1997
1998
1999
2000
2001
2002
2003
2004
2005
2006
2007
2008
2009
2010
2011
2012
2013
2014
Harv
est V
olum
e (m
t)
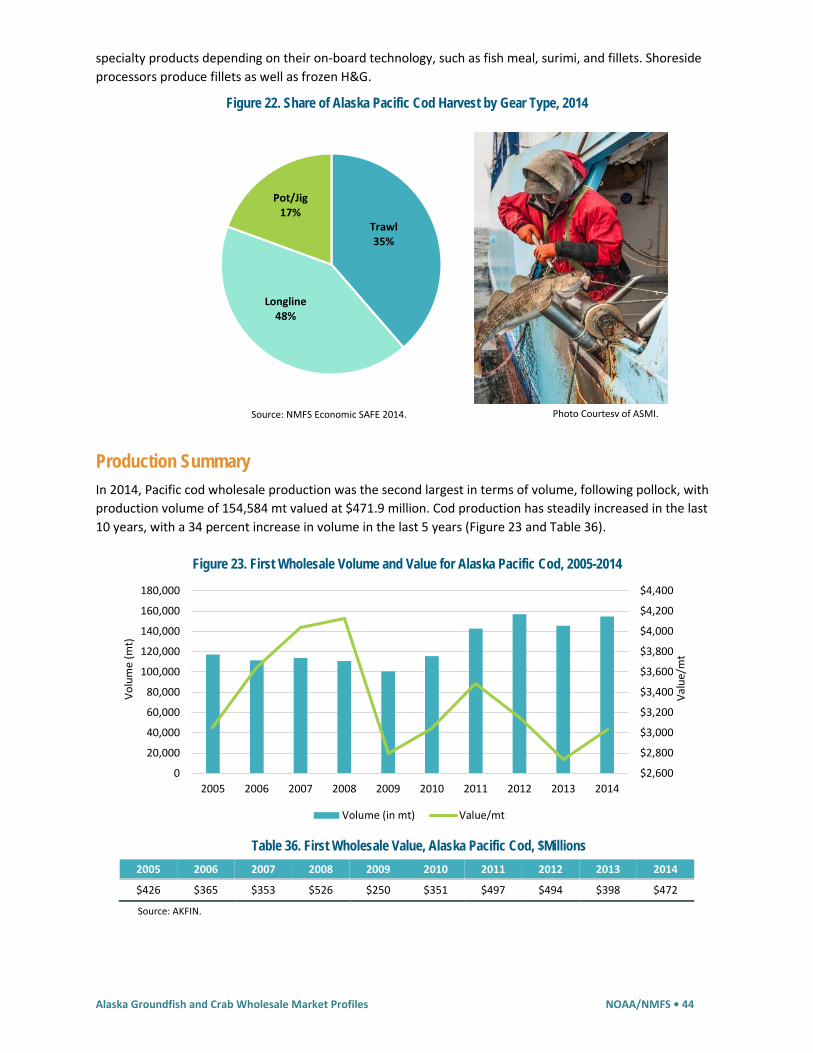
Alaska Groundfish and Crab Wholesale Market Profiles NOAA/NMFS • 44
specialty products depending on their on-board technology, such as fish meal, surimi, and fillets. Shoreside processors produce fillets as well as frozen H&G.
Figure 22. Share of Alaska Pacific Cod Harvest by Gear Type, 2014
Source: NMFS Economic SAFE 2014.
Production Summary In 2014, Pacific cod wholesale production was the second largest in terms of volume, following pollock, with production volume of 154,584 mt valued at $471.9 million. Cod production has steadily increased in the last 10 years, with a 34 percent increase in volume in the last 5 years (Figure 23 and Table 36).
Figure 23. First Wholesale Volume and Value for Alaska Pacific Cod, 2005-2014
Table 36. First Wholesale Value, Alaska Pacific Cod, $Millions 2005 2006 2007 2008 2009 2010 2011 2012 2013 2014
$426 $365 $353 $526 $250 $351 $497 $494 $398 $472
Source: AKFIN.
Trawl35%
Longline48%
Pot/Jig17%
$2,600
$2,800
$3,000
$3,200
$3,400
$3,600
$3,800
$4,000
$4,200
$4,400
0
20,000
40,000
60,000
80,000
100,000
120,000
140,000
160,000
180,000
2005 2006 2007 2008 2009 2010 2011 2012 2013 2014
Valu
e/m
t
Volu
me
(mt)
Volume (in mt) Value/mt
Photo Courtesy of ASMI.

Alaska Groundfish and Crab Wholesale Market Profiles NOAA/NMFS • 45
H&G product accounted for 74 percent of production volume (114,510 mt) in 2014, and 67 percent of first wholesale value ($317 million). Fillets accounted for 12 percent by wholesale volume (18,270 mt) and 25 percent of first wholesale value ($117 million). Other products, including roe and fish meal, made up 14 percent of wholesale volume with 20,014 mt valued at $37 million (Figure 24).
Figure 24. Volume and Value of Pacific Cod Wholesale Production in Alaska, by Product Type, 2014
The following sections detail production for the primary product forms of cod, provides an overview of the supply chain, and analyzes key markets.
Production Volume and Value of H&G and Fillets In 2014, Alaska harvest of Pacific cod was almost entirely processed as H&G and fillets—74 percent and 26 percent, respectively. The H&G sector averaged $294.7 million in first wholesale value over the last 5 years (2010-2014).36 Figure 25 shows overall Alaska production of H&G, which has been increasing. Most H&G cod is frozen and exported to China for secondary processing, mainly into fillets. Fillets are produced almost entirely at shoreside facilities and are frozen in shatterpack form, blocks, individually quick frozen (IQF), and fresh. The remainder of cod is salted, minced, or dried.
36 ADF&G (COAR).
Head and Gut74%
Fillets12%
Other Products
11%
Roe 3%
Volume154,584 mt
Head and Gut67%
Fillets25%
Other Products
5%
Roe 3%
Value$471.9 million
Source: AKFIN.

Alaska Groundfish and Crab Wholesale Market Profiles NOAA/NMFS • 46
Figure 25. Pacific Cod H&G Production in Alaska, by Volume and Value, 1992-2014
Source: ADF&G (COAR).
Table 37. Alaska Pacific Cod Production Volume and First Wholesale Value, by Region, 2014
Production Region Production
Volume (mt)
Pct. of Total
First Wholesale
Value ($thousands)
Avg. Price/kg Pct. of Total
Bering Sea and Aleutians 123,512 80% $351,287 $2.84 75%
Catcher/processors & Motherships 85,420 55% $241,684 $2.83 52%
Shoreside processors 38,092 25% $109,603 $2.88 23%
Gulf of Alaska 31,072 20% $117,490 $3.78 25% Catcher/processors 3,223 2% $8,610 $2.67 2% Shoreside processors 27,849 18% $108,880 $3.91 23%
Grand Total 154,584 $468,776
Note: Due to differences with when data was accessed, total value figures do not precisely match other totals quoted in this report. Source: AKFIN.
The BSAI region accounted for 75 percent of first wholesale production in 2014, with the Gulf of Alaska accounting for the remaining 25 percent (Table 37). The largest sector is the at-sea H&G production, which accounts for 54 percent of wholesale production volume.
There are a variety of Alaska fishing vessels that target cod, including freezer longliners, catcher-vessel longliners, trawlers, and pot vessels. Fixed gear vessels tend to see higher prices for H&G than prices received by trawl vessels. Most of the cod processed at-sea is frozen H&G. Floating catcher processors and mothership processors processed 66 percent of total wholesale production volume in 2014. Shoreside processing facilities turn out almost all of the sector’s fillet production, mostly in shatterpack form. Some
$-
$50
$100
$150
$200
$250
$300
$350
$400
-
20,000
40,000
60,000
80,000
100,000
120,000
140,000
1992
1993
1994
1995
1996
1997
1998
1999
2000
2001
2002
2003
2004
2005
2006
2007
2008
2009
2010
2011
2012
2013
2014
Valu
e ($
mill
ions
)
Volu
me
(mt)
Volume (in mt) Value (in $Millions)
Photo Courtesy of Star Boats.
0 $0

Alaska Groundfish and Crab Wholesale Market Profiles NOAA/NMFS • 47
of the largest shoreside locations for cod processing include Kodiak, Dutch Harbor, and Akutan, which accounted for 27 percent of total production volume in 2014.
Product Description and Supply Chain of H&G and Fillets Most Pacific cod caught in Alaska is processed into frozen H&G product before being exported. Secondary processing occurs mainly in China, and to a lesser extent Japan, Europe, and the United States (Figure 26). Final products are primarily fillets, frozen portions, and value-added products sold in restaurants, grocery stores, and in food service with the largest markets being Europe and the United States (Table 38).
Figure 26. Alaska Pacific Cod Supply Chain (Meat Products Only)
Table 38. Common Pacific Cod Products, Alaska Production, and Recovery Rates, 2014
2014 Production Volume (mt)
2014 Production Value
($thousands)
Recovery Rate Range Average Price/kg
H&G Eastern 87,815 $245,878 56-75% $2.80
H&G Western 25,562 57,705 56-75% 2.26
Fillets, skinless/boneless 17,406 112,363 18-39% 6.46
Roe 5,251 11,682 1-7% 2.22
Other 18,551 41,148 - 2.22
Total Wholesale Production 154,584 $468,776
Total Retained Fed. Harvest 299,128
Notes: Volume in product-weight terms. Due to differences with when data was accessed, value figures do not precisely match other totals quoted in this report. Source: NMFS Catch and Production Reports and Alaska Sea Grant (Crapo, Paust, & Babbit, 1993).
Motherships (Floating Processors)
Alaska Catcher Vessels
Alaska Catcher Processors
Shoreside Processors
Frozen Head and Gut (primary processing)
Frozen Fillets
China, Japan, Europe (Secondary Processors)
U.S. Secondary Processors
Salted Twice-Frozen Fillet Blocks
Portions, Breaded, Other Value-Added
Refresh Markets & Distributors
Restaurants & Grocery Stores
Foreign Consumers Latin America & Europe
Food Service & Quick Serve Restaurants

Alaska Groundfish and Crab Wholesale Market Profiles NOAA/NMFS • 48
Head and Gut While H&G cod are the majority of the first wholesale production (74 percent of total production in 2014 with 114,510 mt valued at $317 million wholesale value), it has the most complex supply chain (Figure 27). Most H&G is further processed in foreign markets, but some also remains in the United States to be processed domestically (Figure 26).
Frozen H&G product provides a raw material to secondary processors which is not contaminated by viscera and blood. Cod are headed and gutted, either onshore or at-sea, and immediately frozen. Frozen H&G product must be thawed, cut, and then re-frozen, which causes fillets to lose some of their quality.
Figure 27. Alaska Pacific Cod H&G Wholesale Production and Exports, 2007-2014
Source: ASMI Alaska Seafood Export Database.
While most frozen H&G product is exported, a portion is distributed to domestic secondary processing facilities (Figure 28). The largest reprocessing market is China, followed by Japan, United States, and Europe. This secondary processing results in primarily frozen fillets and loins, but also includes breaded fish sticks, fillets, and other value added products. Foreign buyers also purchase H&G cod as a raw material for salt cod products, which are popular in Europe and Latin America.
A direct channel for H&G products in the United States are refresh markets, where it is thawed and filleted into portioned products. Refresh markets have increased in popularity in the United States within the last 10 years. Other U.S. processors use H&G cod to produce breaded or coated sticks and portions for sale in grocery stores and food service outlets. Photo Courtesy of ASMI.
$-
$50,000
$100,000
$150,000
$200,000
$250,000
$300,000
$350,000
$400,000
-
20,000
40,000
60,000
80,000
100,000
120,000
140,000
160,000
180,000
2007 2008 2009 2010 2011 2012 2013 2014
Valu
e ($
000s
)
Volu
me
(mt)
Wholesale (in mt) Exports (in mt) Export Value (in $000s)
0 $0

Alaska Groundfish and Crab Wholesale Market Profiles NOAA/NMFS • 49
Figure 28. H&G as Percent of Total Alaska Pacific Cod Exports, 2007-2014
Source: ASMI Alaska Seafood Export Database.
Fillets Cod fisheries in Alaska produced 18,268 mt of fillets in 2014, or about 80 million 8 oz portions. Most Alaska cod fillets are packaged as shatterpacks, consisting of frozen fillet blocks, while individual fillets are separated by plastic sheets, making them easier to separate without need to be thawed.
• IQF (individual quick frozen) fillets and loins are portions that are quickly frozen to preserve freshness.
• Shatterpack fillets are traditionally packed into 45 pound containers and sold to the grocery refresh market.
• Block fillet products are reprocessed into value-added breaded frozen portions.
In most end markets, cod is not differentiated between Pacific cod or Atlantic cod. China imports cod from the United States where it is further processed and re-exported, which is discussed further in the “Key Markets” section. Chinese re-processors produce twice-frozen fillet blocks and breaded frozen portions. This supply of twice frozen blocks competes directly with once frozen cod products produced in Alaska, even though the quality is reported to be lower.37 The competition for cod fillets has reduced the value for cod exports from Alaska, as shown in Figure 29. Most fillets are sold into the domestic market.
In Alaska, cod fillets are reprocessed for both food service and retail as a whitefish product which is easy to thaw and cook from a retail outlet or as a mild seafood dish served at a variety of restaurants including fine dining to quick service.
37 Interview with domestic seafood company wholesale representative.
Pacific cod sold in a refresh market. Photo Courtesy of Garrett Evridge.
85%80% 83%
95% 95% 92% 98% 97%
0%
20%
40%
60%
80%
100%
120%
-
20,000
40,000
60,000
80,000
100,000
120,000
2007 2008 2009 2010 2011 2012 2013 2014
H&G
as P
ct. o
f Tot
al C
od E
xpor
ts
Volu
me
(mt)
Exports (in mt) H&G as Pct. of Exports
0

Alaska Groundfish and Crab Wholesale Market Profiles NOAA/NMFS • 50
Figure 29. First Wholesale and Export Values for Alaska Pacific Cod Fillets, in $Thousands, 2010-2014
Source: ADF&G (COAR) Reports and ASMI Alaska Seafood Export Database.
Key Markets for Pacific Cod In 2014, Alaska Pacific cod H&G exports totaled 100,542 mt, representing 97 percent of total cod exports (Figure 30 and Table 39).38 Frozen H&G exports have been increasing. China is the largest importer of H&G Pacific cod, but most product is reprocessed for export. In 2014, China imported 55,600 mt of cod from the United States. The next largest export markets are Japan, Europe, and Canada.
Figure 30. Total Alaska Pacific Cod Exports, by Volume and Value, 2007-2014
Source: ASMI Export Database.
Pacific cod fillets are primarily consumed in the United States, Canada, and European markets (Table 40). The domestic market, according to McDowell Group estimates, consumed 57 percent of fillets produced in Alaska— or an average of 9,613 mt from 2010-2014. In 2014, Alaska Pacific cod fillets had a first wholesale value of $120.8 million and an export value of $11.4 million, suggesting most product is sold into the domestic market. In the last 5 years, Canada and Europe are the largest foreign markets for once frozen cod fillets, importing 41 percent of exported Alaska cod fillets over the last 5 years (2010-2014).
38 ASMI Export Database.
$-
$50,000
$100,000
$150,000
$200,000
$250,000
$300,000
$350,000
$400,000
-
20,000
40,000
60,000
80,000
100,000
120,000
140,000
160,000
180,000
2007 2008 2009 2010 2011 2012 2013 2014
Valu
e ($
000s
)
Volu
me
(mt)
Wholesale (in mt) Exports (in mt) Export Value (in $000s)
0
$-
$20,000
$40,000
$60,000
$80,000
$100,000
$120,000
$140,000
2010 2011 2012 2013 2014
Valu
e ($
000s
)
Wholesale Value ($000s) Export Value ($000s)
$0
$0

Alaska Groundfish and Crab Wholesale Market Profiles NOAA/NMFS • 51
Table 39. Sales of H&G Alaska Pacific Cod to Key Markets (mt), 2010-2014
Market 2010 2011 2012 2013 2014 Pct. of Total (5-yr. Avg.)
China* 23,547 40,854 45,311 47,116 55,600 40%
Japan* 14,532 18,224 17,087 12,896 17,338 15%
Europe1 17,580 14,884 14,422 8,670 5,968 12%
South Korea* 6,203 5,784 5,472 7,684 5,372 6%
Canada 2,705 2,328 2,482 2,500 2,011 2%
Other 13,038 16,525 12,944 15,108 14,253 14%
Total Exports 77,605 98,599 97,718 93,974 100,542 89% U.S. (Estimated)2 2,711 7,471 21,888 10,409 17,895 11%
Alaska Production 80,316 106,070 119,606 104,383 118,437 * Denotes countries which primarily re-process and/or re-export product to other markets. 1 Does not include Russia, Ukraine, or other minor European markets. 2 Estimated based on annual production less calendar year exports. Note: Data pertains to primary exports only, does not portray product which may be re-exported to other markets. Source: AKFIN, NMFS Trade Data, ASMI Alaska Seafood Export Database, and McDowell Group estimates.
Table 40. Sales of Alaska Pacific Cod Fillets to Key Markets (mt), 2010-2014
Market 2010 2011 2012 2013 2014 Pct. of Total (5-yr. Avg.)
China* 1,539 1,502 4,362 1,104 802 11%
Canada 798 1,326 982 1,240 740 6%
Europe 3,225 1,613 3,831 724 373 12%
Other 3,284 6,049 1,072 470 675 14%
Total Exports 8,846 10,490 10,247 3,539 2,590 43% U.S. (Estimated)2 5,958 5,304 5,593 14,957 16,252 57%
Alaska Production 14,805 15,795 15,841 18,496 18,842 * Denotes countries which primarily re-process and/or re-export product to other markets. 2 Estimated based on annual production less calendar year exports. Note: Data pertains to primary exports only, does not portray product which may be re-exported to other markets. Source: AKFIN, NMFS Trade Data, ASMI Alaska Seafood Export Database, and McDowell Group estimates.
UNITED STATES Not differentiating between Pacific and Atlantic cod, the United States imported 66,421 mt of cod in 2014, valued at $392.5 million (Figure 31 and Table 41). In 2014, fillets accounted for 90 percent of cod imports into the United States, with the remainder divided between H&G and salted. The United States imported $304.1 million of cod fillets in 2014, a 19 percent increase over 2013 (Table 42). According to McDowell Group estimates, the U.S. market bought an estimated 57 percent of Alaska’s cod fillet production from 2010-2014. Seventy-four percent of U.S. cod fillet import volume came from China in 2014. Approximately 15 percent of Alaska H&G production went to the domestic market to be reprocessed.
Photo Courtesy of ASMI.

Alaska Groundfish and Crab Wholesale Market Profiles NOAA/NMFS • 52
Table 41. Total Cod Imports into U.S. Market, Volume and Value, 2010-2014
2010 2011 2012 2013 2014 Pct. Change YOY
Volume (mt) 48,566 52,269 49,755 59,850 66,421 10%
Value ($millions) $263.3 $327.1 $327.6 $341.5 $392.5 13%
Source: NMFS trade data.
Cod is a popular menu item in the U.S. market. IQF fillets and shatterpack fillets of Pacific cod are used by fine restaurants, food service, fast food restaurants, and retail fish markets. Fillet blocks are utilized when the customer needs uniformity, such as in fish sandwiches or in “fish and chips” restaurants. Some grocery retailers utilize fillet block forms in the frozen aisle as value-added products, as well as at the retail fish counter, where fillets are thawed and displayed in a refreshed format.
Figure 31. U.S. Imports of Cod Fillets from Major Trading Partners (mt), 2012-2014
Source: Global Trade Atlas.
Table 42. Total Imports and Price/kg for Cod Fillets into the U.S. Market, 2012-2014 2012 2013 2014 Trading Partner
Value ($thousands)
Price/kg Value ($thousands)
Price/kg Value ($thousands)
Price/kg
China $174,951 $6.06 $165,845 $4.99 $226,315 $5.25
Russia 25,333 7.19 35,239 6.77 29,780 6.79
Iceland 31,230 7.50 29,135 5.90 26,715 7.15
Thailand 7,485 7.11 9,632 6.30 8,065 6.56
Norway 3,020 6.82 5,425 5.97 6,431 5.77
Other 11,690 6.79 10,815 5.51 6,865 6.84
Total $253,710 $6.38 $256,092 $5.36 $304,171 $5.58
Source: Global Trade Atlas.
2012 2013 2014Other 3,217 4,401 3,348Iceland 4,166 4,937 3,735Russia 3,522 5,202 4,383China 28,876 33,217 43,080
-
10,000
20,000
30,000
40,000
50,000
60,000
Volu
me
(mt)
0

Alaska Groundfish and Crab Wholesale Market Profiles NOAA/NMFS • 53
CHINA China serves as a secondary processor for fillets by augmenting fillets with value-added product forms and re-exporting to markets such as Europe and the United States. Over the last 5 years, China has imported 40 percent of Alaska’s cod, and trade with China increased 57 percent. China imports H&G cod (both Pacific and Atlantic) as raw material for reprocessing. The primary products from China are frozen fillet blocks, frozen portions, and value-added products such as battered or breaded portions. Cod fillet blocks compete with Alaska produced cod fillet blocks in the United States and with European cod fillet blocks in the EU. There are other overseas markets that are also destinations for Chinese reprocessed cod products such as Brazil, which increased imports of cod fillets from China by 141 percent from 2013 to 2014 (Table 43).39
Table 43. Primary Export Markets for Chinese Twice-Frozen Cod Fillets (mt), 2012-2014
2012 2013 2014 Pct. of Total Exports
European Market 57,588 68,399 79,976 58%
U.S. 33,093 38,899 44,756 32%
Canada 3,237 4,568 4,918 4%
Brazil 1,386 1,649 3,987 3%
Other 3,904 4,777 4,982 4%
Total 99,208 118,292 138,619 100%
Note: Figures may not sum due to rounding. Source: Global Trade Atlas.
JAPAN AND SOUTH KOREA Japan is a key market for Alaska H&G cod. In 2014, 17,338 mt of Alaska Pacific cod products was exported to Japan and 5,372 mt was exported to South Korea. Japanese consumers typically consume cod in the wintertime, often used in soups, and traditionally prefer it in a “kirimi” cut. South Korean consumers buy H&G and also whole fish, consuming the entire fish. Cod is a mainstay on Korean restaurant menus and a popular item cooked for home consumption. However, a significant volume of H&G cod product shipped to South Korea is re-exported for destinations such as the United States or Europe.
Table 44. Alaska Pacific Cod Export Volume to Major Asian Markets (mt), 2010-2014 Export Market 2010 2011 2012 2013 2014
Japan 17,068 22,158 17,616 13,176 17,572 Fillet 1,836 3,911 464 67 46 H&G 14,532 18,224 17,087 12,896 17,338 Other 700 23 65 213 187
South Korea 7,244 7,168 6,533 7,988 5,535 Fillet 956 1,204 84 29 126 H&G 6,203 5,784 5,472 7,684 5,372 Other 86 179 977 275 36
Grand Total 24,313 29,326 24,149 21,164 23,106 Pct. of Total Cod Exports 30% 28% 23% 22% 22%
Source: ASMI Alaska Seafood Export Database.
39 Global Trade Atlas.

Alaska Groundfish and Crab Wholesale Market Profiles NOAA/NMFS • 54
EUROPE Over the last 5 years (2010-2014), approximately 12 percent of Pacific cod exports from Alaska have been directly exported to the European market. Europe is a more important end-market than suggested by this modest percentage, as Alaska Pacific cod is often routed through China or South Korea before being sold into Europe (Table 45). The EU protects its domestic cod producers by maintaining higher duties on imported cod fillets, whereas frozen H&G cod can generally be imported into the EU with no tariff. Therefore, Alaska exports relatively little fillet production to the EU because of the 7.5 percent tariff. According to domestic seafood industry contacts, frozen cod fillets cut from Pacific cod in China do not incur the same 7.5 percent EU tariff as similar product exported from the United States. This modification in the supply chain may explain the increase in Alaska’s H&G production and the increase in EU cod fillet imports from China in recent years.40
Table 45. European Imports of Cod Fillets from Major Producers (mt), 2012-2014
Exporter 2012 2013 2014 Pct. of Total (3-yr. Avg.)
China* 45,414 55,565 68,533 69%
U.S. (Alaska) 3,445 690 369 2%
Russia 10,871 25,884 36,572 30%
Total 59,730 82,139 105,474 -
*Denotes re-exporter. Note: Totals may not sum due to rounding. Source: Global Trade Atlas and ASMI Alaska Seafood Export Database.
When Atlantic cod stocks began to decline, Pacific cod was used as a substitute. In the last few years, the Atlantic cod supply has increased, leading to more global cod supply, which has reduced cod prices in Europe.
In the last 5 years (2010-2014), 27 percent of cod fillets were exported to Europe. Frozen seafood in Europe tends to be a more popular protein than in the United States.41 In food service, the common packaging are 10 kg bags of frozen 500 g (about 1.1 lb) portions.
Northern Europe and Southern Europe are two distinct end markets for cod products. In the north, the primary end markets are Germany, the UK, and Norway. In Southern Europe, Spain and Portugal consume traditional dishes that incorporate salted cod.
Global Production and Competing Supply There are two main species of cod, Pacific cod (Gadus macrocephalus) and Atlantic cod (gadus morhua). Both are found in the northern hemispheres of the Atlantic and Pacific Oceans. As a gadid whitefish, they are considered almost identical substitutes for each other. In 2014 it is estimated that 482,000 mt of Pacific cod and 1,334,000 mt of Atlantic cod were harvested globally (Table 46). Some of the largest Atlantic cod stocks are in the Barents Sea.
40 Interview with domestic seafood company wholesale representative. 41 Interview with domestic seafood company wholesale representative.
Salt cod production in Europe. Wikipedia, license CC-BY-SA 3.0.

Alaska Groundfish and Crab Wholesale Market Profiles NOAA/NMFS • 55
The U.S. fishery for Atlantic cod is very small and Pacific cod from the North Pacific (primarily Alaska waters) accounts for almost all U.S cod harvest. Alaska accounted for 68 percent of global Pacific cod harvests over the last 3 years (2012-2014), with an average of 327,000 metric tons annually. It contributed 19 percent to the global cod harvest over the same 3 year period.
Table 46. Major Cod Producing Nations (Thousands mt), 2012-2014 2012 2013 2014
Atlantic Cod Supply 1,107 1,343 1,334
Norway 358 472 465
Russia 334 435 432
Iceland 205 236 240
EU 149 132 130
Other 61 68 67
Pacific Cod Supply 470 470 482
U.S. 331 320 330
Russia 77 78 80
Japan 50 60 60
Korea 12 12 12
Total Cod Supply 1,577 1,813 1,816
Source: Groundfish Forum.
In addition to Alaska, Russia and Japan are the next largest producers of Pacific cod products (Figure 32). Japan was the first nation to commercially fish for Pacific cod in Alaska waters and it still harvests Pacific cod, albeit in much smaller quantities than it did decades ago. The two largest suppliers of Pacific cod are the United States and Russia. There has been downward pressure on market prices for cod due to increased quotas in both the United States and Russia. More U.S. Pacific cod is processed in China as prices decrease, due to lower processing costs abroad.
Figure 32. Global Supply of Pacific Cod (mt) 1950-2013
Source: FAO.
-
50,000
100,000
150,000
200,000
250,000
300,000
350,000
400,000
450,000
500,000
1950
1952
1954
1956
1958
1960
1962
1964
1966
1968
1970
1972
1974
1976
1978
1980
1982
1984
1986
1988
1990
1992
1994
1996
1998
2000
2002
2004
2006
2008
2010
2012
Volu
me
(mt)
U.S. Russia Japan Other
0

Alaska Groundfish and Crab Wholesale Market Profiles NOAA/NMFS • 56
Atlantic Cod Fishing for Atlantic cod peaked in the mid-1970s, with global harvests near 3 million mt, nearly double the 2014 level (Figure 33). Stocks were overfished along the Atlantic coasts and served as case studies for collapsed fisheries. In recent years, the supply of Atlantic cod has dwindled with a reduction in harvests due to stocks being rebuilt to sustainable levels, while the demand in the EU for cod has increased. An easy substitute, Pacific cod began to be exported to fulfill demand for Atlantic cod. Pollock, the largest single-species fishery in the world, has also been a substitute for Atlantic cod. As shown in Figure 34, shatterpack cod from Alaska follows a similar price trend of Atlantic cod.
Figure 33. Global Supply of Pacific and Atlantic Cod (mt) 1950-2013
Source: FAO.
Figure 34. Comparison of Shatterpack Cod Value between Alaska and Competitors, 2005-2014
Source: UBComtell.
$2.00
$2.50
$3.00
$3.50
$4.00
$4.50
$5.00
2014201320122011201020092008200720062005
Pric
e pe
r Pou
nd ($
)
Alaska Shatterpack Cod, 8-16 oz Norway/Russia Shatterpack Cod, 8-16 oz
0
500,000
1,000,000
1,500,000
2,000,000
2,500,000
3,000,000
1950
1952
1954
1956
1958
1960
1962
1964
1966
1968
1970
1972
1974
1976
1978
1980
1982
1984
1986
1988
1990
1992
1994
1996
1998
2000
2002
2004
2006
2008
2010
2012
Volu
me
(mt)
Atlantic Cod (in mt) Pacific Cod (in mt)

Alaska Groundfish and Crab Wholesale Market Profiles NOAA/NMFS • 57
Wholesale Market Profile for Yellowfin Sole
Yellowfin sole (Limanda aspera) is one of the most abundant flatfish in the eastern Bering Sea. Alaska is responsible for the majority of the global catch. Overall, the species represented 47 percent of the first wholesale value in 2014 of all Alaska flatfish, which also includes rock sole, Arrowtooth flounder, flathead sole, turbot, and rex sole. Most of Alaska’s yellowfin sole production is exported to China. This market profile summarizes production and markets for yellowfin sole fisheries in Alaska.
Table 47. Summary Profile of Yellowfin Sole Wholesale Production and Markets, 2014
Value and Volume Key Products H&G Whole Round Other
First Wholesale Production (mt) 93,794 Pct. of Value 69% 12% 19%
Pct. of Global Flatfish Harvest (2013) 14% Key Markets China South Korea Other
First Wholesale Value ($millions) $97.8 Pct. of 1st Sales 86% 13% 1%
Pct. of Alaska Groundfish Value 4.0% YOY Change -1% 6% 14%
Pct. of Flatfish Volume 54% Competing Species: Other flatfish, tilapia, whitefish
Fishery Summary Yellowfin sole is a demersal species typically targeted by vessels using trawl gear with most taken between March through May and August through October.42 The largest concentration of yellowfin sole is in the Eastern Bering Sea. The Gulf of Alaska (GOA) also yields a sizeable flatfish harvest but the species is managed as part of a broader shallow-water flatfish complex, also including rock sole, Alaska plaice, and other small shallow-water flatfish. Flatfish species are primarily targeted by the Amendment 80 catcher processer trawl fleet, but also caught by the American Fisheries Act (AFA) trawl catcher processors, AFA trawl catcher vessels, and non-AFA trawl vessels operating in Alaska. Yellowfin sole are highly migratory, spending the winter near shelf margins and migrating to inner shelf areas in the spring to spawn and feed.
Sole were harvested by foreign fleets until the Magnuson-Stevens Act in 1977. U.S. joint venture fisheries began in 1980 and now dominate global landings of yellowfin sole. Alaska fishing efforts have increased since the 1990s and early 2000s. Since 2008, the targeted fishery has operated as a catch share fishery, with participants operating as cooperatives. The new cooperative structure allows companies to operate more efficiently, maximize product retention, and minimize bycatch. Yellowfin sole are caught primarily by trawl catcher-processors and almost all are processed at-sea in the Bering Sea Aleutian Islands (BSAI) region.
42 Gibson, Nash, Geffen, and Van der Veer (2014)
Photo from NMFS (AFSC).

Alaska Groundfish and Crab Wholesale Market Profiles NOAA/NMFS • 58
Figure 35. Yellowfin Sole Harvest Volume in Alaska (mt) 1983-2014
Source: NMFS (OST).
In 2014, the BSAI total allowable catch (TAC) was 184,000 mt and total harvests (including CDQ) were 152,161 mt, equivalent to 85 percent of the TAC (Figure 35 and Table 48). The GOA shallow-water flatfish complex, which includes yellowfin sole, rarely approaches its TAC. In 2014, the GOA shallow-water flatfish harvest of 4,748 mt filled just 14 percent of the 33,679 mt TAC.
Table 48. Yellowfin Sole Harvest Volume in Federal Fisheries (mt), 2010-2014 2010 2011 2012 2013 2014
Gulf of Alaska Shallow Water Flatfish Complex* 5,410 3,974 4,022 5,515 4,748
Bering Sea and Aleutian Islands 113,245 146,418 142,132 158,781 152,161
BSAI TAC 219,000 196,000 202,000 198,000 184,000
Total Harvest 118,655 150,392 146,154 164,296 156,078
*Due to confidentiality, exact harvest rates for yellowfin sole in GOA are not available. They are managed under the shallow water flatfish Complex, which encompasses several flatfish. This estimate will be higher than actual GOA yellowfin sole harvests. Source: NMFS Alaska Region Catch Reports.
Product Description and Supply Chain Yellowfin sole average 42 cm long (approximately 16.5 in.) and weigh 750 g (1.65 lb). The primary products produced in Alaska are frozen headed and gutted (H&G) (83 percent of production volume) and frozen whole fish (16 percent). Yellowfin sole is a white fish with delicate, sweet, and mild-tasting flesh. The most common H&G size is approximately 130-450 g and most whole groundfish are 200-700 g.43 Almost all yellowfin sole are exported to China where they are processed into fillets. These twice-frozen fillets are primarily sold as frozen skinless, boneless 2-4 oz fillets.44 Sole are commonly served poached, sautéed, or steamed. The supply chain for yellowfin sole begins with catcher processors in Alaska that export frozen H&G product to secondary processors in China. Secondary processors transform the fish into its frozen skinless, boneless fillets, primarily for re-export. Twice-frozen fillets are then sold to distributors who sell fish to retail and foodservice operators in Europe, Japan, and the United States.
43 (Alaska Seafood Marketing Institute, 2012) 44 (Pacific Seafood, 2014b)
0
20,000
40,000
60,000
80,000
100,000
120,000
140,000
160,000
1983
1984
1986
1987
1988
1989
1990
1991
1992
1993
1994
1995
1996
1997
1998
1999
2000
2001
2002
2003
2004
2005
2006
2007
2008
2009
2010
2011
2012
2013
2014
Harv
est V
olum
e (m
t)

Alaska Groundfish and Crab Wholesale Market Profiles NOAA/NMFS • 59
Production Volume and Value Alaska produced 93,794 mt of yellowfin sole products in 2014 worth $97.8 million (Figure 36 and Table 49). The species accounted for 9.6 percent of total groundfish production volume and 4.2 percent of the total first wholesale value for groundfish species in 2014. Yellowfin sole are primarily harvested by the Amendment 80 fleet of catcher processors, which consists of 19 vessels. This fleet also targets other flatfish and rockfish species. From 2010 to 2014, flatfish accounted for the majority (60 percent) of Amendment 80 fleet harvests.
The first wholesale value of yellowfin sole has been pushed lower due to an increase in whitefish competition.
Yellowfin sole prices are highly dependent on when they are harvested. Fish caught in the winter, prior to spawning, command higher prices. Flesh quality declines significantly during and after spawning, resulting in lower prices.
Figure 36. First Wholesale Volume and Value of Alaska Yellowfin Sole, 2010-2014
Table 49. First Wholesale Value of Alaska Yellowfin Sole, in $Millions 2010 2011 2012 2013 2014
$76.6 $125.0 $122.4 $121.7 $97.8
Source: AKFIN.
Photo Courtesy of O’Hara Corporation.
$800
$900
$1,000
$1,100
$1,200
$1,300
$1,400
$1,500
$1,600
$1,700
-
10,000
20,000
30,000
40,000
50,000
60,000
70,000
80,000
90,000
2010 2011 2012 2013 2014
Valu
e/m
t
Volu
me
(mt)
H&G Other Whole Fish Value/mt
0

Alaska Groundfish and Crab Wholesale Market Profiles NOAA/NMFS • 60
Wholesale Market Profile for Rock Sole
Rock sole (Lepidopsetta polyxystra) is the second most abundant flatfish by wholesale volume (after yellowfin sole) from the Gulf of Alaska (GOA) and the Bering Sea. Alaska is responsible for the majority of the global rock sole harvest. In 2014, rock sole accounted for 18 percent of the total first wholesale volume and 19 percent of wholesale value for Alaska flatfish. Most of Alaska’s rock sole production is exported to China, Japan, or South Korea as headed and gutted (H&G) or whole fish products. Rock sole generate a higher unit value per metric ton than yellowfin sole due to markets for their roe. This market profile summarizes production and markets for rock sole fisheries in Alaska.
Table 50. Summary Profile of Rock Sole Wholesale Production and Markets, 2014
Value and Volume Key Products H&G H&G with Roe Whole Round
First Wholesale Production (mt) 30,808 Pct. of Value 51% 34% 11%
Pct. of Global Flatfish Harvest (2013) 6% Key Markets China South Korea Other
First Wholesale Value ($millions) $39.7 Pct. of 1st Sales 85% 16% 1%
Pct. of Alaska Groundfish Value 1.6% YOY Change -13% 36% -70%
Pct. Flatfish Volume 18% Competing species: Other flatfish, tilapia, whitefish
Fishery Summary Rock sole refers to two demersal species, northern rock sole and southern rock sole, which are not differentiated commercially.45 Most commonly targeted by vessels using trawl gear, the majority of rock sole are taken in February-March when females are bearing eggs. The largest concentration is in the Eastern Bering Sea, but the GOA also yields a sizeable flatfish harvest but the species is managed as part of a broader shallow-water flatfish complex, also including yellowfin sole, Alaska plaice, and other small shallow-water flatfish. Flatfish species are primarily targeted by the Amendment 80 catcher processer trawl fleet, but also caught by American Fisheries Act (AFA) trawl catcher processors, AFA trawl catcher vessels, and non-AFA trawl vessels operating in Alaska. Rock sole are relatively sedentary, compared to other sole.
Sole were harvested by foreign fleets until the Magnuson-Stevens Act (MSA) in 1977. U.S. joint venture fisheries began in 1980 and now dominate global landings of rock sole. Alaska fishing efforts have increased since the 1990s and early 2000s. Since 2008, the targeted fishery has operated as a catch share fishery (Amendment 80), with participants operating as cooperatives. The new cooperative structure allows companies to operate more efficiently, maximize product retention, and minimize bycatch. Rock sole are caught primarily by trawl catcher-processors and almost all are processed at-sea in the Bering Sea Aleutian Islands (BSAI) region. There is a small amount of rock sole caught by the lower 48, but the majority of the catch is Alaska.
45 Gibson, Nash, Geffen, and Van der Veer (2014)
Photo from NMFS AFSC.

Alaska Groundfish and Crab Wholesale Market Profiles NOAA/NMFS • 61
Figure 37. Rock Sole Harvest Volume in Alaska (mt), 1985-2014
Source: NMFS (OST).
The 2014 total allowable catch (TAC) in the BSAI was 85,000 mt and total harvests were 49,791 mt (Figure 37), representing 61 percent of the TAC (Table 51). BSAI rock sole are targeted for a short period right before they spawn, and then the fleet shifts to targeting other species such as yellowfin sole and Greenland turbot. A relatively small amount of rock sole are caught as part of the Gulf of Alaska shallow water flatfish complex.
Table 51. Rock Sole Harvest Volume in Federal Fisheries (mt), 2010-2014 2010 2011 2012 2013 2014
Gulf of Alaska 3,260 3,063 2,816 4,014 3,390
Bering Sea and Aleutian Islands 50,160 56,105 71,002 56,623 49,791
Total Harvest 53,420 59,168 73,818 60,637 53,181
Source: NMFS Alaska Region Catch Reports and NMFS (OST).
Product Description and Supply Chain Rock sole average about 61 cm in length (approximately 24 in.) and weigh between 2 to 4 lb (900-1,800 g).46 The primary products produced in Alaska are frozen H&G (51 percent of production volume), frozen H&G with roe (34 percent), and whole fish (11 percent). The general H&G size is approximately 500-2,500 grams and whole round is 750-3,500 g.47
Rock sole are primarily caught by catcher processors in Alaska targeting roe-bearing females. Most male rock sole are sold to China and the females with eggs are exported to Japan. Almost all H&G and whole round rock sole is processed in China into fillets that are re-exported into the
46 (Washington Department of Fish and Wildlife, 2015) 47 (Alaska Seafood Marketing Institute, 2012; Pacific Seafood, 2014b)
Photo Courtesy of ASMI.
0
10,000
20,000
30,000
40,000
50,000
60,000
70,000
80,000
1985
1986
1987
1988
1989
1990
1991
1992
1993
1994
1995
1996
1997
1998
1999
2000
2001
2002
2003
2004
2005
2006
2007
2008
2009
2010
2011
2012
2013
2014
Harv
est V
olum
e (m
t)

Alaska Groundfish and Crab Wholesale Market Profiles NOAA/NMFS • 62
United States. It is primarily sold as frozen skinless, boneless 2-5 oz fillets. It is also sold as H&G, roe-in to Japan, where it is a specialty item that is grilled whole. Rock sole is a delicate and mild-tasting whitefish. It is commonly served poached, sautéed, or steamed.
The short duration, high value roe fishery is unique to the flatfish species. During the spawning months, fish with roe intact are hand processed with roe-in, a more expensive processing technique than standard H&G.
Figure 38. Alaska Rock Sole Supply Chain
Production Volume and Value Alaska produced 30,808 mt of rock sole products in 2014 worth $39.7 million (Table 52). The species accounted for 3.2 percent of total groundfish production volume and 1.6 percent of groundfish value in 2014. Rock sole are primarily harvested by the Amendment 80 fleet of catcher processors, which consists of 18 vessels. This fleet also targets other flatfish (sole/flounder), rockfish, and Atka mackerel, and is responsible for most Alaska production of these species. In 2014, flatfish accounted for the majority of these species combined first wholesale value (59 percent), while rockfish and Atka mackerel accounted for 23 and 18 percent, respectively.
Table 52. Alaska Rock Sole Production Volume and Value, 2014 Volume
(mt) Value
($thousands) Recovery
Range Price/kg Pct. of Total Volume
Pct. of Total Value
H&G 19,799 $20,463 60-79% $1.03 64% 51%
H&G, roe-in 6,736 13,434 60-79% 1.99 22% 34%
Whole fish 3,729 4,530 80-94% 1.21 12% 11%
Other* 544 1,309 22-92% 2.41 2% 3%
Total 30,808 $39,736 - $1.29 100% 100%
*Other category includes fillets, which are hand processed. While only 2 percent of total value, they command the highest price per pound. Source: ADF&G (COAR).
Rock sole is similar to other flatfish, except for the roe-in market. In 2014, a third of the total rock sole wholesale value came from H&G roe-in. H&G product with roe was worth nearly twice as much, on a per
Alaska Catcher Processors
Frozen H&G
China (reprocessing)
Twice Frozen Fillets
Frozen H&G, roe-in
Japan Retail Outlets & Restaurants
Whole Fish
China (reprocessing)

Alaska Groundfish and Crab Wholesale Market Profiles NOAA/NMFS • 63
pound basis, as regular H&G product. H&G, H&G roe-in, and whole fish made up 98 percent of the total rock sole production volume in 2014 (Figure 39).
Figure 39. First Wholesale Volume and Value for Alaska Rock Sole, 2010-2014
Rock Sole Wholesale Price per Metric Ton 2010 2011 2012 2013 2014
H&G $1,241 $1,530 $1,769 $1,200 $1,040
H&G, roe-in 1,859 2,311 2,818 1,884 1,985
Other 1,179 1,656 1,551 2,226* 1,366
Total Avg. $/mt $1,368 $1,705 $1,990 $1,333 $1,290
*Indicates unusually high production of fillets, which are hand-processed. Source: AKFIN.
Key Markets for Alaska Sole Species Based on U.S. export statistics, roughly 85 percent of Alaska’s yellowfin and rock sole is exported to China (Tables 53 and 54). The balance flows to South Korea, or remains in the U.S. market. Whole or H&G yellowfin sole is exported to re-processors in China where it is converted into individual frozen skinless, boneless fillets. The majority are re-exported back into North America and Europe for use in food service and for retail. A portion of yellowfin sole is sold as kirimi (slices of fish), which is popular in Japanese cafeterias.48 Korea tends to purchase smaller fish, which tend to be cheaper per kilogram.
Most rock sole is combined with other flatfish which is exported to China and reprocessed as frozen fillets and other products. The highest value product, H&G with roe intact, is consumed in Japan.
48 Interview with domestic seafood company representative.
$-
$10
$20
$30
$40
$50
$60
$70
$80
$90
-
5,000
10,000
15,000
20,000
25,000
30,000
35,000
40,000
45,000
2010 2011 2012 2013 2014
Valu
e ($
mill
ions
)
Volu
me
(mt)
Other Whole Fish H&G with Roe H&G Wholesale Value
Yellowfin sole kirimi. Photo Courtesy of Everfish.
0 $0

Alaska Groundfish and Crab Wholesale Market Profiles NOAA/NMFS • 64
Table 53. U.S. Yellowfin Sole Exports by Major Country (mt), 2013-2014 2013 2014 YOY Pct.
Change in Volume
Pct. Share of Exports Volume
(mt) Value
($thousands) Volume
(mt) Value
($thousands) China 62,680 $89,057 62,095 $86,134 -1% 86%
South Korea 9,381 12,775 10,017 12,264 7% 14%
Other 28 35 32 161 11% 1%
Total 72,089 $101,867 72,143 $98,559 <1 % 100%
Source: NMFS Foreign Trade data.
Table 54. U.S. Rock Sole Exports by Major Country (mt), 2013-2014 2013 2014 YOY Pct.
Change in Volume
Pct. Share of Exports Volume
(mt) Value
($thousands) Volume
(mt) Value
($thousands) China 18,989 $31,686 16,557 $26,336 -13% 85%
Japan 1,947 3,495 2,649 4,463 36% 14%
South Korea 503 907 149 254 -70% 1%
Other 256 584 136 295 -47% 1%
Total 21,695 $36,671 19,491 $31,348 -10% 100%
Source: NMFS Foreign Trade data.
China China is responsible for reprocessing most Alaska-caught yellowfin and rock sole, which is processed with other flatfish into frozen portioned fillets. Approximately 80 percent of all China’s flatfish exports go to Europe, Japan, and the United States (Table 55). As China’s economy grows, an increasing number of whole round sole remain in the domestic market. Both yellowfin and rock sole require hand processing, which is labor-intensive. Due to lower labor costs, much of the flatfish catch from Alaska is processed in China.
Table 55. China Flatfish Exports, by Value and Volume, 2012-2014 2012 2013 2014 Pct. Market Share (3
yr. avg.) Value ($millions)
Volume (mt)
Value ($millions)
Volume (mt)
Value ($millions)
Volume (mt)
Europe $97.9 20,140 $87.0 19,595 $99.1 24,939 29%
Japan 99.0 18,416 106.1 19,344 106.2 20,577 26%
U.S. 88.1 17,363 95.5 18,852 81.9 17,139 24%
Taiwan 5.1 289 19.9 984 36.2 2,197 2%
Canada 24.5 4,626 26.0 4,844 31.5 5,947 7%
Other 27.5 7,289 34.1 9,452 39.3 11,896 13%
Total $342.2 68,123 $368.7 73,071 $394.2 82,695 100%
Source: Global Trade Atlas.
Japan Japan imports 4 percent of Alaska’s frozen H&G rock sole, primarily females with roe intact. They also import reprocessed rock sole roe and kirimi from China. H&G fish are commonly grilled with the roe inside as a delicacy. According to industry experts, Japanese demand has decreased for this specialty product, resulting in lower prices. From 2013 to 2014, export volume from the United States to Japan increased by 36 percent, but the price per kilogram decreased by 6 percent.
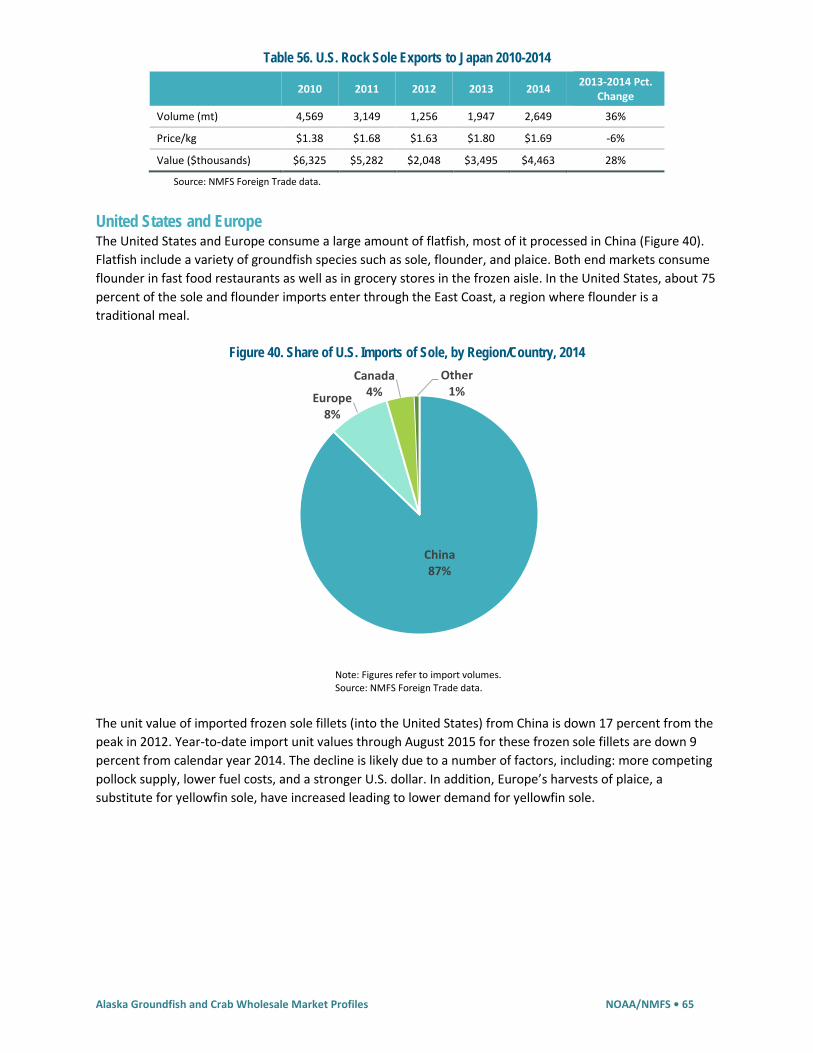
Alaska Groundfish and Crab Wholesale Market Profiles NOAA/NMFS • 65
Table 56. U.S. Rock Sole Exports to Japan 2010-2014
2010 2011 2012 2013 2014 2013-2014 Pct. Change
Volume (mt) 4,569 3,149 1,256 1,947 2,649 36%
Price/kg $1.38 $1.68 $1.63 $1.80 $1.69 -6%
Value ($thousands) $6,325 $5,282 $2,048 $3,495 $4,463 28%
Source: NMFS Foreign Trade data.
United States and Europe The United States and Europe consume a large amount of flatfish, most of it processed in China (Figure 40). Flatfish include a variety of groundfish species such as sole, flounder, and plaice. Both end markets consume flounder in fast food restaurants as well as in grocery stores in the frozen aisle. In the United States, about 75 percent of the sole and flounder imports enter through the East Coast, a region where flounder is a traditional meal.
Figure 40. Share of U.S. Imports of Sole, by Region/Country, 2014
Note: Figures refer to import volumes. Source: NMFS Foreign Trade data.
The unit value of imported frozen sole fillets (into the United States) from China is down 17 percent from the peak in 2012. Year-to-date import unit values through August 2015 for these frozen sole fillets are down 9 percent from calendar year 2014. The decline is likely due to a number of factors, including: more competing pollock supply, lower fuel costs, and a stronger U.S. dollar. In addition, Europe’s harvests of plaice, a substitute for yellowfin sole, have increased leading to lower demand for yellowfin sole.
China87%
Europe8%
Canada4%
Other1%

Alaska Groundfish and Crab Wholesale Market Profiles NOAA/NMFS • 66
Figure 41. Cost/Value Added to Sole by Chinese Secondary Processors, 2007-2015
Source: NMFS Foreign Trade data, AKFIN, and McDowell Group estimates.
Prices of frozen sole fillets imported by the United States from China generally track the value/mt of frozen Alaska H&G sole. However, the price gap between primary and finished product has increased over the past decade supporting industry's claims of increasing secondary processing costs in China (Figure 41). The difference between the first wholesale value/mt of Alaska H&G sole and the value/mt of imported sole fillets from China increased from $2,565/mt in 2006 to $3,289/mt in 2014. These data suggest that although import prices for frozen sole fillets were generally flat over the last decade, the percentage of value retained by Alaska producers declined - particularly in recent years.
Other Markets South Korea consumes some yellowfin sole domestically. The country is the end market for lower quality yellowfin that have already spawned. Koreans also highly value the whole fish appearance; marks and flaws in the gills and eyes detract from value in this market. A substantial portion of the end market for whole fish is Korea.
Brazil was a growing market until it recently banned fish imports with water-retention preservatives used to improve the quality of the flesh, which includes most twice-frozen yellowfin sole from China.49
49 Interview with domestic seafood producers representative.
$2,000
$2,200
$2,400
$2,600
$2,800
$3,000
$3,200
$3,400
$3,600
$0
$500
$1,000
$1,500
$2,000
$2,500
$3,000
$3,500
$4,000
$4,500
$5,000
2006 2007 2008 2009 2010 2011 2012 2013 2014 2015
Diffe
renc
e in
Val
ue p
er m
t
Aver
age
Valu
e pe
r mt
Value/mt of U.S.Imports ofFrozen Sole fromChina (MostlyFillets)
First WholesaleValue/mt ofH&G Alaska Sole
Value/mtDifference ofSole Imports andFirst Wholesaleof H&G AlaskaSole"

Alaska Groundfish and Crab Wholesale Market Profiles NOAA/NMFS • 67
Global Production and Competing Supply Both yellowfin and rock sole are primarily processed at-sea in H&G format destined for fillet processing in China. In the last 5 years, Alaska’s first wholesale volume for flatfish is approximately 50 percent yellowfin sole, 20 percent rock sole, and 30 percent other species combined (Figure 42). The majority of the flatfish are caught by the Amendment 80 fleet, which targets schools of flatfish, depending on seasons. Yellowfin sole are targeted until they spawn, from winter until early spring. Rock sole are targeted during late winter-early spring, just before they spawn.
Figure 42. Composition of Alaska Flatfish Production, by Species, by First Wholesale Volume, 2010-2014
Source: AKFIN.
In terms of contributions to the global flatfish supply, Alaska yellowfin sole was about 14 percent of total flatfish supply volume and rock sole was 6 percent (Figure 43). Alaska’s contribution to global production of flatfish has been increasing since the mid-1980s. Alaska flatfish continue to compete with species such as European plaice and dabs. Global flatfish supply has remained fairly constant over the past 4 decades, but the U.S. contribution increased from 10 percent in 1977 to 48 percent in 2013 (Figure 44). Most Alaska sole and flounder ends up in either the United States or Europe. The U.S. end market allows for multiple species to be labeled as “flounder.” However, Europe requires species to be labeled with the Latin name, which reduces the amount of sole sold as flounder.
Yellowfin Sole53%
Rock Sole18%
Arrowtooth Flounder
13%
Flathead Sole5%
Alaska Plaice5%
Other6%

Alaska Groundfish and Crab Wholesale Market Profiles NOAA/NMFS • 68
Figure 43. Average Composition of Global Production of Flatfish, by Species, by Volume, 2010-2013
Source: FAO Stats.
Figure 44. Global Flatfish Supply and Alaska Harvest of Yellowfin and Rock Sole (mt), 1975-2013
Note: Figures include all flatfish globally. Source: FAO Stats and NMFS (OST).
-
50,000
100,000
150,000
200,000
250,000
-
100,000
200,000
300,000
400,000
500,000
600,000
700,000
800,000
900,000
1,000,000
1975
1977
1979
1981
1983
1985
1987
1989
1991
1993
1995
1997
1999
2001
2003
2005
2007
2009
2011
2013
Alas
ka R
ock
and
Yello
wfin
Sol
e Su
pply
(mt)
Glo
bal S
uppl
y of
Fla
tfis
h (m
t)
Global Flatfish Alaska Rock Sole Alaska Yellowfin Sole
Yellowfin Sole14% Greenland
Turbot12%
European Plaice10%
Rock Sole6%Arrowtooth
Flounder4%
Flatfishes (other or not
specified)54%
0 0

Alaska Groundfish and Crab Wholesale Market Profiles NOAA/NMFS • 69
Wholesale Market Profile for Atka Mackerel
Atka mackerel production was valued at $63.3 million in 2014, accounting for 2.6 percent of the first wholesale value of all Alaska groundfish. Production volume was 35 percent lower than the previous 4 year average in 2014, but 2014 production value trailed the average by only 4 percent due to higher prices. Virtually all of Alaska’s Atka mackerel production is exported to Japan, China, or South Korea as a frozen headed and gutted (H&G) product. Alaska produced 18 percent of global Atka mackerel harvests in 2013. This market profile summarizes production and markets for Atka mackerel fisheries in Alaska.
Table 57. Summary Profile of Atka Mackerel Wholesale Production and Markets, 2014
Value and Volume Key Products H&G Other
First Wholesale Production (mt) 20,900 Pct. of Value 93% 7%
Pct. of Global Harvest (2013) 18% Key Markets Japan China Korea
First Wholesale Value ($millions) $63.3 Pct. of Final Sales 65% 19% 14%
Pct. Change in Value from Prior 4-yr Avg. -4.0% YOY Change 62% 46% 25%
Pct. of Alaska Groundfish Value 2.6% Competing Species: Okhotsk Atka mackerel
Atka mackerel is a key species for Alaska’s Amendment 80 fleet, which also targets high volume flatfish (sole/flounder) and rockfish (including Pacific ocean perch). Atka mackerel accounted for 18 percent of the combined first wholesale value of these three target species in 2014.
Fishery Summary Atka mackerel (Pleurogrammus monopterygius) is a semi-demersal species most commonly targeted by Amendment 80 trawl catcher processors around the Aleutian Islands. Fish are also caught as a sideboard species by AFA trawl catcher processors, AFA trawl catcher vessels, and other trawl vessels operating in Alaska.
Adult fish occur in large localized aggregations at depths less than 200 m over rough, uneven bottom areas with high tidal currents. Atka mackerel move off the bottom during daylight hours presumably to feed on their main prey, euphausiids and copepods. Predators of Atka mackerel include Pacific cod, arrowtooth flounder, Steller sea lions and seabirds. They begin to recruit to the fishery at age 3 and longevity can extend to 15 years.
U.S. joint venture fisheries began in 1980 and dominated landings of Atka mackerel from 1982 to 1988. The last joint venture allocation of Atka mackerel off Alaska was in 1989. Peak domestic catch occurred in 1996. The Atka mackerel fishery is heavily regulated to minimize the potential for prey competition with Steller sea lions, including seasonal allowances of the total allowable catch (TAC) and spatial distribution of the fishery away from critical habitat. Since 2008, the fishery has operated as a catch share fishery, with participants operating as cooperatives.
The vast majority of Atka mackerel is caught in waters around the Aleutian Island chain in western Alaska. Fishermen typically harvest 90 percent or more of the Atka mackerel TAC each year (Tables 59 and 59). Atka mackerel harvests declined by 66 percent between 2010 and 2013, but 2015-2016 TACs have returned to a levels near historic norms (Figure 45).
Photo from NMFS (AFSC).

Alaska Groundfish and Crab Wholesale Market Profiles NOAA/NMFS • 70
Figure 45. Atka Mackerel Harvest Volume in Alaska (mt) 1986-2014
Source: NMFS (OST).
Much of the decline in TACs was related to protection measures for Steller sea lions, which are listed as an endangered species in western Alaska rather than a decrease in species biomass. Atka mackerel are an important prey species for Steller sea lions. Recent mitigation measures have allowed for higher TACs without impacting endangered Steller sea lion populations.
Table 58. Atka Mackerel Harvest Volume in Federal Fisheries (mt), 2010-2014 2010 2011 2012 2013 2014
Gulf of Alaska 2,417 1,615 1,188 1,277 1,042
Bering Sea and Aleutian Islands 68,646 51,809 47,826 23,180 30,947
Total 71,063 53,424 49,014 24,457 31,989
Source: NMFS Alaska Region Catch Reports.
Amendment 80 Catcher Processors. Photo Courtesy of Fishermen’s Finest
0
10,000
20,000
30,000
40,000
50,000
60,000
70,000
80,000
90,000
100,000
1986
1987
1988
1989
1990
1991
1992
1993
1994
1995
1996
1997
1998
1999
2000
2001
2002
2003
2004
2005
2006
2007
2008
2009
2010
2011
2012
2013
2014
Harv
est V
olum
e (m
t)

Alaska Groundfish and Crab Wholesale Market Profiles NOAA/NMFS • 71
Table 59. Atka Mackerel TACs in All Federal Fisheries (mt), 2010-2016
Year Total Allowable
Catch (mt) Pct.
Harvested
2010 76,000 94%
2011 55,080 97%
2012 52,763 93%
2013 27,920 88%
2014 34,322 93%
2015 56,500 -
2016 56,817 -
Source: NMFS Harvest Specification Tables.
Product Description and Supply Chain Most Atka mackerel are between 37 to 47 cm long (approximately 14.5 to 18.5 in.) and weigh 300 to 600 g (0.66 to 1.32 lb).50 The primary products produced in Alaska are frozen H&G (84 percent of production volume) and frozen whole fish (16 percent). Japan produces about 10,000 mt of Atka mackerel surimi, though it is unclear whether that product is manufactured using Alaska product or other sources.51
Atka mackerel flesh offers a high oil content and has a strong, distinct flavor. In its raw form, the fish’s meat is firm and brownish but turns to a creamy white color when cooked. Atka mackerel is typically consumed as split/salted product, often grilled and served with rice.
Atka mackerel are primarily caught by catcher processors in Alaska and exported as a frozen H&G product to secondary processors in Japan, South Korea, and northern China. Secondary processors transform the fish into its finished split/salted form. Local processors and distributors sell the fish to retailers.
There are actually two separate species often referred to as “Atka mackerel.” The Pleurogrammus monopterygius species caught in Alaska is the less abundant of the two, while the “Okhotsk Atka mackerel” (Pleurogrammus azonus) is the other, more abundant variety. The species are not widely differentiated and comments about Atka mackerel markets or global supply extend to both species unless otherwise noted.
Production Volume and Value Alaska produced 20,900 mt of Atka mackerel products in 2014 worth $63.3 million (Figure 46 and Table 60). The species accounted for 2.1 percent of total groundfish production volume and 2.6 percent of the total first wholesale value for groundfish species in 2014. Atka mackerel are primarily harvested by the Amendment 80 fleet of catcher processors, which consists of 18 vessels. This fleet also targets flatfish and rockfish species.
Outside of 2013, the first wholesale value of Atka mackerel has remained surprisingly steady since 2009 - despite substantial declines in production volume. Rising prices largely offset lower production volumes in recent years, resulting in a similar total in first wholesale value in most years between 2009 and 2014.
Production is expected to continue rebounding with higher TACs set in 2015 and 2016. Given past recovery rates, 2015/2016 TACs are likely to produce approximately 35,000 mt of first wholesale product, similar to the average production from 2005 to 2012.
50 (Alaska Seafood Cooperative, 2015a) 51 (Park, 2014)

Alaska Groundfish and Crab Wholesale Market Profiles NOAA/NMFS • 72
Figure 46. First Wholesale Volume and Value for Atka Mackerel, 2005-2014
Table 60. First Wholesale Value of Atka Mackerel, in $Millions, 2005-2014 2005 2006 2007 2008 2009 2010 2011 2012 2013 2014
$36.9 $38.8 $40.4 $38.1 $67.7 $74.4 $75.4 $74.8 $39.5 $63.3
Source: AKFIN.
Key Markets for Atka Mackerel Based on U.S. export statistics, approximately 60 percent of Alaska’s Atka mackerel ends up in Japan (Table 61). The balance is primarily exported to China and South Korea, or remains in the U.S. market. Unfortunately, H.S. (foreign trade) codes do not uniformly identify Atka mackerel, making it difficult to track actual imports of Alaska product. South Korean import statistics specifically identifying Atka mackerel suggests that much of what is exported to South Korea actually enters the Korean market, as opposed to being re-exported, which is often the case with some other species. Given the product’s history and regional demand, it is likely that China also consumes some of its imported volume as well. Despite niche demand for Atka mackerel in China and South Korea, the general market is dominated by Japan.
Table 61. Alaska Atka Mackerel Exports by Major Country (mt), 2010-2014
2010 2011 2012 2013 2014
Japan 15,312 12,183 11,449 7,787 12,627
China 7,835 6,850 5,590 2,554 3,741
South Korea 2,185 2,690 2,418 2,244 2,811
Source: ASMI Alaska Seafood Export Database.
Total export volume of Atka mackerel is typically less the total production volume. Normally, this would suggest some product remains in the domestic market. However, anecdotal reports from the domestic seafood industry indicate very little product, if any, is sold into the U.S. domestic market. The reason for discrepancies between export and total production volume is more likely a result of inaccurate export coding, where a percentage of product is coded as a non-specific groundfish.
0
500
1,000
1,500
2,000
2,500
3,000
3,500
0
5,000
10,000
15,000
20,000
25,000
30,000
35,000
40,000
45,000
2005 2006 2007 2008 2009 2010 2011 2012 2013 2014
Valu
e/m
t
Volu
me
(mt)
Volume (mt) Value/mt

Alaska Groundfish and Crab Wholesale Market Profiles NOAA/NMFS • 73
Japan The majority of Alaska’s Atka mackerel is exported to Japanese markets, where it is particularly popular in the northern Hokkaido region. The most common preparation involves splitting, drying, and salting a headed and gutted fish (known as hokke no hiraki).52 Typically, the fish is then grilled and served with a side of steamed rice.
Atka mackerel, known as shima hokke in Japan, has a unique cultural significance and is a symbolic fish in the Hokkaido region. According to legend, the hokke fish was discovered by a 13th century Buddhist disciple named Nichiji who founded a temple in northern Japan and went on to settle in China.53 The fish has a long symbolic and commercial tradition in Hokkaido, where domestic landings peaked in 1998 at 240,000 mt supporting a market for split/salted hokke and hokke surimi.
Retail hokke prices and wholesale Atka mackerel prices have risen sharply in recent years due to declining harvests in Japan as well as Alaska. Japan harvested 52,700 mt of Atka mackerel in 2013. Japanese landings plunged further to 28,000 mt in 2014, and through May 2015 domestic landings in major Japanese ports were down over 50 percent from the prior year.54 Declining harvest trends in Japan puts Alaska in a better market position; however, Japanese consumers are extremely flexible when it comes to substituting seafood species. Time will tell how high hokke prices can go before reaching a maximum acceptable price for most consumers.
Atka and horse mackerel55 species have historically been important species for Japan’s domestic surimi producers. However, declining harvests and rising prices have prompted Japanese surimi producers to substitute other species for raw material used in surimi production.
Global Production and Competing Supply Alaska accounted for 25 percent of global Atka mackerel harvests between 2011 and 2013, the most recent 3 years with complete data for all countries. Historically, Japan is the largest producer but its harvests have declined significantly since 2008 - down 69 percent through 2013. Japanese fishermen have harvested substantial volumes of the species for many decades, but current harvest levels are lower than any point in at least 45 years based on Japanese trade press reports. Russia was the second largest producer in 2013, slightly behind Japan. Like Alaska, Russia began harvesting Atka mackerel in the 1980s (Figure 47).
In 2013, Atka mackerel harvests reached their lowest point since the late 1980s and were down 55 percent since 2008. During that recent 6 year period of declining global harvests, the ex-vessel price of Alaska’s Atka mackerel approximately doubled.
52 (Hokkaido Food Library, 2015) 53 The fish discovered by Nichiji was actually Okhotsk Atka mackerel (Pleurogrammus azonus), a very close relative to the Atka mackerel found in Alaska waters and often used interchangeably as hokke in Japan. 54 Hokkaido Food Library, 2015. 55 “Horse mackerel” is a generic name given to a range of species, predominantly from the Carangidae (jack mackerels and scads) family. Fish included in the Trachurus (including Atlantic horse mackerel) and Caranx genera encompass most of the horse mackerel category.
Wikimedia Commons, CC-BY-SA 3.0 lic., katorisi

Alaska Groundfish and Crab Wholesale Market Profiles NOAA/NMFS • 74
Figure 47. Global Atka Mackerel Harvest (mt) 1980-2013
Note: Figures include both species of Atka mackerel (P. monopterygius and P. azonus). Source: FAO and NMFS (OST).
0
50,000
100,000
150,000
200,000
250,000
300,000
350,000
400,000
1980
1981
1982
1983
1984
1985
1986
1987
1988
1989
1990
1991
1992
1993
1994
1995
1996
1997
1998
1999
2000
2001
2002
2003
2004
2005
2006
2007
2008
2009
2010
2011
2012
2013
Volu
me
(mt)
Alaska Japan Russia Others

Alaska Groundfish and Crab Wholesale Market Profiles NOAA/NMFS • 75
Wholesale Market Profile for Pacific Ocean Perch
Pacific ocean perch (POP, Sebastes alutus) is the most abundant rockfish species in Alaska, comprising 81 percent of the first wholesale value of all Alaska rockfish in 2014. Overall, POP represented 2.7 percent of the first wholesale value of all Alaska groundfish in 2014. The vast majority of Alaska POP is exported to China (for reprocessing) and Japan – the species’ largest consumer market. Alaska’s POP production accounted for 20 percent of global rockfish harvests in 2013. This market profile summarizes production and markets for POP fisheries in Alaska.
Table 62. Summary Profile of Pacific Ocean Perch Wholesale Production and Markets, 2014
Value and Volume Key Products H&G Other
First Wholesale Production (mt) 23,400 Pct. of Value 93% 7%
Pct. of Global Rockfish Harvest (2013) 20% Key Markets China Japan U.S.
First Wholesale Value ($millions) $65.4 Pct. of Final Sales 60% 29% 6%
Pct. Change in Value from Prior 4-yr Avg. 15.2% YOY Change 87% 28% N/A
Pct. of Alaska Groundfish Value 2.7% Competing Species: Redfish and other rockfish species.
POP is a key species for the Amendment 80 fleet, which also harvests high volume flatfish (sole/flounder), Atka mackerel, and other rockfish species. POP accounted for 19 percent of the combined first wholesale value of these species in 2014.
Fishery Summary POP are one of about 70 different kinds of rockfish (Sebastes spp.) and accounts for the vast majority of rockfish caught in Alaska. POP are a slow-growing species, capable of living to nearly 100 years of age. The fish primarily inhabit waters along the continental slope at depths of 180 to 420 m. Despite their age, the average POP harvested in commercial fisheries are only about 36 cm (14.2 in.) long with a round weight of slightly less than a pound to a little over 2 lb.
Figure 48. Pacific Ocean Perch Harvest Volume in Alaska (mt) 1977-2014
Image from NOAA Fishwatch.gov.
0
10,000
20,000
30,000
40,000
50,000
60,000
1977
1979
1981
1983
1985
1987
1989
1991
1993
1995
1997
1999
2001
2003
2005
2007
2009
2011
2013
Harv
est V
olum
e (m
t)
Source: NMFS OST (1977-2013) and NMFS Alaska Region Catch Reports (2014).

Alaska Groundfish and Crab Wholesale Market Profiles NOAA/NMFS • 76
POP are an important component of Alaska groundfish fisheries, with catches taken primarily from shelf breaks and gullies in the northern Gulf of Alaska and Aleutian Islands region during summer months (Table 63). Most POP are harvested by Amendment 80 catcher processors, and to a lesser extent, smaller catcher vessels. Catcher processors harvest multiple species, conduct primary processing aboard the vessel, and freeze their products on board. The most common fishing gear is otter trawls rigged to fish over generally rougher substrates. Rockfish nets are designed to stay off the bottom as much as possible by employing numerous floats to buoy the net body and codend. However, pelagic trawls are also widely used to target POP in the Gulf of Alaska. Changing fishery management techniques have also been implemented to reduce bycatch and maximize target species retention. In 2008, the new “Amendment 80” catch share fishery went into effect dividing groundfish target quotas for sole, Atka mackerel, and POP and bycatch limits among cooperatives. The new cooperative approach ended the “race for fish” allowing vessels to fish cleaner and more efficiently.56
POP and other rockfish species are primarily harvested by the Amendment 80 fleet of catcher processors, which consists of 18 vessels. This fleet also targets flatfish species and Atka mackerel. POP and other rockfish species accounted for 23 percent the Amendment 80 fleet's first wholesale value in 2014.
Table 63. Pacific Ocean Perch Harvest Volume in Federal Fisheries (mt), 2010-2014 2010 2011 2012 2013 2014
Gulf of Alaska 15,617 14,216 14,911 13,183 17,663
West GOA 3,141 1,819 2,452 447 2,096
Central GOA 10,550 10,527 10,777 11,199 13,697
West Yakutat/Southeast 1,926 1,870 1,682 1,537 1,870
Bering Sea and Aleutian Islands 17,852 24,004 24,142 31,392 32,383
Total 33,469 38,220 39,053 44,575 50,046
Source: NMFS Alaska Region Catch Reports.
POP harvests averaged 18,100 mt between 1992 and 2004, but since then harvests are up 135 percent (Figure 48). Alaska accounts for over 99 percent of POP caught in U.S. waters. Fishermen tend to harvest 90 percent or more of the total allowable catch each year (Table 64).
Table 64. Pacific Ocean Perch TACs in All Alaska Federal Fisheries (mt), 2012-2016
Year Total Allowable
Catch (mt) Pct.
Harvested
2012 39,757 98%
2013 49,707 90%
2014 50,307 99%
2015 52,210 -
2016 52,588 -
Source: NMFS Harvest Specification Tables.
56 (Alaska Seafood Cooperative, 2015b)

Alaska Groundfish and Crab Wholesale Market Profiles NOAA/NMFS • 77
Product Description and Supply Chain Approximately 80 percent of Alaska POP are processed by catcher processors or floating processors. Regardless of whether POP are processed at sea or in shoreside facilities, the vast majority (87 percent) are converted into a frozen headed and gutted (H&G) product, which 250 to 650 g (approx. 0.55 to 1.43 lb).57 Larger POP and other rockfish species are occasionally filleted in shoreside plants, but overall fillets accounts for a minor part of total production.
POP, like other rockfish, have a light-colored, firm flesh. Some POP fillets have a pinkish hue when raw, but turn a creamy white when cooked. In wholesale markets, H&G products are grouped according to the following size specifications (essentially extra-small through extra-large):58
• 2L: 620 – 900 g • L: 460 – 620 g • M: 370 – 460 g • S: 300 – 370 g • SS: 220 – 200 g
POP are often called “rockfish”, “redfish,” or simply “ocean perch” in wholesale and end markets. It is unlikely a consumer would see POP called out specifically on a retail label or restaurant menu. The species’ obscurity and firm, sweet taste is one reason it has become a more valuable alternative to other more expensive species, such as red snapper or orange roughy. Species substitution is illegal if retail or food service operators misrepresent species like red snapper for less expensive species, such as redfish, red drum, or tilapia. There is clearly a strong financial incentive to substitute species like POP for other, more expensive species. However, consumers are free to substitute POP in recipes and it would make sense for chefs to use smaller firm-fleshed fish (like POP) in dishes which do not require a large, expensive snapper fillet (provided they do not misrepresent the species used).
Alaska functions as a primary processor and source of raw material in the greater rockfish supply chain. Most Alaska rockfish production consists of frozen H&G or whole-fish product exported to secondary processors in China and Japan who thaw, cut, freeze, and re-package fillets for sale to end markets. Based on anecdotal reports from domestic seafood industry representatives, virtually all product processed in China is re-exported although attempts to develop a broader consumer market for Alaska seafood products in China continues. Japan is currently the largest consumer market for Alaska rockfish by a wide margin. Europe and the United States also buy smaller quantities of rockfish directly from Alaska, as well as twice frozen product from China. Before reaching consumers, POP is generally sold to retailers and restaurants through regional seafood distributors who maintain connections with processors in China and Alaska.
Production Volume and Value Alaska produced 25,400 mt of POP products in 2014 worth $65.4 million. Total rockfish production, including POP and other Sebastes species, was 32,300 mt valued at $81.2 million (Figure 49 and Table 65). Rockfish accounted for 3.3 percent of total groundfish production volume and value in 2014. Since POP and other rockfish species are so closely linked and substituted for in wholesale markets, wholesale production and market analysis from this point on focuses on all Alaska rockfish species (comprised primarily of POP).
While Alaska rockfish production volume increased 116 percent, what is even more surprising is total first wholesale value increased 137 percent (in nominal terms) between 2005 and 2014. Typically, when supply increases significantly, total value lags behind as market prices adjust downward, reacting to greater product
57 (Alaska Seafood Cooperative, 2015b) 58 (Iquique US, 2015)

Alaska Groundfish and Crab Wholesale Market Profiles NOAA/NMFS • 78
availability. However, rockfish unit values (value/mt) trended up between 2008 and 2011, reacting to growing demand and a weaker Japanese yen.
Figure 49. First Wholesale Volume and Value for Alaska Rockfish Species, 2005-2014
Table 65. First Wholesale Value of Alaska Rockfish Species, in $Millions, 2005-2014 2005 2006 2007 2008 2009 2010 2011 2012 2013 2014
$34.2 $48.8 $42.8 $35.8 $38.4 $59.4 $94.9 $84.7 $67.8 $81.2
Source: AKFIN.
The 2011 year is unique due to the March 2011 tsunami which struck Japan. The tsunami created additional demand for Alaska rockfish and Atka mackerel, as it decimated the country’s seafood industry and many storage facilities. Secondly, rebuilding the country caused the yen to strengthen substantially until 2013 – making imported seafood relatively less expensive to Japanese consumers during 2011 and 2012. When Japan’s central bank began taking steps to weaken the yen in an effort to stimulate export-oriented industries Alaska seafood became relatively more expensive for Japanese consumers. Therefore, it is not surprising that 2011 and 2012 produced the highest (near-term) price and total value for Alaska rockfish.
Given declining prices, it could be assumed that demand for rockfish has subsided since 2011. However, aggregate demand, from the point of view of Japanese consumers, has increased notably. In yen terms, the total first wholesale value of Alaska rockfish increased 19 percent between 2011 and 2014 – even though it declined in U.S. dollar terms.
Key Markets for Pacific Ocean Perch Based on U.S. export statistics, approximately three-quarters of Alaska’s rockfish was sold to export markets in 2014 (Table 66). The balance was either sold to U.S. buyers or may have been exported under a less specific H.S. code. Historically, trade data on rockfish has shown far lower export volumes than expected. Coding appears to be improving; however, a time series of Alaska rockfish export data would likely present an inaccurate picture of actual trends. Due to the questions about underlying trade data, particularly in years prior to 2013, this analysis focuses on 2014 exports – the most recent data available.
$500
$1,000
$1,500
$2,000
$2,500
$3,000
$3,500
$4,000
0
5,000
10,000
15,000
20,000
25,000
30,000
35,000
2005 2006 2007 2008 2009 2010 2011 2012 2013 2014
Valu
e/m
t
Volu
me
(mt)
Volume (in mt) Value/mt

Alaska Groundfish and Crab Wholesale Market Profiles NOAA/NMFS • 79
Table 66. Alaska Rockfish Exports by Major Country (mt), 2014 2014 Pct. of Total Production
China 15,566 48%
Japan 6,861 21%
South Korea 918 3%
Other Countries 458 1%
Total Exports 23,802 74%
Product Not Accounted For and/or U.S. sales 8,480 26%
Total Production 32,283 -
Source: ASMI Alaska Seafood Export Database.
China At least 48 percent of Alaska rockfish production was exported to China in 2014, and this figure is likely somewhat conservative (Table 66). Virtually all POP and other rockfish exported to China consists of frozen whole or H&G fish, which is filleted, and re-exported. Outside of the United States, using H.S. codes detailed enough to identify Alaska rockfish is even more uncommon. As a result, it is not possible to track competing supply of ocean perch and rockfish coming into China or the markets where it goes.
However, based on the codes and instances where product is identified specifically as rockfish (Sebastes spp.), China’s major export markets appear to be Japan, Europe, Russia, and the United States. Japan imported 12,038 mt of “Fish Fillets, Frozen, Nesoi (H.S. code: 030489)” from China in 2014. Much of this volume, perhaps all, is likely ocean perch since shipments of “redfish” and “ocean perch” to other countries contain the same six-digit H.S. code. Europe imported approximately 3,600 mt of ‘030489’ product from China in 2014 which was specifically identified as rockfish (Sebastes). Russia imported 1,778 mt and the United States imported 839 mt of product from China identified as rockfish or ocean perch.
Japan POP is generally called akauo in Japan; however, the fish is known by several other names depending on the region (e.g. aka mebaru, arasukamenuke). Rockfish in general is known as menuke. Japanese consumers utilize POP in a variety of dishes. Common preparations include grilled POP (often marinated with kasuzuke) as an entrée in bento boxes, raw slices for sashimi/sushi, and boiled fillets in soups or broth. POP and other rockfish are harvested along most of Japan’s coastline. As such, it is less of a regional species compared to Atka mackerel.
Japan is the largest consumer market for POP. Importers buy frozen fish from Chinese or Alaska processors, depending on the product demanded – once/twice frozen, fillets, or H&G. From there, most importers act as distributors for retails or food service operators.
Wholesale prices in Japan are flat from last fall, but roughly 25 percent higher than a few years ago (as of September 2015). Domestic production is down as Japanese redfish quotas were set at 9,500 mt in 2014, half of the prior year’s level.59 In addition, European supply is down as there are fewer at-sea freezer boats fishing redfish and more demand for fresh product in European markets.
Alaska is Japan’s largest rockfish/redfish supplier, both in direct terms and product routed through China (Table 67). Europe is the second largest supplier, followed by domestic production and Russian imports.
59 Despite numerous references by trade press to domestic redfish production, FAO capture statistics showed no harvest of POP or other Sebastes spp. species in 2013. It is likely that Japanese redfish production is contained within a generic “marine fishes nei” listing.

Alaska Groundfish and Crab Wholesale Market Profiles NOAA/NMFS • 80
Table 67. Japan Imports of Rockfish by Major Trading Partner (mt), 2013 and 2014 2013 2014 YOY Pct. Change Pct. of Total Imports U.S. (Alaska) 18,475 18,302 -1% 34% China 11,047 12,065 9% 21% Europe 15,764 12,056 -24% 25% Russia 10,229 8,691 -15% 17% Canada 1,060 1,464 38% 2% Avg. Yen/kg Unit Value 489 531 9% -
Note: Includes HS codes ‘030389295’ and ‘030489290.’ Source: Japan Custom Statistics.
HS codes used to categorize internationally traded products vary in how specifically they are used in practice to describe rockfish species. A review of HS codes and trade patterns suggest the majority of rockfish imported by Japan is included the ‘030389295’ and ‘030489290’ codes.
Increasing Atka mackerel quotas in Alaska could impact prices for POP, according to Japanese trade press reports.60 Atka mackerel and POP are competitive species in the dried fish market in Japan, and although the two are not common substitutes in other recipes, consumers may choose one or the other depending on price.
Global Production and Competing Supply Global rockfish production peaked in 1982 at 505,800 mt. Harvests were relatively flat and averaged 209,400 mt from 2009 to 2013, the last 5 years with complete data (Figure 50). Europe is the largest producer of redfish/rockfish products, accounting for just over half (52 percent) of total production in 2013. Alaska POP accounted for one-fifth (20 percent) of global rockfish production in 2013. Including all rockfish species caught in all states, the United States accounted for 23 percent of global production. Russia and Canada together accounted for the other quarter of global production.
Figure 50. Global Rockfish (Sebastes spp.) Harvest (mt), 1980-2013
Note: Figures include all Sebastes spp. species. Source: FAO.
FAO harvest statistics suggest relatively little Japanese production, terminating around 2009. Japanese trade press reports indicate Japan does harvest material volumes of rockfish/redfish species, on the order of 10,000 mt. However, this production may be included under a different species category.
60 (Kidera, 2015)
0
100,000
200,000
300,000
400,000
500,000
600,000
1980
1981
1982
1983
1984
1985
1986
1987
1988
1989
1990
1991
1992
1993
1994
1995
1996
1997
1998
1999
2000
2001
2002
2003
2004
2005
2006
2007
2008
2009
2010
2011
2012
2013
USSR/Russia Europe U.S. (mostly Alaska) Canada Japan Others

Alaska Groundfish and Crab Wholesale Market Profiles NOAA/NMFS • 81
Wholesale Market Profile for Sablefish
Sablefish (Anoplopoma fimbria), whose market name is black cod, is found in waters from the Aleutian Island chain to Northern Mexico with a larger distribution concentrated in the North Pacific Ocean, primarily in the Gulf of Alaska. The fish has an extremely high oil content commands one of the highest ex-vessel prices of any species harvested in Alaska. Japan is the primary market and sablefish are also popular in China, but the fish can be found in many high-end seafood restaurants around the world. Sablefish accounted for $99.0 million of Alaska’s total wholesale value in 2014 and nearly 15 million lb of production volume. The species accounted for 4.1 percent of Alaska groundfish first wholesale value in 2014, and 0.7 percent of production volume.
Table 68. Summary Profile of Sablefish Wholesale Production and Markets, 2014
Value and Volume Key Products H&G Other
First Wholesale Production (mt) 6,700 Pct. of Value 97% 3%
Pct. of Global Sablefish Harvest (2013) 78% Key Markets Japan China Others
First Wholesale Value ($millions) $99.0 Pct. of 1st Sales 61% 9% 30%
Pct. Change in Value from Prior 4-yr Avg. -24.0% YOY Change -16% -16% N/A
Pct. of Alaska Groundfish Value 4.1% Competing Species: Patagonia toothfish (Chilean Seabass)
Fishery Summary Sablefish are a highly migratory fish that live along the continental slope and shelf gullies at depths of 200 m and greater. In Alaska, sablefish are harvested primarily through fixed gear (longline and pot) while a small amount is caught in trawl nets. Fixed gear targets sablefish, whereas bottom trawls capture sablefish within a mixed-species catch of groundfish, both of which are given quota allocation through Total Allowable Catch (TAC) for each region. The federal Individual Fishing Quota (IFQ) program for halibut and sablefish was designed by the North Pacific Fishery Management Council and implemented by National Marine Fisheries Service in 1995. Under the IFQ program, the length of the fishing season increased from 14 days in 1994 to 8 months today, leading to decreased fishermen mortality rates, increased Catch Per Unit Effort (total catch divided by total effort), and stronger ex-vessel prices.61 The federal IFQ fisheries account for the majority of sablefish harvests, with the state overseeing additional fisheries in the Aleutian Islands, Prince William Sound, Cook Inlet, and Southeast Alaska. Alaska accounted for 74 percent of total U.S. sablefish harvests in 2014, and the balance of the U.S. harvest takes place on the U.S. west coast which is also managed as a catch share fishery. The U.S. share of global sablefish production has averaged 87 percent over the last 10 years.
61 (Sigler & Lunsford, 2001)
Image from NOAA Fishwatch.gov.

Alaska Groundfish and Crab Wholesale Market Profiles NOAA/NMFS • 82
Sablefish has been harvested by Canadian and American fishing vessels since the 1900s. The original Japanese commercial longline fishery was replaced by domestic fishing efforts in 1977 after the Magnuson-Stevens Act eliminated foreign fishing vessels from the newly established Exclusive Economic Zone (EEZ), which extended U.S. marine boundaries to 200 miles from the coast. Today, 72 percent of U.S. sablefish is exported to Japanese markets.62
Across Alaska, sablefish are primarily caught with fixed gear allocated according to each region’s Fishery Management Plan. However, trawl vessels also harvest sablefish and accounted for 8.3 percent of the 2014 harvest (Table 69). Fishermen in the Gulf of Alaska will soon have the option to use pot gear, a management response to increased sperm whale depredation in the fishery. Some whales have learned to eat hooked fish off (fixed) longline gear while fishermen are retrieving their catch. These interactions are dangerous for fishermen and whales, and also make it more difficult for fishery managers to account for the removal of additional biomass.
Table 69. Sablefish Harvest Volume for Federal and State Fisheries (mt), 2010-2014 2010 2011 2012 2013 2014
Federal Fisheries
GOA Fixed (IFQ) 9,236 10,153 11,059 11,100 9,457
GOA Trawl 900 1,087 861 846 965
BSAI Fixed (IFQ) 1,247 1,279 1,329 1,122 754
BSAI Trawl 100 85 230 184 58
CDQ Harvest 504 366 389 391 319
State Fisheries
Prince William Sound 96 101 92 71 44
Southeast Alaska 732 646 676 670 568
Aleutian Islands 95 115 102 101 74
Cook Inlet 25 26 31 19 23
Total 12,935 13,858 14,769 14,504 12,262
Federal Pct. 92.7% 93.6% 93.9% 94.1% 94.2%
State Pct. 7.3% 6.4% 6.1% 5.9% 5.8%
Note: Volume in round-weight terms. Source: NMFS Alaska Region Catch Reports and ADF&G, 2015.
62 (Sonu, 2014)
Photo from National Marine Fisheries Service.

Alaska Groundfish and Crab Wholesale Market Profiles NOAA/NMFS • 83
Product Description and Supply Chain Sablefish is a premium-quality whitefish that can be smoked, grilled, and sautéed. It is sold in retail markets in frozen fillet form, often in a marinade. It is primarily exported to wholesale buyers in Japan and other niche Asian markets, where most volume is eventually sold into high-end restaurants. However, the domestic seafood industry representatives report that domestic demand is growing.
Shoreside processors in Alaska receive sablefish deliveries either in the round or eastern cut, on ice. While there are various sablefish products, most Alaska processors sell the fish headed and gutted (H&G) eastern cut (head removed just behind collar bone) (Table 70).
The species’ high oil content and delicate texture make it a sought after product. Fish size largely determines pricing in wholesale markets, but prices are also impacted by quality, origin, supply, substitute fish prices, and the dollar-yen exchange rate. Sablefish are categorized by weight: the larger the fish, the higher the price per pound.63 Differences in wholesale prices often range from $0.75 to $1.50 for each additional pound.
Table 70. Common Sablefish Products, 2014 Alaska Production Volume, and Recovery Rates (Pct.)
2014 Alaska
Production (mt) Recovery Rate
Range
H&G (mostly Eastern cut) 6,287 60-67%
Pectoral Girdles (Collars) 151 N/A
Fillets 43 35-40%
Other Products 215 N/A
Note: Volume in product-weight terms. Source: ADF&G (COAR) and Alaska Sea Grant (Crapo, Paust, & Babbit, 1993).
Supply Chain Figure 51 illustrates the sablefish supply chain, from harvesters to consumers. Alaska sablefish is primarily harvested by relatively small boats (most less than 60 ft.) and delivered to shoreside plants either in the round or already headed and gutted. Freezer longliners (catcher processors) also participate in the sablefish IFQ fishery. The majority of product is sold in a frozen, H&G format to high-volume distributors in Japan and other Asian countries. These foreign importers sell product to secondary distributors in smaller volumes and sell product directly to retail and restaurant. Product sold into the domestic market is typically filleted by primary processors in Alaska or secondary processors/distributors. Regardless of whether sablefish is exported or sold domestically, it typically passes through one or two distributors before being sold to consumers at the retail level.
63 (Reynolds, 2015)
Photo Courtesy of Jane Sullivan.

Alaska Groundfish and Crab Wholesale Market Profiles NOAA/NMFS • 84
Figure 51. Alaska Sablefish Supply Chain
Production Volume and Value
Volume and Value In the last 10 years, Alaska fisheries have produced 71 percent of U.S. sablefish harvests. Volume peaked in the late eighties at 28,000 mt in Alaska, doubling current landing levels of 12,300 mt. The state’s sablefish production has been relatively stable since the late 1990s, but has declined each of the past 2 years (2013-2014) (Figure 52). The 2014 production volume was 59 percent lower than peak production levels, which averaged 21,200 mt between 1987 and 1990. IFQ quota declined in 2014, dipping 17 percent from the last 3 year average. The TAC for 2015 stabilized to 13,500 mt, following abundance trends. Lower recruitment rates are a cause of the decline in TAC from 2013-2016, and are projected to increase after 2016.64
Figure 52. First Wholesale Volume and Value of Alaska Sablefish, 2005-2014
Table 71. First Wholesale Value, Alaska Sablefish, $Millions 2005 2006 2007 2008 2009 2010 2011 2012 2013 2014
$103 $114 $114 $121 $108 $120 $164 $135 $102 $99
Source: ADF&G (COAR).
64 (Hanselman, Lunsford, & Rodgveller, 2014)
Catcher Vessels
Shoreside Processors
Domestic Distributors
Retail & Restaurants
Export Distributors
Wholesale Buyers
Direct Retail & Restaurants
$8,000
$10,000
$12,000
$14,000
$16,000
$18,000
$20,000
0
2,000
4,000
6,000
8,000
10,000
12,000
2005 2006 2007 2008 2009 2010 2011 2012 2013 2014
Valu
e/m
t
Volu
me
(mt)
Volume (in mt) Value/mt

Alaska Groundfish and Crab Wholesale Market Profiles NOAA/NMFS • 85
Sablefish production volume was similar to halibut in 2014, with first wholesale volumes between 6 and 7 thousand metric tons for both species and first wholesale values near $100 million dollars apiece. Although they differ greatly in appearance and have different key markets, halibut and sablefish are similar in other regards. Both are high-value fish, are managed under the same IFQ program, and most are harvested using similar gear (primarily longline). The bulk of each species is harvested before and after the summer salmon fishing season, even though the season typically runs from March into November. Sablefish is delivered either eastern cut (dressed and iced) or in the round. Unlike halibut, which is sold either fresh or frozen, sablefish is almost entirely sold frozen.
The total wholesale value of sablefish was $99 million in 2014, a 24 percent decrease from the previous 4 year average. Production volume was down 23 percent versus the previous 4 year average (Table 71).
Price Sablefish wholesale prices reached a record high of $8.72 per lb in 2011. Since then, mean prices declined to $5.57 per lb in 2013 (Figure 53). Small harvest level and healthy demand have helped to prevent prices from dropping further and in 2014 the wholesale price was $6.70 per lb. Volume is expected to be below historical averages in the next few years and prices are anticipated to remain high.
Figure 53. Alaska Wholesale and Ex-Vessel Prices per Pound, 1995-2014
Source: NMFS Alaska Region Blend Catch-accounting and At-sea and Shoreside Production Reports; ADF&G (COAR).
http://www.afsc.noaa.gov/REFM/Socioeconomics/SAFE/groundfish.php#data
Regional Sablefish Production Sablefish is delivered by catcher vessels to shoreside processors as whole fish or H&G, eastern cut. The majority of sablefish is caught in the Gulf of Alaska. Sitka, Seward, and Kodiak are the state’s largest sablefish ports, accounting for half of the total sablefish landings in 2014 (Table 72). Freezer longliners (catcher processors) accounted for 6.5 percent of the IFQ harvest in 2014.
$1.00
$2.00
$3.00
$4.00
$5.00
$6.00
$7.00
$8.00
$9.00
19951996199719981999200020012002200320042005200620072008200920102011201220132014
Aver
age
Pric
e pe
r lb
Wholesale Price per lb Ex-vessel Price per lb

Alaska Groundfish and Crab Wholesale Market Profiles NOAA/NMFS • 86
Table 72. Alaska Sablefish First Wholesale Volume and Value by Top Ports, 2014
Note: Volume in product-weight terms. Due to slight differences between data sets, total volume and value figures may not match other totals quoted in this report. Source: ADF&G (COAR).
Key Markets for Alaska Sablefish Sablefish is primarily sold by the container load as a frozen, dressed (eastern-cut) product. Importers purchase containers of sablefish and then sell it to wholesale buyers, who in turn act as distributors or secondary processors for restaurants and retail markets.65 Japan is the primary market for Alaska sablefish which extends back to the 1960s when Japanese fishing vessels began harvesting the species in waters off the coast of Alaska. China (including Hong Kong) and the United States are the next largest markets, and strong demand from those countries have pushed prices higher in recent years.66
U.S. sablefish exports is a reasonable proxy for global market share, as the United States accounts for just
under 90 percent of global supply. In 2014, Japan account for 77 percent of U.S. exports by weight (Table 73). HS (Harmonized System) codes typically do not allow for a more comprehensive market share analysis outside of U.S. exports or Japanese imports. Export volume has decreased since 2013, with overall revenues decreasing by 15 percent.
Table 73. U.S. Sablefish Exports to Global Markets, 2014
Volume (mt) Revenue ($millions)
Pct. Change in Volume from 2013
Pct. Change in Revenue from 2013
Japan 5,131 $59.5 -24% -16%
China/Hong Kong 595 8.5 -26% -16%
Singapore 141 2.3 3% 25%
Europe 316 4.6 13% 48%
All other 482 6.7 - -
Total 6,665 $81.6 -23% -15%
Source: NMFS Foreign Trade Data.
65 (Reynolds, 2015) 66 (Sackton, 2015)
Volume (mt) Value ($thousands)
Sitka/Pelican/Petersburg/Wrangell 1,689 $27,160
Kodiak 1,105 16,527
Cook Inlet 1,054 12,694
Juneau/Yakutat 847 12,014
EEZ/Bering Sea 731 8,688
Dutch Harbor/Adak/West Aleutians 685 10,236
Other 727 10,781
Grand Total 6,839 $98,100
Photo Courtesy of Stephanie Warpinski.

Alaska Groundfish and Crab Wholesale Market Profiles NOAA/NMFS • 87
Canada is the only other major sablefish exporter, producing roughly 11 percent of the global share. Canada’s top two export markets are Japan and the United States; however, it is likely that a portion of frozen sablefish imported by U.S. buyers from Canada is re-exported to Asia.
Patagonian toothfish (Dissostichus eleginoides), also known as Chilean seabass, is the primary competitor with sablefish in high-end whitefish markets.67 It also features a high oil content and rich white meat.
Japan Japan imports more sablefish than all other countries combined, but its import share of large sablefish decreased in the last few years due to a strong dollar and increasing international demand. Despite the recent downward trend in market share, Japan’s sablefish market remains a key segment for the Alaska seafood industry.
The country imported approximately 7,200 mt of frozen H&G sablefish in 2014, valued at $96.6 million (Table 74). Total imports in 2014 were one-third below the 2009 level of 10,600 mt, including a 14 percent decline between 2013 and 2014. Total imports in 2014 were 18 percent below the 3 year average of 7,900 mt, including a 15 percent decline between 2013 and 2014.
Sablefish supply, exchange rates, and availability of substitutes, such as mero (Patagonian toothfish), drive sablefish prices historically. A weaker yen and increasing demand in the United States and other export markets have pushed sablefish prices up in Japan (in both USD and yen).
Table 74. Japan Frozen H&G Sablefish Imports, by Major Trade Partner, 2009-2014 Country of Origin 2009 2010 2011 2012 2013 2014
Import Volume (mt) U.S. 9,409 8,402 7,878 8,324 7,655 6,514
Canada 1,196 941 762 789 725 668
Total 10,607 9,349 8,640 9,113 8,380 7,182
Import Value ($millions)
U.S. $117.0 $123.5 $151.2 $106.8 $90.3 $87.6
Canada 15.6 13.9 14.9 11.4 9.0 8.9
Total $132.6 $137.4 $166.0 $118.2 $99.3 $96.6
Import Value/mt
Avg. Total USD/mt $9,409 $8,402 $7,878 $12,972 $11,850 $13,444
Avg. Yen/USD Exchange Rate ¥93.6 ¥87.8 ¥79.7 ¥79.8 ¥97.6 ¥105.8
Est. Total Yen/mt (¥thousands) ¥880 ¥737 ¥627 ¥1,035 ¥1,156 ¥1,423
Note: Volume is in product-weight terms. Source: Global Trade Atlas and OANDA.
United States Estimates for the 5 year average of annual U.S. consumption of sablefish are around 2,895 mt, though the domestic market for sablefish has been increasing for several reasons (Table 75). First of all, high prices for
67 (U.S. Departments of Commerce and State, n.d.)
Photo Courtesy of ASMI.

Alaska Groundfish and Crab Wholesale Market Profiles NOAA/NMFS • 88
Patagonian toothfish have pushed consumers toward substitutes, in particular sablefish. Another reason for the growing popularity of sablefish is its increased usage in Japanese restaurants and high-end restaurants. Lastly, a significant weakening of the yen versus the dollar has reduced demand in Japan and increased the supply of sablefish available for the U.S. market.68
Table 75. Estimated U.S. Sablefish Market Supply (mt), 2010-2014
Year Est. U.S.
Wholesale Production
U.S. Imports
U.S. Exports Est. U.S. Supply
2010 12,182 409 9,148 3,443
2011 12,960 833 13,088 705
2012 12,467 691 10,144 3,014
2013 11,259 268 8,646 2,881
2014 10,400 695 6,665 4,430
Five-year Average 11,854 580 9,538 2,895
Note: Production and supply figures are quoted in product-weight terms, based on frozen H&G, eastern cut product. Source: McDowell Group estimates, based on NMFS harvest and trade data.
China and Other Asian Markets Sablefish has recently seen increased demand in China and other large Asian markets. China is the largest seafood producer in the world as well as a re-processor for Alaska seafoods.69 Demand for high-quality fish has increased due to an expanding middle class, and in recent years, lavish government parties in China and Hong Kong drove an increase in exports until 2013 when the Chinese government curbed expenditures.70 In 2013, U.S. export value was highest in Hong Kong and China, with values over $7.2 million and $2.4 million, respectively (Figure 54).
Figure 54. U.S. Exports of Sablefish by Top 5 Asia Countries (excluding Japan), in $Thousands, 2009-2014
Source: Sonu 2014.
68 (Sackton, 2014) 69 (Alaska Seafood Marketing Institute, 2011) 70 (Undercurrent News, 2013)
$4,7
20
$5,9
00
$7,0
06 $8
,636
$7,2
18
$5,7
33
$2,3
01
$1,6
79 $3
,518
$1,9
36
$2,4
56
$2,7
36
$1,1
78
$1,4
21
$1,2
85
$2,0
36
$1,8
17
$2,2
57
$137
$179
$749
$550
$979
$665
$988
$767
$532
$1,1
86
$633
$574
$-
$1,000
$2,000
$3,000
$4,000
$5,000
$6,000
$7,000
$8,000
$9,000
$10,000
2009 2010 2011 2012 2013 2014
Valu
e ($
000s
)
Hong Kong China Singapore Thailand South Korea
$0

Alaska Groundfish and Crab Wholesale Market Profiles NOAA/NMFS • 89
Global Production and Competing Supply In 2014, the United States harvested 16,500 mt of sablefish while Canada harvested 1,773 mt. Over the last 5 years, Alaska has harvested 65 percent of the global sablefish production (Figure 55). Current harvest levels are lower than historical averages, which has led to higher prices. For wholesale markets, this means volume will remain low and prices fairly high, however there are limitations.
A common substitute on the market, Patagonian toothfish, has a similar high oil content and rich flavor, and equivalent high prices. Patagonian toothfish production peaked at 41,000 mt in 2001 and harvest levels have been declining since. Many different countries fish for Patagonian toothfish with varying degrees of sustainable management. In the early 2000s, it was estimated up to half of harvests consisted of illegal, unreported fishing actual toothfish landings. This lead to informed consumers moving to more sustainably harvested species, such as sablefish.71
Sablefish farming has not developed as anticipated. There are some sablefish farming ventures in British Columbia, with no evident impact on wild Alaska sablefish harvest or revenues. Canada’s wild sablefish harvest is equivalent to that of California or Oregon, with 1,773 mt harvested in 2014.72
Figure 55. Global Supply of Sablefish (mt), 2003-2014
Note: Percent share based on 5 year average.
Source: FAO Fishstats.
71 (Catarci, 2004) 72 (Fisheries and Oceans Canada, 2015)
10% Canada
65% Alaska
24% U.S. West Coast
-
5,000
10,000
15,000
20,000
25,000
30,000
2003 2004 2005 2006 2007 2008 2009 2010 2011 2012 2013 2014
Alaska U.S. West Coast Canada
0
Har
vest
Vol
ume
(mt)

Alaska Groundfish and Crab Wholesale Market Profiles NOAA/NMFS • 90
Wholesale Market Profile for Pacific Halibut
Pacific halibut73 (Hippoglossus stenolepis) is a large flatfish species found in waters of the North Pacific Ocean. It commands one of the highest ex-vessel prices of any species, worth $109 million in first wholesale value in 2014 for 6,157 mt. The fish is primarily sold to upscale retail and food service markets in North America. Halibut accounted for 4.5 percent of Alaska groundfish first wholesale value in 2014, and 0.6 percent of production volume. This profile summarizes the fishery, production volume and value in Alaska, key markets, and global supply.
Table 76. Summary Profile of Pacific Halibut Wholesale Production, 2014
First Wholesale Production (mt) 6,157
Pct. of Global Pacific Halibut Harvest (2013) 73%
First Wholesale Value ($millions) $109.2
Pct. Change in Value from Prior 4-yr Avg. -40%
Fishery Summary Halibut has been harvested commercially since the early 1900s along the West Coast, from California to Alaska. Managed by the International Pacific Halibut Commission (IPHC) since 1923, the organization jointly manages commercial harvest of halibut in the United States and Canada by establishing catch limits based on stock assessments.
The North Pacific Fishery Management Council allocates the catch limits for each management area within Alaska. The fishery is managed under an Individual Fishing Quota (IFQ) system since 1995, eliminating the derby-style race-to-fish and increasing the season length from just a single day in 1994 to the current eight-month window. This management policy greatly impacted the fresh fish market for halibut, improving the season length of fresh supply to nearly year round, reducing fatalities, and improving the market power for fishermen.74
Relative to the previous decade, both participation and harvest levels have fallen significantly. Approximately a thousand longline vessels participated in the 2014 fishery, a 42 percent reduction compared to peak participation in 1995.69
Alaska fisheries accounted for 80 percent of U.S. halibut harvests between 2005 and 2014. Harvest volumes trended downward between 2004 and 2014, but TACs increased in 2015 (Figure 56). Approximately 7,500 mt of halibut were harvested from Alaska in 2014 (Table 77), a 72 percent decline from the peak harvest of 27,500 mt in 2002 and 24 percent decline from the prior year. TACs increased 10 percent in 2015 to 8,741 mt.
73 Any reference to halibut in this profile refers to Pacific halibut specifically. 74 (Thunberg & Brinson, 2012)
Photo Courtesy of ASMI.

Alaska Groundfish and Crab Wholesale Market Profiles NOAA/NMFS • 91
Table 77. Alaska Commercial Halibut Landings, in Metrics Tons, 2010-2014 2010 2011 2012 2013 2014
IPHC Regulatory Area
2C Southeast 1,973 1,040 1,146 1,298 1,459
3A East GOA 9,114 6,472 5,302 4,910 3,336
3B West GOA 4,520 3,328 2,264 1,830 1,281
4 BSAI 2,482 2,599 1,869 1,411 1,079
CDQ Harvest 893 918 656 484 356
Total Harvest 18,982 14,356 11,237 9,933 7,510
Note: Figures are in net weight terms. Source: NMFS Alaska Region Catch Reports (RAM Division).
Figure 56. Alaska Halibut Harvests/TACs (mt), 1950-2014
Note: Figures prior to 1980 include a small amount of U.S. commercial harvest caught in Area 2 which could not be separated. Figures prior to 1995 represent harvest volume while 1995-2014 data refers to TACs; however, harvest volumes have been very close to the annual TAC in every year since 1995. All figures are in net weight terms. Source: International Pacific Halibut Commission (1950-1994) and NMFS Catch Limits (1995-2014)
Product Description and Supply Chain The largest flatfish in the sea, halibut have a mild taste with a firm, flaky texture. It is often breaded/fried but is also used in a variety of other dishes and applications. Halibut is a unique seafood protein, with no close substitutes.
Halibut are sold to consumers as fillets, steaks, and fletches (whole skinless fillets). Halibut cheeks also fetch a premium price as a sweet-flavored delicacy. Halibut are in high demand, with limited supply being the main influence on price.
Seventy-four percent of halibut processed in Alaska was sold to buyers as a headed/gutted product. Skinless/boneless fillets were the next largest product type, accounting for 12 percent of 2014 production. Other product types accounted for 14
Photo Courtesy of Garrett Evridge.
2014 0
5,000
10,000
15,000
20,000
25,000
30,000
Harv
est V
olum
e (in
mt)
Alaska Halibut Harvest/TAC

Alaska Groundfish and Crab Wholesale Market Profiles NOAA/NMFS • 92
percent of production volume and 9 percent of production value. More fresh halibut is sold due to the increase in season length as a result of the IFQ program which ended the race for fish.
Table 78. Common Halibut Products: 2014 Alaska Production Volume and Recovery Rates (Pct.)
2014 Alaska
Production (mt) 2014 Alaska
Production (Pct.) Recovery Rate
Range
Head and Gutted 4,568 74% 68-80%
Dressed (gutted only) 244 4 85-92
Fillet (no skin or ribs) 718 12 34-44
Other Fillets 132 2 34-56
Cheeks 38 1 N/A
Other Products 459 7 N/A
Source: ADF&G (COAR) and Alaska Sea Grant (Crapo, Paust, & Babbit, 1993).
Supply Chain Figure 57 illustrates the halibut supply chain, from harvesters to consumers. Alaska halibut is harvested by relatively small boats (under 60 ft.) with fixed (hook-and-line) gear. The fish are bled and gutted on board and delivered to shoreside processing plants. Halibut are then headed or processed into fillets. Freezer longliners (catcher processors) also participate in the halibut IFQ fishery. The majority of halibut is sold as a fresh or frozen product to seafood distributors. Distribution companies often cut headed/gutted halibut into fillets or steaks and sell product in relatively small lots to grocery chains and restaurants in their local area.
Some grocery chains maintain their own distribution network of trucks and warehouses. These chains are more likely to purchase halibut directly from Alaska processors. A relatively small number of grocery chains purchase headed/gutted halibut and cut the fish into portions at their stores, but most purchase portions from distributors or directly from Alaska processors. The vast majority of product sold to restaurants and other foodservice companies goes through distributors.
Figure 57. Alaska Halibut Supply Chain
Catcher Vessels
Shoreside Processors
Domestic Distributors
Grocery & Foodservice
Export Distributors

Alaska Groundfish and Crab Wholesale Market Profiles NOAA/NMFS • 93
Finally, a relatively small amount of halibut is sold directly to retail customers by fishermen, acting as direct marketers. Halibut lends itself well to direct marketing because it is a high value product from a quota-based fishery, which is already being dressed at-sea. Enterprising fishermen have the time and incentive to work with directly with customers – primarily in the lower 48 states – to sell small lots of halibut, often in boxes of 10, 25, or 50 lb. Although direct sales eliminate part of the traditional supply chain, shipping costs are often much higher than product sold in bulk.
Production Volume and Value
First Wholesale Volume and Value Production volume peaked in the late 1980s at 23,500 mt in Alaska, nearly quadruple the 2014 production volume of 6,160 mt (Figure 58). The state’s halibut wholesale production volume has averaged 16,845 mt since the IFQ program began in 1995, however, harvests declined significantly from 2005 through 2014. The 2014 wholesale production volume was 73 percent lower than peak production levels, which averaged 22,610 mt between 1986 and 1989.
Figure 58. First Wholesale Volume and Value of Pacific Halibut in Alaska, 1985-2014
Source: ADF&G (COAR).
First Wholesale Price Halibut is a high-value fish, typically worth $14,000 to $18,000 per metric ton. Prices across all segments of the supply chain are primarily tied to commercial supply, as the fish has few substitutes. Halibut prices have steadily increased over the past decade due to declining harvest volumes. General economic conditions also play a role in halibut demand.
The average first wholesale price per pound for halibut in 2014 was $8.05/lb., up 10 percent from the previous 3 year average price of $7.28/lb (Figure 59). Total first wholesale revenue for halibut was $109 million in 2014 – 40 percent below the previous 4 year average of $181 million. Alaska processors produced 6,157 mt of halibut products in 2014 – 47 percent below the previous 4 year average of 11,599 mt. Higher prices somewhat offset lower harvest volumes in 2014; however, 2014 registered the lowest first wholesale value since 1998 (in nominal terms). The overall size-at-age has decreased for halibut in the last few years as well, due to slower growth rates.75 Smaller halibut yield less product and incur higher processing and
75 (Keith, Kong, Sadorus, Stewart, & Williams, 2014)
$0
$50,000
$100,000
$150,000
$200,000
$250,000
-
5,000
10,000
15,000
20,000
25,000
1985
1986
1987
1988
1989
1990
1991
1992
1993
1994
1995
1996
1997
1998
1999
2000
2001
2002
2003
2004
2005
2006
2007
2008
2009
2010
2011
2012
2013
2014
Reve
nue
(in $
000s
)
Volu
me
(in m
t)
Wholesale Volume Wholesale Revenue
0

Alaska Groundfish and Crab Wholesale Market Profiles NOAA/NMFS • 94
handling costs. As a result, halibut pricing for H&G product is often stratified by fish size at an ex-vessel and first wholesale level.
Figure 59. Alaska Halibut First Wholesale and Ex-Vessel Price per Pound, 1995-2014
Source: ADF&G (COAR).
Regional Halibut Production
Table 79. Alaska Halibut First Wholesale Volume and Value by Top Ports/Regions, 2014
Volume (mt) Value ($thousands) Pct. of Value
Cook Inlet (Seward to Anchorage) 1,779 $32,706 30%
Kodiak 1,109 20,757 19
Petersburg/Wrangell 844 14,188 13
Northern Southeast (Juneau to Yakutat) 761 14,362 13
Sitka/Pelican/Ketchikan/Craig 631 11,864 11
Other 1,033 15,365 14
Total 6,157 $109,241 -
Source: ADF&G (COAR). Kodiak was Alaska’s top halibut port in 2014, accounting for 19 percent of total first wholesale value for Alaska. Processors in Cook Inlet, primarily Homer and Seward, buy significant volumes of halibut. Cook Inlet ports from Anchorage to Seward produced 1,779 mt of halibut products worth $32.7 million – about 30 percent of the statewide production value. The top five halibut ports/regions are shown in Table 79. In most cases ports had to be combined to maintain processors’ confidentiality.
Key Markets for Pacific Halibut Halibut is sold primarily in North American restaurants and grocery stores. In upscale restaurants, it is often served unbreaded and paired with various sauces. Many restaurants in the Pacific Northwest and other North American casual seafood eateries feature fried halibut bits. Grocery stores and specialty seafood shops typically sell halibut as fresh (or refreshed) portions in a fillet or steak format, typically offering portions of 5 to 10 oz. Estimating the relative volume of production sold into grocery or foodservice segments is not possible due to a lack of data, but each segment accounts for a significant share of wholesale purchases, according to sales representatives of Alaska processors.
$0.00
$1.00
$2.00
$3.00
$4.00
$5.00
$6.00
$7.00
$8.00
1995
1996
1997
1998
1999
2000
2001
2002
2003
2004
2005
2006
2007
2008
2009
2010
2011
2012
2013
2014
Ex-Vessel Price per lb Wholesale Price per lb

Alaska Groundfish and Crab Wholesale Market Profiles NOAA/NMFS • 95
Halibut fillets/steaks account for a majority of the fish’s retail value, but the cheeks of larger halibut are also considered a valuable delicacy. Some processors find industrial markets for halibut heads and frames, but most of these excess fish parts are ground and discharged as waste.
North America The vast majority of Alaska halibut production is sold into North American markets. The United States is the largest market - typically consuming between 80 and 90 percent of total production. Canada is the second-largest market for Alaska halibut, with annual exports averaging 1,390 mt and $12.1 million between 2011 and 2013.76 A portion of halibut exported to Canada may be subsequently re-exported to the United States by Canadian distributors. It is not possible to assess whether halibut imported into the United States from Canada was caught in Alaska or Canada. Regardless, Canada consumes a significant amount of halibut on a per capita and total basis relative to other (non-U.S.) markets.
Upscale grocery chains - such as Whole Foods - account for a disproportionally larger share of sales. Grocery sales of halibut are heaviest between late March through July. Most halibut sold “on special” in grocery stores is priced between $17 and $20 per pound, whereas normal retail pricing on halibut typically exceeds $20 per pound. Selling fillet and steak portions in 5 to 10 oz increments allows retailers to keep unit prices closer to the $10 range. Prices for halibut served at restaurants vary significantly, depending on the establishment and the portion size. Most full-service restaurants offer breaded/fried halibut pieces starting at $12 per piece, while more advanced preparations of 5 to 10 oz portions typically start around $30.
Figure 60 illustrates the trend of declining supply and increasing wholesale prices for halibut. There is a strong relationship over time; however, the data does suggest there is a maximum price that wholesale buyers are willing pay. Prices increased sharply from 2009, coming out of the global recession, through 2011. Despite a recovering economy and declining halibut supplies, wholesale prices remained relatively static, ranging from $7.50 to $8.50 per pound. These data indicate there is price resistance above $8.50 per pound.
Figure 60. North American Halibut Supply and Wholesale Price, 2005-2015
Note: Wholesale price reflects average monthly fresh price of 20-40 lb. halibut, boxed, FOB Seattle. 2015 price data reflects average wholesale price through mid-July. Source: IPHC (2014) and Urner Barry.
The U.S. market typically consumes 80 to 90 percent of U.S. halibut production (Table 80). U.S. market share has been steady, outside of 2011, when the U.S. dollar was generally weaker relative to the Canadian dollar.
76 (Fisheries and Oceans Canada, 2013)
$2.00
$3.00
$4.00
$5.00
$6.00
$7.00
$8.00
$9.00
$10.00
0
10
20
30
40
50
60
70
80
2005 2006 2007 2008 2009 2010 2011 2012 2013 2014 2015
Avg.
Who
lesa
le P
rice/
lb.
Mill
ion
lb. (
Net
Wei
ght)
Commercial Halibut TAC (U.S. & Canada) Average Wholesale Fresh Price/lb.

Alaska Groundfish and Crab Wholesale Market Profiles NOAA/NMFS • 96
It is also possible that Canadian distributors held more halibut product as inventory in 2011. Total U.S. halibut supply declined 45 percent between 2010 and 2014, due to lower harvest volumes. As halibut harvests have declined, trade data suggests that the U.S. market is likely absorbing virtually all U.S. production and perhaps some Canadian production as well.
Table 80. Estimated U.S. Halibut Market Supply (mt), 2010-2014
Year Est. U.S.
Wholesale Production
U.S. Imports U.S. Exports Est. U.S. Supply U.S. Pct. Of Total Supply
2010 19,192 4,976 9,362 14,806 77%
2011 14,563 4,359 9,460 9,463 65%
2012 11,537 4,172 5,392 10,318 89%
2013 10,194 4,868 4,823 10,239 100%
2014 7,860 4,463 4,149 8,174 104%
Five-year Average 12,669 4,568 6,637 10,600 87%
Note: All volume figures have been converted to a net weight (H&G) basis for comparability purposes. A relatively small amount of other flatfish (Atlantic halibut or Greenland turbot) may be included in import/export figures. Source: NMFS (OST), NMFS Foreign Trade Data, and McDowell Group estimates.
Outside of North America, halibut are occasionally exported to upscale seafood buyers in Europe and Southeast Asia who are expected to feature prominent seafood from around the world. However, these are small, niche markets collectively buying about 1 percent of total Alaska halibut production.
Global Production and Competing Supply In 2014, the United States harvested 8,016 mt of Pacific halibut while Canada harvested 2,620 mt, for a total production of 10,627 mt (in net weight terms). Over the last 5 years, Alaska harvested 79 percent of global Pacific halibut production (Figure 61). Current harvest levels for each major production area are much lower
Figure 61. Global Supply of Pacific Halibut (mt), 1950-2013
Note: Figures have been converted to net weight terms using a 75 percent conversion factor. Percent share of harvest based on most recent 5 year average. Sources: Alaska (1950-1994: IPHC (2014), 1995-2014 NMFS OST), U.S. West Coast (NMFS OST), and Canada (1950-2013: FAO, 2014: IPHC (2014)).
0
5,000
10,000
15,000
20,000
25,000
30,000
35,000
40,000
1950
1952
1954
1956
1958
1960
1962
1964
1966
1968
1970
1972
1974
1976
1978
1980
1982
1984
1986
1988
1990
1992
1994
1996
1998
2000
2002
2004
2006
2008
2010
2012
2014
Met
ric T
ons
Alaska U.S. West Coast Canada
5-Year Harvest Avg. 79% Alaska 3% U.S. West Coast 18% Canada

Alaska Groundfish and Crab Wholesale Market Profiles NOAA/NMFS • 97
than historical averages, which has led to higher prices. Alaska’s 2014 was 62 percent below its 2004-2013 average, while Canada and the U.S. West Coast posted harvests 33 percent and 27 percent below their prior 10-year average, respectively.
In terms of competing species, Pacific halibut does not have much competition due to its unique taste and texture. However, Atlantic halibut have a similar taste profile and can be generically marketed as halibut, thus obtaining a premium price. Atlantic halibut tend to be smaller, but with decreasing size-at-age trends for Pacific halibut the two species have a greater volume of similarly sized fillets.
Historically Atlantic halibut harvests have been relatively small compared to Pacific halibut. However, with declining Pacific halibut harvests the Atlantic species now accounts for a larger share of total halibut production. Atlantic halibut made up 25 percent of total halibut production in 2013, up from 10 percent in 2004 (Figure 62).
Figure 62. Pacific and Atlantic Halibut Harvest Volume (mt), 2004-2013
Note: Figures in round weight. Source: FAO.
In addition to wild capture fisheries, there have been halibut aquaculture ventures in Europe raising Atlantic halibut as an alternative to wild halibut. Due to slow maturity rates and other technical difficulties associated with farming halibut, aquaculture production remains relatively inconsequential.
0
10,000
20,000
30,000
40,000
50,000
60,000
2004 2005 2006 2007 2008 2009 2010 2011 2012 2013
Met
ric T
ons
Pacific Halibut Atlantic Halibut

Alaska Groundfish and Crab Wholesale Market Profiles NOAA/NMFS • 98
Wholesale Market Profile for Ancillary Products
Investments in the processing infrastructure to produce fish meal, fish oil, and other ancillary products were largely completed in parallel with growth of the domestic pollock and other groundfish fisheries in the 1990s. Eighty-two percent of Alaska ancillary products are derived from the state’s vast pollock fishery. Roughly 10 percent of the value of pollock products produced in Alaska are derived from ancillary products.
Despite the substantial size of Alaska’s pollock and groundfish fisheries, the state is a small player in the global market for fish meal and fish oil, which are primarily for aquaculture feed. Though currently small in comparison, a growing market exists for nutritional supplements for human consumption, such as fish oil capsules. There are also sizable markets in Asia for niche products like stomachs, milt, collars, and heads from cod, pollock, and other species.
Table 81. Summary Profile of Ancillary Products Wholesale Production and Markets, 2014
Value and Volume Key Products Fish Meal Fish Oil Other
First Wholesale Production (mt) 126,180 Pct. of Value 65% 20% 15%
First Wholesale Value ($millions) $188.4 Key Meal Markets Japan China Korea
Pct. of Alaska Groundfish Value 7.7% Pct. of 1st Sales 7% 66% 27%
Pct. Increase in Value since 2005 88.2% YOY Change 15% 1% 19%
Total Production of Alaska Ancillary Products Alaska groundfish are primarily harvested in the Bering Sea and Gulf of Alaska using trawl gear. Japanese and other foreign fishermen dominated this fishery until the 200-mile EEZ was established by the Magnuson-Stevens Act of 1977, eliminating foreign fishing vessels in U.S. waters. Commercial fishing efforts remained a joint venture with Japanese vessels until the late 1980s when the fishing fleet became entirely U.S. based. Fishing efforts between 1977 and 1987 were minimal, but quickly ramped up in the late 1980s and early 1990s. Since 1990, an average of 580,400 mt of pollock were harvested each year — a number that has stayed relatively stable.
Roughly 5 percent of Alaska groundfish harvests, by volume, end up as marketable ancillary products. Ancillary product production levels in 2014 roughly match those from 2005, but increases in prices have led to a 88 percent increase in total first wholesale value over that time period (Figure 63 and Table 82).
The numbers presented in this analysis provide best estimates for production levels of various Alaska groundfish ancillary products. However, it should be noted that available first wholesale data apply only to ancillary products produced by primary processors in Alaska and does not include any production by subsequent processors. Secondary production of ancillary products is likely to occur when groundfish are sold in a minimally processed state such frozen headed and gutted (H&G) product to reprocessing markets. For Alaska groundfish, the predominant reprocessing markets are in Asia but these markets also exist domestically. For example, the major processors on Kodiak Island jointly own a fish meal plant, which is not considered a primary processor and does not report first wholesale production data to the Alaska Department of Fish & Game. In the case of Kodiak’s fish meal plant, another data source was available (NOAA Office of Science and Technology) and the fish meal production data presented in this report does include secondary production from the Kodiak plant. Other than the fish meal produced at the Kodiak plant, no other production from secondary processors is included in the production estimates presented here.

Alaska Groundfish and Crab Wholesale Market Profiles NOAA/NMFS • 99
Figure 63. First Wholesale Volume and Value of Ancillary Products from Alaska Groundfish, 2005-2014
Table 82. First Wholesale Value and Ancillary Products as Percent of Total Wholesale Value, 2005-2014 2005 2006 2007 2008 2009 2010 2011 2012 2013 2014
Value ($millions) $100.1 $128.1 $117.7 $107.0 $97.5 $135.6 $178.0 $175.6 $180.3 $188.4
Pct. Ancillary Products 4.7% 5.7% 5.1% 4.4% 5.2% 6.4% 6.6% 6.5% 7.8% 7.7%
Source: ADF&G (COAR) and NMFS (OST).
Key Species Eighty-two percent of the total value of Alaska’s ancillary products in 2014 ($188.4 million) was derived from Alaska pollock and 14 percent from Pacific cod. The remaining 4 percent was composed of a mixture of various flatfish and other groundfish species, such as flounder, rockfish, sablefish, Atka mackerel, shark, sole, and squid (Figure 64).
For comparison, ancillary products derived from Alaska salmon totaled $13.7 million in 2014.
Figure 64. Alaska Ancillary Product Wholesale Production Value, by Key Species, 2005-2014
$0
$200
$400
$600
$800
$1,000
$1,200
$1,400
$1,600
$1,800
0
20,000
40,000
60,000
80,000
100,000
120,000
140,000
2005 2006 2007 2008 2009 2010 2011 2012 2013 2014
Valu
e/m
t
Volu
me
(in m
t)
Volume (mt) Value/mt
Pollock82%
Flatfish2%
Pacific Cod 14%
Other Groundfish 2%
Value $188.4 million
Pollock84%
Flatfish1%
Pacific Cod 13% Other Groundfish 2%
Volume 126,178 mt
Source: ADF&G (COAR) and NMFS (OST).

Alaska Groundfish and Crab Wholesale Market Profiles NOAA/NMFS • 100
Figure 65. Alaska Ancillary Product First Wholesale Value and Volume, by Key Groundfish Species, 2014
Notes: Flatfish includes various species of flounder, sole and turbot. Source: ADF&G (COAR) and NMFS (OST).
Key Products Analysis Fish meal is the dominant ancillary product in Alaska’s groundfish fisheries, accounting for 70 percent of the value of all ancillary products produced in 2014. Fish oil is a clear second, at 17 percent, followed by collars, chins, & cheeks; bones and heads; milt; and internal organs (Figures 66 and 67). The composition of product types has stayed fairly steady over the last decade, with the exception of internal organs which accounted for 15 percent of the total value of ancillary products in 2012, but only 1 percent in 2014. Fish meal and fish oil, which are described in more detail below, have increased substantially in value, primarily due to growth of the aquaculture industry.
Figure 66. Alaska Groundfish Ancillary Product First Wholesale Value, by Product Type, 2005-2014
Source: ADF&G (COAR) and NMFS (OST).
$0
$20
$40
$60
$80
$100
$120
$140
$160
$180
$200
2005 2006 2007 2008 2009 2010 2011 2012 2013 2014
Valu
e (in
$m
illio
ns)
Other Groundfish Species Pacific Cod Pollock
$0
$20
$40
$60
$80
$100
$120
$140
$160
$180
$200
2005 2006 2007 2008 2009 2010 2011 2012 2013 2014
Valu
e ($
mill
ions
)
Bones and Heads Collars Chins Cheeks Fish Meal Fish Oil Stomachs Milt

Alaska Groundfish and Crab Wholesale Market Profiles NOAA/NMFS • 101
Figure 67. Alaska Ancillary Product First Wholesale Value and Volume, by Product Type, 2014
Source: ADF&G (COAR) and NMFS (OST).
Fish Meal Alaska fish meal is a shelf-stable product produced by cooking, pressing, drying, and milling fish trimmings, such as heads, viscera, frames, and skins. As opposed to most fish meal produced globally, Alaska fish meal is produced from fish residues rather than whole fish. Fish meal and oil production in Alaska occurs at shore-based processors as well as onboard catcher-processors.
According to IFFO (The Marine Ingredients Organization), fish meal typically consists of between 60-70 percent protein, 10-20 percent ash, and 5-12 percent fat.77 Fish meal from Alaska groundfish has been measured at 70 percent protein, 8 percent ash (mostly calcium and phosphorous), 17 percent fat, and 6 percent moisture.78
In 2012, it was estimated that 68 percent of global uses of fish meal were attributable to aquaculture, followed by feed for chickens (23 percent) and pigs (7 percent).79 As of 2009, of the fishmeal used in aquaculture, 27 percent went to feed salmon and trout, 26 percent to crustaceans, 26 percent to various species of marine fish, 6 percent to tilapia, 5 percent to eels, 4 percent to cyprinids, and 6 percent to other species.80 Other feeds used in aquaculture include plant-based meals, starches, and oils; direct application of fish and fish wastes; algae grown for consumption by herbivorous species; and various other feed types.
Production In 2014, Alaska produced 76,617 mt of fish meal, over 92 percent of which was derived from Alaska pollock. From 2005 to 2014, Alaska fish meal production from groundfish declined by roughly 12 percent, though
77 (IFFO, 2015) 78 (Sheperd, 2014) 79 (Tacon, 2015) 80 (IFFO, 2015)
Photo Courtesy of Unisea.
Bones and Heads4%
Collars Chins Cheeks
6%
Fish Meal69%
Stomachs1%
Milt3%
Fish Oil17%
Value: $188.4 million
Bones and Heads8%
Collars Chins
Cheeks5%
Fish Meal61%
Stomachs1%
Milt3%
Fish Oil22%
Volume126,178 mt

Alaska Groundfish and Crab Wholesale Market Profiles NOAA/NMFS • 102
increasing prices almost tripled the value of fish meal produced in Alaska over that time period, to $130.5 million in 2014 (Figure 68 and Table 83).
Approximately 60 percent of fish meal production occurred at shoreside processors in 2014, with the remaining occurring at sea. Despite increased prices for fish meal, few of the catcher-processors without fishmeal plants have added them in recent years. Adding a fish meal plant generally requires splitting a ship in half and adding a section to the middle to find space for the necessary equipment.
Figure 68. Alaska Fish Meal Production and Value, 2005-2014
Table 83. Alaska Groundfish Fish Meal First Wholesale Value, in $Millions, 2005-2014 2005 2006 2007 2008 2009 2010 2011 2012 2013 2014
$63.0 $81.8 $75.7 $61.9 $57.2 $84.7 $105.5 $98.4 $124.6 $130.5
Source: ADF&G (COAR) and NMFS (OST).
Table 84. First Wholesale Value per Metric Ton of Alaska Fish Meal Products, by Species, 2014
Value ($/mt)
Pollock $1,715
Pacific Cod $1,312
Other Groundfish Species $2,023
Total Groundfish Meal $1,704
Salmon Fish Meal $1,559
Salmon Fish Meal Production (mt) 4,108
Source: ADF&G (COAR).
Market Analysis In 2014, 87 percent of Alaska fish meal was exported to Asia for use in aquaculture feed. In particular Alaska fish meal is used in eel and turtle farming, due to unique properties that separate it from other fish meals, such as the redfish meals produced by the anchovy fisheries off the coast of South America. Unique properties of Alaska whitefish meal include the ability to mix with other ingredients to form a particularly sticky, cohesive dough – the preferred feeding method for eels.
$0
$200
$400
$600
$800
$1,000
$1,200
$1,400
$1,600
$1,800
$2,000
0
10,000
20,000
30,000
40,000
50,000
60,000
70,000
80,000
90,000
100,000
2005 2006 2007 2008 2009 2010 2011 2012 2013 2014
Valu
e/m
t
Volu
me
(mt)
Volume (in mt) Value/mt

Alaska Groundfish and Crab Wholesale Market Profiles NOAA/NMFS • 103
China – which typically receives close to 70 percent of Alaska fish meal exports (Figure 69) – accounted for 60 percent of global aquaculture production in 2012.81 Exports to China have decreased slightly in recent years to 63 percent, due in part to increasingly strict testing requirements of imports. Exports to China in 2015 are expected to further decline due to higher prices as a result of a stronger U.S. dollar (Table 85).
In 2014, 30 percent of Alaska fish meal exports went to South Korea, a proportion that has increased since 2004 when 20 percent went to the country. Japan is the third largest importer of Alaska fish meal, at 7 percent in 2014 – down from 15 percent in 2004. Some of these imports are used domestically in South Korea and Japan but the majority are shipped on to China and other countries in Asia.
Figure 69. Exports of Alaska Fish Meal, 2010-2014
Table 85. Exports of Alaska Fish Meal, 2010-2014
2010 2011 2012 2013 2014
Export Volume (mt) 48,846 65,092 67,055 63,251 67,305
Export Value ($thousands) $65,047 $85,020 $90,586 $98,767 $99,747
Average Export Value per Metric Ton ($US) $1,332 $1,306 $1,351 $1,562 $1,482
Source: ASMI Alaska Seafood Export Database.
In 2014, the United States imported 53,367 mt of fish meal worth $87.2 million, primarily from Mexico and Chile. These imports generally enter the United States through ports in the Southeast and Southwest, as well as ports along the Mississippi River, and are destined for use in pig and chicken farming, as well as other agricultural uses.82 It is likely that most of the domestic sales of Alaska groundfish meal end up in the U.S. agriculture market.
Global Production and Competing Supply Analysis Globally, an estimated 4.3 million metric tons of fish meal was produced in 2014.83 Peru and Chile accounted for 31 percent of global production, primarily from vast anchovy fisheries directed at the fish meal and fish oil markets. As of 2012, roughly 10 percent of global wild capture fish production was directed toward fish meal and fish oil, a percentage that has been declining as more fish production is directed toward human
81 (Tacon, 2015) 82 NOAA Foreign Trade data. 83 (Indexmundi, 2015)
China66.4%
Japan6.7%
South Korea26.6%
Vietnam0.3%
Export Share by Volume
$0
$20,000
$40,000
$60,000
$80,000
$100,000
$120,000
0
20,000
40,000
60,000
80,000
100,000
120,000
2010 2011 2012 2013 2014
Expo
rt V
alue
($00
0s)
Export Volume (mt) Export Value ($000s)

Alaska Groundfish and Crab Wholesale Market Profiles NOAA/NMFS • 104
consumption.84 Despite this trend, global fish meal production levels remain steady due to strong prices and increased production of fish meal from previously discarded fish residues. As of 2012, 35 percent of global fish meal production was derived from fish residues as opposed to whole fish processed specifically for fish meal and fish oil.
The United States is a small player in the global fish meal market, producing 345,000 mt in 2014 or roughly 8 percent of global production.85 Alaska’s groundfish meal production in 2014 accounted for roughly 1.3 percent of global production. The largest proportion of U.S. fish meal and fish oil production comes from menhaden caught in the Gulf of Mexico and Western Atlantic.
Fish meal prices have remained high due to its importance in farmed fish and animal diets and the rapid growth of the aquaculture industry. While the aquaculture industry has increased its use of plant-based feeds in recent years, fish meal plays an important role as a nutritious and healthy feed, as well as for imparting flavor during the last stage of fish culture. Generally, fish meal is traded at 3-4 times the price of its major substitute, soymeal.
Fish Oil Almost all fish oil produced from Alaska groundfish is derived from pollock (98 percent in 2014), and is generally produced as a part of the process that leads to fish meal production.
The process involves cooking and pressing fish residues (leftover waste streams) to remove the liquid phase, which is spun and processed to remove any remaining solids and separate the oil and water. The solid phase left behind contains up to 10 percent oil and is made into fish meal or, in the case of catcher-processors without fish meal plants, ground and dumped overboard.
The majority of the fish oil produced from Alaska groundfish could be termed crude fish oil. Further refinement is necessary to produce a product that is fit for human consumption, including heat, sterilization, and purification steps as well as the addition of antioxidants to protect the oil from degradation. In addition, processes to concentrate and refine the oil can be employed to increase the omega-3 fatty acid percentage, which starts at roughly 28 percent in Alaska groundfish oil and is increased to up to 80 percent or more for pharmaceutical fish oil products.86
Some producers in Alaska are producing even higher quality fish oils, using processing equipment and techniques dedicated to the human nutritional supplement market, including Trident Seafoods (from salmon heads and pollock livers) and Bering Select (from cod livers, starting in 2015). These advanced processes involve increased attention to the quality of raw materials, food-grade sanitation in the processing line, and special separation and preservation techniques designed to produce a higher quality product. The end product is an oil with its natural triglycerides intact.
Production Approximately 28,500 mt of fish oil, worth $32 million, was produced from Alaska groundfish in 2014 — a 271 percent increase in value over 2005 (Figure 70 and Table 86).87 The dramatic rise in total first wholesale value for Alaska groundfish is a result of increased production as well as increased prices, which rose from an average of $436/mt in 2004 to $1,130/mt in 2014.
Shoreside processors produced 58 percent of the groundfish oil produced in Alaska in 2014. The percentage of fish oil produced at-sea has increased from 9 percent in 2004 (totaling 1,800 mt) to 42 percent in 2014
84 (FAO, 2014) 85 (Liddel and Lowther, 2014) 86 Interview with domestic seafood product manufacturer. 87 For reference, 943 mt of fish oil was produced from salmon in Alaska in 2014.

Alaska Groundfish and Crab Wholesale Market Profiles NOAA/NMFS • 105
(roughly 12,000 mt). The majority of this change occurred from 2008 through 2010 when a number of at-sea catcher-processors added fish oil plants to their processing lines.
Figure 70. First Wholesale Value and Volume of Alaska Groundfish Fish Oil Production, 2005-2014
Table 86. Total First Wholesale Value of Alaska Groundfish Oil Production, in $Millions, 2005-2014 2005 2006 2007 2008 2009 2010 2011 2012 2013 2014
$8.7 $14.4 $12.4 $15.7 $13.3 $18.8 $24.6 $23.0 $29.5 $32.3
Source: ADF&G (COAR).
Market Analysis In 2010, the latest year for which data are available, roughly 70 percent of global fish oil was consumed by aquaculture, with direct human consumption (25 percent) and other uses (5 percent) accounting for the remainder.88 Since 2010, the percentage sold for direct human consumption has grown as public appreciation for the health benefits of fish oil has increased.
Roughly 41 percent (11,800 mt) of Alaska groundfish oil production was sold domestically in 2014. According to industry representatives, these sales went to the human nutritional supplement market.89
The remaining portion of Alaska’s groundfish oil production was exported in 2014 (16,790 mt), which is attributable to aquaculture feeds. Fish oil is widely used in aquaculture, especially for salmon and trout farming: in 2010, it was estimated that 69 percent of global fish oil use by aquaculture was used in salmon and trout farming operations, followed by 16 percent for farming of other sea fish, and 5 percent or less for crustaceans, eels, tilapia, and other freshwater fish.
Over the last 5 years (2010-2014), 46 percent of fish oil produced was sent to Asian markets, followed by 40 percent to Canada (Figure 71). The Canadian sales can be assumed to feed salmon farms, whereas major uses in Asia include other sea fish (for example, yellowtail tuna raised in pens off the coast of Japan and other places), marine shrimps, eels, and other species.
88 (Tacon, 2015) 89 Interview with domestic seafood product manufacturer.
$0
$200
$400
$600
$800
$1,000
$1,200
$1,400
0
5,000
10,000
15,000
20,000
25,000
30,000
35,000
2005 2006 2007 2008 2009 2010 2011 2012 2013 2014
Valu
e/m
t
Volu
me
(mt)
Volume (in mt) Value/mt

Alaska Groundfish and Crab Wholesale Market Profiles NOAA/NMFS • 106
Figure 71. Exports of Alaska Fish Oil, 2010-2014
2010 2011 2012 2013 2014
Export Volume (mt) 11,340 9,670 10,459 12,016 16,790
Export Value ($thousands) $13,360 $14,785 $19,327 $22,826 $25,223
Average Export Value per Metric Ton ($US) $1,178 $1,529 $1,848 $1,900 $1,502
Notes: Pie chart represents portions by volume exported to each country or region. Europe includes exports to Denmark, Finland, Germany, Iceland, and Norway. Central and South America includes exports to Chile, Peru, and Mexico. South Asia includes exports to Thailand, Vietnam, and Indonesia. Source: ASMI Alaska Seafood Export Database.
Global Production and Competing Supply Analysis In 2012, the most recent year for which data were available, 902,000 mt of fish oil was produced globally. Roughly 40 percent resulted from production in Chile and Peru (mostly from anchovies), followed by 15 percent from Scandinavia, 7 percent from the United States, 6 percent from Japan, and 35 percent from various other countries.90 Globally, Alaska is a small player in the global fish oil market, accounting for roughly 3 percent of global production.
While global fish oil production levels are relatively stable, they are subject to considerable fluctuation due to the impacts of El Niño cycles on Peruvian and Chilean anchovy fisheries.
The major global market for fish oil is the aquaculture industry, especially salmon farming. While the industry continues to grow substantially, the high price of fish oil has led to increasing substitution, primarily with rapeseed oil. Research suggests that while fish oil is very important to fish nutrition, the minimum requirements can be met by small amounts of fish oil, such as the 5+ percent generally present in fish meal.
The second largest market for fish oil is the nutraceutical market, which grew considerably in the last decade. Growth in the nutraceutical market is expected to drive increasing global demand for fish oil, which is a limited resource and the only major current source of essential omega-3 fatty acids.91
90 (Sheperd, 2014) 91 (Sheperd, 2014)
Canada40%
Central and South …
South Korea15%
China14%
South Asia5%
Japan12%
Europe6%
Export Share by Volume
$0
$5,000
$10,000
$15,000
$20,000
$25,000
$30,000
0
5,000
10,000
15,000
20,000
25,000
30,000
2010 2011 2012 2013 2014
Export Volume (mt) Export Value ($000s)
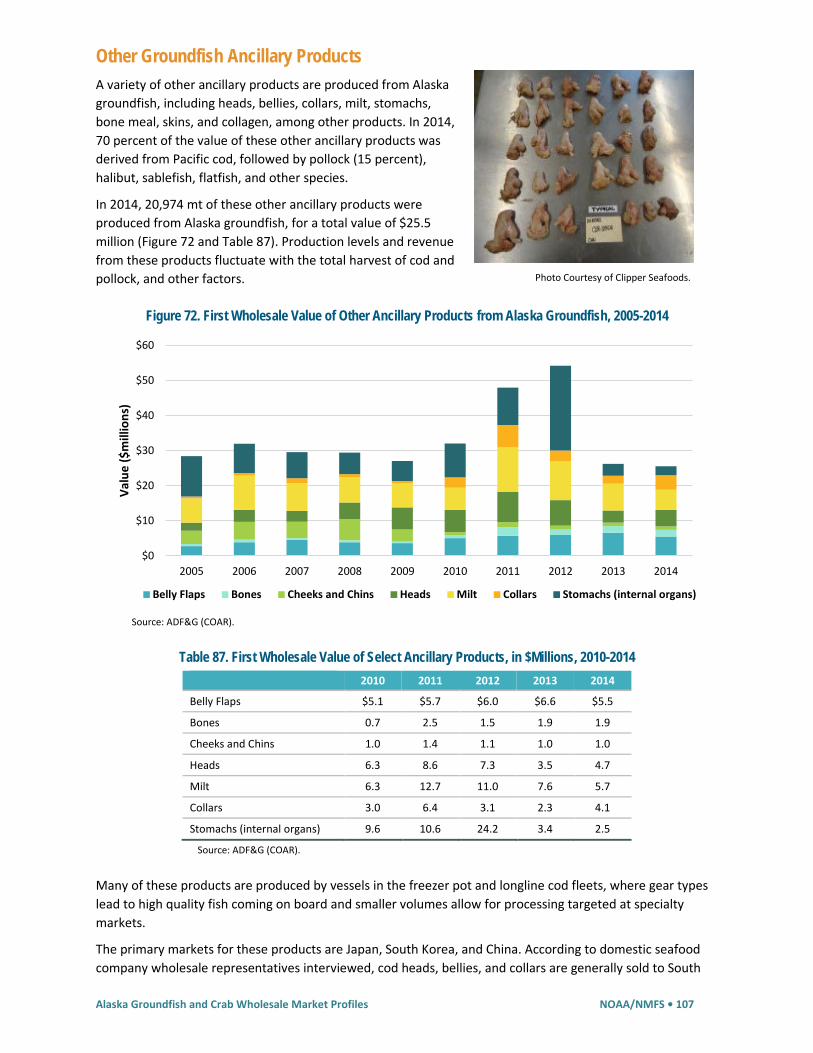
Alaska Groundfish and Crab Wholesale Market Profiles NOAA/NMFS • 107
Other Groundfish Ancillary Products A variety of other ancillary products are produced from Alaska groundfish, including heads, bellies, collars, milt, stomachs, bone meal, skins, and collagen, among other products. In 2014, 70 percent of the value of these other ancillary products was derived from Pacific cod, followed by pollock (15 percent), halibut, sablefish, flatfish, and other species.
In 2014, 20,974 mt of these other ancillary products were produced from Alaska groundfish, for a total value of $25.5 million (Figure 72 and Table 87). Production levels and revenue from these products fluctuate with the total harvest of cod and pollock, and other factors.
Figure 72. First Wholesale Value of Other Ancillary Products from Alaska Groundfish, 2005-2014
Source: ADF&G (COAR).
Table 87. First Wholesale Value of Select Ancillary Products, in $Millions, 2010-2014 2010 2011 2012 2013 2014
Belly Flaps $5.1 $5.7 $6.0 $6.6 $5.5
Bones 0.7 2.5 1.5 1.9 1.9
Cheeks and Chins 1.0 1.4 1.1 1.0 1.0
Heads 6.3 8.6 7.3 3.5 4.7
Milt 6.3 12.7 11.0 7.6 5.7
Collars 3.0 6.4 3.1 2.3 4.1
Stomachs (internal organs) 9.6 10.6 24.2 3.4 2.5
Source: ADF&G (COAR).
Many of these products are produced by vessels in the freezer pot and longline cod fleets, where gear types lead to high quality fish coming on board and smaller volumes allow for processing targeted at specialty markets.
The primary markets for these products are Japan, South Korea, and China. According to domestic seafood company wholesale representatives interviewed, cod heads, bellies, and collars are generally sold to South
Photo Courtesy of Clipper Seafoods.
$0
$10
$20
$30
$40
$50
$60
2005 2006 2007 2008 2009 2010 2011 2012 2013 2014
Valu
e ($
mill
ions
)
Belly Flaps Bones Cheeks and Chins Heads Milt Collars Stomachs (internal organs)

Alaska Groundfish and Crab Wholesale Market Profiles NOAA/NMFS • 108
Korea for soups and other uses. Markets dominated by the Japanese include cod milt and cod stomachs, though some of these products are also sold in Eastern Europe.
As Alaska processors continue to innovate, it is expected that additional ancillary products will be produced, especially ones targeted at the nutraceutical and beauty markets, as has been seen in other parts of the world. For example, Westward Seafoods recently began marketing a nutritional supplement called Alyeska Alaskan Hydrolyzed Fish Collagen, which is manufactured primarily from pollock skins.

Alaska Groundfish and Crab Wholesale Market Profiles NOAA/NMFS • 109
Wholesale Market Profile for Snow Crab
Snow crab, including both Chionoecetes bairdi and Chionoecetes opilio species, are harvested primarily in federally-managed fisheries in the Bering Sea, though smaller state-managed bairdi fisheries exist around Kodiak and Southeast Alaska. Snow crab is the most valuable and most abundant of all commercial crab species in Alaska, with 56.8 million lb harvested worth $233.3 million in first wholesale value in 2014 (combined harvest and first wholesale value of opilio and bairdi).
Table 88. Summary Profile of Alaska Snow Crab Wholesale Production and Markets
Value and Volume (CY2014) Species Harvested (2014/2015 Season) Opilio Bairdi
First Wholesale Production (millions lb.) 44.1 Pct. of Volume 82% 18%
Pct. of Global Snow Crab Harvest (CY2013) 15% Processing Regions (CY2014)
Bering Sea
Dutch Harbor Other
First Wholesale Value ($millions) $233.3 Pct. of Processed Volume 47% 41% 12%
Pct. Change in Value from Prior 4-yr Avg. 8% Key Markets: U.S., Japan, China (mostly reprocessing)
Pct. of Alaska Crab Value 62% Competing Species: Canadian and Russian snow crab
Sources: ADF&G (COAR) and McDowell Group estimates.
Fishery Summary Snow crab are harvested with pots at depths typically ranging from 240 feet to 360 feet. These steel cages (typically 7’x7’x3’) are baited with Pacific cod, herring, or salmon, and placed on the ocean floor for 24 hours or longer. A line runs from the pot to a buoy floating at the ocean surface, allowing for retrieval by a fishing vessel.
Each year, the total allowable catch (TAC) of snow crab is set by the National Marine Fisheries Service (NMFS) and the Alaska Department of Fish & Game (ADF&G) through the North Pacific Fishery Management Council (NPFMC). Included in these TACs is a portion of the annual quota allocated to Community Development Quota (CDQ) groups.
Once the annual TACs have been established, crab vessels traditionally focus on king crab when the season opens on October 15th until the harvest is complete, typically sometime in November. Following the king crab harvest, fisherman will either take a break or fish cod before transitioning to snow crab harvest, usually after the first of the year. King crab and snow crab are harvested with the same pots after modifications are made which compensate for the size difference between king and snow crab.
Opilio versus Bairdi versus Tanner versus Queen crab?
One confusing aspect to snow crab are the different names used to describe the crab by fishermen, fishery managers, and marketers. The following descriptions and background information may help:
• Snow crab is the most common market term, and can apply to any of the seven crab species in the Chionecetes genus.
• In Alaska, the names Tanner and bairdi are typically used interchangeably while snow crab refers only to opilio.
• Bairdi crab are typically larger and less abundant, but with a wider distribution than opilio crab in Alaska.
• Opilio account for the vast majority of global snow crab production. Canada is the largest producer where the species is also known as Queen crab.
Where possible, opilio and bairdi are differentiated in this report. References to snow crab include both species (opilio and bairdi).

Alaska Groundfish and Crab Wholesale Market Profiles NOAA/NMFS • 110
In 2006, federal snow crab fisheries in the Bering Sea were rationalized with allocations based upon historical harvests. Previous to this transition, season lengths were compressed into a short period of competitive fishing which compromised both safety and product quality as fisherman had to fish regardless of weather and processors were often overwhelmed by high volumes landed over very short periods.
Commercial harvest of Alaska crab was pioneered by Japanese and Russian fleets using tangle nets starting in the 1930s. Domestic harvest began in the late 1940s, and by the early 1960s U.S. fishermen dominated the fishery.92 Around the same time, the use of trawl and tangle nets for harvesting crab were outlawed and only males meeting a size requirement could be retained. With the passing of the 1976 Magnuson-Stevenson Act, foreign vessels were prevented from harvesting Alaska crab. The domestic fleet focused mainly on king crab harvest in these early years, with significant harvest of snow crab beginning in the mid-1970s.
The snow crab fishery in Alaska increased substantially following the steep reduction in king crab harvest in the early 1980s. Landings (mainly in the Bering Sea) grew steadily through the 1980s before peaking in 1991 with a record harvest of more than 368 million lb. Following this peak, volume fluctuated, climbing to approximately 243 million lb before trending down to a low of 25 million lb in 2004. Since that time, harvests have trended upward, recovering to more than 93 million lb in 2012 (Figure 73).
Figure 73. Annual Snow and King Crab Harvests in Alaska, in Millions lb., 1967-2014
Sources: NMFS (1967-2013) and McDowell Group estimates (2014).
92 (Zimmermann, Dew and Malley, 2009)
0
50
100
150
200
250
300
350
400
1967
1969
1971
1973
1975
1977
1979
1981
1983
1985
1987
1989
1991
1993
1995
1997
1999
2001
2003
2005
2007
2009
2011
2013
Harv
est (
mill
ions
lb.)
Snow Crab King Crab
Photo Courtesy of ASMI.

Alaska Groundfish and Crab Wholesale Market Profiles NOAA/NMFS • 111
Federally managed snow crab fisheries in the Bering Sea are Alaska’s largest, typically accounting for more than 90 percent of the state’s total snow crab harvest. Of all Alaska snow crab fisheries, the Bering Sea opilio fishery is the most significant in terms of harvest volume, averaging 63.5 million lb annually from 2010 to 2014 (Table 89). Harvests in federal fisheries for bairdi in Eastern and Western Bering Sea areas have have increased drastically in recent years after being closed from 2010 to 2013. The combined TAC in federally-managed bairdi fisheries jumped to nearly 20 million lb in the 2015/2016 season. Bairdi now represents roughly one-third of all Alaska snow crab TACs, whereas prior to the 2015/2016 it had not exceeded 20 percent of the total TAC. The percentage of TAC caught has also been rising in the fishery, as full exploitation of the allowable bairdi catch has only been approached in the last few seasons.
The smaller, state-managed tanner/bairdi crab fisheries in Southeast, Kodiak, and the Alaska Peninsula have averaged just over 3 million lb annually from 2010 to 2014. While harvest volumes from Southeast have been stable over the last 5 years, fisheries near Kodiak and the Alaska peninsula have often been closed.
Table 89. Alaska Snow Crab Harvest/TAC for Federal and State Fisheries, in Millions lb., 2011-2016
CY2011 Harvest
CY2012 Harvest
CY2013 Harvest
CY2014 Harvest
CY2015 Harvest
CY2016 TACs
Federal Fisheries 51.3 82.1 66.6 56.8 81.6 60.3
Bering Sea Snow Crab (opilio) 51.3 82.1 66.6 54.0 67.9 40.6
Eastern Bering Tanner Crab (bairdi) Closed Closed Closed 1.5 8.5 11.3
Western Bering Sea Tanner Crab (bairdi) Closed Closed Closed 1.3 5.3 8.4
State Tanner Fisheries (bairdi) 5.9 4.7 2.2 1.2 1.4 -
Southeast Tanner Crab 0.9 1.1 1.2 1.2 1.4 -
Kodiak Tanner Crab 1.5 1 0.7 Closed Closed -
Southern Peninsula Tanner Crab 2.9 1.9 0.3 Closed Closed -
Chignik Tanner Crab 0.6 0.7 Closed Closed Closed -
Total Tanner/Bairdi 5.9 4.7 2.2 4.0 15.1 -
Total Opilio 51.3 82.1 66.6 54.0 67.9 40.6
Total Snow Crab 57.2 86.8 68.8 58.0 83.0 -
Note: All federal harvests are applied to the second calendar year of the season. For example, total federal fishery harvests of opilio and bairdi from the 2014/2015 season are shown in calendar year 2015. Source: NMFS Alaska Region Catch Reports, ADF&G Regional Offices.
Product Description and Supply Chain Snow crab is harvested by commercial fishing vessels where they are kept alive in tanks which circulate seawater. Some vessels have the capacity to process onboard, but the majority of crab are delivered to shoreside facilities where they are butchered, cooked, frozen, and sorted by size. While a number of smaller primary processors sell directly to retail and food service markets, the majority of snow crab is sold first to a broker which facilitates distribution (Figure 74).
Snow crab sections—the most important product by both volume and value—are priced by the weight per section in ounces, ranging from 5 oz. to 12 oz. with heavier sections typically worth more. Wholesale value of sections has ranged from a low of $2.99 in 2006 to $5.45 in 2011.93 Small amounts of raw crab are processed in Alaska facilities for consumption in the Asian market.
93 ADF&G (COAR).

Alaska Groundfish and Crab Wholesale Market Profiles NOAA/NMFS • 112
According to industry contacts, significant amounts of snow crab exported to China undergoes secondary processing for re-export into Japan, primarily crab meat for sushi.94 A portion of snow crab consumed in the domestic market undergoes secondary processing to produce cracked, scored, and split legs or claws.
One unique trait of snow crab is that they can “drop” their legs if injured or when being handled by fishermen. Snow crab missing legs cannot be sold as a symmetric cluster, instead these crab are exported to China where meat is extracted from the legs and body of the crab.95
While the supply chain between opilio and bairdi is very similar, increased bairdi harvest in recent years has led to an increase in product differentiation between the two species. Industry contacts indicate that while Japan has been the historical market for bairdi, the domestic market is growing.
Figure 74. Alaska Snow Crab Supply Chain
94 Interviews with domestic seafood company wholesale representatives. 95 Personal communication with domestic seafood company wholesale representative.
Photo Courtesy of Alaska Seafood.

Alaska Groundfish and Crab Wholesale Market Profiles NOAA/NMFS • 113
Production Volume and Value In 2014, snow crab was processed by 21 different facilities or vessels in Alaska. The majority (18) are shoreside facilities with the remainder either catcher/processors or floating processors. Nine shoreside facilities in Dutch Harbor and other plants in the Bering Sea region accounted for 88 percent of snow crab production in 2014 (Table 90). Approximately 12 percent was produced on the Alaska Peninsula, Kodiak Island, offshore processors, and facilities located in Southeast Alaska.
Table 90. Alaska Snow Crab Volume and Wholesale Value by Region, 2014
Region Production Volume First Wholesale Value
Millions lb. Pct. of Total Millions $ Pct. of Total
Dutch Harbor 20.7 47% $109.3 47%
Bering Sea 18.2 41% 95.3 41%
Alaska Peninsula/Kodiak/Offshore 4.7 11% 24.7 11%
Southeast 0.7 1% 4.6 2%
Total 44.2 100% $233.9 100%
Note: Regions have been combined to preserve confidentiality. Values have been rounded. Source: ADF&G (COAR).
Opilio crab has averaged 91 percent of snow crab product volume and 90 percent of first wholesale volume over the last 10 years. While bairdi products are smaller in volume and absolute value, their larger weight results in more valuable products on a unit value basis, a differential that has averaged nearly 20 percent over the last 10 years.
Figure 75. First Wholesale Production Volume of Alaska Snow Crab, in Millions lb., 2005-2014
Source: ADF&G (COAR).
0
10
20
30
40
50
60
70
2005 2006 2007 2008 2009 2010 2011 2012 2013 2014
Volu
me
(mill
ion
lb.)
Opilio Bairdi

Alaska Groundfish and Crab Wholesale Market Profiles NOAA/NMFS • 114
Figure 76. First Wholesale Production Value of Alaska Snow Crab, in $Millions, 2005-2014
Source: ADF&G (COAR).
Production Analysis
Measured by both volume and value, crab sections are the largest proportion of snow crab products, accounting for nearly 100 percent of all product volume in 2014. Small amounts of shucked meat is produced from snow crab that are not able to be sold in sections because of missing legs.
The proportion of salable product available after processing relative to the animal’s live weight is known as the recovery rate. The recovery rate for frozen, cooked sections, ranges from 65 to 72 percent.96
Table 91. Volume and Wholesale Value of Snow Crab Products, 2014
Snow Crab Species Crab Sections All Other Products Total
Total Volume (millions lb.) 43.8 0.4 44.1
Opilio 37.0 0.3 37.3
Bairdi 6.8 0.1 6.9
Total Value ($millions) $231.4 $1.3 $232.7
Opilio $193.5 $1.3 $194.7
Bairdi $37.9 $0.1 $38.0
Note: Figures may not sum due to rounding. Source: ADF&G (COAR).
96 (Crapo, Paust, and Babbit, 2004)
$0
$50
$100
$150
$200
$250
$300
$350
2005 2006 2007 2008 2009 2010 2011 2012 2013 2014
Valu
e ($
mill
ions
)
Opilio Bairdi

Alaska Groundfish and Crab Wholesale Market Profiles NOAA/NMFS • 115
Figure 77. First Wholesale Value and Volume of Snow Crab Sections, 2005-2014
Table 92. First Wholesale Value of Snow Crab Sections, in $Millions, 2005-2014 2005 2006 2007 2008 2009 2010 2011 2012 2013 2014
$71.7 $91.2 $90.3 $131.3 $130.7 $103.4 $211.6 $294.5 $245.7 $233.3
Source: ADF&G (COAR).
Key Markets for Snow Crab The United States is the most significant market for Alaska snow crab producers, receiving an estimated 58 percent of all first-order sales over the last 5 years (Table 93). China is the largest export market, accounting for 57 percent of all exports and 24 percent of total Alaska snow crab production over the same period. However, industry reports much of this volume is processed for consumption in Japanese and other Asian markets.97 Sales to Japan, Canada, and other foreign countries averaged 42 percent of all Alaska snow crab production from 2010 to 2014.
Table 93. Estimated Sales of Alaska Snow Crab to Key Markets, in Millions lb., 2010-2014
Market 2010 2011 2012 2013 2014 Pct. of Total Production (5-yr. Avg.)
China 7.6 9.8 15.9 11.0 9.2 24%
Japan 3.1 7.6 7.4 3.3 3.6 11%
Canada 0.5 1.4 2.1 1.4 1.6 3%
Other Countries 0.2 0.9 3.3 3.0 1.9 4%
Total Exports 11.3 19.7 28.6 18.7 16.3 42%
U.S.1 20.4 19.5 33.5 30.7 27.8 58%
Total Production 31.7 39.2 62.1 49.4 44.1 100% 1 Estimate based on annual production less calendar year exports. Note: Data pertains to primary exports only, does not portray product which may be re-exported to other markets. Figures may not sum due to rounding. Source: ADF&G (COAR), ASMI Alaska Seafood Export Database, and McDowell Group estimates.
97 Interview with domestic seafood company wholesale representative.
$2.00
$3.00
$4.00
$5.00
$6.00
$7.00
$8.00
$9.00
2005 2006 2007 2008 2009 2010 2011 2012 2013 20140
10
20
30
40
50
60
70
Uni
t Val
ue ($
/lb.
)
Volu
me
(Mill
ions
lb.)
Volume Unit Value

Alaska Groundfish and Crab Wholesale Market Profiles NOAA/NMFS • 116
UNITED STATES A relatively small proportion of all snow crab consumed in the United States comes from Alaska. McDowell Group estimates that over the last 5 years approximately 80 percent of all snow crab consumed in the United States originated outside the United States (Table 94). In 2014, an estimated 66 percent of snow crab sold in the United States came from Canada, a figure representing 87.9 million lb or more than three times Alaska’s estimated U.S. sales of 27.8 million lb (Figure 78). Alaska supplied an estimated 21 percent of U.S. supply, while the remainder came from other countries, the largest of which is Russia, accounting for 8 percent.
Beginning in 2015, one of the most pressing issues facing the processing industry is how to differentiate opilio and bairdi snow crab from one another. In most years, this has not been a large focus of the industry as bairdi harvests were relatively small. However, as bairdi TACs have increased from 2.2 million lb. in 2013 to 16.5 million lb. in 2015, industry is trying to add value to bairdi harvests by highlighting its larger size and sweeter taste compared to opilio. Previous to increased bairdi volume, bairdi was often marketed as “Jumbo Snow Crab” or a similar generic equivalent.
For the most part, both bairdi and opilio are currently marketed as snow crab. One strategy to assist product differentiation between bairdi and opilio is to encourage retailers and food service operators to use the species names, making it clear to the consumer bairdi is a different crab than the smaller opilio species.
Some food service operators are marketing bairdi as a premium product, highlighting its larger size and sweeter taste compered to opilio. For example, Red Lobster showcased bairdi as a special in summer of 2015 and Joe’s Crab Shack has “Jumbo Bairdi Crab” as a permanent menu item. Las Vegas and southern states are some of the largest markets for snow crab in the domestic market.
Table 94. Estimated U.S. Snow Crab Market Supply, in Millions lb., 2010-2014
Year Alaska Production Imports Exports Est. U.S.
Supply Est. Product from Alaska
Pct. Alaska
2010 31.8 101.9 11.3 122.4 20.5 17% 2011 39.5 95.6 19.7 115.4 19.8 17% 2012 62.1 99.9 28.6 133.4 33.5 25% 2013 49.4 121.8 18.7 152.5 30.7 20% 2014 44.1 104.6 16.3 132.4 27.8 21% Five-year Average 45.4 104.7 18.9 131.2 26.5 20%
Note: Totals and rows may not sum due to rounding. Source: ADF&G (COAR), NMFS Foreign trade data, and McDowell Group estimates.
Figure 78. Estimated Source of Snow Crab Consumed in the United States, 2014
Canada66%
Domestic (Alaska)
21%
Russia8%
All Other 5%
Source: NMFS Trade Data, McDowell Group Estimates.

Alaska Groundfish and Crab Wholesale Market Profiles NOAA/NMFS • 117
JAPAN McDowell Group estimates that Japan is the world’s second-largest consumer of snow crab. From 2010 to 2014, Japan has imported an annual average of 51.6 million lb of snow crab from all countries (Table 95). Slightly more that 50 percent of this volume originated in Russia and 27.8 percent came from Canadian sources. The remaining 9.7 percent came predominantly from the United States and other countries.
The value of these imports averaged slightly more than $312.3 million with about 49 percent or $153.2 million flowing to Russia (Table 95). The remaining $159.1 million went to Canada ($103.8 million), the United States ($51.9) million, and other countries ($3.5 million).
With more supply and a lower price than king crab, snow crab functions as a popular substitute. The crab is traditionally consumed during the holiday season and during Golden Week which runs from April 29th to May 5th spanning seven public holidays. Common ways snow crab are consumed in Japan include use in sushi and soups such as mizutaki and shabu-shabu where raw crab is placed in boiling water along with other ingredients. Some variations of this technique results in the crab curling as it is cooks resulting in an attractive, flower-like presentation of seafood. Snow crab is commonly consumed both in homes and at restaurants.
The strong U.S. dollar and weak Russian ruble make Alaska snow crab relatively more expensive, positioning Russian snow crab as a more affordable option for Japanese consumers. According to industry contacts, this currency issue is one of the most significant challenges faced by processors trying to sell into the Japanese market.98
Japanese imports of U.S. crab often far exceed corresponding data on U.S. snow crab exports to Japan. Secondary processing operations in China likely explains much of the variance. Crab routed through China may still be imported into Japan and categorized as a “Product of U.S.A.” Similar to many other products analyzed in this series, the multi-national supply chain of snow crab underscores the importance of not limiting market analyses only to first-order export statistics.
Table 95. Japanese Imports of Snow Crab, 2010-2014 2010 2011 2012 2013 2014
Import Volume (millions lb.)
Russia 25.7 33.2 28.3 24.6 25.8
Canada 11.7 13.8 17.7 12.6 15.7
U.S. (mostly Alaska) 4.0 9.3 12.6 6.9 7.5
Other Countries 0.9 1.1 1.0 1.1 4.6
Total 42.3 57.3 59.6 45.2 53.6
Pct. U.S. (Alaska) 10% 16% 21% 15% 14%
Import Value ($millions)
Russia $128.1 $214.5 $150.8 $118.3 $154.3
Canada 74.5 115.3 130.2 89.2 109.6
U.S. (Alaska) 17.0 62.5 80.4 46.3 52.9
Other Countries 2.7 4.8 3.6 3.4 2.8
Total $222.4 $397.1 $365.1 $257.2 $319.6
Pct. U.S. (Alaska) 8% 16% 22% 18% 17%
Source: Global Trade Atlas.
98 Interview with domestic seafood company wholesale representative.

Alaska Groundfish and Crab Wholesale Market Profiles NOAA/NMFS • 118
CHINA While China is the largest trading partner measured by exports, industry contacts indicate the majority of this crab undergoes secondary processing, mainly extracting meat for use in sushi, before being re-exported to Japan.99 Many of the largest seafood processors handling snow crab are owned by Japanese companies which take advantage of lower labor costs in China for reprocessing. Since 2007, China has imported an average of 9.7 million lb of Alaska snow crab worth $42.1 million (Figure 79).
Figure 79. U.S. Snow Crab Exports to China, 2007-2014
Source: ASMI Alaska Seafood Export Database.
Global Production and Competing Supply The global harvest of snow crab averaged slightly more than 400 million lb per year from 2005 to 2013. Canadian harvests averaged 50 percent of this volume over this period. Volume from South Korea, the second largest global producer, increased nearly 60 percent over this period. Snow crab harvest in the United States (Alaska) has fluctuated significantly over this period, from a low of 28.4 million lb in 2005 to approximately 93 million lb in 2012. Russian production has increased steadily over the last 10 years, rising from 46.3 million lb in 2005 to 64.4 million lb in 2013. The balance comes primarily from Japan and Greenland which have averaged 10.9 and 5.8 million lb, respectively (Figure 80).
The global supply of snow crab in 2013 was approximately 452 million lb. Canada’s harvest of 216.1 million lb accounted for 48 percent of the total (Figure 81). South Korea accounted for 19 percent and Alaska’s harvest of slightly less than 69 million lb represented 15 percent of the global supply. Russia’s harvest volume was similar to Alaska’s, accounting for 14 percent of the total. Japan’s 9.3 million pound harvest accounted for 2 percent while supply from the North Atlantic countries totaled the remainder.
99 Interview with domestic seafood company wholesale representative.
0.0
2.0
4.0
6.0
8.0
10.0
12.0
14.0
16.0
18.0
2007 2008 2009 2010 2011 2012 2013 2014$0.0
$10.0
$20.0
$30.0
$40.0
$50.0
$60.0
$70.0
$80.0
Volu
me
(mill
ions
lb.)
Valu
e ($
mill
ions
)
Volume Value

Alaska Groundfish and Crab Wholesale Market Profiles NOAA/NMFS • 119
Figure 80. Global Harvest Volume of Snow Crab, in Millions lb., 2005-2013
Source: FAO Stats.
Snow crab supply from the Barents Sea has increased in recent years after a large biomass was discovered in 2013.100 According to trade press, the 2016 harvest of Russian snow crab from the Barents Sea will increase 45 percent when compared to 2015, totaling slightly more than 3.5 million lb.101 In addition, Norwegian TACs in the Barents will add 4.4 million lb to the global snow crab supply in 2016.
Figure 81. Global Snow Crab Harvest by Country, 2013
Source: FAO Stats.
100 (Havforskningsinstitutten, 2013) 101 (Vovchenko, 2015b)
0
50
100
150
200
250
300
350
400
450
500
2005 2006 2007 2008 2009 2010 2011 2012 2013
Harv
est V
olum
e (m
illio
ns lb
.)
Canada South Korea United States of America Russia All Other
Canada48%
South Korea20%
U.S.(Alaska)
15%
Russia14%
Japan2%
Greenland1%
St. Pierre and
Miquelon<1%
Norway<1%

Alaska Groundfish and Crab Wholesale Market Profiles NOAA/NMFS • 120
Wholesale Market Profile for King Crab
King crab, including the red (Paralithodes camtschaticus), golden (Lithodes aequispinus), and blue (Paralithodes platypus) species, are caught in waters throughout Alaska, with the largest concentration found in the Bering Sea. Harvested commercially since the 1930s, king crab are one Alaska’s most valuable fisheries, on a per pound basis. In 2014, 15.8 million lb of king crab were harvested in Alaska, representing 10.7 million lb of production volume worth approximately $116.7 million in first wholesale value.
Table 96. Summary Profile of Alaska King Crab Wholesale Production and Markets, 2014
Value and Volume Key Products Sections Other
First Wholesale Production (millions lb.) 10.7 Pct. of Value 93% 7%
Pct. of Global King Crab Harvest (2013) 15% Key Markets U.S. Japan Other
First Wholesale Value ($millions) $116.7 Pct. of Final Sales 51% 35% 14%
Pct. Change in Value from Prior 4-yr Avg. -19% YOY Change -15% 33% -1%
Pct. of Alaska Crab Value 31% Competing Species: Russian king crab, Southern king crab
Sources: ADF&G (COAR) and McDowell Group estimates.
Fishery Summary King crab are harvested with pots at depths ranging from 90 feet to more than 300 feet. These steel cages (typically 7’x7’x3’) are baited with Pacific cod, herring, or salmon, and placed on the ocean floor for 24 hours or longer. A line runs from the pot to a buoy floating at the ocean surface, allowing for retrieval by a fishing vessel.
Each year, the total allowable catch (TAC) in Alaska king crab fisheries is set by the National Marine Fisheries Services (NMFS) and the Alaska Department of Fish & Game (ADF&G) through the North Pacific Fishery Management Council (NPFMC.) A portion of these TACs is allocated to Community Development Quota (CDQ) groups in western Alaska.
In 2005, the most economically significant king crab fisheries were rationalized with allocations based upon historical harvests. Previous to this transition, season lengths were compressed into a short period of competitive fishing; the red king crab season lasted only 3 days in 2004. The next year the season was extended to 92 days. Short seasons compromised both safety and product quality as fisherman had to fish regardless of weather and processors were often overwhelmed by high volumes landed over very short periods.
Commercial harvest of Alaska king crab was pioneered by Japanese and Russian fleets using tangle nets starting in the 1930s. Domestic harvest began in the late 1940s, and by the early 1960s U.S. fishermen dominated the fishery.102 Around the same time, the use of trawl and tangle nets for harvesting crab were
102 (Zimmermann, Dew and Malley, 2009)
Photo courtesy of Garrett Evridge.

Alaska Groundfish and Crab Wholesale Market Profiles NOAA/NMFS • 121
outlawed and only males meeting a size requirement could be retained. With the passing of the 1976 Magnuson-Stevenson Act, foreign vessels were prevented from harvesting Alaska king crab. The domestic fleet continued to develop as strong prices and landings resulted in increased fishing pressure. After landings peaked in 1980 at 180 million lb, the harvest fell precipitously (driven mainly by reductions around Kodiak Island) and has averaged approximately 20 million lb annually since the early 1980s.
Federally managed king crab fisheries in the Bering Sea are Alaska’s largest, typically accounting for more than 90 percent of Alaska king crab harvest volume. Of all Alaska king crab fisheries, the Bristol Bay Red king crab fishery is the most significant in terms of harvest volume, averaging 9.7 million lb annually from 2010 to 2014. The Aleutian Islands Golden king crab fishery is the second largest king crab in Alaska, averaging 5.9 million lb. The Saint Matthews Blue king crab fishery often produces the only commercial harvest of blue king crab in Alaska. It has averaged 1.0 million lb over the past 5 years, but recent harvest volumes are well below those of 2010 to 2012 (Figure 82).
Figure 82. Annual King Crab Landings in Alaska, in Millions lb., 1950-2014
Source: NMFS (1950-2013) and McDowell Group estimates (2014).
The smaller, state-managed king crab fisheries in Southeast have averaged approximately 500,000 lb annually from 2010 to 2014 (Table 97). While harvest volumes from Norton Sound have been stable over the last 5 years, king crab fisheries in Southeast have often been closed. Of all Alaska king crab fisheries, the Bristol Bay Red king crab is the most significant in terms of volume, averaging nearly 10 million lb annually from 2010 to 2014.
Photo courtesy of Garrett Evridge (pictured, left).
0
20
40
60
80
100
120
140
160
180
200
1950
1957
1964
1971
1978
1985
1992
1999
2006
2013
Volu
me
(mill
ions
lb.)

Alaska Groundfish and Crab Wholesale Market Profiles NOAA/NMFS • 122
Table 97. Alaska King Crab Harvest/TAC in Federal and State Fisheries, in Millions lb., 2010-2015
CY2010 Harvest
CY2011 Harvest
CY2012 Harvest
CY2013 Harvest
CY2014 Harvest
CY2015 TAC/GHL
Federal Fisheries 22.1 15.6 15.3 14.3 15.8 16.3
Bristol Bay Red King Crab 14.7 7.8 7.8 8.5 9.9 10.0
Aleutian Islands Golden King Crab 6.1 6.0 5.9 5.8 5.7 6.0
St. Matthews Blue King Crab 1.3 1.9 1.6 Closed 0.3 0.4
State Fisheries 1.1 1.3 1.1 0.9 0.6 0.6
Norton Sound Red King Crab 0.4 0.4 0.5 0.4 0.4 0.5
Southeast Red King Crab Closed 0.2 Closed Closed Closed Closed
Southeast and Yakutat Brown Crab 0.7 0.7 0.6 0.5 0.2 0.1
Total Red King 15.3 8.4 8.4 9.1 10.3 10.1
Total Golden/Brown King 6.7 6.7 6.9 6.8 6.5 6.4
Total Blue King 2.4 1.7 1.6 Closed 0.7 0.4
Total King Crab 24.3 16.8 16.9 15.9 17.5 16.9
Note: All federal fishery harvests are applied to the first calendar year of the season. For example, federal king crab harvests from the 2014/2015 season are shown in calendar year 2014. Source: NMFS Economic Crab SAFE 2014, ADF&G Shellfish Reports, and ADG&G Regional Offices.
Product Description and Supply Chain King crab is harvested by commercial fishing vessels where they are kept alive in tanks which circulate seawater. While some vessels have the capacity to process onboard, the majority of crab are delivered to shoreside facilities where they are butchered, cooked, frozen, and sorted by size.
The vast majority of king crab are sold in the wholesale market as cooked/frozen sections. King crab sections are priced by the number of legs and claws needed to fill a 10-pound box (Table 98). Lower counts indicate larger legs and are typically more valuable. This sizing system commonly ranges from 6-9 legs and claws per box to twenty or more per box. King crab sections averaged approximately $10.00/lb. at the first wholesale level over the 2004 to 2014 period, ranging from a low of $6.78/lb. to a high of $15.17/lb. in 2011.103
Table 98. King Crab Section Sizing
Number of Legs and Claws per 10-pound box
6-9 12-14 16-20 20+
9-12 14-17 20-24
A small portion of the king crab harvest is flown to high-end markets as a live or fresh, uncooked product. Live king crab production totaled approximately 260,000 lb in 2014 worth $3.5 million, while fresh production totaled 105,000 lb worth $1.3 million. Together these product forms accounted for 4.1 percent of total king crab first wholesale value. Live and fresh product forms accounted for 6.0 percent of first wholesale value in 2012, the recent high-water mark.
While the majority of crab flows directly from primary processors to international and domestic wholesale markets for consumption at the retail and food service level, an estimated 10 to 15 percent of the annual production undergoes secondary processing (in addition to separating legs/claws and sorting by size). This figure represented approximately 1.0 to 1.6 million lb of specialty Alaska king crab products in 2014.104
103 ADF&G (COAR). 104 Interview with domestic seafood company wholesale representative.

Alaska Groundfish and Crab Wholesale Market Profiles NOAA/NMFS • 123
Common specialty crab products include cracked, scored, and split legs or claws—all products which make it easier for consumers to access crab meat. The majority of this secondary processing takes place in the Pacific Northwest, with some occurring in other plants around the United States.105 These specialty crab products are primarily consumed in the domestic market.
Figure 83. Alaska King Crab Supply Chain
Production Volume and Value In 2014, king crab was processed by 26 different facilities or vessels in Alaska. The majority (20) were shoreside facilities with the remainder either catcher/processors or floating processors. While most processing capacity is located close to the Bering Sea, a number of facilities in Southeast Alaska serve local fisheries.
Table 99. Alaska King Crab First Wholesale Volume and Value by Region, 2014
Region Volume Value
Millions lb. Pct. of Total Millions $ Pct. of Total
Dutch Harbor/Alaska Peninsula 9.5 89% $101.9 87%
Bering Sea/Norton Sound 0.7 7% 8.2 7%
Kodiak/Off-shore 0.3 3% 4.5 4%
Southeast/ Cook Inlet 0.1 1% 2.2 2%
Total 10.7 100% $116.7 100%
Note: Regions have been combined to preserve confidentiality. Source: ADF&G (COAR).
105 Interview with domestic seafood company wholesale representative.

Alaska Groundfish and Crab Wholesale Market Profiles NOAA/NMFS • 124
Nearly 90 percent of the 2014 king crab harvest was processed in the Dutch Harbor/Alaska Peninsula region, with the majority handled by shoreside facilities in Dutch Harbor (Table 99). Facilities in the Bering Sea/Norton Sound region (mainly in St. Paul and Nome) processed 7 percent. The remaining 4 percent was processed in facilities in Kodiak, off-shore, Cook Inlet, and Southeast.
Figure 84. First Wholesale Production Volume Alaska King Crab, in Millions lb., 2004-2014
Source: ADF&G (COAR).
Red king crab is the largest Alaska king crab fishery measured by volume and value, accounting for an average of 67 percent of production volume and 75 percent of first wholesale value since 2004 (Figures 84 and 85). Over the same period, golden king crab has averaged 30 percent of volume and 22 percent of value. With fisheries closed 6 out of the last 11 years, blue king crab volume and value is relatively small.
Figure 85. First Wholesale Value of Alaska King Crab, in $Millions, 2004-2014
Source: ADF&G (COAR).
$0
$20
$40
$60
$80
$100
$120
$140
$160
$180
$200
2004 2005 2006 2007 2008 2009 2010 2011 2012 2013 2014
Valu
e ($
mill
ions
)
Red King Crab Blue King Crab Golden King Crab
0.0
2.0
4.0
6.0
8.0
10.0
12.0
14.0
16.0
18.0
2004 2005 2006 2007 2008 2009 2010 2011 2012 2013 2014
Volu
me
mM
illio
n lb
.)
Red King Crab Blue King Crab Golden King Crab

Alaska Groundfish and Crab Wholesale Market Profiles NOAA/NMFS • 125
Production Analysis
Crab sections are the largest proportion of king crab products, accounting for approximately 95 percent of all product volume in 2014. Whole crab, either frozen or alive, accounted for nearly 5 percent of all products in 2014. Crab shipped alive are flown from Alaska directly to market. The king crab are kept in a moist environment and can live approximately 24-hours out of the water. Crab tails totaled less than 1 percent of all king crab products in 2014.
Table 100. Production Volume and First Wholesale Value of King Crab Products, 2014
King Crab Species Crab Sections All Other Products Total
Total Volume (millions lb.) 10.2 0.6 10.7
Red 6.7 0.4 7.1
Golden 3.3 0.2 3.4
Blue 0.2 < 0.1 0.2
Total Value ($millions) $109.4 $7.3 $116.7
Red $77.2 $4.8 $81.9
Golden 30.3 2.5 32.8
Blue 2.0 <0.1 2.0
Note: Figures may not sum due to rounding. Source: ADF&G (COAR).
The proportion of salable product available after processing relative to the animal’s live weight is known as the recovery rate. This rate ranges from slightly more than 20 percent for cooked crabmeat to roughly 95 percent for cooked whole crab. The recovery rate for sections, depending on the size of crab, ranges from 52 to 67 percent.106 Red and golden crab yield a higher recovery rate than blue king crab which is often smaller.
Figure 86. First Wholesale Volume and Value of King Crab Sections, 2004-2014
Table 101. First Wholesale Value of Alaska King Crab Sections, in $Millions, 2004-2014 2004 2005 2006 2007 2008 2009 2010 2011 2012 2013 2014
$113.4 $114.2 $88.6 $127.0 $143.5 $111.6 $163.0 $156.9 $115.8 $108.0 $109.4
Source: ADF&G (COAR).
106 (Crapo, Paust, & Babbit, 1993)
$0
$2
$4
$6
$8
$10
$12
$14
$16
$18
2004 2005 2006 2007 2008 2009 2010 2011 2012 2013 20140
2
4
6
8
10
12
14
16
Uni
t Val
ue ($
/lb.
)
Volu
me
(mill
ions
lb.)
Volume Unit Value

Alaska Groundfish and Crab Wholesale Market Profiles NOAA/NMFS • 126
Key Markets for King Crab The United States is the most significant market for Alaska king crab, averaging 44 percent of all production over the last 5 years (Table 102). The domestic market buys the most golden king crab and is the second largest market for Alaska red king crab.107 Japan is the largest export market, accounting for 60 percent of all exports and buying an estimated one-third of total Alaska king crab production. Canada, China, and all other countries have averaged 22 percent of all Alaska king crab exports from 2012 to 2014. Discussions with industry representatives indicate the majority (possibly 80 percent) of king crab is sold on the wholesale market between November and February, beginning with Thanksgiving and concluding with Super Bowl Sunday.
Table 102. Estimated Sales of Alaska King Crab to Key Markets, in Millions lb., 2010-2014
Market 2010 2011 2012 2013 2014 Pct. of Total (5-yr. Avg.)
Japan 6.4 3.8 2.6 2.8 3.7 34%
Canada 0.8 1.3 0.9 0.7 0.6 8%
China 0.7 0.7 0.4 0.4 0.4 5%
Other Countries 1.4 2.3 1.0 0.5 0.6 10%
Total Exports 9.4 8.2 4.9 4.3 5.2 56% U.S.1 4.9 3.2 4.8 6.4 5.5 44%
Total Production 14.3 11.4 9.7 10.7 10.7 100% 1 Estimate based on annual production less calendar year exports. Note: Data pertains to primary exports only, does not portray product which may be re-exported to other markets. Figures may not sum due to rounding. Source: ADF&G (COAR), NMFS Trade Data, ASMI Alaska Seafood Export Database, and McDowell Group estimates.
UNITED STATES McDowell Group estimates that over the last 5 years more than 80 percent of all king crab consumed domestically has originated outside the United States, mainly from Russia (Table 103). This is a surprising figure given that many U.S. consumers likely associate king crab with Alaska and the popular Discovery-channel TV show “Deadliest Catch.”
According to industry representatives, an estimated 70 percent of red king crab sold in the United States goes to food service with the remaining 30 percent sold at retail. Golden king crab is split about evenly between food service, retail, and the military which is required to purchase domestic food products. Food service is comprised of high-end restaurants and family/casual restaurants (Joe’s Crab Shack, Red Lobster, etc.). Most grocery chains with a seafood case sell some variety of king crab, and Costco does significant volume with temporary “road-show” sales where king crab is featured for a limited time along with other shellfish products.
107 Interview with domestic seafood company wholesale representative.
Photo courtesy of Garrett Evridge.

Alaska Groundfish and Crab Wholesale Market Profiles NOAA/NMFS • 127
Although king crab is widely considered a luxury good, the U.S. market remains price-conscious when it comes to selecting product. There is a market for red king crab at fine dining and upscale restaurants, as well as Costco and high-end grocery stores. Golden and blue king crab are sold primarily into the domestic markets. These relatively affordable varieties are often sold at national restaurant chains and to the military.
Table 103. Estimated U.S. King Crab Market Supply, in Millions lb., 2010-2014
Year Alaska Production Imports Exports Est. U.S.
Supply Est. Product from Alaska
Pct. Alaska
2010 15.1 23.0 9.5 28.5 5.6 20% 2011 11.4 20.1 8.1 23.4 3.3 14% 2012 10.3 24.7 4.9 30.1 5.4 18% 2013 10.7 25.3 4.3 31.7 6.4 20% 2014 10.7 27.6 5.2 33.1 5.5 16% Five-year Average 11.7 24.1 6.4 29.3 5.2 18%
Note: These data do not distinguish between red, blue, and golden king crab. Totals and rows may not sum due to rounding. Source: ADF&G (COAR), NMFS Foreign Trade Data, ASMI Alaska Seafood Export Database, and McDowell Group estimates.
In 2014, nearly 70 percent of king crab consumed in the United States came from imported Russian product, a figure representing 22.7 million lb or more than four times Alaska’s estimated U.S. sales of 5.2 million lb (Figure 87). King crab from Russia is typically sold at a discount to Alaska product in the domestic market.108 Imports from Argentina have grown from approximately 700,000 lb in 2010 to nearly 4.4 million lb in 2014 or 14 percent of the total. All other sources equaled approximately 1 percent.
Figure 87. Estimated Source of King Crab Consumed in the United States, 2014
JAPAN Over the last 10-years, Japan has imported an average of 5.1 million lb of Alaska king crab worth $42 million, most of which is red king crab (Figure 88). King crab is a common gift given during the December holiday season; an industry contact estimates 80 to 90 percent of red king crab is sold in the months prior to this holiday season.109 Similar to other markets, larger crab sections are valued more, especially as a gift. A common practice is to sell smaller sections to restaurants and reserve the larger sections for retail sales.
108 Interview with domestic seafood company wholesale representative. 109 Interview with domestic seafood company wholesale representative.
Russia69%
Domestic (Alaska)
16%
Argentina14%
All Other1%
Source: NMFS Trade Data, McDowell Group Estimates.

Alaska Groundfish and Crab Wholesale Market Profiles NOAA/NMFS • 128
Exports to Japan have been reduced in recent years due to more conservative harvest levels in Alaska. Additionally, a strengthening U.S. dollar can make seafood from other countries more affordable to the Japanese customer, reducing demand for Alaska king crab.110
Figure 88. U.S. Red King Crab Exports to Japan, 2005-2014
In total, Japan imported an average of nearly 30 million lb of king crab annually from 2010 to 2014 worth $220 million (Table 104). More than 80 percent of this volume originated in Russia with the remainder coming from Alaska and small amounts from Norway, Chile and other countries.
Table 104. Japanese Imports of King Crab, 2010-2014 2010 2011 2012 2013 2014
Import Volume (millions lb.) Russia 17.6 19.6 41.0 27.6 17.4
U.S. (Alaska) 6.4 3.8 2.6 2.8 3.7
Other Countries 1.6 0.7 0.4 0.1 0.0
Total 25.7 24.1 44.1 30.4 21.1 Pct. U.S. (Alaska) 25% 16% 6% 9% 18% Import Value ($millions) Russia $127.7 $203.3 $265.7 $145.4 $132.7
U.S. (Alaska) 65.2 43.7 29.7 28.3 36.8
Other Countries 11.2 8.5 4.1 0.7 0.0
Total $204.1 $255.4 $299.4 $174.3 $169.5 Pct. U.S. (Alaska) 32% 17% 10% 16% 22%
Source: Global Trade Atlas.
Global Production and Competing Supply The global supply of king crab averaged nearly 150 million lb per year from 2004 to 2013 and is dominated by Russian production, which accounted for an estimated 71 percent of the total harvest volume during the 10-year period (Figure 89). Total supply declined by more than 50 percent between 2007 and 2010, but has
110 As the U.S. dollar gets stronger against the Yen, U.S. products become relatively expensive to Japanese consumers.
0.0
1.0
2.0
3.0
4.0
5.0
6.0
7.0
8.0
9.0
2005 2006 2007 2008 2009 2010 2011 2012 2013 2014$0.0
$10.0
$20.0
$30.0
$40.0
$50.0
$60.0
$70.0
Volu
me
(mill
ion
lb.)
Valu
e ($
mill
ions
)
Volume (millions of lbs) Value
Source: NMFS Trade Data, compiled by McDowell Group.

Alaska Groundfish and Crab Wholesale Market Profiles NOAA/NMFS • 129
increased slightly in recent years, reaching 115 million lb in 2013. Alaska typically has the second-largest king crab harvest production. Chile and Argentina have the third-and-fourth-largest king crab harvest production, catching Southern king crab, a close substitute of red king crab. The two countries’ combined harvest has grown substantially in recent years, increasing from 9.3 million lb in 2004 to 21.6 million lb in 2013. Norway accounts for the balance, harvesting 3 million lb of king crab in the Barents Sea.
Figure 89. Estimated Global Supply of King Crab, in Millions lb., 2004-2013
Historically, Russian harvest of king crab has included significant amounts of illegal, unreported, and unregulated (IUU) production. Although a portion of the harvest is conducted illegally and in excess of stated TACs, the IUU harvest volume can be estimated. Because nearly all Russian crab harvests are exported, the volume of Russian crab imported by other countries can be converted into a live weight equivalent and compared to official harvests statistics. Using this method, McDowell Group estimates the 2013 IUU king crab harvest in Russia totaled 21 million lb, while the remaining 52 million lb was legally harvested. Not included in the table above are 33 million lb of IUU Russian crab which had no species identification on the trade data. This volume is likely comprised almost entirely of king and snow crab. Beginning in 2008 the Russian government began a focused campaign to reduce IUU harvest. While these efforts have impacted IUU harvest, a significant amount of traded product is still unaccounted for in official Russian harvest statistics.
In 2013—the most recent year for which data is available—harvest of Russian king crab accounted for 64 percent of global production, with 46 percent of global supply coming from legal sources and an estimated 18 percent from IUU sources (Figure 90). Russian IUU production has declined significantly in recent years, but was still greater than all of Alaska’s king crab production in 2013. While Russian IUU production is trending down, legal king crab harvests are increasing substantially.
With a harvest of nearly 16 million lb, Alaska represented 14 percent of global supply in 2013. Chile’s harvest of slightly less than 13 million lb and Argentina’s harvest of 9 million lb together equaled nearly 20 percent of global supply. Norway accounted for approximately 3 percent of global supply.
0
50
100
150
200
250
2004 2005 2006 2007 2008 2009 2010 2011 2012 2013
Harv
est V
olum
e (m
illio
ns lb
.)
All Other
Argentina/Chile
United States(Alaska)
Russia (legal andestimated IUU)
Source: FAO, NMFS (U.S.), McDowell Group estimates (Russian IUU production).

Alaska Groundfish and Crab Wholesale Market Profiles NOAA/NMFS • 130
Figure 90. Estimated Proportions of Global King Crab Supply, 2013
Argentina8%
Chile11%
Norway3%
Russia (Legal)45%
Russian (est. IUU)18%
Alaska 15%
Source: FAO, NMFS, McDowell Group estimates (Russian IUU).

Alaska Groundfish and Crab Wholesale Market Profiles NOAA/NMFS • 131
References
Alaska Department of Fish and Game. (2015). Sablefish: Cook Inlet Management Area. http://www.adfg.alaska.gov/index.cfm?adfg=commercialbyareacookinlet.cookinlet_groundfish_sablefish_harvest. Accessed April 2015.
Alaska Seafood Marketing Institute. (2011). China's International Seafood Trade. http://www.alaskaseafood.org/fishingprocessing/seafoodweb_may11/china.html. Accessed May 2015.
Alaska Seafood Marketing Institute. (2012). Flatfish Buyers Guide. http://www.alaskaseafood.org/foodservice/practices/documents/Flatfish_BuyersGuide.pdf. Accessed April 2015.
Alaska Seafood Marketing Institute. (2013). Economic Value of the Alaska Seafood Industry. Alaska Seafood Marketing Institute, 150 Nickerson Street Suite 310 Seattle, WA 98109-1634.
Buchanan, S., B. Emmett, and H. Kittlesen. (2012). Traceability within the British Columbia halibut industry: a review of traceability practices, readiness, and opportunities. Archipelago Marine Research Ltd., 525 Head Street, Victoria, British Columbia V9A 5S1 Canada.
Alaska Seafood Marketing Institute (ASMI).(2014). 2014 Alaska Seafood Market Outlook. Seafood Market Bulletin.http://www.alaskaseafood.org/industry/market/seafood_spring14/2014-alaska-seafood-market-outlook.html. Accessed April 2015.
Barrett, B., and M. Notaras. (2012). Future of Food in Japan. Our World. http://ourworld.unu.edu/en/future-of-food-in-japan. Accesssed April 2015.
Catarci, C. (2004). World Markets and Industry of Selected Commercially-Exploited Aquatic Species with an International Conservation Profile. FAO United Nations, Rome, Italy. FAO Fisheries Circular No. 990.
Crapo, C., B. Paust, and J. Babbit. (1993). Alaska Sea Grant College Program. Marine Advisory Bulletin 37, 32 p.
FAO Globefish Market Reports. (2014-2015). Globefish: Pangasius. http://www.fao.org/in-action/globefish/market-reports/pangasius/en/. Accessed April 2016.
Food and Agricultural Organization of the United Nations. (2015). Market Reports: Groundfish. http://www.globefish.org/groundfish-march-2015.html. Accessed April 2016.
Fisheries and Oceans Canada. (2013). Export Highlights British Columbia Agrifoods. British Columbia. http://www.dfo-mpo.gc.ca/fm-gp/sustainable-durable/fisheries-peches/halibut-fletan-eng.htm. Accessed March 2013.
Fisheries and Oceans Canada. (2015). Pacific Fisheries Catch Statistics. http://www.pac.dfo-mpo.gc.ca/stats/comm/summ-somm/annsumm-sommann/2013/ANNUAL13_USER_three_party_groups-eng.htm. Accessed April 2016.
Fissel, B., Dalton, M., Felthoven, R., Garber-Yonts, B., Haynie, A., Himes-Cornell, A., S. Kasperski, J. Lee, D. Lew, L. Pfeiffer, and C. Seung. (2014). Stock Assessment and Fishery Evaluation Report for the Groundfish Fisheries of the Gulf of Alaska and Bering Sea/Aleutian Islands Area: Economic Status of the Groundfish Fisheries Off Alaska, 2012. North Pacific Fishery Management Council, 605 West 4th, Suite 306, Anchorage, Alaska 99501-2252.

Alaska Groundfish and Crab Wholesale Market Profiles NOAA/NMFS • 132
Gibson, R. N., R. D. Nash, A. J. Geffen, and H. W. Van der Veer. (2014). Flatfishes: Biology and Exploitation. West Sussex: Wiley & Sons.
Green, K., J. Stahl, M. Vaughn, K. Carroll, and A. Baldwin. (2014). Annual Management Report for the Southeast and Yakutat Commercial Groundfish Fisheries, 2014. Alaska Department of Fish and Game Fishery Management Report No. 14-57, 42 p.
Hanselman, D. H., C. R. Lunsford, and C. J. Rodgveller. (2014). Assessment of the sablefish stock in Alaska, p. 576-717. In Stock Assessment and Fishery Evaluation Report for the Groundfish Fisheries of the Bering Sea, Aleutian Islands, and Gulf of Alaska, 2014. North Pacific Fishery Management Council, 605 West 4th, Suite 306, Anchorage, Alaska 99501-2252.
Herrfurth, G. (1987). Walleye pollock and its utilization and trade. Marine Fisheries Review 49(1): 61-76.
Hui, Y. H. (2005). Handbook of Food Science, Technology, and Engineering. CRC Press, Taylor and Francis Group, Boca Raton Fl. 3,632 p.
indexmundi. (2015). Fish Meal Production by Country in 1000 MT. http://www.indexmundi.com/agriculture/?commodity=fish-meal&graph=production. Accessed April 2016.
International Pacific Halibut Commission (IPHC). (2013). International Pacific Halibut Commission Annual Report, 2012. International Pacific Halibut Commission, 2320 West Commodore Way, Suite 300, Seattle WA 98199-1287.
Keith, S., T. Kong, L. Sadorus, I. Stewart, and G. Williams (editors). (2014). The Pacific halibut: Biology, fishery, and management. International Pacific Halibut Commission Technical Report No. 59, 60 p.
Knapp, G. (2006). An Overview of Alaska Pollock Markets. Presented at the 2006 Alaska Marine Science Symposium. Anchorage, AK. Available at http://doc.nprb.org/web/symposium/2006/tuesday/session_3/Knapp_Pollock_Markets_MSS_060124.ppt. Accessed April 2016.
Liddel, M., and A. Lowther (editor). (2014). Fisheries of the United States, 2013. NOAA, NMFS, Office of Science and Technology, Fisheries Statistics Division. Current Fishery Statistics No. 2013.
National Marine Fisheries Service. (2001). Steller Sea Lion Protection Measures Final Supplemental Environmental Impact Statement. NOAA, National Marine Fisheries Service, Alaska Region.
Nissui Group. (n.d.). Pollock roe products. http://www.nissui.co.jp/english/product/marine/roe.html. Accessed April 2016.
North Pacific Fishery Management Council. (2012). Fishing Fleet Profiles. http://www.npfmc.org/wp-content/PDFdocuments/resources/FleetProfiles412.pdf. Accessed April 2016. North Pacific Fishery Management Council, 605 West 4th, Suite 306, Anchorage, Alaska 99501-2252.
Pacific Salmon Commission. (2015). Final Estimates of Transboundary River Salmon Production, Harvest and Escapement and a Review of Joint Enhancement Activities in 2013. Pacific Salmon Commission Joint Transboundary Technical Committee Report TCTR (15)-5. Pacific Salmon Commission, 600-155 Robson Street, Vancouver B.C., Canada V6E 1B5.
Pacific Seafood. (2014). Alaska pollock. Pacific Seafood. https://www.pacseafood.com/products/details/seafood/alaska-pollock/. Accessed April 2016.
Alaska Groundfish and Crab Wholesale Market Profiles NOAA/NMFS • 133
Pacific Seafood. (2014). Flounder & Sole. Pacific Seafood Products: https://www.pacseafood.com/products/details/seafood/flounder-sole/. Accessed April 2016.
Park, J. W. (2014). Surimi and Surimi Seafood (3rd edition). CRC Press, Taylor and Francis Group, Boca Raton Fl.
Reynolds, J. (2015). Seafood Producers Cooperative. Personal communication, June 2015. Seafood Producers Cooperative-Bellingham, 2875 Roeder Ave, #2, Bellingham, WA 98225.
Sackton, J. (2014). As Alaska sablefish season closes, prices reach record levels in Japan. SeafoodNews.com, http://www.seafoodnews.com/Story/952303/As-Alaska-Sablefish-Season-Closes-Prices-reach-record-levels-in-Japan. Accessed April 2016.
Sackton, J. (2015). Near record prices for sablefish may mean much lower consumption in Japan. SeafoodNews.com, http://www.seafoodnews.com/Story/971116/Near-Record-Prices-for-Sablefish-May-Mean-Much-Lower-Consumption-in-Japan. Accessed April 2016.
Seaman, T. (2014). US pollock catchers try to shift volumes away from Europe. Retrieved from Undercurrent News, http://www.undercurrentnews.com/2014/04/02/us-pollock-catchers-try-to-shift-volumes-away-from-europe/. Accessed April 2016.
Seaman, T. (2015). Weak H&G pollock prices in China see Russian pollock catchers look to Nigeria. Undercurrent News, http://www.undercurrentnews.com/2015/06/18/weak-hg-pollock-prices-in-china-see-russian-pollock-catchers-look-to-nigeria/. Accessed April 2016.
Sheperd, B., and E. Bachis. (2014). Changing supply and demand for fish oil. Aquaculture Economics & Management 18(4): 395-416.
Sigler, C. F., and C. R. Lunsford. (2001). Effects of individual quotas on catching efficiency and spawning potential in the Alaska sablefish fishery. Canadian Journal of Fisheries and Aquatic Sciences 58: 1300-1312.
Sonu, S. C. (2014). Supply and market for sablefish in Japan. U.S. Department of Commerce, NOAA Technical Memorandum NOAA-TM-NMFS-WCR-102014, 51 p.
Stewart, J. (2013). Korean, Japanese buyers travel in for Seattle pollock roe auction. Undercurrent news, http://www.undercurrentnews.com/2013/10/28/korean-japanese-buyers-travel-in-for-seattle-pollock-roe-auction/. Accessed April 2016.
Tacon, A. G. J., and M. Metian. (2015). Feed matters: Satisfying the feed demand of aquaculture. Reviews in Fisheries Science & Aquaculture 23(1): 1-10.
Takeuchi, M. (2014). High pollock, tilapia prices set to cause yellowfin sole to rise from 10-year low. Undercurrent News, http://www.undercurrentnews.com/2014/04/14/high-pollock-tilapia-prices-set-to-cause-alaska-yellowfin-sole-to-rise-from-10-year-low/. Accessed April 2016.
The Fish Site. (2015). FAO Globefish reports - Alaska pollock, hake, and surimi. http://www.thefishsite.com/reports/?id=5534. Accesssed April 2016.
The Marine Ingredients Organisation (IFFO). (2015). What are marine ingredients? http://www.iffo.net/what-are-marine-ingredients. Accessed April 2016.
Thunberg, E., and A. Brinson. (2012). North Pacific Halibut Individual Fishing Quota Program. https://alaskafisheries.noaa.gov/sites/default/files/reports/ifq-performance2013.pdf. Accessed April 2016. Alaska Regional Office, NOAA, National Marine Fisheries Service, PO Box 21668, Juneau AK 99513.

Alaska Groundfish and Crab Wholesale Market Profiles NOAA/NMFS • 134
Trebesch, C. L. (2013). Annual Management Report for the Bering Sea-Aleutian Islands Area State-Waters Groundfish Fisheries and Groundfish Harvest from Parallel Seasons in 2012. Alaska Department of Fish and Game Fishery Management Report No. 13-33, 43 p.
Undercurrent News. (2013). China seafood sales feel pinch of corruption crackdown. http://www.undercurrentnews.com/2013/08/26/china-seafood-sales-feel-pinch-of-corruption-crackdown/. Accessed April 2015.
U.S. Departments of Commerce and State. (n.d.). Chilean Sea Bass Frequently Asked Questions. U.S. Import Control Program, Office of Public Affairs, U.S. Department of Commerce, NOAA, National Marine Fisheries Service.
Vovchenko, E. (2015). Russian pollock fillet production spikes 43% in first quarter. Intrafish.com, http://www.intrafish.com/news/article1411058.ece. Accessed April 2016.
Washington Department of Fish and Wildlife. (2008). Economic Analysis of the Non-Treaty Commercial and Recreational Fisheries in Washington State. Washington Department of Fish and Wildlife, 600 Capitol Way North, Olympia, Washington 98501-1091.
Washington Department of Fish and Wildlife. (2015). Fishing and Shellfishing. Washington Department of Fish and Wildlife, http://wdfw.wa.gov/fishing/bottomfish/identification/flatfish/l_bilineata.html. Accessed April 2016.
Wessel, M., J. Rumble, K. J. Goldman, , E. Russ, M. Byerly, and C. Russ. (2014). Prince William Sound Registration Area E Groundfish Fisheries Management Report, 2009-2013. Alaska Department of Fish and Game Fishery Management Report No. 14-42, 63 p.
Yoo, S-Y. (2013). 2013 Seafood Products Market Brief. USDA Foreign Agricultural Service. http://gain.fas.usda.gov/Recent%20GAIN%20Publications/2013%20Seafood%20Products%20Market%20Brief_Seoul%20ATO_Korea%20-%20Republic%20of_4-17-2013.pdf. Accessed April 2016.

McDowell Acknowledgements:This project benefited greatly from input provided by government agencies and industry participants. McDowell Group would like to express its appreciation to employees of NOAA’s Alaska Fisheries Science Center, the Alaska Fisheries Information Network, the Alaska Department of Fish and Game, the Alaska Seafood Marketing Institute, and numerous private companies.
National Marine Fisheries ServiceAlaska Fisheries Science Center 7600 Sand Point Way N.E. Seattle, Washington 98115www.afsc.noaa.gov
Pacific States Marine Fisheries Commission205 SE Spokane Street, Suite 100 Portland, Oregon 97202www.psmfc.org
McDowell Group Anchorage Office1400 W. Benson Blvd., Suite 510Anchorage, Alaska 99503
McDowell Group Juneau Office 9360 Glacier Highway, Suite 201Juneau, Alaska 99801www.mcdowellgroup.net