Embed Size (px)
Citation preview
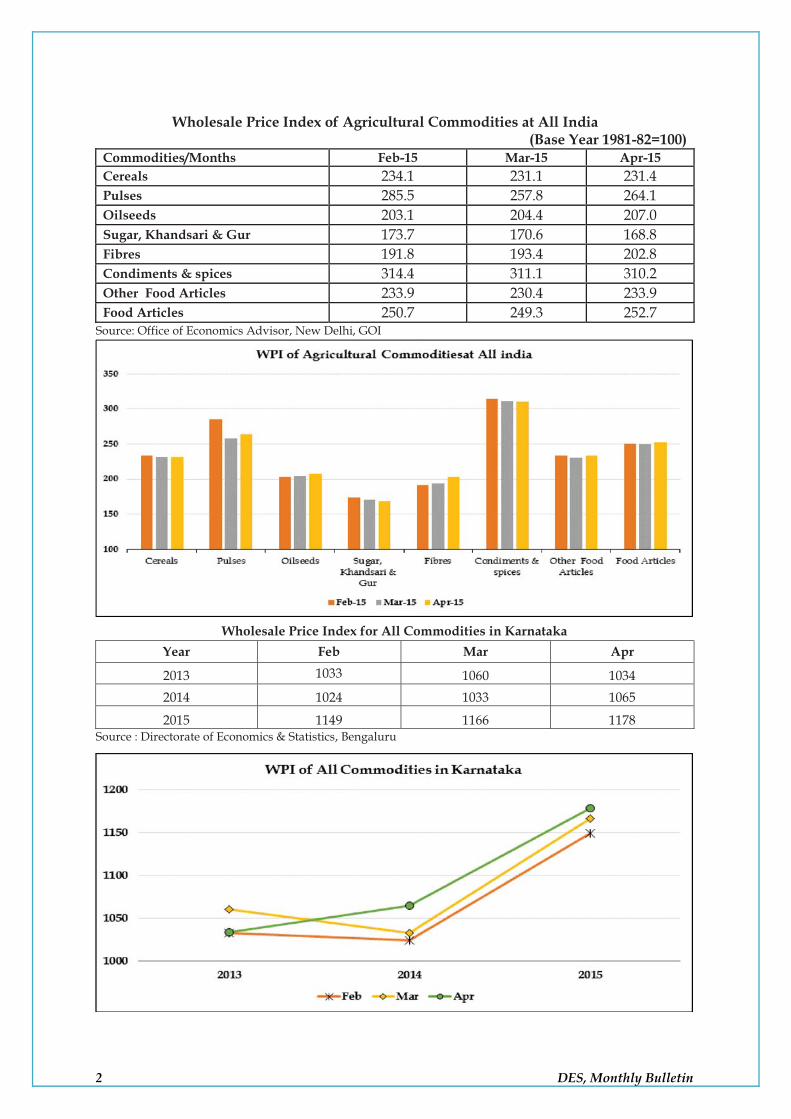
Wholesale Price Index of Agricultural Commodities at All India
(Base Year 1981-82=100) Commodities/Months Feb-15 Mar-15 Apr-15 Cereals 234.1 231.1 231.4 Pulses 285.5 257.8 264.1 Oilseeds 203.1 204.4 207.0 Sugar, Khandsari & Gur 173.7 170.6 168.8 Fibres 191.8 193.4 202.8 Condiments & spices 314.4 311.1 310.2 Other Food Articles 233.9 230.4 233.9 Food Articles 250.7 249.3 252.7
Source: Office of Economics Advisor, New Delhi, GOI
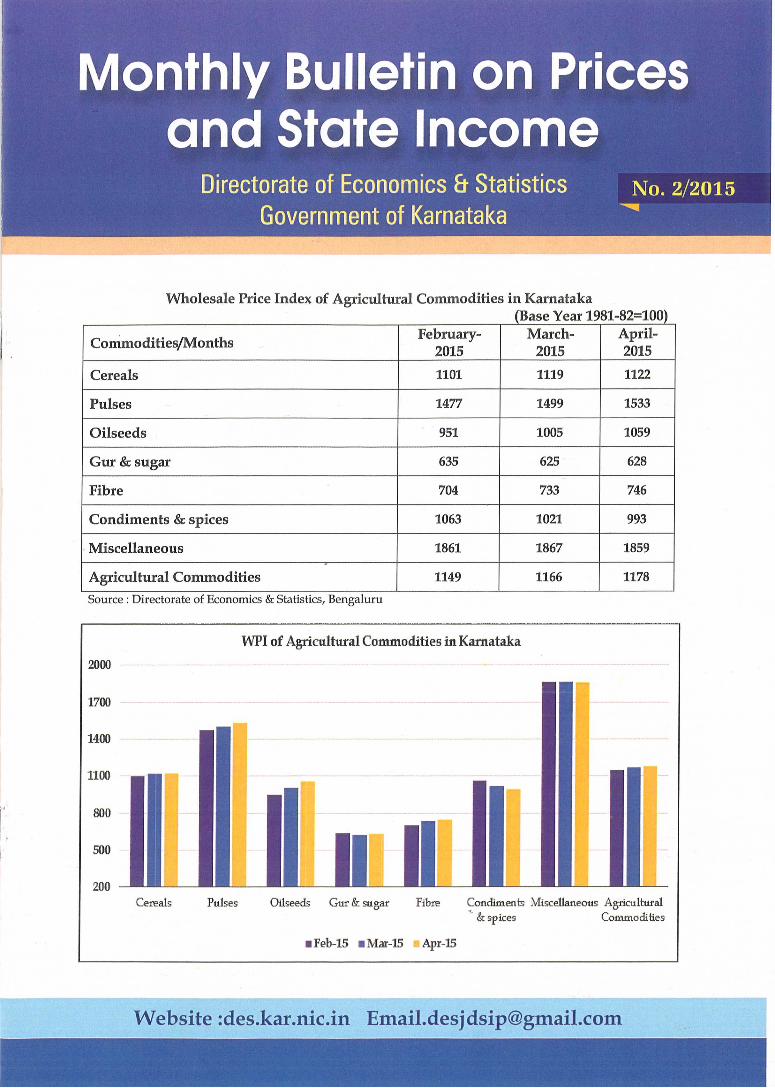
Wholesale Price Index for All Commodities in Karnataka
Year Feb Mar Apr
2013 1033 1060 1034 2014 1024 1033 1065
2015 1149 1166 1178 Source : Directorate of Economics & Statistics, Bengaluru
2 DES, Monthly Bulletin
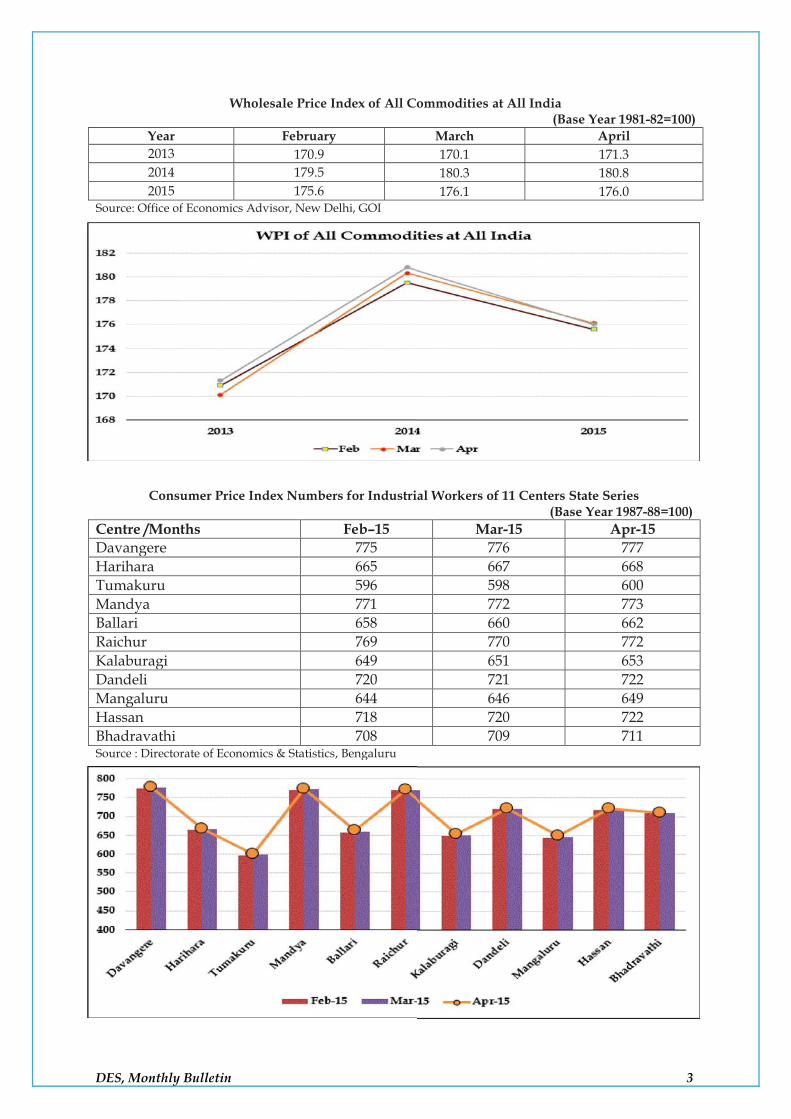
Wholesale Price Index of All Commodities at All India (Base Year 1981-82=100)
Year February March April 2013 170.9 170.1 171.3 2014 179.5 180.3 180.8 2015 175.6 176.1 176.0
Source: Office of Economics Advisor, New Delhi, GOI
Consumer Price Index Numbers for Industrial Workers of 11 Centers State Series (Base Year 1987-88=100)
Centre /Months Feb–15 Mar-15 Apr-15 Davangere 775 776 777 Harihara 665 667 668 Tumakuru 596 598 600 Mandya 771 772 773 Ballari 658 660 662 Raichur 769 770 772 Kalaburagi 649 651 653 Dandeli 720 721 722 Mangaluru 644 646 649 Hassan 718 720 722 Bhadravathi 708 709 711 Source : Directorate of Economics & Statistics, Bengaluru
DES, Monthly Bulletin 3
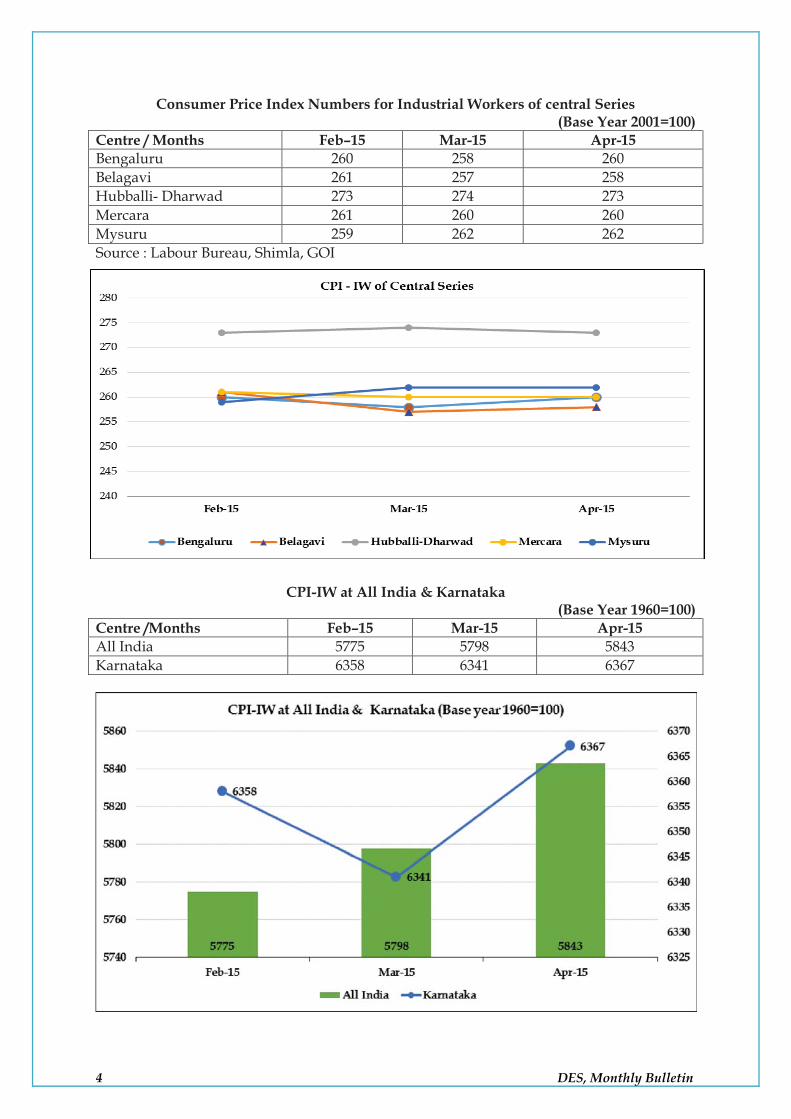
CPI-IW at All India & Karnataka (Base Year 1960=100)
Centre /Months Feb–15 Mar-15 Apr-15 All India 5775 5798 5843 Karnataka 6358 6341 6367
Consumer Price Index Numbers for Industrial Workers of central Series (Base Year 2001=100)
Centre / Months Feb–15 Mar-15 Apr-15 Bengaluru 260 258 260 Belagavi 261 257 258 Hubballi- Dharwad 273 274 273 Mercara 261 260 260 Mysuru 259 262 262 Source : Labour Bureau, Shimla, GOI
4 DES, Monthly Bulletin
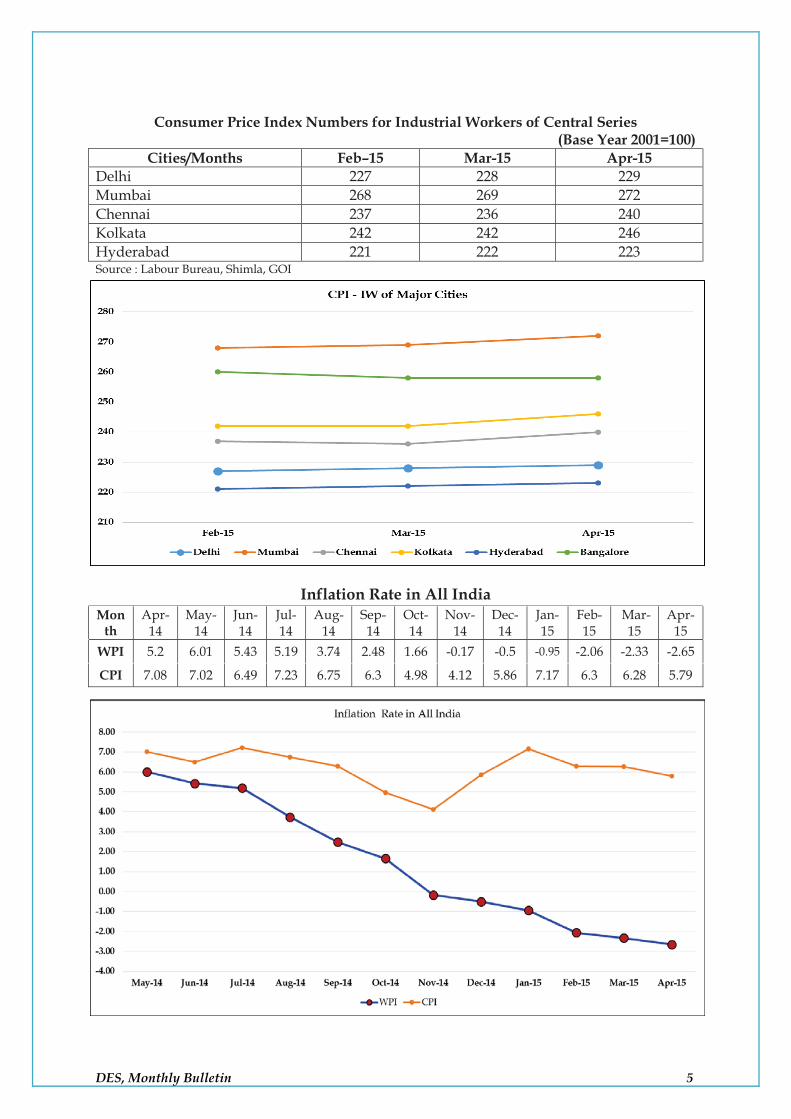
Inflation Rate in All India Mon
th Apr-
14 May-
14 Jun-14
Jul-14
Aug-14
Sep-14
Oct-14
Nov-14
Dec-14
Jan-15
Feb-15
Mar-15
Apr-15
WPI 5.2 6.01 5.43 5.19 3.74 2.48 1.66 -0.17 -0.5 -0.95 -2.06 -2.33 -2.65
CPI 7.08 7.02 6.49 7.23 6.75 6.3 4.98 4.12 5.86 7.17 6.3 6.28 5.79
Consumer Price Index Numbers for Industrial Workers of Central Series (Base Year 2001=100)
Cities/Months Feb–15 Mar-15 Apr-15 Delhi 227 228 229 Mumbai 268 269 272 Chennai 237 236 240 Kolkata 242 242 246 Hyderabad 221 222 223 Source : Labour Bureau, Shimla, GOI
DES, Monthly Bulletin 5
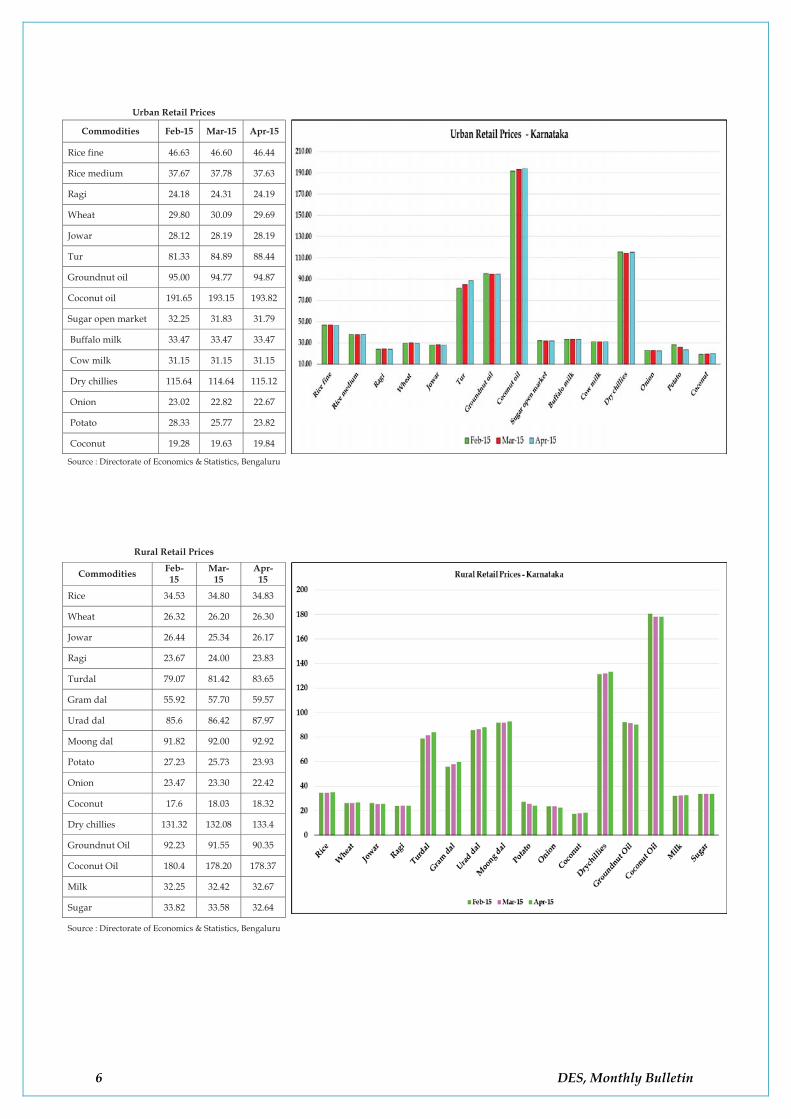
Urban Retail Prices
Commodities Feb-15 Mar-15 Apr-15
Rice fine 46.63 46.60 46.44
Rice medium 37.67 37.78 37.63
Ragi 24.18 24.31 24.19
Wheat 29.80 30.09 29.69
Jowar 28.12 28.19 28.19
Tur 81.33 84.89 88.44
Groundnut oil 95.00 94.77 94.87
Coconut oil 191.65 193.15 193.82
Sugar open market 32.25 31.83 31.79
Buffalo milk 33.47 33.47 33.47
Cow milk 31.15 31.15 31.15
Dry chillies 115.64 114.64 115.12
Onion 23.02 22.82 22.67
Potato 28.33 25.77 23.82
Coconut 19.28 19.63 19.84
Source : Directorate of Economics & Statistics, Bengaluru
Rural Retail Prices
Commodities Feb- 15
Mar- 15
Apr- 15
Rice 34.53 34.80 34.83
Wheat 26.32 26.20 26.30
Jowar 26.44 25.34 26.17
Ragi 23.67 24.00 23.83
Turdal 79.07 81.42 83.65
Gram dal 55.92 57.70 59.57
Urad dal 85.6 86.42 87.97
Moong dal 91.82 92.00 92.92
Potato 27.23 25.73 23.93
Onion 23.47 23.30 22.42
Coconut 17.6 18.03 18.32
Dry chillies 131.32 132.08 133.4
Groundnut Oil 92.23 91.55 90.35
Coconut Oil 180.4 178.20 178.37
Milk 32.25 32.42 32.67
Sugar 33.82 33.58 32.64
Source : Directorate of Economics & Statistics, Bengaluru
6 DES, Monthly Bulletin
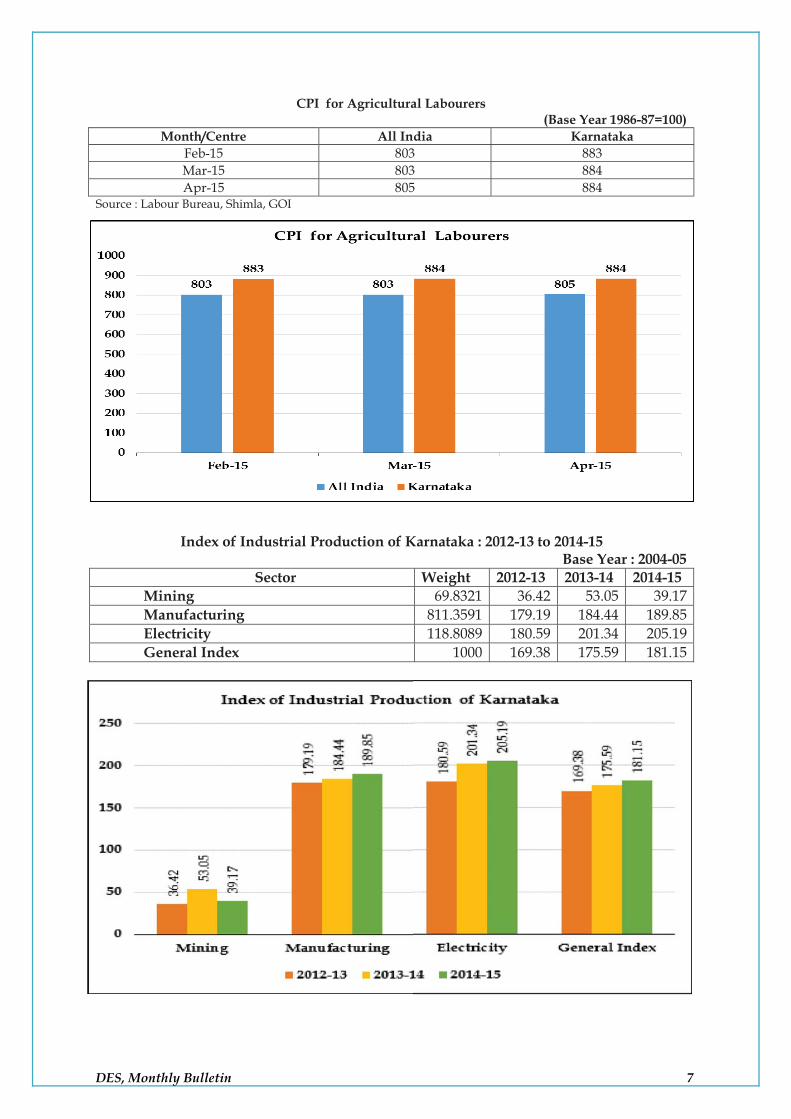
Index of Industrial Production of Karnataka : 2012-13 to 2014-15 Base Year : 2004-05
Sector Weight 2012-13 2013-14 2014-15 Mining 69.8321 36.42 53.05 39.17 Manufacturing 811.3591 179.19 184.44 189.85 Electricity 118.8089 180.59 201.34 205.19 General Index 1000 169.38 175.59 181.15
CPI for Agricultural Labourers (Base Year 1986-87=100)
Month/Centre All India Karnataka Feb-15 803 883 Mar-15 803 884 Apr-15 805 884
Source : Labour Bureau, Shimla, GOI
DES, Monthly Bulletin 7
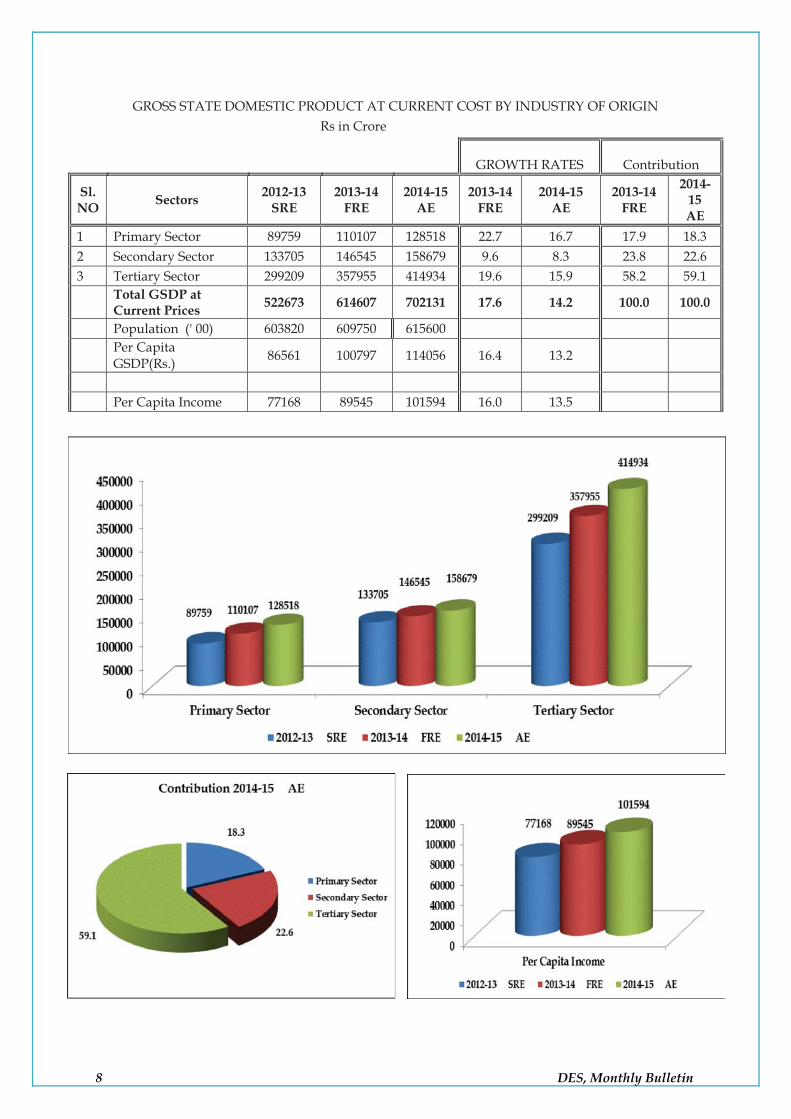
GROSS STATE DOMESTIC PRODUCT AT CURRENT COST BY INDUSTRY OF ORIGIN Rs in Crore
GROWTH RATES Contribution
Sl. NO Sectors 2012-13
SRE 2013-14
FRE 2014-15
AE 2013-14
FRE 2014-15
AE 2013-14
FRE
2014-15 AE
1 Primary Sector 89759 110107 128518 22.7 16.7 17.9 18.3 2 Secondary Sector 133705 146545 158679 9.6 8.3 23.8 22.6 3 Tertiary Sector 299209 357955 414934 19.6 15.9 58.2 59.1
Total GSDP at Current Prices 522673 614607 702131 17.6 14.2 100.0 100.0
Population (' 00) 603820 609750 615600
Per Capita GSDP(Rs.) 86561 100797 114056 16.4 13.2 Per Capita Income 77168 89545 101594 16.0 13.5
8 DES, Monthly Bulletin