Embed Size (px)
Citation preview
Who’s Afraid of the Big Enlargement?EEccoonnoommiicc aanndd SSoocciiaall IImmpplliiccaattiioonnss ooff tthhee EEuurrooppeeaann UUnniioonn’’ss PPrroossppeeccttiivveeEEaasstteerrnn EExxppaannssiioonn
CEPR Policy Paper No. 7
Tito Boeri, IGIER, Università Bocconi, Milano, Fondazione Rodolfo Debenedetti and CEPR
Guiseppe Bertola, European University Institute, Firenze and CEPR
Herbert Brücker, Deutsches Institut für Wirtschaftsforschung (DIW Berlin) and IZA
Fabrizio Coricelli, Università di Siena and CEPR
Juan Dolado, Universidad Carlos III de Madrid and CEPR
John Fitzgerald, Economic and Social Research Institute (ESRI)
Angel de la Fuente, Universidad Autonoma de Barcelona
Pietro Garibaldi, Università Bocconi, Milano and CEPR
Gordon Hanson, University of California, San Diego
Juan Jimeno, Fundación de Estudios de Economia Aplicada and CEPR
Richard Portes, London Business School (LBS) and CEPR
Gilles Saint-Paul, Université des Sciences Sociales de Toulouse and CEPR
Antonio Spilimbergo, International Monetary Fund (IMF) and CEPR
Editor: Romesh Vaitilingam

CCeennttrree ffoorr EEccoonnoommiicc PPoolliiccyy RReesseeaarrcchh
The Centre for Economic Policy Research is a network of over 580 Research Fellows and Affiliates, basedprimarily in European universities. The Centre coordinates the research activities of its Fellows andAffiliates and communicates the results to the public and private sectors. CEPR is an entrepreneur,developing research initiatives with the producers, consumers and sponsors of research. Established in1983, CEPR is a European economics research organization with uniquely wide-ranging scope andactivities.
CEPR is a registered educational charity. The Centre is supported by the European Central Bank, theBank for International Settlements, the European Investment Bank, 23 national central banks and 41companies. None of these organizations gives prior review to the Centre’s publications, nor do theynecessarily endorse the views expressed therein.
The Centre is pluralist and non-partisan, bringing economic research to bear on the analysis of medium-and long-run policy questions. CEPR research may include views on policy, but the Executive Committeeof the Centre does not give prior review to its publications, and the Centre takes no institutional policy positions. The opinions expressed in this report are those of the authors and not thoseof the Centre for Economic Policy Research.
Executive Committee
Chair Guillermo de la Dehesa Vice Chair Hans de Gier
Villy Bergström Denis Gromb Michael SaundersJan Krysztof Bielecki Marc Hendriks Kermit SchoenholtzDiane Coyle Bengt Holmström Miguel Sebastián GascónKevin Darlington Jan Häggström Andrew SmithQuentin Davies Giles Keating Juha TarkkaBernard Dewe Mathews John Lipsky Philippe WeilFernando Fernández Méndez Sergio Lugareside Andes Gerard LyonsDavid Folkerts-Landau Sanjit MaitraFrancesco Giavazzi Rafael Repullo
Officers
President Richard PortesChief Executive Officer Hilary BeechResearch Director Mathias Dewatripont
Centre for Economic Policy Research90-98 Goswell RoadLondon EC1V 7RRUKTel: (44 20) 7878 2900 Fax: (44 20) 7878 2999Email: [email protected] Website: www.cepr.org
© Centre for Economic Policy Research June 2002

Contents
Foreword
Executive Summary
11.. IInnttrroodduuccttiioonn 11
22.. LLaabboouurr mmaarrkkeettss:: wwhhaatt rreeffoorrmmss aarree nneeeeddeedd iinn tthhee WWeesstt ttoo aabbssoorrbb tthhee sshhoocckk ooff eennllaarrggeemmeenntt mmoorree eeffffeeccttiivveellyy?? 22
2.1 NAFTA as a preview of the adjustments involved in enlargement 3
2.2 Institutions that accommodated the adjustment to NAFTA and lessons for the EU 6
2.3 Towards more mobility-friendly institutions in the EU 8
33.. SSoocciiaall wweellffaarree:: wwhhaatt rreeffoorrmmss aarree nneeeeddeedd iinn tthhee EEaasstt aanndd hhooww mmaayy tthhee EEUU eennssuurree tthhaatt tthheeyy aarree iimmpplleemmeenntteedd?? 1111
3.1 Can income convergence be accelerated? 113.2 Policy trade-offs 143.3 Is there a role for EU conditionality? 173.4 Can financial contributions from the EU-15 make the
CEECs fulfil these conditions? 183.5 Towards a pan-European social safety net? 20
44.. EEaasstt--WWeesstt mmiiggrraattiioonn:: sshhoouulldd ffrreeee mmoovveemmeenntt ooff llaabboouurr bbee iinnttrroodduucceedd iimmmmeeddiiaatteellyy oorr oonnllyy aafftteerr aa ttrraannssiittiioonnaall ppeerriioodd?? 2233
4.1 Does waiting have an option value? 234.2 What restrictions on migration during the transitional
period? 314.3 Tackling illegal immigration: the US experience 324.4 Making the EU’s borders less porous 354.5 An EU-wide migration policy? 37
55.. RReeggiioonnaall ppoolliiccyy:: sshhoouulldd EEUU--wwiiddee rreeddiissttrriibbuuttiioonn bbee rreeffoorrmmeedd aanndd iiff ssoo,, hhooww?? 3399
5.1 Can structural funds accelerate income convergence? 395.2 Lessons from the EU’s Southern enlargement 475.3 How to share the costs of redistributive policies across
EU members 505.4 How to allocate the funds 53
References 54
List of Figures
Figure 1: National income per capita at PPP in USD – EU-15 +
Eastern Enlargement (1999) 4
Figure 2: Gross national income per capita at PPP in USD – North
America (1999) 4
Figure 3: Personal characteristics and attitudes towards EU enlargement
(percentage variation in the probability of being against) 19
Figure 4: Statutory contribution rates by social expenditure over GDP 20
Figure 5a: Estimated migration flows to Germany 30
Figure 5b: Estimated migration stocks in Germany 30
Figure 6: Evolution of structural fund allocations 40
Figure 7: EU structural funds allocated to cohesion countries 41
Figure 8: Allocation of structural funds, 1994-9 42
Figure 9: Regional distribution of FDI inflows (Spain, 1986-96) 47
Figure 10: FDI and EU funds in Spanish regions (1988-94] 48
List of Tables
Table 1: Basic indicators for the candidate countries in 2000 51
Table 2: Calculation of the net fiscal balances of new entrants under
current conditions given the 1998 redistribution coefficient
for the EU budget 53
Table 3: Benchmark allocation of the budget costs of enlargement
among the EU-15 and 1998 excess balances of these countries 54
List of BoxesBox 1: Estimating the migration potential of Eastern enlargement 25
Box 2: The contribution of EU regional programmes to employment
and output growth 45


Foreword
The initial enthusiasm of many EU citizens at the 'return to Europe' of former members ofthe Soviet bloc has turned to anxiety at the realization of the possible adverseconsequences of enlargement. Potential undesirable effects of enlargement, inparticular for labour markets and social conditions, can be met by appropriatelydesigned policies which are so far not in place or planned. Rather than legitimizingsuch fears, politicians and policy-makers must dispel them by leading the EU and itsmembers to adopt these measures. Enlargement also offers the EU a window ofopportunity to accelerate unavoidable reforms of structural policies, agriculturalpolicies and their financing. These are the premises of this new CEPR Policy Paper. Theauthors outline the key economic and social implications of the prospective accessionof the Central and East European countries into the European Union and proposepolicy recommendations for EU enlargement.
This Policy Paper is the result of major teamwork and all the members of the group arevery grateful to Tito Boeri for his tireless efforts in coordinating the project. As for allCEPR publications, the views expressed here are those of the authors writing in theirpersonal capacity. Their opinions are entirely independent from CEPR and from thefunders, Fondazione Rodolofi de Benedetti.
Many thanks go to Fondazione Rodolofi de Benedetti for their generous support for thisproject and to the CEPR staff members whose hard work and professionalism haveensured its successful execution – in particular to Publications Assistant, Michael Kelly.
HILARY BEECH5 June 2002


We analyse the economic and social implications of the prospective enlargement ofthe European Union (EU) to take in the Central and East European countries (CEECs).The initial enthusiasm for their ‘return to Europe’ has turned to anxiety about thepotential consequences. Many studies have shown the economic benefits forincumbent members, as well as for the new entrants. But many citizens of the currentEU-15 are concerned that the accession of countries with much lower incomes perhead will affect them adversely. There are fears of mass migration, pressures on welfaresystems, industrial relocation to the new EU members in response to lower labour costsand job losses for unskilled natives, displaced by more skilled migrants from the East.Some politicians relentlessly exploit these fears, with highly dangerous consequences.
We maintain that potential undesirable effects of enlargement, in particular for labourmarkets and social conditions, can be met by appropriately designed policies, whichare so far not in place or planned. Rather than legitimizing the fears, politicians andpolicy-makers must dispel them by leading the EU and its members to adopt thesemeasures.
EU governments are wary of the budgetary consequences of enlargement. Since mostcandidate countries have big agricultural sectors and low incomes per head, theextension of current agricultural and structural policies to new entrants would implylarge positive budget balances with the EU, which would have to be financed by thecurrent EU-15. Since the Laeken summit set a firm date (2004) for enlargement to takein most of the candidates, the pressure is now to establish long transition periodsbefore new members achieve full access to regional and agricultural programmes.The capping of structural fund transfers to new members at 4% of their GDP is likely tobe extended beyond 2006.
We argue that treating the new EU citizens differently would backfire. Structural fundsare aimed at promoting faster growth; without such policies, income convergencewould take too long. Investment in the public capital of the accession countries andsupport for the reform of their education systems and public administrations can helpaccelerate income convergence. Postponing full access to structural funds will not inpractice buy time until these countries get economically closer to the EU.
More broadly, enlargement offers the EU a window of opportunity to accelerate theunavoidable reforms of structural policies, agricultural policies and, indeed, the widerbudget. National governments could play a greater role in the allocation of funds tothe regions, in order to exploit better economies of agglomeration and to concentrateresources on meaningful infrastructure projects. The financing of regional policiesshould change to a system in which each country pays or receives proportionally to its
Executive Summary

distance from the average EU income per head. Agricultural policies should movefurther away from price supports towards explicit transfers to agricultural workers.
We consider arguments for a delay before lifting all restrictions on migration from Eastto West. We draw on the latest estimates of the potential flows of people, as well as theUS experience in tackling illegal immigration. Although we find that some estimates ofthe likely volume of migration are substantially exaggerated, there is a significantrange of uncertainty, so we conclude that there is indeed an option value to waiting.The waiting time should be used to smooth the adjustment process and to gain moreknowledge about the possible actual migration numbers. The current EU membersshould therefore begin to open their labour markets to migration from the CEECsinstead of maintaining their restrictive policies during the transitional period.
The accession of the CEECs will have a significant impact on labour markets in thecurrent EU member countries, with changes in the demand for labour, industriallocation and migration patterns. We consider how to promote adjustment to theseshocks by adapting the typical West European institutions of wage determination,employment protection and unemployment benefit. We draw on the experience of theUnited States and Canada since the early 1990s, when they went into a free-tradeagreement (NAFTA) with Mexico, their populous and much poorer southern neighbour.The simple lesson is that integration of economies at vastly different levels ofdevelopment calls for significant inter-industry and geographical labour mobility.
We therefore recommend:
1. More mobility-friendly labour market institutions among the current EU members; thatis, more unemployment insurance of short duration (because associated with measuresto encourage the unemployed into work); less employment protection legislation.2. Encouragement of candidate members to raise social welfare standards, both bymaking them a condition of accession and by offering financial assistance in theirdesign and start-up; accession countries should have minimum guaranteed-incomeschemes similar to those in place in most current EU members.3. EU coordination of the level of these minimum guaranteed income schemes,adjusted to take account of differences in the cost of living across countries andregions; the long-term plan should be to build up a pan-European social safety net asone of the pillar institutions of the EU.4. A transitional period before migration restrictions on new members are lifted,provided the period is clearly defined from the outset, restrictions are flexiblycoordinated at the EU level and existing restrictions on labour mobility within the currentEU (notably those preventing the cross-country portability of social security rights) aredismantled.5. Adoption of EU-wide migration policies, encompassing not only enforcement ofborder controls, but also on-site controls of illegal employment of migrants;6. Maintenance of structural funds at current levels, allocating regional funds tonational governments and making the funding schemes more transparent withoutviolating the resources ceiling for the EU budget set at 1.27% of GNP.
Executive Summary

Such measures are essential to integrate the new members successfully into the EU. Theprize is great: a Europe that fits its historical and cultural boundaries and exploits thetremendous economic benefits of a single market for 500 million people. The risks arealso great, and we must begin immediately to minimize them. The consequences offailure are only too clear.
Executive Summary


1. Introduction
What are the economic and social implications of the prospective enlargement of theEU to take in the CEECs? The initial enthusiasm at the ‘return to Europe’ of these formermembers of the Soviet bloc has turned to anxiety about the potential consequences.Many citizens of the current EU members – the EU-15 – are concerned that theaccession of countries with much lower per capita income levels than the currentmembers – the CEEC-10 (Bulgaria, the Czech Republic, Estonia, Hungary, Latvia,Lithuania, Poland, Romania, Slovakia and Slovenia) plus two or three other candidates– will have a range of adverse effects.
There are fears of mass migration, pressures on welfare systems, industrial relocation tothe new EU members in response to lower labour costs, and job losses for unskillednatives, displaced by more skilled migrants from the East. According to theEurobarometer survey (an opinion poll conducted on behalf of the EuropeanCommission at least twice a year among all EU members), roughly 40% of thepopulation of the EU-15 would currently vote an overwhelming ‘no’ to the Easternenlargement. At present, it seems that they are prepared to allow in only one country,Switzerland, which is richer than all the current members except Luxembourg.
While the fears of EU citizens are primarily focused on migration, EU governments areconcerned about the budgetary implications of enlargement. Since most candidatesfor membership have large agricultural sectors and low incomes per head, theextension of current agricultural and structural policies to new entrants would implylarge positive budget balances with the EU, which would have to be financed bycurrent members. This prospect is creating pressures to delay accession, to establishlong transitional periods for full access to certain programmes, notably the structuralfunds and the Common Agricultural Policy, and to curtail or reform these programmes.There is a fair amount of haggling and horse-trading among the EU-15 on how therelevant costs should be shared among them.
But Europe cannot renege on its commitment to integrate the East. And it cannotpostpone the process for too long: expectations have been raised of a fast andsmooth accession. Disappointing the citizens of the East may backfire, for example, byencouraging waves of illegal migrants to come in from these countries. After the tragicevents of 11 September 2001, the Eastern enlargement has also acquired a newsymbolic value: it is proof that it is possible to join the ‘rich man’s club’ even startingfrom low levels of income per head. The door so far left open by the EU to Turkey is alsoa door opened to the Muslim world.
A number of studies demonstrate convincingly that the benefits from enlargement interms of further trade integration and migration are substantial and will largely

outweigh the costs of accession at the EU aggregate level and at the level ofindividual EU members (for example, Baldwin et al., 1997; Lejour et al., 2001;Keuschnigg and Kohler, 1999, 2001; Breuss, 2001). Yet the concerns of citizens andgovernments suggest that there is no alternative to trying to ensure that the benefits ofenlargement will largely outweigh its costs not only in aggregate, but also at the levelof regions and local communities, minimizing the losses from the CEECs accession.
This requires four broad sets of policies:
1. Implementing structural reforms at home that will allow domestic labour markets toabsorb more effectively the shock associated with the entry of countries with muchlower levels of income per head.2. Making accession by the CEECs conditional on reforms to their systems of socialwelfare provision that will mitigate the undesirable distributional effects of enlargement.3. Allowing for a gradual dismantling of the remaining barriers to migration from thecandidates for accession.4. Reforming EU-wide redistribution policies so as to make them more transparent andto encompass the new members.
This report looks at these four issues in turn. Section 2 examines what reforms to thetypical West European institutions of wage determination, employment protection andunemployment benefit might be necessary to adjust to the shock of enlargement moreeffectively. It draws on the experience of the United States and Canada since the early1990s, when they extended their free-trade agreement to incorporate Mexico, theirpopulous and much poorer southern neighbour.
Section 3 explores the potential for convergence of income levels between the currentEU members and the candidates for accession, and some of the policy trade-offs thatthe CEECs face. In particular, it examines how the EU can encourage its aspiringmembers to establish better standards of social welfare, both by making them acondition of accession and by offering financial assistance in their design and start-up.
Section 4 considers the reasons for a transitional period following the CEECs’ accessionbefore lifting all restrictions on migration from the East to the West. It draws on the latestestimates of the potential flows of people as well as North America’s experience intackling illegal immigration.
Finally, Section 5 addresses reform of the EUs structural funds: their potential impact onconvergence, how the limited budget should be allocated and how the costs ofredistribution should be shared. It draws on the experience of the Southernenlargement in 1986, when Spain and Portugal became EU members.
2 Introduction

2. Labour markets: what reforms are needed in theWest to absorb the shock of enlargement moreeffectively?
The accession of the CEECs will have a significant impact on labour markets in thecurrent EU members, potentially leading to changes in the demand for labour, inindustrial location and in migration patterns. This section examines what reforms to thetypical West European institutions of wage determination, employment protection andunemployment benefit might be necessary in order to adjust to the shock of suchdevelopments more effectively.
The section draws on the experience of the United States and Canada since the early1990s, when they extended their free-trade agreement to incorporate Mexico, theirpopulous and much poorer southern neighbour. The simple lesson is that integration ofeconomies at vastly different levels of development calls for significant inter-industryand geographical labour mobility, which labour market institutions in the EU shouldfacilitate, not hinder.
22..11 NNAAFFTTAA aass aa pprreevviieeww ooff tthhee aaddjjuussttmmeennttss iinnvvoollvveedd iinn eennllaarrggeemmeenntt
Important lessons on what types of reform of employment, wage-setting and socialpolicy institutions could promote smoother labour market adjustment in an enlargedEurope can be drawn from the North American Free Trade Agreement (NAFTA) of 1993,which extended the US-Canada Free Trade Agreement of 1989 to include Mexico.Differences in initial conditions, between North America and Mexico, on the one hand,and the EU-15 and the CEEC-10, on the other, are comparable. Just like Mexico inrelation to the United States and Canada, the candidates for EU accession are not onlygeographically close to the existing trading bloc, but they also have low incomes andlarge populations (Figures 1 and 2)1.
Of course, the two experiments in integration are very different in other respects.Mexico began unilateral market liberalization a decade or so before petitioning to jointhe larger free-trade area, and the CEECs have enjoyed essentially free bilateralaccess to many key EU markets during the process of post-communist transition. NAFTAis strictly focused on free trade among its members, and the EU encompasses acommon external trade policy, free movement of labour and regulatory harmonization.
1. In nominal terms, Mexico’s income per head in 1993 was 12% of the US level, and the CEEC-10s is 12% of the EU-15 level. The working-age population of the aggregate US-Canadian economy was about 3.7 times larger thanMexicos in 1993, and on the same basis the EU-15’s is 3.4 times larger than the CEEC-10.
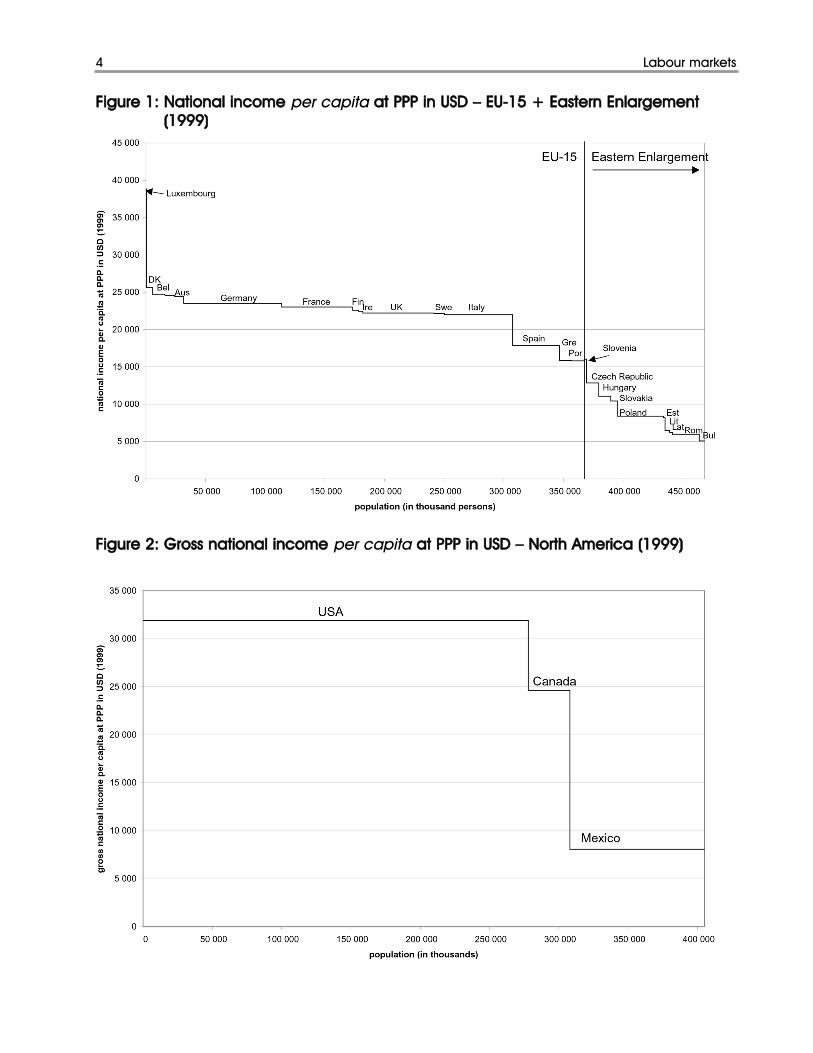
Figure 1: National income per capita at PPP in USD – EU-15 + Eastern Enlargement (1999)
Figure 2: Gross national income per capita at PPP in USD – North America (1999)
4 Labour markets

Labour markets 5
Even more importantly, the structure of internal policies is quite different in the twoblocs: in particular, the labour market institutions typical of EU members impose muchmore stringent regulations on employment and wage-setting than is the case in NorthAmerica2. Nevertheless, with these qualifications, the NAFTA experience offers a usefulpreview of the possible effects of enlarging the EU to include the CEECs.
Mexico’s integration into the North American economy began not with NAFTA but withthe country’s unilateral trade and investment reforms in the 1980s. Since then, therehas been a dramatic increase in regional trade in manufactured goods, most of whichhas been a result of production sharing between US and Mexican firms (Hanson, 1998).In industries such as apparel, auto parts, machinery and electronics, which in 1998accounted for 58% of total trade between the two countries, the United Statesproduces components and exports them to Mexico, where they are assembled intofinished goods and then exported back to the United States. Under this arrangement,US firms specialize in research and development, the production of skill- or capital-intensive inputs, and marketing and distribution, and Mexican firms specialize in thenarrow task of product assembly.
Mexican export assembly plants, known as maquiladoras, now account for 15-20% ofmanufacturing employment in Mexico and have been the country’s fastest growingindustrial sector for two decades (Vargas, 2000). Some maquiladoras are created byUS direct investments in Mexico, but many are owned by Mexican nationals.Production sharing between Mexican and US firms has entailed three types of labourmarket adjustment in the two countries:
1. changes in the composition of demand for industrial workers.2. changes in industrial location.3. potential changes in migration patterns.
Demand for labour
The demand for labour has changed significantly in both countries. As US firms havemoved labour-intensive production activities to Mexico, they have shed productionlabour and other workers with low education levels. The majority of these workersappear to have left manufacturing and now work in the service sector, often at muchlower wages (Kletzer, 2001).
A high degree of inter-sectoral mobility of labour within the United States has helpedfacilitate this transition. Similarly, in Mexico, the expansion of export assembly hasincreased the demand for younger, more educated workers, particularly females.Rapid growth of the supply of labour, including increased female labour forceparticipation, has helped to sustain the expansion of maquiladoras.
2. See Bertola (1999) for a review of theoretical and empirical comparative work in this area.
6 Labour markets
Industrial relocation
The pattern of industrial location has changed too. As US-Mexican trade has increased,US firms have shifted input production from traditional manufacturing sites in themidwest and northeast to sites in California, Texas and elsewhere in the southwest(Hanson, 2001). They have also expanded the provision of transport, distribution andother trading services in the US-Mexican border region.
The regional shift in labour demand, which has many other contributing factors(Blanchard and Katz, 1992), has been accommodated by migration within the UnitedStates towards the western and southwestern states (and by the creation of newhousing supplies). In Mexico, the expansion of production by maquiladoras hascontributed to a massive relocation of industrial activity from the centre of the countryto cities near the US-Mexican border. In both countries, expanded US-Mexican tradehas contributed to a relocation of economic activity towards the border.
Immigration
The third type of labour market adjustment relates to immigration, a key feature of US-Mexican economic integration. Though not covered by NAFTA, which does notenvisage any liberalization of cross-border labour flows, US policies that favour familyreunification allow 75,000-100,000 legal immigrants from Mexico to enter the countryeach year. Another 100,000-150,000 immigrants enter illegally by crossing the border.
The majority of the nearly 8 million Mexican immigrants living in the United States areclustered in the main border states: California with 44% of the total, Texas with 22%and Arizona with 5% (no other state has more than 3% of the total, apart from Illinoiswith nearly 6%). Immigrant labour has been absorbed in agriculture, apparel and foodprocessing, as well as non-traded activities like construction, household services, andrestaurants and lodging (Smith and Edmonston, 1997). The fact that Mexicanimmigrants continue to flow to the United States is a clear indication that expanded US-Mexican trade has not yet closed sufficiently the large wage differentials between thetwo countries nor has absorbed the large Mexican unemployment pool.
22..22 IInnssttiittuuttiioonnss tthhaatt aaccccoommmmooddaatteedd tthhee aaddjjuussttmmeenntt ttoo NNAAFFTTAA aanndd lleessssoonnssffoorr tthhee EEUU
Mexican immigrants in the United States are predominantly in low-paid jobs, whichtypically offer minimal non-wage benefits such as health care or training (Borjas, 1999).Particularly in agriculture and construction, the hiring of labour often occurs in spotmarkets, in which immigrants obtain jobs on a daily or weekly basis. The flexibility andfluidity of labour markets for very low-wage workers in the United States appear to beimportant in how the country absorbs the roughly 300,000 new immigrants with lessthan a high-school education who enter the country each year (US Immigration andNaturalization Service, 2000). With Eastern enlargement of the EU, migration flows,notably of unskilled workers, are likely to be smaller than NAFTA’s (see Section 4 of this

Labour markets 7
report) but not insignificant.
Mexican migration to the United States has been fuelled by other reforms in Mexicoapart from the liberalization of trade and investment that culminated with NAFTA. Overthe course of the last decade, Mexico has dismantled communal landholding inagriculture and a system of subsidies and price controls that supported ruralproducers. This has further contributed to the flow of labour from rural areas to Mexicancities and to the United States. Unlike the CEECs, Mexico has no social safety net thatcould reduce migration pressures.
In common with other Anglo-Saxon countries, the United States and Canada allow theirlabour markets to adjust flexibly within an institutional framework of decentralized wagebargaining, low minimum wages and temporary unemployment insurance. In contrast,continental European countries tend to regulate their labour markets by interferingmore heavily in the processes of wage and employment determination: wage-setting iscentralized (and/or bound by stringent minimum wage legislation) and job creationand destruction are subject to considerable administrative constraints.
The CEECs’ pattern of comparative advantage and the NAFTA experience in theaftermath of integration suggest that the Eastern enlargement will call for significantlyfaster rates of inter-industry labour reallocation in current EU members. Past evidenceindicates that it would be hard for their labour markets’ institutional configurations toaccommodate this. In Germany, for example, apprenticeship-based training andindustry-level wage bargaining have historically resulted not only in high productivity atthe industry level, but also in remarkably low rates of worker mobility across employersand especially across industries and occupations (OECD, 1997). Indeed, Europeansgenerally tend not to change jobs frequently: Labour Force Survey data show that onaverage in 2000 only 16.4% of the working population had been with their employersless than one year. Comparable analysis suggests a figure of around 30% for theUnited States (OECD, 1996).
Many EU labour markets also appear ill suited to coping with the other dimension ofpost-NAFTA adjustment, namely the geographical relocation of existing industries. Ofcourse, regional labour mobility is much lower in Europe than in the United States.According to the European Community Household Panel (which surveys a large sampleof households representative of each EU member, asking the same questions abouteducation, jobs, families, incomes, etc.), 1 out of 200 EU citizens (0.5%) changeresidence every year. In contrast, in the United States, around 6.7 million people (2.5%)move across state boundaries every year. Although it is of course true that US states aremore numerous and, on average, smaller than EU members, the difference in mobilityrates is striking.
This is not solely a reflection of cultural and language differences: after all, in the 1950sand 1960s, workers did move more around Europe, both within countries towards citiesand industrial areas, and across borders. Rather, the relative immobility of Europeansreflects the same institutions that underlie slow inter-industry mobility. ContinentalEuropean systems of industrial relations and social policy tend to subsidize non-
8 Labour markets
employment in declining areas, and fail to reward mobility with the wage differentialsand easy job-finding opportunities that motivate Americans to migrate towardsbooming regions.
Other institutions discourage mobility across EU members. Linguistic differences arecertainly a major obstacle to cross-country labour flows: there are currently 11 differentlanguages within the EU and, and following a full Eastern enlargement, there would be21. But there are also important barriers to mobility arising from a lack of institutionalcoordination across EU members, which puts a de facto tax on labour flows. Forexample, different national regulations on supplementary pensions and the absenceof harmonized taxation rules for retirement savings can significantly reduce the pensionwealth of workers moving between EU members. Health-care systems also vary widelyamong countries and extra costs may be incurred in joining a new system.
The growing proportion of non-EU citizens resident in the EU seems to be more mobilethan the rest of the workforce. According to the European Community HouseholdPanel, a pan-European survey tracking individuals even when they change dwelling,about 6 out of 100 non-EU citizens of working age change residence inside the EUevery year compared with 1 out of 200 EU natives. The presence of more immigrantswill help the EU to have a more mobile labour force. Immigrants ‘grease the wheels’ ofEuropean labour markets, an effect that is often ignored in debates about migration.
With the likelihood of continuing labour demand shocks over the course of individuals’working lives, labour market rigidities can have the beneficial effects that originallymotivated their introduction3. But they also tend to prevent accommodation of one-time adjustment pressures like those that are likely to emerge as a result of Easternenlargement, judging by the NAFTA experience. By removing the incentives for labourto be reallocated, regulation undoubtedly reduces productive efficiency and thereturns to capital. This is particularly undesirable when economic integration calls forone-time adjustment at the same time as it removes obstacles to the mobility of bothlabour and capital.
22..33 TToowwaarrddss mmoorree mmoobbiilliittyy--ffrriieennddllyy iinnssttiittuuttiioonnss iinn tthhee EEUU
The simple lesson of the NAFTA experience is that integration of economies at vastlydifferent levels of development calls for significant inter-industry and geographicallabour mobility. EU governments should not restrict this mobility through excessiveregulations on employment protection (which raise the cost to firms of dismissingworkers) or by maintaining the current obstacles to intra-EU migration. In order to takeadvantage of the opportunities for efficiency-enhancing trade and migration arisingfrom the Eastern enlargement, we believe that labour market institutions in the EU
3. For example, insulating employment relationships from market pressure and shocks can provide insurancebenefits to workers (Bertola, 2001) and foster accumulation of specific human capital (Acemoglu and Pischke,1998). These second-best arguments for employment protection apply particularly in the presence of capital-marketimperfections that make it difficult for individuals to finance education and training.

Labour markets 9
should be reformed in the direction of the mobility-friendly configuration of NorthAmerican countries.
In order to shelter workers from labour market shocks when competitive pressures arestrong and significant structural adjustment essential, it is preferable to rely mainly onunemployment insurance and in-work benefits than on employment protectionlegislation. In so far as enlargement has similar effects to closer European integrationand monetary union in increasing the elasticity of labour demand, the adverse effectsof rigid institutions on employment and growth are exacerbated (Boeri and Bertola,2001). Although protecting workers against labour market risk inevitably reducesefficiency, unemployment insurance can cover a larger segment of the labour force(not only those who already have a permanent contract) than employment protection,while involving fewer efficiency losses.
Of course, prospective Eastern enlargement need not be the main rationale for suchreforms. Rather, deeper integration with relatively poor economies adds to existingpressures for reform from increasingly intense competition within and across countries(Bertola et al., 2001). Reforms of this kind have been advocated – and sometimesalready implemented – so as to cope with competition coming from less developedcountries, and indeed from deregulation within the EU.
Mobility-oriented labour market reforms are likely to result in higher employment rates,but they recommend themselves particularly for the purpose of taking advantage ofnew productive opportunities generated by integration. Removal of trade and mobilitybarriers unavoidably generates losses as well as gains. To ensure that gains more thanoffset losses, institutions must be designed so as to facilitate rather than preventchange. Preventing losses may seem to be the more politically attractive option, but itcan also eliminate all gains.
Reforms need not take the form of simple deregulation. Systems of temporaryunemployment insurance can to some extent reconcile worker protection and mobilityby providing financial incentives to find work, especially when job search effort isappropriately monitored. Similarly, search assistance, as well as a framework ofsubsidized training (or lifelong learning), can make it possible to cope with reallocationdemands without burdening workers with an unfair share of the cost of transition.
Labour market reforms should, in fact, proceed in step with appropriate deregulationof product and capital markets. Evidence reported in Boeri et al. (2000) indicates thatproduct and labour markets are both highly regulated in continental Europeancountries, and improving workers access to financial and insurance markets is essentialin order to make labour market deregulation politically acceptable. But wage flexibilityand benefit reduction are vital for the more dynamic labour market configuration thatmay properly support the transition to the full integration of an enlarged EU.
Some of these mobility-friendly reforms will require concerted action at the EU level. Inparticular, it is important that supranational authorities remove remaining legal,administrative and fiscal barriers to the portability of supplementary pension rights

10 Labour markets
across EU members and that the employment principle in the provision of socialsecurity to immigrants is properly enforced. This principle means that individuals canhave access to the social security system of the country to which they relocate as longas they have had a job, with entitlement to social security defined on the basis of thelength of their contribution records.
3. Social welfare: what reforms are needed in theEast and how can the EU ensure that they areimplemented?
The differences in income levels between the current EU members and the candidatesfor accession are substantial. The gap raises important questions about the likelyspeed at which the East can catch up with the West and the policies that mightaccelerate such convergence, such as higher-quality institutions and improvedinfrastructure, both physical and social. But some policies, such as attracting higherflows of foreign capital and encouraging the emigration of unskilled labour, may beless than attractive to citizens of the EU-15.
This section explores the potential for income convergence and some of the policytrade-offs that the CEECs face. In particular, it examines how the EU can encourage itsaspiring members to establish better standards of social welfare, both by making thema condition of accession and by offering financial assistance in their design and start-up. We argue that the CEECs should have minimum guaranteed-income schemessimilar to those in place in most current EU members and, if necessary, they should beco-funded by the EU.
33..11 CCaann iinnccoommee ccoonnvveerrggeennccee bbee aacccceelleerraatteedd??
NAFTA did not involve free labour mobility, but the Eastern enlargement of the EUimplies – albeit not necessarily immediately – the liberalization of labour movementsoriginating from the new members. Episodes of economic integration that involve theliberalization of labour movements between countries at very different levels of incomeper head have historically been accompanied by explicit or implicit subsidy ofunemployment in the low-income countries and regions4.
Even in North America, subsidies from rich to poor regions have been used to limit themigration of labour. For example, the United States sent generous income transfers toPuerto Rico, totalling an annual average of 17% of the territory’s GDP, over the period1971–91, in part to slow migration from the island to the US mainland.
German unification is a similar case: public transfers from western Germany have beenas high as 80% of eastern Germany’s GDP, allowing for fast wage convergence. Largesubsidies to poor integrating regions were in this case the other side of the coin of the
4. For a model and a review of simple evidence from the United States and Puerto Rico, eastern and westernGermany, Spain and the EU, and Italian regions, see Spilimbergo (1999).

adoption of a single regulatory framework. As shown by the experience of the ItalianMezzogiorno over a long period, and so far confirmed by the experience of easternGermany after unification, this type of integration results in slow growth, long-termunemployment and inactivity in the poor regions.
This is a problem common to large countries with institutions that compress wage-setting and inhibit regional labour mobility. Employment performance is worse in thelarger, more heterogeneous countries of continental Europe than in smaller countrieslike Austria, Ireland, the Netherlands and Portugal, where labour market policies do notinterfere with the adjustments entailed by the coexistence of differently developedregions within a single regulatory framework.
In the context of Eastern enlargement, it is difficult to envisage transfers being used toboost incomes and limit migration, at least on the scale involved in Germanunification. But the CEECs are substantially poorer than the EU average (at most 35% ofthe EU’s PPP-adjusted GDP per head, and 12% in nominal terms), and in 41 of the 53regions of the CEECs, income per head is significantly below the EU average. Inaddition to the average low level, the dispersion of income per head in differentregions of the CEECs is striking. In 1998 income levels per head in Prague were 115%of the EU average, while the income per head of most regions in Bulgaria andRomania was less than 30% of the EU average. Moreover, even in some regions ofPoland, GDP per head was 26% of the EU average in 1998.
Since the starting point of the CEECs’ incomes per head is much lower than in the EU-15, a key issue is how long it will take for these countries to close this income gap.Econometric analysis of post-war income convergence in Western Europe suggests thatif the CEECs adopt the policies of the EU-15, they will converge slowly: it will take morethan three decades to halve the income gap with the current EU members.
For example, analysis using traditional growth regressions to extrapolate the CEECs’prospects (as in Barro and Sala-i-Martin, 1991; Levine and Renelt, 1992) leads toprojected annual growth rates of around 5%, implying a rather slow process ofconvergence not only with the average income of the EU as a whole, but even withthat of low-income members like Greece, Portugal and Spain (Fischer et al., 1998).These estimates are broadly consistent with the rate of conditional convergence of 2%found by Barro and Sala-i-Martin (1991, 1995). Conditional convergence is the rate ofconvergence towards the steady-state level of income of the benchmark countries,taking account of the effects of a set of variables that influence economic growth5.
Among the key factors fostering growth in the CEECs is the level of human capitalendowments, although there are questions about the quality of secondary and notablyvocational education in these countries (Boeri, 2000). Less favourable for growth,according to Barro and Sala-i-Martin (1991), is the high government consumption,though fiscal discipline induced by EU accession would imply a reduction in
5. Studies taking account of the role of terms-of-trade effects have found a slower rate of convergence of around1.3% (Acemoglu and Ventura, 2001).
12 Social welfare
government consumption and a consequent improvement in growth prospects. Forexample, Fischer et al. (1998) assume a reduction to 10% in the ratio of governmentconsumption to GDP.
EU accession could also have a strong impact on institutional development. Toevaluate the effects of institutional change on growth, traditional growth regressionsneed to be amended (as discussed in Rodrik, 2000; Romer, 2000) to include variablesthat account for institutional development, adding the positive effects throughimproved institutions on the traditional channels of growth-generating effects ofeconomic integration (via trade creation). But using Knack and Keefer’s (1993)specification, which adds to the Levine and Renelt analysis a proxy for institutionaldevelopment (obtained from data gathered by the International Country Risk Guide onthe effectiveness of the legal system and the level of corruption), growth prospectswould be significantly reduced (EBRD, 1997).
Such a conclusion is reached by comparing findings on future growth in transitioncountries (from Levine-Renelt specifications) with those from an alternative specificationthat includes an index of institutional development6. The latter implies a downwardrevision of the estimated long-run growth trend: even for those CEECs with high-qualityinstitutions (and for which institutional data are available), the absence of furtherinstitutional change would, according to these calculations, lower long-term growthrates by about 1.5% a year. Needless to say, this would slow down convergencesignificantly.
Institutions affect growth not only through public investment in infrastructure, but alsothrough social infrastructure, the systems of health care, education and welfareprovision. Moreover, a broad notion of institutions includes redistributive policiesintended to compensate losers (as discussed in Section 5 of this report) that may beco-funded by the EU, for example via the structural funds. These factors are crucialthough difficult to quantify. But it is likely that faster institutional convergence wouldsignificantly improve the prospects for economic convergence.
Most significantly, it seems clear that postponing the accession or reducing the scopeof integration would reduce the pace of income convergence. Empirical workindicates that monetary union may have a large potential impact on trade creationand growth: Frankel and Rose (2000), in particular, calculate that monetary unionraises trade among members by a factor of 2-3, and this in turn raises growth. Theseestimates are probably over-optimistic, but they are surely evidence of a significantpositive effect that would imply an increase in the rate of convergence. Delaying theEastern enlargement may retard this process, and uncertainty on entry dates is likely toslow down investment, both foreign and domestic, in the candidates for accession,with adverse effects on output growth.
Social welfare 13
6. This is a composite index encompassing ‘expropriation risk’, ‘rule of law’, ‘risk of contract repudiation by thegovernment’, ‘corruption’, and ‘quality of the bureaucracy’ (EBRD, 1997). The enlarged Levine-Renelt specificationincludes enrolment rates in primary school, changes in international prices and growth of labour force (instead ofpopulation).

14 Social welfare
33..22 PPoolliiccyy ttrraaddee--ooffffss
One key factor in increasing the rate at which incomes per head in the CEECsconverge on those in the EU-15 is foreign direct investment (FDI). But policies designedto attract foreign capital to the CEECs may not be entirely agreeable to current EUmembers, who may believe that it is being diverted or ‘exported’ from the West.Similarly, sizeable ‘exports’ of unskilled labour from the CEECs to the EU-15, which wouldalso promote income convergence, are unlikely to be palatable to citizens of the lattercountries. Such ‘exports’ could be encouraged by maintaining social welfare at a lowlevel: while on paper the CEECs have a wide range of social policy instruments, theyactually achieve a low coverage of the working-age population, as there is a sizeableinformal sector.
Attracting foreign direct investment
Attracting foreign capital to the CEECs, by allowing them to offer tax breaks and otherfavourable conditions for multinational firms, may generate FDI inflows immediatelyafter accession that are more than twice as large as current inflows. The experience ofthe EU’s Southern enlargement in 1986 suggests that there could be higher FDI inflowseven in the absence of tax breaks: flows to Spain and Portugal went from less than 1%of their combined GDP in the period 1975-85 to around 3% in the second half of the1980s, after they joined the EU.
Admittedly, this increase in FDI inflows occurred during a period of increasing globalcapital movements. What is more, the increase was transitory, with inflows falling backto around 1% of GDP in the 1990s7. Nevertheless, using projections for trade potentialtogether with the fact that trade and current account deficits are matched by capitalmovements, Boeri et al. (2001) estimate that capital flows to the CEECs may double inthe wake of accession, even in the absence of tax breaks for foreign capital.
Exporting unskilled labour
The estimates of migration from the CEECs to the EU-15 discussed in Section 4 of thisreport suggest annual flows of around 300,000 people a year (of whom two-thirdswould go to Germany), falling to 150,000 within a decade of accession (Boeri et al.,2001). In the long-run, the foreign population from the CEECs residing in the EU isestimated to increase from 850,000 to 2.9-4.5 million. At 0.8% and 1.2% of the EU’spopulation and labour force respectively, these proportions are not huge. Yet they aresubstantially more than was experienced as a consequence of the EU’s Southernenlargement.
7. The contrast between the Iberian experience and Greece is interesting: FDI inflows to Greece remained at 1.0-1.5% in the period 1975-95, and the Greek accession to the EU in 1981 did not produce any significant rise. Thetiming of the Greek accession (before the global expansion of FDI), the political instability at the time and the poormacroeconomic performance of the Greek economy during the 1980s are undoubtedly relevant factors inexplaining why FDI inflows to Greece did not increase at the same rate as in Spain and Portugal (Alogoskoufis,1995).

Social welfare 15
Net migration flows from Spain and Portugal to the EU were close to zero during thesecond half of 1980s, with no significant trend in Spain and even a decreasing one inPortugal. Admittedly, this was a period when both countries enjoyed a strong cyclicalboom with employment rising very fast. Furthermore, despite EU accession, there wererestrictions on migration for a transitional period of seven years. Yet even when therestrictions were lifted, coinciding with the recession of the early 1990s and a time ofintense job destruction, there was barely any rise in migration flows from either country:net flows remained more or less constant in Spain throughout the 1990s at the samelevel of the 1980s, while increasing only marginally in Portugal.
This weak response can partly be ascribed to income differentials that were muchsmaller and travel distances that were considerably larger than is the case with someof the CEECs. In addition, the increasing generosity of benefits for those who are notemployed (in Spain since the early 1980s and in Portugal since the early 1990s) as wellas flows of public capital to develop basic infrastructure (education, health, transport,etc.) in the poorest regions of these countries have contributed significantly to reducedlabour mobility.
How likely is it that immigrants from the CEECs will be unskilled? In contrast to the mainsource countries of South-North migration (Greece, Morocco, Portugal, Spain, Turkeyand Yugoslavia), the formal education levels of the workforce in the CEECs are high.Labour Force Survey data suggest that the formal education levels of migrant workersfrom the CEECs are on average equal to or higher than those of EU natives. But thesefigures require some qualifications:
First, the Labour Force Survey data overestimate education levels since temporarymigrants are under-reported.
Second, migrant workers from the East tend to work in the same sectors as otherforeigners, concentrated in industries with high shares of manual and less skilled work,such as construction, cleaning services and manufacturing.
Microeconometric evidence suggests that the returns to human capital are low forimmigrants from the CEECs (Kreyenfeld, 1999; Konitzka and Kreyenfeld, 2001). Soalthough the formal education of migrants from the CEECs is substantially higher thanthat of other foreigners, at present they compete with other foreigners for less skilledjobs. This is not unusual, since it is well-known that assimilation into labour markets takestime. It is also worth noting that EU migrants depend less on welfare than natives inGermany (Riphahn, 1998; McCormick et al., 2002).
But the human capital characteristics of migrants from the CEECs may change duringthe course of Eastern enlargement. Basic migration theory suggests that, ceterisparibus, the composition of migrant populations is determined by the distribution ofincome in the sending countries relative to the receiving countries (Borjas, 1987; Roy,1951). At the beginning of the transition process, incomes were distributed moreequally in the CEECs than in the market economies of Western Europe, butsubsequently the distribution of income has approached West European levels. As a

16 Social welfare
consequence, the incentives of highly skilled workers to migrate should have lessenedrelative to those of low-skilled workers during the transition process.
The likely EU response
While for current EU members importing unskilled labour and exporting capital willimprove economic efficiency, such outcomes are unlikely to be palatable to theircitizens. Capital mobility is already being resisted by workers in the West, as evidencedby the struggle against globalization. And immigration is already thought to be at acritical level in many countries. According to the Eurobarometer survey (seeMcCormick et al., 2002), a majority of Europeans are in favour of zero immigration.Moreover, in a special Eurobarometer survey carried out in 1997, almost one-third ofrespondents openly described themselves as ‘quite racist’ or ‘very racist’.
Furthermore, there is some evidence that those immigrants most likely to be dependenton the welfare state select recipient countries with more generous benefits. McCormicket al. (2002) report that in Austria, Belgium, Denmark, Finland, France and theNetherlands and, non-EU citizens are over-represented in the pool of unemploymentbenefit recipients, even after controlling for personal characteristics (for example,when comparisons are made with reference to low-skilled workers with the samenumber of dependent children).
It is, therefore, not ludicrous to conjecture that a perception by the public that thecandidates for accession may adopt a strategy of exporting unskilled labour couldgenerate political support against the Eastern enlargement, especially in the moregenerous countries. Indeed, in the 1997 Eurobarometer survey, the EU members withthe largest proportion of respondents expressing concern about the possibility ofmigrants abusing the welfare state were those with the most generous social welfaresystems.
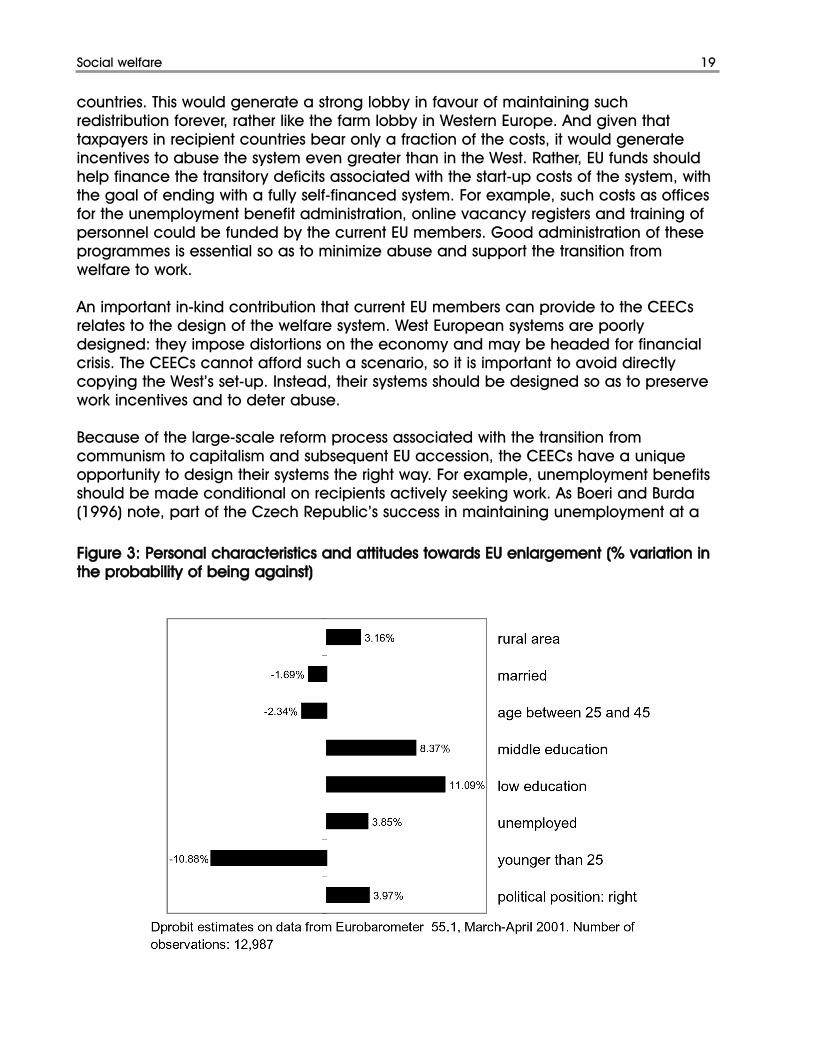
The 2001 Eurobarometer survey indicates further that opposition to Easternenlargement is concentrated among the unemployed, those with lower levels ofeducation and the elderly, while ideological factors play a much less important role. Inparticular, having only a primary or low level of education, being unemployed andliving in a rural area increases the probability of opposing enlargement by almost20%, while being a supporter of right-wing parties increases the probability ofopposing enlargement only by 4% (see Figure 3).
At present, no provision in supranational EU regulation guarantees that this strategy isimpossible. The European Social Charter only states that ‘everybody has the right tobenefit from social welfare services’, without imposing any quantitative floor. Andcapital taxation is already quite low in countries such as Ireland. What is more, to theextent that social provisions are a luxury public good, it makes perfect sense for poorercountries to have few of them. Historically, strong growth in the most advancedcountries has been associated with business-friendly policies and poor living conditionsfor workers. Only after some time could society afford to have generous welfarestandards.

Social welfare 17
The implication is that the EU-15 cannot allow the CEECs to implement beggar-my-neighbour policies. But at the same time, they cannot impose high welfare standardson them and demand that they bear all the costs. This would slow their convergenceto the EU average and reduce their economic efficiency at a time when productivitygrowth is vital.
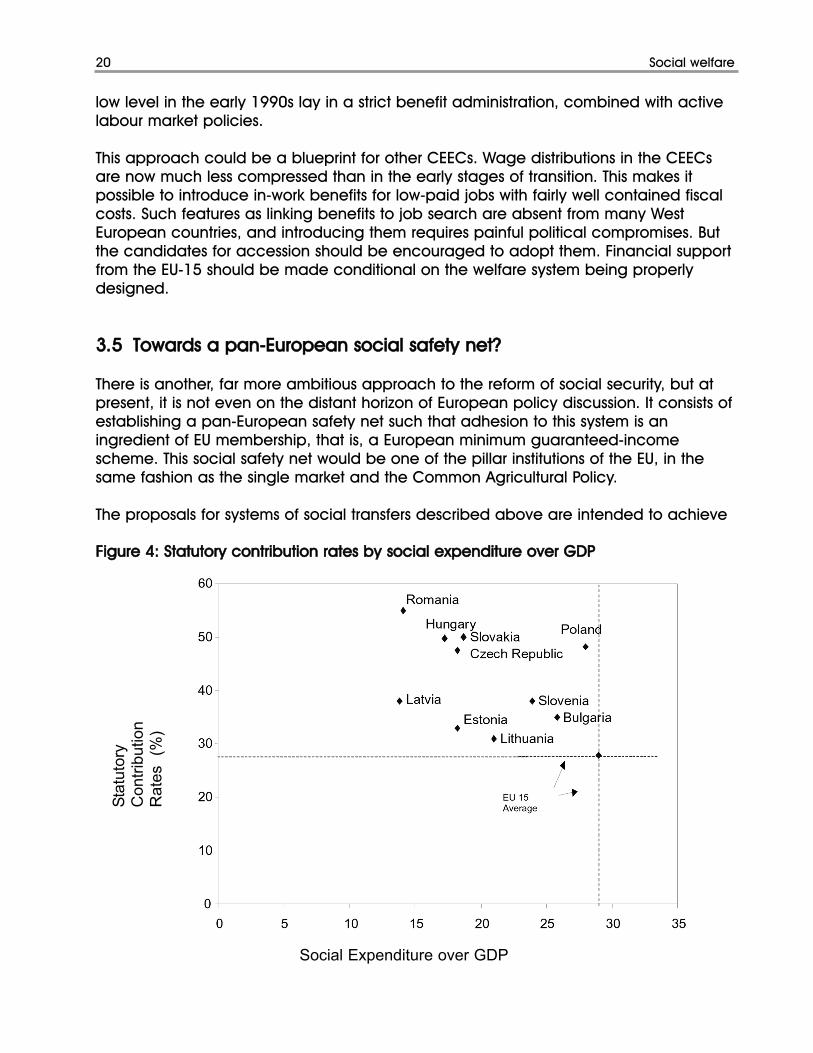
The imposition of high taxes to pay for a more generous social safety net may alsobackfire by simply expanding the already large informal sectors in the CEECs. Indeed,as Figure 4 suggests, these countries already levy social security contributions on thetop of wage bills that are high by EU standards. At the same time, they spend less onsocial welfare as a proportion of GDP than their EU counterparts. This is due to relativelylow wage shares but also to sizeable informal sectors, which increase the gap betweenstatutory and effective contribution rates.
33..33 IIss tthheerree aa rroollee ffoorr EEUU ccoonnddiittiioonnaalliittyy??
One way of discouraging the CEECs from using beggar-my-neighbour policies is to usethe process of Eastern enlargement to ensure that on joining the EU, they have anappropriate level of social protection8. Under this approach, the role of current EUmembers would be to make accession conditional on the existence of a decent socialsafety net, while at the same time contributing to the costs of establishing such a safetynet via structural funds.
At present, EU institutions have limited power over EU members: they lack a politicallyaccountable executive; they are bound by the need for unanimity; and there is no EU-specific enforcement entity. If a decision by the European Court is not implemented byan EU member, there is no supranational coercive power to enforce it. Instead,enforcement relies on the goodwill of EU members. But before Eastern enlargement,incumbent EU members have some leverage over the future initial conditions that willprevail in the CEECs on the day they become full EU members.
It may be argued that because these initial conditions have been imposed by other EUmembers, the CEECs’ governments would try to reverse them after accession. But to theextent that large and powerful social groups benefit from them, attempted reversalsmay prove politically costly. In other words, established institutions generate their ownconstituency and for this reason are not easy to overturn9.
Most of the conditionality that has been imposed on candidates in the course of theaccession process is concerned with the acquis communautaire of product quality
8. As Boeri (2000) suggests, some of the CEECs (though not all) have to some extent opted for a Western-stylewelfare state, with all the qualifications associated with much lower living standards. But naturally, such institutionsare far less established than in the West, and they are typically thought to be inefficient. The evidence suggests thatsuch systems are in fact rather inefficient in accomplishing their redistributive functions, often contributing toincreased rather than reduced inequalities. And the transition process itself is putting the welfare state under strain,as it is typically associated with budgetary problems.9. See Fernandez and Rodrik (1989), and Saint-Paul (2000) for an analysis of this phenomenon.

18 Social welfare
standards and health and safety regulations. This is legitimate since such legislation isessential for the single market to operate effectively. But ensuring appropriate welfarestandards in the CEECs is equally important. Accession can be made conditional onprogress in this dimension too by appropriate interpretation of the Social Charter10.
While the timing of accession can be used to reward those countries that fulfil thewelfare conditions before accession, the availability of structural funds and loans frominstitutions such as the European Investment Bank can be used thereafter. But followingaccession newcomers cannot be treated differently from other members.
33..44 CCaann ffiinnaanncciiaall ccoonnttrriibbuuttiioonnss ffrroomm tthhee EEUU--1155 mmaakkee tthhee CCEEEECCss ffuullffiill tthheessee ccoonnddiittiioonnss??
Many commentators argue that given the size of the EU budget, the structural fundsare too small to fund a decent system of social transfers. We believe that this case isoverstated. The EU budget is small but transfers to the candidates for accession wouldstill be substantial relative to their GDP, and the welfare system in the East does nothave to be as lavish as it is in the West. A large proportion of transfers in the Westconsists of pensions that are quite generous in terms of their duration and replacementratio. New EU members do not have to adopt these standards immediately. Some ofthem have recently reformed their pension systems and can instead focus onunemployment benefits and social assistance. Improvements in design are also likelyto reduce costs.
As an example, in Germany 28% of GDP is devoted to social programmes, of whichabout half goes on pensions; the rest therefore represents 14% of GDP. In Ireland,structural funds from the rest of the EU amounted to 7% of GDP in 1991, when thecountry’s GDP per head was around 66% of the EU average. As income levels in theCEECs are further from the EU average than Ireland’s at the time of its accession, theyare likely to receive more money. The EU-15 can therefore have substantial leverageon newcomers by targeting the use of these funds. With the Southern enlargement, forexample, structural funds boosted the level of physical public infrastructure in Greece,Portugal and Spain. In the new wave of accessions, part of the structural funds can betargeted at building an appropriate level of social infrastructure.
This does not mean that richer countries should casually pay for benefits in recipient
10. Unfortunately, in the country memoranda prepared by the European Commission in the context of accession, itis difficult to find recommendations aimed at improving the efficiency of the welfare system by applying stringentwork tests and better targeting benefits. Rather, the set of recommendations developed in the social policy field isoften fairly prescriptive in areas where it would be better not to exert EU conditionality. For example, somerecommendations have to do with the establishment of so-called ‘social dialogue’ institutions at the national level,which essentially means tripartite commissions in the corporatist tradition. Such structures are rather marginal in theinstitutional landscape of the CEECs, whose institutions of collective bargaining remain highly decentralized. Giventhe large regional imbalances prevailing in these countries there is no reason – not even from the EU standpointsince the deterioration of some local labour market conditions may increase migration flows – why centralizedcollective bargaining institutions should be preferred to plant-level bargaining.
Social welfare 19
Figure 3: Personal characteristics and attitudes towards EU enlargement (% variation inthe probability of being against)
countries. This would generate a strong lobby in favour of maintaining suchredistribution forever, rather like the farm lobby in Western Europe. And given thattaxpayers in recipient countries bear only a fraction of the costs, it would generateincentives to abuse the system even greater than in the West. Rather, EU funds shouldhelp finance the transitory deficits associated with the start-up costs of the system, withthe goal of ending with a fully self-financed system. For example, such costs as officesfor the unemployment benefit administration, online vacancy registers and training ofpersonnel could be funded by the current EU members. Good administration of theseprogrammes is essential so as to minimize abuse and support the transition fromwelfare to work.
An important in-kind contribution that current EU members can provide to the CEECsrelates to the design of the welfare system. West European systems are poorlydesigned: they impose distortions on the economy and may be headed for financialcrisis. The CEECs cannot afford such a scenario, so it is important to avoid directlycopying the West’s set-up. Instead, their systems should be designed so as to preservework incentives and to deter abuse.
Because of the large-scale reform process associated with the transition fromcommunism to capitalism and subsequent EU accession, the CEECs have a uniqueopportunity to design their systems the right way. For example, unemployment benefitsshould be made conditional on recipients actively seeking work. As Boeri and Burda(1996) note, part of the Czech Republic’s success in maintaining unemployment at a
20 Social welfare
Figure 4: Statutory contribution rates by social expenditure over GDP
low level in the early 1990s lay in a strict benefit administration, combined with activelabour market policies.
This approach could be a blueprint for other CEECs. Wage distributions in the CEECsare now much less compressed than in the early stages of transition. This makes itpossible to introduce in-work benefits for low-paid jobs with fairly well contained fiscalcosts. Such features as linking benefits to job search are absent from many WestEuropean countries, and introducing them requires painful political compromises. Butthe candidates for accession should be encouraged to adopt them. Financial supportfrom the EU-15 should be made conditional on the welfare system being properlydesigned.
33..55 TToowwaarrddss aa ppaann--EEuurrooppeeaann ssoocciiaall ssaaffeettyy nneett??
There is another, far more ambitious approach to the reform of social security, but atpresent, it is not even on the distant horizon of European policy discussion. It consists ofestablishing a pan-European safety net such that adhesion to this system is aningredient of EU membership, that is, a European minimum guaranteed-incomescheme. This social safety net would be one of the pillar institutions of the EU, in thesame fashion as the single market and the Common Agricultural Policy.
The proposals for systems of social transfers described above are intended to achieve
Stat
utor
yC
ontri
butio
nR
ates
(%
)
Social Expenditure over GDP

Social welfare 21
appropriate initial conditions after a single episode, namely the Eastern enlargement.But the problems are deeper, arising from the structural interaction betweentransnational labour and capital markets and nationally set welfare standards.
In the single market, a country that lowers its welfare standards exerts an externality onother countries by exporting its potential welfare recipients. Similarly, a country thatreduces taxes on mobile factors of production exerts an externality on other countriesby poaching their tax base. The greater the mobility of factors across borders, themore severe these effects.
One radical way to reduce the effects would be to deprive individual countries of theirautonomy in setting tax rates and benefits, determining them instead at thesupranational level. But this is clearly politically unrealistic. It is also costly since itignores differences in national preferences about the size of transfers andgovernment’s involvement in society. In other words, taking account of externalitiesshould not mean a one-size-fits-all pan-European social welfare system.
A preferable option would be to have explicit minimal standards set at the Europeanlevel with individual EU members free to improve on them. It is not obvious how to setsuch minimal standards, but in theory they could correspond to what the leastgenerous countries would be willing to offer if they were forced to take account of theexternalities. Alternatively, the minimal standards could be determined on ethicalgrounds, by setting them equal to the market value (at local prices) of a basket ofgoods considered necessary for basic human dignity. This would not prevent benefitsfrom being too low relative to the optimum, but at least it would prevent any race tothe bottom from going too far.
From a financial perspective, the EU budget is sufficient to funds minimum socialwelfare programmes harmonized across the EU (Atkinson, 1998; Bean et al., 1998). Andthe unavoidable inter-jurisdictional redistribution involved in providing a pan-Europeansafety net in the presence of sizeable income differences could be co-financed at theEU level. The size of the relevant budget line would be significantly smaller than existingprogrammes like the structural funds and the Common Agricultural Policy. Moreover, noinstitutional reform would be required to run such a programme: even EU institutionswith few supranational powers could be in charge of running schemes of ‘incomesupport of the last resort’ (Bertola et al., 2001).
Above the minimum level, there would be competition among national systems. Therights accumulated in the various countries would be fully portable and workers wouldhave access pro rata to the welfare system of the country to which they move. Thiswould allow EU citizens to choose the system they prefer. For example, if one country isless generous than another, those individuals who want more protection could movefrom the former to the latter, contributing more but getting more in exchange.
But if countries differ in the degree of redistribution of their welfare system, then thiscould be problematic. Rich households would opt out of countries that redistributemore than the European system, thus putting pressure on the financing of their national

22 Social welfare
welfare states, while poor households would be the ones to join the more redistributivecountries. This problem should not be overlooked, although the current low mobility ofthe European workforce suggests that it may become relevant only over a long period.Having a two-tier system, with the most redistributive part coordinated at the pan-European level and countries deciding above this minimum, could be a good way tocope with the problem.

The latest negotiations between the European Commission and the CEECs on the issueof migration suggest that the Eastern enlargement will involve the free movement oflabour only after a transitional period lasting up to seven years. Hence, if the firstcandidates join in 2005, citizens of the new members will be free to move and work inthe current EU only in 2010 or 2012.
This section asks why there should be such a delay before lifting all restrictions onmigration from the East to the West. For evidence, we draw on the latest estimates ofthe potential flows of people as well as North America’s experience in tackling illegalimmigration. We conclude that there is an option value to waiting provided that thetransitional period is clearly defined from the outset, restrictions are flexible andcoordinated at the EU level, and current measures that limit mobility within the EU arephased out. The transition period could also be used to make the borders of an EUcomprising as many as 27 members less porous to immigrants, by coordinating theenforcement of EU-wide migration policies, including worksite enforcement.
44..11 DDooeess wwaaiittiinngg hhaavvee aann ooppttiioonn vvaalluuee??
The idea of a transitional period is dictated by politics. The European Commission hasto take account of the concerns of many EU citizens who believe that enlargement willlead to mass migration from the East, creating labour market tensions, problems ofsocial cohesion and associated high rates of crime. 2002 is an election year forseveral EU members, including some of those most affected by the CEECs’ potentialaccession, notably Germany. And the most recent waves of the Eurobarometer surveysuggest that support for Eastern enlargement is declining, notably in the EU membersbordering the CEECs.
If properly used, the transitional period could turn out to be useful. There is an optionvalue to waiting before making an irreversible decision such as allowing freemovement of labour. This arises from the possibility of gathering more information onmigration pressures and the effects of migration policies. It is extremely difficult to makeaccurate predictions of the migration potential of the Eastern enlargement. Thenumber of foreign residents from the CEEC-10 may increase immediately after freemovement is introduced, by 220,000 in Germany and by another 40,000 in Austria. Yetthese estimates rest on experience from past migration episodes that may not hold true
4. East-West migration: should free movement oflabour be introduced immediately or only after atransitional period?

24 East-West Migration
of the CEECs.
The main economic rationale for waiting before liberalizing labour movements istherefore to improve our knowledge of migration pressures and, in light of this, makebetter decisions.
Migration associated with past episodes of economic integration has frequently beenoverestimated. After the fall of the Berlin Wall, many observers predicted a massmigration wave from the East to the West. But East-West migration has been moderateduring the last decade: roughly 850,000 nationals from the CEEC-10 reside in the EU-15, and the cumulative net migration from the CEEC-10 to the EU-15 is estimated ataround 650,000 people between 1989 and 2000.
Around 300,000 nationals from the CEEC-10 work in the EU-15. This figure includesaround 12,000 border commuters in Austria and Germany, and the annual full-timeequivalent of seasonal workers and other temporary migrants (Boeri et al., 2001). Thenumber of residents and workers from the CEEC-10 in the EU-15 corresponds to a shareof 0.2% of the workforce and population in the EU-15 (0.8% of the workforce andpopulation of the CEEC-10).
But migration from the CEECs is concentrated in the neighbouring countries andregions: around two-thirds of migrants from the CEECs reside in Germany and 14% inAustria, and the proportions of the workforce that they constitute are, respectively, 0.5%and 1.1%. In some regions, for example, at Austria’s borders with Hungary and Slovakiaand the Bavarian border with the Czech Republic, the proportions of foreign nationalsfrom the CEECs are substantially higher. Yet the concentration of migrants in theseregions has not, or not yet, significantly affected wages and employment in theseregions (see, for example, Boeri et al., 2001; Hofer and Huber, 1999; Trabold andTrübswetter, 2001; Winter-Ebmer and Zimmermann, 1999).
Needless to say, these rather small figures reflect tight restrictions on migration into theEU-15. With the exception of the right to self-establishment, the regulation of theimmigration of nationals from the CEEC-10 remains in the domain of the individualmembers. Since the 1993 recession in continental Europe, labour migration from theCEECs has been restricted to a small number of temporary migrants by theneighbouring EU members. Thus, it is difficult to predict what could happen after theremoval of barriers to migration. The uncertainty is even greater given the difficulties ofpredicting the speed of economic convergence, discussed in Section 3 of this report.
Since 1990, several studies have tried to assess the migration potential associated withthe Eastern enlargement. Different methodologies have been used: opinion polls;extrapolations from South-North migration; and multivariate analysis of past migrationepisodes in econometric models. Surprisingly enough, most studies converge inpredicting the long-term migration potential at about 3% of the current population ofthe CEEC-10, that is, about 3 million individuals. But it is important to note that thestudies rely on ad hoc assumptions and to be aware of the limitations of themethodology on which they are based. Box 1 offers a survey of this literature.

East-West Migration 25
The literature on the migration potential of Eastern enlargement suggests someimportant qualitative and quantitative conclusions.
First, income differentials and employment variables turn out to be significant in almostall regressions. The convergence of levels of GDP per head and employment rates inboth the receiving and the sending regions are key variables that affect the size of themigration potential.
Second, migration tends to zero if income convergence is attained.
Third, it takes a rather long time (15-20 years) before migration stocks adjust to theirlong-run equilibrium levels.
Fourth, the size of long-run migration stocks or cumulative net migration over longerperiods of time depends heavily on the assumptions underlying the different models.
Under reasonable assumptions, our best estimate is that cumulative net migration orlong-run migration stocks (attained 15-20 years after free movement of labour hasbeen introduced) in the EU-15 will amount to 2-3% of the population from the CEEC-10in Germany and 3-5% of the population from the CEEC-10. Note that this figure isobtained from the extrapolation of South-North migration by Layard et al. (1992), theestimates from static gravity models as long as they rely on international migrationdata (Hille and Straubhaar, 2001; Orlowski and Zienkowski, 1999), the dynamic
Box 1: Estimating the migration potential of Eastern enlargement
Representative surveys of public opinion suggest that 10-30% of the population in the CEECs have a generalpreference to migrate to the EU (see, for example, Fassmann and Hintermann, 1997; Wallace, 1998;Hospodárské Noviny, 2001). But only a small fraction of these people will actually move. By assessing the‘seriousness’ of the answers, Fassmann and Hintermann estimate that the ‘actual migration potential’ will bearound 2% of the population of the CEECs. This figure does not sound unreasonable in the light of evidencefrom the German Socio-Economic Panel, which shows that only 5% of East Germans who said they planned tomigrate to western Germany in 1991 had actually moved there two years later (Büchel and Schwarze, 1994).
In general, opinion polls face three basic problems, which make it difficult to draw any quantitativeconclusions as to the actual migration potential:
· They only provide information on the supply side, the propensity of workers to migrate, not the demand side,the capacity of labour markets to absorb additional workers.· Little is known about whether somebody who indicates a general propensity to migrate in an opinion poll hasserious intentions to move.· Migration from the East is largely a temporary phenomenon. This means that the proportion of the populationthat will move to another country and perhaps return within a certain period of time is much higher than theproportion that will live in a foreign country at a given point in time1.
Because of these problems, the author of one of the most comprehensive surveys concludes that opinion pollsare reliable in relative terms, but cannot be used to estimate migration levels (Wallace, 1998). Nevertheless, itis possible to draw interesting conclusions on the human capital characteristics of migrants from these surveys,since the socio-economic characteristics of actual migrants and those who reveal a preference to ...
1. As an example, for the last five years around 200,000 temporary workers from the CEECs have been employed each year in Germany withan average duration of stay of three months. Under the (unrealistic) assumption that

26 East-West Migration
...migrate seem to be similar (Büchel and Schwarze, 1994).
Another way of estimating the migration potential is through extrapolation exercises, which take as referencethe migration flows from southern Europe to the West and North European countries in the 1950s and 1960s,and the migration of Mexicans to the United States in the 1970s and 1980s (Layard et al., 1992; Lundborg,1998; Bauer and Zimmermann, 1999). These studies conclude that less than 3% of the population in the CEECswill migrate to the West within 15 years. That corresponds to an annual immigration of around 200,000 peoplefrom all CEECs (including the former Soviet Union), or 130,000 people from the Czech Republic, Hungary,Poland and Slovakia (Quaisser et al., 2000). Note that these figures refer to gross inflows, implying that netmigration and migration stocks will be substantially lower.
Interestingly enough, the income differentials between the main sending and receiving countries of South-North migration in the 1960s are similar to the income differentials between Eastern and Western Europetoday2. Moreover, although the free movement of workers was granted to only a few European countries in the1960s and 1970s, the barriers to labour immigration were de facto removed in the main receiving countriesduring the period of guest-worker recruitment in the 1960s and early 1970s.
But there are also important differences in the conditions of South-North and East-West migration.
First, labour markets were characterized by full employment and shortages of manual workers in the mainreceiving countries (Belgium, France, Germany and Switzerland) until the first oil price shock in 1973. Today,unemployment rates are still high in the main receiving countries of East-West migration in the EU.
Second, the demographic structure of the population has changed: the share of young, mobile cohorts in thepopulation of the CEECs will decline at the beginning of the next decade.
Third, the labour force in the CEECs is well educated relative to traditional sending countries.
Fourth, the transition process is not yet complete, so rates of structural change and job turnover are higher inthe CEECs than in traditional sending countries.
These differences may bias the results of extrapolation exercises in both directions. But the exercises may dogive a hint as to the magnitude of the migration potential.
In order to overcome the shortcomings of simple back-of-the-envelope calculations, a number ofeconometric studies have tried to exploit the information from post-war migration episodes in Western Europeto assess potential migration after the free movement of labour has been introduced. Most of these analysesderive from the traditional Harris-Todaro (1970) model, and explain migration flows or stocks by differences inincomes per head and employment rates in the respective locations. Moreover, some models include dummyvariables in an effort to capture different institutional conditions for migration, such as free movement in the EUor guest-worker recruitment in the 1960s and early 1970s. These studies have produced a wide variety ofresults and many suffer from several methodological problems.
There are basically four types of models in the literature:
1. Static models, which rely on the assumption that there is a constant relationship between migration rates ormigration stocks and a set of explanatory variables such as income differentials and unemployment rates.
2. Dynamic models that take account of the adjustment of migration rates or stocks, but assume that constantdifferences across countries do not affect migration...
each worker from the CEECs has been employed in Germany only once, this figure corresponds to total migration of 1 million workers in fiveyears. Yet on average, only 40,000 temporary workers from the CEECs have been employed in Germany at each point in time during thisperiod.2. PPP-adjusted GDP per head levels of the main sending countries varied between 20% (Turkey) and 55% (Spain) of the main receivingcountries of South-North migration in Europe (for example, Belgium, France, Germany and Switzerland) in 1965 (Maddison, 1995), while PPP-adjusted GDP per head levels of the CEECs are today between 20% (Bulgaria) and 55% (Slovenia) of the main receiving countries in the EU(Austria and Germany).
East-West Migration 27
...3. Dynamic models that consider that constant differences between countries, such as geography,language and culture, affect migration behaviour.
4. Error-components models, which ‘explain’ migration by a set of country-specific and time-specific errorcomponents.
Static models
The starting point for the first strand of the literature is a study by Barro and Sala-i-Martin (1995), whichregresses the migration balance against levels of GDP per head across regions in Europe, Japan and theUnited States. Using the coefficients for Germany from the Barro and Sala-i-Martin study, Franzmeyer andBrücker (1997) estimate the annual net inflow from the CEEC-5 (the Czech Republic, Hungary, Poland, Slovakiaand Slovenia) into the EU-15 at 340,000-580,000 people for the per capita GDP levels of 1996. Similarexercises have been undertaken for Austria by Hofer (1998) and Walterskirchen and Dietz (1998)3. This simpleapproach suffers from three shortcomings, as follows:
· Variables other than the income differential are omitted.
· The coefficients from the cross-sectional regressions neglect the adjustment of migration to incomedifferentials.
· The migration balance of regions comprises both national and international migration. Since the elasticity ofnational migration is higher than the elasticity of international migration, using the coefficients from the Barroand Sala-i-Martin (1995) study tends to exaggerate the estimates of the migration potential significantly (seeStraubhaar, 1998, and Alecke et al., 2000, for a discussion).
Building on the static approach, other studies have estimated so-called gravity models, that is, migrationstocks or net migration rates have been regressed against a set of explanatory variables, such as levels ofGDP per head, (un-)employment rates, population size and distance, for a cross-section of sending andreceiving countries. On the basis of such a model, Hille and Straubhaar (2001) estimate that for the presentincome differential, around 340,000 people a year will migrate from the CEEC-10 to the EU-15, whichcorresponds to a cumulative figure of around 4 million people within 15 years under reasonable assumptionsabout the convergence of the levels of income per head.
Note that these figures refer to gross rates, so that net migration rates will be substantially lower. Orlowski andZienkowski (1999) estimate that 1.2-3.8% of the Polish population will migrate to the EU within 15 years,depending on different assumptions about the convergence of the levels of GDP per head. The difference ofthe Hille and Straubhaar (2001) and Orlowski and Zienkowski (1999) projections from the estimates based onthe Barro and Sala-i-Martin (1995) study can be traced back to the use of another database: internationalmigration figures instead of regional migration balances have been used.
Dynamic models
Dynamic models have the advantage that they make it possible to model the adjustment of migration tochanges in the relevant variables. Note that the change of location involves fixed set-up costs, such thateconomic theory treats migration as an investment in the productive use of human resources (Sjaastad, 1962).So just like other irreversible investments under uncertainty, the decision to exercise the option to migrate mustbe based on the option value of waiting for further information (Burda, 1995). Uncertainty not only increasesthe opportunity costs of migration, but also implies a sluggish adjustment of migration to a change ineconomic and institutional variables. Neglecting these adjustment processes may therefore bias the results.Several dynamic models have been estimated in order to consider the adjustment of migration to a changein the relevant variables4. But dynamic models may involve other kinds of restrictions. Migration is affected notonly by variables that vary over time, such as income differentials and employment rates, but also by...
3. Using the same coefficients as Franzmeyer and Brücker (1997), Hofer (1998) expects net migration of 25,000-40,000 people a year intoAustria. Relying on other coefficients, Walterskirchen and Dietz (1998) estimate the annual net migration of workers (including commuters) fromthe CEEC-5 into Austria at 42,000 people in 2005. 4. Note that time-series data on migration stocks and flows by nationality are reported by only a few EU members. Most dynamic modelstherefore rely on Germany, where migration stocks and flows have been reported by nationality since 1967.
28 East-West Migration
...constant factors such as geographical distance, language and culture, which affect the pecuniary andnon-pecuniary costs of migration. Omitting these variables may seriously bias the results (see Hsiao, 1986Alecke et al., 2001, Fertig and Schmidt, 2000, and Brücker, 2001, for a discussion on the migration context).
Indeed, the estimation of a stock-adjustment model with constant absolute terms across the sending countries(Sinn et al., 2000; Flaig, 2001) has brought implausibly high coefficients for long-run migration potentials: forthe present income differential of the CEECs, steady-state migrant stocks are estimated at 8-11% of thepopulation from the CEECs for Germany alone; and the upper limit of the 95% confidence interval exceeds50% of the population. But since the constraint of common absolute terms is clearly rejected by all tests, long-term forecasts can hardly be based on these estimates (Brücker, 2001).
Dynamic models with constant national differences
Starting with Fertig (1999), dynamic models have been estimated that allow for country-specific differences inthe constant factors that affect migration: so-called fixed effects. These fixed effects cover all constant termsthat affect migration, whether observable or not. Note that the variables are identified in fixed-effects modelsbasically by the time dimension, which may involve a loss of efficiency of the estimates5. The fixed effectshave turned out to be highly significant and have a considerable impact on the size of the migration volume.They cannot therefore be neglected in the estimation of the migration potential.
For the projection of the migration potential, a two-stage procedure has been proposed by Fertig (1999). Inthe first stage, the dynamic model is estimated with fixed effects, and in the second stage, the fixed effectsare explained by language, geography and other time-invariant variables6. Building on Fertig’ approach,Boeri et al. (2001) estimate an error-correction model, which is based on the assumption that there is a long-run dynamic equilibrium between the migration stocks (that is, the share of foreign residents in the populationof the home country) and the income differential and other explanatory variables7. This hypothesis has beensupported by panel co-integration tests. Based on this model, the long-run stocks of the foreign population aswell as the speed of adjustment can be estimated.
Boeri et al. (2001) estimate that 1.9-3.0% of the population in the CEEC-10 will migrate to Germany in thelong-run, while the initial growth of the foreign population from the CEECs after the introduction of the freemovement is estimated at 200,000-300,000 people. An extrapolation of these results to the EU-15 gives a long-run migration potential of 3.5-4.5% of the population in the CEECs, and an initial growth of the foreignpopulation of 300,000-450,000 people in the EU-15 immediately after free movement of labour has beenintroduced for the CEEC-10. These results have turned out to be robust with regard to changes in thespecification of the model and the selection of the sample. Moreover, the dynamic forecast quality of theestimates within the sample is satisfying. Nevertheless, certain caveats still apply:
· The explanation of the fixed effects in a second regression is a rather crude method and a good deal ofuncertainty remains over to the impact of country-specific effects on the migration potential from the CEECs.
· The estimation of dynamic models with fixed effects may involve an estimation bias, but one that declineswith the number of observations over time (Nickell, 1981). Although more than 30 time-series observations areincluded in the sample, this bias may still have an impact8.
· Differences in migration behaviour across countries may affect not only the fixed effects, but also the slopeparameters. As a consequence, the coefficients can be biased and the migration behaviour from the...
5. This involves a loss of efficiency relative to the Ordinary Least Square-estimate with common constant terms. But with more than 30observations, there is considerable variance over time in the German sample.6. Note that time-invariant variables cannot be included in the dynamic model with fixed effects, since all time-invariant terms are perfectlyco-linear.7. In contrast to Boeri et al.. (2001), Fertig (1999) assumes that there is a dynamic equilibrium between the migration rate and the explanatoryvariables. This hypothesis is derived from a model by Hatton (1995), but is rejected by the panel co-integration tests for the German database.Fertig estimates net migration from the CEEC-10 into Germany at around 70,000 people a year, which is considerably lower than the estimatesin Boeri et. al. (2001).8. The standard approach to eliminating the bias by instrumented estimation (Anderson and Hsiao, 1981, Arellano and Bond, 1991) has turnedout to reduce the forecasting quality within sample, such that the non-corrected model has been used for the forecasts (Brücker, 2001).
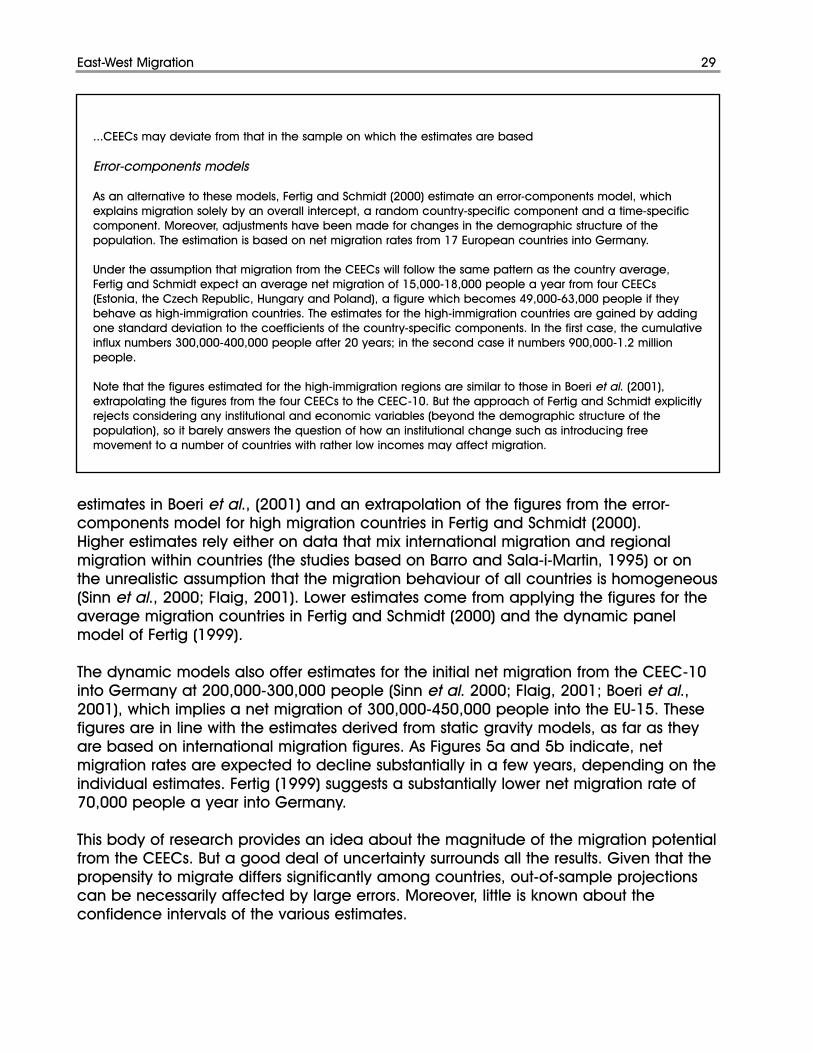
East-West Migration 29
estimates in Boeri et al., (2001) and an extrapolation of the figures from the error-components model for high migration countries in Fertig and Schmidt (2000).Higher estimates rely either on data that mix international migration and regionalmigration within countries (the studies based on Barro and Sala-i-Martin, 1995) or onthe unrealistic assumption that the migration behaviour of all countries is homogeneous(Sinn et al., 2000; Flaig, 2001). Lower estimates come from applying the figures for theaverage migration countries in Fertig and Schmidt (2000) and the dynamic panelmodel of Fertig (1999).
The dynamic models also offer estimates for the initial net migration from the CEEC-10into Germany at 200,000-300,000 people (Sinn et al. 2000; Flaig, 2001; Boeri et al.,2001), which implies a net migration of 300,000-450,000 people into the EU-15. Thesefigures are in line with the estimates derived from static gravity models, as far as theyare based on international migration figures. As Figures 5a and 5b indicate, netmigration rates are expected to decline substantially in a few years, depending on theindividual estimates. Fertig (1999) suggests a substantially lower net migration rate of70,000 people a year into Germany.
This body of research provides an idea about the magnitude of the migration potentialfrom the CEECs. But a good deal of uncertainty surrounds all the results. Given that thepropensity to migrate differs significantly among countries, out-of-sample projectionscan be necessarily affected by large errors. Moreover, little is known about theconfidence intervals of the various estimates.
...CEECs may deviate from that in the sample on which the estimates are based
Error-components models
As an alternative to these models, Fertig and Schmidt (2000) estimate an error-components model, whichexplains migration solely by an overall intercept, a random country-specific component and a time-specificcomponent. Moreover, adjustments have been made for changes in the demographic structure of thepopulation. The estimation is based on net migration rates from 17 European countries into Germany.
Under the assumption that migration from the CEECs will follow the same pattern as the country average,Fertig and Schmidt expect an average net migration of 15,000-18,000 people a year from four CEECs(Estonia, the Czech Republic, Hungary and Poland), a figure which becomes 49,000-63,000 people if theybehave as high-immigration countries. The estimates for the high-immigration countries are gained by addingone standard deviation to the coefficients of the country-specific components. In the first case, the cumulativeinflux numbers 300,000-400,000 people after 20 years; in the second case it numbers 900,000-1.2 millionpeople.
Note that the figures estimated for the high-immigration regions are similar to those in Boeri et al. (2001),extrapolating the figures from the four CEECs to the CEEC-10. But the approach of Fertig and Schmidt explicitlyrejects considering any institutional and economic variables (beyond the demographic structure of thepopulation), so it barely answers the question of how an institutional change such as introducing freemovement to a number of countries with rather low incomes may affect migration.
30 East-West Migration
Figure 5a: Estimated migration flows to Germany
Figure 5b: Estimated migration stocks in Germany

East-West Migration 31
44..22 WWhhaatt rreessttrriiccttiioonnss oonn mmiiggrraattiioonn dduurriinngg tthhee ttrraannssiittiioonnaall ppeerriioodd??
The option value of waiting will be significant if four conditions are satisfied:
1. The maximum length of the transitional period is defined from the outset to avoidgiving the impression that restrictions may remain in place forever.2. Rather than simply maintaining existing country-specific migration restrictions foranother decade, quotas are coordinated and enforced at the EU level.3. These quotas can be easily adjusted to changing cyclical and labour marketconditions. Temporary migration schemes could also be envisaged to cope with skillshortages.4. In the interim period, remaining restrictions on the mobility of labour within the EU arephased out and no further restrictions introduced.
The transitional period
Defining the maximum length of the transitional period from the outset would avoidgiving the impression that restrictions may stay there forever. Uncertainty about thelength of restrictions would increase applications for quotas and temporary workpermits, discourage return migration and prevent the adjustment of migration flows tothe conditions of local labour markets.
Quotas
Quotas coordinated and enforced at the EU level are preferable to leaving in placeexisting country-specific migration restrictions. Such quotas could be easily monitored.If actual migration fails to fill the quotas, they could be lifted early.
Since the Nice summit of December 2000, the EU is far from having an EU-widemigration policy. Yet many regret this outcome, even in countries traditionally inclinedto opt out of EU-wide policies. For example, the UK’s House of Lords EU Committeeissued a report in April 2001 broadly welcoming the adoption of an EU-wide migrationpolicy (House of Lords, 2001). The European Commission’s proposal on migration andthe Eastern enlargement envisages that the extension for another two years of thetransitional period could only be agreed by the Commission. This is a first step towardsadopting an EU-wide migration policy.
Temporary migration
Quotas established at the EU level could be adjusted to changing cyclical and labourmarket conditions. Temporary migration schemes could also be introduced for workersthat the EU most urgently needs, notably those at the opposite ends of the skillspectrum: for high-skilled jobs where there are shortages of the necessary talent; andlow-skilled jobs no longer considered palatable by EU citizens.The main problem with temporary schemes is that it is difficult to ensure that they donot end up allowing permanent migration. But contracts can be devised in such a wayas to provide incentives for the worker to leave the country at the end of the period

32 East-West Migration
and for the employer to make sure that this actually happens. In other words,enforcement of the temporary nature of migration should rely as much as possible onthe employers. Bonding schemes, whereby the employer provides the employee with alump sum when he or she leaves the country, have proved successful in Israel, acountry where public administration finds it particularly hard to control migration.
Phasing out
Current restrictions on the mobility of labour within the EU make it particularly hard topredict the impact of immigration, since it becomes concentrated in specific countriesand regions. This is because native workers are discouraged from changing residencewhen labour market conditions for them deteriorate.
As discussed in Section 2 of this report, it is important for EU members to eliminate taxobstacles to the cross-border provision of occupational pensions, and to coordinateregulations on pension funds, ensuring that workers moving from one country toanother do not lose their accumulated pension rights. Furthermore, fears that the freemovement of labour encourages ‘welfare-shopping’ in countries with generous welfarestates should not translate into the introduction of country-specific restrictions onaccess to welfare.
The primary condition for intra-EU migration is that migrants be able to financethemselves out of their work or wealth without social assistance. This also holds true forfamily reunification. But the principle of non-discrimination demands that EU citizenswho live for a certain period in another country get the same access as natives to allwelfare benefits, including social assistance. Thus, although welfare-shopping is not aseasy as is often believed, immigration may involve costs for the welfare state in themedium term.
But demands for changes in EU legislation, particularly the principle of non-discrimination, are short-sighted. Such changes would have adverse effects on labourmobility within the EU and be politically destructive.
44..33 TTaacckklliinngg iilllleeggaall iimmmmiiggrraattiioonn:: tthhee UUSS eexxppeerriieennccee
It is difficult to find reliable data on illegal immigration, as most statistics come fromadministrative sources, which, by definition, cannot capture such movements of labour.Illegal migration is generally underestimated, but this seems to be more the case inEurope than in the United States, where researchers can draw on better statistics onborder controls. Available estimates (McCormick et al., 2002) suggest that illegal flowsas a proportion of the population are about 25% larger in Europe than in the UnitedStates. At the same time, legal flows are about 25% larger in the United States than inEurope.
These differences in legal and illegal flows raise an obvious question: is illegalmigration larger in Europe than in the United States simply because restrictions on legal

East-West Migration 33
migration are too tight in Europe? There are many indications of substitution betweenlegal and illegal migration. Restrictions on temporary migration in the United Stateshave been generally associated with a pick-up in illegal migration flows (Hanson et al.,2002).
Substitutability between legal and illegal migration stems from the fact that the latter isfostered by the illegal employment of foreign workers: such people face the high costsof migration but take the risk of being caught because they have a realisticexpectation of getting a job and an income. At the same time, illegal employment offoreign workers increases in the presence of restrictions on numbers of work permits.Indeed, border controls tend to be less effective than internal controls in controllingillegal migration. But internal controls face strong opposition from employers and, as aconsequence, are poorly enforced.
Illegal immigration in the United States is quite a new phenomenon, originating in themarket for temporary agricultural labour. Labour shortages induced by the SecondWorld War led the US government to establish the Bracero Program, granting Mexicanworkers temporary permits to work in US agriculture. At its peak in 1956, 445,197workers were granted temporary permits, but by 1965 support had faded and theprogram was abolished. But temporary agriculture workers kept on coming illegallyand in even greater numbers, beginning the period of modern mass illegalimmigration.
The US Immigration and Naturalization Service (INS) estimates that there were about 5million illegal immigrants in 1996, one- third of the country’s new immigrants. Illegalimmigration is no longer a seasonal agriculture-related phenomenon but has becomemore urban, stable and diversified. Illegal immigrants have become more diverse interms of country of origin, sector of employment and demographic profile: around ahalf of them come from Mexico and a third from other Latin American countries; theywork in several unskilled labour-intensive industries, such as apparel, textiles,construction, domestic services and agriculture; they comprise both men and women,and have different levels of education. Illegal immigrants are concentrated in a fewstates: over 40% live in California, and about 30% in Florida, New York and Texastogether.
The US government has experimented with several policy measures to control the flowof illegal immigrants:
1. border enforcement.2. worksite enforcement.3. amnesties.4. collaboration with the sending countries.5. access to welfare services.
But the overall policy has been ambiguous. Some highly publicized policy measures,such as strict border controls in particular areas, are successful in modifying thedistribution of illegal flows along the US-Mexican border, but are of little use in limiting

34 East-West Migration
overall illegal immigration, while more effective measures like worksite enforcement areused sparingly.
Border enforcement
Since 1924, the US border patrol has monitored the country’s borders. While for manyyears, patrolling was little more than formal – a yearly average of 80,000 officer-hoursin the 1960s – since 1965, patrolling has became increasingly stringent, using morethan 360,000 officer-hours in 1996. The increase in enforcement has translated intomore success in apprehending illegal immigrants: the elasticity of apprehensions withrespect to enforcement hours is between 0.6-0.8.
But while the increase in border enforcement and apprehensions has been dramatic,there is little evidence of its effectiveness: most illegal immigrants who are caught aresimply brought back to the border and can easily try to cross the following day. Yet inspite of this ineffectiveness border enforcement seems to be very attractive politically.
Worksite enforcement
Internal controls, particularly worksite enforcement, are not much used in the UnitedStates. In 1990, less than 8% of INS officers were devoted to interior enforcement. Thisrelative insignificance is even more evident looking at the numbers of illegalimmigrants apprehended: only 10,000 in the interior out of a total of 1.5 million.
The strong preference for border enforcement over interior enforcement is puzzlingfrom an economic point of view, since efficiency considerations would suggest a moreequal distribution. The INS recognizes this, but faces strong political oppositionwhenever it conducts raids in the interior and moreover, it lacks proper legalinstruments. For example, before 1986 it was illegal to harbour illegal immigrants butgiving employment was not considered illegal harbouring. Since 1986, there havebeen penalties for employers of illegal immigrants, but enforcement has been low, withthe INS fining a maximum of 20 employers a year for over $20,000.
Amnesties
The 1986 Immigration Reform and Control Act granted an amnesty to more than 2.2million workers living in the country illegally. This was supposed to be a one-off measurethat would legalize past illegal immigration while giving strong incentives against futureillegal immigration. But since illegal immigration has actually increased greatly, the actmay be deemed to have failed.
The reason why an amnesty does not stop illegal immigration is that it lowers costs forprospective immigrants: first, it legalizes the ethnic network already operating in theUnited States; and second, it creates expectations of future amnesties. But amnestiesseem to be politically acceptable because they reduce uncertainty for the currentemployers of illegal immigrants, well-defined group, while being potentially damagingfor future possible employers.

East-West Migration 35
Collaboration
The US and Mexican governments are working together on immigration policy, inparticular on a new amnesty. This is a dramatic change given that until recently eachcountry considered immigration policy an internal matter. International agreements onimmigration are not common but have some precedents: the United States and Japansigned an agreement in 1906 to limit migration; and Hong Kong and China havesigned similar agreements in the past.
Access to welfare services
There has been considerable debate on the impact of illegal immigrants’ use of publicservices, such as public education and emergency care, on the US fiscal accounts atboth the state and national levels. Although the overall impact seems small, somestates, such as California, are quite negatively affected. There have been attempts todeny education, health and social services to illegal workers, notably the nationalwelfare reform of 1996. But the provisions discriminating against legal and illegalimmigrants have been rolled back as a result of legal challenges and the reluctanceof local authorities to implement the tougher measures.
It seems to be politically very costly or legally difficult to discriminate againstimmigrants in access to basic welfare services. Moreover, any scaling back of theseservices that is not coordinated nationally seems to suffer from welfare-shopping,immigrants being by definition very mobile, reacting quickly to different welfaretreatments.
44..44 MMaakkiinngg tthhee EEUU’’ss bboorrddeerrss lleessss ppoorroouuss
There seems to be a vicious circle in the European discussion of migration. Negativeperceptions of migration induce governments to adopt restrictive policies on legalmigration, hence generating more illegal migration. Perceptions then become self-fulfilling in that more illegal migration strengthens the negative perceptions.
What are the key lessons for Europe from the United States’ experience with illegalimmigration? Can better enforcement of border controls, internal controls or anamnesty break this vicious circle?
The problem with border controls
It is clear that there are inherent difficulties in border controls. An EU of 27 states (theEU-15 enlarged to encompass the CEEC-10 plus Cyprus and Malta) would have aneastern border of ten countries from Lithuania to Bulgaria. In such a future EU, illegalimmigrants would have thousands of kilometres of border to access, and the idea ofcontinuously patrolling such a wide and diverse piece of land would be very difficult,for a number of reasons.

36 East-West Migration
First, border controls would need to be coordinated across EU members, which wouldinevitably imply the coordination of police activity.
Second, and most importantly, it is quite likely that illegal immigrants would try to enterthe EU at its eastern border with the intention of going west. It is likely that illegalimmigrants will ultimately want to settle in the rich countries of Western Europe, such asFrance and Germany.
Will the police in the CEECs have sufficient incentives to stop illegal immigrants fromtemporarily entering their countries when their final destination will probably beelsewhere? Probably not. This free-rider problem is potentially very serious. Indeed, theUnited States had a potentially similar problem across states, and accordingly chose todelegate its border controls to a federal authority. But in Europe there is no federalpolice authority, and there will not be one in the foreseeable future.
So even if Europe chose to use border controls as a way of monitoring illegalimmigrants, the free-rider problem would not be easily solved. But the US experiencealso suggests that border controls are extremely costly and not particularly efficient. Asa result, the free-rider problem at the country level, coupled with the inefficienciesinherent in border controls, suggest that Europe should also focus its efforts on otherpolicies.
Internal controls and the shadow economy
The obvious alternative is internal controls, particularly worksite inspections. But doesthe US reluctance to give interior enforcement proper legal instruments foreshadowsimilar political difficulties in Europe? The answer is almost certainly yes, judging fromthe EU’s experience with employment in the shadow economy. Modern informationtechnologies and improvements in tax collection make it quite easy to detect andcurb hidden economic activity. But this is rarely done and government statements ofzero tolerance of the informal sector seem not be taken too seriously by firms andworkers, who continue to go underground.Indeed, the informal sector in Europe is flourishing. Available estimates of its size rangefrom a low of 10-12% of GDP in the Nordic countries, Switzerland and the UK to peaksof 20-30% in southern Europe and Ireland. According to the estimates in Schneiderand Enste (2000), the number of people working in the unofficial economy doubledbetween 1978 and 98. Data on the Italian economy published by Istat in 1999 suggestthat as many as 15% of the country’s labour units were employed in the shadoweconomy; and in southern regions, this shadow rate is as high as 22.6%.
What explains Europe’s tolerance of the informal sector? One possible reason is thatgovernments fear that curbing the shadow economy may simply raise unemployment,with undesirable political consequences. In any event, if Europe does not enforce itsexisting legislation on regular employment, it is difficult to see why such legislationwould be implemented in the future.
East-West Migration 37
An amnesty?
A third instrument for tackling illegal immigration would be an amnesty. A Europeanamnesty would pose an obvious problem of coordination, but it could be useful toregularize the status of the existing stock of illegal immigrants. But amnesties are not acredible way of dealing with illegal immigration since they raise the flow of illegalimmigrants anticipating a future amnesty. Thus, an amnesty is conceivable only whenthere is a very strong change in the policy regime, and we simply do not foresee sucha change in Europe.
The policy dilemma
The size of the future European border, as well as the lack of a European federal policyauthority, suggests that border controls (the main instrument used in the United States)are going to be poorly enforced. Furthermore, internal controls, potentially moreefficient ways of dealing with illegal immigration, are not going to be politically viableoptions given the tolerance of employment in Europe’s shadow economy. This impliesthat Europe cannot mimic US policy on illegal immigration and should probably find aEuropean solution to the problem. Supranational authorities should play an importantrole in strengthening worksite inspection and restricting the illegal employment offoreign workers.
Another way to proceed is to establish close cooperation with the likely countries oforigin of future illegal immigration. In an EU of 27 members, these will probably be thetraditional North African Arab countries and Albania, plus the lowest-income membersof the Commonwealth of Independent States, countries like Azerbaijan, Tajikistan andUkraine. Unfortunately, the latter group of countries currently has limited ties with the EU,suggesting the need to establish a long-run policy of close cooperation with them.One way or another, it will be necessary to influence the incentives for these countriesto increase their border controls and control the flow of illegal immigrants. Suchincentives will involve favourable trade agreements as well as specific aid policies, allof which represents a major challenge for European policy-makers.
44..55 AAnn EEUU--wwiiddee mmiiggrraattiioonn ppoolliiccyy??
This challenge can only be addressed by adopting an EU-wide migration policy.Supranational decision-making on migration restrictions would also make it possible toabandon the hypocritical stance of many countries, declaring migration policies thatare formally very strict but which actually increase illegal migration, and then using expost amnesties to regularize illegal immigrants.
National governments seem to be taken hostage by voters pressing for strict migrationpolicies. Under these circumstances, there is a strong case for delegating authority tosupranational bodies that can pursue longer-term goals and break out of the viciouscircle. This is precisely the principle that has been applied to monetary policy: thedecision to delegate authority over monetary policy to independent central banks

(and then to the European Central Bank) recognizes that governments are not in thebest position to pursue the longer-term goal of containing inflation. Similarconsiderations apply to migration policies: Ulysses should be tied firmly to the mast toavoid being tempted by the siren songs.
Potential free-riding on border controls also calls for policies coordinated and co-funded at the EU level: border controls are effective only when applied all along theborders; otherwise, they just end up shifting pressure from one country to another. AnEU-wide approach to migration policy would also make it easier to reach agreementswith sending countries, making quotas conditional on the adoption of policiespreventing illegal migration (in terms of both border controls and anti-povertyschemes).
A case for stronger supranational power over migration policy can also be madebased on considerations relating to the enforcement of national legislation. After all,how can national differences in migration policies be reconciled with the idea of asingle market for labour? The EU could play an important role in strengthening internalenforcement of migration controls, with worksite inspections preventing illegal work byforeign citizens. Some centralization of these inspectorate functions would be useful, asit would reduce pressure exerted by local lobbies that have a strong interest inmaintaining illegal labour in place.
There is no doubt that it is difficult to envisage the creation of a pan-Europeanauthority aimed at enforcing country-specific labour laws and stopping illegalimmigration. Many countries are likely to oppose such an institution since it would aimto implement policies that they deliberately choose not to enforce. Yet we believe thatone of the few efficient options for monitoring illegal immigration would be the creationof such an authority, and we urge policy-makers to take such an option seriously.
But if there are many reasons to advocate moving to an EU-wide migration policy, theconsensus that could be gathered around such a move is rapidly fading. According tothe Eurobarometer survey, support for European migration policies has been decliningeverywhere in the EU since 1993 (with the exception of the Netherlands) and there arealready many countries where less than 50% of the voters are in favour of delegatingauthority to the EU on these issues.
38 East-West Migration

11. Article 1 of the Single European Act states that the European Community (as it was then known) ‘shall aim atreducing disparities between the various regions and mitigating the backwardness of the less-favoured regions’.
5. Regional policy: should EU-wide redistribution bereformed, and if so, how?
Reform of the EU’s structural funds can play an important role in accelerating incomeconvergence and ensuring that the skill composition of migrants from the East is notbiased towards the unskilled in a way that would be regarded unfavourably by citizensof the EU-15. This section examines the potential impact of structural funds onconvergence, drawing on the experience of the Southern enlargement. We also makea case for how the limited budget should be allocated and how the costs ofredistribution should be shared.
55..11 CCaann ssttrruuccttuurraall ffuunnddss aacccceelleerraattee iinnccoommee ccoonnvveerrggeennccee??
Over the last two decades, the EU has adopted an active cohesion policy aimed atreducing income disparities by subsidizing various types of investment programmes inthe EU’s poorest regions through the structural funds. Although the effectiveness of theseprogrammes has often been questioned, available evidence suggests that they havecontributed significantly to output growth in at least some of the recipient countriesand regions. This has two important implications.
First, similar programmes can help narrow the enormous income gap between currentEU members and the candidates for accession, provided they are adequatelydesigned and managed.
Second, the cost of enlargement should not fall only, or even primarily, on the currentbeneficiaries of structural funds, those regions with incomes substantially below thecurrent EU average. Curtailment of these programmes would probably entail asignificant cost in terms of slowing convergence within the EU-15.
The concern for economic cohesion has been a constant feature of the process ofEuropean integration. While the single market offered the promise of a significantincrease in the output of the EU as a whole, the political viability of the project alsorequired that the distribution of its benefits were perceived to be fair by the constituentcountries and regions. This preoccupation led to the gradual development of anactive regional policy, to which the EU explicitly committed itself in the Single EuropeanAct of 198711. The main instruments for this policy are the structural funds, especially theEuropean Regional Development Fund (ERDF) and the European Social Fund (ESF),aimed at promoting the development of the EU’s poorer regions.

Figure 6 summarizes the evolution of structural fund expenditure. Reflecting theincreasing importance attributed to cohesion, both the absolute size of the funds andtheir weight in the overall EU budget have increased steadily over time. Structural fundexpenditure accounted for 34.7% of the EU budget and 0.39% of the EU’s GDP in1998, compared with only 10% and 0.09% respectively in 1980.
But in spite of their rapid growth, the structural fund programmes are still too small tohave a significant macroeconomic effect on the receiving economies, even thoughtheir expenditures are highly concentrated on the regions with lower incomes perhead. For example, in the last five years, annual structural fund grants have rangedfrom 1% to at most 3.5% of GDP in the cohesion countries. And they currently amountto only two-thirds of the cost of the agricultural price-support programmes that absorb
the lion’s share of the budget and tend to favour rich agricultural regions at the heartof the EU.
Figure 7 shows the allocation of the funds across the four cohesion countries – Greece,Ireland, Portugal and Spain – over the last two planning periods, 1989-93 and 1994-9.In the first planning period, Ireland received a much higher allocation per head thanthe other cohesion countries. In the second period, Ireland still received more perhead than Greece or Portugal, but the difference was small. The allocation to Spainwas in both cases lower because a significant number of Spanish regions are notclassified as having Objective 1 status. Regions with Objective 1 status are the poorestand therefore most favoured parts of the EU in terms of structural funds.
The allocation of structural funds among different expenditure categories reveals the
Figure 6: Evolution of structural fund allocations
40 Regional policy
Source: Vademecum Budgetaire de la Communauté, 1999
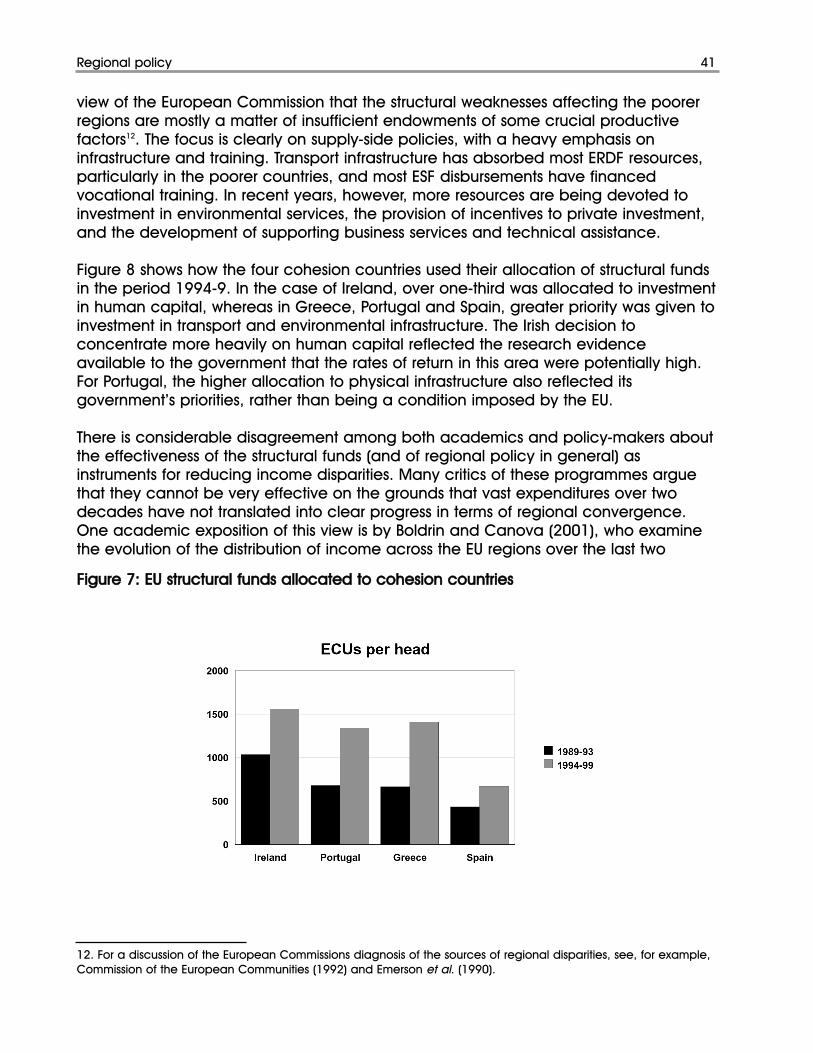
Regional policy 41
view of the European Commission that the structural weaknesses affecting the poorerregions are mostly a matter of insufficient endowments of some crucial productivefactors12. The focus is clearly on supply-side policies, with a heavy emphasis oninfrastructure and training. Transport infrastructure has absorbed most ERDF resources,particularly in the poorer countries, and most ESF disbursements have financedvocational training. In recent years, however, more resources are being devoted toinvestment in environmental services, the provision of incentives to private investment,and the development of supporting business services and technical assistance.
Figure 8 shows how the four cohesion countries used their allocation of structural fundsin the period 1994-9. In the case of Ireland, over one-third was allocated to investmentin human capital, whereas in Greece, Portugal and Spain, greater priority was given toinvestment in transport and environmental infrastructure. The Irish decision toconcentrate more heavily on human capital reflected the research evidenceavailable to the government that the rates of return in this area were potentially high.For Portugal, the higher allocation to physical infrastructure also reflected itsgovernment’s priorities, rather than being a condition imposed by the EU.
There is considerable disagreement among both academics and policy-makers aboutthe effectiveness of the structural funds (and of regional policy in general) asinstruments for reducing income disparities. Many critics of these programmes arguethat they cannot be very effective on the grounds that vast expenditures over twodecades have not translated into clear progress in terms of regional convergence.One academic exposition of this view is by Boldrin and Canova (2001), who examinethe evolution of the distribution of income across the EU regions over the last two
Figure 7: EU structural funds allocated to cohesion countries
12. For a discussion of the European Commissions diagnosis of the sources of regional disparities, see, for example,Commission of the European Communities (1992) and Emerson et al. (1990).
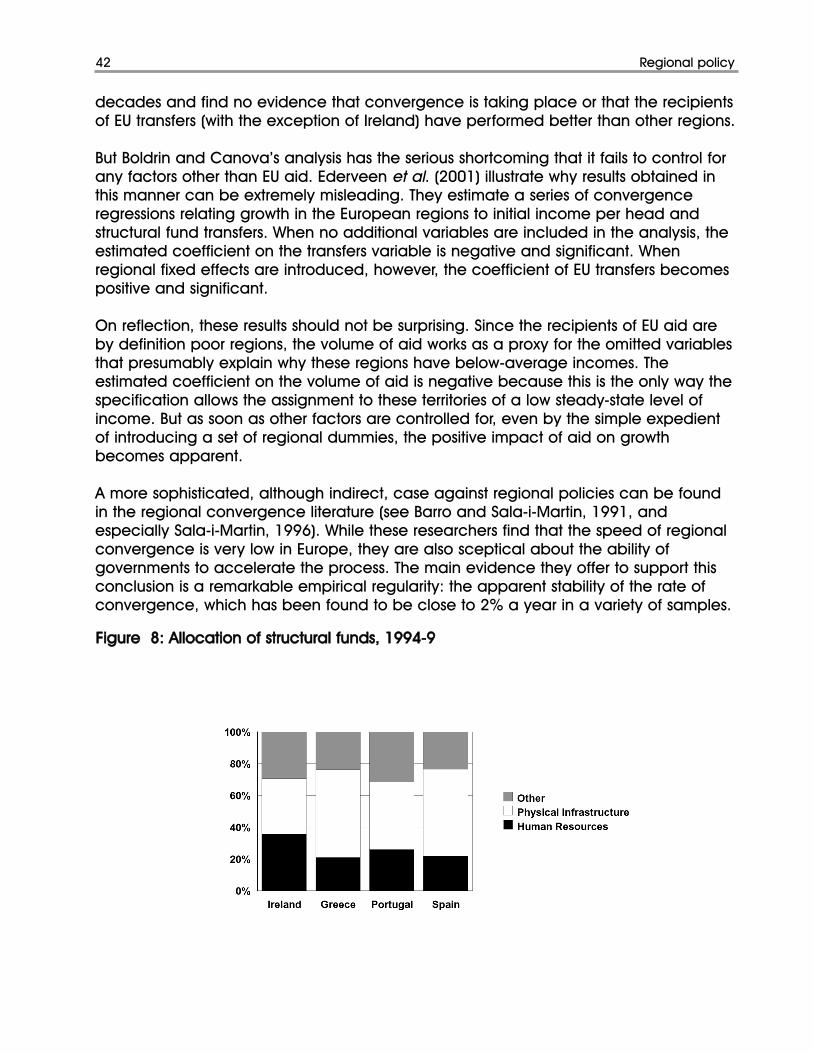
decades and find no evidence that convergence is taking place or that the recipientsof EU transfers (with the exception of Ireland) have performed better than other regions.
But Boldrin and Canova’s analysis has the serious shortcoming that it fails to control forany factors other than EU aid. Ederveen et al. (2001) illustrate why results obtained inthis manner can be extremely misleading. They estimate a series of convergenceregressions relating growth in the European regions to initial income per head andstructural fund transfers. When no additional variables are included in the analysis, theestimated coefficient on the transfers variable is negative and significant. Whenregional fixed effects are introduced, however, the coefficient of EU transfers becomespositive and significant.
On reflection, these results should not be surprising. Since the recipients of EU aid areby definition poor regions, the volume of aid works as a proxy for the omitted variablesthat presumably explain why these regions have below-average incomes. Theestimated coefficient on the volume of aid is negative because this is the only way thespecification allows the assignment to these territories of a low steady-state level ofincome. But as soon as other factors are controlled for, even by the simple expedientof introducing a set of regional dummies, the positive impact of aid on growthbecomes apparent.
A more sophisticated, although indirect, case against regional policies can be foundin the regional convergence literature (see Barro and Sala-i-Martin, 1991, andespecially Sala-i-Martin, 1996). While these researchers find that the speed of regionalconvergence is very low in Europe, they are also sceptical about the ability ofgovernments to accelerate the process. The main evidence they offer to support thisconclusion is a remarkable empirical regularity: the apparent stability of the rate ofconvergence, which has been found to be close to 2% a year in a variety of samples.
Figure 8: Allocation of structural funds, 1994-9
42 Regional policy
Regional policy 43
13. Positive results are reported, among others, by Mankiw et al. (1992) and Barro and Lee (1994), while Islam(1995), Caselli et al. (1996) and others report the loss of significance of schooling indicators in fixed-effect startspecifications. Pritchett (1995) also reports negative results and argues that researchers and policy-makers shouldstart taking them at face value.
According to Sala-i-Martin (1996), the fact that convergence takes place at practicallythe same speed within groups of territories supposedly characterized by very differentlevels of redistributive effort implies that such policies cannot be very effective.
But this conclusion seems far too hasty. Governments can certainly influence the rateat which regions accumulate various productive factors, particularly infrastructure andhuman capital. To the extent that these factors have an effect on productivity and onthe location of mobile private factors, there will be room for supply-side policies toinfluence the dispersion of regional incomes and to promote or accelerate incomeconvergence. From this point of view, the stability of the convergence coefficientacross different samples may indicate that the redistributive effort has been too smallto have a noticeable effect on the evolution of income disparities, and/or that thepolicies adopted in the past have not been very effective. But it cannot be taken asevidence that regional policy per se is necessarily ineffective.
Since EU regional policy has essentially taken the form of conditional grants for thefinancing of training and infrastructure projects, discussion about its effectivenessshould begin with an analysis of the contribution of these two types of investment toproductivity growth. Although the issue is somewhat controversial, we believe that theexisting evidence provides reasonable support for the view that expenditure oneducation can have a considerable effect on productivity growth, and that the sameholds true for infrastructure investment, at least in regions where the endowment of thisfactor is low.
Education and growth
Academic economists have traditionally been inclined to consider educationalexpenditure a key component of national investment with a substantial pay-off in termsof output growth, and have often assigned to the accumulation of human capital acentral role in formal models, particularly in the recent literature on endogenousgrowth. This optimism seemed to be confirmed by a first round of cross-countryempirical studies of the determinants of growth, where a variety of educationalindicators were consistently found to have the expected positive effect.
A second round of such studies (characterized by the use of panel data techniques),however, produced rather disappointing results and even led some researchers toexplicitly question the link between education and productivity13. But the evidenceseems to be accumulating that such negative results were largely due to poor dataand various econometric problems. The current state of thinking about this issue is wellsummarized by Temple (2000), who, after surveying the relevant micro- andmacroeconomic evidence, concludes that ‘the weight of the evidence points tosignificant productivity effects’ of educational investment.

Infrastructure and growth
The degree of consensus on the productivity effects of infrastructure investment isprobably much smaller. The issue has been the subject of a debate that continues inthe literature. The available empirical evidence is problematic and its interpretation iscomplicated by econometric problems that have not yet been fully solved. Early workon the subject, notably by Aschauer (1989), concluded that the elasticity of national orregional output with respect to public capital is large and very significant, and that therate of return on public investment is exceedingly high.
A number of more recent studies, however, have questioned these results on the basisof various econometric problems. Some of these studies find that the significance ofpublic capital disappears when a specification in first differences is used or fixedeffects are introduced to control for unobserved national or regional specificities. Theyconclude that the accumulation of public capital does not appreciably contribute toproductivity growth.
Other recent papers, in contrast, confirm the significance of infrastructure, using co-integration or panel data techniques that should in principle take care of some of themain objections to Aschauer’s results. Some of them (particularly Fernald, 1999) alsoprovide rather convincing evidence that causation runs from infrastructure investmentto productivity growth, and not the other way around. De la Fuente (2000a) surveys theavailable evidence and concludes that there are sufficient indications that publicinfrastructure investment contributes significantly to productivity growth, at least incountries or regions where a saturation point has not been reached.
Similar conclusions are reached by Canning and Pedroni (1999), who also point toimportant differences in the nature of the infrastructure projects being undertaken. Thereturns to such investment are probably quite high when infrastructure is scarce andbasic networks have not been completed, but fall sharply thereafter. Hence,appropriate infrastructure provision is probably a basic ingredient for a successfulregional or national development policy, even if it does not hold the key to rapidproductivity growth in advanced countries where transport and communications needsare already adequately served.
This conclusion is based in part on a comparison of existing results for the regions ofSpain and the states of the United States. Public-capital variables are almost alwayssignificant in panel data specifications for the Spanish regions, and often insignificantin similar exercises conducted with US data. One possible explanation for thisdifference is that, as Fernald (1999) notes, the existing data for the United States start in1970 – approximately the time when the interstate highway system was completed –whereas the Spanish data refer to a sample where the stock of infrastructure was stillclearly insufficient.
In summary, even though the existing evidence is by no means clear-cut, on the wholethe relevant literature suggests that investment in education and infrastructure is animportant source of productivity growth. It follows that regional policy aimed at
44 Regional policy

Regional policy 45
Box 2: The contribution of EU regional programmes to employment and output growth
Most analyses of the impact of the EU’s structural funds follow one of two approaches.
1. The most common one is to use conventional macroeconometric models to simulate the effects of structuralspending on national economic aggregates.
2. An alternative approach relies on direct estimation with regional data of supply-oriented models inspired, atleast loosely, by the recent growth literature.
Each of these methodologies has advantages and drawbacks. Conventional macroeconometric models arewell suited for analysing the short- and medium-term effects of EU policies through their impact on aggregatedemand. In many cases, however, the direct supply effects of structural expenditure have to be introduced ina somewhat ad hoc fashion, as the production blocks of these models are often not designed to capture therelevant effects. The second approach, in contrast, focuses on direct estimation of the relevant supply effects,but fails to consider their demand and price implications.
Taken together, the two sets of studies give a fair indication of the order of magnitude of the relevant effects.Both types of models, moreover, can be used to isolate the impact of structural fund expenditure controllingfor other relevant factors that may affect the performance of the different territories, thus providing a moreaccurate picture than some of the studies reviewed in the main text of this report, such as Boldrin and Canova(2001).
Bradley et al. (1995) summarize a series of studies that analyse the impact of the structural funds on the fourcohesion countries following a common approach1. These studies make use of a series of macroeconometricmodels (the so-called HERMIN family of models), which incorporate supply blocks that allow for positiveexternalities arising from investment in infrastructure and human capital, as well as the demand-side effectsthat are standard in neo-Keynesian models.
The estimates of the relevant long-run supply-side effects of the 1994-9 Community Support Framework (CSF)are substantial in all cases. After stripping out the demand-side impact, the estimated effect of the 1994-9 CSFamounts to 1.3 percentage points of GDP in Portugal, 6.8 points in Spain, 2.8 points in Ireland and 8 points inGreece. A somewhat lower estimate (of 2 percentage points of GNP) is obtained for Ireland using a speciallyconstructed supply-side model (see Fitzgerald, 1998, for a summary of the relevant work).
Many studies of the supply-side impact of EU regional policies focus on Spain. De la Fuente and Vives (1995)estimate a simple model of regional income determination built on a production function that includes humancapital and infrastructure as inputs. They find that differences in the stocks of these factors are responsible fora significant fraction of regional income disparities, and that ERDF-financed infrastructure investment duringthe second half of the 1980s was rather effective. In spite of the limited size of the programme, ERDF addedaround 2 percentage points to average regional productivity and reduced the dispersion of regional outputper worker by around 5%. This figure represents one-third of the observed decrease in the dispersion ofproductivity during the 1980s and, from this perspective, is far from negligible.
A more recent study by de la Fuente (2000b) on the impact of the 1994-9 CSF on the Objective 1 regions ofSpain reaches similar conclusions. He estimates a production function and an employment equation withpanel data for the Spanish regions, and computes social rates of return on various types of structural fund...
reducing regional disparities by supporting the accumulation of these factors in poorregions can work in principle. Box 2 reviews some studies that have attempted tomeasure the actual contribution of EU regional programmes to employment andoutput growth in recipient countries and regions.
1. See Bradley et al. (1995) for Ireland, Modesto and Neves (1995) for Portugal, and Herce and Sosvilla-Rivero(1995) for Spain. Christodoulakis and Kalyvitis (2000) follow a similar approach for Greece.

46 Regional policy
...expenditure. His results suggest that the contribution of the structural funds to the growth of output andemployment in the Objective 1 regions of Spain during the period 1994-9 was quite considerable. InAndalucía, for example, the effect on output has exceeded 1 percentage point a year, the employmenteffect is around 0.4 points a year and the overall rate of return on CSF-related public expenditure is 30%. Theresults are similar for other Objective 1 regions and add up to growth and employment contributions of 0.6%and 0.2% a year respectively for the whole of Spain (including the regions not covered by Objective 1).
Bean (1997) analyses the impact of productive public investment in the Spanish regions using a structuralValue-at-Risk model that describes the joint evolution of output, private and public capital, employment andunemployment. His results also indicate that the output effects of public investment are important. His estimateof the elasticity of output with respect to the stock of infrastructure (around one-third) is much higher thanexisting direct estimates of the relevant production function elasticity (around 10%). This finding suggests thatfeedback effects through increased employment and private investment are of considerable importance.
In the specific case of training programmes, many of the activities funded by the EU in these areas havebeen subjected to extensive evaluation to assess their rate of return. Denny et al. (2000) evaluate a widerange of educational and labour market interventions in Ireland using a consistent methodology. Their resultsshow that some of the EU-funded programmes had a strong impact on subsequent earnings and others wereless successful. This is unsurprising but, as a result of this study and a series of earlier studies, the education andlabour market programmes gradually evolved over the 1990s. The more successful programmes have beenmaintained and some of the least successful ones have been dropped. Although this research does notprovide a precise estimate of the overall rate of return on training programmes, it does show policy-makerslearning from research and gradually moving to maximize returns from investment.
An important implicit assumption of the existing supply-side studies of the impact of EUregional policies is that all investment financed by the structural funds has exactly thesame impact as other projects of the same nature. It is possible, however, thatbecause of the low marginal cost of these resources, both to the national and regionaladministrations and to the private sector, they may be used to finance projects thatwould not survive a strict cost-benefit analysis or that these projects may be lessefficiently managed than those financed entirely by national budgets.
While there is no hard evidence on this issue (largely because the existing data are notdetailed enough to test the hypothesis), there are probably valid reasons for concernabout waste and mismanagement. It is likely that a correction for this factor wouldsomewhat reduce estimates of the impact of EU regional policy programmes, but it ishighly unlikely that it would drive the relevant rates of return to unacceptably lowvalues.
Even so, there are good reasons to continue to work on the improvement of projectselection, control and evaluation procedures in order to increase the returns tostructural fund expenditure. These issues are likely to be particularly important in thecase of new EU members, which may initially lack the capacity to manageappropriately a large inflow of funds. Experience with the structural funds in the currentcohesion countries shows that the process itself can bring benefits. through improvedplanning and better management practices14.
As in these countries, the introduction of an evaluation culture into the CEECs, showing
14. See Fitzgerald (1998) for an analysis of the Irish case.
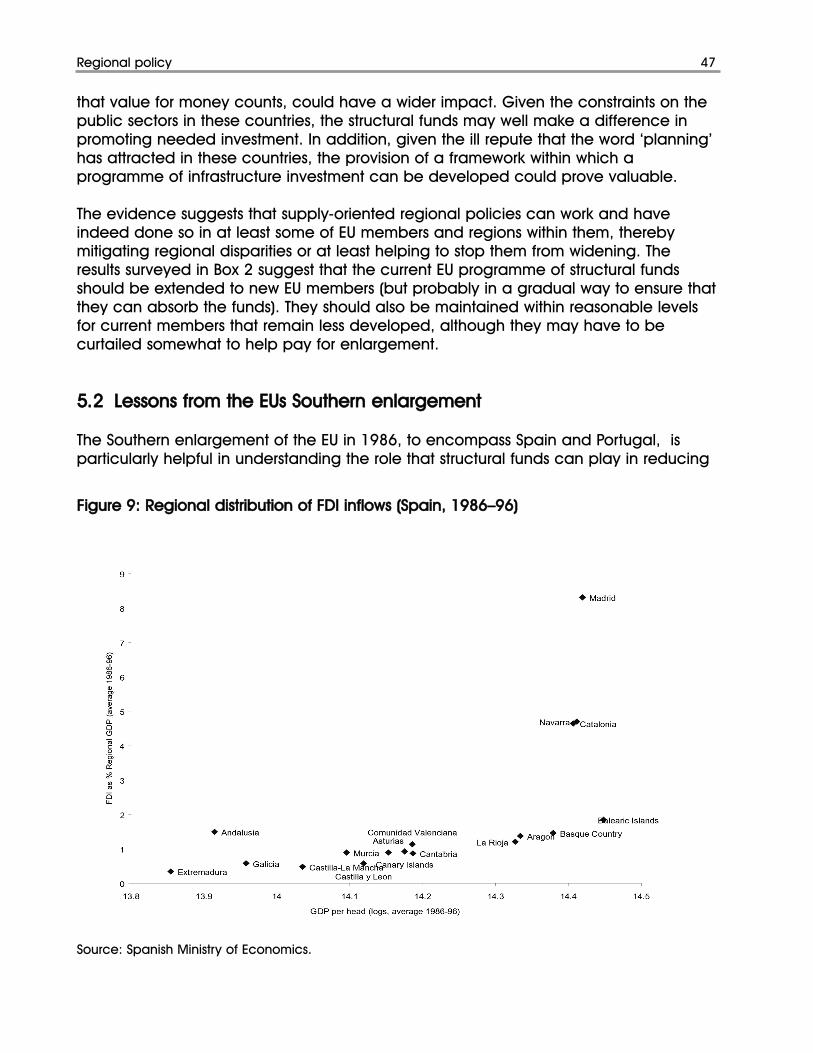
Regional policy 47
that value for money counts, could have a wider impact. Given the constraints on thepublic sectors in these countries, the structural funds may well make a difference inpromoting needed investment. In addition, given the ill repute that the word ‘planning’has attracted in these countries, the provision of a framework within which aprogramme of infrastructure investment can be developed could prove valuable.
The evidence suggests that supply-oriented regional policies can work and haveindeed done so in at least some of EU members and regions within them, therebymitigating regional disparities or at least helping to stop them from widening. Theresults surveyed in Box 2 suggest that the current EU programme of structural fundsshould be extended to new EU members (but probably in a gradual way to ensure thatthey can absorb the funds). They should also be maintained within reasonable levelsfor current members that remain less developed, although they may have to becurtailed somewhat to help pay for enlargement.
55..22 LLeessssoonnss ffrroomm tthhee EEUUss SSoouutthheerrnn eennllaarrggeemmeenntt
The Southern enlargement of the EU in 1986, to encompass Spain and Portugal, isparticularly helpful in understanding the role that structural funds can play in reducing
Figure 9: Regional distribution of FDI inflows (Spain, 1986–96)
Source: Spanish Ministry of Economics.
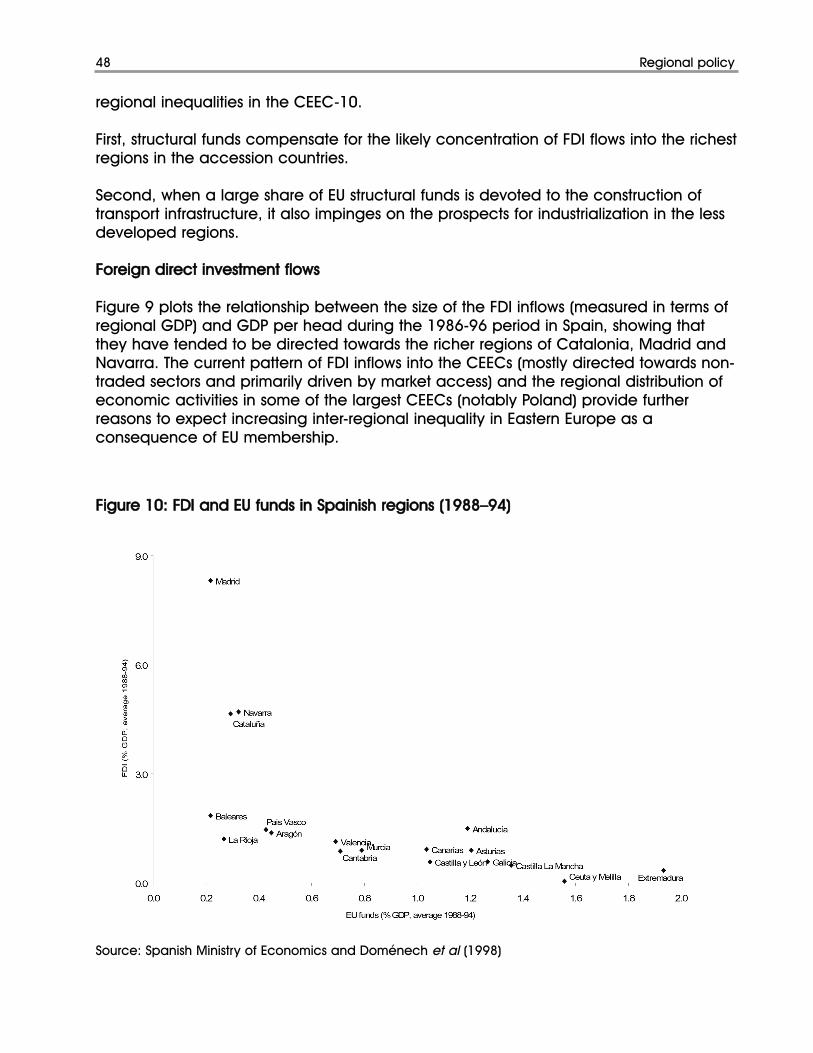
regional inequalities in the CEEC-10.
First, structural funds compensate for the likely concentration of FDI flows into the richestregions in the accession countries.
Second, when a large share of EU structural funds is devoted to the construction oftransport infrastructure, it also impinges on the prospects for industrialization in the lessdeveloped regions.
Foreign direct investment flows
Figure 9 plots the relationship between the size of the FDI inflows (measured in terms ofregional GDP) and GDP per head during the 1986-96 period in Spain, showing thatthey have tended to be directed towards the richer regions of Catalonia, Madrid andNavarra. The current pattern of FDI inflows into the CEECs (mostly directed towards non-traded sectors and primarily driven by market access) and the regional distribution ofeconomic activities in some of the largest CEECs (notably Poland) provide furtherreasons to expect increasing inter-regional inequality in Eastern Europe as aconsequence of EU membership.
Figure 10: FDI and EU funds in Spainish regions (1988–94)
48 Regional policy
Source: Spanish Ministry of Economics and Doménech et al (1998)
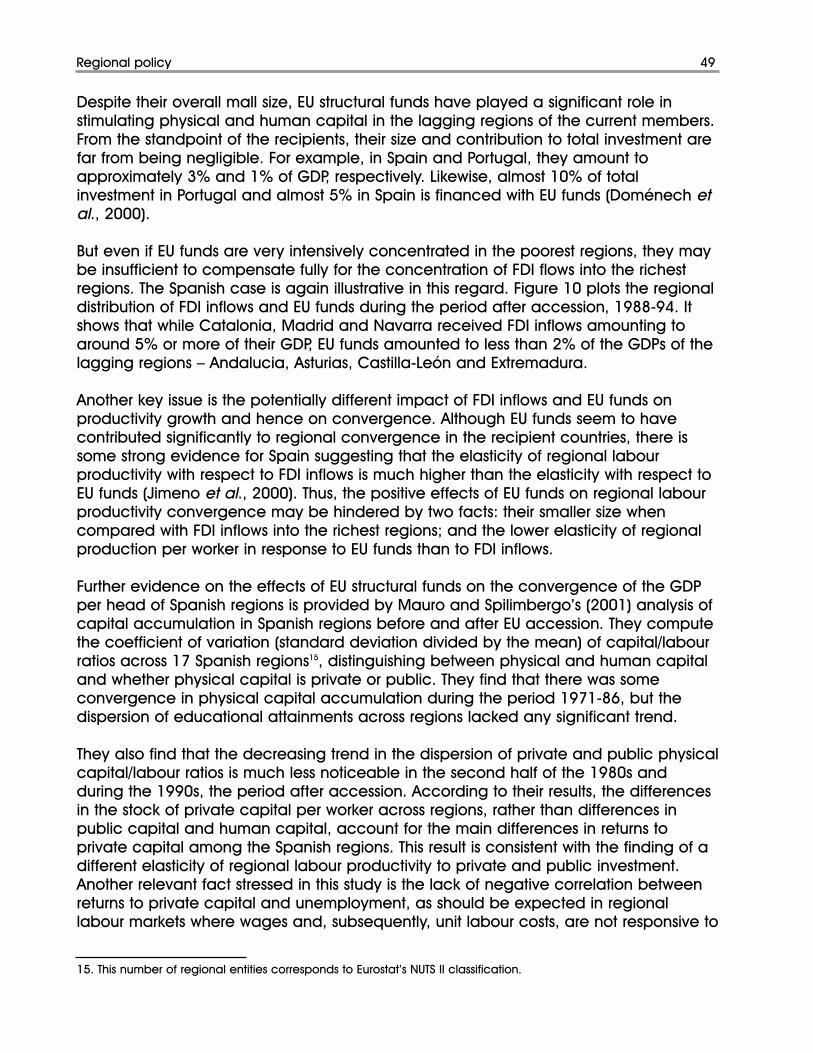
Regional policy 49
Despite their overall mall size, EU structural funds have played a significant role instimulating physical and human capital in the lagging regions of the current members.From the standpoint of the recipients, their size and contribution to total investment arefar from being negligible. For example, in Spain and Portugal, they amount toapproximately 3% and 1% of GDP, respectively. Likewise, almost 10% of totalinvestment in Portugal and almost 5% in Spain is financed with EU funds (Doménech etal., 2000).
But even if EU funds are very intensively concentrated in the poorest regions, they maybe insufficient to compensate fully for the concentration of FDI flows into the richestregions. The Spanish case is again illustrative in this regard. Figure 10 plots the regionaldistribution of FDI inflows and EU funds during the period after accession, 1988-94. Itshows that while Catalonia, Madrid and Navarra received FDI inflows amounting toaround 5% or more of their GDP, EU funds amounted to less than 2% of the GDPs of thelagging regions – Andalucia, Asturias, Castilla-León and Extremadura.
Another key issue is the potentially different impact of FDI inflows and EU funds onproductivity growth and hence on convergence. Although EU funds seem to havecontributed significantly to regional convergence in the recipient countries, there issome strong evidence for Spain suggesting that the elasticity of regional labourproductivity with respect to FDI inflows is much higher than the elasticity with respect toEU funds (Jimeno et al., 2000). Thus, the positive effects of EU funds on regional labourproductivity convergence may be hindered by two facts: their smaller size whencompared with FDI inflows into the richest regions; and the lower elasticity of regionalproduction per worker in response to EU funds than to FDI inflows.
Further evidence on the effects of EU structural funds on the convergence of the GDPper head of Spanish regions is provided by Mauro and Spilimbergo’s (2001) analysis ofcapital accumulation in Spanish regions before and after EU accession. They computethe coefficient of variation (standard deviation divided by the mean) of capital/labourratios across 17 Spanish regions15, distinguishing between physical and human capitaland whether physical capital is private or public. They find that there was someconvergence in physical capital accumulation during the period 1971-86, but thedispersion of educational attainments across regions lacked any significant trend.
They also find that the decreasing trend in the dispersion of private and public physicalcapital/labour ratios is much less noticeable in the second half of the 1980s andduring the 1990s, the period after accession. According to their results, the differencesin the stock of private capital per worker across regions, rather than differences inpublic capital and human capital, account for the main differences in returns toprivate capital among the Spanish regions. This result is consistent with the finding of adifferent elasticity of regional labour productivity to private and public investment.Another relevant fact stressed in this study is the lack of negative correlation betweenreturns to private capital and unemployment, as should be expected in regionallabour markets where wages and, subsequently, unit labour costs, are not responsive to
15. This number of regional entities corresponds to Eurostat’s NUTS II classification.
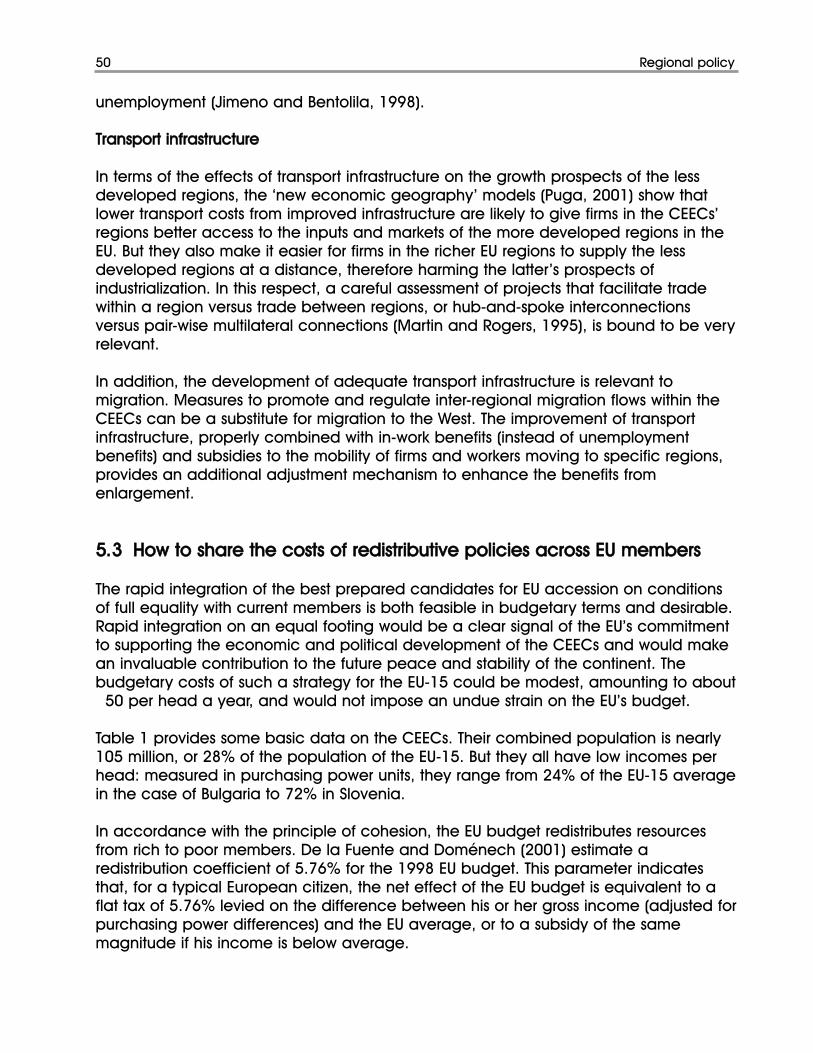
unemployment (Jimeno and Bentolila, 1998).
Transport infrastructure
In terms of the effects of transport infrastructure on the growth prospects of the lessdeveloped regions, the ‘new economic geography’ models (Puga, 2001) show thatlower transport costs from improved infrastructure are likely to give firms in the CEECs’regions better access to the inputs and markets of the more developed regions in theEU. But they also make it easier for firms in the richer EU regions to supply the lessdeveloped regions at a distance, therefore harming the latter’s prospects ofindustrialization. In this respect, a careful assessment of projects that facilitate tradewithin a region versus trade between regions, or hub-and-spoke interconnectionsversus pair-wise multilateral connections (Martin and Rogers, 1995), is bound to be veryrelevant.
In addition, the development of adequate transport infrastructure is relevant tomigration. Measures to promote and regulate inter-regional migration flows within theCEECs can be a substitute for migration to the West. The improvement of transportinfrastructure, properly combined with in-work benefits (instead of unemploymentbenefits) and subsidies to the mobility of firms and workers moving to specific regions,provides an additional adjustment mechanism to enhance the benefits fromenlargement.
55..33 HHooww ttoo sshhaarree tthhee ccoossttss ooff rreeddiissttrriibbuuttiivvee ppoolliicciieess aaccrroossss EEUU mmeemmbbeerrss
The rapid integration of the best prepared candidates for EU accession on conditionsof full equality with current members is both feasible in budgetary terms and desirable.Rapid integration on an equal footing would be a clear signal of the EU’s commitmentto supporting the economic and political development of the CEECs and would makean invaluable contribution to the future peace and stability of the continent. Thebudgetary costs of such a strategy for the EU-15 could be modest, amounting to about�50 per head a year, and would not impose an undue strain on the EU’s budget.
Table 1 provides some basic data on the CEECs. Their combined population is nearly105 million, or 28% of the population of the EU-15. But they all have low incomes perhead: measured in purchasing power units, they range from 24% of the EU-15 averagein the case of Bulgaria to 72% in Slovenia.
In accordance with the principle of cohesion, the EU budget redistributes resourcesfrom rich to poor members. De la Fuente and Doménech (2001) estimate aredistribution coefficient of 5.76% for the 1998 EU budget. This parameter indicatesthat, for a typical European citizen, the net effect of the EU budget is equivalent to aflat tax of 5.76% levied on the difference between his or her gross income (adjusted forpurchasing power differences) and the EU average, or to a subsidy of the samemagnitude if his income is below average.
50 Regional policy
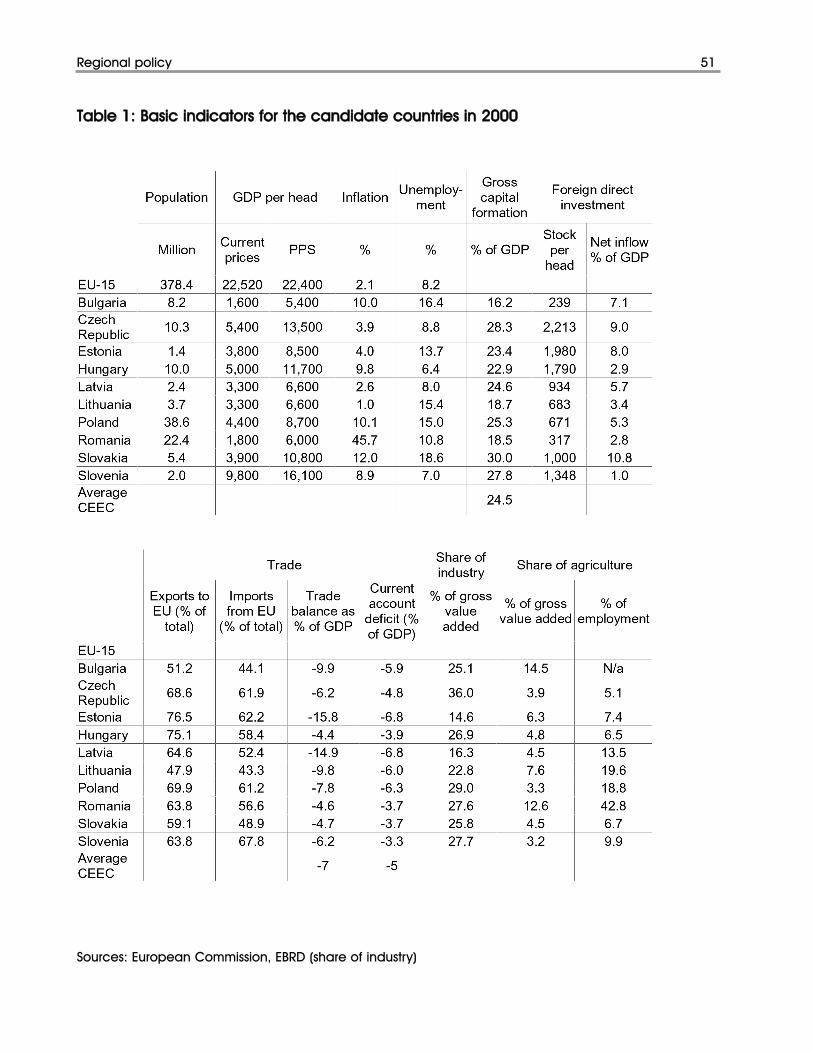
Regional policy 51
Table 1: Basic indicators for the candidate countries in 2000
Sources: European Commission, EBRD (share of industry)

The budgetary costs of the accession of the first group of candidate countries to the EU(which excludes Bulgaria, Romania and Turkey from the 13 countries currentlyapplying) can be approximated under the assumption that the degree of redistributionimplicit in current EU budget practices is maintained and extended to the newentrants. Applying the budget allocation rule implicit in de la Fuente and Doménech’sestimate, it is possible to compute the net budget surpluses to which new memberswould be entitled as a function of the difference between their incomes per head andthe average income per head of the enlarged EU, with both variables measured inpurchasing power units.
This provides an estimate of the net budgetary costs of enlargement to current EUmembers, which would have to finance these surpluses if enlargement were to takeplace right away and without transitional periods. The resulting figure should be anupper bound on the actual costs for two reasons.
First, structural funds are likely to be phased in gradually over a transitional period tomake sure that new members have the capacity to absorb and manage these fundsappropriately
Second, it can be expected that income differences between new and current EUmembers will diminish gradually over time, thereby reducing the need for transfersbelow these estimates by the time accession is completed.
On the other hand, rapid convergence in price levels between the new members andthe rest of the EU would significantly increase the cost of the proposed policy.
Table 2 summarizes the required information and the results of the computation. Thenet budget surpluses per head in PPS units in column [2] are obtained by multiplyingthe difference between each country’s real income per head and the average valueof the same variable in an enlarged EU composed of current members and all exceptMalta of the ten candidate countries expected to join in the first wave. This figure istranslated from PPS units to current euros in column [3] by using the price indices shownin Table 1. Multiplying the nominal per head net balances by the population of eachcountry gives the total net balances in column [4] in millions of current euros. The lasttwo columns of the table show the values of these balances as a percentage of eachcandidate country’s own GDP (column [5]) and the GDP of the current EU (column [6]).
If the current degree of redistribution through the EU budget is maintained, most of thenew members should receive significant net transfers, ranging from 0.69% of GDP inthe case of Cyprus to 13.25% in Latvia. The sum of the required transfers is 19.5 billioneuros, or one-quarter of a percentage point of the EU-15’s GDP.
This level of transfers to new entrants can be accommodated by the EU budget withoutundue strain. The current financial perspectives approved in the Berlin summit of 1999earmark for accession-related expenditures in 2006 a sum of 14.2 billion euros(measured in 1999 prices, as our figures) leaving a margin of another 12.8 billion eurosfor potential expenditure increases without violating the resources ceiling set at 1.27%
52 Regional policy

Regional policy 53
Table 2: Calculation of the net fiscal balances of new entrants under current conditionsgiven the 1998 redistribution coefficient for the EU budget
of GNP. The sum of these two figures would be more than enough to finance the fullintegration of the entire first group of candidate countries by 2006. Since things arelikely to proceed at a rather slower pace, the budgeted amount of accession-relatedexpenditure is likely to be sufficient to allow any new entrants immediate and fairlyunrestricted access to EU programmes.
How should these costs of enlargement be shared among current EU members? Toanswer this question, assume that all EU members agree that the current allocation ofbudget costs and benefits is fair. Under this provisional assumption of an unquestionedstatus quo, it would seem natural to share the costs of enlargement equally, that is, toincrease the deficits per head or reduce the surpluses per head of current membersby an equal amount in PPS units. This would amount to shifting down uniformly ahypothetical budget allocation rule linking net per head budget balances to incomeper head to allow for the reduction of average EU income per head as a result ofenlargement, while keeping the degree of redistribution constant.
The first three columns of Table 3 show the implications of this benchmark proposal. Theannual per capita cost to the EU-15 of financing the net transfers to new entrantscalculated above would be 52.1 euros in PPS units, as shown in the first column ofTable 3. This figure is then translated into current euros by applying the appropriateprice index and multiplying by each country’s population to obtain the totalcontributions shown in the third column. These range from 24 million euros forLuxembourg to 4.5 billion euros for Germany, and add up to the required 19.5 billioneuros.
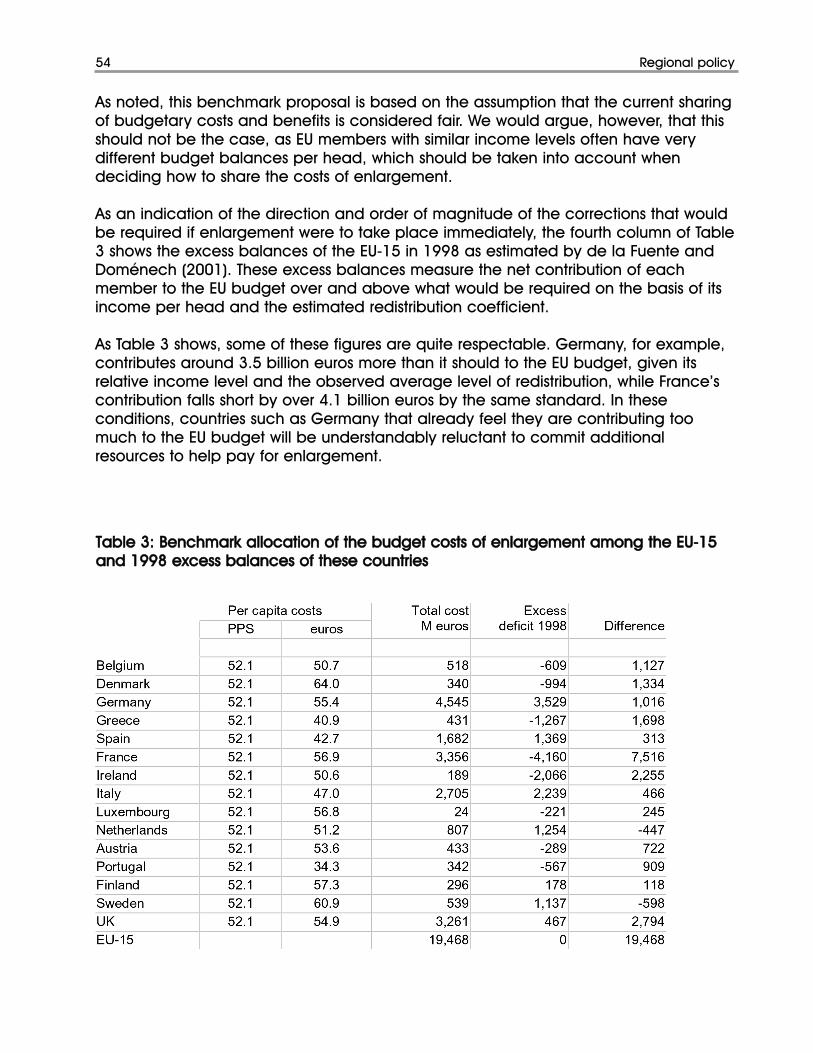
As noted, this benchmark proposal is based on the assumption that the current sharingof budgetary costs and benefits is considered fair. We would argue, however, that thisshould not be the case, as EU members with similar income levels often have verydifferent budget balances per head, which should be taken into account whendeciding how to share the costs of enlargement.
As an indication of the direction and order of magnitude of the corrections that wouldbe required if enlargement were to take place immediately, the fourth column of Table3 shows the excess balances of the EU-15 in 1998 as estimated by de la Fuente andDoménech (2001). These excess balances measure the net contribution of eachmember to the EU budget over and above what would be required on the basis of itsincome per head and the estimated redistribution coefficient.
As Table 3 shows, some of these figures are quite respectable. Germany, for example,contributes around 3.5 billion euros more than it should to the EU budget, given itsrelative income level and the observed average level of redistribution, while France’scontribution falls short by over 4.1 billion euros by the same standard. In theseconditions, countries such as Germany that already feel they are contributing toomuch to the EU budget will be understandably reluctant to commit additionalresources to help pay for enlargement.
54 Regional policy
Table 3: Benchmark allocation of the budget costs of enlargement among the EU-15and 1998 excess balances of these countries

Regional policy 55
One likely outcome is that such countries will press for the curtailment of existingprogrammes (and especially of structural funds to the poorest EU-15 countries) and forthe imposition of limits on the amount of transfers to new entrants. It may be preferableto use enlargement as an opportunity to revise current budget practices in a way thatensures greater horizontal equity while maintaining the current degree of redistributionof the system and extending it to new entrants.
55..44 HHooww ttoo aallllooccaattee tthhee ffuunnddss
To reduce the risk of a gross waste of resources, reform of the structural funds should gobeyond the financing method and also envisage ways to allocate the funds thatincrease the incentives to make better use of them. Two alternative broad principlescan be adopted in this context.
The first approach is to leave the allocation mechanism as it is, with the EU co-financing regional spending and a limited involvement of national governments in theprocess. This approach has led in some cases to excessive inter-regional redistributionand results in an ineffective allocation of funds when local administrations are weak(for example, in the Italian Mezzogiorno), as we can expect to be the case in mostpoor regions of the CEECs.
The second approach is to strengthen the role played by national governments in theallocation of structural funds under the scrutiny of EU authorities and to abandon rigidco-funding requirements. This approach provides better guarantees of an effective useof resources and avoids the duplication of effort. In addition, countries already have inplace systems of internal personal redistribution that presumably reflect theirpreferences. But the approach may lead to too little regional redistribution andpotentially undesirable effects in terms of unskilled migration from these countries.
Our preference is for a greater involvement of national governments in the allocationof structural funds, leaving their regional distribution at the discretion of EU members.This will allow an increase in the efficiency of regional policies that should promote –according to economic geography models – the attainment of economies ofagglomeration, and hence may go contrary to allocation mechanisms rewarding allthe poorest regions in a country. Redistribution to the poorest regions should, after all,also proceed along the lines proposed in Section 3 of this report, that is, by adopting aEuropean social minimum and, if necessary, co-funding it with a special chapter of theEU budget.
References
Acemoglu, D. and J.–S. Pischke (1998), ‘Why Do Firms Train? Theory and Evidence’,Quarterly Journal of Economics 113 (1), pp. 79-119.
Acemoglu, D. and J. Ventura (2001), ‘The World Income Distribution’ NBER WP SeriesVG015 8083
Alecke, B., P. Huber and G. Untiedt (2001), ‘What a Difference a Constant Makes: HowPredictable Are International Migration Flows?’, in OECD, Migration Policies and EUEnlargement: The Case of Central and Eastern Europe, Paris: OECD, pp. 63-78.
Alogoskoufis, G. (1995), ‘The Two Faces of Janus: Institutions, Policy Regimes andMacroeconomic Performance in Greece’, Economic Policy 20, pp. 147-84.
Anderson, T.W. and C. Hsiao (1981), ‘Estimation of Dynamic Models with ErrorComponents’, Journal of the American Statistical Association 76, pp. 47-82.
Arellano, M. and S. Bond (1991), ‘Some Tests of Specification for Panel Data: MonteCarlo Evidence and an Application to Employment Equations’, Review of EconomicStudies, 58, pp. 277-297
Arellano, M. and S. Bond (1995), ‘Another Look at the Instrumental Variables Estimationof Error-component Models’, Journal of Econometrics 68 S, pp. 29-51.
Aschauer, D. (1989), ‘Is Public Expenditure Productive?’, Journal of Monetary Economics23, pp. 177-200.
Atkinson, A.B. (1998), Three Lectures on Poverty in Europe, Oxford: Basil Blackwell.
Baldwin, R.E., J.F. Francois, C. Cedilla and R. Portes (1997), ‘The Costs and Benefits ofEastern Enlargement: the Impact on EU and Central Europe’, Economic Policy 24, pp.97-105.
Barro, R.J. and J.-W. Lee (1994), ‘Sources of Economic Growth’, Carnegie-RochesterConference Series on Public Policy 40, pp. 1-46.
Barro, R.J. and X. Sala-i-Martin (1991), ‘Convergence across States and Regions’,Brookings Papers on Economic Activity 1, pp. 107-82.
Barro, R.J. and X. Sala-i-Martin (1995), Economic Growth, New York: McGraw-Hill.Bauer, T., and K.F. Zimmermann (1999), ‘Assessment of Possible Migration Pressure and its
Labour Market Impact Following EU Enlargement to Central and Eastern Europe’, IZAResearch Report No. 3, Bonn: IZA.
Bean, C. (1997), ‘The Impact of Cohesion Fund Spending on Regional Output andEmployment in the Presence of Interregional Spillovers’, mimeo, London School ofEconomics.
Bean, C., S. Bentolila, G. Bertola and J. Dolado (1998), Social Europe: One for All?,Monitoring European Integration 8, London: CEPR.
Bentolita, S. and J. Jimeno ‘Regional Unemployment Persistence, spain, 1976-1994’,Labour Economics 5, (1998).
Bertola, G. (1999), ‘Microeconomic Perspectives on Aggregate Labour Markets’, in O.Ashenfelter and D. Card (eds), Handbook of Labour Economics 3B, Amsterdam: North-Holland, pp. 2985-3028.
Bertola, G. (2000), ‘Labour Markets in the European Union,’ IFO Studie 1/2000, pp. 99-122.
Bertola, G. (2001), ‘Job Security and Labour Income Risk’,http://www.iue.it/Personal/Bertola.
Bertola, G. et al. (2001), ‘EU Welfare Systems and Labour Markets: Diverse in the Past,Integrated in the Future?’, in G. Bertola, T. Boeri and G. Nicoletti (eds), Welfare andEmployment in a United Europe, Cambridge, MA: MIT Press.
Bertola, G., J.F. Jimeno, R. Marimon and C. Pissarides (2001), ‘Welfare Systems andLabour Markets in Europe: What Convergence before and after EMU?’, in G. Bertola, T.Boeri and G. Nicoletti (eds), Welfare and Employment in a United Europe, Cambridge,MA: MIT Press.
Bertola, G., and R. Rogerson (1997), ‘Institutions and Labour Reallocation’, EuropeanEconomic Review 41 (6), pp. 1147-71.
Blanchard, O.J., and L.F. Katz (1992), ‘Regional Evolutions’, Brookings Papers onEconomic Activity 1, pp. 1-61.Brookings Institution, Washington
Boeri, T. (2000), Structural Change, Welfare Systems and Labour Reallocation, Oxford:Oxford University Press.
Boeri, T. and G. Bertola (2001), ‘EMU Labour Markets Two Years On: MicroeconomicsTensions and Institutional Evolution’, in Buti, M. and Sapir, A. (2002) EMU and EconomicPolicy in EMU – The Challenge of the Early Years, Edward Elgar.
Boeri, T., H. Brücker et al. (2001), ‘The Impact of Eastern Enlargement on Employmentand Labour Markets in the EU Member States’, Brussels: European Commission.
References 57
58 References
Boeri, T. and M. Burda (1996), ‘Active Labour Market Policies, Job Matching and theCzech Miracle’, European Economic Review, pp 805-17.
Boeri, T., G. Nicoletti and S. Scarpetta (2000), ‘Regulation and Labour MarketPerformance’, in G. Galli and J. Pelkmans (eds), Regulatory Reform andCompetitiveness in Europe, Northampton, MA: Edward Elgar.
Boldrin, M. and F. Canova (2001), ‘Income Disparities and Regional Policies’, EconomicPolicy 32, pp. 205-53.
Borjas, G.J. (1987), ‘Self-selection and the Earnings of Immigrants’, American EconomicReview 77, pp. 531-53.
Borjas, G.J. (1999), Heaven’s Door: Immigration Policy and the American Economy,Princeton, NJ: Princeton University Press.
Bradley, J., J. Herce and L. Modesto (1995), ‘The Macroeconomic Effects of the CSF1994-99 in the EU Periphery: An Analysis Based on the HERMIN Model’, EconomicModelling 12 (3).
Bradley, J., K. Whelan and J. Wright (1995), ‘HERMIN Ireland’, Economic Modelling 12(3).
Breuss, F. (2001), ‘Macroeconomic Effects of EU Enlargement for the Old and the NewMembers’, WIFO Working Paper No. 143/2001, Vienna: WIFO.
Brücker, H. (2001), ‘Die Folgen der Freizügigkeit für die Ost-West-Migration’,Konjunkturpolitik, Beiheft ‘Migration in Europa’ No. 52, pp. 17-54.
Büchel, F. and J. Schwarze (1994), ‘Die Migration von Ost- nach Westdeutschland –Absicht und Realisierung’, Mitteilungen zur Arbeitsmarkt- und Berufsforschung 27 (1), pp.43-52.
Burda, M. (1995), ‘Migration and the Option Value of Waiting’, Economic and SocialReview 27, pp. 1-19.
Canning, D. and P. Pedroni (1999), ‘Infrastructure and Long Run Economic Growth’,Working Paper No. 90-09, Cornell University, Ithaca, NY, Center for AnalyticalEconomics.
Caselli, F., G. Esquivel and F. Lefort (1996), ‘Reopening the Convergence Debate: ANew Look at Cross-country Growth Empirics’, Journal of Economic Growth, pp. 363-89.
Christodoulakis, N. and S. Kalyvitis (2000), ‘The Effects of the Second CommunitySupport Framework 1994-99 on the Greek Economy’, Journal of Policy Modelling 22 (5).
Commission of the European Communities (1992), Comunicación de la Comisión: Las
Políticas Estructurales Comunitarias, Balance y Perspectivas, Luxembourg.
De la Fuente, A. (2000a), ‘The Effect of Structural Fund Spending on the SpanishRegions: A Preliminary Assessment of the 1994-99 Objective 1 CSF’, mimeo, Instituto deAnálisis Económico, Barcelona.
De la Fuente, A. (2000b), ‘Infrastructures and Productivity: A Survey’, mimeo, Instituto deAnálisis Económico, Barcelona.
De la Fuente, A. and R. Doménech (2001), ‘The Redistributive Effects of the EU Budget:An Analysis and a Proposal for Reform’, Journal of Common Market Studies 39 (2), pp.307-30.
De la Fuente, A. and X. Vives (1995), ‘Infrastructure and Education as Instruments ofRegional Policy: Evidence from Spain’, Economic Policy 20, pp. 12-51.
Denny, K., C. Harmon and P. O’Connell (2000), Investing in People, Policy ResearchSeries No. 38, Economic and Social Research Institute, Dublin.
Doménech, R., A. Maudes and J. Varela (2000), ‘Fiscal Flows in Europe: TheRedistributive Effects of the EU Budget’, Weltwirtschaftliches Archiv 4.
Ederveen, S., J. Gorter and R. Nahuis (2001), ‘The Wealth of Regions: The Impact ofStructural Funds on Convergence in the EU’, mimeo, Netherlands Bureau for EconomicPolicy Analysis, The Hague.
Emerson, M., D. Gros and J. Pisani-Ferry (1990), ‘One Market, One Money: AnEvaluation of the Potential Benefits and Costs of Forming an Economic and MonetaryUnion’, European Economy 44, pp. 3-347.
European Bank for Reconstruction and Development (1997), Transition Report, London:EBRD.
Fassmann, H. and C. Hintermann, (1997), ‘Migrationspotential Ostmitteleuropa’, ISR-Forschungsberichte No. 15, Institut für Stadt- und Regionalforschung, Vienna.
Fernald, J. (1999), ‘Roads to Prosperity? Assessing the Link Between Public Capital andProductivity’, American Economic Review 89 (3), pp. 619-38.
Fernandez, R. and D. Rodrik (1991), ‘Resistence to Reform: Status Quo Bias in thePrescence of Individual-Specific Uncertainty’ American Economic Review, Vol 81 (5) pp1146-55.
Fertig, M. (1999), ‘The Economic Impact of EU-enlargement: Assessing the MigrationPotential’, Discussion Paper No. 964, Department of Economics, University ofHeidelberg.
References 59
60 References
Fertig, M. and C.M. Schmidt (2000), ‘Aggregate-level Migration Studies as a Tool forForecasting Future Migration Streams’, Discussion Paper No. 324, Department ofEconomics, University of Heidelberg.
Fischer S., R. Sahay and C.A. Vegh (1998), ‘From Transition to Market: Evidence andGrowth Prospects’, IMF Working Paper 98/53.
Fitzgerald, J. (1998), ‘An Irish Perspective on the Structural Funds’, European PlanningStudies 6 (6).
Flaig, G. (2001), ‘Zur Abschätzung der Migrationspotentiale der osteuropäischen EU-Beitrittsländer’, Konjunkturpolitik, Beiheft ‘Migration in Europa’ No. 52, pp. 55-76.
Frankel, J.A. and A.K. Rose (2000), ‘An Estimate of the Effect of Currency Unions onTrade and Output’, CEPR Discussion Paper No. 2631. Centre for Economic PolicyResearch.
Franzmeyer, F. and H. Brücker (1997), ‘Europäische Union, Osterweiterung undArbeitskräftemigration’, Deutsches Institut für Wirtschaftsforschung, Berlin No. 5/97.
Hanson, G. (1998), ‘North American Economic Integration and Industry Location’,Oxford Review of Economic Policy 14 (2), pp. 30-44.
Hanson, G. (2001), ‘US-Mexico Integration and Regional Economies: Evidence fromBorder-City Pairs’, Journal of Urban Economics.
Hanson, G., R. Robertson and A. Spilimbergo (2002), ‘Does Border Enforcement ProtectUS Workers from Illegal Immigration?’, Review of Economics and Statistics, forthcoming.
Harris, J.R. and M.P. Todaro (1970), ‘Migration, Unemployment and Development: A Two-sector Analysis’, American Economic Review 60, pp. 126-42.
Hatton, T.J. (1995), ‘A Model of UK Emigration, 1870-1913’, Review of Economics andStatistics 77 (3), pp. 407-15.
Herce J. and S. Sosvuilla-Rivero (1995), ‘HERMIN Spain’, Economic Modelling 12 (3).
Hille, H. and T. Straubhaar (2001), ‘The Impact of EU-enlargement on MigrationMovements and Economic Integration, Results of Recent Studies’, in OECD, MigrationPolicies and EU Enlargement. The Case of Central and Eastern Europe, Paris: OECD, pp.79-100.
Hofer, H. (1998), ‘The Impact of Immigration on Host Country Wages andUnemployment’, in K. Pichelmann (ed.), The Economic Consequences of EasternEnlargement of the European Union: the Austrian View, Vienna: Institute of AdvancedStudies.
Hofer, H. and P. Huber (1999), ‘Eastward Enlargement, Trade and Migration: Impact onthe Austrian Labor Market’, background report to Boeri et al., ‘The Impact of EasternEnlargement on Employment and Labour Markets in the EU Member States’ (2001),Vienna: Institute of Advanced Studies.
Hospodárské Noviny (2001), ‘Práce v ciziné neláká jen výdélkem’, Prague, 30 April, 4.
House of Lords (2001), European Union Committee Thirteenth Report: ‘A CommunityImmigration Policy’, 25 April 2001.
Hsiao, C. (1986), Analysis of Panel Data, Cambridge, UK: Cambridge University Press.
Islam, N. (1995), ‘Growth Empirics: A Panel Data Approach’, Quarterly Journal ofEconomics 110, pp. 1127-70.
Jimeno. J.F., O. Cantó, A.R. Cardoso, M. Izquierdo and C.F. Rodrigues (2000),‘Integration and Inequality: Lessons from the Accessions of Portugal and Spain to theEU’, in background papers, Making Transition Work for Everyone, World Bank.
Keefer, P. and S. Knack, ‘Institutions and Economic Performance: Cross country testsusing alternative institutional measures’, Economic Politics 7:3, pp. 207-227, 1995.
Keuschnigg, C. and W. Kohler (1999), ‘Eastern Enlargement of the EU: How Much is itWorth for Austria?’, mimeo, University of Saarland.
Keuschnigg, C. and W. Kohler (2001), ‘The German Perspective on Eastern EUEnlargement’, The World Economy 24, pp. 513-42.
Kletzer, L. (2001), ‘Job Loss and Competition from Imports: How Much and How Costly?’,Washington, DC: Institute for International Economics.
Konitzka, D. and M. Kreyenfeld (2001), ‘Die Verwertbarkeit ausländischerAusbildungsabschlüsse. das Beispiel der Aussiedler auf dem deutschen Arbeitsmarklt’,Zeitschrift für Soziologie 30(4), pp. 267-82.
Kreyenfeld, M. (1999), ‘Labour Market Performance of Ethnic Germans in WesternGermany’, background report to Boeri, T., Brücker, H. et al., ibidem ‘The Impact ofMigration’, Rostock.
Layard, R., O. Blanchard, R. Dornbusch and P. Krugman (1992), East-West Migration: theAlternatives, Cambridge, MA: MIT Press.
Lejour, A. R. de Mooj and R. Nahuis (2001), ‘EU Enlargement: Economic Implications forCountries and Industries’, CPB Netherlands Bureau for Economic Policy Analysis,Document No. 011, The Hague, Netherlands.
Levine, R. and D. Renelt ‘A Sensitivity Analysis of Cross-Country Growth Regressions’
References 61
62 References
American Economic Review 82 (4) 942:963
Lundborg, P. (1998), ‘The Free Movement of Labour Between Sweden and the New EUMembers’, in Committee on the Economic Effects of EU Enlargement (ed.), A Biggerand Better Europe?, Stockholm, Government Official Reports, 1997:156
Maddison, A. (1995), Monitoring the World Economy 1820-1992, Paris: OECD.
Mankiw, G., D. Romer and D. Weil (1992), ‘A Contribution to the Empirics of EconomicGrowth’, Quarterly Journal of Economics, pp. 407-37.
Martin, P. and C. Rogers (1995). ‘Industrial location and public infrastructure.’ Journal ofInternational Economics 39, pp. 335-51
Mauro, P. and A. Spilimbergo (2001), ‘Physical Capital Adjustment within Spain: Long-runand Short-run Analysis’, IMF Working Paper 01/17, Washington DC IMF
McCormick, B, T. Boeri and G. Hanson (2002), Immigration Policy and the Welfare State,Oxford: Oxford University Press.
Modesto L., and P. Neves (1995), ‘HERMIN Portugal’ , Economic Modelling 12 (3).
Nickell, S. (1981), ‘Biases in Dynamic Models with Fixed Effects’, Econometrica 49, pp.1417-26.
Nicoletti, G., S. Scarpetta and O. Boylaud (1999), ‘Summary Indicators of ProductMarket Regulation with an Extension to Employment Protection Legislation’, OECDEconomics Department Working Paper No. 226, Paris: OECD.
OECD (1996), Employment Outlook 1996, Paris: OECD.
OECD (1997), Employment Outlook 1997, Chapter 2: ‘Earnings Mobility: Taking a LongerRun View’, Paris: OECD.
Orlowski, W. and L. Zienkowski (1999), ‘Potential Size of Migration from Poland afterJoining the EU’, WIFO Monthly Report 2/1999, Vienna: WIFO.
Pritchett, L. (1995), ‘Where Has All the Education Gone?’, mimeo, World Bank.
Puga, D. (2001), ‘European Regional Policies in the Light of Recent Location Theories’,CEPR Discussion Paper No. 2767. Centre for Economic Policy Research.
Riphahn, R.T. (1998), ‘Immigration Participation in the German Welfare Programme’,Finanzarchiv 55, pp. 163-85.
Rodrik, D. (2000), ‘Institutions for High-Quality Growth: What They Are and How toAcquire Them’, CEPR Discussion Paper No. 2370. Centre for Economic Policy Research.
Romer, D. (2000), Advanced Macroeconomics, New York: McGraw Hill.
Roy, A.D. (1951), ‘Some Thoughts on the Distribution of Earnings’, Oxford EconomicPapers 3, pp. 135-46.
Saint-Paul, G. (2000), The Political Economy of Labour Market Institutions, Oxford: OxfordUniversity Press.
Sala-i-Martin, X. (1996), ‘Regional Cohesion: Evidence and Theories of Regional Growthand Convergence’, European Economic Review 40, pp. 1325-52.
Schneider, F. and D.H. Enste (2000), ‘Shadow Economies: Size, Causes andConsequences’, Journal of Economic Literature 58 (1), pp. 77-114.
Sinn, H.-W., G. Flaig, M. Werding, S. Munz, N. Düll and H. Hofmann (2000), ‘EU-Erweiterung und Arbeitskräftemigration: Wege zu einer schrittweisen Annäherung derArbeitsmärkte’, ifo-Institut für Wirtschaftsforschung, Munich.
Sjaastad, L.A. (1962), ‘The Cost and Returns of Human Migration’, Journal of PoliticalEconomy pp. 80-93.
Smith, J.-P. and B. Edmonston (eds) (1997), The New Americans: Economic,Demographic, and Fiscal Effects of Immigration, Washington, DC: National AcademyPress.
Spilimbergo, A. (1999), ‘Labour Market Integration, Unemployment and Transfers’,Review of International Economics 7 (4), pp. 641-50.
Straubhaar, T. (1998), ‘Osterweiterung der Europäischen Union und Migration aus Ost-nach Westeuropa: Zu grosse Hoffnung hier, zu starke Ängste dort’, in W. Zohlnhöfer (ed.),Perspektiven der Osterweiterung und Reformbedarf der Europäischen Union, Schriftendes Vereins für Socialpolitik 255, Berlin.
Temple, J. (2000), ‘Growth Effects of Education and Social Capital in the OECD’,mimeo, Oxford University.
Trabold, H. and P. Trübswetter, 2001, ‘Beschäftigungs- und Lohneffekte der Migration’, inH. Brücker, H. Trabold, P. Trübswetter and C. Weise, ‘Migration: Potential und Effekte fürden deutschen Arbeitsmarkt’, research report, Deutsches Institut fürWirtschaftsforschung, Berlin.
US Immigration and Naturalization Service, Department of Justice (2000), 1998Statistical Yearbook of the Immigration and Naturalization Service, Washington, DC: USGovernment Printing Office.
Vargas, L. (2000), ‘Maquiladoras 2000: Still Growing’, El Paso Business Frontier 3, pp. 1-5.
References 63

64 References
Wallace, C. (1998), ‘Migration Potential in Central and Eastern Europe’, InternationalOrganization for Migration (IOM), Geneva.
Walterskirchen, E. and R. Dietz (1998), ‘Auswirkungen der EU-Osterweiterung auf denösterreichischen Arbeitsmarkt’, Studie des österreichischen Instituts fürWirtschaftsforschung, Vienna.
Winter-Ebmer, R. and K.F. Zimmermann (1999), ‘East-West Trade and Migration: theAustro-German Case’, in R. Faini, J. de Melo and K.F. Zimmermann (eds), Migration: theControversies and the Evidence, Cambridge, UK: Cambridge University Press, pp. 296-326.