Embed Size (px)
Citation preview
Who’s Turn to Eat?The Political Economy of Roads in Kenya
Robin Burgess (LSE), Remi Jedwab (PSE/LSE), EdwardMiguel (UC-Berkeley) and Ameet Morjaria (LSE)
Infrastructure and Economic Development ConferenceWorld Bank/TSE
11 January 2009
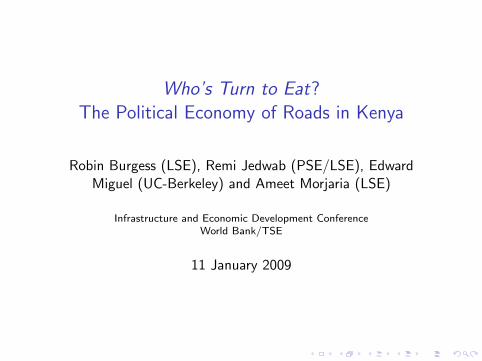
”Ministers’ Home Areas Get Lion’s Share of Roads Cash.”Daily Nation, 20 July 2006.
”Once Nairobi and the tourist hub represented by the Maasai Marawere excluded, [road] allocations to the home constituencies ofvocal government critics were nearly 320 times less generous thanthose to constituencies of trusted presidential aides.””It’s Our Turn to Eat.”, Michela Wrong, 2009.
Research Question
I Do African leaders disproportionately favor specific ethnicgroups in the provision of public investments?
I Why?

Motivation 1
African politics is widely claimed to be unrepresentative and unac-countable, whereby leaders disproportionately favor their own ethnic-ity when allocating public investments (Posner 2005, Bates 2008).
A large cross-country literature has emphasized the role of ethnicdiversity in ”Africa’s growth tragedy” (Easterly and Levine 1997,Montalvo and Reynal-Querol 2005).
Yet, even in not fully democratic regimes, leaders must build multi-ethnic coalitions to retain power. They reward co-ethnics and nonco-ethnics by investing in public infrastructure.
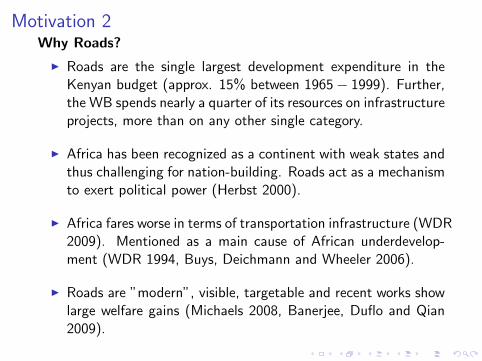
Motivation 2Why Roads?
I Roads are the single largest development expenditure in theKenyan budget (approx. 15% between 1965− 1999). Further,the WB spends nearly a quarter of its resources on infrastructureprojects, more than on any other single category.
I Africa has been recognized as a continent with weak states andthus challenging for nation-building. Roads act as a mechanismto exert political power (Herbst 2000).
I Africa fares worse in terms of transportation infrastructure (WDR2009). Mentioned as a main cause of African underdevelop-ment (WDR 1994, Buys, Deichmann and Wheeler 2006).
I Roads are ”modern”, visible, targetable and recent works showlarge welfare gains (Michaels 2008, Banerjee, Duflo and Qian2009).
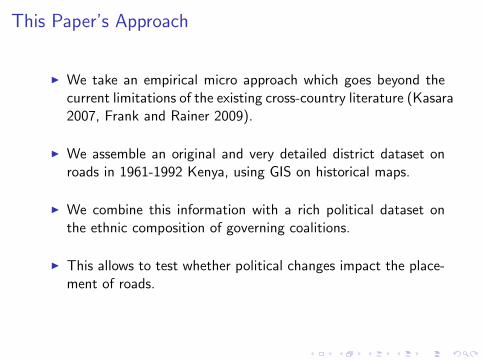
This Paper’s Approach
I We take an empirical micro approach which goes beyond thecurrent limitations of the existing cross-country literature (Kasara2007, Frank and Rainer 2009).
I We assemble an original and very detailed district dataset onroads in 1961-1992 Kenya, using GIS on historical maps.
I We combine this information with a rich political dataset onthe ethnic composition of governing coalitions.
I This allows to test whether political changes impact the place-ment of roads.
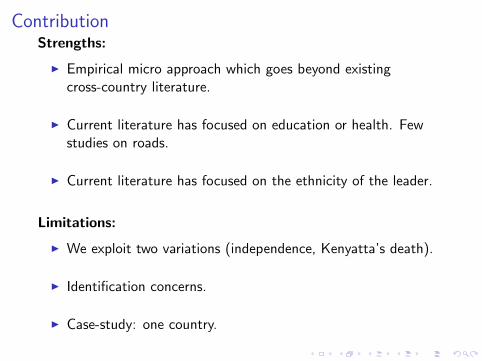
ContributionStrengths:
I Empirical micro approach which goes beyond existingcross-country literature.
I Current literature has focused on education or health. Fewstudies on roads.
I Current literature has focused on the ethnicity of the leader.
Limitations:
I We exploit two variations (independence, Kenyatta’s death).
I Identification concerns.
I Case-study: one country.

Context
Kenya became independent in 1963. Single-party democracy from1966 to 1992.
The President is chosen by the Central Committee of the rulingparty (KANU). The executive seat is never contested during thisperiod.
Political competition takes place within the party and along ethniclines. Three groups monopolize the political game: the Kikuyus,the Kalenjins and the Luos.
The Ministry of Public Works is both the decision-maker andoperator of road construction.
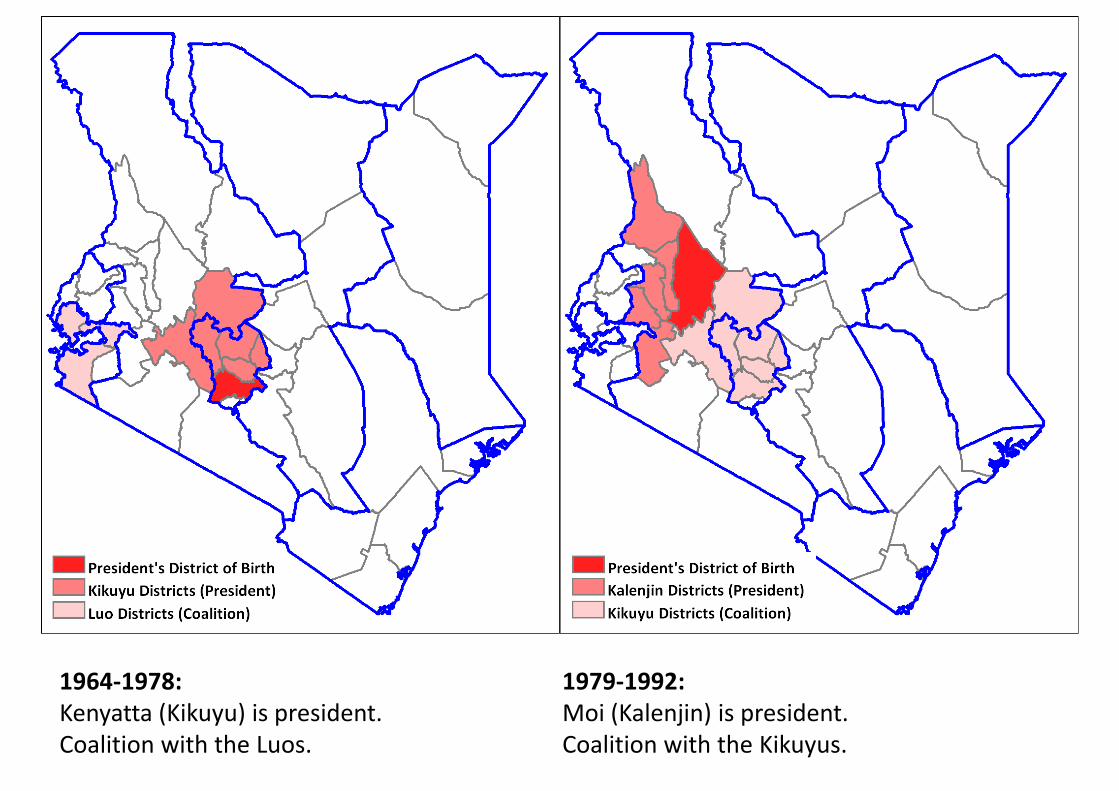
1964-1978:
Kenyatta (Kikuyu) is president.
Coalition with the Luos.
1979-1992:
Moi (Kalenjin) is president.
Coalition with the Kikuyus.


Preview of Findings
Key Message: Targeting of roads is both narrower and broaderthan suggested by the often popularised ethnic patronage story.
1. Co-ethnic districts receive twice more paved roads than nonco-ethnic districts (10.6%).
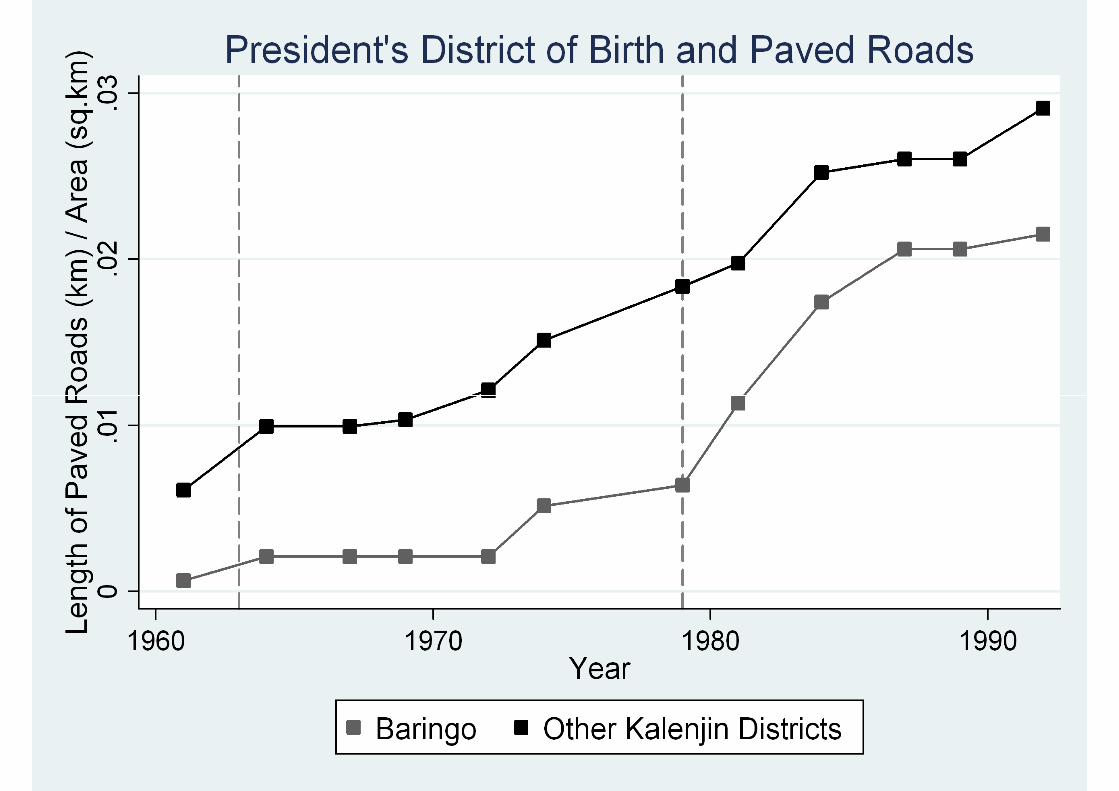
2. The President’s home area gets five times more paved roadsthan the other co-ethnic districts (10.4%).
3. The district of the non co-ethnic coalition members obtain asmuch paved roads as the co-ethnic districts (10.5%).
Around one-third of the construction of paved roads can beexplained by political economy factors.

Conceptual Framework
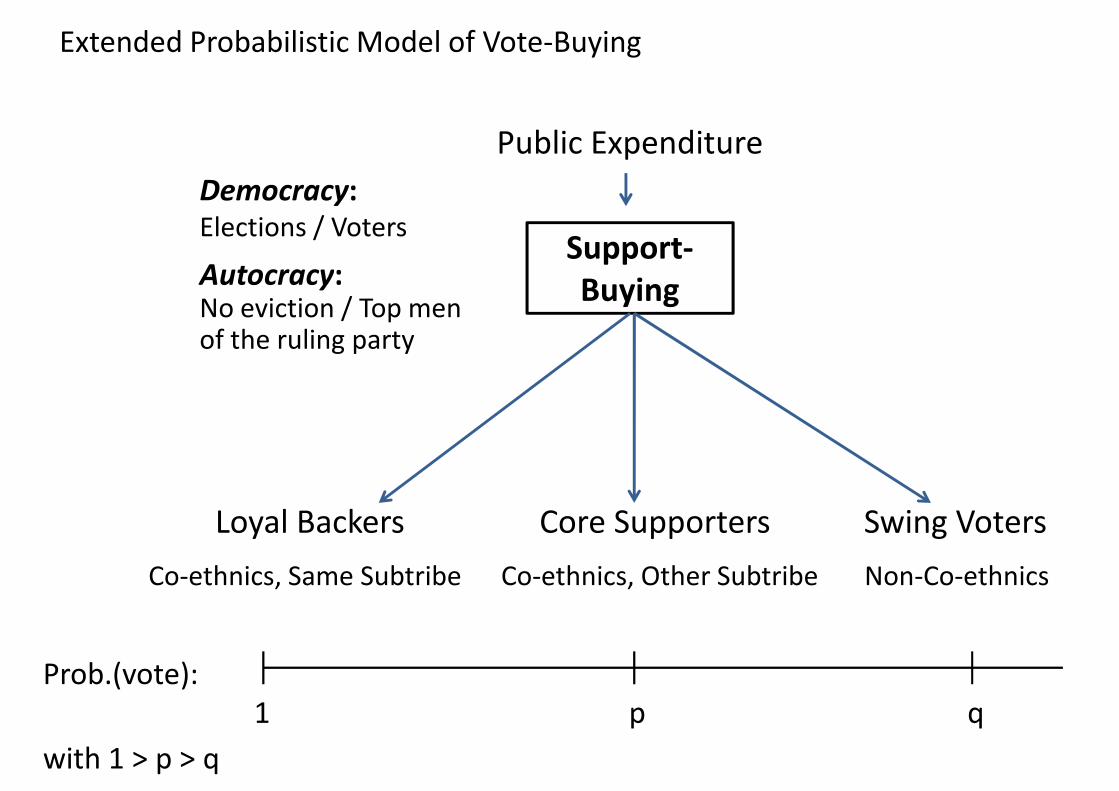
Autocrats face the threat of being evicted by coalitions within theruling party. By distributing cabinet positions to the top men of theother ethnic groups and bringing public goods to their areas, theyare able to build stable multi-ethnic coalitions and remain in power.
I ”Loyal Backer” models: target co-ethnics, same sub-tribe.
I ”Core-supporter” models (Cox and McCubbins 1986, Dixitand Londregan 1996): target co-ethnics, other subtribe.
I ”Swing-voter” models (Lindbeck and Weibull 1987, Dixit andLondregan 1996, Groseclose and Snyder 1996): target pivotalvoters, i.e. non co-ethnics.
Support-
Public Expenditure
Democracy:
Elections / Voters
Autocracy:
Extended Probabilistic Model of Vote-Buying
Support-
Buying
Loyal Backers Core Supporters Swing Voters
Autocracy: No eviction / Top men of the ruling party
Loyal Backers Core Supporters Swing Voters
Co-ethnics, Same Subtribe Co-ethnics, Other Subtribe Non-Co-ethnics
Prob.(vote):
1 p q
with 1 > p > q
Empirical Evidence
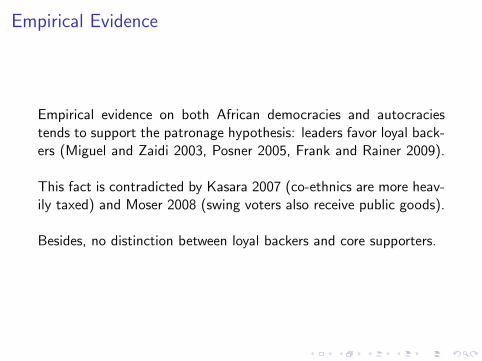
Empirical evidence on both African democracies and autocraciestends to support the patronage hypothesis: leaders favor loyal back-ers (Miguel and Zaidi 2003, Posner 2005, Frank and Rainer 2009).
This fact is contradicted by Kasara 2007 (co-ethnics are more heav-ily taxed) and Moser 2008 (swing voters also receive public goods).
Besides, no distinction between loyal backers and core supporters.

Political Data
Variables: District of birth and ethnicity of all the appointed cabinetmembers between 1961 and 1992: the President, Vice-President andMinisters.
Primary Sources: Government Publication: Organization of TheGovernment of the Republic of Kenya, released after every cabinetshuffle and lists all the civil servants. We obtain the ethnicity anddistrict of birth of the leaders:
1. Direct assistance from journalists from the top Kenyan dailies.
2. Work of political scientists (e.g. Hornsby 1995 and Ahluwalia1996).
3. Weekly Review Magazine - highly active political magazine.
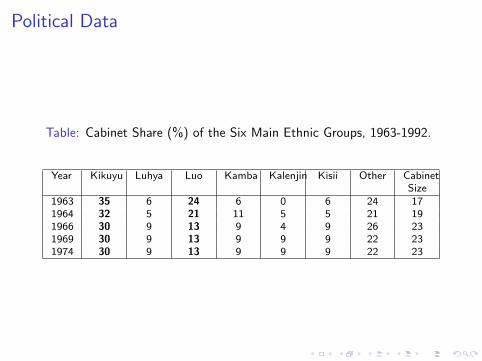
Political Data
Table: Cabinet Share (%) of the Six Main Ethnic Groups, 1963-1992.
Year Kikuyu Luhya Luo Kamba Kalenjin Kisii Other CabinetSize
1963 35 6 24 6 0 6 24 171964 32 5 21 11 5 5 21 191966 30 9 13 9 4 9 26 231969 30 9 13 9 9 9 22 231974 30 9 13 9 9 9 22 23
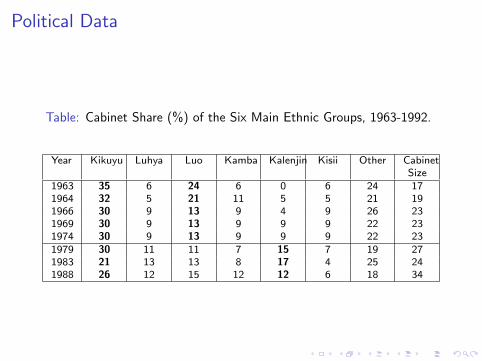
Political Data
Table: Cabinet Share (%) of the Six Main Ethnic Groups, 1963-1992.
Year Kikuyu Luhya Luo Kamba Kalenjin Kisii Other CabinetSize
1963 35 6 24 6 0 6 24 171964 32 5 21 11 5 5 21 191966 30 9 13 9 4 9 26 231969 30 9 13 9 9 9 22 231974 30 9 13 9 9 9 22 231979 30 11 11 7 15 7 19 271983 21 13 13 8 17 4 25 241988 26 12 15 12 12 6 18 34

Road Data
Variables: Rqdt is the total length of roads of quality q in districtd at year t. Where:q = paved roads, improved roads, trackst = 1961, 1964, 1967, 1969, 1972, 1974, 1979, 1981, 1984, 1987,1989, 1992
Primary Sources: Time series of Michelin Road Map Series:Africa South and Central. These maps have a consistent legendwhich allows to classify roads into three different qualities.
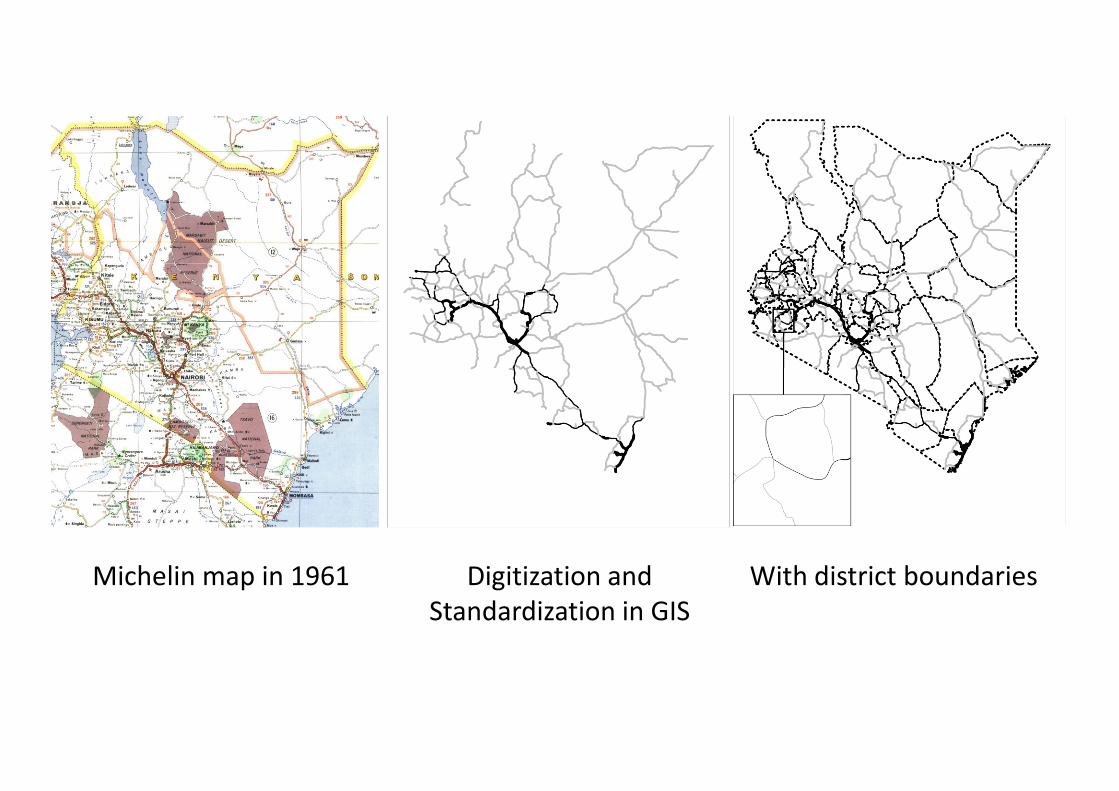
Michelin map in 1961 Digitization and
Standardization in GIS
With district boundaries
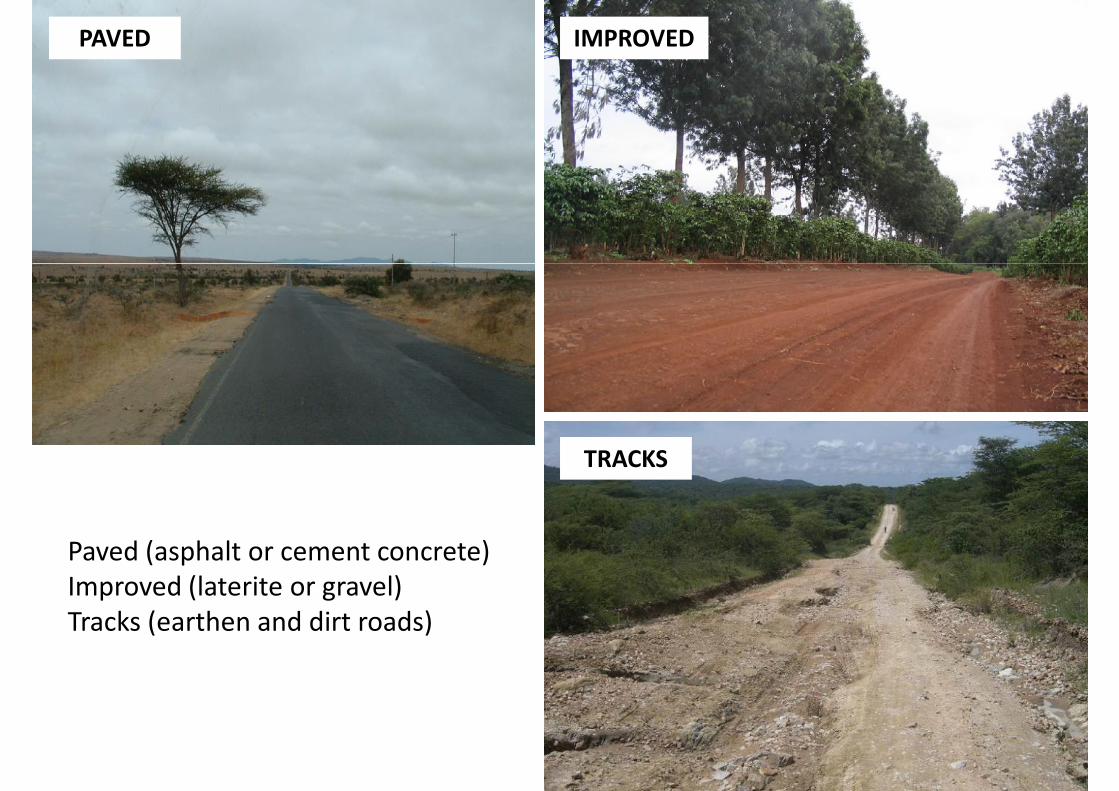
PAVED IMPROVED
TRACKS
Paved (asphalt or cement concrete)
Improved (laterite or gravel)
Tracks (earthen and dirt roads)
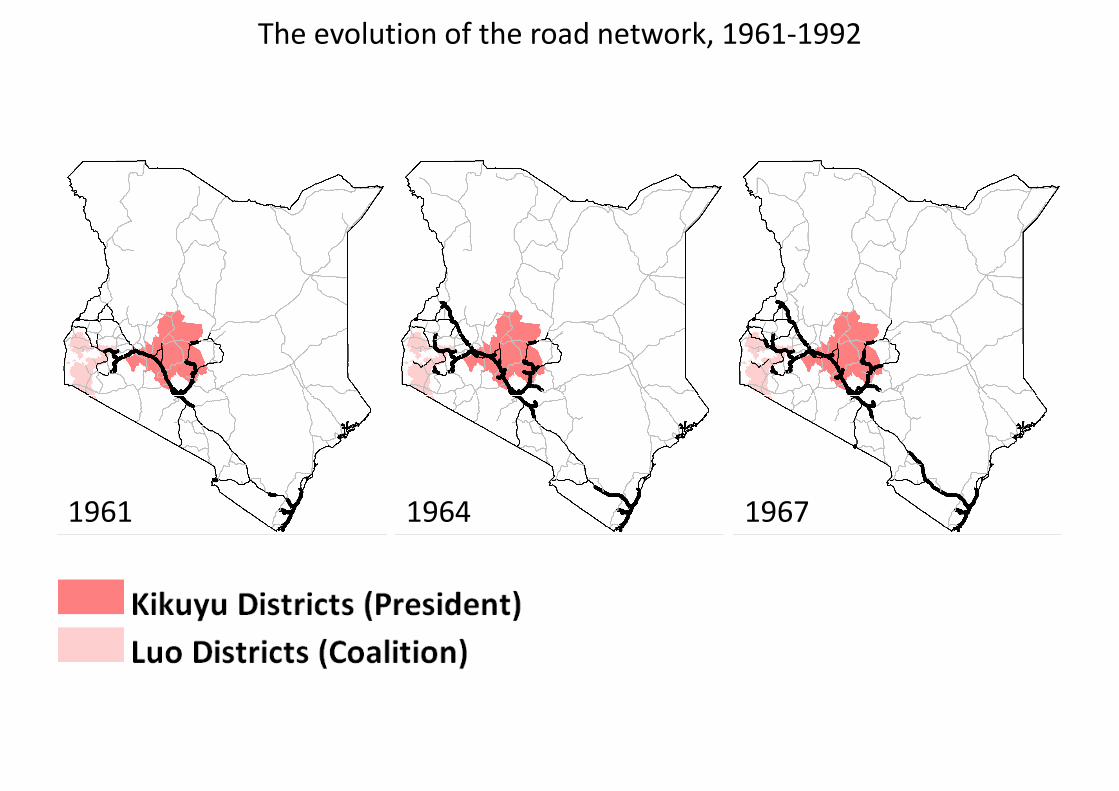
The evolution of the road network, 1961-1992
1961 1964 19671961 1964 1967

The evolution of the road network, 1961-1992
1969 1972 19741969 1972 1974
The evolution of the road network, 1961-1992
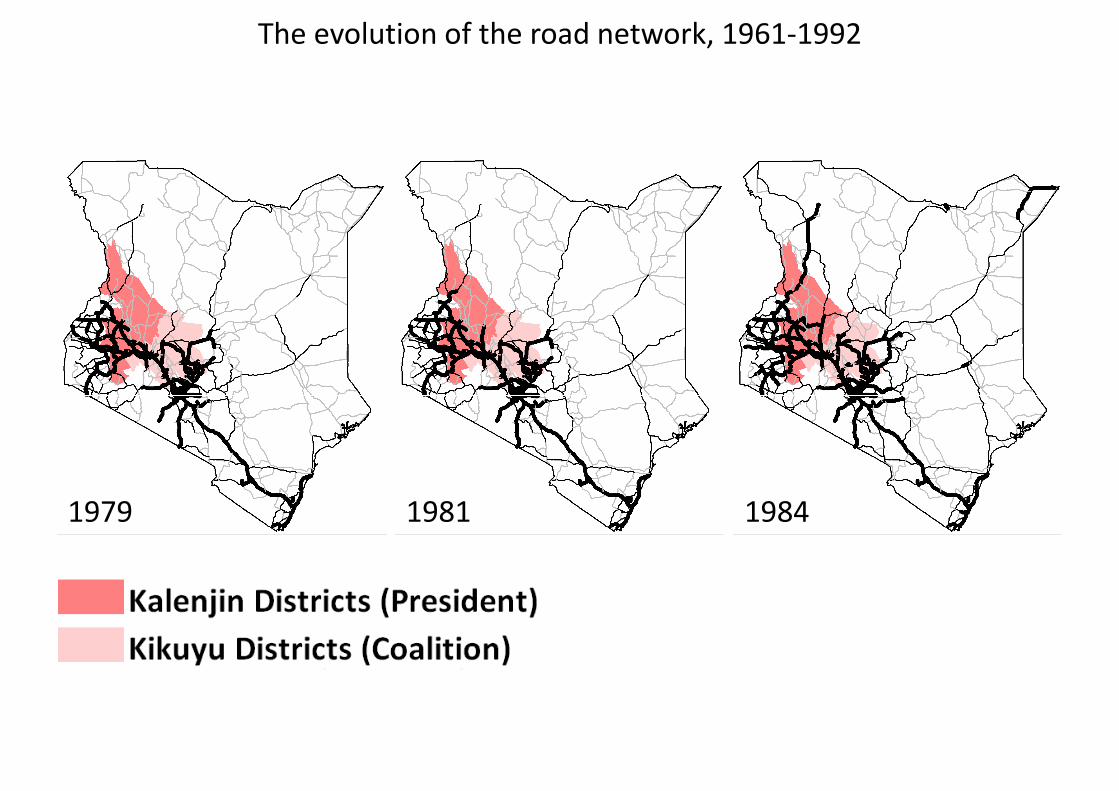
1979 1981 19841979 1981 1984
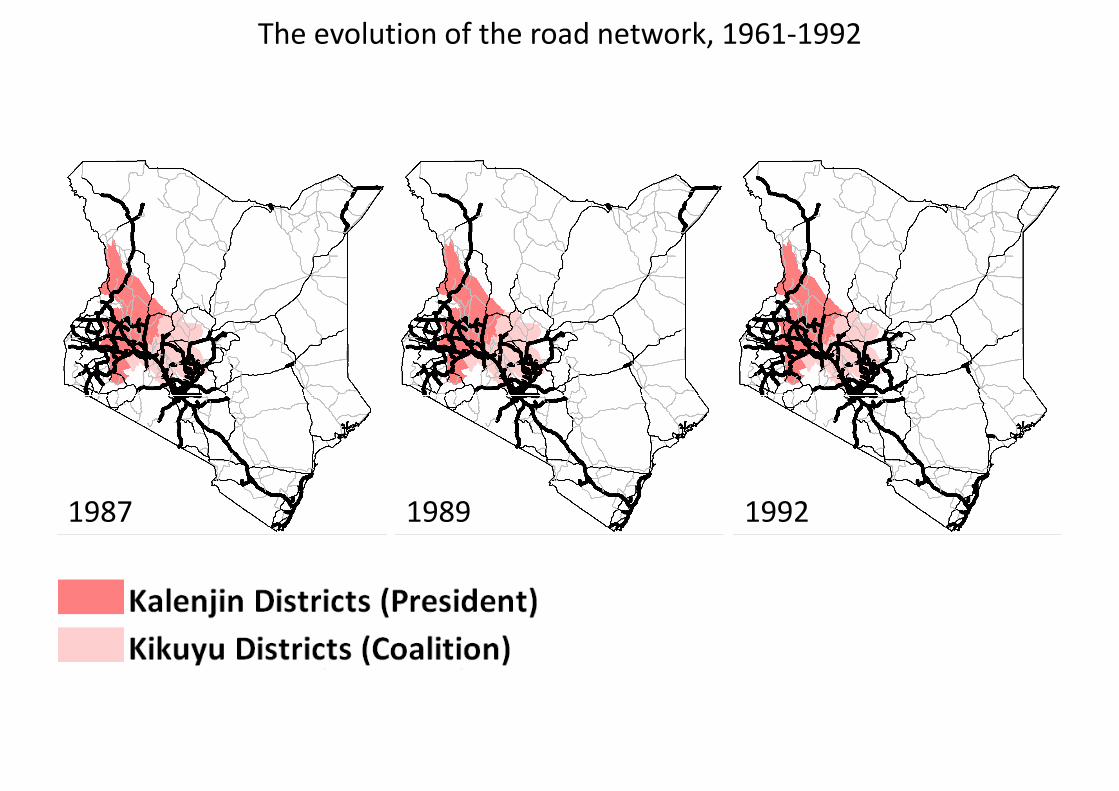
The evolution of the road network, 1961-1992
1987 1989 19921987 1989 1992

Econometric Specification
For district d and year t, we run:
Rqdt = αd + βt + ξRqdt−1 + δPdt−1 + φtXd + εdt (1)
Rqdt is the length in km of road type q in district d at time t. Pdt−1
are our political economy variables of interest at time t-1:
1. Share of the President’s co-ethnic group in district d.
2. Share of the coalition member’s ethnic group in district d.
3. A dummy variable valuing 1 if district d is the district of birthof the President.
4. A dummy variable valuing 1 if district d is the district of birthof the Public Works Minister.
αd and βt are district and year fixed effects, and Xd is a vector ofbaseline demographic, economic and geographic variables whoseeffect φt we allow to vary with time.

Econometric Concerns 1
Key Assumption: Changes in political leadership are exogenous.
The timing of independence (1963) is exogenous, as the BritishEmpire was granting independence to its African colonies aroundthat time.
The death of Kenyatta in 1978 was due to natural causes (similarexercise to Jones and Olken 2005).
1. We exploit the one change in president leadership.
2. Further, the vice-president Moi (Kalenjin) was not expectedto succeed Kenyatta (Kikuyu) due to strong opposition fromthe Kikuyu elite.
Econometric Concerns 2
Concerns: Omitted variables: (a) political and economic powers gohand-in-hand, both driving road building, or (b) road building un-related to political economy factors (e.g., Mombasa-Kampala road).
Kalenjins are a pastoralist community and were not economicallysuccessful during the pre-1978 period.
Control for economic geography, demography and economic activitycharacteristics by including interactions of baseline district variableswith a time trend or time dummies.

Three Sets of Controls
1. Economic Geography: dummies for Mombasa-Kampala in-ternational road, border of Uganda and border of Tanzania, allinteracted with a time trend.
2. Demography: 1962 population, having a city in 1962 and 1962urbanization rate, all interacted with time dummies.
3. Economic activity: 1961 per capita earnings, 1961 employ-ment rate in the formal sector and 1961 primary educationcompletion rate, all interacted with time dummies.
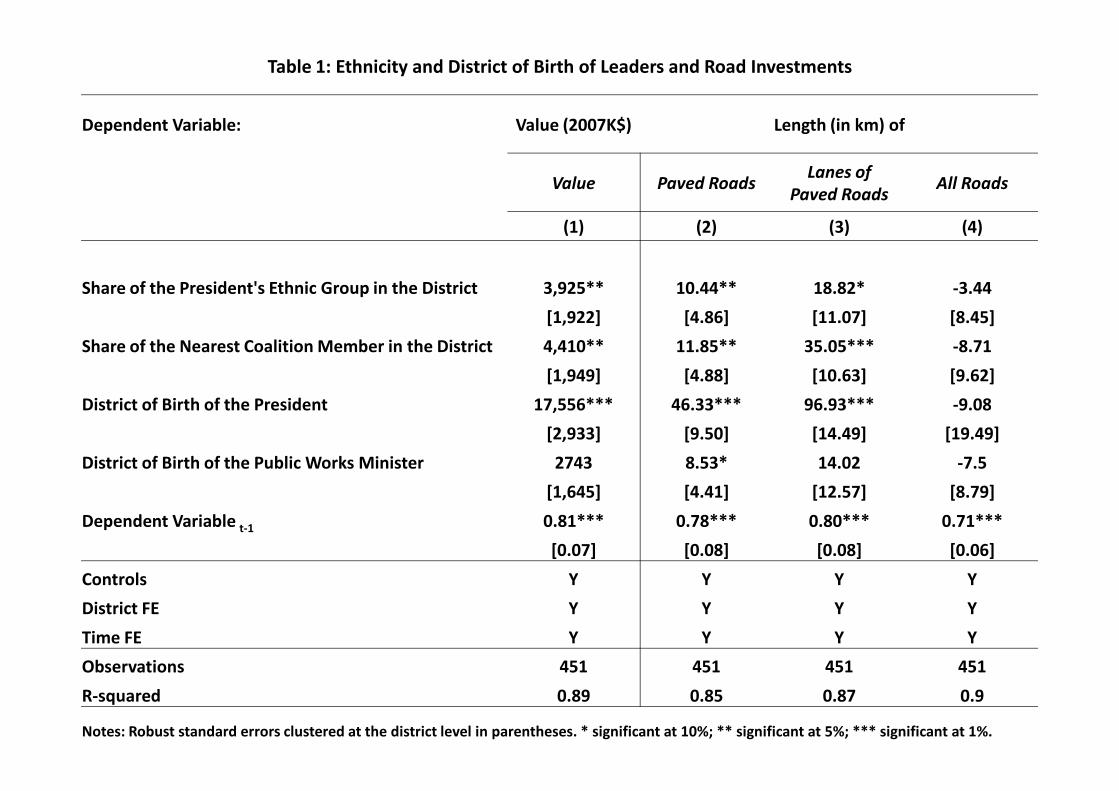
Table 1: Ethnicity and District of Birth of Leaders and Road Investments
Dependent Variable: Value (2007K$) Length (in km) of
Value Paved RoadsLanes of
Paved RoadsAll Roads
(1) (2) (3) (4)
Share of the President's Ethnic Group in the District 3,925** 10.44** 18.82* -3.44
[1,922] [4.86] [11.07] [8.45]
Share of the Nearest Coalition Member in the District 4,410** 11.85** 35.05*** -8.71
[1,949] [4.88] [10.63] [9.62]
District of Birth of the President 17,556*** 46.33*** 96.93*** -9.08District of Birth of the President 17,556*** 46.33*** 96.93*** -9.08
[2,933] [9.50] [14.49] [19.49]
District of Birth of the Public Works Minister 2743 8.53* 14.02 -7.5
[1,645] [4.41] [12.57] [8.79]
Dependent Variable t-1 0.81*** 0.78*** 0.80*** 0.71***
[0.07] [0.08] [0.08] [0.06]
Controls Y Y Y Y
District FE Y Y Y Y
Time FE Y Y Y Y
Observations 451 451 451 451
R-squared 0.89 0.85 0.87 0.9
Notes: Robust standard errors clustered at the district level in parentheses. * significant at 10%; ** significant at 5%; *** significant at 1%.
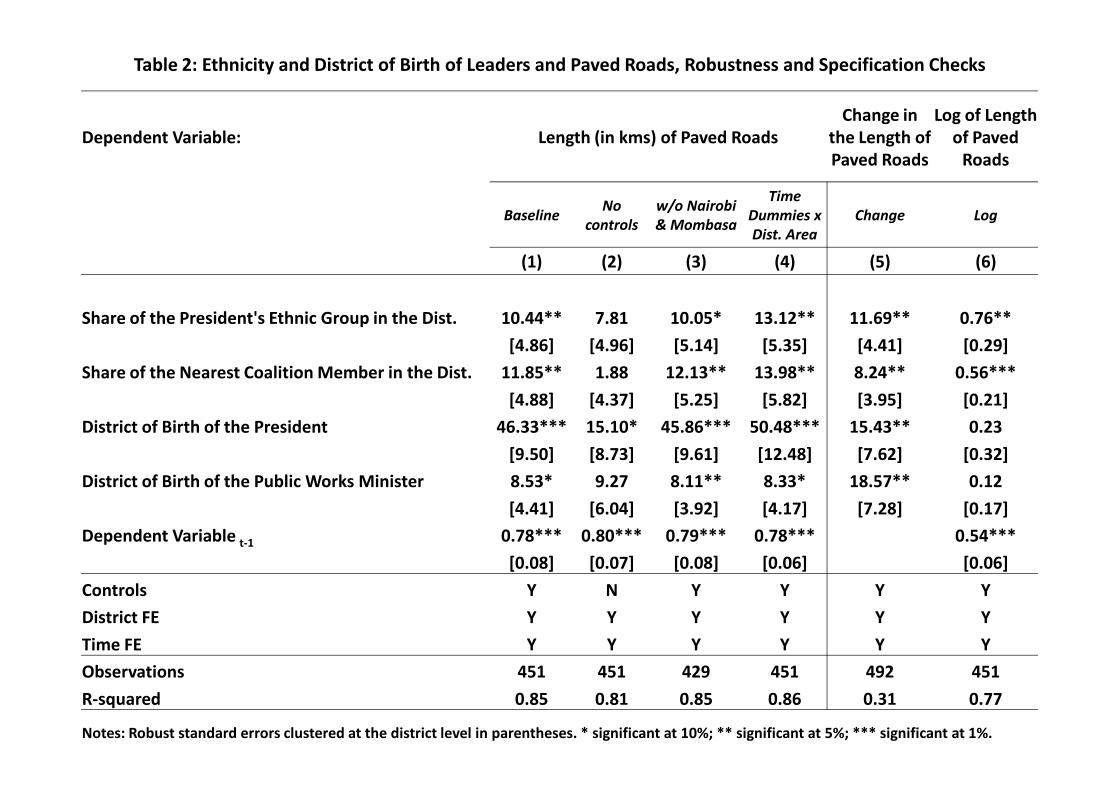
Table 2: Ethnicity and District of Birth of Leaders and Paved Roads, Robustness and Specification Checks
Dependent Variable: Length (in kms) of Paved Roads
Change in
the Length of
Paved Roads
Log of Length
of Paved
Roads
BaselineNo
controls
w/o Nairobi
& Mombasa
Time
Dummies x
Dist. Area
Change Log
(1) (2) (3) (4) (5) (6)
Share of the President's Ethnic Group in the Dist. 10.44** 7.81 10.05* 13.12** 11.69** 0.76**
[4.86] [4.96] [5.14] [5.35] [4.41] [0.29]
Share of the Nearest Coalition Member in the Dist. 11.85** 1.88 12.13** 13.98** 8.24** 0.56***
[4.88] [4.37] [5.25] [5.82] [3.95] [0.21][4.88] [4.37] [5.25] [5.82] [3.95] [0.21]
District of Birth of the President 46.33*** 15.10* 45.86*** 50.48*** 15.43** 0.23
[9.50] [8.73] [9.61] [12.48] [7.62] [0.32]
District of Birth of the Public Works Minister 8.53* 9.27 8.11** 8.33* 18.57** 0.12
[4.41] [6.04] [3.92] [4.17] [7.28] [0.17]
Dependent Variable t-1 0.78*** 0.80*** 0.79*** 0.78*** 0.54***
[0.08] [0.07] [0.08] [0.06] [0.06]
Controls Y N Y Y Y Y
District FE Y Y Y Y Y Y
Time FE Y Y Y Y Y Y
Observations 451 451 429 451 492 451
R-squared 0.85 0.81 0.85 0.86 0.31 0.77
Notes: Robust standard errors clustered at the district level in parentheses. * significant at 10%; ** significant at 5%; *** significant at 1%.

Table 3: Ethnicity and District of Birth of Leaders and Road Network Value, Robustness and Specification Checks
Dependent Variable: Road Network Value (2007K$)
Change in
Road Network
Value
Log of Road
Network
Value
Baseline No controlsw/o Nairobi
& Mombasa
Time
Dummies x
Dist. Area
Change Log
(1) (2) (3) (4) (5) (6)
Share of the President's Ethnic Group in the Dist. 3,925** 2926 3,771* 4,860** 4,996*** 0.29***
[1,922] [1,784] [2,004] [2,036] [1,825] [0.10]
Share of the Nearest Coalition Member in the Dist. 4,410** 962 4,538** 5,265** 3,922** 0.20**
[1,949] [1,476] [2,062] [2,182] [1,636] [0.08][1,949] [1,476] [2,062] [2,182] [1,636] [0.08]
District of Birth of the President 17,556*** 6,982** 17,459*** 19,710*** 9,242*** 0.21
[2,933] [3,078] [2,917] [4,177] [2,690] [0.12]
District of Birth of the Public Works Minister 2743 2,858.00 2531 2423 4660 -0.01
[1,647] [2,314] [1,525] [1,620] [2,772] [0.06]
Dependent Variable t-1 0.81*** 0.81*** 0.81*** 0.81*** 0.55***
[0.07] [0.07] [0.07] [0.08] [0.05]
Controls Y N Y Y Y Y
District FE Y Y Y Y Y Y
Time FE Y Y Y Y Y Y
Observations 451 451 429 451 451 451
R-squared 0.89 0.87 0.89 0.9 0.36 0.7
Notes: Robust standard errors clustered at the district level in parentheses. * significant at 10%; ** significant at 5%; *** significant at 1%.

Conclusion
1. In line with the political patronage literature, we find thatpresidents favor co-ethnics (10.6%).
2. We also find evidence for:- The president further favors his home area (10.5%).- The president rewards non co-ethnic allies (10.4%).- The Ministry of Public Works is a key position (1.9%).
One third of the construction of paved roads can beexplained by political economy factors.African politics is more complex than the sole politicalpatronage story.
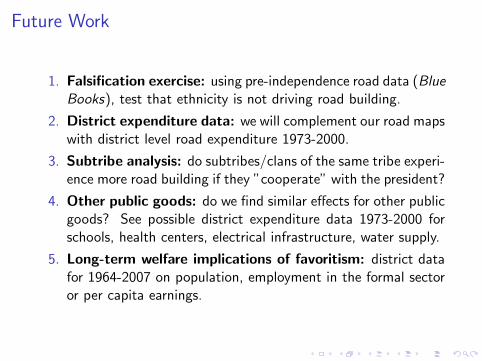
Future Work
1. Falsification exercise: using pre-independence road data (BlueBooks), test that ethnicity is not driving road building.
2. District expenditure data: we will complement our road mapswith district level road expenditure 1973-2000.
3. Subtribe analysis: do subtribes/clans of the same tribe experi-ence more road building if they ”cooperate” with the president?
4. Other public goods: do we find similar effects for other publicgoods? See possible district expenditure data 1973-2000 forschools, health centers, electrical infrastructure, water supply.
5. Long-term welfare implications of favoritism: district datafor 1964-2007 on population, employment in the formal sectoror per capita earnings.