Embed Size (px)
Citation preview

Why Airplanes Crash: Causes of Accidents Worldwide By
Clinton V. Oster, Jr. (corresponding author) [email protected]
School of Public and Environmental Affairs Indiana University (812) 855‐0563
John S. Strong
Mason School of Business College of William & Mary
C. Kurt Zorn
School of Public and Environmental Affairs Indiana University
Abstract
In this paper, we report the results of a detailed examination of the causes of 700 fatal aviation accidents that occurred worldwide between 1990 and 2006 in commercial passenger service. We look at both scheduled and nonscheduled and both domestic and international service. We also categorize the accident aircraft as large jets, regional and medium jets, small jets, turboprops, and piston powered aircraft. We find that the mix of causes of those accidents vary substantially across regions of the world, across different kinds of service, and across different categories of aircraft.
1

Introduction
The safety of commercial passenger aviation service remains a worldwide concern. Between 1990 and 2006, an average of over 1,000 passengers and 130 crew members died in commercial passenger service accidents every year. In terms of fatalities, that’s the equivalent of five crashes every year of the same magnitude of loss as the Air France flight that crashed in the Atlantic while en route from Rio de Janeiro to Paris on June 1, 2009.
An inevitable question is whether commercial passenger aviation service is getting safer or less safe over time. One approach to answering this question is to calculate rates of safety events, such as passenger fatalities per 1,000,000 enplanements or fatal accidents per 100,000 departures. A comparison of these rates can help identify segments of the aviation industry where safety performance is problematic relative to the rest of the industry. In addition, they can provide insight into how overall safety has changed over time. However, such rates provide little understanding about why safety may differ among segments of the industry and offer little guidance about what steps might be taken to improve safety.
The approach we employ in this paper overcomes these limitations by providing a classification of international passenger aviation service accidents according to their cause. The distribution of these causes is then analyzed over time (1990 – 2006) and also across industry segments to provide additional insight into why these accidents may be occurring.
Determining the Cause of the Accident
The most difficult problem in conducting such an analysis is determining how to assign a single cause for an accident when most have several contributing factors. There are three principal approaches to assigning cause; each has its drawbacks. Consider an example where an aircraft engine fails during takeoff and the cockpit crew fails to take the proper actions needed to land the plane safely. Clearly, both the failure of the engine and the failure of the cockpit crew to respond properly contributed to the accident. There would have been no accident if there had been no engine failure or if the cockpit crew had responded properly to the engine problem.
The approach used in this analysis is to select the cause that initiated the sequence of events that culminated in the accident – in the case of this example, the cause assigned to the accident would be engine failure. An alternative approach would be to select as the accident’s cause the last point at which the event could have been prevented. In the example above, the failure of the cockpit crew to take the proper steps would be the culprit, resulting in the assigned cause for the accident being pilot error. A third approach would be to select all factors contributing to the accident as causes meaning, in the preceding example both engine failure and pilot error would be listed as the cause of the accident. How do these approaches differ? One clear difference is that pilot error would be indicated much more frequently if either of the last two approaches were used, whereas equipment failure and other causes would show up more frequently when the first approach is employed. Admittedly, there are many accidents initiated by some sort of mechanical failure or other problem that could have been prevented by a proper response by the flight crew. However, the authors believe this places an unreasonable expectation on pilots to be infallible in what often are very trying circumstances.
2

By focusing on the sequence initiating cause1 as is done in this analysis, attention is centered on what began the unfortunate chain of events that led to the accident. The assumption behind this approach is that, in the absence of this initiating cause, the accident would have been avoided. Another benefit of focusing attention on the sequence initiating cause is it avoids the data analysis problems associated with assigning multiple causes. Counting all contributing causes for an accident makes interpretation of the distribution of causes difficult because some accidents have more contributing causes than others and would thus contribute more causes to the distribution. Finally, focusing on the sequence‐initiating cause means that when pilot error is assigned as the cause, it can be thought of as “unforced” pilot error rather than a failure to respond properly to an emergency when there may be a confluence of events that are difficult to respond to regardless of how talented the pilot is or how good their training was.
For each of the 700 accidents analyzed over the 1990 to 2006 time span a sequence initiating cause was determined according to the rules described in Appendix 1. As can be seen in the appendix, there are 44 different possible causes grouped into the following eight categories: Equipment Failure, Seatbelt/Turbulence, Environment, Pilot Error, Air Traffic Control, Ground/Cabin Crew, Collisions with other aircraft, and Other. The “Other” category includes accidents where the cause could not be determined either because the aircraft was never recovered or because there was insufficient information about the accident to determine a cause.
The Source of the Accident Data
The source of accident data is the World Aircraft Accident Summary (WAAS) published by Ascend, which is a division of Airclaims. WAAS compiles a broad array of both fixed wing and helicopter accidents and places accidents in a variety of categories. The analysis in this paper is restricted to accidents involving passenger fatalities in fixed wing aircraft operating in the following categories: Domestic Nonscheduled Passenger, Domestic Scheduled Passenger, International Nonscheduled Passenger, International Scheduled Passenger, Domestic Nonscheduled Cargo, Domestic Scheduled Cargo, International Nonscheduled Cargo, and International Scheduled Cargo. At first glance, the inclusion of cargo accidents may seem curious, particularly to those most familiar with the US major carriers where there is usually a clear distinction between passenger and cargo operations. Elsewhere in the world, however, the distinction is less clear and often flights classified as cargo flights also carry significant numbers of passengers. Thus, they are an important component of commercial passenger air service.
While WAAS is the most comprehensive source of worldwide aviation accident data, there are still some limitations associated with the data. As WAAS states in their introductory material, “The accident details presented here have been drawn from very many sources both official and unofficial (including press reports). They may, therefore, be incomplete or otherwise incorrect. Similarly the need to condense accident descriptions can result in unintentional shifts in emphasis.”2 Thus it is possible that what appears to have been the sequence of events in the account of the accident in WAAS may differ from what appears to have been the sequence of events in other accounts of the same accident.
No source of worldwide accident data can be guaranteed to include all accidents, particularly accidents in remote areas by smaller nonscheduled carriers. In comparing alternative sources of data,
1 This is the same basic approach taken by the authors in their 1992 book, Why Airplanes Crash, (Oxford University Press), although the implementation details of this approach have been refined over the intervening years. 2 Explanatory Notes, World Aircraft Accident Summary, CAP479, Ascend 2007, page i.
3

the authors found WAAS to be the most comprehensive set of accident reports. But WAAS does not try to include all accidents. Specifically, WAAS strives to include all jet and turboprop fixed wing accidents; all piston engine accidents of aircraft with more than 10 seats; and all fixed wing accidents with five or more fatalities. Thus, accidents with fewer than five fatalities in smaller piston engine aircraft are not necessarily included. However, the WAAS data does contain many accidents with fewer than five fatalities in smaller piston engine aircraft, such an Antonov AN2s, Cessna 400s and Piper PA 31s. While this segment of the aviation industry may not be fully represented in the data, it is also not completely excluded, meaning it most likely is underrepresented to some unknown degree.3
Accidents by Aircraft Type, Over Time, by Type of Service, and by Region
A total of 700 accidents were examined for this analysis. Each of these accidents involved at least one passenger fatality. In total there were 17,486 passenger fatalities and 2,284 crew fatalities that occurred due to these accidents. In addition to the large number of fatalities that occurred on the ground as a result of the terrorist hijackings in the United States on September 11, 2001, 274 people lost their lives on the ground due to accidents covered by this analysis.
Each of the 700 accidents was categorized according to the type of aircraft involved using the following categories:
1. Large jets – Those jet aircraft that in typical passenger configuration have more than 100 seats.
2. Regional Jets (RJ)/Medium Jets – Those jet aircraft designed for commercial passenger service that in typical passenger configuration have 100 or fewer seats.
3. Small Jets – Those small jet aircraft designed primarily for corporate or private use. 4. Turboprops – All turboprop powered aircraft 5. Piston – All piston engine aircraft
Table 1 shows the breakdown of accidents and passenger fatalities by aircraft type. Not surprisingly, the larger aircraft account for a proportionately higher share of passenger fatalities than fatal accidents. Large jets, for example, account for less than a quarter of accidents but two‐thirds of passenger fatalities. Piston engine aircraft, in contrast, account for about the same proportion of accidents as large jets but only about 5 percent of fatalities. Nevertheless because of the large number of piston engine accidents these flights result in a significant proportion of overall passenger deaths. Indeed, over nine times as many passengers were killed in piston engine accidents as in RJ/Medium jet accidents.
The right hand column of the table shows the average fraction of passengers on board who were killed in these accidents. In general, a higher proportion of passengers were killed in accidents involving smaller aircraft than in ones involving larger aircraft. The figure for large jets is a little misleading in comparison to the other figures for other aircraft types. For large jets, there were a few accidents that resulted in passenger fatalities due to turbulence where passengers failed to have their seatbelts fastened or were struck by flying objects in the cabin. Such accidents generally involve a small proportion of the passengers on the aircraft and were only present in the large jet segment of the fatal accidents by aircraft type data set.
3 While not used in this analysis, WAAS also includes reports of helicopter accidents for turbine powered helicopters and for helicopter accidents with five or more fatalities.
4

Table 1: Accidents and Fatalities by Aircraft Type
Aircraft Type Passenger Fatalities Fatal Accidents Fraction
Passengers of Killed Number Share Number Share
Small Jet 118 1% 27 4% 94% Piston 929 5% 162 23% 80% RJ/Medium Jet 1014 6% 33 5% 70% Turboprop 3740 21% 318 45% 76% Large Jet 11685 67% 160 23% 68%
Figure 1 shows the number of fatal accidents by year also broken down by aircraft type. While there is year‐to‐year variability in the number of accidents, there is also a clear downward trend in the number of accidents since the mid‐1990s. Moreover, the trend is not the result of declines in a single aircraft type, but seems to be generally across the board. Figure 2 shows the number of passenger fatalities by year by aircraft type. Here the year‐to‐year variability is more pronounced, largely because a single large jet accident can result in a large number of passenger fatalities. Even with this added variability, the downward trend since the mid‐1990s can still be seen.
Figure 1: Number of Fatal Accident by Year by Aircraft Type
5

Figure 2: Passenger Fatalities by Year by aircraft type
Accidents were also categorized into the type of service being conducted when the accident occurred. This breakdown is presented in Table 2. In this table, cargo and passenger accidents in each category were combined. Not surprisingly, the vast majority of the accidents occurred in domestic service due to more frequent operations and therefore greater exposure. The largest number of passenger fatalities occurred in the scheduled service categories, both domestic and international, where larger aircraft are more commonly used. The relatively low figure for the fraction of passengers killed in international scheduled service is driven in part by the seatbelt and turbulence accidents mentioned above, which occur mostly in international scheduled service.
Table 2: Accidents and Fatalities by Type of Service
Type of Service Passenger Fatalities Fatal Accidents Fraction of
Passengers Killed Number Share Number Share Unknown 199 1% 9 1% 96% Domestic Nonscheduled 2474 14% 291 42% 73% Domestic Scheduled 7873 45% 265 38% 71% International Nonscheduled 1922 11% 72 10% 77% International Scheduled 5018 29% 63 9% 65%
Finally, the accidents were categorized by the region where the operator experiencing the accident was based. That breakdown is presented in Table 3. (Appendix 2 contains a list of the countries that were assigned to each region).
6

Table 3: Accidents and Fatalities by Region
Region Passenger Fatalities Fatal Accidents Number Share Number Share
Africa 2217 13% 103 15% Asia (except China) 2554 15% 79 11% Australia and Oceania 318 2% 47 7% Central America and the Caribbean 646 4% 58 8% China 1644 9% 27 4% Europe 1469 8% 55 8% Former Soviet Union 2364 14% 72 10% Middle East and North Africa 2116 12% 31 4% North America 2172 12% 111 16% South America 1986 11% 117 17%
Admittedly, neither tables 2 nor 3 are particularly informative by themselves because the number of accidents and fatalities are not compared to the volume of air traffic in each type of service or in each region. Operations data for many, but not all, of the world’s airlines is available from ICAO. However, because of differences in the airlines included in the WAAS data and the ICAO data, accident and fatality rates for countries, regions, and types of service must be built up airline by airline. That task is underway by the authors, but has not been completed.
Causes of Accidents
Table 4 shows the breakdown of accidents and passenger fatalities by cause for all 700 accidents. Pilot error was found to be the sequence‐initiating cause in 40 percent of the accidents while equipment failure was found to be the cause in 23 percent of the accidents. Pilot error and equipment failure were by far the two most frequent causes of fatal passenger aircraft accidents. The third most prevalent cause was the “other” category, which consists almost entirely of accidents for which there wasn’t sufficient information to determine the cause or in which the aircraft was not found or recovered so that it wasn’t possible to conduct even a cursory accident investigation.
The only other cause category accounting for 10 percent or more of the accidents was Environment, which includes causes stemming from the environment in which the flight occurs. Almost all of these accidents were due to weather. The others in the environment category were almost all the result of animal strikes. Interestingly, with all the recent attention and concern given to bird strikes in the United States, of the 700 commercial passenger fatality accidents worldwide in the 1990 through 2006 period, only six, less than one percent, were due to animal strikes. It is also interesting to note that over the period, terrorism and related criminal activity accounted for 4 percent of fatal accidents and 7 percent of passenger fatalities. As will be seen later in the paper, the role of terrorism varies considerably across regions of the world.
7

Table 4: Accidents and Passenger Fatalities by Cause
Cause of Accident Passenger Fatalities Fatal Accidents Fraction of
Passengers Killed Number Share Number Share Pilot Error 5928 34% 278 40% 65% Equipment Failure 4694 27% 158 23% 72% Other 2150 12% 134 19% 93% Environment 1751 10% 71 10% 71% Terrorism/Criminal 1308 7% 30 4% 62% Other Aircraft 907 5% 14 2% 100% Air Traffic Control 443 3% 9 1% 87% Ground/Cabin Crew Error 303 2% 4 1% 92% Seatbelt Turbulence 2 0% 2 0% 0.3%
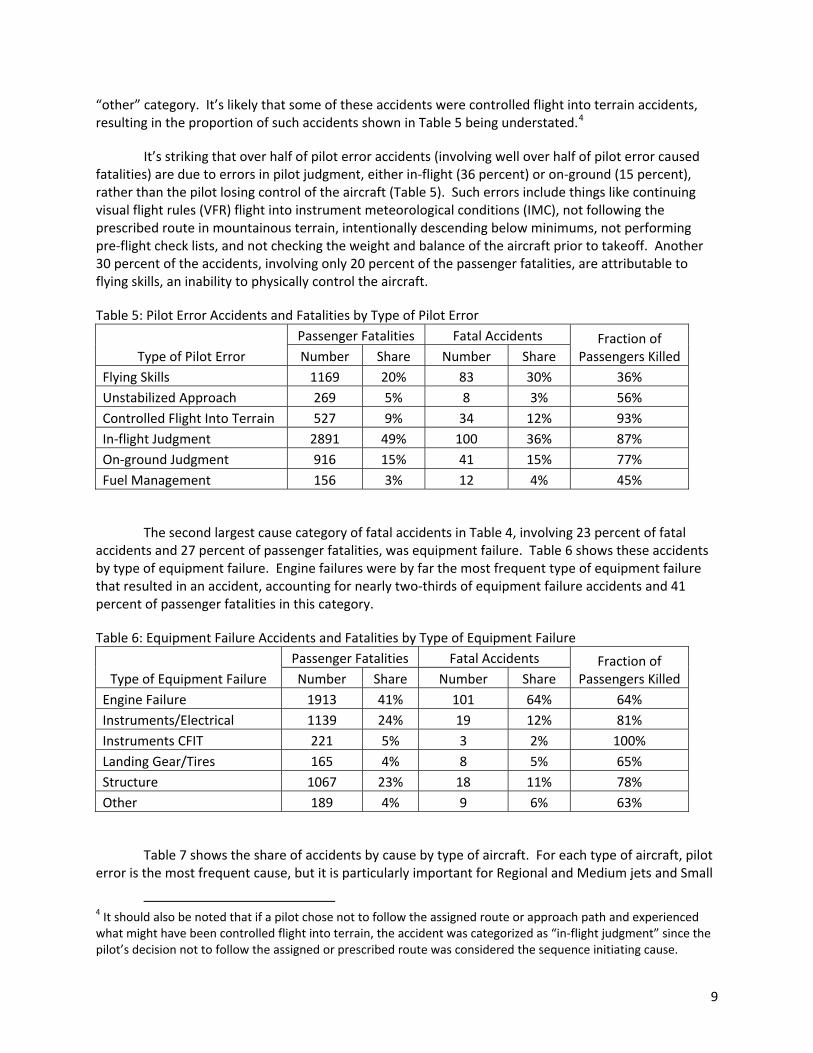
Overall, pilot error is the most frequent cause of fatal accidents. Table 5 breaks down the pilot error category into the specific types of pilot error. As discussed in detail in Appendix 1, the types of pilot error found in these accidents include: flying skills, unstabilized approach, controlled flight into terrain, in‐flight judgment, on‐ground judgment, and fuel management.
Determining the type of pilot error for an accident can be difficult, particularly for accidents that have not had a detailed accident investigation, so a further discussion of two pilot error categories is warranted. One type of pilot error that has been of concern, particularly in the United States, is a pilot flying an unstabilized approach. In some cases, this might be considered a deficiency in flying skills. In accidents that are carefully investigated and where the aircraft were equipped with Flight Data Recorders (FDR), it’s often possible to determine unambiguously that the approach was unstable, and therefore the cause assigned is pilot error – unstabilized approach. However, in many of the accidents in the database there was no detailed accident investigation and no FDR data was available. In some of those accidents, it’s likely that the approach was unstabilized, but there was no way to determine unambiguously that from the information available, so the accident was categorized as pilot error ‐‐ flying skills.
Accidents involving controlled flight into terrain can also be difficult to assess. The notion behind such an accident is that the pilot may become distracted or lose situational awareness and simply fly the plane into the ground, often in level flight into rising terrain. Avoiding such accidents was the goal of installing ground proximity warning devices in many large jet aircraft. For the most part, these devices have eliminated this type of accident. However, many aircraft, particularly smaller aircraft and aircraft operated outside the developed world don’t have ground proximity warning devices so such accidents still do occur with some regularity. For many of the accidents in this database, the aircraft was simply discovered after crashing into a mountain side or into rising terrain with little or no information on what transpired before the crash occurred. Was this controlled flight into terrain or was there some equipment failure or some other factor that resulted into the crash? If the cause wasn’t clear from the information in the database, the accident was categorized as “cause ambiguous” and put into the
8
“other” category. It’s likely that some of these accidents were controlled flight into terrain accidents, resulting in the proportion of such accidents shown in Table 5 being understated.4
It’s striking that over half of pilot error accidents (involving well over half of pilot error caused fatalities) are due to errors in pilot judgment, either in‐flight (36 percent) or on‐ground (15 percent), rather than the pilot losing control of the aircraft (Table 5). Such errors include things like continuing visual flight rules (VFR) flight into instrument meteorological conditions (IMC), not following the prescribed route in mountainous terrain, intentionally descending below minimums, not performing pre‐flight check lists, and not checking the weight and balance of the aircraft prior to takeoff. Another 30 percent of the accidents, involving only 20 percent of the passenger fatalities, are attributable to flying skills, an inability to physically control the aircraft.
Table 5: Pilot Error Accidents and Fatalities by Type of Pilot Error
Type of Pilot Error Passenger Fatalities Fatal Accidents Fraction of
Passengers Killed Number Share Number Share Flying Skills 1169 20% 83 30% 36% Unstabilized Approach 269 5% 8 3% 56% Controlled Flight Into Terrain 527 9% 34 12% 93% In‐flight Judgment 2891 49% 100 36% 87% On‐ground Judgment 916 15% 41 15% 77% Fuel Management 156 3% 12 4% 45%
The second largest cause category of fatal accidents in Table 4, involving 23 percent of fatal accidents and 27 percent of passenger fatalities, was equipment failure. Table 6 shows these accidents by type of equipment failure. Engine failures were by far the most frequent type of equipment failure that resulted in an accident, accounting for nearly two‐thirds of equipment failure accidents and 41 percent of passenger fatalities in this category.
Table 6: Equipment Failure Accidents and Fatalities by Type of Equipment Failure
Type of Equipment Failure Passenger Fatalities Fatal Accidents Fraction of
Passengers Killed Number Share Number Share Engine Failure 1913 41% 101 64% 64% Instruments/Electrical 1139 24% 19 12% 81% Instruments CFIT 221 5% 3 2% 100% Landing Gear/Tires 165 4% 8 5% 65% Structure 1067 23% 18 11% 78% Other 189 4% 9 6% 63%
Table 7 shows the share of accidents by cause by type of aircraft. For each type of aircraft, pilot error is the most frequent cause, but it is particularly important for Regional and Medium jets and Small
4 It should also be noted that if a pilot chose not to follow the assigned route or approach path and experienced what might have been controlled flight into terrain, the accident was categorized as “in‐flight judgment” since the pilot’s decision not to follow the assigned or prescribed route was considered the sequence initiating cause.
9

Jets, accounting for over half of the accidents in both cases. For Large Jets, Turboprops, and Piston aircraft, pilot error is the most important cause, but equipment failure is also important. It’s also notable in Table 7 that Terrorism is a proportionately larger share for Large Jets than for any of the other categories, suggesting that larger aircraft are a more attractive target for terrorists than are smaller aircraft.
Table 7: Share of Accidents by Cause by Type of Aircraft
Cause of Accidents
Share of Accidents
Large Jet Turboprop Piston Regional/ Medium Jet Small Jet
Equipment Failure 25% 21% 29% 15% 4% Seatbelt Turbulence 1% 0% 0% 0% 0% Environment 9% 12% 8% 12% 7% Pilot Error 38% 41% 32% 58% 63% Air Traffic Control 2% 2% 0% 0% 4% Ground Cabin Crew Error 2% 0% 0% 0% 0% Other Aircraft 4% 2% 1% 0% 4% Other 7% 21% 30% 9% 19% Terrorism/Criminal 12% 3% 1% 6% 0%
Table 8 shows the breakdown of the type of equipment failure by the type of aircraft. As can be seen in the table, engine failure is the overwhelming type of equipment failure in piston‐engine aircraft, accounting for 87 percent. Perhaps this is not surprising given the greater complexity and number of moving parts in a piston engine compared to a turbine engine. However, even in turboprops, engine failure accounted for 71 percent of equipment failure. What is striking in the table is that engine failure accounted for a far smaller proportion of equipment failure in large jet aircraft, confirming the widely held belief that modern jet engines operate with a very high degree of reliability. Moreover, because of the strict certification requirements for engine‐out performance of large jet aircraft, it may well be that an engine failure, when it does occur, is less likely to result in an accident in these aircraft.
Table 8: Equipment Failure Accidents by Type of Aircraft
Type of Equipment Failure Large Jets Turboprops Piston
Number Share Number Share Number Share Engine Failure 12 30% 47 71% 40 87% Instruments/Electrical 12 30% 5 8% 2 4% Instruments CFIT 2 5% 0 0% 0 0% Landing Gear/Tires 3 8% 5 8% 1 2% Structure 9 23% 6 9% 1 2% Other 2 5% 3 5% 2 4%
Table 9 shows the breakdown of accident causes by region. As can be seen in the next to the last line in the table, there is considerable variability across regions in the share of the “other” category. Recall that this category consists almost entirely of accidents where the cause could not be determined
10

11
either because insufficient information was available about the accident or because the aircraft disappeared and was never recovered. With this much variation in the proportion of accidents for which a cause could not be assigned, it’s difficult to compare the distribution of causes. Table 10 also shows the distribution of causes across regions, but only for those accidents for which a cause could be determined thus allowing easier comparisons across regions.
Turning to Table 10, pilot error and equipment failure are the two most frequent causes of accidents in all regions. While pilot error is a more frequent cause in most regions, in both Africa and China, equipment failure is more prevalent than is pilot error. While pilot error is less common as a cause than equipment failure in China, in the rest of Asia, pilot error accounts for 64 percent of the fatal crashes, well over twice that accounted for by equipment failure. Both Australia/Oceania and Central America and the Caribbean also have very high rates of pilot error relative to the other regions. Another area with large differences among regions is the role of terrorism. China, Africa, the Former Soviet Union, and the Middle East and North Africa all have an above average share of accidents caused by terrorism.
Conclusion
The analysis above provides some insight into the distribution of fatalities and fatal accidents that worldwide during the 1990 to 2006 time period. An idea is provided with regard to what served as the initiating cause in what often was a chain of events that led to a particular accident and how these causes compare among regions of the world, across types of service, and among types of aircraft. No really definitive conclusions can be drawn, in the absence of data concerning exposure in each category. However, the analysis does take an important first step toward answering the question of why airplanes crash and how the aircraft type, the type of service, and the region where the operator is based may contribute to fatal aviation accidents.

Table 9: Share of Accidents by Cause by Region
Cause of Accident Africa
Asia (except China)
Australia and
Oceania
Central America and
the Caribbean China Europe
Former Soviet Union
Middle East and North Africa
North America
South America
Equipment Failure 30% 18% 19% 21% 37% 20% 18% 23% 22% 22% Seatbelt Turbulence 0% 0% 0% 0% 0% 2% 0% 0% 1% 0% Environment 13% 4% 9% 7% 11% 11% 15% 17% 10% 9% Pilot Error 25% 43% 49% 62% 33% 38% 46% 33% 43% 32% Air Traffic Control 3% 1% 0% 0% 0% 2% 0% 0% 3% 1% Ground/Cabin Crew Error 1% 0% 0% 0% 0% 2% 0% 0% 1% 1% Other Aircraft 1% 0% 0% 0% 0% 5% 1% 10% 3% 3% Other 18% 33% 23% 9% 4% 18% 11% 10% 14% 30% Terrorism/Criminal 9% 1% 0% 2% 15% 2% 8% 7% 4% 2%
Table 10: Share of Accidents by Cause by Region for Accidents Where Cause Could be Assigned
Cause of Accident Africa
Asia (except China)
Australia and
Oceania
Central America and
the Caribbean China Europe
Former Soviet Union
Middle East and North Africa
North America
South America
Equipment Failure 37% 26% 25% 23% 38% 24% 20% 26% 26% 32% Seatbelt Turbulence 0% 0% 0% 0% 0% 2% 0% 0% 1% 0% Environment 15% 6% 11% 8% 12% 13% 17% 19% 11% 13% Pilot Error 31% 64% 64% 68% 35% 47% 52% 37% 50% 46% Air Traffic Control 4% 2% 0% 0% 0% 2% 0% 0% 3% 1% Ground/Cabin Crew Error 1% 0% 0% 0% 0% 2% 0% 0% 1% 1% Other Aircraft 1% 0% 0% 0% 0% 7% 2% 11% 3% 4% Terrorism/Criminal 11% 2% 0% 2% 15% 2% 9% 7% 4% 2%
12

Appendix 1: Definitions and Rules for Assigning Causes to Accidents
Equipment Failure:
Engine Failure Engine failure includes any failure in flight or during the takeoff role of the power plant including propellers, internal engine parts, turbos, magnetos, fuel lines downstream of the fuel tank, engine controls, fuel contamination other than problems that should have been detected during preflight checks (water, misfueling, etc.) If the pilot claims engine failure and post‐crash inspection fails to determine a cause of the engine failure, the accident is considered an engine failure. However, if the engine runs without problem in the post‐crash Investigation, the accident is considered “cause ambiguous” An accident caused by the failure of the APU is included in this category.
Instruments/Electrical Includes any malfunction of aircraft instruments of any other
electrical failure (other than magneto). Inaccurate fuel gauge is not considered instrument failure.
Instruments‐CFIT Includes any malfunction of onboard aircraft instruments that
results in a CFIT (controlled flight into terrain) accident in reduced visibility conditions.
Landing Gear/Tires Any malfunction of the landing gear, tires, wheels, or brakes.
However, it does not include malfunction from a hard landing or excessive side loads (ground loops).
Structure Includes failure of wings, flight control surfaces, or other
structural parts of the aircraft (ailerons, horizontal and vertical stabilizers, etc.)
Homebuilt Includes any mechanical, structural, or electrical failure of a
homebuilt aircraft. Homebuilt aircraft are identified either by being designated as a homebuilt in the accident brief or if the manufacturer’s name is the same as the pilot’s name. (used for general aviation accidents)
Other Includes all other equipment failures, such as the failure of a
seat leading to loss of control of the aircraft.
13

Seatbelt Not Fastened/Turbulence:
Seatbelt not fastened This category is to be used when a passenger death results from not having his or her seatbelt fastened when turbulence is encountered and adequate warning had been given by the flight crew. Adequate warning must include the seatbelt sign being illuminated and, if it had been previously turned off in flight, must include an announcement by a member of the flight deck crew or cabin crew. If the sign had been previously turned off in flight, there must be an announcement by a member of the flight deck crew or cabin crew.
Turbulence This category is to be used in accidents involving turbulence
other than those in the category above. If a flight attendant is injured by turbulence, it is in this category. If a passenger is injured by turbulence when the seatbelt sign is not turned on, it is also in this category. If the seatbelt sign is turned on but the passenger is injured before or while returning to his or her seat, it is in this category. Damage to an aircraft from turbulence would also be in this category.
Environment:
Weather This category includes accidents resulting from windshear, slippery runway (unless the pilot lands excessively long), emergency landings due to weather, and icing. Weather encountered during takeoff is considered pilot error preflight judgment. If a weather briefing is not obtained prior to flight, the cause is considered preflight judgment. If a VFR‐rated pilot encounters predicted weather beyond his or her capability, it is preflight judgment. Attempting to land at an airport below minimums is weather only if no alternative airport is available. Windy conditions during takeoff or landing while airborne that are corroborated by weather data or witnesses are considered weather. Otherwise such accidents are to be categorized as flying skills or, if high winds are knows to the pilot prior to landing as in‐flight judgment or prior to takeoff as preflight judgment. Downdrafts in mountainous terrain are considered weather if altitude is 1000 above ground level. Otherwise, the accident is considered in‐flight judgment.
14

Wind Gusts Includes accidents resulting from encountering high winds while the aircraft is on the ground (taxi, landing roll, takeoff roll, parked).
Animals Includes collision with any animals in‐flight or on the ground. It
also includes accidents due to evasive maneuvers trying to avoid animals.
Unimproved runway Includes any accident where the cause was an unseen
obstruction or flaw in a non‐paved runway. Examples would include hitting a submerged log with a float plane or breaking through the ice while landing on a river or lake. This code is also used for failures in runway lighting during touchdown and landing.
Pilot Error:
Flying Skills Includes accidents resulting from deficiencies on the part of the pilot in maintaining physical control of the aircraft. It includes hard landing, landing long, stalls, becoming disoriented, and so on. Failure to correct for a mild downdraft during landing is considered flying skills.
Unstabilized approach accident resulting from failure to maintain a reasonably
constant airspeed and descent rate during approach and landing. This is a form of flying skills with a separate code.
CFIT pilot error CFIT (controlled flight into terrain) In‐flight judgment includes mental errors such as failure to do the landing
checklist, failure to correct for carb icing, failure to maintain proper mixture control, becoming lost, improper flap setting for flight or landing. It also includes errors in judgment that put the plane in a hazardous situation such as flying at low altitude (buzzing, hitting power lines, spotting animals), flying into canyons, flying into rising terrain that exceeds climb capabilities of the aircraft, choosing to land in uncertain terrain (roads, pasture, etc.) and continuing VFR flight into IFR conditions. These are errors in judgment while the plane is airborne.
On‐ground judgment includes errors made prior to the flight that result in an accident
such as failure to do preflight checklist, failure to get weather briefing, takeoff for a VFR flight into marginal weather, takeoff into adverse weather or wind conditions, takeoff from uncertain terrain and, starting the plane when it is unoccupied and it isn’t
15
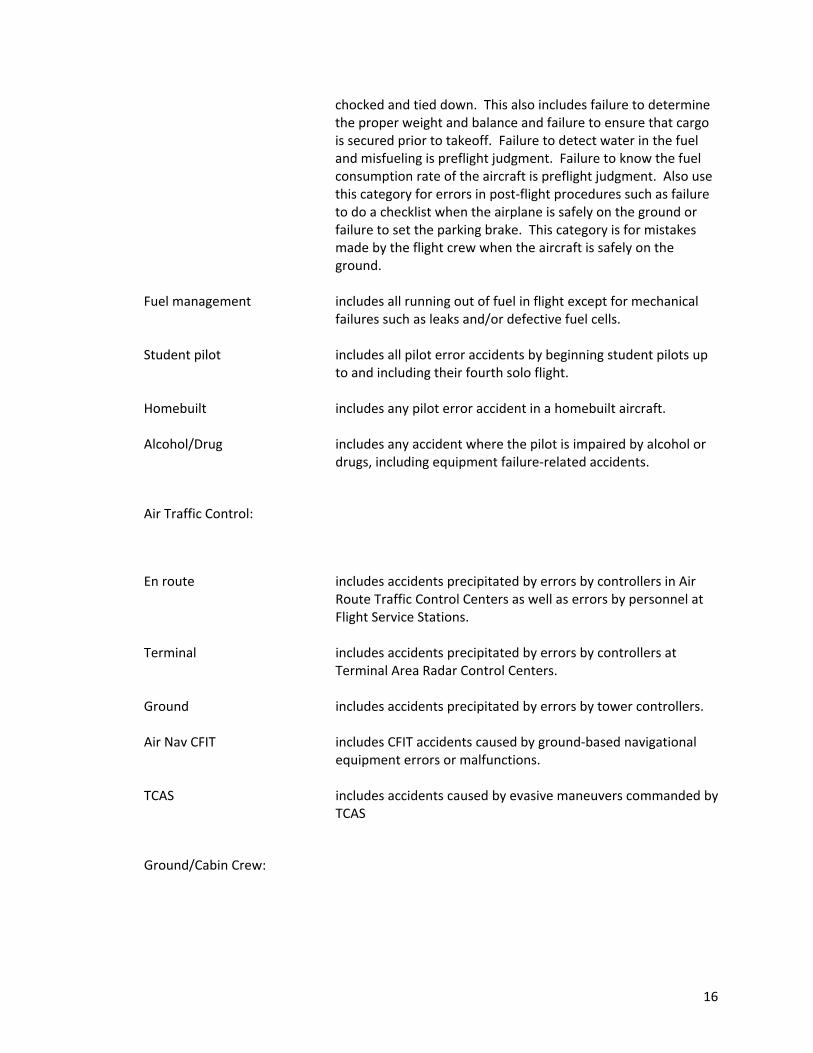
chocked and tied down. This also includes failure to determine the proper weight and balance and failure to ensure that cargo is secured prior to takeoff. Failure to detect water in the fuel and misfueling is preflight judgment. Failure to know the fuel consumption rate of the aircraft is preflight judgment. Also use this category for errors in post‐flight procedures such as failure to do a checklist when the airplane is safely on the ground or failure to set the parking brake. This category is for mistakes made by the flight crew when the aircraft is safely on the ground.
Fuel management includes all running out of fuel in flight except for mechanical
failures such as leaks and/or defective fuel cells. Student pilot includes all pilot error accidents by beginning student pilots up
to and including their fourth solo flight. Homebuilt includes any pilot error accident in a homebuilt aircraft. Alcohol/Drug includes any accident where the pilot is impaired by alcohol or
drugs, including equipment failure‐related accidents.
Air Traffic Control:
En route includes accidents precipitated by errors by controllers in Air Route Traffic Control Centers as well as errors by personnel at Flight Service Stations.
Terminal includes accidents precipitated by errors by controllers at
Terminal Area Radar Control Centers. Ground includes accidents precipitated by errors by tower controllers. Air Nav CFIT includes CFIT accidents caused by ground‐based navigational
equipment errors or malfunctions. TCAS includes accidents caused by evasive maneuvers commanded by
TCAS
Ground/Cabin Crew:
16

Airline Ground Crew includes any accidents from errors by ground crew personnel employed by an airline.
Other Ground Crew includes accidents by ground crew or other ground‐based
personnel employed non‐airline companies. This would include drivers of catering and fuel trucks.
Cabin Crew includes accidents caused by cabin crew error.
Other Aircraft:
Midair collision any accident where two planes collide and either of the planes is in the air. This category takes precedence over all other causes except air traffic control.
On ground any accident when two moving planes collide on the ground. If
a moving plane collides with a stationary plane, the moving plane is a pilot error/flying skills and the stationary plane is this category.
Other:
Company Operations any accident resulting from systematic application of company‐mandated unsafe practices.
Aircraft not recovered any accident where the aircraft was not recovered or a
sufficient portion of the aircraft to allow an effective accident investigation was not recovered.
Medical Impairment any accident where the pilot error appears to have been
induced by a medical impairment, such as a heart attack and so on.
Apparent Drug/Illegal Contraband Transport any accident that occurs during the apparent
transport of illegal drugs, or other contraband (illegal aliens) regardless of the specific cause of the accident.
No valid license any accident by an unlicensed pilot. A pilot whose license has
only recently expired is not included in this category.
17

Cause ambiguous any accident where the accident investigation was not able to determine the sequence of events in sufficient detail to determine the cause.
Terrorism/Conflict/Criminal Activity: 90‐99
Hijacking Bomb Missile Gunfire Other Terrorism/Criminal use this category for accidents caused by unruly or illegal
behavior by passengers.
18

19
Appendix 2: Regions and Countries Assigned to each Region (including WAAS Country Codes)
Africa UG‐‐Uganda AO‐‐Angola ZA‐‐South Africa Central America and the BI‐‐Burundi ZM‐‐Zambia Caribbean BJ‐‐Benin ZR‐‐Democratic Republic AG‐‐Antigua and BW‐‐Botswana of the Congo Barbuda CF‐‐Central African ZW‐‐Zimbabwe AN—Netherlands
Republic Antilles CG‐‐Republic of the Asia (except China) AW‐‐Aruba
Congo BD‐‐Bangladesh BB‐‐Barbados CI‐‐Cote d'Ivoire BN‐‐Brunei BS‐‐Bahamas CM‐‐Cameroon BT‐‐Bhutan BZ‐‐Belize CV‐‐Cape Verde ID‐‐Indonesia CR‐‐Costa Rica DJ‐‐Djibouti IN‐‐India CU‐‐Cuba ER‐‐Eritrea JP‐‐Japan DM‐‐Dominica ET‐‐Ethiopia KH‐‐Cambodia DO‐‐Dominican Republic GA‐‐Gabon KP‐‐North Korea GD‐‐Grenada GH‐‐Ghana KR‐‐South Korea GP‐‐Guadeloupe/ST. GM‐‐Gambia LA‐‐Laos Barthelemy GN‐‐Guinea LK‐‐Sri Lanka GT‐‐Guatemala GQ‐‐Equatorial Guinea MM‐‐Myanmar HN‐‐Honduras GW‐‐Guinea‐Bissau MN‐‐Mongolia HT‐‐Haiti HV‐‐Burkina Faso MV‐‐Maldives JM‐‐Jamaica KE‐‐Kenya MY‐‐Malaysia KN‐‐Saint Kitts and KM‐‐Comoros NP‐‐Nepal Nevis LR‐‐Liberia PH‐‐Philippines LC‐‐Saint Lucia LS‐‐Lesotho PK‐‐Pakistan MQ‐‐Martinique MG‐‐Madagascar SG‐‐Singapore MX‐‐Mexico ML‐‐Mali TH‐‐Thailand NI‐‐Nicaragua MR‐‐Mauritania VN‐‐Vietnam PA‐‐Panama MU‐‐Mauritius PR—Puerto Rico MW‐‐Malawi Australia and Oceania SV‐‐El Salvador MZ‐‐Mozambique AU—Australia TC—Turks and Caicos NA‐‐Namibia CK—Cook Islands Islands NE‐‐Niger FJ‐‐Fiji TT‐‐Trinidad and Tobago NG‐‐Nigeria GU‐‐Guam VC‐‐Saint Vincent and RW‐‐Rwanda KI‐‐Kiribati the Grenadines SC‐‐Seychelles MH‐‐Marshall Islands VG‐‐Virgin Islands SD‐‐Sudan NH‐‐Vanuatu (British) SL‐‐Sierra Leone NR‐‐Nauru VI‐‐Virgin Islands (US) SN‐‐Senegal NZ‐‐New Zealand ST‐‐Sao Tome and PF—French Polynesia China
Principe PG‐‐Papua New Guinea CN‐‐China SZ‐‐Swaziland PW‐‐Palau HK—Hong Kong TD‐‐Chad SB‐‐Solomon Islands TW‐‐Taiwan TG‐‐Togo TO‐‐Tonga TZ‐‐Tanzania WS—Western Samoa

Europe LV‐‐Latvia PY‐‐Paraguay AL‐‐Albania MD‐‐Moldova SR‐‐Suriname AT‐‐Austria RU‐‐Russia UY‐‐Uruguay BA‐‐Bosnia and SU—Soviet Union VE‐‐Venezuela
Herzegovina (1990‐1991) BE‐‐Belgium TJ‐‐Tajikistan BG‐‐Bulgaria TM‐‐Turkmenistan CH‐‐Switzerland UA‐‐Ukraine CY‐‐Cyprus UZ‐‐Uzbekistan CZ‐‐Czech Republic DE‐‐Germany Middle East and North Africa DK‐‐Denmark AE‐‐United Arab ES‐‐Spain Emirates FI‐‐Finland AF‐‐Afghanistan FR‐‐France BH‐‐Bahrain GB‐‐United Kingdom of DZ‐‐Algeria
Great Britain and EG‐‐Egypt Northern Ireland IL‐‐Israel
GR‐‐Greece IQ‐‐Iraq HR‐‐Croatia IR‐‐Iran HU‐‐Hungary JO‐‐Jordan IE‐‐Ireland KW‐‐Kuwait IS‐‐Iceland LB‐‐Lebanon IT‐‐Italy LY‐‐Libya LI‐‐Liechtenstein MA‐‐Morocco LU‐‐Luxembourg OM‐‐Oman MC‐‐Monaco QA‐‐Qatar MK—Macedonia SA‐‐Saudi Arabia MT‐‐Malta SO‐‐Somalia NL‐‐Netherlands SY‐‐Syria NO‐‐Norway TN‐‐Tunisia PL‐‐Poland TR‐‐Turkey PT‐‐Portugal RO‐‐Romania North America SE‐‐Sweden CA‐‐Canada SI‐‐Slovenia GL‐‐Greenland SK‐‐Slovakia US‐‐United States of YU‐‐Yugoslavia America
Former Soviet Union South America
AM‐‐Armenia AR‐‐Argentina AZ‐‐Azerbaijan BO‐‐Bolivia BY‐‐Belarus BR‐‐Brazil EE‐‐Estonia CL‐‐Chile GE‐‐Georgia CO‐‐Colombia KG‐‐Kyrgyzstan EC‐‐Ecuador KZ‐‐Kazakhstan GY‐‐Guyana LT‐‐Lithuania PE‐‐Peru
20