Embed Size (px)
Citation preview

AFEASIBILITY REPORT
ON
‘ BAKERY ’
GROUP ‘C’THIRD YEAR M.BA
2010-11
K.S. SCHOOL OF BUSINESS MANAGEMENTGUJARAT UNIVERSITYAHMEDABAD-380009
1

CERTIFICATE
This is to certify that members of group of Third year M.B.A. of K.S School of
Business Management and Research have successfully completed their
feasibility report on BAKERY for the academic year 2009-2010 and have duly
submitted the report to the institute.
Date of submission : March 10, 2011
Project Guide : Mrs. Anjali Gokhru
Signature :
K.S School of Business Management Gujarat University,Ahmedabad -380009
2

MEMBERS OF GROUP ‘C’
S.No ROLL NO. NAME1. 3022 KINJAL MAKWANA2. 3026 HELLY MODI3. 3028 RICHITA MODI4. 3031 VIDHI PADSALA5. 3032 ANKITA PANCHAL6. 3057 CHARMI SHAH7. 3081 AMISHA RAI8. 3097 GRISHMA JOSHI9. 3102 PARUL LAKUM
10. 3114 SHWETA SAGAR
3

TABLE OF CONTENTSS.No PARTICUALAR PAGE NUMBER
1. ACKNOWLEDGMENT 52 PREFACE 63 EXECUTIVE SUMMARY 74. INTRODUCTION TO
FESIBILITY9
5. INTRODUCTION TO BAKERY 126. ENVIRONMENTAL
SCANNING19
7. LEGAL FEASIBILTY 268. TECHNICAL FEASIBILTY 359. HUMAN RESOURCE
FEASIBILTY61
10. MARKETING FEASIBILTY 7111. FINANCIAL FEASIBILTY 10012. CONCLUSION 13013. BIBLIOGRAPHY/
WEBOGRAPHY132
14. APPENDIX 134
4

ACKNOWLEDGEMENT
How does a person say “thank you” when there are so many people to thank?
Obviously this project is a thank you to our faculty guide Mrs. Anjali Gokhru for her inspiring guidance.
We would also like to thank our director Dr. Sarla Achuthan, the powerful driving force of K.S. School of Business Management.
We are also greatly indebted to the consumers and the dealers for their co-operation and support. Without their active participation this feasibility project could not have been completed successfully.
Last, but not the least, we are deeply indebted to K.S. School of Business Management for providing us the opportunity to enhance our inner ability and improve our knowledge and skills.
Finally, we express our warm gratitude to all the people, who have been directly or indirectly involved in this project and made it an enjoyable and meaningful experience.
5

PREFACEFeasibility reports address things like where and how the business will operate. They provide in-depth details about the business to determine if and how it can succeed, and serve as a valuable tool for developing a winning business plans.
This project studies and analyses various parameters that decide the establishment of a bakery and whether the venture shall be feasible or not.
The project has been divided into four major branches of feasibility study, namely, technical, human resource, marketing and financial.
Our team has made an all out effort to present a comprehensive feasibility report and depict the feasibility of the project.
We hope that this project will receive a warm welcome from K.S. School of Business Management.Valuable suggestions from the teachers and students are welcome for the improvement of the project.
6

EXECUTIVE SUMMARY
This project is a feasibility report for establishing a bakery. The name of our partnership firm has been decided as ‘Cravings Bakery’. We will enter into the business with breads, buns, toasts, khari and cream rolls as our chief products. Legal, technical, marketing & financial feasibility have been covered in this project.
For the legal feasibility, we have shown laws that govern bakery production and
products.
Technical feasibility includes raw materials, machineries required for production
and the production process for different products. These have been decided after
visiting bakeries in Ahmedabad and conducting a small survey for dealers.
Marketing feasibility covers the marketing mix for our firm, marketing strategy
adopted and the market research conducted for consumers and dealers of bakery
products. The analyses of these surveys show the customer trends for bakery
products and the pattern of demand and supply in the bakery industry.
The workforce required by the firm is specified in human resource feasibility.
Estimated costs, sales, profits make the financial feasibility. Ratio analysis and
break even sales are also covered in this part.
7
8

INTRODUCTION
9

FEASIBILITY
10

DEFINITION OF FEASIBILITY A feasibility report looks at the viability of an idea with an emphasis on identifying potential problems and attempts to answer one main question: Will the idea work and should you proceed with it?
Before you begin writing your business plan you need to identify how, where, and to whom you intend to sell a service or product. You also need to assess your competition and figure out how much money you need to start your business and keep it running until it is established.
Feasibility studies address things like where and how the business will operate. They provide in-depth details about the business to determine if and how it can succeed, and serve as a valuable tool for developing a winning business plan.
Why Are Feasibility Reports so Important?Feasibility reports contain comprehensive, detailed information about your business structure, your products and services, the market and help you to know the logistics of how you will actually deliver a product or service, the resources you need to make the business run efficiently, as well as other information about the business.
The Components of a Feasibility Report Description of the Business: The product or services to be offered and
how they will be delivered. Market Feasibility: Includes a description of the industry, current market,
anticipated future market potential, competition, sales projections, potential buyers, etc.
Technical Feasibility: Details how you will deliver a product or service (i.e., materials, labour, transportation, where your business will be located, technology needed, etc.).
Financial Feasibility: Projects how much start-up capital is needed, sources of capital, returns on investment, etc.
Organizational Feasibility: Defines the legal and corporate structure of the business (may also include professional background information about the founders and what skills they can contribute to the business).
Conclusions: Discusses how the business can succeed. Be honest in your assessment because investors won’t just look at your conclusions they will also look at the data and will question your conclusions if they are unrealistic.
11

INTRODUCTION TOBAKERY
HISTORYBaking is the technique of prolonged cooking of food by dry heat acting by convection, normally in an oven, but also in hot ashes, or on hot stones. It is
12

primarily used for the preparation of bread, cakes, pastries, pies, cookies, biscuits and crackers. Such items are sometimes referred to as "baked goods," and are sold at a bakery. A person who prepares baked goods as a profession is called a baker. It is also used for the preparation of baked potatoes, baked apples, baked beans, and various other foods.
Many commercial ovens are provided with two heating elements: one for baking, using convection and conduction to heat the food, and one for broiling or grilling, heating mainly by radiation.
The baking process does not require any fat to be used to cook in an oven. Some makers of snacks such as potato chips or crisps have produced baked versions of their snack items as an alternative to the usual cooking method of deep-frying in an attempt to reduce the calorie or fat content of their snack products.
In ancient history, the first evidence of baking occurred when humans took wild grass grains, soaked them in water, and mixed everything together, mashing it into a kind of broth-like paste. The paste was cooked by pouring it onto a flat, hot rock, resulting in a bread-like substance. Later, this paste was roasted on hot embers, which made bread-making easier, as it could now be made anytime fire was created.
Baker putting a bread into an oven with a peel, 1568
Baking flourished in the Roman Empire. In about 300 BC, the pastry cook became an occupation for Romans. This became a respected profession because pastries
13

were considered decadent, and Romans loved festivity and celebration. Thus, pastries were often cooked especially for large banquets, and any pastry cook who could invent new types of tasty treats was highly prized. Around 1 AD, there were more than three hundred pastry chefs in Rome, and wrote about how they created all sorts of diverse foods, and flourished because of those foods.. A great selection of bakery products like breads and pastries, with many different variations, different ingredients, and varied patterns, were often found at banquets and dining halls. The Romans baked bread in an oven with its own chimney, and had mills to grind grain into flour.
Eventually, because of Rome, the art of baking became known throughout Europe, and eventually spread to the eastern parts of Asia. Bakers often baked goods at home and then sold them in the streets. In London, pastry chefs sold their goods from handcarts. This developed into a system of delivery of baked goods to households, and demand increased greatly as a result. In Paris, the first open-air café of baked goods was developed, and baking became an established art throughout the entire world, thus leading to the successful birth of bakeries and baked products.
SCENARIO OF BAKERY IN INDIA14

The bread and bakery products market has struggled with numerous challenges over many years. As a mature and saturated market, it has had to rely on continual investment in new product development (NPD) and marketing to ensure growth. The higher unit cost of bread, rather than increases in volume consumption, has led to a 9% increase in household expenditure on bread and bakery products during 2010. The traditional white bread sector was the largest in the total bread market until 2006, when the growing focus on healthy eating, among other factors, led some consumers to switch to other types of bread and bakery products. However, despite falling consumption, rising prices have meant that total household expenditure on white bread rose steeply in 2009 and in 2010. The brown and whole meal bread sector has experienced a strong revival since 2005 — something which can be linked mainly to renewed interest in healthy eating. The sector has retained a share of the total bread market of more than 18% since 2007. The specialty breads sector has shown steady growth during the past 5 years. It overtook white bread as the largest sector in 2006, and in 2009 had sales at a similar level to white bread. In India, there are 85,000 bakery units, of which 75,000 operate in unorganized sector occupying 65% of the market share. The per capita consumption of bakery products as it stands today is 1-2 kg per annum, which compares very low with that in the advanced countries, which is 10-50 kg per annum. The urban areas hog a major share of the Indian Bakery, comprising 77.5 % of the total market, owing to 2 vital factors – rising disposable incomes and time constraints in the working population residing in these areas. The Indian Bakery Market is estimated to be worth Rs. 6,900 Crores, growing at a healthy CAGR of 7 % per annum. Out of this bread and biscuits hold about 82% of the share. The major players in these segments are Britannia, Parle, Bakeman, ITC Foods Ltd and HUL and the major brands are Britannia, Parle, Bakeman, Priya Gold, Cremica, Dukes and Horlicks. Another segment worth mentioning is Cakes and Pastries, which is dominated by Monginis, a Cake brand based at Mumbai.
15

Some of the major consumer trends in the Indian Bakery Market worth mentioning are,
With globalization and cultural integration, eating habits of the discerning urban and rural consumer are fast changing. Bakery joints are slowly becoming popular hangout places. A typical trend is for a variety of bakery snacks, top quality products and value for money. The present day consumer looks for new bakery products, better appeal, taste and convenience from bakery foods. With a population of 1 billion plus, India has the largest middle-income consumers, who demand varieties in food, clothing, transport and improved living standards, also wish to eat out. Another fastest growing segment in India, is Bakery Cafes and Restaurants, who cater fast foods. Consumers are increasingly concerned about their health and are well aware of the relationship between nutritious food and optimal health. Various concerns have caused consumers to demand for healthier bakery products. The concerns like, the growing media coverage on health, the rising incidence of health conditions (obesity, diabetes and cardiac problems) etc. have resulted in the introduction of low/light, functional, wholemeal, multigrain, natural and organic products in the market. In addition to healthier products, consumers also are purchasing products that satisfy their taste buds. With lifestyles becoming increasingly stressful, consumers may indulge in food for comfort. On-site manufacturing of bakery products in bakeries and supermarkets directly contributes to this trend, as it is well known that the smell of freshly baked breads and other products is a strong motivational factorin subsequent purchases. Indulgence/luxury products like cakes and pastries are becoming more pronounced as a key trend in the bakery industry. Consumers increasingly seek for premium, gourmet and exotic products to satisfy their desire to indulge.
The future of bakery industry in India is indeed bright, as 70 - 80% of the market is still being served by the unorganized segments of the market. Larger companies have continued to place a high emphasis on branding and marketing in an effort to differentiate their products from those of their competitors.
16

PROJECT AT A
GLANCE
17

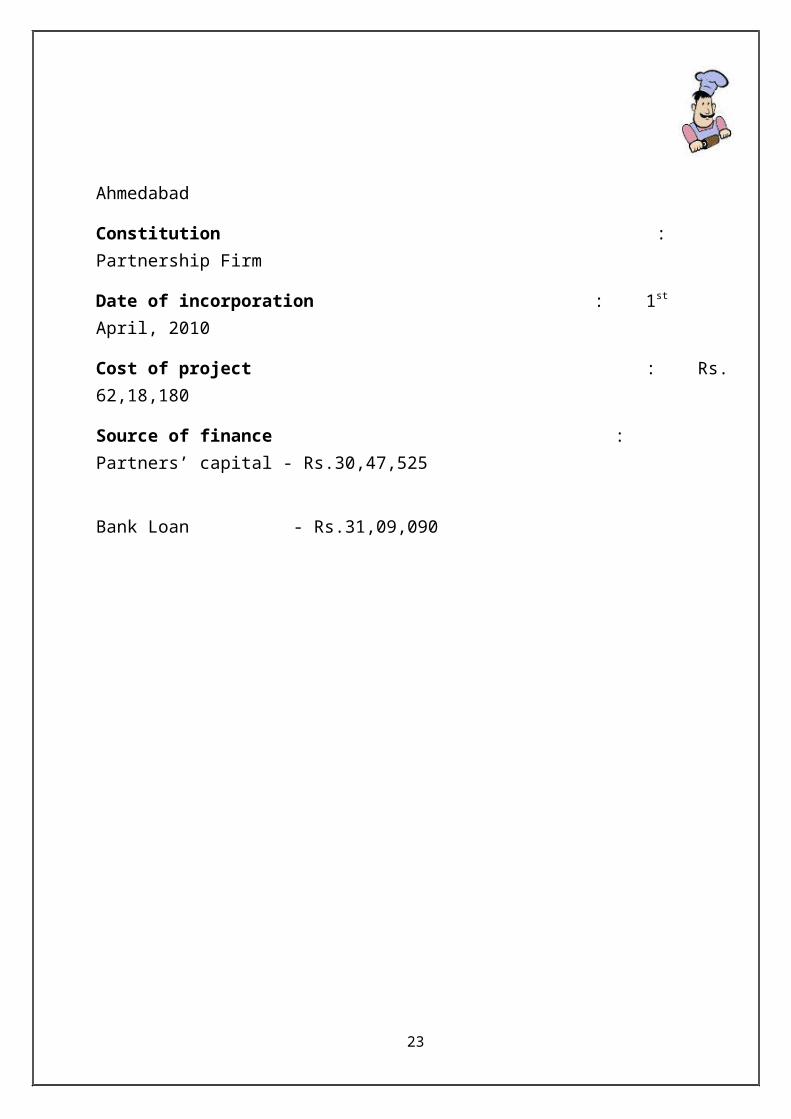
Name : Cravings Bakery
Product : Breads, buns, Cream rolls, Tea cakes Status : Medium Scale
Address : Phase-2, GIDC, Changodar,
Ahmedabad
Constitution : Partnership Firm
Date of incorporation : 1st April, 2010
Cost of project : Rs. 62,18,180
Source of finance : Partners’ capital - Rs.30,47,525
Bank Loan - Rs.31,09,090
18

ENVIRONMENTALSCANNING
PEST ANALYSIS
19

A PEST analysis is an analysis of the external macro-environment that affects all firms. P.E.S.T. is an acronym for the Political, Economic, Social, and Technological factors of the external macro-environment. Such external factors usually are beyond the firm's control and sometimes present themselves as threats. For this reason, some say that "pest" is an appropriate term for these factors. However, changes in the external environment also create new opportunities and the letters sometimes are rearranged to construct the more optimistic term of STEP analysis.
Many macro-environmental factors are country-specific and a PEST analysis will need to be performed for all countries of interest. The following are examples of some of the factors that might be considered in a PEST analysis.
Political Analysis Political stability Pricing regulations Taxation - tax rates and incentives
20
PEST
POLITICAL
TECHNOLOGICAL
SOCIAL
ECONOMIC

Wage legislation - minimum wage and overtime Work week Mandatory employee benefits Industrial safety regulations Product labeling requirements
Economic Analysis Government intervention in the free market Skill level of workforce Labour costs Business cycle stage (e.g. prosperity, recession, recovery) Economic growth rate Unemployment rate Inflation and interest rates
Social Analysis Demographics Class structure Education Culture (gender roles, etc.)
Technological Analysis Level of technology used for production. Innovation in production techniques.
The number of macro-environmental factors is virtually unlimited. In practice, the firm must prioritize and monitor those factors that influence its industry. Even so, it may be difficult to forecast future trends with an acceptable level of accuracy.
SWOT ANALYSIS
21

A scan of the internal and external environment is an important part of the strategic planning process. Environmental factors internal to the firm usually can be classified as strengths (S) or weaknesses (W), and those external to the firm can be classified as opportunities (O) or threats (T). Such an analysis of the strategic environment is referred to as a SWOT analysis.
The SWOT analysis provides information that is helpful in matching the firm's resources and capabilities to the competitive environment in which it operates. As such, it is instrumental in strategy formulation and selection.
The SWOT Analysis of our firm is
Strength The prices of our products are very reasonable and less than our
competitors. New and different varieties of breads have been introduced which shall give
us the benefit of product differentiation. Our sales are through tie-ups with grocery stores and supermarkets across
Ahmedabad. This gives us a wide consumer base and a chance to serve different levels of customers.
The firm also gives a little more commission to its distributors to encourage dealership.
The labour required does not need any specific qualification & skill and hence can be made easily available.
22
Weakness Bakery products are perishable items hence need to be sold as soon as
possible to gain maximum benefit. The customers also prefer fresh products. But the far location of the factory can increase the time between baking and actual selling.
Our bakery has introduced few bakery items from the possible product lines. We are not making cakes, pastries, chocolates and other various products. This limited menu can be seen as a weakness.
We are not introducing our own outlets but are selling through tie-ups across the city. This delays our brand establishment time.
Opportunity Expansion of the product line in the future with the introduction of biscuits
and cakes and pastries. Scope for expansion with the establishment of our own outlets and bakery
cafés Growing concern for health and multigrain food products shall become a
reason for increase of our sales of food items such as brown breads, tomato-spinach bread and white-coriander bread.
Threats Severe competition in the industry with well-established players like Modern
breads, Britannia, Havmor, Italian Bakery, Moti bakery etc.
23

LEGAL CRITERIANumerous laws has been stipulated by ministry of food and related ministry to check consumer interest and stop malpractices by manufacturers.
Following are the acts inacted by Government of India :
Food Safety and Standards Act , 2006 Prevention of Food Adulteration Act (PFA) 1954 and Environment Protection
Act, 1986. Pollution Control (Ministry of Environment and Forests). Industrial Licenses. BIS Act, 1986.
In addition to Commercial licenses and registration following are major laws to be followed by bakeries
Factories Act (Occupational related issues ) Air and Water pollution Act (Pollution Control ) Petroleum Act ( Storage of LPG in factory premises)
A brief introduction to some of the major laws in food industry and bakery is as follows:
Prevention of Food Adulteration Act, 1954The objectives of this Act are:
1. To protect the public from poisonous and harmful foods.2. To prevent the sale of substandard foods3. To protect the interest of the consumers be eliminating fraudulent practices.
Our firm adheres to the requirements of this Act and uses no adulterant substance in production.
The Bureau of Indian Standards Act, 1986An Act to provide for the establishment of a Bureau for the harmonious development of the activities of standardization, marking and quality certification of goods and for matters connected therewith or incidental thereto.
24

Food Safety and Standards Act, 2006 This act replaces the Prevention of Food Adulteration Act(PFA)1954. The objective of the new act is to consolidate the laws relating to food and to curb Food Adulteration by prescribing higher penalties for violation of food laws. It established Food Safety Management System for ensuring availability of safe and wholesome food for human consumption. Food Safety and Standards Authority of India was also established for enforcing the food safety standards.
Labour LawsThere are certain labour and employment laws that also need to be followed:A) Laws related to Industrial Relations:
i. The Trade Union (Amendment) Act, 2001ii. Industrial Employment (Standing Order) Act, 1946iii. The Industrial Dispute Act, 1947
B) Laws related to wages:
i. Payment of wages (Amendment) Act, 2005.ii. The Minimum Wages Act, 1948iii. The Payment of Bonus Act, 1965
25

LEGAL FEASIBILITY
PARTNERSHIP DEED26

Partnership is an association of two or more people who come together for achieving some common goals. A written document which binds them and gives them a legal enforcement right is called a partnership deed.
The partnership deed of Cravings Bakery is as follows:
1) Date of Execution:
“This deed of partnership is executed on April 1, 2011
Details of Partners:
S.NO NAMEOF PARTNER ADDRESS
1 KINJAL MAKWANA A/305,shrinandnagar-2,Vejalpur
2 HELLY MODI 1271, Raja Mehta ni pole, Kalupur.
3 RICHITA MODI 1534,Fafda ni Pole, Sarangpur.
4 VIDHI PADSALA 2, Raviraj Society, Science City.
5 ANKITA PANCHAL K-3/453, Nikita Park, Naroda.
6 CHARMI SHAH B/3 Kirtan App., Nava vadaj.
7 AMISHA RAI 13, Sakansh App., Ambavadi
8 GRISHMA JOSHI C-76, GIDC, Naroda.
9 PARUL LAKUM A/5 F/3, Shivalay So., Vejalpur.
10 SHWETA SAGAR A-214, Purshottam Park, D-Cabin.
.
The above partners have come together to carry on the business of a bakery enterprise, as from April 1, 2011. The terms and conditions of partnership in writing as agreed upon, are as follows.
a. Name
The business of the firm will be carried on under the name “Cravings”. However partners shall be entitled to change the name of the firm as may be mutually agreed upon.
27

b. Business of partnership
The partnership will carry on the business of bakery, making, distributing and selling bakery products as agreed by the partners.
c. Date of CommencementThis partnership shall be deemed to have been commenced on and with effect from April 1, 2011.
d. Place of businessThe principal place of the business of the firm shall be at Phase-2, GIDC, Changodar, but the partners shall be at liberty to shift it to any other place Or places and to open branch or branches at any other place or places as may be agreed upon.
e. Duration
That the duration of this partnership is not fixed and it shall be partnership at will.
f. Accounting YearThe accounting year of the company shall commence from April 1 and will end on March 31 every year. The first accounting year of the firm will be from 1-04-2011 to 31-03-2012.
g. Accounts and Records
Proper and regular accounts and records of the affairs and transaction of the firm shall be maintained and kept at the principal place or any other relevant or appropriate place or places in accordance with the requirements of the business of the firm.
h. Final Accounts
The balance sheet as on the last day of the accounting year and profit and loss account for the year shall be prepared at the end of each accounting year. The profit and loss as the case may be of the year shall be worked out and be allocated between the partners as per the profit –loss sharing ratio.
28

i. Capital
The initial capital of the firm shall be Rs. out of which 40% shall be contributed by all the partners equally and remaining will be the loan from the bank.
j. Drawings
The drawing shall be made by partners as many times in the year as per the wish to the partners taking into consideration the respective accounts.
k. Borrowing Power
The firm shall be entitled to secure deposits, borrow money and take loans from banks, financial institution and other corporate bodies or non-corporate parties. The partners can also provide loans to the firm.
l. Bank Account
Bank account in one or more banks will be operated in the names of the firm by any one or more of the partners and they shall be authorized to avail all types of facilities in the name of the firm that are generally allowed by the banks. Partners are also entitled to authorize any other person for operation of bank account through a power of attorney signed by all the partners.
m. Remuneration
It is hereby agreed that in consideration of the working partners keeping themselves actively engaged in the conduct of the affairs of the firm as working partners they shall be entitled to draw remuneration with effect from April 1, 2011 as under:
For the purpose of above calculation book profit shall be calculated on basis as defined in explanation 3 to section 40(b) of the income tax act, 1961 or any other applicable provision as may be in force for the income tax assessment of the partnership firm for the relevant accounting period.
In case of loss remuneration will be paid to the working partners as paid in the case of profit.
The partners shall be entitled to increase the above remuneration and may agree to pay remuneration to other working partner of partners as the case may be. The
29

parties here also agree to revise the mode of calculation, the above said remuneration as may be agreed to by and between the partners from time to time. However nothing herein contained shall preclude the working partners from withdrawing any amount standing to the capital and/or current or loan account. Yearly share of profit for the relevant accounting year would be in such a manner as may be decided by the partners by mutual consent.
n. Interest
Partners shall be provided interest on their respective capitals at a rate of 6% per annum.
o. Share in Profit/Loss
The profits and loss will be distributed equally among all the partners.
p. Modification
The partners shall be entitled to modify the above terms relating to remuneration, interest payable etc., by executing supplementary deed, and any such deed when executing shall have effect, unless otherwise provided, from the first day of the accounting period in which supplementary deed is executed and the same shall form part of this deed of partnership.
q. Arbitration
Any dispute or difference of opinion among the partners that may arise during the existence of this partnership shall be referred to arbitration and in such cases the provision of Indian Arbitration Act, 1940 shall be made applicable.
r. Amendment and Alteration
The partners shall, by mutual, oral, and/or written agreement, be at liberty to amend, alter, vary, or add to the aforementioned terms and conditions.
30

Declaration:
After hearing the translation of this partnership deed and complete understanding of the terms and conditions, we the partners agree to the above deed.
BANK OF BARODA Ashram Road, Ahmedabad
No.: BR:ADV/3/180
M/s. Cravings Bakery Date: 2 February, 2011
31

Phase-II, GIDC ChangodarAhmedabad.
Dear Sir/Ma’am
Ref: Sanction of Credit
With reference to your application letter dated 7/8/2010 we are pleased to sanction the credit facilities on the following terms and conditions:
1. Nature of facility: Term loan of Rs.
2. Purpose: Purchase of fixed assets
3. Rate of Interest: 11% per annum
4. Period/ Repayment: 5 years
Other terms and conditions:a.) You will periodically submit the monthly statement of stock, sales and purchase.b.) You will submit a copy of the audited/unaudited Balance sheet, Trading amount and
profit and loss account within three months from the close of the accounting year.c.) Bank will have the right to carry out inspection of books of Cravings Bakery and the
charges thereof will be borne by you.
Even though the above-mentioned facility is granted to you for a period of 60 months, the bank reserves the right to recall the facility or alter the terms and conditions at any time during the currency of the facility.
Yours faithfully
Senior ManagerBank of Baroda
32

33

34

TECHNICAL FEASIBILITY
INTRODUCTION
The term “technical feasibility” establishes that the product or service can operate in the desired manner. Technical feasibility means “achievable”. This has to be
35

proven without building the system. The proof is defining a comprehensive number of technical options that are feasible within known and demanded resources and requirements. These options should cover all technical sub-areas.
Our technical feasibility includes location analysis, procurement of raw materials, specification of machinery and production process
LOCATION ANALYSISThe selection of location plays a vital role for the growth. We have decided to establish our production unit as well as the administrative office in our factory building in Changodar.
36

Factory & Administrative office address:
Cravings bakery,
Phase-2, GIDC Changodar,
Ahmedabad.
Area: 3600 sq. feet Cost of land: 16, 42,000 including documentation charges and agent’s
commission. Reason for selecting the site:
• Fast growing area• Easy availability of land and building at reasonable rates.• Easily accessible location• Easy availability of raw materials and amenities like electricity and
water as the whole area is an industrial site.• Easy availability of the labour in industrial aree.
PLANT LAYOUT
37

The plant layout of the factory building and the planned interior setup is depicted below:
PROCUREMENT OF RAW MATERIALSThe estimated daily requirement of ingredients is:
S.NO INGREDIENTDAILY REQUIREMENT
(in Kgs.)PRICE PER
Kg./Ltr.
38

1. Maida 400 172. Wheat Flour 50 173. Yeast 12 1804. Milk 57 225. Vegetable Oil 12 606. Sugar 23 307. Butter 15 1008. Brown Sugar 4 409. Baking Powder 2.5 9010. Curd 8 5011. Salt 10 512. Spinach leaves 5 1713. Tomato 5 3014. Cumin powder 0.2 10015. Red chili powder 0.2 25016. Cinnamon 0.2 10017. Coriander 0.7 10018. Ginger 0.350 75
Apart from the above mentioned ingredients, we shall also need the following ingredients on weekly basis.
S.No. INGREDIENT WEEKLY REQUIREMENT
PRICE PER Kg/gms.
1. Tutti-Fruity 1.5 kg 802. Chocó powder 300 gms 2003. Cocoa powder 300 gms 200
The ingredients will be purchased from local suppliers at Jamaalpur and Kalupur markets.
SPECIFICATION OF MACHINERY
1.) DECK OVEN39

NAME Deck oven(in-built proofer)QUANTITY PURCHASED 1
SUPPLIER Canon engineering industriesPRICE Rs. 2,64,000
WEIGHT 490 kgCAPACITY 9 trays
FUEL Gas-fired
2.) DOUGH MIXER
40

NAME Dough MixerQUANTITY PURCHASED 3
SUPPLIER Canon Engineering IndustriesPRICE PER UNIT Rs. 46,500
WEIGHT 285 kgCAPACITY 25 kg
FUEL Electric fired
3.) DOUGH MOULDER
41

NAME Dough moulderQUANTITY PURCHASED 2
SUPPLIER Canon Engineering IndustriesPRICE PER UNIT Rs. 42,350
WEIGHT 290 kgsCAPACITY 80 kg/hour
FUEL Electric fired
4.) SUGAR GRINDER
42

NAME Sugar Grinder
QUANTITY PURCHASED 1
SUPPLIER Kaps Engineers
PRICE Rs. 35,000
WEIGHT 250 kg
CAPACITY 135 kg/hour
5.) PACKING MACHINE
43

NAME Packing Machine
QUANTITY PURCHASED 2
SUPPLIER Apple Bakery Machinery Pvt. Ltd.
PRICE Rs. 47,650
WEIGHT 265 kgs
6.) BREAD/TOAST SLICER44

NAME Bread Slicer
QUANTITY PURCHASED 2
SUPPLIER Canon Engineering IndustriesPRICE Rs. 38,000
WEIGHT 270 kgsCAPACITY 300 loaves per hour
Capable of slicing bread upto 25 cm long
45

7.) FREEZER
NAME Freezer
QUANTITY PURCHASED 2
SUPPLIER KPM Industries
PRICE Rs. 16,400
WEIGHT 300 kgs
46

8.) MIXER GRINDER
NAME Mixer Grinder
QUANTITY PURCHASED 1
SUPPLIER Local Shop
PRICE Rs. 3,600
47

9.) ROLLING RACKS
NAME Rolling Racks
QUANTITY PURCHASED 6
SUPPLIER KPM Industries
PRICE Rs. 7500
CAPACITY 7 storey
48

10.) TRAYS
NAME Trays
QUANTITY PURCHASED 100
SUPPLIER KPM Industries
PRICE PER UNIT Rs. 200
49

11.) STAINLESS STEEL UTENSILS AND TOOLS
NAME Stainless steel utensils
SUPPLIER Local Shops
PRICE Rs.83,400
50

PROCESS
BREAD:
51
PACKAGING
SLICING
COOLING
BAKING
PROOFING
SHAPING
PRE-SHAPING
MIXING

Starter Often referred to as sourdough, this is a pre-made mixture of flour water and naturally occurring yeast. A portion of the starter from the previous day is included in the next day’s starter. The starter is a continuous and dynamic mixture. It is allowed to develop until it has reached itsmaturity for many hours and then it is included in the mixing process.Starter imparts a sour flavor and develops a distinctive crust.
MixingIn the mixing step the ingredients of the recipe are incorporated into a homogeneous mixture and then developed. This is a two stage process.
First everything (flour, water, salt and leavening) is mixed together and water is added gradually on a low speed. After the appropriate amount of water is added the second stage of gluten formation and development begins.
In gluten development, or strength, the gluten is formed by the combining of the water and protein in the flour. The gluten is developed by the stretching and folding of the strands (or kneading). Gluten development becomes the foundation and structure for the bread. Here begins the first fermentation stage. (fermentation
is the conversion of carbohydrates (sugars) to alcohol and CO2) At this point the dough will spring back when touched.
Pre shape
In this step the dough is given a shape and divided into proportional sizes
52

In our process we shape all loaves first into rounds. Here some of the developing gas is worked out by hand. Once rounded the dough is allowed to rest. Generally we cover the dough to keep from drying and crusting over. In our case the resting is usually 10-20 minutes.
ShapingOnce the dough is relaxed the final shape is given.
Here the excess gases are expelled very gently by pressing and squeezing the dough by hand. The expulsion of the gases makes for a more uniform loaf of bread and less air pockets. By expelling the gases the fermentation process is also rejuvenated and slightly accelerated. Once shaped, the dough is placed on flour lined pans or boards.
ProofingAt this point fermentation is allowed to take its course in a warm and humid atmosphere while the dough is covered.
This type of proofing, combined with other details of the bread making process, gives our bread its uniqueness, depth of flavor and crispy crust. Here the dough ferments (or rises) to a desired volume and consistency. Ideally the dough should be soft and slightly pliable. If pushed with a finger it should leave an impression.
53

BakingDuring the initial baking there is a tremendous burst of gas that occurs called oven spring.
To allow for controlled tearing the bakers score (make cuts to) the loaves. The cuts create a weak area for the expansion to occur. This is where the final result can be experienced. The sight of warm fresh baked bread being pulled from the oven, the smell of freshly baked bread and the sound of the crackling crust is where the results of all the hard work are realized.
Cooling The bread formed is then allowed to cool for some time.
PackingThe ready bread is then packed and wrapped. The seal and logo of the firm is imprinted on the packing. Thus the final product is ready to be sold.
54

TOAST :
The process for making toast starts with bread as the raw material.
Cut the slices of bread in the desired shape of toasts. Butter it up liberally Add salt and pepper to taste Pour hot milk over the toast Let all that soak in.
The toasts are ready. After proper packing, they are ready to be sold
KHARI :
Rub solidified ghee into flour till crumbly. Make a well in center. Add salt in it. Add 1 cup of cold water and mix well till dough is formed. Use more water if
required, to make a soft dough. Knead for 3-4 minutes till smooth. Keep aside covered for 10 minutes. Roll into a rectangle, of the desired size, with help of dry flour for dusting. Dust
away excess flour. Spread fat over the rectangle keeping a 0.5” margin all around. Roll rectangle into a tight roll, pressing sides to keep ghee inside intact. Dust liberally with dough, place in freezer for 15 minutes. Remove, roll back to a
rectangle. Brush with very little ghee. Fold one-third of the outer portion onto the central portion. Brush with flour, return to chiller for 15 minutes. Roll again, cut into desired shapes (rectangle, triangle, etc.).
55

Place on a greased baking sheet, brush with ghee. Place in a preheated oven at 200 degree Celsius for 15 minutes. Reduce thereafter to minimum (50C or lower) for 10 minutes to allow drying out. Remove place on racks till fully cooled, before storing in airtight container.
OUR PRODUCTS
BREADS
WHITE BREAD
BROWN BREAD
WHITE CORIANDER BREAD
56

TOMATO SPINACH BREAD
BUNS
PAV
DABELI
57

PIZZA
CREAM ROLLS
58

TOASTS
59

KHARI
60

TEA CAKES
TUTTI FRUITY
61

CHOCOLATE
62

HUMAN RESOURCE FEASIBILTY
ORGANISATION CHART
63

64
PARTNERS
FACTORY MANAGER
PRODUCTION SUPERVISOR
MASTER BAKER
UTILITY WORKERS
FINANCE MANAGER
ACCOUNTANT
MARKETING MANAGER

JOB ANALYSIS
Job analysis includes mainly two things:
1) Job description
Job description is the process by which organization ensured that it has right number and kind of people at the right place and capable of effectively and efficiently completing the task at hand. It describes the functions, duties to be performed and responsibilities of the job holder.
2) Job specification
Job specification states the minimum acceptable qualification that the candidate must possess to perform the job successfully. Job specification identifies the knowledge, skills and abilities to do the job effectively.
65

1. Production Supervisor
66
Job Description:
Job Title : Production Supervisor
Reporting to : Supervisor, Production Department
Function :
To achieve production targets in specific period.To arrange manpower &other sources for production.Planning, have control over the process & check the deviation.To co-operate with administrative department for implementation of
policies & plans.
Duties, Responsibilities & Authorities:
Responsible for production schedules & arrangement of labors. Regular check of stock, purchase, manpower condition.
Job Specification:
Education: Graduate in mechanical engineer from reputed institute
Skills & Requirement:
Capable of leading team of workers. Good communication skills & ability to undertake work from
subordinates.

2. Finance manager
3. Supervisor
67
Job Description:
Job Title: Finance manager
Reporting to: Supervisor
Function:
To make proper policies for condition of companyTo provide appropriate rate of depreciation reserve & surplusTo ascertain budgets for all plans & projectsTo decide upon investment of funds of the company
Duties, Responsibilities, & authority:
To check discrepancies in company’s financial resources To ensure optimum & fare use of company’s financial resources To co-ordinate well with an accountants & director. Analyze financial position of regular intervals.
Job Specification:
Job Title: Finance manager
Education: MBA with finance/CA
Skills Requirements:
Sharp & Speedy in calculation Good analytical skill Division making ability Physical health: Smart & fit
Experience: At least 5 years in similar role.

68
Job Description:
Job Title : Supervisor
Reporting to : Factory Manager
Function :
To perform work efficiently given by production manager.To supervise production process.To give suggestion for better quality of production.To instruct skilled, unskilled labors for effective work.
Duties, Responsibilities & Authorities:
Check daily performance of labors. Responsible for non performance of work of skilled & unskilled
labors.
Job Specification:
Job Title: Supervisor.
Education: Qualified from Industrial Training Institue
Skills & Requirement:
Good relations with workers. Physical Health: Good temperament, Co-operation.
Experience: minimum 2 years.

4. Worker
69
Job Description:
Job Title : Worker
Reporting to : Production Manager
Function :
To perform work efficiently given by supervisor. To work with co-operation.
Duties, Responsibilities & Authorities:
Follow instruction of supervisor. To inform manager immediately for any kind of default.
Job Specification:
Job Title: Worker.
Education: S.S.C or H.S.C. pass
Skills & Requirement:
Technical knowledge about their work and machines should be able to do the job assigned to them.
Physical Health: Capable of working at least 8 hours.
Experience: Not necessary
5. Marketing Manager
70
Job Description:
Job Title : Marketing Manager
Reporting to : Director
Function :
To decide advertising plan & promotional plans. To act as bridge between company & customer.
Duties, Responsibilities & Authorities:
To decide & achieve the target. Responsible for any customer or dealer’s complaint about his
service.
Job Specification:
Job Title: Marketing Manager.
Education: Graduate.
Skills & Requirement:
Knowledge of surrounding market. Should have innovative ideas
Physical Health: Good presence of mind &Good co operation.
Experience: Minimum 1 year in relevant field or fresher can also apply.

6. Peon
7. Security Guard
8. Driver
71
Job Specification
Job Title : Peon Education : S.S.C. or H.S.C Physical health : Healthy Mental Ability : The candidate should be of sound mind.
Job Specification
Job title : Security Guard Education : S.S.C. or H.S.C. & having security training Physical & health : Healthy, polite & able to convince. Special Ability : He should be strong enough to stop any
stranger to the premises. Guard the place from thieves.
Job Specification
Job title : Driver Education : S.S.C. Physical health : Physically fit, good eyesight and no addiction.

AMENITIES TO EMLOYEES.
Following amnesties shall be provided to the workers at the factory:
I. Drinking water:
Effective arrangements have been made to provide wholesome drinking water for all the employees. Drinking water coolers have been established at different spots within the factory.
II. Lavatory:
There are clean lavatories separate for males and females conveniently situated within the building.
III. First Aid:
Adequate first aid kits have been provided for all the employees to avoid unforeseen mishaps and accidents during operations.
IV. Provision for lunch:
Since the shift requires continuous 8 hours of work, afternoon lunch and evening tea shall be provided to all the employees at reasonable affordable prices.
72

MARKETING FEASIBILITY
73

MARKETING MIX
74
MARKETING MIX
PRODUCT
PROMOTION
PRICE
PLACE

PRODUCT
The product is the heart of the marketing exchange. Customers buy product to solve problems or enhance their lives and thus the marketer has to ensure that the product can fully satisfy the customers, not just in functional terms but also in psychological terms.
“A product is physical good, service, idea, person or place that is capable of offering tangible and intangible attributes that individuals or organization regard as to necessary, worthwhile or satisfied that they are prepared to exchange money, patronage or some other unit of value in order to acquire it.”
In this report, our products are breads and buns, cream rolls, toasts and khari and tea cakes.
75

PRODUCT LEVEL
76
POTENTIAL LEVEL
AUGMENTED LEVEL
EXPECTED LEVEL
BASIC PRODUCTCORE
BENEFIT

PRODUCT LEVEL CHART FOR BAKERY
CORE BENEFIT
Core benefit includes the benefit that the product provides to the customers to satisfy their needs.
To satisfy hunger
BASICPRODUCT
In the basic product the marketer has to turn the core benefit into a basic product. This is the actual tangible item that people purchase.
Bakery products like Breads
Toasts/ Khari
Tea cakes
Cream rolls
EXPECTED PRODUCT
At this level, the marketer prepares an expected product, a set of attributes and conditions buyers normally expect when they purchase this product.
Good taste
Good quality
Varieties
Purity and no adulteration
Attractive packaging
AUGMENTED PRODUCT
This is the non tangible elements that are perhaps provided in addition to the physical parts. The marketer prepares an augmented product that exceeds customer expectations. Brand positioning & competition takes place at this level.
Diet products
Sugar free or low calorie products
Free home delivery
POTENTIAL PRODUCT
At this level, the potential product encompasses all the possible augmentation and transformations.
The product or offering might undergo future.
Mix flavour bread having different flavours in the same slice
Breads and butter-jam-cheese-chopped vegetables-ketchup in
77

the same packet
PRICEThe price is the only component in the mix that generates revenue, while other components generate costs.
Price means consideration of any goods or services that a customer paid to the producer.
78

To a manufacturer, price represents the quality of money received by the firm on sales of its products. To a customer, it represents monetary scarifies and hence his perception of the value of the products.
Depending on the objective, the bakery can set the prices. As far as bakery is concerned, it has the objective of the selling its products to the consumer at reasonable price and offer good quality.
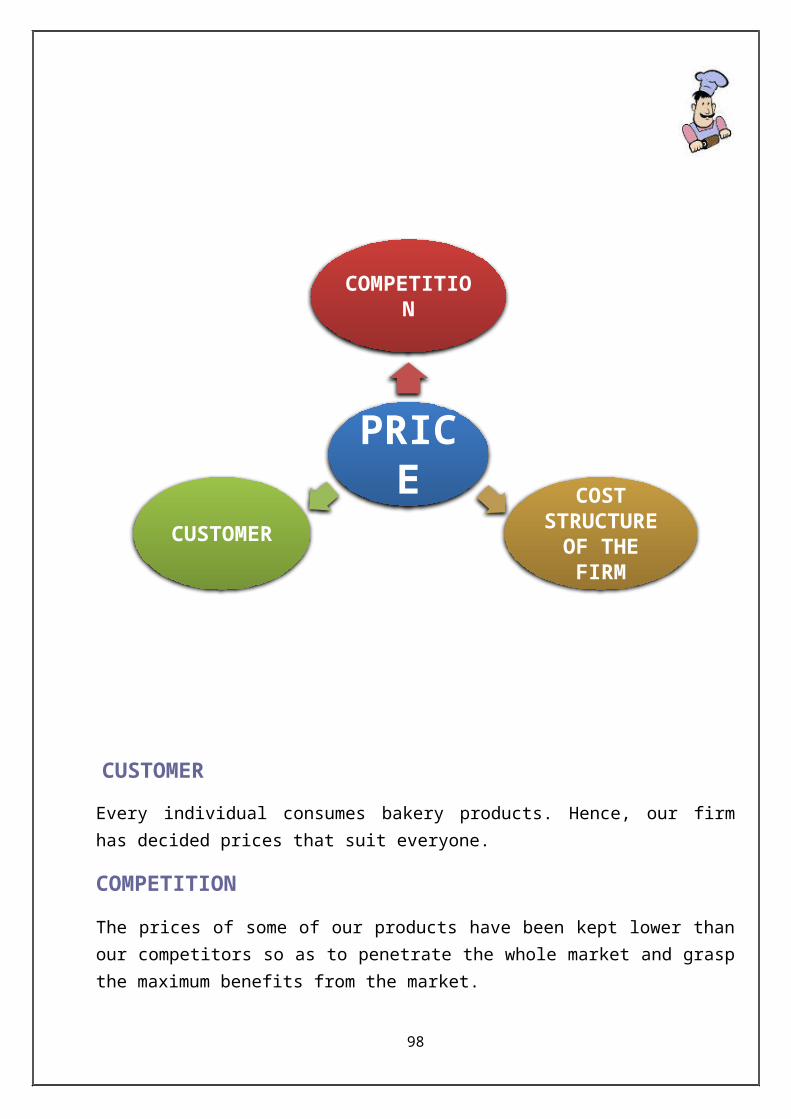
In order to arrive at an acceptable price level, the manufacturer needs to have the information on the 3 C’s namely Customer, Competition and Cost structure of the firm.
CUSTOMER
79
PRICE
COMPETITION
COST STRUCTURE
OF THE FIRMCUSTOMER

Every individual consumes bakery products. Hence, our firm has decided prices that suit everyone.
COMPETITIONThe prices of some of our products have been kept lower than our competitors so as to penetrate the whole market and grasp the maximum benefits from the market.
COST STRUCTURE OF THE FIRMAn optimum cost structure has been adopted that enables the firm to earn a reasonable profit and minimizes wastage of resources and losses. We have priced our product somewhere near the prices of the competitors considering the following objectives:
Survival:
As we shall face intense competition survival in the market is our short-term objective. In the long run, we shall work for new innovative varieties offering our customers wider choices.
Maximization of market share:
Our long-term objective is to become a role player in this market. We shall try to achieve this by charging less than our competitor’s price.
80

PLACE81
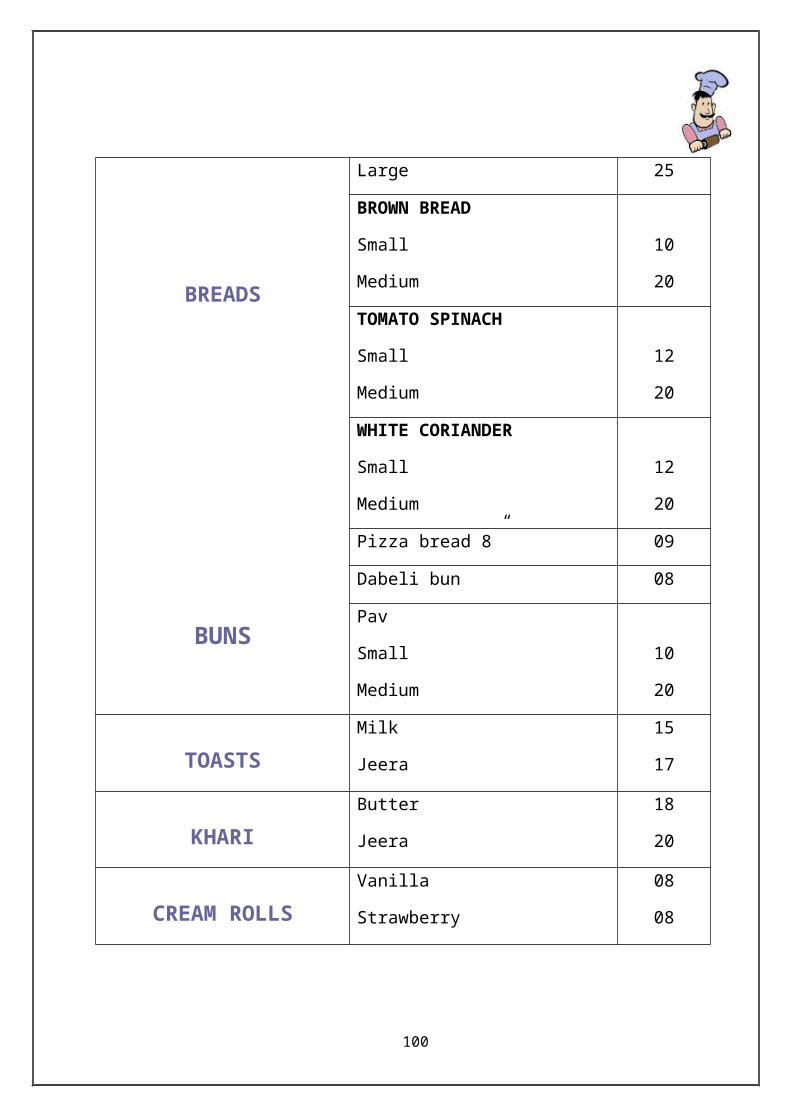
ITEM VARIETY PRICE
BREADS
BUNS
WHITE BREAD
Small
Medium
Large
09
15
25
BROWN BREAD
Small
Medium
10
20
TOMATO SPINACH
Small
Medium
12
20
WHITE CORIANDER
Small
Medium
12
20
Pizza bread 8” 09
Dabeli bun 08
Pav
Small
Medium
10
20
TOASTSMilk
Jeera
15
17
KHARIButter
Jeera
18
20
CREAM ROLLSVanilla
Strawberry
08
08

The location of the plant is a very important aspect in economic analysis of any project as it plays a vital role in continuing life of the business as in future. The firm has to leverage the advertisement while operating with location of plant as the biggest constraint.
Location of plant and industry means a specific site in the region where the business units is to be started for selecting location or the pertinent factors influencing the location have to be considered and weighted out very carefully.
Place: Ahmedabad
Address: Phase-2, GIDC, Changodar,
Ahmedabad.
Why have we chosen Ahmedabad?•Native place•An emerging mega city•Easy availability of building•To create the brand image•Easily accessible location.
Area: 3600 sq. feet.
Distribution channel:
It means the channel through which goods passed from source to destination that is from manufacture to retailer.
Company should pay attention to how the product is distributed. They should have proper distribution channel so that consumers may get rid of the problems regarding unavailability of the product.
Our firm uses the following distribution channel
82

The ready bakery goods are distributed to grocery stores and supermarkets having our dealership. These stores then make the final sale to the consumers.
PROMOTION
83
FACTORY
DEALERS i.e.
SUPERMARKETS AND GROCERY
STORES
CUSTOMERS
Promotion is the part of the marketing mix that many people consider to be "marketing" but this is really the end result of all your hard work in defining products to satisfy needs and pricing it accordingly.
Promotion decisions are those related to communicating and selling to potential consumers.
The success of any business entity depends on how well it has been able to create awareness about its products or services in its target segment so as to induce its consumption by customers.
Promotion is the marketing communication.
There are traditionally 5 promotional tools:
1. Advertisement2. Sales Promotion3. Public relation4. Direct marketing5. Personal Selling
Our firm shall use advertisement tools to create awareness among the public, about our products and the bakery.
ADVERTISEMENTAdvertising is used to build up a long-term image for a product and can reach geographically dispersed buyers.
Advertisement is an informal way of communication which induces customers to buy the product and services and which also creates awareness among consumers.
Types of advertisement:
(a) Informative advertisement : - Informative advertisement is that from which the consumer gets the necessary information about our products and other relevant details.
(b) Influential advertisement : -Influential advertisement shall influence the customers to buy our products.
84

5 M’s OF ADVERTISING
85
ADVERTISING
MONEY
MISSION
MESSAGEMEDIA
MEASUREMENT

1. MISSION:
It is all about setting the advertisement goal in the initial stage.
We have printed information brochures that includes list of our products and varieties, commission rates, terms of sale etc. These shall be distributed to the grocery stores and supermarkets to make them aware of our firm and products and generate their interest in dealership.
Apart from these we shall also advertise by putting up floor signboards at banners at our distributor stores to catch the eye of the public and create awareness and interest about our products.
2. MONEY:
Deciding on the advertising budget
We have considered the following factors while deciding our advertising budget:
a) Stage in life cycle: In the initial stage, our advertising budget is high because we want to introduce our product to the customers and dealers. Afterwards, it will be low compared to the first year.
b) Market share and consumer base: When the firm covers enough market shares, it will require less marketing budget because it will have a set of loyal buyers and recognition in the market.
c) Competition: in the initial stage, we shall face good competition from the well established players in the market, such as Modern breads, Brittannia, Havmor. Therefore, we shall have to advertise more in order to get some public attention.
d) Advertising frequency: When advertising frequency is high, advertising budget will be high and when it is low, required money will be less.
86

3. MESSAGE:
Our message is to give the customer such a delicious taste that they don’t forget hence truly ‘An unforgettable taste’
4. MEDIA:
It includes the decision regarding media vehicles, deciding on media timings and deciding on geographical allocation. Major media types are print media which includes pamphlet, newspapers, hoardings, magazines and television media
Our firm prints pamphlets 4 times in a year to be distributed along with the vernacular newspaper in the areas in which we have tie-ups with the stores.
5. MEASUREMENT
Our company tries to measure the communication effect of an advertisement – that is, its potential effect on awareness, knowledge or preference.
MARKET RESEARCH87

Managers need information in order to introduce products and services that create value in the mind of the customer. But the perception of value is a subjective one, and what customers’ value this year may be quite different from what they value next year. As such, the attributes that create value cannot simply be deduced from common knowledge. Rather, data must be collected and analyzed. The goal of marketing research is to provide the facts and direction that managers need to make their more important marketing decisions.
To maximize the benefit of marketing research, those who use it need to understand the research process and its limitations.
Marketing Research vs. Market Research These terms often are used interchangeably, but technically there is a difference.
Market research deals specifically with the gathering of information about a market's size and trends. It is directed towards a very specific i.e. particular market area,
Marketing research covers a wider range of activities.
While it may involve market research, marketing research is a more general systematic process that can be applied to a variety of marketing problems. It is concerned specifically about marketing process.
Marketing research can be further expanded into two specific domains: consumer-related marketing research and business-to-business marketing (B2B) research.
I. PROBLEM IDENTIFICATION AND DEFINITION
88

This is the introductory phase of the marketing research process. Basically, it involves a clear and precise understanding of the problem at hand. It is crucial that the research team identifies, understands and defines the problem in its entire capacity, as it affects all the subsequent activities involved in the research process. Research teams make use of customer feedback, internal and external data reports, sales graphs, purchasing patterns, etc. to come up with an accurate problem definition.
Problem statement:
The problem statement of this research is to analyze the determinants of the consumer behaviour like income, lifestyle etc. regarding the consumption pattern of bakery products so as to give us a better understanding of the trends of the market.
II. DEVELOPING YOUR APPROACH
Once your problem is better defined, you can move onto developing your approach. Generally speaking, your approach should be developed almost exclusively around a defined set of objectives. This stage includes decisions on the data sources, research approaches, research instruments, sampling plan, and contact methods.
DATA SOURCES
The researcher can gather secondary data, primary data, or both.
Secondary data are data that were collected for another purpose and already exist somewhere.
Primary data are data freshly gathered for a specific purpose or for a specific research project.
Researchers use secondary data to see whether the problem can be partly or wholly solved without collecting costly primary data. When the needed data do not exist or are dated, inaccurate, incomplete, or unreliable, the researcher will have to collect primary data.
The primary source used in our project is surveys each for dealer & consumers.
The secondary data source was the information collected from dealers in the form of pamphlets, internet, marketing books and newspaper articles.
RESEARCH APPROACHES
89

This process mainly involves a lot of field-related work activities such as outdoor interviews, survey campaigns
The instrument used in this project is survey research method.
SURVEY RESEARCH
Surveys are best suited for descriptive research.
Organizations undertake surveys to learn about people’s knowledge, beliefs, preference and satisfaction. Generally questionnaires are used for this.
We have drafted separate questionnaires each for consumers and manufactures of the bakery products, to understand the demand and supply pattern of the bakery industry. Our questionnaire consisted of both open-ended and close-ended questions and covered various decision-making parameters like income, preferences etc.
SAMPLING PLAN
This includes deciding four areas namely:
1. Sampling unit: Who is to be surveyed?
The marketing researcher must define the target population that will be sampled. We have surveyed the people of Ahmedabad city as it is our resident place.
2. Sample size: How many people should be surveyed?
In our survey the primary information is collected through a sample size of 600 consumers and 5 bakeries
3. Sampling procedure: How should the respondents be chosen?
In this project, convenience sampling has been used.
CONTACT METHOD.
The marketing researcher must decide how to contact the subjects: by mail, by telephone, in person or online.
For this research, personal interviews and face-to-face conversations were used as the contact methods.
90
III. COLLECTION OF DATA.Often called data collection or survey fielding, this is the point at which the finalized questionnaire (survey instrument) is used in gathering information among the chosen sample segments.
Finally over a period of time, the data was properly assembled and arranged for analyzing.
IV. ANALYZE THE INFORMATION.The last step is to analyze the information collected in the previous step & present the finding and solutions to our problem statement.
For this, we used mathematical tools such as graphs, summations and percentages. Microsoft Excel was used extensively for the diagrammatic and graphic presentation of data.
91

ANALYSIS
92

Q.1. Approximate monthly family income (in Rs.) :
□ Below 5000 □ 5000 to 15000 □ 15000 to 25000 □ Above 25000
MONTHLY INCOME NUMBER OF RESPONDENTSBELOW 5000 52
5000 TO 15000 18815000 TO 25000 196ABOVE 25000 164
GRAND TOTAL 600
Below 5000; Series1; 52; 9%
5000 to 1500031%
15000 to 25000;
Series1; 196; 33%
Above 2500027%
Distribution of respondents as per income
We can see that majority of the respondents surveyed have annual family monthly income between Rs. 15000 to Rs 25000 i.e. 33%, closely followed by the respondents having annual monthly family income of Rs. 5000 to Rs. 15000, 31%.
93

Q.2. Which of the following bakery products you use ?
□ Breads □ Toasts/ Khari □ Biscuits/ Cookies □ Chocolates □ Cakes/ Pastries □ Other. Please specify______
BAKERY PRODUCTS NO. OF RESPONDENTSBREADS 440
TOASTS/ KHARI 400BISCUITS/ COOKIES 424
CHOCOLATES 398CAKES/ PASTRIES 340
OTHERS 10TOTAL 600
424400
440
398
340
10
DISTRIBUTION OF RESPONDENTS AS PER PRODUCT CONSUMED
Majority of our respondents consume breads among the bakery products, closely followed by biscuits and toasts. Whereas very few respondents lie in other category which includes cream rolls, puffs etc.
94

Q.3. Do you have preference for egg-less bakery products?
□ Yes □ No
PARTICULAR NUMBER OF RESPONDENTSYES 456NO 144
TOTAL 600
YES77%
NO23%
Distribution of respondent as per preference for egg-less products
A large number of the surveyed respondents i.e. 77% have preference for egg-less products while only 23% of the surveyed respondents do not have any such preference.
95

Q.4. Your demand for the following bakery product is:
Demand based Need based (On regular basis) (As and when needed)
1) Breads □ □2) Toast / Khari □ □3) Biscuits/Cookies □ □ 4) Cakes/ Pastries □ □5) Chocolates □ □6) Any other □ □
PRODUCTSNUMBER OF RESPONDENTSREGULAR NEED
BREAD 294 228TOAST 276 276
BISCUIT 376 168CAKES 76 464
CHOCOLATES 230 316OTHER 8 2
Bread; REG-ULAR; 294 Toasts; REG-
ULAR; 276
Biscuits; REG-ULAR; 376
Cakes; REG-ULAR; 76
Chocolates; REGULAR; 230
Others; REG-ULAR; 8
Bread; Need Based; 228
Toasts; Need Based; 276
Biscuits; Need Based; 168
Cakes; Need Based; 464
Chocolates; Need Based;
316
Others; Need Based; 2
DISTRIBUTION OF RESPONDENTS AS PER THE TYPE OF DEMAND
REGULAR Need Based
The above chart shows that bread and biscuits are such bakery product that are consumed on a regular basis i.e. demand based. On the other hand, products like cakes and chocolates, are consumed only when needed and not on a regular basis.
96

Q.5. How did you come to know of this bakery?
□ TV Ad □ Newspapers □ Radio □ Hoarding/Signboard □ Internet □ Friends/ Relatives □ Pamphlets □ Any other
SOURCE OF INFORMATION NUMBER OF RESPONDENTS
T.V. ADVERTISEMENTS 84HOARDINGS/SIGNBOARD 84
NEWSPAPER 88RADIO 24
INTERNET 52PAMPHLETS 52
FRIENDS 346OTHERS 44
TV Ad; Series1; 84;
11%
Hoarding; Series1; 84;
11%
Newspapers; Series1; 88; 11% Radio; Series1; 24; 3%
Internet; Series1; 52;
7%Pamphlets; Series1; 52;
7%
Friends; Series1; 346;
45%
Others; Series1; 44;
6%
DISTRIBUTION OF RESPONDENTS AS PER SOURCE OF INFORMATION
TV Ad Hoarding Newspapers Radio Internet Pamphlets Friends Others
Majority of the respondents surveyed (45%) came to know of the bakery through friends & relatives. TV ads, newspaper & hoardings are the second source of information for the customers with approximate contribution of 11% each.
97
Q.6. Why do you prefer this bakery?
□ Near location □ Good quality □ Affordable prices □ Variety in products □ Brand loyalty □ Any other
REASON FOR PREFERANCENUMBER OF
RESPONDENTSNEAR LOCATION 248GOOD QUALITY 388
PRICES 140BRAND 176
VARIETY 180
Near local area; Series1;
248; 22%
Good quality; Series1; 388; 34%
Prices; Series1; 140;
12%
Brand; Series1; 176;
16% Variety; Series1; 180; 16%
DISTRIBUTION OF RESPONDENTS AS PER REASON OF PREFERENCE
Maximum respondents i.e. 34% prefer purchasing from their respective bakery because of the good quality offered whereas 22% of the respondents prefer the bakery due to near location in their neighborhood.
98

Q.7. Do you buy more bakery products during special occasions and festive seasons? □ Yes □ No
ADDITIONAL PURCHASE
NUMBER OF RESPONDENTS
YES 302NO 298
GRAND TOTAL 600
Yes; Series1; 302; 50%
No; Series1; 298; 50%
DISTRIBUTION AS PER ADDITIONAL PURCHASE DUR-ING FESTIVALS
Our survey reveals that there is an equal distribution between the respondents who purchase more during festive season and those who don’t. Different varieties of biscuits, cookies, chocolates and pastries are among those products whose sales increase during festive seasons like Diwali and Christmas.
99
Q.8. Are you satisfied with the current prices of the bakery products?
□ Yes □ No
PARTICULAR NUMBER OF RESPONDENTS
YES 526NO 74
TOTAL 600
YES88%
NO12%
DISTRIBUTION OF RESPONDENTS AS PER SATIS-FACTION WITH PRICES
It can be clearly seen that, 88% of the respondents surveyed are satisfied with the current prices of the bakery products. 12% of the sample size feels that the prices of certain products like cakes and pastries are high and should be reduced.
Q.9. Would you like to try a new bakery?
100

□ Yes □ No □ Not thought of
PARTICULARNUMBER OF
RESPONDENTSYES 152NO 250
NOT THOUGHT OF 198GRAND TOTAL 600
YES25%
NO42%
NOT THOUGHT OF33%
DISTRIBUTION OF RESPONDENTS AS PER WILLIGNESS TO TRY A NEW BAKERY
Our survey reveals that 25% of the persons surveyed are willing to try a new bakery, while 33% of the sample size have not yet thought about it.
101

FINDINGS AND CONCLUSIONSThe findings from our survey can be listed as:
The demand and consumption for breads is highest among the other bakery products. Hence we have decided to manufacture bread as our key product and offer different varieties to create a brand differentiation.
In Ahmedabad, people prefer egg-less products. Hence no product of ours shall contain eggs.
Good quality of the product is the chief requirement of the customer during purchase, whereas near location and prices occupy a secondary place. Therefore our firm shall concentrate on keeping high quality standards. We shall cater to the guidelines of The Bureau of Indian Standards Act, 1986.
LIMITATIONSOur survey faced certain limitations such as:
The survey is limited to only 600 people of the city of Ahmedabad. The trends stated here may differ in different cities and sample population.
Some of the respondents are reluctant in answering certain questions such as income, leading to a bias in our findings.
102

FINANCIALFEASIBILITY
A STATEMENT SHOWING COST OF PROJECTSR. NO PARTICULAR AMOUNT (in Rs.)
1. Land 16428002. Building 2340000
103

3. Machinery 8793004. Furniture & Fixtures 122100
5. Equipments 3629006. Vehicles 4940007. Preliminary expenses 56800
8. Pre-operative Expenses 1205009. Working Capital 138215
10. Reserves for contingency 61565
TOTAL COST 6218180
MEANS OF FINANCENO. PARTICULAR AMOUNT1. Partners’ capital (50%) 30475252. Secured loans (50%) 31090903. Reserve and surplus 61565
TOTAL 6218180
Note: 1 Cost of Land
No. Particular Amount1. Basic Cost of Land 1480000
104

2. 1% Commission of Agent 14800
3. Stamp duty @ 10% 148000
TOTAL 1642800
Note: 2 Cost of Construction
No Particular Area(in sq. feet) Amount1. Production area 1813 13139502. Storage area 300 2305003. Administrative office 375 3217504. Water room & wash room 244 1746005. Finished goods storage 300 2375006. Loading Dock 168 1097007. Parking space 150 525008. Security cabin 56 274009. Open land 194 102600
TOTAL 3600 2340000
Note: 3 Machinery
No. Particular Quantity Price Amount1 Deck oven 1 264000 2640003 Dough mixer 3 46500 1395004 Dough molder 2 42350 847005 Sugar grinder 1 35000 350006 Packing machine 2 47650 953007 Toast slicer/bread slicer 2 38000 760008 Freezer 2 16400 328009 Mixer 1 3600 360010 Rolling racks 6 7500 4500011 Trays 100 200 2000012 Stainless steel
utensils/tools/equipment knives- - 83400
TOTAL 879300
Note: 4 Cost of Furniture
No. Particular Quantity Price Amount1 Sofa Set 2 10400 20800
105

2 Revolved Chairs 4 1500 60003 Comfort Chairs 8 950 76004 Office desk 3 3000 90005 Office Cupboard 1 8000 80006 Cabinet 1 11300 113007 Working table 1 9000 90008 Dustbin 4 100 4009 Air Conditioner 1 25000 2500010 Lights 50 40 200011 Fans 10 1200 1200012 Exhaust Fans 4 1500 600013 Others 5000
TOTAL 122100
Note: 5 Cost Of equipments
No. Particular Quantity Price Amount1 Computer 3 23900 717002 Telephone instruments 2 600 12003 Fire extinguisher equipment 3 5000 150004 Generator 1 25000 275000
TOTAL 362900
Note: 6 Cost Of Vehicle
No. Particular Quantity Price Amount1 Tempo 2 247000 494000
TOTAL 494000
Note: 7 Preliminary Exp.
No. Particular Amt.1 Licence Fees 350002 Registration Fees (1%) 14800
106

3. Partnership deed 7000TOTAL 56800
Note: 8 Pre-operatives Exp.
No. Particular Amount1 Market Survey Exp. 25002 Connection Charges
1) A.E.C. (Three phase)2) Electricity connection charges
3) Plumbing4) Telephone charges
5) Gas pipe line charges
480001850090002500
40000
TOTAL 120500
DEPRECIATIONPARTICULARS 1ST 2ND 3RD YEAR 4TH 5TH
107

YEAR YEAR YEAR YEARMACHINERIES 15%Op balance 879300 747405 635294 540000 459000Less: depreciation 131895 112111 95294 81000 68850Closing balance 747405 635294 540000 459000 390150BUILDING 10%Op balance 2340000 2106000 1895400 1705860 1535274
Less: depreciation 234000 210600 189540 170586 153527Closing balance 2106000 1895400 1705860 1535274 1381747FURNITURE 10%Op balance 122100 109890 98901 89011 80110Less: depreciation 12210 10989 9890 8901 8011Closing balance 109890 98901 89011 80110 72099VEHICLE 40%Op balance 494000 296400 177840 106704 64022Less: depreciation 197600 118560 71136 42682 25609Closing balance 296400 177840 106704 64022 38413COMPUTERS 60%
Op balance 71700 28680 11472 4589 1836Less: depreciation 43020 17208 6883 2753 1101Closing balance 28680 11472 4589 1836 735Total depreciation
618725 469468 372743 305922 257099
Add Tempo -------- -------- 247000 148200 88920Less: depreciation -------- -------- 98800 59280 35568Closing balance -------- -------- 148200 88920 53352
TOTAL DEPRECIATION
618725 469468 471543 365202 292667
SALARYParticular
sNo. Monthl
y salary1ST
YEAR2ND
YEAR3RD
YEAR4TH
YEAR5TH
YEARFactory 1 13000 15600 156000 156000 163800 163800
108

manager 0Finance manager
1 13000 156000
156000 156000 163800 163800
Accountant 1 10000 ----------
120000 120000 120000 126000
Marketing manager
1 13000 156000
156000 156000 163800 163800
Production supervisor
1 8000 96000 96000 96000 100800 100800
Master baker
1 4500 54000 54000 54000 54000 54000
Utility workers
Varies
3500 210000
210000 420000 420000 546000
Drivers 2 3000 72000 72000 108000 110160 110160Security guard
1 3000 36000 36000 36000 37080 37080
Peon 1 3000 36000 36000 36000 37080 37080Total 13 64000 97200
0109200
0133800
0137052
0150252
0
BONUSParticulars No 1ST
YEAR2ND
YEAR3RD YEAR 4TH
YEAR5TH
YEARFactory manager
1 13000 13000 13000 13650 13650
Financial manager
1 13000 13000 13000 13650 13650
Marketing manager
1 13000 13000 13000 13650 13650
Accountant 1 ------ 12000 12000 12000 12600Production supervisor
1 8000 8000 8000 8400 8400
Master baker 1 4500 4500 4500 4500 4500Utility workers Varies 17500 17500 35000 35000 41000Drivers 2 6000 6000 9000 9300 9300Security guard 1 3000 3000 3000 3150 3150Peon 1 3000 3000 3000 3150 3150
Total 13 81000 93000 113500 116450 123050
FACTORY OVERHEAD EXPENSES109

PARTICULARS 1ST
YEAR2ND YEAR 3RD YEAR 4TH YEAR 5TH YEAR
SalaryFactory manager 156000 156000 156000 163800 163800Production supervisor
96000 96000 96000 100800 100800
Peon 36000 36000 36000 37080 37080Security guard 36000 36000 36000 37080 37080
BonusFactory manager 13000 13000 13000 13650 13650Supervisor 8000 8000 8000 8400 8400Peon 3000 3000 3000 3150 3150Security guard 3000 3000 3000 3150 3150
DepreciationMachinery 131895 112111 95294 81000 68850Building 234000 210600 189540 170586 153527
Insurance
Machinery 13190 11211 9529 8100 6885Building 4680 4212 3791 3412 3071Electricity charges 2,21,000 225694 285415 233598 235690Power and fuel 180000 205141 225984 226983 285741
Repairs and maintenance
Building 2340 2340 2340 2340 2340Machinery 8790 8790 8790 8790 8790
TOTAL 1146895 1131099 1171683 1101919 1041284
ADMINISTRATIVE OVERHEADS110

PARTICULARS 1ST
YEAR2ND YEAR 3RD YEAR 4TH YEAR 5TH YEAR
SalaryAccountant 120000 120000 120000 126000Finance manager 156000 156000 156000 163800 163800
BonusAccountant 12000 12000 12000 12600Finance manager 13000 13000 13000 13650 13650
DepreciationComputer 43020 17208 6883 2753 1101Furniture 12210 10989 9890 8901 8011Telephone 26000 17750 15310 21680 15650Stationery 5000 6550 6854 7045 7520Electricity charges 90000 92546 93568 94871 95862
TOTAL 345230 446043 433505 444700 444194
SELLING & DISTRIBUTION OVERHEADParticulars 1ST
YEAR2ND
YEAR3RD
YEAR4TH
YEAR5TH
YEARSalary
Marketing manager
156000 156000 156000 163800 163800
Driver 72000 72000 108000 110160 110160Bonus
Marketing Manager
13000 13000 13000 13650 13650
Driver 6000 6000 9000 9300 9300Depreciation of vehicle
197600 118560 169936 101962 61177
Fuel & maintenance of vehicle
155200 160580 165847 178450 182560
Advertisement 18500 20500 25000 25000 27000Commission on sales
175800 205150 226680 258100 269750
Insurance of vehicle
17290 15215 22034 16970 13481
TOTAL 811390 767005 895497 877392 850878
111

REPAYMENT OF LOANYear Principle
RemainingInstallment
PaidInterest Total Amt.
PaidBalance ofPrinciple
1st Year 3109090 621818 342000 963818 24872722nd Year 2487272 621818 273600 895418 18654543rd Year 1865454 621818 205200 827018 12436364th Year 1243636 621818 136800 758618 6218185th Year 621818 621818 68400 690218 _
TOTAL 3109090 1026000 4135090
STATEMENT OF INTEREST ON PARTNERS’ CAPITAL
Particular 1st Year 2nd Year 3rd Year 4th Year 5th YearOpening balance of capital
3047525 3136287 3581981 4063263 5027221
Add: Interest 182852 188177 214919 243796 301633Add: Profit 88762 445694 481282 963958 1091076
3319139 3770158 4278182 5271017 6419930Less: Interest (182852) (188177) (214919) (243796) (301633)
TOTAL 3136287 3581981 4063263 5027221 6118297
COST SHEET112

Particular 1st Year 2nd Year 3rd Year 4th Year 5th Year
Opening Stock of R.M. 0 30270 35200 38950 42150
Add:- Purchases 4540510 5297170 5853040 6664340 6964530Less:- Cl.
Stock of R.M. 30270 35200 38950 42150 45890Cost Of R.M. Consumed 4510240 5292240 5849290 6661140 6960790
Add:-Direct Labour 264000 264000 474000 474000 600000
Bonus 22000 22000 39500 39500 45500Prime Cost 4796240 5578240 6362790 7174640 7606290
Add:-Factory O.H. 1146895 1131099 1171683 1101919 1041284
Total Factory Cost 5722135 6709339 7534473 8276559 8647574Add:-
Office O.H. 345230 44604ss3 433505 444700 444194Cost of
Production 6067365 7155382 7967978 8721259 9091768Add:-
Opening stock of FG - 25870 27850 29950 30500Less:-
Closing Stock of FG 25870 27850 29950 30500 32950
Cost of Sales 6041495 7127532 7938028 8690759 9058818Add:- Selling & Distribution
Exp 811390 767005 895497 877392 850878Cost of
goods sold 6852885 7894537 8833525 9568151 9909696Add:- Profit 908115 1159813 1170975 1823089 1994674
TOTAL SALES
7761000 9054350 10004500 11391240 11904370
TRADING AND PROFIT & LOSS A/C113

Particulars 1st Year 2nd Year 3rd Year 4th Year 5th YearINCOME:-Cash Sales 7114250 8201750 8978600 10132840 10419370Credit Sales 646750 852600 1025900 1258400 1485000Total Sales Income 7761000 9054350 10004500 11391240 11904370Closing Stock of FG 25870 27850 29950 30500 32950Less:- Opening Stock of FG ------ 25870 27850 29950 30500Total Income 7786870 9056330 10006600 11391790 11906820Raw Material Consumed 4510240 5292240 5849290 6661140 6960790Direct Labour & Bonus 286000 286000 513500 513500 645500Factory Cost 781000 808388 886849 850333 818907Administrative Cost 290000 417846 416732 433046 435082Selling & Distribution Cost 613790 648445 725561 775430 789701Preliminary Expenses Written Off 35460 35460 35460 35460 35460Interest on Partners' Capital 182852 188177 214919 243796 301633Total Expenditure 6699342 7676556 8642311 9512705 9987073Gross Profit(PBDIT) 1087528 1379774 1364289 1879085 1919747Less:- Depreciation 618725 469468 471543 365202 292667PBIT 468803 910306 892746 1513883 1627080Interest- Long Term Loan @ 11% 342000 273600 205200 136800 68400PBT 126803 636706 687546 1377083 1558680Tax Paid @ 30% 38041 191012 206264 413125 467604
PAT 88762 445694 481282 963958 1091076BALANCE SHEET
114

Particulars Year 1 Year 2 Year 3 Year 4 Year 5
SOURCE OF FUNDS
Owners Funds 3136287 3581981 4063263 5027221 6118297Reserve & Surplus
61565 61565 61565 61565 61565
Bank Loan 2487272 1865454 1243636 621818 0TOTAL SOURCE OF FUND
5685124 5509000 5368464 5710604 6179862
APPLICATION OF FUNDS
Fixed AssetsLand 1642800 1642800 1642800 1642800 1642800Building 2340000 2106000 1895400 1705860 1535274Less: Depreciation
234000 210600 189540 170586 153527
2106000 1895400 1705860 1535274 1381747Machinery 879300 747405 635294 540000 459000Less: Depreciation
131895 112111 95294 81000 68850
747405 635294 540000 459000 390150Furniture 122100 109890 98901 89011 80110Less: Depreciation
12210 10989 9890 8901 8011
109890 98901 89011 80110 72099Vehicle 494000 296400 424840 254903 152941Less: Depreciation
197600 118560 169937 101962 61177
296400 177840 254903 152941 91764Computer 71700 28680 11472 4589 1836 Less: Depreciation
43020 17208 6883 2753 1102
28680 11472 4589 1836 734Other equipment
291200 291200 291200 291200 291200
TOTAL FIXED ASSETS
5222375 4752907 4528363 4163161 3870494
CURRENT ASSETS, LOANS AND ADVANCEInventory
115

Raw Material 30270 35200 38950 42150 45890Finished Goods 25870 27850 29950 30500 32950
Sundry Debtors 546750 850123 926540 1025360 1125460
Cash & Bank Balance 307583
410680 554151 1288113 2083908TOTAL CURRENT ASSETS
910473 1323853 1549591 2386123 3288208
LESS : CURRENT LIABILITIES AND PROVISIONCreditors 567564 652140 758410 852140 956840
Deferred Wages
22000 22000 22000 22000 22000
TOTAL CURRENT LIABILITY
589564 674140 780410 874140 978840
NET CURRENT ASSETS
320909 649713 769181 1511983 2309368
Miscellaneous Expenditure (To the extent not written off)
141840 106380 70920 35460 0
TOTAL APPLICATION OF FUNDS
5685124 5509000 5368464 5710604 6179862
CASH FLOW STATEMENT
116

Particular 1st year 2nd year 3rd year 4th year 5th yearCASH FLOW FROM OPERATING ACTIVITIES
PAT 88762 445694 481282 963958 1091076Interest 524852 461777 420119 380596 370033Tax Provision 38041 191012 206264 413125 467604Depreciation 618725 469468 471543 365202 292667Preliminary Expenses 35460 35460 35460 35460 35460CHANGES IN WORKING CAPITAL (13326) (225707) 24003 (8840) (1590)Tax Paid (38041) (191012) (206264) (413125) (467604)Net Cash Flow
From Operating Activities 1254473 1186692 1432407 1736376 1787646
CASH FLOW FROM INVESTMENT ACTIVITIESPurchase of Assets (5841100) ------ (247000) ------ ------Preliminary Activities (177300) ------ ------ ------ ------Net Cash Flow
From Investing Activities (6018400) ------ (247000) ------ ------
CASH FLOW FROM FINANCIAL ACTIVITIESCapital 3109090 ------ ------ ------ ------Term Loan Taken 3109090 ------ ------ ------ ------Repayment of Term Loan (621818) (621818) (621818) (621818) (621818)Interest on Loan (342000) (273600) (205200) (136800) (68400)Interest on Capital (182852) (188177) (214919) (243796) (301633)Net Cash Flow From Financial
Activities 5071510 (1083595) (1041937) (1002414) (991851)Total 307583 103097 143470 733962 795795Add:- Opening Balance 0 307583 410680 554151 1288113Closing Balance 307583 410680 554151 1288113 2083908
117

WORKING CAPITALNo. Particular Amount
1. Current AssetsA. Raw material requirement 30270B. W.I.P requirement ------C. Finished Goods requirement 25870
Debtors Requirement 546750
D. Cash Balance 124889Total Current Assets 727779
2. Current LiabilitiesA. Creditors 567564B. Deferred Wages 22000
Total Current Liabilities 589564
TOTAL WORKING CAPITAL 138215
118

RATIO ANALYSIS
PARTICULARS1st
year2nd
year3rd
year4th
year5th
yearPROFITABILITY RATIONet profit ratio (%)(Net profit/sales)100 1.14 4.92 4.81 8.46 9.17Operating ratio (%)(PBIT/sales)*100 6.04 10.05 8.92 13.29 13.67Cash profit ratio (%)[(PAT+depreciation)/sales]*100 9.12 10.11 9.52 11.67 11.62
EFFICIENCY RATIOFixed assets turnover ratioSales/fixed assets 1.49 1.91 2.21 2.74 3.08Total asset turnover ratio(Sales)/(total assets-misc.exp.) 1.27 1.49 1.65 1.74 1.66
SOLVANCY RATIOProprietor's ratio (%)Proprietor's fund/total asset-misc.exp*100 52.14 60.00 67.87 77.70 86.33
COVERAGE RATIOInterest coverage ratioPBIT/interest on debt 1.37 3.32 4.35 11.07 23.79LIQUIDITY RATIOCurrent ratioCurrent asset/current liabilities 1.54 1.96 1.99 2.73 3.36
TREND OF RATIOS119

1. NET PROFIT RATIO
Net Profit Ratio
Year
Perc
enta
ge
Interpretation:
The firm has continuously made profit for five years. It shows the firms capability to increases revenue from its business.
2.OPERATING RATIO120

Operating Ratio
Year
Perc
enta
ge
Interpretation:
Operating profit of the firm is continously increasing over the five years, but it dose not increase with more margins because of increses in revenues expenses in that years. But it does not decrease that also shows continously increament in revenue.
121

3.CASH PROFIT RATIO
Cash Profit Ratio
Year
Perc
enta
ge
Interpretation:
Cash profit of the firm is continously increasing in five years and it will help the firm to repay its loans and liabilites.
Cash profit increment also indicate that the firm has more source to earn cash revenue.
122

4. FIXED ASSETS TURNOVER RATIO
Fixed Assets Turnover Ratio
Year
Perc
enta
ge
Interpretation:
As the revenue is increasing year by year and the depreciation is written off the value of fixed assets reduces and thus there is an increase in the fixed asset turnover ratio.
123

5. TOTAL ASSETS TURNOVER RATIO
Total Assets Turnover Ratio
Year
Perc
enta
ge
Interpretation:
The total asset turnover ratio of the firm continously increses in 5 years. It shows that firm has optimum uses of its assets to generate its revenue.
124

6. PROPRIETOR’S RATIO
Proprietor's Ratio
Year
Perc
enta
ge
Interpretation:
Proprietor ratio indicate that the share of owners in the firm aganist the other liabilites. The Proprietor ratio of the firm is continously increasing in five years and in the 5th year its is nearly 86.33% and its equal to half of the balance sheet total and its gives encourage the firm to take more risk.
125

7. INTEREST COVERAGE RATIO
Interest Coverage Ratio
Year
Perc
enta
ge
Interpretation:
The interest coverage ratio indicates capacity of firm to pay interest on debt out of its profit. The above chart shows that there is continuous increase in this ratio through out 5 years because of increase in revenue. It is maximum 23.79% in the 5th year.
126

8. CURRENT RATIO
Current Ratio
Year
Tim
es
Interpretation:
Ideal current ratio is 2:1 but the above ratio’s are around 3.36:1 which is above ideal ratio that is justifiable in our industry.
127

CAPITAL BUDGETING
YEAR PAT
DEPRECIATIO
NPRE. EXP.
CFAT
DISCOUNTIN
G
P V OF CASH FLOW
DISCOUNTIN
G
P V OF CASH FLOW
CUM CFAT
FACTOR 11%
FACTOR 1%
1st
Year
88762 618725
35460
742947 0.901 669395 0.990 735518
742947
2nd
Year
445694 469468
35460
950622 0.812 771905 0.980 931610
1693569
3rd
Year
481282 471543
35460
988285 0.731 722436 0.971 959625
2681854
4th
Year
963958 365202
35460
1364620 0.659 899285 0.961 1311400
4046474
5th
Year
1091076 292667
35460
1419203 0.593 841587 0.951 1349662
5465677
Total
5465677 3904609 5287814
128

NET PRESENT VALUEParticular Amount
Total Discounted Cash Inflow 3904609Less
Total Cash Outflow 6218180NPV (2313571)
PAY BACK PERIOD
In our project Pay Back Period is beyond 5 years. As at the end of the 5 years net
cumulative Cash flow is Rs. 5465677 and our initial investment is of Rs. 6218180.
PROFITABILITY INDEX
Particular AmountTotal Cash Inflow 3904609
DivideTotal Cash Outflow 6218180
P.I 0.6279
INTERNAL RATE OF RETURN
In case of IRR we require two NPV i.e. one negative and one positive at two
different discounting factor. Hence in our project we have taken in to consideration
two discounting factor i.e. 1 and 11% discount level and at both the levels NPV is
negative so it is not feasible within the scope of five years.
129

BREAK EVEN ANALYSIS
Particular 1st Year 2nd Year 3rd Year 4th Year 5th YearTotal Income 7786870 9056330 10006600 11391790 11906820Less : Variable CostDirect Material 45,10,240 5292240 5849290 6661140 6960790Direct Labour 286000 286000 513500 513500 645500Electricity Charges 311000 318240 378983 328469 331552Repairs Maintenance 166330 171710 176977 189580 193690Power and Fuel 180000 205141 225984 226983 285741Commission on sales 175800 205150 226680 258100 269750Total Variable Cost 56,29,370 6478481 7371414 8177772 8687023Contribution 2157500 2577849 2635186 3214018 3219797
Less : Fixed CostSalary & Wages 767000 899000 938000 973470 889350Depreciation 618725 469468 471543 365202 292667Insurance 35160 30638 35354 28482 23437Telephone & Internet 26000 17750 15310 21680 15650Stationery & Postage 5000 6550 6854 7045 7520Advertisement 18500 20500 25000 25000 27000interest on Partner's Capital 182852 188177 214919 243796 301633Interest on Loan 342000 273600 205200 136800 68400Preliminary Exp. 35460 35460 35460 35460 35460Total Fixed Cost 2030697 1941143 1947640 1836935 1661117Profit 126803 636706 687546 1377083 1558680PV Ratio =Contribution/Sales
27.71% 28.46% 26.33% 28.21% 27.04%
130

BES=Fixed cost/PV ratio (In Rupees)
7328390 6820600 7397038 6511645 6143184
ASSUMPTIONS The number of working days is 25 in a month leading to a total of 300
days in a year.
The registration charges and stamp duty for land is assumed at 1% and
10% respectively.
Reserves for contingency is taken at 1% of the cost of project.
The rates for insurance premium are:
ITEM RATE
Machinery 1.5%
Building 0.2%
Vehicle 3.5%
Repairs and maintenance is assumed at following rates throughout the
project:
ITEM RATE
Machinery 1%
Building 0.1%
Bank loan is taken at 11% rate of interest.
Interest on partners’ capital is 6%.
The number of utility workers varies throughout the project.
YEAR NUMBER OF WORKERS
First year 5
Second year 5
Third year 10131

Fourth year 10
Fifth year 13
An accountant is recruited from the second year.
Depreciation is calculated as per Reducing balance method i.e. W.D.V
Depreciation rate are taken as per Income Tax Act, 1961, for partnership
firms.
ITEM RATE
Machinery 15%
Building 10%
Computer 60%
Vehicle 40%
Furniture 10%
Preliminary expenses are written off over a period of 5 years
Telephone expenses, electricity charges and power expenses vary
throughout the project. Their increase or decrease is not fixed at a certain
rate.
Closing stock of raw material is kept at 2 days on the total purchase.
Closing stock of finished goods is kept at 1 day on total sales.
132

CONCLUSION
133

We would finally like to conclude the project with a great feeling of having gained enormous knowledge about bakery industry. First of all we are thankful to our faculty members who gave us such a wonderful opportunity to learn about the practical aspects of knowledge.
By conducting an extensive research on all the aspects of establishing a bakery,
we conclude that the project is not feasible as per capital budgeting techniques.
While making the project we learnt how to communicate or deal with people and how to maintain contacts with them. We saw all the marketing factors and were able to understand more about it because of seeing them practically. It has been said that practical knowledge is more important than theoretical knowledge.
Lastly we are obliged to our co-ordinates who helped us from the beginning to the end for giving us an excellent experience of present scenario of market. Whatever we learnt from market research will definitely help in enhancing our academic career and come up as an efficient manager.
134

Bibliography/ webography
BIBLIOGRAPHYMarketing Management - A South Asian Perspective
135

13th edition
- Philip Kotler,
- Kevin Lane keller
- Abraham Koshy
- Mithileshwar Jha
Brochures given by the dealers
WEBOGRAPHY
www.bakerybazaar.com
www.wikipedia.org
www.justdial.com
www.fao.org
www.blog.franchiseindia.com
136

APPENDIX
K.S SCHOOL OF BUSINESS MANAGEMENTGUJARAT UNIVERSITY
137

A SURVEY OF THE CONSUMERS OF BAKERY PRODUCTS
Q.1. Approximate monthly family income (in Rs.) :
□ Below 5000 □ 5000 to 15000 □ 15000 to 25000 □ Above 25000
Q.2. Which of the following bakery products you use ?
□ Breads □ Toasts/ Khari □ Biscuits/ Cookies □ Chocolates □ Cakes/ Pastries □ Other. Please specify_______
Q.3. Do you have preference for egg-less bakery products ?
□ Yes □ No
Q.4. Your demand for the following bakery product is:
Regular based Need based
i) Breads □ □
ii) Toast / Khari □ □
I iii) Biscuits/Cookies □ □
iv) Cakes/ Pastries □ □
v) Chocolates □ □
vi) Any other(Please mention) □ □
Q.5. What is the frequency of purchase for the following products ?
i) Breads _________________
138

ii) Toast / Khari _________________
iii) Biscuits/Cookies _________________
iv) Cakes/ Pastries _________________
v) Chocolates _________________
vi) Any other(Please mention) __________________
Q.6. Who is the final decision maker in the purchase of bakery produce in your household ? ___________________
Q.7. Who consumes more bakery items in your household ? ____________
Q.8. Which of the following bakery product is consumed more ? (Please rank starting from 1 for the most consumed item)
□ Breads □ Toasts/ Khari □ Biscuits/ Cookies □ Chocolates □ Cakes/ Pastries □ Other. Please specify____________
Q.9. From which bakery do you usually purchase bakery products ? _______
Q.10. How did you come to know of this bakery ?
□ TV Ad □ Newspapers □ Radio □ Hoarding/ Signboard □ Internet □ Pamphlets □ Friends/ Relatives □ Any other. Please specify _____________
Q.12. Why do you prefer this bakery ?
139

□ Near location □ Good quality □ Affordable prices
□ Brand loyalty □ Variety in products □ Any other. ___
Q.13. Do you buy more bakery products during special occasions and festive seasons ? □ Yes □ No
If yes, then please specify which products. _______________________
Q.14. (i) Are you satisfied with the current prices of the bakery products?
□ Yes □ No
(ii) If No, for which products are you not satisfied ? ________________
(iii) What price would you like to pay for that product ? _____________
Q.15. Would you like to try a new bakery ?
□ Yes □ No □ Not thought of Please mention the reason for your answer ____________________
THANK YOU
K.S SCHOOL OF BUSINESS MANAGEMENT
GUJARAT UNIVERSITY
140

A SURVEY OF THE DEALERS OF BAKERY PRODUCTS
Technical feasibility
1. What kind of equipments you have?_____________________________________________________________________________________________________________________________________________________________________
2. What is the cost of each equipment?_____________________________________________________________________________________________________________________________________________________________________
3. What is your maintenance cost for your equipment?_______________________________________________________
4. What is the source of water you have required?______________________________________________________________________________________________________________
5. How much you spend for your water facilities?_______________________________________________________
6. Have you fuel facility or not?______________________________________________________________________________________________________________
7. What is source of power?_______________________________________________________
8. Which type of communication facilities you have required? Telephone Fax Internet Postage
141

9. Why you are taking this location for your factory?______________________________________________________________________________________________________________
10.Which kind of raw material required for product & service?______________________________________________________________________________________________________________
11.What is the cost of R.M?_______________________________________________________
Lay-out and space
12.How much space is required for production area?______________________________________________________________________________________________________________
13.How much space required for sales office & administrative?_______________________________________________________
14.What is the cost of land & building?_______________________________________________________
15.What are the costs of plant, machinery, furniture & fixtures?_______________________________________________________
16.Have you any branches? Yes, than specify the area __________________________ No
Human Resource Management
17.How many workers are there in factory?_______________________________________________________
18.What is the labor turnover ratio?_______________________________________________________
142

19.How much salary you have to pay for your workers?______________________________________________________________________________________________________________
20.What is the increment ratio?_______________________________________________________
21.Are you paid extra wages to your workers for their over time? Yes, than how much?_________________________ No
22.Which types of workers are there in your factory? Skilled Semi-skilled Unskilled
23.Which facilities you are given to workers & staff persons? Canteen Drinking water Rest room Parking Sports & entertainment garden Toilets sanitation Dispensary
24.Are u given any bonus & allowances for a particular occasion? Yes No
Market i ng feasibility
25.By which way you advertise your product? Local news papers Pamphlets TV Radio Internet Magazines Hoardings
143

26.How much you spend on advertisement?_______________________________________________________
27.What kind of sales promotion you use? Coupons Free vouchers
28.What kind of marketers you have? Consumer marketers Business marketers
29.What is the time duration of advertisement? Continuity Flighting Pulsing
30.Which kind of market you have? Wholesale market Retail market
31.Which kind of facilities you provide? Transportation Storage Packaging
32.How much you spend for advertising through news paper?_______________________________________________________
33. In which news paper you gave advertisement?_______________________________________________________
34.Which kind of demand is there for a particular product?______________________________________________________________________________________________________________
35.Which companies are your competitors? ______________________________________________________________________________________________________________
144

Financial feasibility
36.What are the sources of finance? Share capital Term loans Debentures Unsecured loans Deposits Subsidy
37.What is your turnover? Monthly _____________ Annual ______________
38.How you purchase R.M. from your suppliers? Cash Credit
39.What are the costs for following: Manufacturing cost _________________ Transportation cost_________________ Production cost_____________________ Selling cost________________________
40.How can you buy machineries? Cash Credit
o Loan Installment Repayment
41.How much you are investing in following: Each product Equipment
42.What is the your monthly income?_____________
145

43.How much capital is required for establishing the factory?_____________________
44.How much your depreciation & which method you use for calculating depreciation?___________________________________________
45.How much you pay taxes?____________________________________
46.How much your profit margin?________________________________
47.Any kind of festivals can affect your selling? Yes No
_*_*_*_*_*_*_*_*_*_*_*_
146