Embed Size (px)
Citation preview

Why Are Residential PV Prices in Germany So Much Lower Than in the United States?
A Scoping Analysis
Joachim Seel, Galen Barbose, and Ryan Wiser Lawrence Berkeley National Laboratory
SunShot Webinar February 26th 2013
http://emp.lbl.gov/publications/why-are-residential-pv-prices-germany-so-much-lower-united-states-scoping-analysis
For offering comments and/or assistance, thanks to Kristen Ardani, Ted James, and Alan Goodrich (NREL), as well as Minh Le and Christina Nichols (U.S. DOE). This analysis was funded by the Solar Energy Technologies Program, Office of Energy
Efficiency and Renewable Energy of the U.S. Department of Energy under Contract No. DE-AC02-05CH11231.

Table of Contents
• Motivation, Scope, and Limitations • Background and Existing Literature
– Learning related to overall PV market size
– Feed-in tariff as driver of price reductions in Germany
• German Survey Results – Customer acquisition costs – Installation labor costs – Permitting, interconnection and inspection costs – Sales taxes – Other soft Balance of System (BoS) costs
• Summary • Bibliography
2

Motivation, Scope, and Limitations
• The installed price of residential PV is significantly lower in Germany than in the U.S., due primarily to differences in “soft” costs
• In order to better characterize the nature of these differences, LBNL conducted: – Literature review and analysis of existing data – Empirical research with 2 surveys of German residential PV
installers
• Focus is the pre-incentive price paid for customer-owned systems
• Analysis here is intended to be a “first cut” and serves to highlight specific areas where further research could reveal additional insights
3

Germany’s 2011 Additions ~4x Greater, and Cumulative Additions More than 5x Greater, than United States
4 Data Sources: US: IEA and GTM/SEIA; Germany: BNetzA (Federal Grid Agency)
24 32 48 67 94 108 149 210 338 473 918
1900 1992
53 110 110
139 670 951 843
1271
1950
3794
7408 7485
6227
0
5000
10000
15000
20000
25000
30000
35000
0
1000
2000
3000
4000
5000
6000
7000
8000
2000 2001 2002 2003 2004 2005 2006 2007 2008 2009 2010 2011 2012Q1-Q3
Cum
ulat
ive
Addi
tion
[MW
]
Annu
al a
dditi
ons [
MW
]
PV capacity additions (MW)
Germany cumulative USA cumulative USA annual additions Germany annual additions

Annual Residential Installations in Germany in 2011 2.5x Greater than in the United States, cumulative installations 3.6x
5
128 115
268 297
688
761
0
100
200
300
400
500
600
700
800
2010 2011
MW
CAUSAGermany
Annual residential PV installations
Data Sources: US: GTM/SEIA; Germany: BNetzA (Federal Grid Agency)
373 488 637
934
2731
3420
0
500
1000
1500
2000
2500
3000
3500
4000
2010 2011
MW
Cumulative residential PV installations

* Note: Focusing on systems ≤10kW serves as a proxy for the residential market, as the project-level installed price data for German systems used for this figure do not include host customer type
Residential PV System Prices Have Often Been Higher in the U.S. Than in Germany
Data Sources: U.S. System Prices are derived from LBNL’s TTS dataset and are equal to the median of customer-owned systems ≤10kW installed in each year. German System Prices are the averages of individual price quotes in EuPD’s dataset (2008-2011) or the average of prices reported by IEA, Photon, KfW, and Schaeffer (2001-2007). Module Factory-Gate Prices are the average of prices reported by IEA, GTM, IRENA, Navigant, and Photon (annual currency exchange rates were used for module prices estimates)
6
6.91 6.21
4.25 3.42
1.81 1.35
6.56 5.88 5.26
0
2
4
6
8
10
12
2001 2002 2003 2004 2005 2006 2007 2008 2009 2010 2011
$201
1/W
Median Installed Price of Customer-Owned PV Systems ≤10 kW*
US system prices
German system prices
module factory-gate prices
CA
NJ
AZ

Data Sources: US: TTS, CSI working database of Dec 5th 2012; Germany: EuPD and BSW
Installed Price Gap Was $2.8/W in Q4 2011 and Differential Continued Through 2012
7 * Note: German system prices are available by quote date, rather than by installation date. However, the average time lag between price quote and installation date is much shorter in Germany than in the US., as described further within the secondary analysis
7.36 7.05
6.80 6.50
6.44 6.28 6.16 5.90
4.38 4.32 4.20 4.09
3.67 3.61 3.26 3.08
2.87 2.62 2.51
6.65 6.59 6.46 6.23 6.23
5.87 5.52
5.56 5.11
2.00
3.00
4.00
5.00
6.00
7.00
8.00
2010Q1
2010Q2
2010Q3
2010Q4
2011Q1
2011Q2
2011Q3
2011Q4
2012Q1
2012Q2
2012Q3
$201
1/W
Installation Date*
Median Installed Price of Customer-Owned PV Systems ≤10 kW
US system prices
German system prices
CSI system prices
NJ
AZ
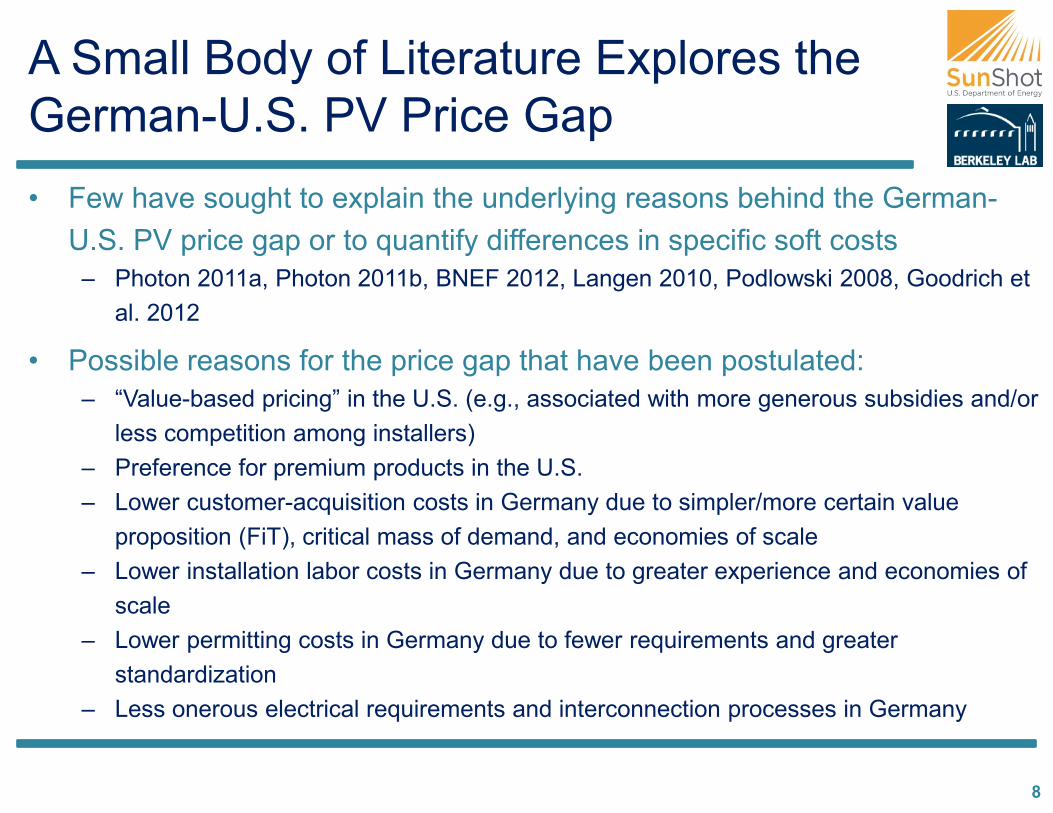
A Small Body of Literature Explores the German-U.S. PV Price Gap • Few have sought to explain the underlying reasons behind the German-
U.S. PV price gap or to quantify differences in specific soft costs – Photon 2011a, Photon 2011b, BNEF 2012, Langen 2010, Podlowski 2008, Goodrich et
al. 2012
• Possible reasons for the price gap that have been postulated: – “Value-based pricing” in the U.S. (e.g., associated with more generous subsidies and/or
less competition among installers) – Preference for premium products in the U.S. – Lower customer-acquisition costs in Germany due to simpler/more certain value
proposition (FiT), critical mass of demand, and economies of scale – Lower installation labor costs in Germany due to greater experience and economies of
scale – Lower permitting costs in Germany due to fewer requirements and greater
standardization – Less onerous electrical requirements and interconnection processes in Germany
8

Data Sources: See slide 9.
Differences in Market Size Alone May Explain Roughly Half of the Price Gap
9
Implied Average Annual Non-Module Costs* vs. Cumulative Capacity:
Customer-Owned Systems ≤10 kW, 2001-2011
• Total non-module costs in 2011 were ~$2.8/W higher in the U.S. than in Germany
• But, at the same cumulative capacity that the U.S. had installed at the end of 2011 (4 GW), non-module costs for residential PV in Germany were only $1.3/W less than in the U.S.
• One might (crudely) infer that the remaining $1.5/W of the total gap in 2011 non-module costs may be due simply to the larger base of German experience
0
1
2
3
4
5
6
7
8
9
10
100 1000 10000
$201
1/W
cumulative national PV capacity installed [MW]
USA Germany
2011
2011
$1.30
$1.50
* Note: Implied average annual non-module cost = average annual system price minus global average factory gate module price
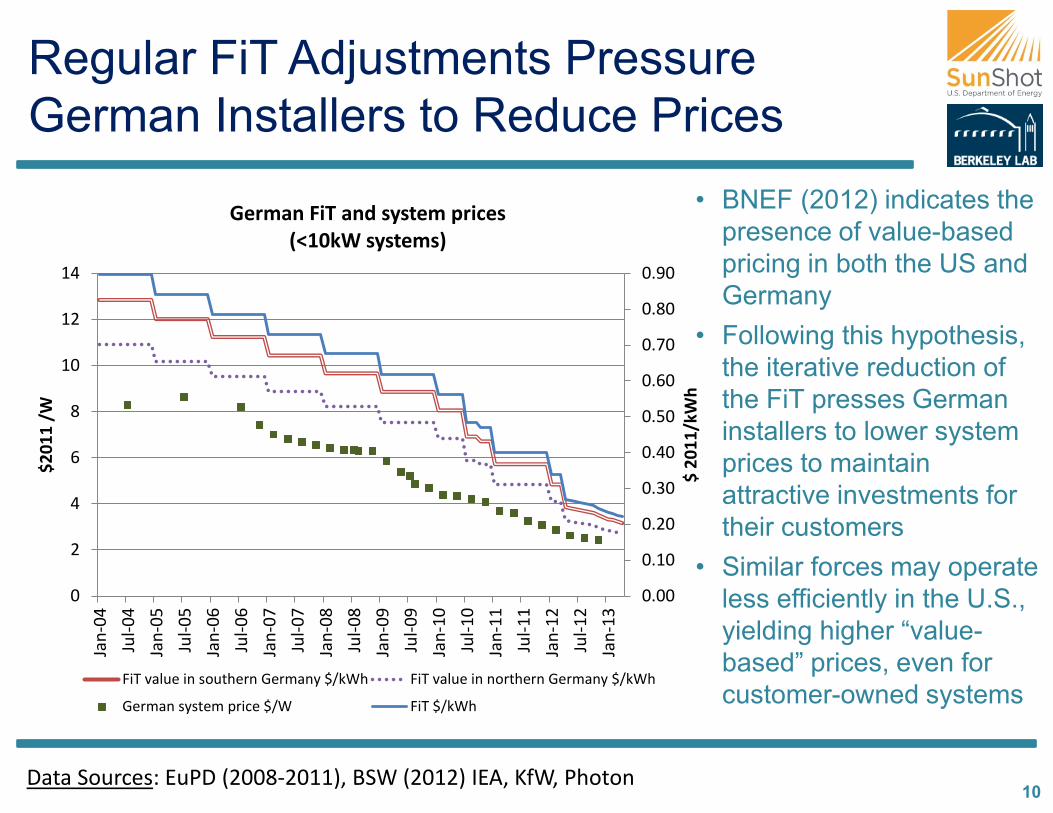
Regular FiT Adjustments Pressure German Installers to Reduce Prices
10 Data Sources: EuPD (2008-2011), BSW (2012) IEA, KfW, Photon
• BNEF (2012) indicates the presence of value-based pricing in both the US and Germany
• Following this hypothesis, the iterative reduction of the FiT presses German installers to lower system prices to maintain attractive investments for their customers
• Similar forces may operate less efficiently in the U.S., yielding higher “value-based” prices, even for customer-owned systems
0.00
0.10
0.20
0.30
0.40
0.50
0.60
0.70
0.80
0.90
0
2
4
6
8
10
12
14
Jan-
04Ju
l-04
Jan-
05Ju
l-05
Jan-
06Ju
l-06
Jan-
07Ju
l-07
Jan-
08Ju
l-08
Jan-
09Ju
l-09
Jan-
10Ju
l-10
Jan-
11Ju
l-11
Jan-
12Ju
l-12
Jan-
13
$ 20
11/k
Wh
$201
1 /W
German FiT and system prices (<10kW systems)
FiT value in southern Germany $/kWh FiT value in northern Germany $/kWh
German system price $/W FiT $/kWh

Survey Results
11

Overview of Survey Methodology
Germany 2011
Germany 2012
U.S. 2010
Residential installers 24 41 56
Residential systems 2056 1824 6038
Residential capacity
[kW] 17,819 11,924 34,396
• German survey focuses on standard DOE soft cost categories: • Customer acquisition • Permitting, interconnection, inspection • Installation labor
• Adapted from NREL survey of U.S. installers to allow comparisons • Average labor hours per system for PII
and installation • Total annual expenditures on customer
acquisition
Installer Survey Sample
• 1st survey asked about costs of residential systems installed in 2011, fielded in early 2012
• 2nd survey asked about installation labor of residential systems installed in preceding 12 months, fielded in October 2012
• Survey instrument, written in German, distributed by email to 300 German residential installers and fielded online via www.photovoltaikstudie.de 12

Raw Sample Characterization
• Most respondents in both surveys are small volume installers – Most installed <50 systems per
12-month period – Median installations/yr = 25 for
2011, 26 for 2012
• Average system sizes are a bit smaller in 2012 German survey – Average of 6 kW per system
(compared to 8 kW in German 2011 survey*)
– Less variation in average system size
13
6 10
3 2 3 9
22
5 2 3 0
5
10
15
20
25
<9 10-49 50-99 100-199 >200
Num
ber o
f Res
pond
ents
Number of Residential Systems Installed per Year
Number of Res. Systems/Yr. Installed
German Survey 2011
German Survey 2012
4 8 7
3 2 3
26
10 2 0
0
5
10
15
20
25
30
<4 4-8 8-12 12-16 >16
Num
ber o
f Res
pond
ents
Average Size of Residential Systems Installed [kWp]
Average Residential System Size
German survey 2011
German survey 2012

Total Soft BoS Costs + Profit Represent Roughly $0.62/W or 20% of System Price
14
* Notes: Survey results are summarized in terms of the average of responses across survey respondents, weighted by each respondent’s reported 2011 residential capacity installed. This chart summarizes responses to the survey question asking installers to identify the average price of residential systems sold in 2011, and to allocate that price across the categories identified along the x-axis. Due to the revised installation labor cost estimates based on the second survey, there is a slight misalignment between the category “other project costs” and the sum, reported later, of PII, direct customer acquisition cost and labor installation costs.
Residential PV System Price Build-Up Reported by German Installers (Averages* and 25th/75th Percentiles for Systems Installed in 2011 )
1.82
0.33 0.23
0.18 0.15
0.28
3.44
3.05 2.70
0.0
0.5
1.0
1.5
2.0
2.5
3.0
3.5
module inverter otherhardware
other projectcost
other non-project cost
net profit other systemprice
estimates
$ 20
11/W
EuPD 2011
Photon2011
BNEF Q42011
Reported Average System Price by 24 Installers: $3.00/W
Includes installation
labor cost, PII, direct
customer acquisition
Includes overhead,
cost of failed bids, general advertising
Excludes overhead
costs

Soft Costs for Residential PV in Germany Are ~$2.7/W Lower Than in the U.S.
15
Total soft costs for residential PV in Germany, including margin, are just 19% of the implied soft costs for U.S. residential PV ($0.62/W vs. $3.34/W)
1.83 1.82
0.55 0.33
0.47 0.23
3.34
0.62
0.00
1.00
2.00
3.00
4.00
5.00
6.00
7.00
USA 2011 Germany 2011
$ 20
11 /
W soft BoS + profit
other hardware
inverter
module
$3.00
$6.19
Implied soft-BoS + profit (residual of TTS system prices and hardware costs)
GTM/SEIA*
NREL cost modeling H2 2011
LBNL TTS: Residential systems of any size, excluding 3rd party owned systems
* Note: US module and inverter prices are based on average factory gate prices for Q4 2010-Q3 2011 as reported by GTM/SEIA with an adder of 10% to account for supply chain costs. Inverter efficiency assumed to be 85%.

Labor Rates Are Higher in Germany Than in the U.S. for Some Functions, but Lower for Others
16
• The results that follow this slide rely on German wage rates derived from the survey • In the above graphic, data from the German statistical agency (DeStatis) are also
shown for comparison (these data cover all sectors, so are not specific to PV) • U.S. labor rates are from RS Means (as used by NREL cost modeling team and as
used in NREL BoS survey analysis for the U.S.)
62
42 35
32
20
48
38
47 53
42
28 21
53
23 32
0
10
20
30
40
50
60
70
electrician installationlabor
non-electricianinstallation labor
system design engineer sales representative administrative labor
$ 20
11 /
h
Fully burdened wages at PV installation companies [$/h]
USA German survey 2011 German Statistical Agency 2010

Residential Customer Acquisition Costs Average $0.07/W in Germany
17
• Most respondents reported customer acquisition costs <$0.15/W; several small-volume installers reported somewhat higher costs
• On average, customer acquisition labor includes 3 hrs/system for sales representative and 2 hrs/system for design engineer
0.04
0.02
0.01
$0.00
$0.01
$0.02
$0.03
$0.04
$0.05
$0.06
$0.07
$0.08
Germany 2011
$201
1/W
SystemDesign
MarketingandAdvertising
OtherCustomerAcquisition
$.07
Average Customer Acquisition Costs Across Installers
$0.0
$0.1
$0.2
$0.3
$0.4
$0.5
$0.6
$0.7
$0.8
0 100 200 300 400 500 600
$201
1/W
Total Residential Installations (#)
Average Customer Acquisition Costs for Each Installer
Notes: Other Customer Acquisition costs include such items as: sales calls, site visits, travel time to and from the site, contract negotiation, bid preparation. Marketing & Advertising and Other Customer Acquisition costs are based on reported annual expenditures, while System Design costs are based on reported labor hours and wages for system design engineering.
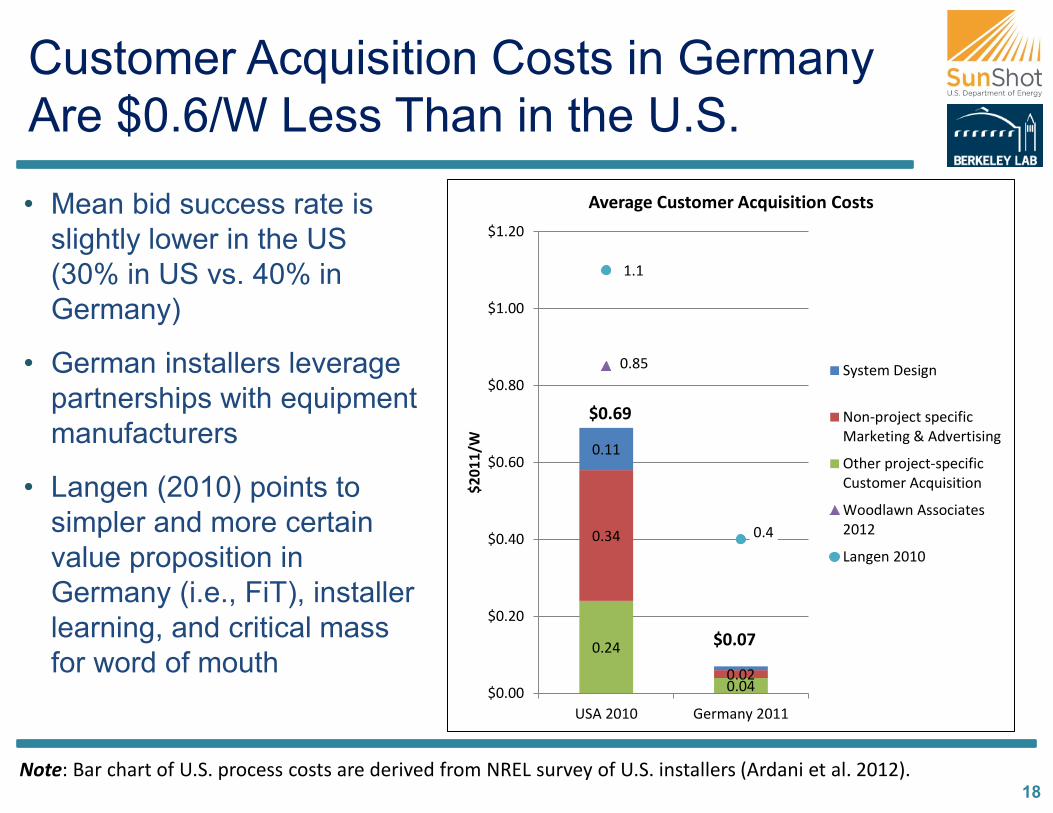
Customer Acquisition Costs in Germany Are $0.6/W Less Than in the U.S.
18
• Mean bid success rate is slightly lower in the US (30% in US vs. 40% in Germany)
• German installers leverage partnerships with equipment manufacturers
• Langen (2010) points to simpler and more certain value proposition in Germany (i.e., FiT), installer learning, and critical mass for word of mouth
Note: Bar chart of U.S. process costs are derived from NREL survey of U.S. installers (Ardani et al. 2012).
0.24
0.04
0.34
0.02
0.11
0.85
1.1
0.4
$0.00
$0.20
$0.40
$0.60
$0.80
$1.00
$1.20
USA 2010 Germany 2011
$201
1/W
Average Customer Acquisition Costs
System Design
Non-project specificMarketing & Advertising
Other project-specificCustomer Acquisition
Woodlawn Associates2012
Langen 2010
$0.69
$0.07

PII Costs Are Negligible for Residential PV in Germany • Total PII costs of $0.03/W on average • Fewer than 10 hours of labor required for all PII activities, and no fee
– Average labor requirement of 5 hrs (confirmed by PV legal survey, lowest for all European countries)
– Permit requests and incentive application are done online; usually no permit inspection required • Grid upgrade costs for German residential PV systems are paid by Grid Operator (SEPA 2012)
0123456789
10
0 100 200 300 400 500 600
Tota
l lab
or h
ours
/ins
tall
Residential PV systems installed in 2011 (#)
Total PII Labor Hours Per Respondent
0.01
0.001 0.001
0.02
0.00
$0.00
$0.01
$0.02
$0.03
$0.04
Germany 2011
$201
1/W
Permit Fee
Incentive Application
CompletingInterconnection
Completing PermitInspection
Submitting PermitPackage
Preparing PermitPackage
$0.03
Average PII Costs
19

PII Costs Account for Roughly $0.2/W of the German-U.S. PV Price Gap
20 * Note: Fully-burdened labor rates assumptions: 70% design engineer and 30% administrative labor; averaging $41/hr
for Germany (based on survey questions) vs. $26/hr for the U.S. (based on RS Means data)
8.5
1.7
3.2
0.3
4.3
0.2
2.9
3.0
3.7
0.06
0.01
0.03
0.00
0.03
0.00
0.01
0.02
0.02
0.00
0.09
0.00
SunRun (2011)$.28/W
0.00
0.05
0.10
0.15
0.20
0.25
0.30
0
5
10
15
20
25
USA 2010 [h/system]
Germany 2011 [h/system]
USA 2010 [$/W]
Germany 2011 [$/W]
$2011/Wh/system PII requirements Permit Fee
Incentive Application
Completing Interconnection
Completing Permit Inspection
Submitting Permit Package
Preparing Permit Package
$.24/W
$.03/W
22.6h
5.2h
PV Grid (2012)
4.7h
CPF (2012)Only
permitting labor time
14.5hCPF (2012)
Only permitting labor costs (excluding
fee) $.11/W
Differences due to both PII labor costs and permit fee • PII labor costs are $0.12/W lower in
Germany* • Remainder of gap ($0.09/W) is
associated with permit fee (assuming an average of $430 per system in the U.S.)
• Langen (2010) estimates PII costs for the US at $.80/W, and Germany at $.10/W
• PV Grid (2012) reports 2.5h for interconnection, 1.5h for interconnection permits and .7h for other legal-administrative processes in Germany
• SunRun (2011) estimate of $.50/W in the U.S. includes sales & marketing costs & variations in building requirements

Installation Labor Costs in Germany Average $0.23/W
21
• German follow-up survey shows higher labor hours than original survey, more in line with expectations: – Mean installation labor = 39 man-hours/system (vs. 7.5 hours in original survey) – Responses generally ranged from 25-50 hours/system – Respondents to original survey likely misinterpreted the question (i.e., confusion
between hours-on-site vs. man-hours) • No obvious economies of scale with respect to installer annual sales volume
0
10
20
30
40
50
60
70
80
0 50 100 150 200 250
Inst
alla
tion
Labo
r (h
/sys
tem
)
Residential Installations in per year (#)
Installation Labor vs. Systems/Yr (by installer)
9
30
0.06
0.17
0.00
0.05
0.10
0.15
0.20
0.25
05
1015202530354045
labor time labor cost
$201
1/W
h/sy
stem
German Installation Labor Time and Cost electrician non-electrician
$0.23 39h

German Installations Are Faster and Cheaper than in the United States
• Updated survey results show a sizable gap between the United States and Germany in installation times (36h)
• Installers in Germany rely even more on (cheaper) non-electrician installation labor than in the US (77% vs. 65%)
22
26
9
49
30 0.26
0.06
0.33
0.17
BNEF (2012)
24h
PV Grid (2012)
26h
EuPD (2012)
$0.42/W
0
0.1
0.2
0.3
0.4
0.5
0.6
0.7
0
10
20
30
40
50
60
70
80
USA 2010[h/system]
Germany 2011[h/system]
USA 2010 [$/W] Germany 2011[$/W]
$201
1/W
h/sy
stem
Installation Labor electrician installation labor non-electrician installation labor
$0.59
75h
39h
$0.23

Differences in Installation Labor Partly Stem from Different Mounting Practices
• Large majority of German installers either never or rarely install systems requiring roof-penetration
• Roof penetration is much more common in the United States, due to differences in roofing materials and higher wind speeds in some regions
• Follow-up survey also asked about the usage of roof-to-inverter conduits for wiring and about the location of grounding for German residential PV – But no clear trend that might explain
differences in labor requirements compared to U.S. systems
23
0%
10%
20%
30%
40%
50%
60%
70%
80%
90%
100%
0 10 20 30 40 50installer ID
German Installers: Percentage of systems per installer requiring rooftop penetration

Nationwide Sales Tax Exemptions in Germany Further Reduce Soft Costs • Survey respondents confirmed that German residential PV systems are
effectively exempt from revenue taxes/ sales taxes/ value added taxes – Regular tax rate of 19% can be exempted either via “Kleinunternehmer”
or “Vorsteuererstattungs” clause
24
• In the United States, 23 states assess sales tax on residential PV systems, usually 4-8% of system prices, as do many local governments
• Given the spatial distribution of PV systems, and accounting for sales tax exemptions in some states, state and local sales taxes added $0.21/W to the median price of US residential PV in 2011

Notes: “Overhead, profit, and other residual soft costs” is calculated as the difference between total soft costs and the sum of the individual business process costs quantified through the German and U.S. installer surveys. This residual term includes such items as property-related expenses (rent, utilities, etc.), inventory-related costs, additional insurances and fees, and general administrative costs. Our estimate of $1.61/W for “overhead, profit and residual soft costs” is generally consistent with the findings of CPF (2012). Research by Woodlawn Associates (2012) suggests that profit margins for many U.S. installers are low or non-existent, implying that the differences shown for the “overhead, profit, and other residual soft costs” category is not the result of much higher profit margins in the U.S.
Summary of Soft Cost Differences for Residential PV in the U.S. and Germany
25
Comparison of Soft Costs for Residential PV in Germany and the U.S. (customer-owned systems)
0.34
0.11 0.24
0.15 0.09
0.59
0.21
1.61
0.02 0.01 0.04 0.03 0.00
0.23
0.00
0.29
0
0.2
0.4
0.6
0.8
1
1.2
1.4
1.6
1.8
customeracquistion:marketing +
advertisement
customeracquisition:
system design
customeracquisition: other
PII labor cost permitting fee installation labor sales tax overhead, profit,and other
residual softcosts
$ 20
11 /
W
USA Germany
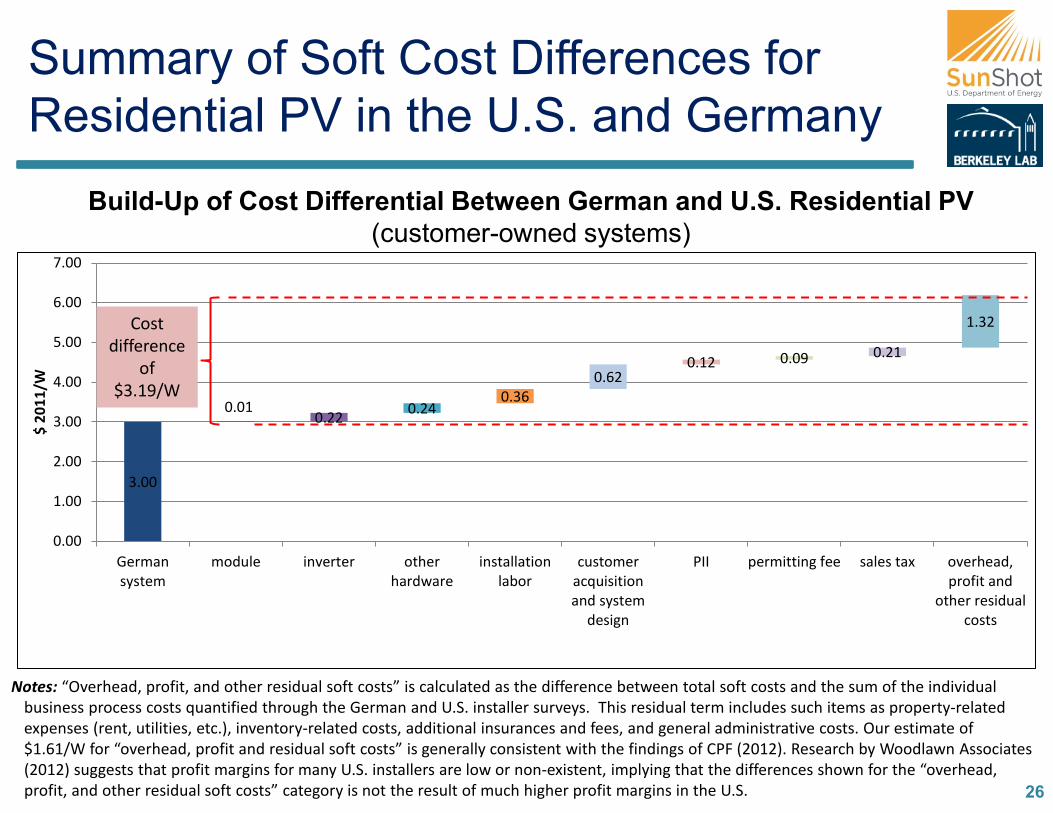
0.01 0.22 0.24
0.36 0.62
0.12 0.09 0.21
1.32
3.00
0.00
1.00
2.00
3.00
4.00
5.00
6.00
7.00
Germansystem
module inverter otherhardware
installationlabor
customeracquisitionand system
design
PII permitting fee sales tax overhead,profit and
other residualcosts
$ 20
11/W
Summary of Soft Cost Differences for Residential PV in the U.S. and Germany
Cost difference
of $3.19/W
Build-Up of Cost Differential Between German and U.S. Residential PV (customer-owned systems)
Notes: “Overhead, profit, and other residual soft costs” is calculated as the difference between total soft costs and the sum of the individual business process costs quantified through the German and U.S. installer surveys. This residual term includes such items as property-related expenses (rent, utilities, etc.), inventory-related costs, additional insurances and fees, and general administrative costs. Our estimate of $1.61/W for “overhead, profit and residual soft costs” is generally consistent with the findings of CPF (2012). Research by Woodlawn Associates (2012) suggests that profit margins for many U.S. installers are low or non-existent, implying that the differences shown for the “overhead, profit, and other residual soft costs” category is not the result of much higher profit margins in the U.S. 26

Possible Market Drivers for Soft Cost Differential between Germany and U.S. (1) • Greater market-wide deployment and longevity in Germany
allow for cost reductions based on installer experience
• Lower market fragmentation (one contiguous market and regulatory framework) and higher population density in Germany allow for lower overhead, transport, and supply chain costs. – In the US, at least 50 markets exist – many more when considering local
permitting-inspection-interconnection rules.
• Larger and more concentrated markets in Germany (as well as cultural differences with the US) facilitate bandwagon effects and customer acquisition by word of mouth, leading to lower customer acquisition costs
27

• Less onerous permitting-inspection-interconnection processes (e.g. online registration, no permitting fee or inspection by county officials) and installation practices (e.g. easier grounding, roof penetration) in Germany
• Simpler, more certain and more lasting value proposition in Germany allow for both lower customer acquisition + overhead costs, and larger average system sizes – FiT guaranteed for 20 years in Germany vs. varying value of net metering +
state incentives + federal tax incentives in the US
• Regular declining FiT and high competition among installers yield pressure for price reductions and lower margins in Germany, while larger incentives, opportunities for higher value-based pricing, and less installer competition allow for higher prices and margins in US
28
Possible Market Drivers for Soft Cost Differential between Germany and U.S. (2)

Policy Implications
A large and durable market size
A concentrated market minimize fragmentation
A simple, transparent, certain incentive structure / value proposition
Simple interconnection, permitting, and inspection requirements
Regular incentive declines to drive & follow cost reduction
29
Reducing residential PV prices in the United States may require policies that enable:

Suggestions for Further Research
• Initiate a more refined analysis of overhead costs and margins among installers
• Better understand the pricing decision of installers and competition between installers (i.e., degree of “value-based pricing”)
• Further investigate installation practices and differing regulatory requirements (usage of grounding, roof-penetration and conduits)
• Compare supply-chain margins between the two countries and average prices paid by installers for modules and inverters
• Assess the role of FIT policies in Germany in stimulating price reductions and potential implications for U.S. solar policy
30

Questions?
Download LBNL Electricity Markets & Policy Publications: http://emp.lbl.gov/reports
Joachim Seel, Galen Barbose, Ryan Wiser [email protected] [email protected] [email protected]

0%
5%
10%
15%
20%
25%
30%
35%
40%
Perc
ent o
f sys
tem
s
$2011/W
USA
Germany
Installed Prices in the U.S. Are Also Much More Varied Than in Germany
32
• Some U.S. systems have reached German prices already
• Greater variation in the U.S. indicative of greater market fragmentation across jurisdictions
Data Sources: US: TTS; Germany: EuPD
Frequency Distribution: Installed Price of ≤10 kW Customer-Owned Systems Installed in 2011
* Note: German data come from a quarterly survey of system price quotes from roughly 100 installers, and are thus based on a much smaller sample than the US data and may not reflect the full extent of price variability in the German market.

The Price Gap Is Not Due to Differences in Chinese Module Market Share
33
Share of module manufacturers by country of headquarters for customer-owned ≤10kW systems in 2011
25%
24% 22%
20%
8%
USA n=20,761
China+Taiwan
USA
Japan
Germany
Rest of theWorld
53%
27%
6%
5%
9%
Germany n=3,041
Chinese modules are cheaper ($1.61/W vs. $2.01/W in 2011), but…
Among customer owned systems ≤10 kW, the U.S. and Germany had similar shares of Chinese modules*
Thus differences in Chinese module market share do not contribute significantly to the German-U.S. price gap.
Data Sources: TTS, EuPD
Note: Third-party owned systems in the U.S. have a higher share of Chinese modules (e.g. BNEF 2012), but for the purpose of assessing the price gap in this analysis, we focus specifically on customer-owned systems.

Longer U.S. Project Development Time Contributes to Apparent Price Gap
34
•Based on TTS data and German survey responses, residential projects take 126 days to develop in the U.S. vs. 35 days in Germany •When comparing German and U.S. system prices based on installation date, some of the difference is due to the longer development time in the U.S., i.e., German system pricing is effectively “shifted” one quarter relative to the U.S. • In Q4 2011, this effect contributes ~$0.18/W ($3.26 minus $3.08) to the apparent price gap •Larger or smaller impacts in other quarters, depending on speed of price declines
7.36 7.05
6.80 6.50 6.44 6.28 6.16
5.90
7.05 6.80
6.50 6.44 6.28 6.16 5.90
4.38 4.32 4.20 4.09
3.67 3.61 3.26 3.08
2.50
3.50
4.50
5.50
6.50
7.50
8.50
2010Q1
2010Q2
2010Q3
2010Q4
2011Q1
2011Q2
2011Q3
2011Q4
$201
1/W
Median PV prices for systems ≤10 kW
USA completion
USA application
Germany

German Residential Systems Are Generally Larger Than U.S. Systems
35 Notes: US data based on TTS; German data reflects all grid-connected PV systems (in front + behind the meter) as collected by the Federal Grid Agency (Bundesnetzagentur, BNetzA)
0%
5%
10%
15%
20%
0-1kW 1-2kW 2-3kW 3-4kW 4-5kW 5-6kW 6-7kW 7-8kW 8-9kW 9-10kW
Perc
ent o
f Sys
tem
s
Size Distribution of PV Systems ≤10kW Installed in 2011
USA Germany
US median: 4.95kW
German median: 6.8kW
Applying the U.S. price distribution to the system size distribution for German systems yields a median system price that is $0.15/W lower than the actual median price for the 2011 U.S. systems in the TTS data sample ($6.21/W)

First German prices were normalizes for 2011 €, which were then converted to $ using the average exchange rate of the year 2011 of $1.39/€. The average exchange rate in 2012 was $1.29/€, an expression of German system prices in $2012 using the 2012 average exchange rate would thus be about 7% lower than the prices expressed in $2011.
Appendix: Currency Conversion
36
0.9
1
1.1
1.2
1.3
1.4
1.5
1.6
1.7
2000
2001
2002
2003
2004
2005
2006
2007
2008
2009
2010
2011
2012
Inflation and Exchange rate factors
German inflation + 2011 x-rate variable x-rate and US inflation US inflation factor German inflation factor

Bibliography I • Ardani, Kristen. “Non-Hardware BoS Cost for PV Systems Database 2010”. National Renewable Energy
Laboratory (NREL), February 2012.
• Darghouth,Naim, Barbose, Galen and Wiser, Ryan. The Impact of Rate Design and Net Metering on the Bill Savings from Distributed PV for Residential Customers in California. Lawrence Berkeley National Laboratory (LBNL), April 2010.
• Barbose, Galen, Darghouth, Naim, and Wiser, Ryan. Tracking the Sun V- A Historical Summary of Installed Cost of Photovoltaics in the United States from 1998 to 2011. Berkeley, CA: Lawrence Berkeley National Laboratory, November 2012. http://emp.lbl.gov/publications/tracking-sun-v-historical-summary-installed-price-photovoltaics-united-states-1998-2011.
• Board of Governors of the Federal Reserve System. “Foreign Exchange Rates G.5”, January 8, 2012. http://www.federalreserve.gov/releases/g5/.
• Bolcar, Katie and Ardani, Kristen. National Survey Report of PV Power Applications in the US 2010. Exchange and Dissemination of PV Power Systems. International Energy Agency (IEA), 2011.
• Bromley, Hugh. California Versus German Solar Prices: Same Dope, Twice as High. Bloomberg New Energy Finance (BNEF), February 2012.
• Brooks, Bill. Expedited Permit Process for PV System - A Standardized Process for the Review of Small-scale PV Systems. Solar America Board for Codes and Standards, October 2011.
• Bundesnetzagentur (BNetzA). “Monthly PV System Interconnection Announcements 2009-2011”, 2012. http://www.bundesnetzagentur.de/DE/Sachgebiete/ElektrizitaetGas/AnzeigenMitteilungen/MeldungPhotovoltaikanlagen/MeldungPhotovoltaikanlagen_node.html.
• Bundesverband Solarwirtschaft e. V. (BSW-Solar). Statistische Zahlen Der Deutschen Solarstrombranche (PV). Berlin, 2012. http://www.solarwirtschaft.de/fileadmin/media/pdf/
37

Bibliography II • Clean Power Finance, Tong, James. Nationwide Analysis of Solar Permitting and the Implications for Soft
Costs. December 2012. http://www.solarpermit.org/CPF-DOE%20Permitting%20Study_Dec2012_Final.pdf
• DSIRE. “Solar Sales Tax Incentives”. Database of State Incentives for Renewables and Efficiency, n.d. http://www.dsireusa.org/solar/solarpolicyguide/?id=12.
• EuPD. “Database of Installer Offer Prices for German Residential PV Systems 2006-2011”, 2012.
• German Statistical Federal Agency. “Monthly Price Indices for Cost of Living and Index of Retail Prices 1991-2011”, January 8, 2012. www.destatis.de.
• Gipe, Paul. “Rate of Return Calculation of Solar PV Using Excel Rate Function”, April 2007. http://www.wind-works.org/Solar/RateofReturnCalculationofSolarPVUsingIRATEFunction.html
• GTM Research, and Solar Energy Industries Association (SEIA). US Solar Energy Trade Assessment 2011, November 2011.
• GTM Research. U.S. Solar Market Insight Report 2010. Solar Energy Industry Association (SEIA), 2011.
• ———. U.S. Solar Market Insight Report 2011. Solar Energy Industry Association (SEIA), 2012.
• ———. U.S. Solar Market Insight Report Q3 2012. Solar Energy Industry Association (SEIA), 2012.
• Goodrich, Alan, James, Ted and Woodhouse, Michael. Residential, Commercial and Utility-Scale PV System Prices in the US: Current Drivers and Cost-Reduction Opportunities. National Renewable Energy Laboratory (NREL), February 2012.
• Haas, Reinhard. Progress in Markets for Grid-Connected PV Systems in the built Environment. Progress in Photovoltaics: Research and Applications. 2004(12), pp.427-440.
• IHS Emerging Energy Research. Europe Solar PV, Markets and Strategies 2011-2025, September 2011.
38

Bibliography III • International Weather for Energy Calculations (IWEC). “Insolation Rates for Hamburg, Germany”. U.S.
Department of Energy: EnergyPlus Energy Simulation Software, December 2011. http://apps1.eere.energy.gov/buildings/energyplus/cfm/weather_data3.cfm/region=6_europe_wmo_region_6/country=DEU/cname=Germany.
• ———. “Insolation Rates for Munich, Germany”. http://apps1.eere.energy.gov/buildings/energyplus/cfm/weather_data3.cfm/region=6_europe_wmo_region_6/country=DEU/cname=Germany.
• IRENA. Renewable Energy - Power Sector Costing Study. International Renewable Energy Agency (IRENA), 2011.
• Junginger, Martin, van Sark, Wilfried and Faaji, André. Technological Learning in the Energy Sector. Northampton, Massachusetts, USA: Edward Elgar Publishing, Inc., 2010.
• King, Alison and Jolly, Margaret. Combining Permitting, Interconnection, and Incentive Applications: A New York City Case Study. NYC Solar City, 2011. www.nycsolarcity.com.
• Krämer-Eis, Helmut. Perspektiven Erneuerbarer Energien Teil 1: Photovoltaik. KfW Beiträge Zur Mittelstands- Und Strukturpolitik 12. Frankfurt am Main: Kreditanstalt für Wiederaufbau (KfW), November 1999.
• Langen, Christian. “Complexity cost and economies of scale, why residential customers in Germany pay 25% for a PV system than US customers”, SolarPower International 2010, Sovello AG
• Maycock, Paul and Bower, Ward. National Survey Report of PV Power Applications in the US 2002. Exchange and Dissemination of PV Power Systems. International Energy Agency (IEA), 2003.
39

Bibliography IV
• Maycock, Paul, Pedigo, Susannah and Bower, Ward. National Survey Report of PV Power Applications in the US 2006. Exchange and Dissemination of PV Power Systems. International Energy Agency (IEA), 2007.
• Maycock, Paul, Poole, Lauren and Bower, Ward. National Survey Report of PV Power Applications in the US 2007. Exchange and Dissemination of PV Power Systems. International Energy Agency (IEA), 2008.
• McFreely, David. Study of Solar Permitting and Inspection- A Study of Issues with Existing Procedures and the Need for an Industry Standard. San Jose: SolarTech, September 2011.
• Mills, Carl, and Newick, Kurt. Solar Electric Permit Fees in Northern California. Sierra Club, July 2011.
• Mints, Paula. “Capacity, Prices, and All That Solar Jazz”. Renewable Energy World, March 2011. http://www.renewableenergyworld.com/rea/news/article/2011/03/capacity--prices-.
• National Renewable Energy Laboratory (NREL). National Survey Report of PV Power Applications in the US 2008. Exchange and Dissemination of PV Power Systems. International Energy Agency (IEA), 2009.
• ———. National Survey Report of PV Power Applications in the US 2009. Exchange and Dissemination of PV Power Systems. International Energy Agency (IEA), 2010.
• ———. “Photovoltaic Solar Resource: United States and Germany”. May 2008. http://www.seia.org/galleries/default-file/PVMap_USandGermany.pdf.
• ———. System Advisor Model (SAM), n.d. https://sam.nrel.gov/.
• Oppermann, Klaus. Perspektiven Erneuerbarer Energien Teil 4: Fördergebnisse Des 100.000 Dächer-Solarstrom-Programms- Eine Zwischenbilanz. KfW Beiträge Zur Mittelstands- Und Strukturpolitik 28. Frankfurt am Main: Kreditanstalt für Wiederaufbau (KfW), August 2002.
40

Bibliography V
• Oppermann, Klaus. Perspektiven Erneuerbarer Energien: Das 100.000 Dächer-Solarstrom-Programm: Eine Schlussbilanz. KfW Beiträge Zur Mittelstands- Und Strukturpolitik 31. Frankfurt am Main: Kreditanstalt für Wiederaufbau (KfW), November 2004.
• Payne, Doug. “Overcoming US Market Barriers to PV” presented at the Intersolar, San Francisco, July 13, 2011.
• PHOTON Consulting, LLC. The Next Wave. Solar Annual, 2012.
• ———. The True Cost of Solar Power 2011, The Pressure Is On, 2011.
• Pitt, Damian. Taking the Red Tape Out of Green Power - How to Overcome Permitting Obstacles to Small-scale Distributed Renewable Energy. Network for New Energy Choices, 2008.
• Podlowski, Lars. “Applying German Design Practices in the US”. Solon, 2008.
• PV Legal. Reduction of Administrative Barriers for PV Systems in Germany at the National Level. Bundesverband der Solarwirtschaft (BSW), 2011. http://www.pvlegal.eu/results/advisory-papers/germany.html
• PV Grid. Time Estimates For Residential PV Systems in Germany. Bundesverband der Solarwirtschaft (BSW), 2012. http://www.pvgrid.eu/database/pvgrid/germany/national-profile-6/residential-systems/2404/standard-subsegment-1.html
• PvXchange. “pvX-Spotmarket Price Index for Modules”, December 1, 2011. http://www.pvxchange.com.
• Reichmuth, Matthias. Vorbereitung Und Begleitung Des EEG Erfahrungsberichtes 2011- IIc- Solare Strahlungsenergie. Berlin: Leipziger Institut für Energie, June 2011.
• Renewable Analytics. “Database of Survey Results 2010,2011”, February 2012.
• Schaeffer, Gerrit Jan, Erik Alsema, Ad Seebregts, Luuk Beurskens, Hugo de Moor, Wilfried van Sark, Michael Durstewitz, et al. Learning from the Sun. Energy Research Centre of the Netherlands (ECN), August 2004.
41

Bibliography VI • Solar Electric Power Association (SEPA). Fact Finding Mission to Germany- Can Germany count on solar. September 2012
• Statistisches Bundesamt. “Für 2011 Wird Mit Einer Leichten Bevölkerungszunahme Gerechnet”, January 13, 2012. https://www.destatis.de/DE/PresseService/Presse/Pressemitteilungen/2012/01/PD12_014_12411.html;jsessionid=6DFB56EB33FF754CAC381C7CC029C18D.cae2.
• Stubenrauch, Frank. National Survey Report of PV Power Applications in Germany 2002. International Energy Agency (IEA), 2003.
• SunRun, Sprague, Ethan. The Impact of Local Permitting on the Cost of Solar Power. January 2011. www.sunrunhome.com/permitting.
• Tweedie, A. and Dorris, E.. Comparing Germany’s and California’s Interconnection Processes for PV Systems. National Renewable Energy Laboratory (NREL), July 2011.
• Tepper, Marco. “Statistical Data of the German Solar Electric Industry (PV)”. Bundesverband der Solarwirtschaft (BSW), April 1, 2012. http://www.solarwirtschaft.de/fileadmin/media/pdf/bsw_solar_fakten_pv.pdf.
• U.S. Census Bureau, Population Division. “Annual Estimates of the Population for the United States, Regions, States, and Puerto Rico: April 1, 2010 to July 1, 2011 (NST-EST2011-01)”, December 2011.
• Wissing, Lothar. National Survey Report of PV Power Applications in Germany 2006. Exchange and Dissemination of PV Power Systems. International Energy Agency (IEA), May 2006.
• ———. National Survey Report of PV Power Applications in Germany 2008 Version 2. Exchange and Dissemination of PV Power Systems. International Energy Agency (IEA), May 2009.
• ———. National Survey Report of PV Power Applications in Germany 2010. Exchange and Dissemination of PV Power Systems. International Energy Agency (IEA), May 2011.
• Woodlawn Associates. The Economics of Residential Solar Installation. September 2012, http://www.woodlawnassociates.com/economics-solar-installation/.
42