Embed Size (px)
Citation preview

E1C04 07/16/2010 Page 95
Why Do Balance of Payments Problems Occur?
Balance of payments difficulties can arise—and, in the worstcase, build into crises—even in the face of strong preventionefforts. The IMF assists countries in restoring economic sta-bility by helping devise programs of corrective policies andproviding loans to support them.
Bad luck, inappropriate policies, or a combination ofthe two may create balance of payments difficulties in acountry—that is, a situation where sufficient financing onaffordable terms cannot be obtained to meet internationalpayment obligations. In the worst case, the difficulties canbuild into a crisis. The country’s currency may be forced todepreciate rapidly, making international goods and capitalmore expensive, and the domestic economy may experiencea painful disruption. These problems may also spread toother countries.
The causes of such difficulties are often varied andcomplex. Key factors have included weak domestic financial
systems, large and persistent fiscal deficits, high levels ofexternal and/or public debt, exchange rates fixed at in-appropriate levels, natural disasters, or armed conflicts or asudden and strong increase in the price of key commoditiessuch as food and fuel. Some of these factors can directlyaffect a country’s trade account, reducing exports or in-creasing imports. Others may reduce the financing availablefor international transactions; for example, investors may loseconfidence in a country’s prospects, leading to massive as-set sales, or ‘‘capital flight.’’ In either case, diagnoses of, andresponses to, crises are complicated by linkages betweenvarious sectors of the economy. Imbalances in one sectorcan quickly spread to other sectors, leading to widespreadeconomic disruption.
Source: ‘‘Factsheet, October 2008: How The IMF Helps to ResolveBalance of Payments Difficulties,’’ http://www.imf.org/external/np/exr/facts/crises.htm, accessed September 2009.
95

E1C04 07/16/2010 Page 96
International business transactions occur in many different forms over the courseof a year. The measurement of all international economic transactions betweenthe residents of a country and foreign residents is called the balance of payments(BOP).1 Government policymakers need such measures of economic activity toevaluate the general competitiveness of domestic industry, to set exchange-rate orinterest-rate policies or goals, and for many other purposes. Individuals and busi-nesses use various BOP measures to gauge the growth and health of specific typesof trade or financial transactions by country and regions of the world against thehome country.
International transactions take many forms. Each of the following examples is aninternational economic transaction that is counted and captured in the U.S. balanceof payments.
� U.S. imports of Honda automobiles, which are manufactured in Japan.� A U.S.-based firm, Bechtel, is hired to manage the construction of a major
water-treatment facility in the Middle East.� The U.S. subsidiary of a French firm, Saint Gobain, pays profits (dividends)
back to the parent firm in Paris.� An American tourist purchases a hand-blown glass figurine in Venice, Italy.� The U.S. government provides grant financing of military equipment for its
NATO (North Atlantic Treaty Organization) military ally, Turkey.� A Canadian dentist purchases a U.S. Treasury bill through an investment bro-
ker in Cleveland, Ohio.
These are just a small sample of the hundreds of thousands of international trans-actions that occur each year. The balance of payments provides a systematic methodfor the classification of all of these transactions. There is one rule of thumb that willalways aid in the understanding of BOP accounting: Watch the direction of themovement of money.
The balance of payments is composed of a number of subaccounts that arewatched quite closely by groups as diverse as investors on Wall Street, farmers inIowa, politicians on Capitol Hill, and people in boardrooms across America. Thesegroups track and analyze the two major subaccounts, the current account and thefinancial account, on a continuing basis. Before describing these two subaccountsand the balance of payments as a whole, it is necessary to understand the rather un-usual features of how balance of payments accounting is conducted.
FUNDAMENTALS OF BALANCE OF PAYMENTSACCOUNTING
1. To understand the fun-damental principles ofhow countries measureinternational business ac-tivity, the balance of pay-ments
The balance of payments must balance. If it does not, something has either not beencounted or counted properly. It is therefore improper to state that the BOP is in dis-equilibrium. It cannot be. The supply and demand for a country’s currency may beimbalanced, but that is not the same thing. Subaccounts of the BOP, such as themerchandise trade balance, may be imbalanced, but the entire BOP of a single coun-try is always balanced.
There are three main elements to the process of measuring international eco-nomic activity: (1) identifying what is and is not an international economic transac-tion; (2) understanding how the flow of goods, services, assets, and money createsdebits and credits to the overall BOP; and (3) understanding the bookkeeping proce-dures for BOP accounting, called double entry.
balance of payments(BOP) A statement of alltransactions between onecountry and the rest of theworld during a given period; arecord of flows of goods, ser-vices, and investments acrossborders.
current account An accountin the BOP statement that re-cords the results of transac-tions involving merchandise,services, and unilateral trans-fers between countries.
financial account An ac-count in the BOP statementthat records transactions in-volving borrowing, lending,and investing across borders.
96 Part 2 FOUNDATIONS

E1C04 07/16/2010 Page 97
DEFINING INTERNATIONAL ECONOMIC TRANSACTIONS
Identifying international transactions is ordinarily not difficult. The export of mer-chandise, goods such as trucks, machinery, computers, telecommunications equip-ment, and so forth, is obviously an international transaction. Imports such as Frenchwine, Japanese cameras, and German automobiles are also clearly internationaltransactions. But this merchandise trade is only a portion of the thousands of differ-ent international transactions that occur in the United States or any other countryeach year.
Many other international transactions are not so obvious. The purchase of a glassfigure in Venice, Italy, by an American tourist is classified as a U.S. merchandiseimport. In fact, all expenditures made by American tourists around the globe thatare for goods or services (meals, hotel accommodations, and so forth) are recorded inthe U.S. balance of payments as imports of travel services in the current account.The purchase of a U.S. Treasury bill by a foreign resident is an international financialtransaction and is dutifully recorded in the capital account of the U.S. balance ofpayments.
THE BOP AS A FLOW STATEMENT
The BOP is often misunderstood because many people believe it to be a balancesheet, rather than a cash flow statement. By recording all international transactionsover a period of time, it is tracking the continuing flow of purchases and paymentsbetween a country and all other countries. It does not add up the value of all assetsand liabilities of a country like a balance sheet does for an individual firm.
There are two types of business transactions that dominate the balance ofpayments:
1. Real assets: The exchange of goods (e.g., automobiles, computers, watches,textiles) and services (e.g., banking services, consulting services, travel ser-vices) for other goods and services (barter) or for the more common type ofpayment, money.
2. Financial assets: The exchange of financial claims (e.g., stocks, bonds,loans, purchases or sales of companies) in exchange for other financial claimsor money.
Although assets can be separated as to whether they are real or financial, it isoften easier to simply think of all assets as being goods that can be bought and sold.An American tourist’s purchase of a handwoven area rug in a shop in Bangkok is notall that different from a Wall Street banker buying a British government bond forinvestment purposes.
BOP ACCOUNTING: DOUBLE-ENTRY BOOKKEEPING
The balance of payments employs an accounting technique called double-entrybookkeeping. Double-entry bookkeeping is the age-old method of accounting inwhich every transaction produces a debit and a credit of the same amount. Simulta-neously. It has to. A debit is created whenever an asset is increased, a liability isdecreased, or an expense is increased. Similarly, a credit is created whenever an assetis decreased, a liability is increased, or an expense is decreased.
An example clarifies this process. A U.S. retail store imports from Japan $2million worth of consumer electronics. A negative entry is made in the merchan-dise-import subcategory of the current account in the amount of $2 million. Simulta-neously, a positive entry of the same $2 million is made in the capital account for the
double-entry bookkeepingAccounting methodologywhere each transaction givesrise to both a debit and acredit of the same currencyamount. It is used in the con-struction of the balance ofpayments.
The Balance of Payments Chapter 4 97

E1C04 07/16/2010 Page 98
transfer of $2 million to the Japanese manufacturer. Obviously, the result of hundredsof thousands of such transactions and entries should theoretically result in a perfectbalance.
That said, it is now a problem of application, and a problem it is. The measure-ment of all international transactions in and out of a country over a year is a daunt-ing task. Mistakes, errors, and statistical discrepancies will occur. The primaryproblem is that although double-entry bookkeeping is employed in theory, the indi-vidual transactions are recorded independently. Current and capital account entriesare recorded independent of one another, not together as double-entry bookkeepingwould prescribe. It must then be recognized that there will be serious discrepancies(to use a nice term for it) between debits and credits, and the possibility in total thatthe balance of payments may not balance!
The following section describes the various balance of payment accounts, theirmeanings, and their relationships, using the United States as the example. The chap-ter then concludes with a discussion—and a number of examples—of how differentcountries with different policies or levels of economic development may differ mark-edly in their balance of payment accounts.
THE ACCOUNTS OF THE BALANCE OF PAYMENTS
2. To examine the similari-ties of the current andcapital accounts of thebalance of payments
The balance of payments is composed of two primary subaccounts, the Current Ac-count and the Financial/Capital Account. In addition, the Official Reserves Accounttracks government currency transactions, and a fourth statistical subaccount, theNet Errors and Omissions Account, is produced to preserve the balance in the BOP.The international economic relationships between countries do, however, continueto evolve, as the recent revision of the major accounts within the BOP discussed laterindicates.2
THE CURRENT ACCOUNT
The Current Account includes all international economic transactions with incomeor payment flows occurring within the year, the current period. The Current Accountconsists of four subcategories:
1. Goods trade: This is the export and import of goods. Merchandise trade isthe oldest and most traditional form of international economic activity. Al-though many countries depend on imports of many goods (as they shouldaccording to the theory of comparative advantage), they also normally workto preserve either a balance of goods trade or even a surplus.
2. Services trade: This is the export and import of services. Some common in-ternational services are financial services provided by banks to foreign import-ers and exporters, travel services of airlines, and construction services ofdomestic firms in other countries. For the major industrial countries, this sub-account has shown the fastest growth in the past decade.
3. Income: This category is predominantly current income associated with in-vestments that were made in previous periods. If a U.S. firm created a subsidi-ary in South Korea to produce metal parts in a previous year, the proportionof net income that is paid back to the parent company in the current year (thedividend) constitutes current investment income. Additionally, wages andsalaries paid to nonresident workers is also included in this category.
98 Part 2 FOUNDATIONS

E1C04 07/16/2010 Page 99
4. Current transfers: Transfers are the financial settlements associated withthe change in ownership of real resources or financial items. Any transfer be-tween countries that is one-way, a gift, or a grant, is termed a current transfer.A common example of a current transfer would be funds provided by theUnited States government to aid in the development of a less-developed na-tion. Transfers associated with the transfer of fixed assets are included in anew separate account, the Capital Account, which now follows the CurrentAccount. The contents of what previously had been called the capital ac-count are now included within the Financial Account.
All countries possess some amount of trade, most of which is merchandise. Manysmaller and less-developed countries have little in the way of service trade, or itemsthat fall under the income or transfers subaccounts.
The Current Account is typically dominated by the first component described—the export and import of merchandise. For this reason, the balance on trade (BOT),which is so widely quoted in the business press in most countries, refers specifically tothe balance of exports and imports of goods trade only. For a larger industrializedcountry, however, the BOT is somewhat misleading because service trade is not in-cluded; it may be opposite in sign on net, and it may actually be fairly large as well.
Table 4.1 summarizes the Current Account and its components for the UnitedStates for the 2002–2008 period. As illustrated, the U.S. goods trade balance hasconsistently been negative, but has been partially offset by the continuing surplus inservices trade.
Goods Trade
Figure 4.1 places the Current Account values of Table 4.1 in perspective overtime by dividing the Current Account into its two major components: (1) goodstrade and (2) services trade. The first and most striking message is the magnitudeof the goods trade deficit in 2006, 2007, and 2008 (a continuation of a positioncreated in the early 1980s). The balance on services and income, although notlarge in comparison to net goods trade, has generally run a surplus over the pasttwo decades.
Table 4.1 The U.S. Current Account, 2002–2008 (billions of U.S. dollars)
2002 2003 2004 2005 2006 2007 2008
Goods exports 686 717 811 898 1020 1142 1281Goods imports �1167 �1264 �1477 �1682 �1863 �1969 �2117Goods trade balance (BOT) �481 �548 �666 �783 �844 �827 �836
Services trade credits 289 301 350 385 432 501 546Services trade debits �231 �250 �291 �314 �349 �375 �405Services trade balance 58 51 58 72 83 125 140
Income receipts 281 320 414 535 682 819 765Income payments �254 �275 �347 �463 �634 �728 �646Income balance 27 45 67 72 48 91 118
Current transfers, credits 12 15 20 19 26 23 22Current transfers, debits �77 �87 �105 �109 �117 �139 �150Net transfers �65 �72 �84 �90 �91 �116 �128
Current Account Balance �461 �523 �625 �729 �804 �727 �706
Source: Derived from International Monetary Fund, International Financial Statistics, imf.org, September 2009.
The Balance of Payments Chapter 4 99

E1C04 07/16/2010 Page 100
The deficits in the BOT of the past decade have been an area of considerableconcern for the United States. Merchandise trade is the original core of internationaltrade. It has three major components: manufactured goods, agriculture, and fuels.The manufacturing of goods was the basis of the industrial revolution, and the focusof the theory of international trade described in the previous chapter. The U.S. goodstrade deficit of the 1980s and 1990s was mainly caused by a decline in traditionalmanufacturing industries that have over history employed many of America’s work-ers. Declines in the net trade balance in areas such as steel, automobiles, automotiveparts, textiles, shoe manufacturing, and others caused massive economic and socialdisruption. The problems of dealing with these shifting trade balances will be dis-cussed in detail in a later chapter.
The most encouraging news for U.S. manufacturing trade is the growth ofexports in recent years. A number of factors contributed to the growth of U.S.exports, such as the weaker dollar (which made U.S.-manufactured goods cheaper interms of the currencies of other countries), more rapid economic growth in Europe,and a substantial increase in agricultural exports. Understanding merchandise importand export performance is much like understanding the market for any single prod-uct. The demand factors that drive both imports and exports are income, the eco-nomic growth rate of the buyer, and price (the price of the product in the eyes of theconsumer after passing through an exchange rate). For example, U.S. merchandiseimports reflect the income level and growth of American consumers and industry. Asincome rises, so does the demand for imports.
Exports follow the same principles but in the reversed position. U.S. merchan-dise exports depend not on the incomes of U.S. residents, but on the incomes of thebuyers of U.S. products in all other countries around the world. When these econo-mies are growing, the demand for U.S. products will also rise. However, the recenteconomic crises in Asia now raise questions regarding U.S. export growth in the im-mediate future.
The service component of the U.S. Current Account is one of mystery to many.As illustrated in both Table 4.1 and Figure 4.1, the U.S. has consistently achieved a
Figure 4.1 U.S. Trade Balances on Goods and Services, 1985–2008
$200
Billions of U.S. dollars
100
0
–100
–200
–300
Balance on goods Balance on services–400
–500
–600
–700
–800
–900
1985
1986
1987
1988
1989
1990
1991
1992
1993
1994
1995
1996
1997
1998
1999
2000
2001
2002
2003
2004
2005
2006
2007
2008
Source: International Monetary Fund, International Financial Statistics, imf.org, September 2009.
100 Part 2 FOUNDATIONS
E1C04 07/16/2010 Page 101
surplus in services trade income. The major categories of services include travel andpassenger fares, transportation services, expenditures by U.S. students abroad and for-eign students pursuing studies in the United States, telecommunications services,and financial services.
THE CAPITAL AND FINANCIAL ACCOUNT
The Capital and Financial Account of the balance of payments measures all interna-tional economic transactions of financial assets. It is divided into two major compo-nents, the Capital Account and the Financial Account.
� The Capital Account: The Capital Account is made up of transfers of finan-cial assets and the acquisition and disposal of nonproduced/nonfinancial assets.The magnitude of capital transactions covered is of a relatively minor amount,and will be included in principle in all of the following discussions of the fi-nancial account.
� The Financial Account: The financial account consists of three components:direct investment, portfolio investment, and other asset investment. Financial assetscan be classified in a number of different ways, including the length of the lifeof the asset (its maturity) and by the nature of the ownership (public or private).The Financial Account, however, uses a third way. It is classified by the degreeof control over the assets or operations the claim represents: portfolio investment,where the investor has no control, or direct investment, where the investor exertssome explicit degree of control over the assets. (The contents of the FinancialAccount are for all intents and purposes the same as those of the Capital Ac-count under the IMF’s BOP accounting framework used prior to 1996. We willrefer, from this point on, almost exclusively to the Financial Account.)
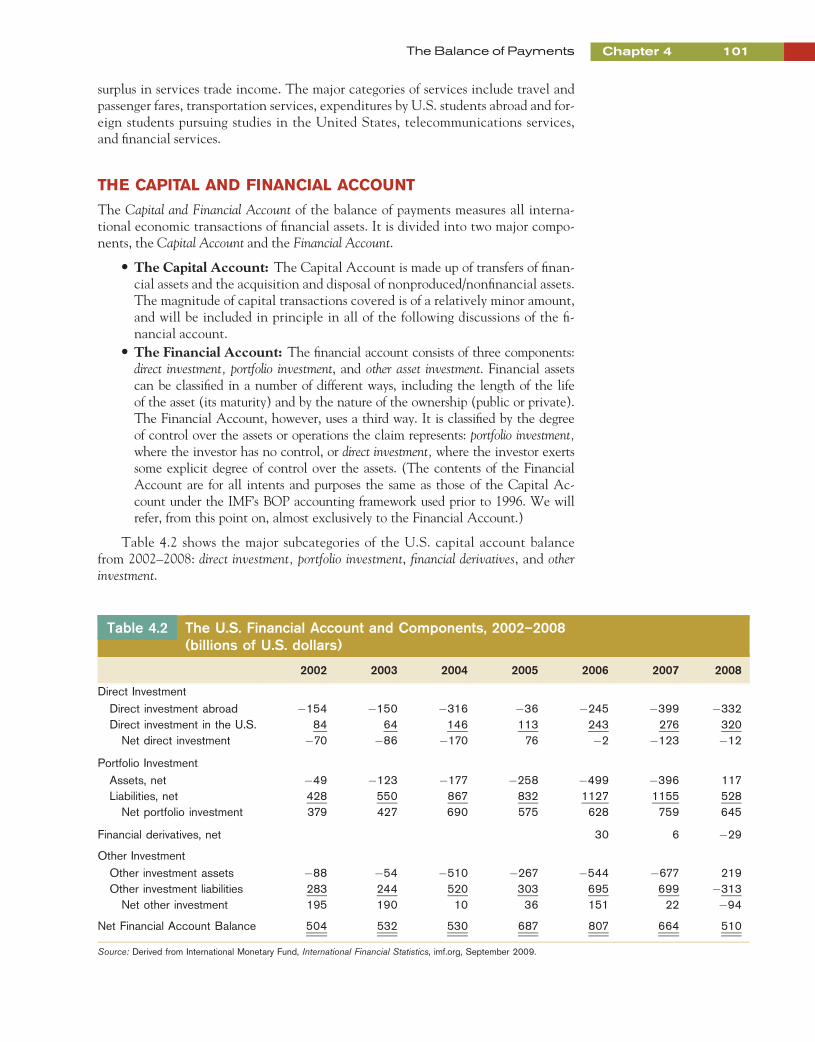
Table 4.2 shows the major subcategories of the U.S. capital account balancefrom 2002–2008: direct investment, portfolio investment, financial derivatives, and otherinvestment.
Table 4.2 The U.S. Financial Account and Components, 2002–2008(billions of U.S. dollars)
2002 2003 2004 2005 2006 2007 2008
Direct InvestmentDirect investment abroad �154 �150 �316 �36 �245 �399 �332Direct investment in the U.S. 84 64 146 113 243 276 320Net direct investment �70 �86 �170 76 �2 �123 �12
Portfolio InvestmentAssets, net �49 �123 �177 �258 �499 �396 117Liabilities, net 428 550 867 832 1127 1155 528Net portfolio investment 379 427 690 575 628 759 645
Financial derivatives, net 30 6 �29
Other InvestmentOther investment assets �88 �54 �510 �267 �544 �677 219Other investment liabilities 283 244 520 303 695 699 �313Net other investment 195 190 10 36 151 22 �94
Net Financial Account Balance 504 532 530 687 807 664 510
Source: Derived from International Monetary Fund, International Financial Statistics, imf.org, September 2009.
The Balance of Payments Chapter 4 101

E1C04 07/16/2010 Page 102
1. Direct investment: This is the net balance of capital dispersed out of andinto the United States for the purpose of exerting control over assets. Forexample, if a U.S. firm either builds a new automotive parts facility in anothercountry or actually purchases a company in another country, this would fallunder direct investment in the U.S. balance of payments accounts. When thecapital flows out of the United States, it enters the balance of payments as anegative cash flow. If, however, foreign firms purchase firms in the UnitedStates (e.g., Sony of Japan purchased Columbia Pictures in 1989) it is a capi-tal inflow and enters the balance of payments positively. Whenever 10 per-cent or more of the voting shares in a U.S. company is held by foreigninvestors, the company is classified as the U.S. affiliate of a foreign company,and a foreign direct investment. Similarly, if U.S. investors hold 10 percent ormore of the control in a company outside the United States, that company isconsidered the foreign affiliate of a U.S. company.
2. Portfolio investment: This is net balance of capital that flows in and out ofthe United States but does not reach the 10 percent ownership threshold ofdirect investment. If a U.S. resident purchases shares in a Japanese firm, butdoes not attain the 10 percent threshold, it is considered a portfolio investment(and in this case an outflow of capital). The purchase or sale of debt securities(like U.S. Treasury bills) across borders is also classified as portfolio investmentbecause debt securities by definition do not provide the buyer with ownershipor control.
3. Financial derivatives: Financial derivatives are financial instruments thatare linked to a specific financial instrument, indicator, or commodity—the instrument’s underlying asset. The value of a financial derivativederives from the price of an underlying item, such as an asset or index. Finan-cial derivatives are used for a number of purposes, including risk management,hedging, arbitrage between markets, and speculation. Financial derivativeswere previously reported as a subcategory of Portfolio Investment (section 2),but, as a result of a revision by the IMF in 2002, they are now required to bereported on their own if the country deems them to be of significant size.
4. Other investment assets/liabilities: This final category consists of variousshort-term and long-term trade credits, cross-border loans from all types offinancial institutions, currency deposits and bank deposits, and other accountsreceivable and payable related to cross-border trade.
Direct Investment
Figure 4.2 shows how the major subaccounts of the U.S. capital account—net direct investment, portfolio investment, and other investment—have changedsince 1985.
The boom in foreign investment into the United States, or foreign resident pur-chases of assets in the United States, during the 1980s was extremely controversial.The source of concern over foreign investment in any country, including the UnitedStates, focuses on two topics—control and profit. Most countries possess restrictionson what foreigners may own in their country. This is based on the premise that do-mestic land, assets, and industry in general should be held by residents of the country.For example, up until 1990 it was not possible for a foreign firm to own more than20 percent of any company in Finland. This rule is the norm, rather than the excep-tion. The United States has traditionally had few restrictions on what foreign resi-dents or firms can own or control in the United States; most restrictions that remaintoday are related to national security concerns. As opposed to many of the traditionaldebates over whether international trade should be free or not, there is not the same
102 Part 2 FOUNDATIONS

E1C04 07/16/2010 Page 103
consensus that international investment should necessarily be free. This is a questionthat is still very much a domestic political concern first, and an international eco-nomic issue second.
The second major source of concern over foreign direct investment is who re-ceives the profits from the enterprise. Foreign companies owning firms in the UnitedStates will ultimately profit from the activities of the firms, or put another way, fromthe efforts of American workers. In spite of evidence that foreign firms in the UnitedStates reinvest most of the profits in the United States (in fact at a higher rate thandomestic firms), the debate has continued on possible profit drains. Regardless of theactual choices made, workers of any nation feel the profits of their work should re-main in the hands of their own citizens. Once again, this is in many ways a politicaland emotional concern rather than an economic one.
The choice of words used to describe foreign investment can also influence publicopinion. If these massive capital inflows are described as ‘‘capital investments from allover the world showing their faith in the future of American industry,’’ the net capitalsurplus is represented as decidedly positive. If, however, the net capital surplus is de-scribed as resulting in ‘‘the United States as the world’s largest debtor nation,’’ thenegative connotation is obvious. Both are essentially spins on the economic principlesat work. Capital, whether short-term or long-term, flows to where it believes it canearn the greatest return for the level of risk. Although in an accounting sense that is‘‘international debt,’’ when the majority of the capital inflow is in the form of directinvestment and a long-term commitment to jobs, production, services, technological,and other competitive investments, the impact on the competitiveness of Americanindustry (an industry located within the United States) is increased. The ‘‘net debtor’’label is misleading in that it inappropriately invites comparison with large debt crisisconditions suffered by many countries in the past, like Mexico and Brazil.
Portfolio Investment
Portfolio investment is capital invested in activities that are purely profit-motivated (return), rather than ones made in the prospect of controlling or
Figure 4.2 The U.S. Financial Account, 1985–2008
$800
Billions of U.S. dollars
700
600
500
400
300
Net direct investment
200
100
0
100
200
1985
1986
1987
1988
1989
1990
1991
1992
1993
1994
1995
1996
1997
1998
1999
2000
2001
2002
2003
2004
2005
2006
2007
2008
Net portfolio investment Net other investment
Source: International Monetary Fund, International Financial Statistics, imf.org, September 2009.
The Balance of Payments Chapter 4 103
E1C04 07/16/2010 Page 104
managing the investment. Investments that are purchases of debit securities, bonds,interest-bearing bank accounts, and the like are only intended to earn a return. Theyprovide no vote or control over the party issuing the debt. Purchases by foreign inves-tors of debt issued by the U.S. government (U.S. Treasury bills, notes, and bonds)constitute net portfolio investment in the United States.
As illustrated in Figure 4.2, portfolio investment has shown a much more vola-tile behavior than net direct investment over the past decade. Many U.S. debt secu-rities, such as U.S. Treasury securities and corporate bonds, were in high demand inthe late 1980s, while surging emerging markets in both debt and equities caused areversal in direction in the 1990s. The motivating forces for portfolio investmentflows are always the same, return and risk. This theoretical fact, however, does notmake them any the more predictable.
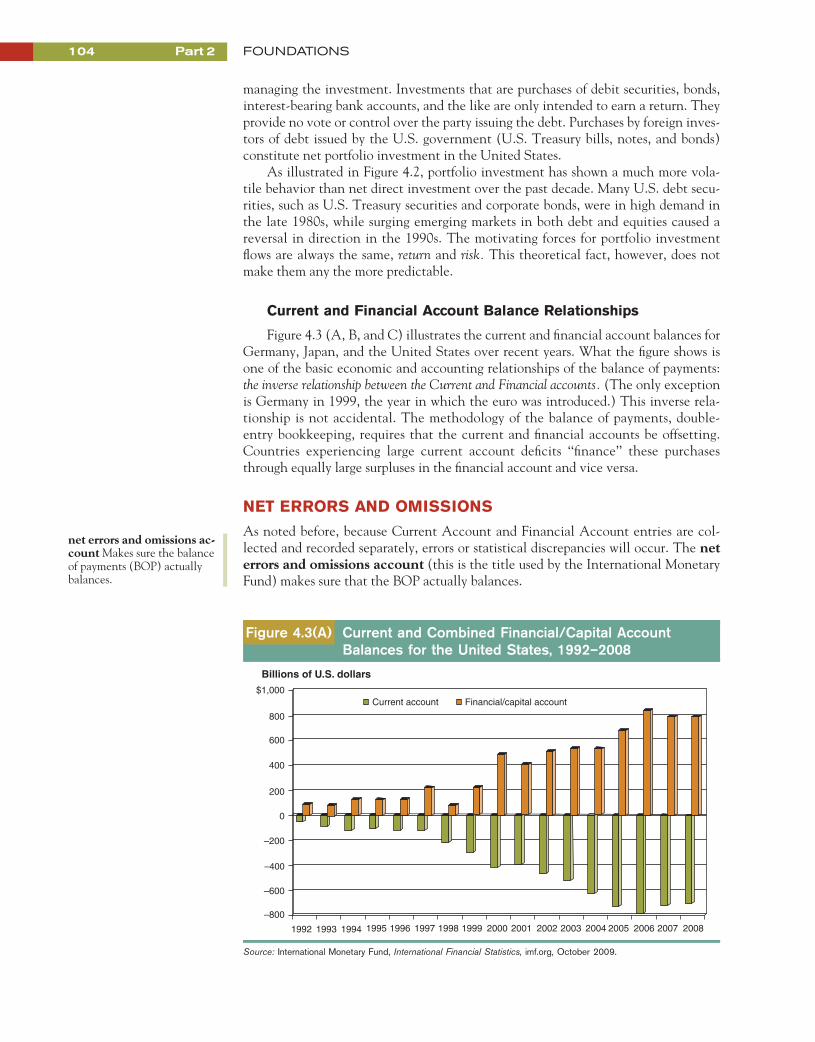
Current and Financial Account Balance Relationships
Figure 4.3 (A, B, and C) illustrates the current and financial account balances forGermany, Japan, and the United States over recent years. What the figure shows isone of the basic economic and accounting relationships of the balance of payments:the inverse relationship between the Current and Financial accounts. (The only exceptionis Germany in 1999, the year in which the euro was introduced.) This inverse rela-tionship is not accidental. The methodology of the balance of payments, double-entry bookkeeping, requires that the current and financial accounts be offsetting.Countries experiencing large current account deficits ‘‘finance’’ these purchasesthrough equally large surpluses in the financial account and vice versa.
NET ERRORS AND OMISSIONS
As noted before, because Current Account and Financial Account entries are col-lected and recorded separately, errors or statistical discrepancies will occur. The neterrors and omissions account (this is the title used by the International MonetaryFund) makes sure that the BOP actually balances.
Figure 4.3(A) Current and Combined Financial/Capital AccountBalances for the United States, 1992–2008
Current account Financial/capital account$1,000
Billions of U.S. dollars
800
600
400
200
0
–200
–400
–600
–800
1992 1993 1994 1995 1996 1997 1998 1999 2000 2001 2002 2003 2004 2005 2006 2007 2008
Source: International Monetary Fund, International Financial Statistics, imf.org, October 2009.
net errors and omissions ac-count Makes sure the balanceof payments (BOP) actuallybalances.
104 Part 2 FOUNDATIONS

E1C04 07/16/2010 Page 105
OFFICIAL RESERVES ACCOUNT
The official reserves account is the total currency and metallic reserves heldby official monetary authorities within the country. These reserves are normallycomposed of the major currencies used in international trade and financial transac-tions (so-called hard currencies like the U.S. dollar, German mark, and Japaneseyen) and gold.
Figure 4.3(B) Current and Combined Financial/Capital AccountBalances for Japan, 1992–2008
Current account Financial/capital account$250
Billions of U.S. dollars
200
150
100
50
0
–50
–100
–150
–200
1992 1993 1994 1995 1996 1997 1998 1999 2000 2001 2002 2003 2004 2005 2006 2007 2008
Source: International Monetary Fund, International Financial Statistics, imf.org, October 2009.
Figure 4.3(C) Current and Combined Financial/Capital AccountBalances for Germany, 1992–2008
Current account Financial/capital account$300
Billions of U.S. dollars
200
100
–0
–100
–200
–300
–4001992 1993 1994 1995 1996 1997 1998 1999 2000 2001 2002 2003 2004 2005 2006 2007 2008
Source: International Monetary Fund, International Financial Statistics, imf.org, October 2009.
official reserves account Anaccount in the BOP statementthat shows (1) the change inthe amount of funds immedi-ately available to a country formaking international pay-ments and (2) the borrowingand lending that has takenplace between the monetaryauthorities of different countr-ies either directly or throughthe International MonetaryFund.
The Balance of Payments Chapter 4 105
E1C04 07/16/2010 Page 106
The significance of official reserves depends generally on whether the countryis operating under a fixed-exchange-rate regime or a floating-exchange-ratesystem. If a country’s currency is fixed, this means that the government of thecountry officially declares that the currency is convertible into a fixed amount ofsome other currency. For example, for many years the South Korean won was fixedto the U.S. dollar at 484 won equal to 1 U.S. dollar. It is the government’s respon-sibility to maintain this fixed rate (also called parity rate). If for some reason thereis an excess supply of Korean won on the currency market, to prevent the value ofthe won from falling, the South Korean government must support the won’s valueby purchasing won on the open market (by spending its hard currency reserves, itsofficial reserves) until the excess supply is eliminated. Under a floating-rate system,the government possesses no such responsibility and the role of official reserves isdiminished.
THE BALANCE OF PAYMENTS IN TOTAL
3. To understand the criti-cal differences betweentrade in merchandise andservices, and why interna-tional investment activityhas recently been contro-versial in the United States
Table 4.3 provides the official balance of payments for the United States as pre-sented by the International Monetary Fund (IMF), the multinational organizationthat collects these statistics for more than 160 different countries around theglobe. Now that the individual accounts and the relationships among theaccounts have been discussed, Table 4.3 gives a comprehensive overview of howthe individual accounts are combined to create some of the most useful summarymeasures for multinational business managers.
The current account (line A in Table 4.3), the capital account (line B), andthe financial account (line C) combine to form the basic balance (Total, GroupsA through C). This is one of the most frequently used summary measures of theBOP. It is used to describe the international economic activity of the nation asdetermined by market forces, not by government decisions (such as currencymarket intervention). The U.S. basic balance totaled a deficit of –$196 billion in2008. A second frequently used summary measure, the overall balance,also called the official settlements balance (Total of Groups A through D inTable 4.3), was at a surplus of $4 billion in 2008.
The meaning of the balance of payments has changed over the past 30 years. Aslong as most of the major industrial countries were still operating under fixedexchange rates, the interpretation of the BOP was relatively straightforward. A sur-plus in the BOP implied that the demand for the country’s currency exceeded thesupply, and that the government should then allow the currency value to increase(revalue) or to intervene and accumulate additional foreign currency reserves in theOfficial Reserves Account. This would occur as the government sold its own cur-rency in exchange for other currencies, thus building up its stores of hard currencies.A deficit in the BOP implied an excess supply of the country’s currency on worldmarkets, and the government would then either devalue the currency or expend itsofficial reserves to support its value. But the transition to floating exchange rate re-gimes in the 1970s (described in the following chapter) changed the focus from thetotal BOP to its various subaccounts like the Current and Financial Account bal-ances. These are the indicators of economic activities and currency repercussionsto come. The crises in Mexico (1994), Asia (1997), Turkey (2001), and Argentinaand Venezuela (2002) highlight the continuing changes in the role of the balanceof payments.
fixed-exchange-rate Thegovernment of a country offi-cially declares that its cur-rency is convertible into afixed amount of some othercurrency.
floating-exchange-rateUnder this system, the govern-ment possesses no responsibilityto declare that its currency isconvertible into a fixed amountof some other currency; this di-minishes the role of officialreserves.
106 Part 2 FOUNDATIONS

E1C
0407/16/2010
Page
107
Table 4.3 The U.S. Balance of Payments, Analytic Presentation, 1998–2008 (billions of U.S. dollars)
1998 1999 2000 2001 2002 2003 2004 2005 2006 2007 2008
A. Current Account �213 �300 �417 �385 �461 �523 �625 �729 �804 �727 �706
Goods: exports fob 672 686 775 722 686 717 811 898 1020 1142 1281Goods: imports fob �917 �1030 �1227 �1148 �1167 �1264 �1477 �1682 �1863 �1969 �2117Balance on Goods �245 �344 �452 �426 �481 �548 �666 �783 �844 �827 �836
Services: credit 261 280 296 283 289 301 350 385 432 501 546Services: debit �181 �199 �224 �222 �231 �250 �291 �314 �349 �375 �405Balance on Goods and Services �165 �263 �380 �365 �424 �497 �608 �712 �760 �701 �696
Income: credit 262 294 351 291 281 320 414 535 682 819 765Income: debit �258 �280 �330 �259 �254 �275 �347 �463 �634 �728 �646Balance on Goods, Services, and Income �160 �249 �359 �333 �396 �452 �541 �639 �712 �611 �578
Current transfers: credit 10 9 11 9 12 15 20 19 26 23 22Current transfers: debit �63 �59 �69 �60 �77 �87 �105 �109 �117 �139 �150
B. Capital Account �1 �5 �1 �1 �1 �3 �2 �4 �4 �2 1
Capital account: credit 1 1 1 1 1 1 1 1 1 2 5Capital account: debit �2 �6 �2 �2 �2 �4 �3 �5 �5 �4 �4
Total Groups A plus B �214 �305 �418 �386 �463 �527 �627 �733 �807 �728 �705
C. Financial Account 77 227 478 405 504 532 530 687 807 664 509
Direct investment 36 65 162 25 �70 �86 �170 76 �2 �123 �12Direct investment abroad �143 �225 �159 �142 �154 �150 �316 �36 �245 �399 �332Direct investment in United States 179 289 321 167 84 64 146 113 243 276 320
Portfolio investment assets �130 �122 �128 �91 �49 �123 �177 �258 �499 �396 117Equity securities �101 �114 �107 �109 �17 �118 �85 �187 �137 �148 �1Debt securities �29 �8 �21 18 �32 �5 �93 �71 �362 �248 119
Portfolio investment liabilities 188 286 437 428 428 550 867 832 1127 1155 528Equity securities 42 112 194 121 54 34 62 89 145 276 110
Debt securities 146 173 243 307 374 516 806 743 981 879 417
(continued )
107

E1C
0407/16/2010
Page
108
Financial derivatives, net 0 0 0 0 0 0 0 0 30 6 �30
Other investment assets �74 �166 �273 �145 �88 �54 �510 �267 �544 �677 219Monetary authorities 0 0 0 0 0 0 0 0 0 �24 �530General government 0 3 �1 0 0 1 2 6 5 2 0Banks �36 �71 �133 �136 �38 �26 �359 �151 �343 �494 356Other sectors �38 �98 �139 �9 �50 �29 �153 �121 �207 �161 393
Other investment liabilities 57 165 280 187 283 244 520 303 695 699 �313Monetary authorities 7 25 �11 35 70 11 13 8 2 �11 29General government �3 �1 �2 �2 0 �1 0 0 3 5 9Banks 30 67 123 88 118 136 347 232 344 466 �268Other sectors 23 74 171 66 96 98 160 62 346 238 �83
Total, Groups A through C �138 �77 60 19 41 5 �98 �46 �1 �65 �196
D. Net Errors and Omissions 144 69 �59 �14 �38 �6 95 32 �2 65 200
Total, Groups A through D 7 �9 0.31 4.88 3.71 �1.33 �2.80 �14.10 �2 0 4
E. Reserves and Related Items �7 9 0 �5 �4 2 3 14 2 0 �5
Note: Totals may not match original source due to rounding.
Source: International Monetary Fund, International Financial Statistics, imf.org, September 2009.
Table 4.3 (Continued)
1998 1999 2000 2001 2002 2003 2004 2005 2006 2007 2008
108
E1C04 07/16/2010 Page 109
THE BALANCE OF PAYMENTS AND ECONOMICCRISES
4. To review the mechani-cal steps of howexchange rate changesare transmitted intoaltered trade prices andeventually trade volumes
The sum of cross-border international economic activity—the balance of pay-ments—can be used by international managers to forecast economic conditions and,in some cases, the likelihood of economic crises. The mechanics of internationaleconomic crisis often follow a similar path of development:
1. A country that experiences rapidly expanding current account deficits willsimultaneously build financial account surpluses (the inverse relationshipnoted previously in this chapter).
2. The capital that flows into a country, giving rise to the financial account sur-plus, acts as the ‘‘financing’’ for the growing merchandise/services deficits—the constituent components of the current account deficit.
3. Some event, whether it be a report, a speech, an action by a government orbusiness inside or outside the country, raises the question of the country’s eco-nomic stability. Investors of many kinds, portfolio and direct investors in thecountry, fearing economic problems in the near future, withdraw capital fromthe country rapidly to avoid any exposure to this risk. This is prudent for theindividual, but catastrophic for the whole if all individuals move similarly.
4. The rapid withdrawal of capital from the country, so-called capital flight, re-sults in the loss of the financial account surplus, creating a severe deficit in thecountry’s overall balance of payments. This is typically accompanied by rapidcurrency depreciation (if a floating-rate currency) or currency devaluation (ifa fixed-rate currency).
International debt and economic crises have occurred for as long as there havebeen international trade and commerce. And they will occur again. Each crisis has itsown unique characteristics, but all follow some of the economic fundamentals de-scribed earlier (the one additional factor that differentiates many of the crises iswhether inflation is a component). The Asian economic crisis was a devastating re-minder of the tenuousness of international economic relationships.
THE ASIAN CRISIS
The roots of the Asian currency crisis extended from a fundamental change in theeconomics of the region—the transition of many Asian nations from net exportersto net importers. Starting as early as 1990 in Thailand, the rapidly expandingeconomies of the Far East began importing more than they exported, requiringmajor net capital inflows to support their currencies. As long as the capital contin-ued to flow in—for manufacturing plants, dam projects, infrastructure development,and even real estate speculation—the pegged exchange rates of the region could bemaintained. When the investment capital inflows stopped, however, crisis wasinevitable.
The most visible roots of the crisis were the excesses in capital flows into Thai-land in 1996 and early 1997. With rapid economic growth and rising profits formingthe backdrop, Thai firms, banks, and finance companies had ready access to capitalon the international markets, finding cheap U.S. dollar loans offshore. Thai bankscontinued to raise capital internationally, extending credit to a variety of domesticinvestments and enterprises beyond the level that the Thai economy could support.Capital flows into the Thai market hit record rates, pouring into investments of allkinds, including manufacturing, real estate, and even equity market margin-lending.As the investment ‘‘bubble’’ expanded, some participants raised questions about the
The Balance of Payments Chapter 4 109

E1C04 07/16/2010 Page 110
economy’s ability to repay the rising debt. The baht came under sudden andsevere pressure.
Currency Collapse
The Thai government and central bank intervened in the foreign exchangemarkets directly (using up precious hard currency reserves) and indirectly (by raisinginterest rates to attempt to stop the continual out-flow). The Thai investment marketsground to a halt, causing massive currency losses and bank failures. On July 2, 1997,the Thai central bank, which had been expending massive amounts of its limited for-eign exchange reserves to defend the baht’s value, finally allowed the baht to float (orsink in this case). The baht fell 17 percent against the U.S. dollar and more than 12percent against the Japanese yen in a matter of hours. By November, the baht hadfallen from Baht25/US$ to Baht40/US$, a fall of about 38 percent. As illustrated inTable 4.4, Thailand was not alone in creating massive current account deficits in theperiod leading up to 1997. In fact, with the rather special exceptions of China andSingapore, all of East Asia was in current account deficit beginning in 1994.
Within days, a number of neighboring Asian nations, some with and some with-out characteristics similar to Thailand, came under speculative attack by currencytraders and capital markets. The Philippine peso, the Malaysian ringgit, and theIndonesian rupiah all fell within months, as shown in Figure 4.4. In late October,Taiwan caught the markets off balance with a surprise competitive devaluation of15 percent. The Taiwanese devaluation seemed only to renew the momentum of thecrisis. Although the Hong Kong dollar survived (at great expense to the centralbank’s foreign exchange reserves), the Korean won was not so lucky. In Novemberthe historically stable Korean won also fell victim, falling from Won900/US$ tomore than Won1100/US$. By the end of November the Korean government was inthe process of negotiating a US$50 billion bailout of its financial sector with theInternational Monetary Fund (IMF). The only currency that had not fallen besidesthe Hong Kong dollar was the Chinese renminbi, which was not freely convertible.Although the renminbi had not been devalued, there was rising speculation thatthe Chinese government would devalue it for competitive reasons. Figure 4.4 showsthe change in exchange rates for four of these Asian economies.
Causal Complexities
The Asian economic crisis—for the crisis was more than just a currencycollapse—had many roots besides the traditional balance of payments difficulties.The causes are different in each country, yet there are specific underlying similaritiesthat allow comparison: corporate socialism, corporate governance, and banking sta-bility and management.
Corporate Socialism Although Western markets have long known the cold indif-ference of the free market, the countries of post–World War II Asia have largelyknown only the good. Because of the influence of government and politics in thebusiness arena, even in the event of failure, government would not allow firms tofail, workers to lose their jobs, or banks to close. When the problems reached the sizeseen in 1997, the business liability exceeded the capacities of governments to bailbusiness out. Practices that had persisted for decades without challenge, such as life-time employment, were now no longer sustainable. The result was a painful lesson inthe harshness of the marketplace.
Corporate Governance An expression largely unused until the 1990s, corporategovernance refers to the complex process of how a firm is managed and operated,
110 Part 2 FOUNDATIONS

E1C
0407/16/2010
Page
111
Table 4.4 Current Account Balances of East Asian Countries, 1988–1999 (millions of U.S. dollars)
1988 1989 1990 1991 1992 1993 1994 1995 1996 1997 1998 1999
Deficit CountriesIndonesia �1,397 �1,108 �2,988 �4,260 �2,780 �2,106 �2,792 �6,431 �7,663 �4,889 4,096 5,785Korea 14,538 5,387 �1,745 �8,291 �3,944 990 �3,867 �8,507 �23,006 �8,167 40,365 24,477Malaysia 1,867 315 �870 �4,183 �2,167 �2,991 �4,520 �8,644 �4,462 �5,935 9,529 12,606Philippines �390 �1,456 �2,695 �1,034 �1,000 �3,016 �2,950 �1,980 �3,953 �4,351 1,546 7,910Thailand �1,654 �2,498 �7,281 �7,571 �6,303 �6,364 �8,085 �13,554 �14,691 �3,021 14,243 12,428Subtotal 12,964 640 �15,579 �25,339 �16,194 �13,487 �22,214 �39,116 �53,775 �26,363 68,779 63,206
Surplus CountriesChina �3,802 �4,317 11,997 13,272 6,401 �11,609 6,908 1,618 7,243 36,963 31,472 15,667Singapore 1,882 2,923 3,097 4,884 5,915 4,211 11,400 14,436 13,898 16,912 21,025 21,254Subtotal �1,920 �1,394 15,094 18,156 12,316 �7,398 18,308 16,054 21,141 53,875 52,497 36,921
Asian Crisis
‘‘Deficit Countries’’ are those with current account balances that were negative for the 1994 to 1997 period, leading up to the Asian Crisis.‘‘Surplus Countries’’ are those with current account balances that were positive for the 1994 to 1997 period. Hong Kong and Taiwan are not listed, as they are not individually reported by the IMF.The Asian Crisis actually began with the devaluation of the Thai baht on July 1, 1997. However, given annual balance of payments statistics, it is shown here between the 1997 and 1998 calendar years.
Source: Data abstracted from the International Monetary Fund, Balance of Payments Statistics Yearbook 2000.
111

E1C04 07/16/2010 Page 112
who it is accountable to, and how it reacts to changing business conditions. There islittle doubt that many firms operating within the Far Eastern business environmentswere often largely controlled by either families or groups related to the governingparty or body of the country. The interests of stockholders and creditors were oftensecondary at best to the primary motivations of corporate management. Withoutfocusing on ‘‘the bottom line,’’ the bottom line deteriorated.
Banking Liquidity and Management Banking is one of those sectors that has def-initely fallen out of fashion in the past two decades. Bank regulatory structures andmarkets have been deregulated nearly without exception around the globe. The cen-tral role played by banks in the conduct of business, however, was largely ignored andunderestimated. As firms across Asia collapsed, as government coffers were emptied,as speculative investments made by the banks themselves failed, banks closed. With-out banks, the ‘‘plumbing’’ of business conduct was shut down. Firms could not ob-tain the necessary working capital financing they needed to manufacture theirproducts or provide their services. This pivotal role of banking liquidity was the focusof the International Monetary Fund’s bail-out efforts.
The Asian economic crisis had global impact. What started as a currency crisisquickly became a regionwide recession (or depression, depending on definitions).3
The slowed economies of the region quickly caused major reductions in world de-mand for many products, commodities especially. World oil markets, copper markets,and agricultural products all saw severe price falls as demand fell. These price fallswere immediately noticeable in declining earnings and growth prospects for otheremerging economies.
The post-1997 period has been one of dramatic reversal for the countries of EastAsia. As Table 4.4 illustrates, beginning in 1998, every nation within East Asia listedhas run a current account surplus as a result of massive recession (imports fell volun-tarily, as well as being restricted by governments), significant domestic currency de-valuation (resulting in significantly lower purchasing power, hence the countries
Figure 4.4 Dollar Index
110
100
90
80
70
60
50
40
30
20
101998 1999 2000 2001
Thai Baht Philippines Pesos Malaysian Ringgit Indonesian Ruplah
Source: Pacific Exchange Rate Service, http://fx.sauder.ubc.ca � 2002 by Prof. Werner Antweiler, University of BritishColumbia, Vancouver B.C., Canada. Time period shown in diagram: April 1, 1997 through February 1, 2002.Reproduced with permission.
112 Part 2 FOUNDATIONS

E1C04 07/16/2010 Page 113
could no longer afford to purchase imports), and rising exports (as currency de-valuation made their merchandise relatively cheaper for countries in other parts ofthe world to purchase). Unfortunately, the adjustment period has been one ofmassive unemployment, social disruption, and economic reconstruction with highhuman cost.
CAPITAL MOBILITY
5. To understand howcountries with differentgovernment policiestoward international tradeand investment, or differ-ent levels of economicdevelopment, differ in theirbalance of payments
As we have seen, the degree to which capital moves freely cross-border is criticallyimportant to a country’s balance of payments. We have already seen how theUnited States, while experiencing a deficit in its Current Account balance overthe past 20 years, has simultaneously enjoyed a Financial Account surplus. But theability of capital to move involves both economic and political factors. The open-ness of the U.S. economy, the depth and breadth of its financial markets, and itsrelative political stability, have all contributed to making the United States anattractive nation for capital investment of all kinds. Other countries, however, de-pending on their economic prospects and their political openness, may not alwaysattract capital.
Before leaving our discussion of the balance of payments we need to gain addi-tional insights into the history of capital mobility and the contribution of capitalinflows and capital outflows (so-called capital flight) to the balance of payments ofselected countries in recent years.
Has capital always been free to move in and out of a country? Definitely not.The ability of foreign investors to own property, buy businesses, or purchase stocksand bonds in other countries has been controversial. Obstfeld and Taylor (2001)studied the globalization of capital markets and concluded that the pattern illustratedin Figure 4.5 is a fair representation of the ‘‘conventional wisdom’’ on the openness of
Figure 4.5 A Stylized View of Capital Mobility in Modern History
High
Low
1860 1880 1900 1920 1940 1960 1980 2000
1900
Gold Standard1880–1914
CapitalMobility
Bretton Woods1845–1971
Interwar 1914–1945
Float1971–2000
1880
18901918 1925
1929
1980
1960
2000
1971
1945
1914
Source: ‘‘Globalization and Capital Markets,’’ Maurice Obstfeld and Alan M. Taylor, NBER Conference Paper, May 4–5,2001, p. 6.
The Balance of Payments Chapter 4 113

E1C04 07/16/2010 Page 114
global capital markets in recent history.4 Since 1860, the gold standard in use prior toWorld War I and the post-1971 period of floating-exchange-rates have seen thegreatest ability of capital to flow cross-border. Note that Figure 4.5 uses no specificquantitative measure of mobility. The diagram uses only a stylized distinction be-tween ‘‘low’’ and ‘‘high,’’ combining two primary factors, the exchange rate regimesand the state of international, political, and economic relations.
Obstfeld and Taylor argue that the post-1860 era can be subdivided into fourdistinct periods.
1. The first, 1860–1914, was a period characterized by continuously increasingcapital openness as more and more countries adopted the gold standard andexpanded international trade relations.
2. The second period, 1914–1945, was a period of global economic destruction.The combined destructive forces of two world wars and a worldwide depres-sion led most nations to move toward highly nationalistic and isolationist po-litical and economic policies, effectively eliminating any significantmovement of capital between countries.
3. The third period, 1945–1971, the Bretton Woods era, saw a great expansionof international trade in goods and services. This time also saw the slow butsteady recovery of capital markets. The fixed-exchange-rate regime of BrettonWoods may have failed because the sheer forces of global capital could nolonger be held in check.
4. The fourth and current period, 1971–2000 [2002], is a period characterized byfloating-exchange-rates and economic volatility, but rapidly expanding cross-border capital flows. The major industrial countries either no longer try, nolonger need, or no longer can control the movement of capital. Because cur-rency markets are free to reflect underlying economic fundamentals and in-vestor sentiments about the future, capital movements increased in responseto this openness.
Of course, this is a stylized global view, and the situations of the individual coun-tries always have their own characteristics. The currency crises of the latter half ofthe 1990s and of the early twenty-first century may result in the reversal of this free-dom of cross-border capital movement; it is still too early to tell. It is clear, however,that the ability to move instantaneously and massively cross-border has been one ofthe major factors in the severity of recent currency crises.
CAPITAL FLIGHT
Many recent global and financial crises have been characterized by sudden andshocking outflows of capital from the national economy, capital flight. Although nosingle accepted definition of capital flight exists, the term is traditionally used to de-scribe sudden capital withdrawals by investors from countries in which they perceivea political, economic, or currency crisis to be forthcoming. The capital is typicallyportfolio investments and bank deposits (a component of ‘‘other investment’’ withinthe Financial Accounts in the balance of payments), and may be owned or controlledby both domestic and foreign investors. Much like a bank run, it is typically charac-terized by nearly irrational or panic behavior, as no one wants to be the last one inline to try to take their money out of a falling economy.
The rapid and sometimes illegal transfer of capital out of a country poses signifi-cant economic and political problems. Many heavily indebted countries have suf-fered significant capital flight, which has compounded their problems of debt service.
Five primary mechanisms exist by which capital may be moved from one countryto another.
114 Part 2 FOUNDATIONS

E1C04 07/16/2010 Page 115
1. Transfers via the usual international payments mechanisms, regular banktransfers, are obviously the easiest and lowest cost, and are legal. Most eco-nomically healthy countries allow free exchange of their currencies, but ofcourse for such countries ‘‘capital flight’’ is not a problem.
2. Transfer of physical currency by bearer (the proverbial smuggling of cash inthe false bottom of a suitcase) is more costly and, for transfers out of manycountries, illegal. Such transfers may be deemed illegal for balance of pay-ments reasons or to make difficult the movement of money from the drugtrade or other illegal activities.
3. The transfer of cash into collectibles or precious metals, which are then trans-ferred across borders.
4. Money laundering, the cross-border purchase of assets that are then managedin a way that hides the movement of money and its ownership.
5. False invoicing of international trade transactions. Capital is moved throughthe underinvoicing of exports or the overinvoicing of imports, where the dif-ference between the invoiced amount and the actually agreed-upon paymentis deposited in banking institutions in a country of choice.
The concern over capital movements—both in and out of a country—has ledmany countries to institute a variety of capital controls at different times in history.
Capital Inflows: The Case of China
The Chinese balance of payments serves as an interesting example of one coun-try’s ongoing efforts to manage its current and financial accounts. As illustrated inFigure 4.6, China was the recipient of massive capital inflows between 1993 and1997. This reflected a return to political norms following the Tiananmen Squareevents of 1989, and the perceived growing promise of the Chinese marketplace.Simultaneously, the country enjoyed a small but positive current account surplus.Both accounts, however, were heavily managed through complex Chinese regulationand intervention. Capital inflows are through a permit process, with foreign investors
Figure 4.6 Current and Combined Financial/Capital AccountBalances for China, 1998–2008
Current account Financial/capital account$450,000
400,000
350,000
300,000
250,000
200,000
150,000
100,000
50,000
0
–50,000
Millions of U.S. dollars
1998 1999 2000 2001 2002 2003 2004 2005 2006 2007 2008
Source: International Monetary Fund, International Financial Statistics, imf.org, September 2009.
The Balance of Payments Chapter 4 115
E1C04 07/16/2010 Page 116
being largely limited to joint venture investments within the country. At the sametime, the Chinese government has aggressively promoted exports of many productswhile exercising extreme control over imports, both in content and quantity.
The onslaught of the Asian Crisis in 1997, however, clearly brought the capitalinflows to a halt (India suffered a similar fate as well). The Chinese financial accountbalance fell back, suffering a deficit in 1998, and near zero balances in 1999 and 2000.But with the new millennium (remember, the official start of the new century wasJanuary 1, 2001, not 2000), China’s attractiveness returned, as it was the recipient ofmore than $35 billion in capital inflows in 2001 alone. This massive capital injectionby global investors—primarily multinational corporations—was indicative of the per-ceived attractiveness of the Chinese economy for future economic growth and therenewed comfort these investors felt with the current Chinese political regime.
Capital Outflows: The Case of Turkey
Turkey’s economic and financial crisis of 2000–2001 serves as a prime example ofhow a country’s balance of payments can deteriorate—or essentially collapse—in avery short period of time. Although there were a series of political, economic, andsocial ills that combined during the height of the crisis, a very large part of Turkey’scrisis arose from capital flight. Figure 4.7 illustrates some of Turkey’s financialaccounts and how they deteriorated suddenly in 2001.
In the late 1990s many of Turkey’s largest and most powerful banks borrowedlarge quantities of U.S. dollars on the international financial markets. The capitalwas not used for loans or development in Turkey, but rather on speculation relatedto Turkish government bonds. Bank funds and financing is listed in the ‘‘net otherinvestment’’ subcategory of the balance of payments, and Turkey’s net inflows 1997–2000 are obvious from Figure 4.7. However, a political crisis in February 2001 initi-ated a series of economic crises in Turkey, including the collapse of its currency.With this crisis, the capital that had so readily flowed into Turkey in the previous
FOCUSON
POLITICSMY BIG FAT GREEK DEBT(KRISIS)
The Greek debt crisis (krisis in Greek, thelanguage which gave us the term ‘‘crisis’’) of
2010, and its contagious spread to the value of the euro andthe members of the European Union, although not a traditionalGreek tragedy, is certainly a challenge to the political econ-omy of Europe. The problem, however, is that the problem is abit tricky with Greece’s membership within the EU.
The Greek government has for many years spent more thanit took in, running a government (fiscal) deficit. And like so manyother governments before it, it prints pieces of paper and sellsthis paper, government bonds, to the global public. These Greekgovernment bonds, also termed sovereign debt, are denomi-nated in euros. The growing possibility of the Greek govern-ment’s inability to pay these debts in a timely manner has led toa series of loans by both the EU and the international communityto Greece to allow it time to get its house in order.
The threat to Greece’s balance of payments from the debtcrisis arises more from the country’s credit rating, however, thanthe actual debt service payments. Greek companies of all kinds,including those that produce products for export, need to beable to borrow money from banks to help fund their working
capital––their receivables and inventories––in everyday opera-tions. When Greece’s credit rating was downgraded to junkbond status in the spring of 2010, it dramatically increased thecost of borrowing for Greece on the global market. But evenmore critically, it meant that Greek commercial banks could nolonger use Greek bonds as collateral to borrow more moneyfrom the European Central Bank. If the banks could not borrow,they could not lend. If they could not lend, Greek businesses ofall kinds, including exporters, would grind to a halt.
The European Central Bank, sensing the crisis, took thepolitically dangerous move of changing its rules, allowing junkbond credit quality issues to now be used as collateral, ahighly controversial move to keep the Greek banks open andoperating. Although all agree that it will not be enough to rightthe sinking Greek ship, it may save Greek business anotherday to fight the good fight, and give it time to cut public spend-ing and decrease its ever-growing budget deficit.
Source: ‘‘Greek Debt Restructuring to Avoid Euro Tragedy Could Become Script,’’John Dizard, Financial Times, May 8, 2010, p. 14; ‘‘ECB Suspends Rating Limitson Greek Debt,’’ Geoffrey T. Smith, Wall Street Journal, May 3, 2010; ‘‘Leaders:Acropolis Now; Europe’s Soverign Debt Crisis,’’ The Economist, May 1, 2010,p. 11; ‘‘Neither a Borrower nor a Lender Be: Germany and Greece,’’ The Econo-mist, May 1, 2010, p. 65; ‘‘Greek Debt Downgraded to Junk,’’ Peter Whoriskey andDina ElBoghdady, The Washington Post, April 28, 2010, p. A1.
116 Part 2 FOUNDATIONS

E1C04 07/16/2010 Page 117
years now flew out. The devastating amount in 2001, more than $12 billion, resultedin a structural collapse of the Turkish banking system.
S U M M A R Y
The balance of payments is the summary statement of all in-ternational transactions between one country and all othercountries. The balance of payments is a flow statement, sum-marizing all the international transactions that occur acrossthe geographic boundaries of the nation over a period oftime, typically a year. Because of its use of double-entrybookkeeping, the BOP must always balance in theory,though in practice there are substantial imbalances as a re-sult of statistical errors and misreporting of current accountand capital account flows.
The two major subaccounts of the balance of payments,the current account and the capital account, summarize thecurrent trade and international capital flows of the country.
Due to the double-entry bookkeeping method of accounting,the current account and capital account are always inverseon balance, one in surplus while the other experiences defi-cit. Although most nations strive for current account sur-pluses, it is not clear that a balance on current or capitalaccount, or a surplus on current account, is either sustain-able or desirable. The monitoring of the various subaccountsof a country’s balance of payments activity is helpful to deci-sion makers and policymakers at all levels of government andindustry in detecting the underlying trends and movementsof fundamental economic forces driving a country’s interna-tional economic activity.
K E Y T E R M S
balance of payments (BOP) 96
current account 96
financial account 96
double-entry bookkeeping 97
net errors and omissionsaccount 104
official reserves account 105
fixed-exchange-rate 106
floating-exchange-rate 106
Q U E S T I O N S F O R D I S C U S S I O N
1. Why must a country’s balance of payments always bebalanced in theory?
2. What is the difference between the merchandise tradebalance (BOT) and the current account balance?
3. What is service trade?
4. Why is foreign direct investment so much more contro-versial than foreign portfolio investment? How did this relateto Mexico in the 1990s?
Figure 4.7 Turkey’s Financial Accounts in Crisis, 1997–2001(billions of U.S. dollars)
$8
6
4
2
0
–2
–4
–6
–8
–10
–12
–141997
Net direct investment Net portfolio investment Net other investment
1998 1999 2000 2001
Source: International Monetary Fund, Balance of Payments Statistics Yearbook, 2002.
The Balance of Payments Chapter 4 117