Embed Size (px)
Citation preview
Why do People Stay?Insider Advantages andImmobility
Peter A. FischerEinar HolmGunnar MalmbergThomas Straubhaar
HWWA DISCUSSION PAPER
112Hamburgisches Welt-Wirtschafts-Archiv (HWWA)
Hamburg Institute of International Economics2000
ISSN 1616-4814

The HWWA is a member of:
• Wissenschaftsgemeinschaft Gottfried Wilhelm Leibniz (WGL)• Arbeitsgemeinschaft deutscher wirtschaftswissenschaftlicher Forschungsinstitute (ARGE)• Association d‘Instituts Européens de Conjoncture Economique (AIECE)
Why do People Stay?Insider Advantages andImmobility
Peter A. FischerEinar HolmGunnar MalmbergThomas Straubhaar
This paper is part of the research programme „Internationalisation of Labour Markets"

HWWA DISCUSSION PAPER
Edited by thePRESIDENTIAL DEPARTMENT
Hamburgisches Welt-Wirtschafts-Archiv (HWWA)Hamburg Institute of International Economics
ÖffentlichkeitsarbeitNeuer Jungfernstieg 21 − 20347 HamburgTelefon: 040/428 34 355Telefax: 040/428 34 451e-mail: [email protected]: http://www.hwwa.de/
Thomas StraubhaarHamburg Institute of Internatinal EconomicsEuropa-Kolleg HamburgCEPR LondonTelefon: 040/428 34 350Telefax: 040/428 34 529e-mail: [email protected]
Einar Holm, Gunnar MalmbergDepartment of Social and Economic GeographyUniversity of Umeå, SchwedenTel.: (4690) 786 5495Fax: (4690) 166 359e-mail: [email protected]: [email protected]
Peter A. FischerEconomics Editor – WirtschaftsredaktionNeue Zürcher ZeitungTel.: 0041 1 258 1111/1086Fax: 0041 1 252 13 29e-mail: [email protected]
5
Contents
Abstract/Zusammenfassung 6
1 Introduction 7
2. Explaining (im)mobility 8
3 The Model and Data 13
3.1 The Model 13
3.2 The Data 15
4 Determinants of Immobility: Estimation Results 17
4.1 Duration and socio-economic Characteristics Matter 17
4.2 Poor Performance of Regional Macro Variables 25
4.3 Life-course Specificity and the Labour Market 26
4.4 Place of Birth and Occupation make little Difference 29
4.5 Group-specific Heterogeneity 30
5 Conclusions and Interpretation 32
References 34
Appendix 37
6
Abstract
The low mobility of people in Europe is considered a problem for adjustment toasymmetric shocks and regional convergence in the European Monetary Union. Wesuggest a complement to the traditional migration theories, the insider advantagesapproach to explain why most Europeans prefer to stay. Staying immobile they haveaccumulated work- and leisure-oriented insider advantages that are location-specific andwould be lost in the case of emigration. Therefore, the longer people have stayed -andthe more insider advantages they have accumulated-, the less likely they are to move.Using a new micro dataset covering all people resident in Sweden in 1994 and theirmobility experience since 1985, we find a strong positive duration dependence of theprobability to stay. Traditional micro-economic characteristics prove helpful inexplaining immobility, while regional macro-economic differences have surprisinglylittle impact on individual mobility decisions. A large proportion of the moves betweenSwedish labour markets seem to be related to specific life-course events rather than topure labour market issues.
Zusammenfassung
Wieso ist die Mobilität der Arbeitskräfte innerhalb der Europäischen Union � allerFreizügigkeit zum Trotz � so gering? Traditionelle Theorieansätze vermögen dieschwach ausgeprägte Wanderungsintensität der EU-Angehörigen nur begrenzt zu er-klären. Denn eigentlich sollten die teilweise beträchtlichen Einkommens- undBeschäftigungsunterschiede zu weit mehr Migration innerhalb der EU führen. In diesemDiskussionspapier entwickeln wir eine Idee, die sehr wohl zu erklären vermag, weshalbfür die meisten Menschen �stehen� die bessere Alternative als �gehen� ist. Der Insider-Ansatz macht deutlich, weshalb für die individuelle Entscheidung eine grenz- undkulturraumüberschreitende Wanderung die Ausnahme und nicht die Regel ist. Dieempirische Überprüfung mit Hilfe eines neuen originären Mikro-Datensets, das diegesamte schwedische Wohnbevölkerung enthält, bestätigt die These, dass die Verweil-dauer einen direkten positiven Einfluss auf die Verharrenswahrscheinlichkeit ausübt.Wer lange an einem Ort lebt, wird immer wahrscheinlicher an diesem Ort bleiben!
JEL-codes: F22, J60, R23
7
1. IntroductionΗ
In the recently introduced European Monetary Union (EMU) it is no longer possible toreact to asymmetric macroeconomic shocks with exchange rate changes. Instead, thenecessary adjustments have to take place through (real) price and labour marketflexibility or mechanisms of interregional and international transfers.
Compared to the United States, Europe is characterised by comparatively low rates ofmobility of people. As a crude rule of thumb, international emigration propensities inEurope have been around or below 0.5 per cent of population. For 1990-95, Obstfeldand Peri (1998) report average annual internal net migration rates of 0.31 for Germanyand 0.2 for the UK, as opposed to 0.87 for the USA. Blanchard and Katz (1992) showedthat between the different States of America migration has played an important role inbalancing out temporary regional labour market effects. They find, that �a decrease inemployment of 1 worker in the initial years is associated with an increase inunemployment of 0.3 workers, a decrease in participation of 0.05 workers, and thus animplied increase in net outmigration of 0.65 workers� (Blanchard and Katz 1992:34).Decressin and Fatas (1994) have demonstrated that in Europe the main adjustment toregional labour demand shocks happens through changes in labour market participationrates. Eichengreen (1993) estimates the elasticity of migration on regional wagedifferentials to be 25 times higher in the US than in Britain. For the Southern Europeancountries Italy and Spain this difference will be even higher (see Faini et al. 1997 forItaly and Bentolila and Jimeno 1995 for Spain).
The relatively low mobility of people within Europe has raised concerns about theeconomic effects of EMU (see Obstfeld and Peri 1998). It has stimulated discussionabout the causes of immobility. Traditional migration theory has been quite successfulin explaining causes and consequences of international and internal migration. Lessclear it is, however, why most people do not move, despite persistent aggregate regionalwage differentials. Traditional migration theories introduce pecuniary transport andtransaction costs to explain immobility (for a review see e.g. Greenwood 1993, 1997). Η The authors are grateful to Kalle Mäkilä (Spatial Modelling Centre Kiruna) and Urban Lindgren
(University of Umeå) for their competent support in processing the raw data. Several participants atresearch seminars in Umeå, Kiruna and Hamburg as well as at the ESPE annual conference inAmsterdam provided valuable comments. The authors acknowledge financial support by the GermanAcademic Exchange Service and the Swedish Institute (DAAD-SI German-Swedish Research Co-operation Project), the Spatial Modelling Centre in Kiruna and the Swedish Council for SocialResearch (SFR-project on immigrant�s education and performance).
8
Other standard explanations include institutional obstacles, risk adversity and the�option value of waiting� (Burda, 1995). But while transport and transaction costs havebeen falling and progress has been made in the European Union to remove obstacles tomigration, in many European countries internal migration rates have had a tendency todecrease substantially since the late Sixties and early Seventies. In this paper we suggestan extension to standard explanations of mobility, namely the insider advantage theoryof immobility. We argue that for most people in Europe it is fully rational not toconsider moving because they have accumulated too many location-specific insideradvantages over time. Even if substantial macro-economic differences persist on theaggregate level, moving away will generally not be beneficial from an individual pointof view, due to the costs of accumulated location-specific insider advantages that wouldbe sunk in case of out-migration. The longer people stay, the more they haveaccumulated such insider advantages and the less likely they will be to move. Therefore,(im)mobility should be highly duration dependent.
In this paper we use a newly released, very comprehensive micro dataset on peopleresident in Swedish labour markets in 1994 to test our insider advantages approach. Dueto the availability of extensive information about each individual it has been possible totest the partial effect of various factors on the probabilities of staying within the sameregional labour market. In line with our insider advantages theory we find substantialempirical support for immobility being strongly duration dependent. Furthermore,duration at a certain location matters more than duration at a workplace. Both socio-economic characteristics and family ties turn out to be important determinants ofimmobility, while aggregate regional attributes like wage differences or vacancy ratesperform badly.
In section 2, we first introduce the insider-advantage approach towards explainingimmobility. Section three introduces the data and the model. Section four discusses theresults of its estimation on Swedish data. Part five concludes.
2. Explaining (im)mobility
Classical migration theories explain mobility in terms of differences between attributesof places on the macro level, group dynamics and networking on the meso level and
9
socio-economic characteristics and behavioural strategies on the micro-level.1 Studiesusing aggregate data have shown that changes in place-specific living standards andlabour market conditions may explain fluctuations in migration flows (Ghatak, Levineand Wheatley Price 1996). However, despite considerable macro-economic differencespersisting both between many countries as well as within,2 and despite technologicaland political reductions in the obstacles to migration, the vast majority of people havenot and do not consider moving.3 To complicate things even further, migration flows donot necessarily diminish between places that seem very similar on an aggregate level.
Although contributing insights as to why some people move, classical explanations aresomewhat unsatisfactory in explaining why most people never consider moving. WhileStark (1991) and Stark, Helmenstein and Yegorov (1997) concentrate on the optimalduration of migration and on return migration we suggest a new approach to explainimmobility which we call the insider-advantage theory. The insider advantage theory initself accommodates several elements of traditional explanations but derives some newconclusions with respect to the underlying dynamics of mover-stayer decisions.
Under the conventional micro-level migration analysis a decision maker compares heror his present and future level of utility in different macro-level units on the basis of heror his present stock of assets and abilities. In most cases this is not a realistic judgementbecause a certain part of the abilities and assets of every human being are location-specific, in other words they can only be used (or are only in existence) in a specific
1 For a new and comprehensive comparative multidisciplinary survey on theories of migration see
Hammar et al. 1997, and for a shorter review that more explicitly treats issues of economicmethodology Bauer and Zimmermann 1997 and Greenwood 1997.
2 Research on international migration has often been conducted separately of research on internalmigration (Korcelli 1994). In our empirical work, we analyse regional in- and out-migration inSweden. But from an economic or geographic point of view, the distinction between internal andinternational migration is rather arbitrary. For both �types� of migration individuals will have to makethe same considerations, the only difference being that with increasing geographical and culturaldistance the cost of moving and maintaining previous networks increases while the transferability ofinsider advantages decreases. Accumulating new location-specific knowledge and abilities maybecome more difficult. That national borders coincide with the significant demarcation line betweenlow and high economic, social and cultural costs of moving become more unlikely the more countriesintegrate economically. Although the quantification of respective effects needs further research, weare thus convinced, that the importance of insider-advantages effects in explaining immobility holdsfor international migration too.
3 With respect to the decrease in obstacles to migration we think not only of the general reduction intransport and communication costs and the progress in international economic integration. We alsorefer to political developments like the fall of the �iron curtain�. Hunt (2000) examines why peoplestill live in East Germany. However, she stays within a rather traditional analysis and concludes thatconvergence in hourly wages is the most important factor to explain the downward trend in Germaneast to west migration.

10
place. These are what we call insider-advantages. They are not transferable to otherplaces of work and residence. An important part of these abilities has to be obtainedwithin a location specific learning process which requires time, information andtemporary immobility. Mobility turns such investments into lost sunk costs, i.e. costswhich are tied to a specific project or - in this case - a specific location and which arelost in the case of out-migration. Strong ties to places, people and projects areconstraints to migration (Malmberg 1997). Therefore, immobility is a utilitymaximizing strategy to a majority of people because the loss of location specific assetsand abilities induced by migration would be too severe and because it is immobilitywhich allows individuals to accumulate insider-advantages.
With respect to mobility, Becker (1962) and his scholars emphasised that part of theknowledge an individual acquires is often firm-specific and can not be transferred toanother employment. Migration may therefore result in a decrease of potentiallyachievable relative wages because firm-specific abilities are 'sunk' in case of a change ofworkplace. In its exclusive concentration on firm-specific insider advantages, however,Becker�s approach seems to us too rigid to satisfactorily explain immobility.4
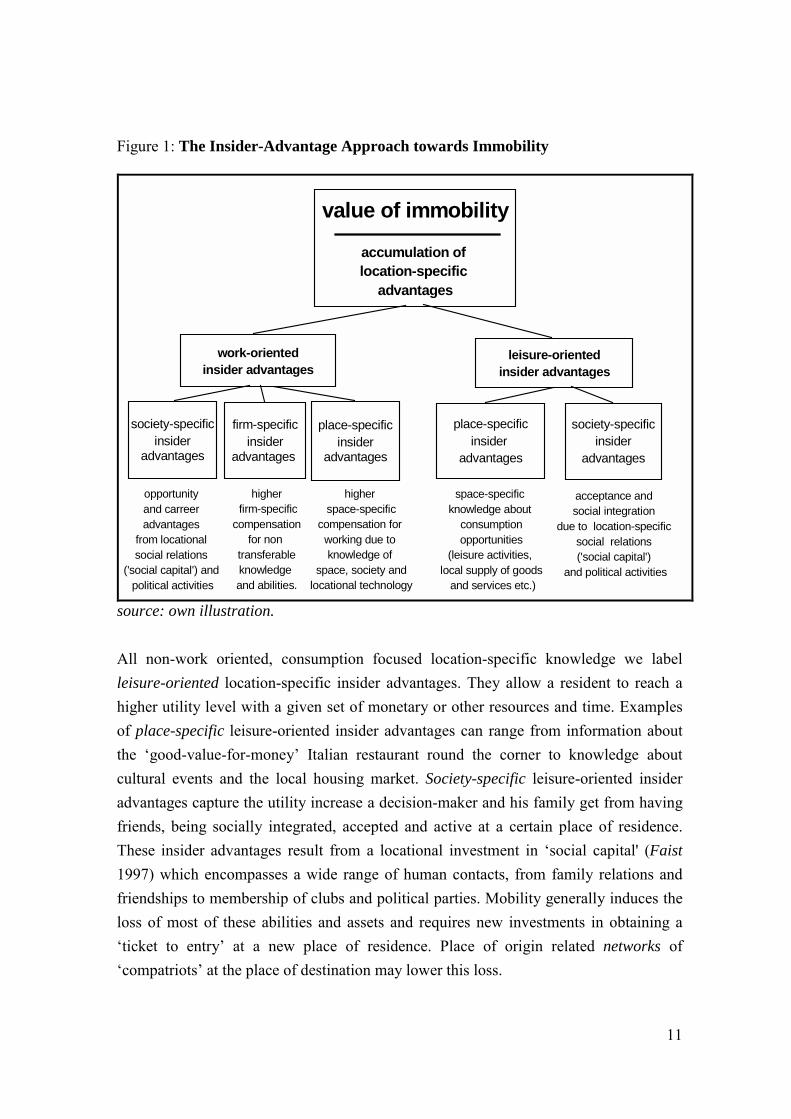
Figure 1 gives a graphical representation of the structure of our insider-advantage idea.It differentiates insider-advantages according to their origin (work- or leisure-related)and specificity (firm-, place- or society-specific).
Place-specific advantages make the individual particularly attractive for all or at leastsome firms in his region of work. Examples of such insider advantages are expertise inthe location-specific preferences, desires and habits of clients or insider knowledge ofthe peculiarities of the political situation in a region. Society-specific advantages broadlyemanate from the social relations and political activities an immobile individual buildsup within the society in which he/she is residing (lobbying, political networks). Firm,place- and society-specific work-oriented insider advantages lead to higher revenues forthe individual, in the form of wages or other income.
4 For a somewhat different treatment of location-specific advantages emanating from the labour supply
side see Chiswick (1986). The insider-outsider concept is of course not a new innovation. It has beenused in different fields of economics and became especially popular in labour market economics (seee.g. Lindbeck and Snower 1986, 1994).
11
Figure 1: The Insider-Advantage Approach towards Immobility
value of immobility
accumulation of location-specific
advantages
work-orientedinsider advantages
leisure-orientedinsider advantages
society-specificinsider
advantages
firm-specificinsider
advantages
place-specificinsider
advantages
place-specificinsider
advantages
society-specificinsider
advantages
opportunity and carreer advantages
from locational social relations
('social capital') and political activities
higher firm-specific
compensationfor non
transferableknowledge and abilities.
higher space-specific
compensation for working due to knowledge of
space, society andlocational technology
space-specific knowledge about
consumption opportunities
(leisure activities, local supply of goods
and services etc.)
acceptance and social integration
due to location-specific social relations ('social capital')
and political activities
source: own illustration.
All non-work oriented, consumption focused location-specific knowledge we labelleisure-oriented location-specific insider advantages. They allow a resident to reach ahigher utility level with a given set of monetary or other resources and time. Examplesof place-specific leisure-oriented insider advantages can range from information aboutthe �good-value-for-money� Italian restaurant round the corner to knowledge aboutcultural events and the local housing market. Society-specific leisure-oriented insideradvantages capture the utility increase a decision-maker and his family get from havingfriends, being socially integrated, accepted and active at a certain place of residence.These insider advantages result from a locational investment in �social capital' (Faist1997) which encompasses a wide range of human contacts, from family relations andfriendships to membership of clubs and political parties. Mobility generally induces theloss of most of these abilities and assets and requires new investments in obtaining a�ticket to entry� at a new place of residence. Place of origin related networks of�compatriots� at the place of destination may lower this loss.
12
The more developed economies are, and the relatively more important leisure timebecomes in comparison to working time, the more leisure-oriented insider advantagesought to matter for the decision to stay or to go. Admittedly leisure-oriented insideradvantages are for the most part difficult to quantify in monetary terms. Nevertheless isshould be possible to control their importance indirectly. If duration of stay increasesthe probability of staying irrespective of duration of employment or if, for example,having children decreases individual propensities to move, then this is likely to be dueto leisure-oriented insider advantages rather than work-oriented ones.
Intertemporally, insider-advantages may be partly recovered and �updated� if onereturns, but they nevertheless strongly increase the (opportunity) costs of staying away.There may be some cases where the benefits of being an outsider create the veryincentive to move (for example a Chinese offering traditional Chinese medical practicesto a European clientel in Paris). But such situations tend to be exceptional. Whileoutsider advantages may be an incentive to move for a few, our argument is that insideradvantages provide reason enough to stay for most.
There is some similarity between our insider-advantage approach and the human capitalapproach. The human capital approach emphasises the point that people are verydifferent in their characteristics and their abilities and that migration may be a form ofinvestment on which the return will occur within a given future time span. The insider-advantage approach stresses that during periods of immobility at a particular locationindividuals invest in the accumulation of location specific skills, abilities and assets. Bythis they can increase the realisable individual utility at this location significantly.Therefore there may be very little migration even if on an aggregate level considerablelocational differences in average incomes, unemployment risks or endowment withnatural amenities exist. There is little migration because individuals rightly expect that amove might decrease her personal utility due to the incurred loss on non-transferableknowledge and the costly need to acquire new insider-advantages in order to get into asimilar relative position at the new location.5
Hägerstrand (1975, 1993) has pointed to the influence of constraints on migration. Heidentified people�s engagement in everyday projects and activities, such as work,studies, hobbies, friends and family, as decisive for long term decisions and related the
5 In that sense, the insider-advantage approach to explain immobility can also be seen as an alternative,
more explicit formulation of traditional migration costs.
13
propensity to move to the possibility to transfer or substitute these local �projects�.Major life events have been identified as major determinants of family migration.Getting a job, starting an education, get married, having babies and buying a house areevents that strengthen the ties to a specific place, while events such as loosing job,ending education, get divorced and children leaving home increase the propensity tomigrate positively.
Important empirical implications of the insider-advantage approach to immobility arethat mobility patterns should be duration dependent and that the degree oftransferability of skills, abilities and personal relations ought to be of central importancefor observed (im-)mobility behaviour. The more people have accumulated location-specific insider-advantages and the less transferable their abilities and current �life-projects� are, the more likely it is that they stay immobile. Somebody who has movedrecently and thus already has lost his accumulated insider-advantages should be morelikely to move again. The longer she or he stays at the new place of residence, thesmaller the probability of an additional move.6
3. The Model and Data
3.1 The Model
We start with a standard neo-classical utility maximising migration function and assumethat individuals decide whether to move or not by comparing expected utilities atalternative destinations with their present situation. The net present value NPV is madeup by the difference over time between expected discounted utilities at an alternativedestination and at the present one. Different kinds of utilities are realised with differentprobabilities. For our empirical analysis, however, it is impossible to observe actualutilities. What we can observe is the result of the decision making process only: people
6 To exclude some of the standard hypotheses of labour market analysis concerning the effects of
duration of stay and to identify the duration dependent and labour market related insider advantage wecould also examine whether the annual wage increase of newcomers differs from the one of peoplethat have been there for a longer period already. However, in this paper we leave open whether thisanalysis might change our empirical results because the data necessary to test the hypothesis properlyare not available. Finally, immobility could also be the consequence of a duration dependent higherappreciation of locally segregated cultural or social milieus. It could be that private consumption in agroup or network specific context generates positive social consumption externalities. Bades on amodel by Pollak (1979), Binder and Pearan (1997) have shown that an inclusion of consumptioninterdependencies does not change the empirical validity of a standard consumption analysis.
14
either stay or go. If individuals decide to move when the expected net present utility ofstaying at another location exceeds the one at the present place of residence, we havethe relation between utilities and probability stated in the random utility model. Here,the decision to stay or go includes, apart from the utility comparison, a place-specificrandom term ε:
))1()()1()(()(0 10 1
ijj
m
t t
tt
n
k
jk
jki
m
t t
tt
n
k
ik
ik cuuprobstayprob −+��
�
����
�+⋅��
�
����
�>+���
����
�+⋅��
�
����
�= � �� �=
−
==
−
=
εθρεθρ
(1)
where uk=f(Xk), k are different categories of utility, i assigns to the present place ofresidence and j an alternative location. Θ represents the discount factor and cij coversthe (direct) migration costs of moving from i to j.
To simplify notation, let us label the discounted and probability-weighted utilities withU. In line with our insider advantages model we distinguish between two broadcategories of utilities, work-oriented utilities UWO and leisure-oriented utilities ULO.Thus (individual) location-specific utilities are conceived as:
iiiii ULOUWOu εµ +++= (2)
They result from a fixed but place-specific component µi (natural amenities etc.), thesum of work and leisure oriented utilities plus a random but place-specific component εi.
With respect to the determination of UWO and ULO individual time horizons anddiscount factors are obviously dependent on age. The standard migration theory impliesthat UWO and ULO are furthermore conditional on individual microeconomiccharacteristics XMIC like education and experience (Becker 1962). An individual�sfamily situation (marital status, number of children etc.) may matter for thedetermination of the disposable household income as well as its use (Stark and Bloom1985, Stark 1991). Also we expect region-specific macro factors XMAC like labourmarket conditions (unemployment and vacancies rates) or general regional attributes(wage level, local opportunities) to be important for the determination of place-specificutilities. Provided that the life-course event theory of mobility proves relevant, weshould find utilities to be further dependent on life course events LCE like the formationor disintegration of households, engaging in educational activities, getting unemployedor having a baby. Last but not least, the insider-advantages theory suggests that the
15
amount of location-specific insider advantages IA an individual has accumulated overtime will be important in defining the work and leisure oriented utilities a person canexpect to achieve at a certain place. Given our insider advantage hypothesis, we expectIA to be a function of duration of stay and transferability of skills7 and abilities. Thus:
)()(
iiiii
iiiii
XIAXLCEXMACXMIChULOXIAXLCEXMACXMICgUWO
+++=+++=
(3)
and consequently, the probability of staying will be determined as:
( )ijjjjjiiii cULOUWOULOUWOprobstayprob −+++>+++== εµεµ)1( (4)
Given the discussed determinants of the decision to stay or go, we estimate theindividual probability of staying in terms of a probit model as:
)][],[][][()1(
43
21
piji
ppjpiij
XLCEXMACXMACXMICXIAXIAstayprob
ββββµ
+∆+
+−+Φ== (5)
Here, the constant µij captures both, differences in location-specific amenities as well asimmediate moving costs cij. To test for the relative importance of the accumulation ofwork and leisure-oriented insider advantages, we will include both time since lastchange of employer and time since last change of residence. With respect to otherdeterminants, it is obviously difficult to know whether regressors proxy work or leisureoriented insider effects. Distinguishing between the two remains therefore to someextent a question of interpretation.
3.2 The Data
The empirical investigation in this paper relies on data from the TOPSWING database.This new database links information from various official statistical registers andcensuses as provided by Statistics Sweden. It covers anonymised micro data for the totalpopulation resident in Sweden between 1985 and 1995, i.e. more than 9 million people.It includes information about an individual�s place of residence and work, age, gender,
7 For a recent discussion of the role of skill transferability in immigrant performance see Friedberg
(2000).
16
education, income, employment, profession as well as household conditions and links tofamily members (see appendix 1 for further information on the variables used).
In this paper we are interested in inter-regional migration that is not purely residentialbut involves both, a change of residence and a change of workplace. Our data does notconstrain us to use politically defined county borders. Instead, in what follows we willuse economically defined labour market regions as spatial resolution of our analyses.Labour market regions are defined by Statistics Sweden and the Swedish Department ofFinance as to minimise inter-regional commuting (Finansdepartementet 1994). Usingthese labour market regions we separate the territory of Sweden into 108 differentregional labour markets. For this study we have drawn a sample of all movers overlabour market regions during the years of the study (1994 and 1989) and a control groupof 2% of Swedish-born stayers and 20% of non-moving immigrants. In ourcalculations individual observations have been weighted as to represent the trueproportion in total population.
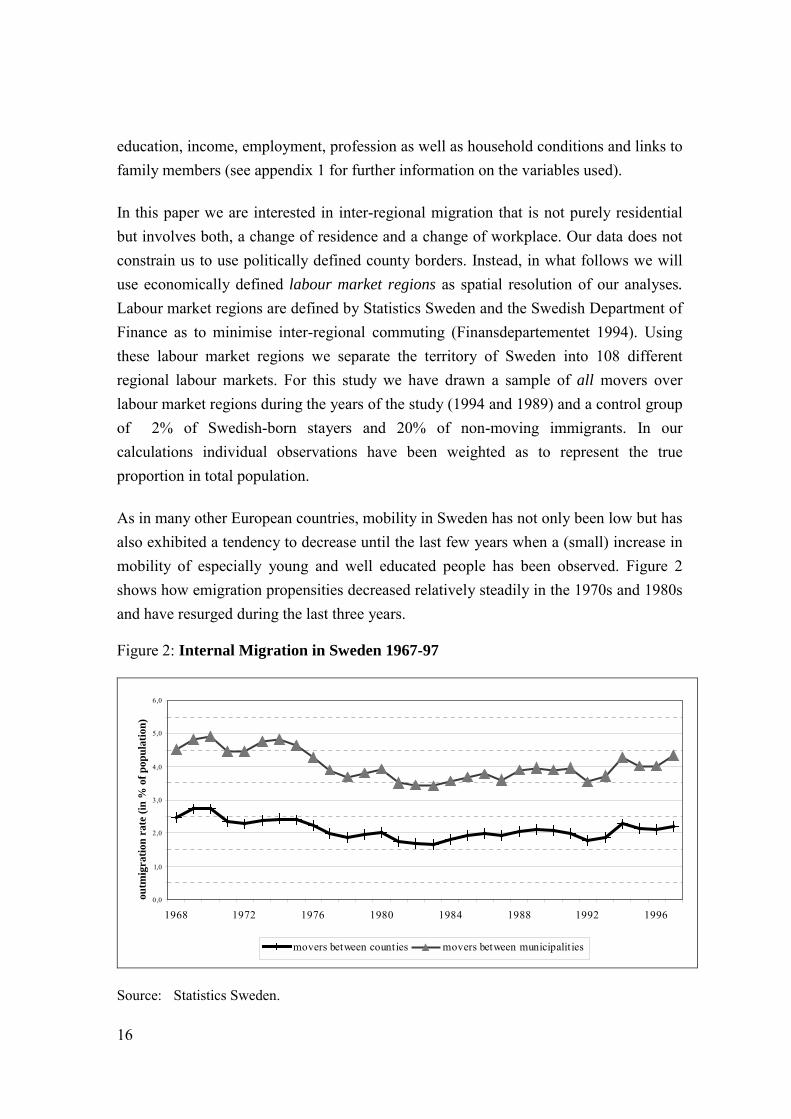
As in many other European countries, mobility in Sweden has not only been low but hasalso exhibited a tendency to decrease until the last few years when a (small) increase inmobility of especially young and well educated people has been observed. Figure 2shows how emigration propensities decreased relatively steadily in the 1970s and 1980sand have resurged during the last three years.
Figure 2: Internal Migration in Sweden 1967-97
0,0
1,0
2,0
3,0
4,0
5,0
6,0
1968 1972 1976 1980 1984 1988 1992 1996
outm
igra
tion
rate
(in
% o
f pop
ulat
ion)
movers between counties movers between municipalities
Source: Statistics Sweden.
17
During 1994 about 15 per cent of the population in Sweden changed address, but only2,3 per cent of the population had moved over the border of a labour market region. Ifthe data period is extended to ten years (1985-1995) 87% of the population still lived inthe same labour market region.
Bengtson and Johanson (1993) point out some possible explanations to the trend ofdecreasing mobility in Sweden. They emphasise the low regional income variations, theincrease in public job opportunities and the growing number of two income families;trends that are also found in other developed economies. Indeed, (im)mobility patternshave been similar to those observed in other European countries. Studies of immobilityin the Swedish context thus might reveal some Sweden-specific characteristics, butgenerally speaking the determinants affecting the patterns of immobility should be verysimilar to the situation in other European countries.
4. Determinants of Immobility: Estimation Results
4.1 Duration and socio-economic Characteristics Matter
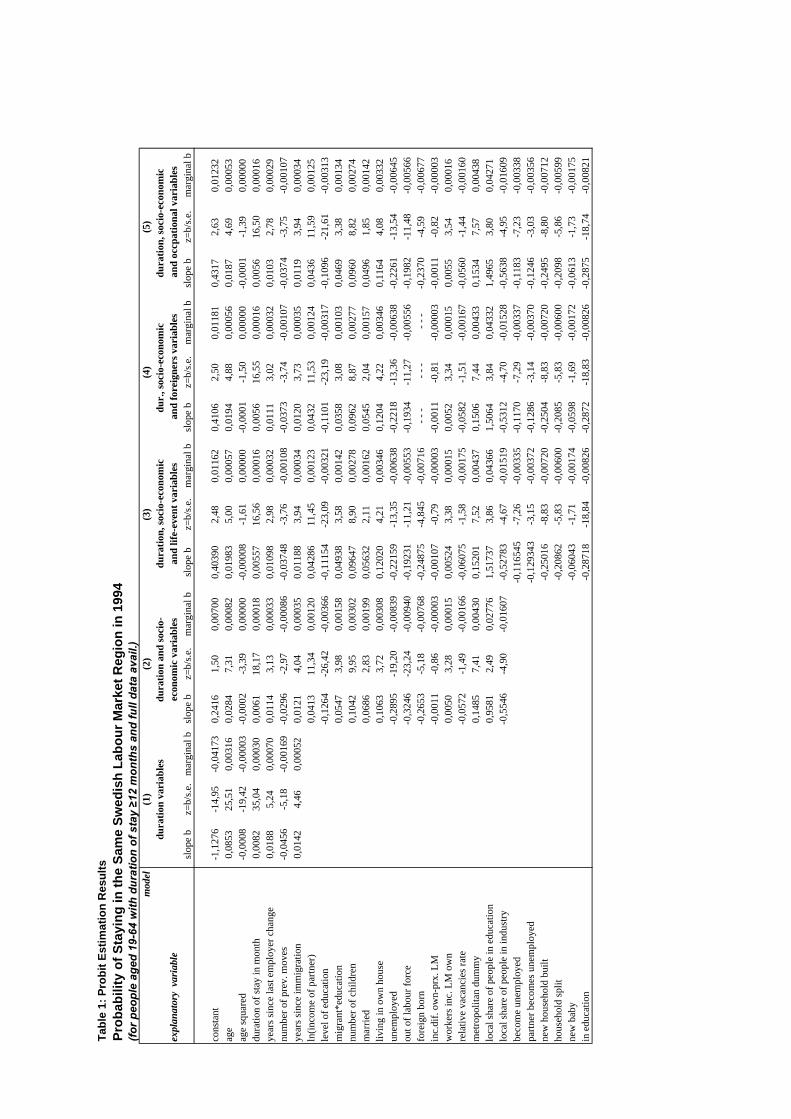
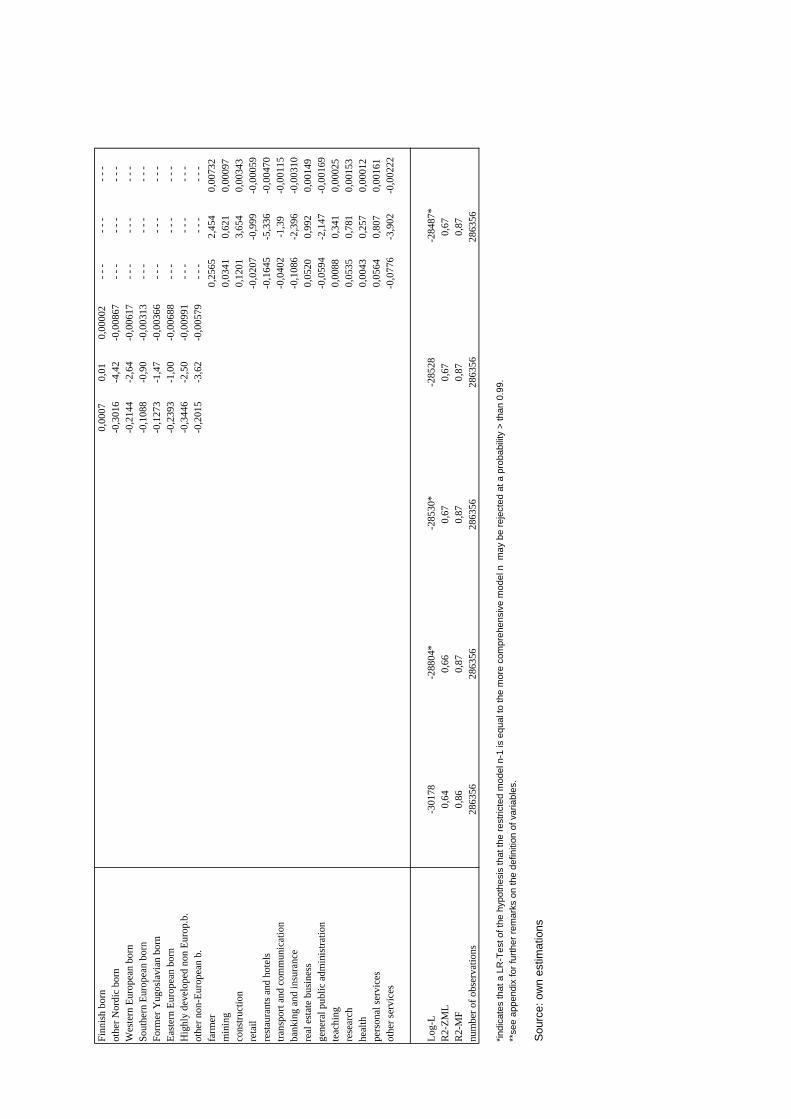
Table 1 shows the results of our probit estimations of the propensity to stay in aSwedish labour market for all people aged between 19 and 64 who have stayed for atleast 12 months prior to moving and for whom the necessary information is available.The sample comprises 286,356 observations, which allow for a relatively detailedcombination of explanatory variables. Results are provided for five different modelsderived from equation (4). These five are all nested.8 They are built in order to allowchecking for the relative importance of our arguments and the stability of the differentparameters. Model (1) includes duration variables linked to our insider-advantageshypothesis only. Model (2) adds the �classic� socio-economic micro and region-specificmacro factors. Model (3) also includes �life-course events�, model (4) checks for theimportance of different places of birth and model (5) introduces occupational dummies.An asterix (�*�) at the end of the Log-L term indicates that a Log-likelihood ratio testrejects the hypotheses that the model is not significantly better than the lesscomprehensive nested one with a probability larger than 0.99. It thus indicates that
8 Actually, model (1) is nested in (2), (2) in (3), (3) in (4) and (5) but (4) not in (5).
18
despite the absence of improvements in the pseudo-R2 the more comprehensive modelincludes additional explanatory factors that are jointly significant.9
Our estimation results provide support for the insider advantage hypothesis that peopleare immobile because they accumulate location-specific insider advantages which aresunk in case of a move. The longer people stay at a certain place, the less likely they areto move. In model (1) we regress the probability of staying on just duration of stay inmonths, years since last change of employer, number of previous moves and forimmigrants years since immigration. Immigrants should be more mobile (because theyalready lost their insider advantages), but their behaviour should approximate natives'overtime. To control for the possibility that the expected duration effects occur onlybecause one gets older and is therefore less likely to move, we also control for age andallow the effect of age being non-linear by including an age square term in theregression. If immobility were determined mainly by the accumulation of firm andwork-specific insider advantages, we would expect �years since last change ofemployer� to be a chief determinant of the probability to stay. If leisure-oriented place-and society-specific insider advantages matter more, this should show up in acorresponding importance of the general duration of stay variable. For duration of staywe have checked various specifications, but the simplest linear one applied here provedbest.10
For model 1, age shows the usual significant properties. Immobility is a very age-specific phenomenon. More than two thirds of all movers in Sweden have been between
9 Note that unlike in OLS-regressions it is impossible in binary choice models to calculate an R2 that
sets true and estimated y into proportion and explains the part of the total variance an estimated modelexplains. For discrete choice estimation, several goodness of fit indicators have been proposed (for adiscussion of the most prominent alternatives see Amemiya 1981 and Veall and Zimmermann 1992).Most of them aim to approximately mimic the properties of the OLS-R2 and are therefore also calledpseudo-R2.a We calculated and provide two pseudo-R2 that have been found to mimic best theproperties of the traditional regression R2 (Windmeijer, 1995). R2-MZL is the indicator proposed byMcKelvey and Zavoina (1975) and Laitila (1995). R2-MF provides the popular likelihood ratio indexdeveloped my McFadden (1974).
10 Initially it may take some time before a mover reconsiders a move he has just made. Thus we couldexpect the likeliness to move to be very low initially, then increase considerably and thereafterdecrease again. Such a pattern could e.g. be captured by a logistic specification of the duration effect.In an investigation on UK data Gordon and Molho (1995) find an �inverted-U curve effect� of durationfor local, residential mobility. In our data on mobility between labour market regions in Sweden, wedo not find such a non-linear effect. If the probability of moving further on (or back) is low initiallyand increases only after some time, then this happens within less than one year of stay which is theminimum duration requirement for moves to be included in our investigation. We also did not findany significantly decreasing (or increasing) effect of duration that a polynomial specification of theduration term would capture.
19
20 and 35 years old. But controlling for this, both duration variables turn out significantand show the expected sign. The probability of staying is thus highly durationdependent. Duration of stay is estimated to be both, much more significant and moreimportant in magnitude, than duration since last change of employer. Two to threeadditional months of stay in the same labour market make up for one year with the sameemployer. Although model (1) obviously suffers from omission bias, its goodness of fitis quite remarkable. The �years since immigration� variable produces the expected effectclearly. Having just recently immigrated, foreign born people are significantly moremobile than native born. The number of previous moves still increases the likelihoodof moving significantly, but less than half a year of staying at the same place andemployer increases the probability of staying by more than a previous move decreasesit.11
Comparing parameter estimates in model (1) to (5) reveals that model 1 suffers fromomission bias and therefore overestimates the importance of the duration and ageeffects. But once we account for individual socio-economic characteristics and regionaldifferences in model (2), the duration parameters continue to be among the mostimportant explanatory factors of mobility behaviour. Even if we add further significantadditional explanatory factors in subsequent models the duration effects remain veryrobust. 12
11 The more the number of previous moves contributes to the explanatory power of a model, the better
one could argue that the migratory behaviour of individuals is due to unobservable factors that dividethe population permanently into two heterogeneous groups of movers and stayers. Given the relativelymodest importance and significance of previous moves, our results indicate that the above argumentdoes not hold as such: there is more we know about (im)mobility than just explaining migration byprevious migration.
12 With our cross-sectional data we can not completely rule out, that the estimated strong duration effectresults to some extend also from sorting. A definite answer on the relative importance of theendogenous emergence of reasons to stay versus sorting effects has to be left for further research. Butseveral tests have led us to the conclusion that accumulated insider advantages indeed play animportant role here while the sorting effect is probably a relatively minor phenomenon. First, giventhe relatively modest importance and significance of previous moves relative to the duration of stayeffect, our results indicate that unobservable factors that divide the population permanently into twoheterogeneous groups of movers and stayers are of minor importance here. There is more we knowabout (im)mobility than just explaining migration by previous migration. Second, assuming that abreak-up of the household e.g. due to divorce or also becoming adult represent �exogenous shocks�that would expose all individuals concerned to a new sorting process, we estimated our modelsseparately for people divorcing and for persons aged 18 to 20. The results (available from the authorson request) show that the duration of staying effect remains relatively stable and highly significant,while other determinants except those related to education, the family and the individual employmentstatus loose their significance.
Tabl
e 1:
Pro
bit E
stim
atio
n R
esul
tsPr
obab
ility
of S
tayi
ng in
the
Sam
e Sw
edis
h La
bour
Mar
ket R
egio
n in
199
4(fo
r peo
ple
aged
19-
64 w
ith d
urat
ion
of s
tay ≥1
2 m
onth
s an
d fu
ll da
ta a
vail.
)m
odel
(1)
(2)
(3)
(4)
(5)
dura
tion
vari
able
sdu
ratio
n an
d so
cio-
dura
tion,
soci
o-ec
onom
icdu
r., s
ocio
-eco
nom
icdu
ratio
n, so
cio-
econ
omic
ex
plan
ator
y v
aria
ble
econ
omic
var
iabl
esan
d lif
e-ev
ent v
aria
bles
and
fore
igne
rs v
aria
bles
and
occp
atio
nal v
aria
bles
slop
e b
z=b/
s.e.
mar
gina
l bsl
ope
bz=
b/s.e
.m
argi
nal b
slop
e b
z=b/
s.e.
mar
gina
l bsl
ope
bz=
b/s.e
.m
argi
nal b
slop
e b
z=b/
s.e.
mar
gina
l b
cons
tant
-1,1
276
-14,
95-0
,041
730,
2416
1,50
0,00
700
0,40
390
2,48
0,01
162
0,41
062,
500,
0118
10,
4317
2,63
0,01
232
age
0,08
5325
,51
0,00
316
0,02
847,
310,
0008
20,
0198
35,
000,
0005
70,
0194
4,88
0,00
056
0,01
874,
690,
0005
3ag
e sq
uare
d-0
,000
8-1
9,42
-0,0
0003
-0,0
002
-3,3
90,
0000
0-0
,000
08-1
,61
0,00
000
-0,0
001
-1,5
00,
0000
0-0
,000
1-1
,39
0,00
000
dura
tion
of st
ay in
mon
th0,
0082
35,0
40,
0003
00,
0061
18,1
70,
0001
80,
0055
716
,56
0,00
016
0,00
5616
,55
0,00
016
0,00
5616
,50
0,00
016
year
s sin
ce la
st e
mpl
oyer
cha
nge
0,01
885,
240,
0007
00,
0114
3,13
0,00
033
0,01
098
2,98
0,00
032
0,01
113,
020,
0003
20,
0103
2,78
0,00
029
num
ber o
f pre
v. m
oves
-0,0
456
-5,1
8-0
,001
69-0
,029
6-2
,97
-0,0
0086
-0,0
3748
-3,7
6-0
,001
08-0
,037
3-3
,74
-0,0
0107
-0,0
374
-3,7
5-0
,001
07ye
ars s
ince
imm
igra
tion
0,01
424,
460,
0005
20,
0121
4,04
0,00
035
0,01
188
3,94
0,00
034
0,01
203,
730,
0003
50,
0119
3,94
0,00
034
ln(in
com
e of
par
tner
)0,
0413
11,3
40,
0012
00,
0428
611
,45
0,00
123
0,04
3211
,53
0,00
124
0,04
3611
,59
0,00
125
leve
l of e
duca
tion
-0,1
264
-26,
42-0
,003
66-0
,111
54-2
3,09
-0,0
0321
-0,1
101
-23,
19-0
,003
17-0
,109
6-2
1,61
-0,0
0313
mig
rant
*edu
catio
n0,
0547
3,98
0,00
158
0,04
938
3,58
0,00
142
0,03
583,
080,
0010
30,
0469
3,38
0,00
134
num
ber o
f chi
ldre
n0,
1042
9,95
0,00
302
0,09
647
8,90
0,00
278
0,09
628,
870,
0027
70,
0960
8,82
0,00
274
mar
ried
0,06
862,
830,
0019
90,
0563
22,
110,
0016
20,
0545
2,04
0,00
157
0,04
961,
850,
0014
2liv
ing
in o
wn
hous
e0,
1063
3,72
0,00
308
0,12
020
4,21
0,00
346
0,12
044,
220,
0034
60,
1164
4,08
0,00
332
unem
ploy
ed-0
,289
5-1
9,20
-0,0
0839
-0,2
2159
-13,
35-0
,006
38-0
,221
8-1
3,36
-0,0
0638
-0,2
261
-13,
54-0
,006
45ou
t of l
abou
r for
ce-0
,324
6-2
3,24
-0,0
0940
-0,1
9231
-11,
21-0
,005
53-0
,193
4-1
1,27
-0,0
0556
-0,1
982
-11,
48-0
,005
66fo
reig
n bo
rn-0
,265
3-5
,18
-0,0
0768
-0,2
4875
-4,8
45-0
,007
16 -
- - -
- - -
- --0
,237
0-4
,59
-0,0
0677
inc.
dif.
own-
prx.
LM
-0,0
011
-0,8
6-0
,000
03-0
,001
07-0
,79
-0,0
0003
-0,0
011
-0,8
1-0
,000
03-0
,001
1-0
,82
-0,0
0003
wor
kers
inc.
LM
ow
n0,
0050
3,28
0,00
015
0,00
524
3,38
0,00
015
0,00
523,
340,
0001
50,
0055
3,54
0,00
016
rela
tive
vaca
ncie
s rat
e-0
,057
2-1
,49
-0,0
0166
-0,0
6075
-1,5
8-0
,001
75-0
,058
2-1
,51
-0,0
0167
-0,0
560
-1,4
4-0
,001
60m
etro
polit
an d
umm
y0,
1485
7,41
0,00
430
0,15
201
7,52
0,00
437
0,15
067,
440,
0043
30,
1534
7,57
0,00
438
loca
l sha
re o
f peo
ple
in e
duca
tion
0,95
812,
490,
0277
61,
5173
73,
860,
0436
61,
5064
3,84
0,04
332
1,49
653,
800,
0427
1lo
cal s
hare
of p
eopl
e in
indu
stry
-0,5
546
-4,9
0-0
,016
07-0
,527
83-4
,67
-0,0
1519
-0,5
312
-4,7
0-0
,015
28-0
,563
8-4
,95
-0,0
1609
beco
me
unem
ploy
ed-0
,116
545
-7,2
6-0
,003
35-0
,117
0-7
,29
-0,0
0337
-0,1
183
-7,2
3-0
,003
38pa
rtner
bec
omes
une
mpl
oyed
-0,1
2934
3-3
,15
-0,0
0372
-0,1
286
-3,1
4-0
,003
70-0
,124
6-3
,03
-0,0
0356
new
hou
seho
ld b
uilt
-0,2
5016
-8,8
3-0
,007
20-0
,250
4-8
,83
-0,0
0720
-0,2
495
-8,8
0-0
,007
12ho
useh
old
split
-0,2
0862
-5,8
3-0
,006
00-0
,208
5-5
,83
-0,0
0600
-0,2
098
-5,8
6-0
,005
99ne
w b
aby
-0,0
6043
-1,7
1-0
,001
74-0
,059
8-1
,69
-0,0
0172
-0,0
613
-1,7
3-0
,001
75in
edu
catio
n-0
,287
18-1
8,84
-0,0
0826
-0,2
872
-18,
83-0
,008
26-0
,287
5-1
8,74
-0,0
0821
Finn
ish
born
0,00
070,
010,
0000
2 -
- - -
- - -
- -ot
her N
ordi
c bo
rn-0
,301
6-4
,42
-0,0
0867
- - -
- - -
- - -
Wes
tern
Eur
opea
n bo
rn-0
,214
4-2
,64
-0,0
0617
- - -
- - -
- - -
Sout
hern
Eur
opea
n bo
rn-0
,108
8-0
,90
-0,0
0313
- - -
- - -
- - -
Form
er Y
ugos
lavi
an b
orn
-0,1
273
-1,4
7-0
,003
66 -
- - -
- - -
- -Ea
ster
n Eu
rope
an b
orn
-0,2
393
-1,0
0-0
,006
88 -
- - -
- - -
- -H
ighl
y de
velo
ped
non
Euro
p.b.
-0,3
446
-2,5
0-0
,009
91 -
- - -
- - -
- -ot
her n
on-E
urop
ean
b.-0
,201
5-3
,62
-0,0
0579
- - -
- - -
- - -
farm
er0,
2565
2,45
40,
0073
2m
inin
g0,
0341
0,62
10,
0009
7co
nstru
ctio
n0,
1201
3,65
40,
0034
3re
tail
-0,0
207
-0,9
99-0
,000
59re
stau
rant
s and
hot
els
-0,1
645
-5,3
36-0
,004
70tra
nspo
rt an
d co
mm
unic
atio
n-0
,040
2-1
,39
-0,0
0115
bank
ing
and
insu
ranc
e-0
,108
6-2
,396
-0,0
0310
real
est
ate
busi
ness
0,05
200,
992
0,00
149
gene
ral p
ublic
adm
inis
tratio
n-0
,059
4-2
,147
-0,0
0169
teac
hing
0,00
880,
341
0,00
025
rese
arch
0,05
350,
781
0,00
153
heal
th0,
0043
0,25
70,
0001
2pe
rson
al se
rvic
es0,
0564
0,80
70,
0016
1ot
her s
ervi
ces
-0,0
776
-3,9
02-0
,002
22
Log-
L-3
0178
-288
04*
-285
30*
-285
28 -2
8487
*R
2-ZM
L0,
640,
660,
670,
670,
67R
2-M
F0,
860,
870,
870,
870,
87nu
mbe
r of o
bser
vatio
ns28
6356
2863
5628
6356
2863
5628
6356
*indi
cate
s th
at a
LR
-Tes
t of t
he h
ypot
hesi
s th
at th
e re
stric
ted
mod
el n
-1 is
equ
al to
the
mor
e co
mpr
ehen
sive
mod
el n
may
be
reje
cted
at a
pro
babi
lity
> th
an 0
.99.
**se
e ap
pend
ix fo
r fur
ther
rem
arks
on
the
defin
ition
of v
aria
bles
.
Sour
ce: o
wn
estim
atio
ns
22
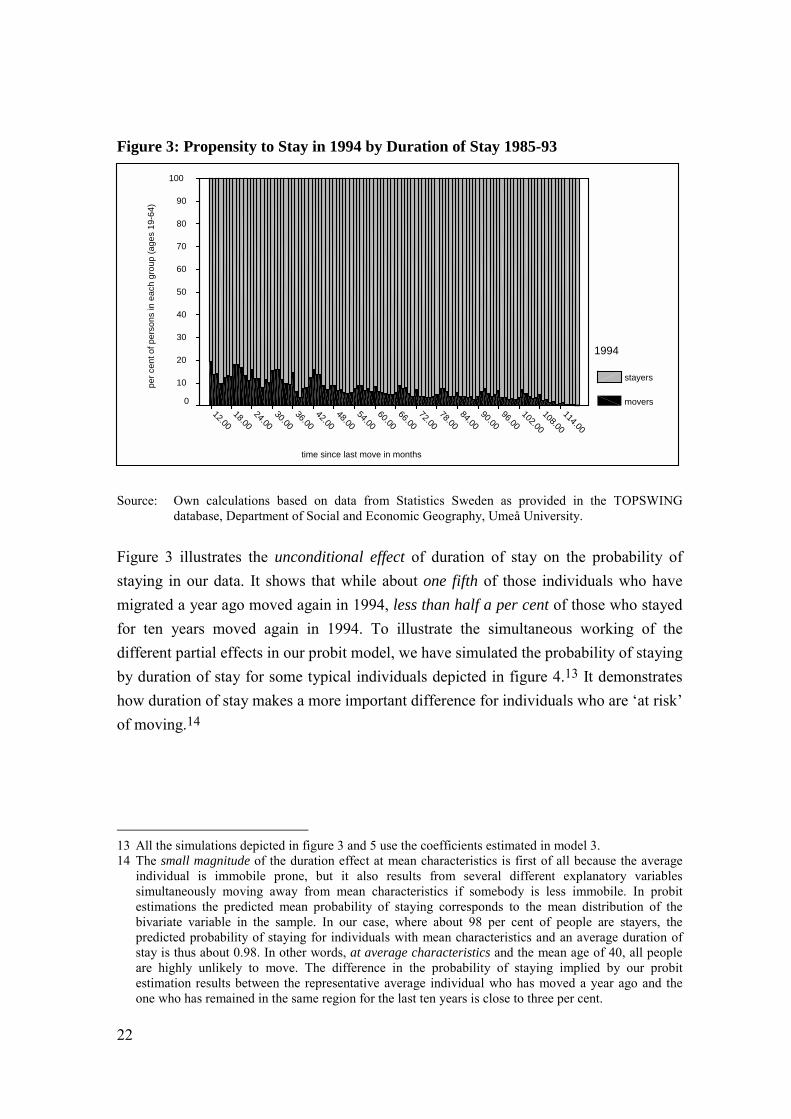
Figure 3: Propensity to Stay in 1994 by Duration of Stay 1985-93
time since last move in months
114.00
108.00
102.00
96.0090.00
84.0078.00
72.0066.00
60.0054.00
48.0042.00
36.0030.00
24.0018.00
12.00
per c
ent o
f per
sons
in e
ach
grou
p (a
ges
19-6
4)
100
90
80
70
60
50
40
30
20
10
0
1994
stayers
movers
Source: Own calculations based on data from Statistics Sweden as provided in the TOPSWINGdatabase, Department of Social and Economic Geography, Umeå University.
Figure 3 illustrates the unconditional effect of duration of stay on the probability ofstaying in our data. It shows that while about one fifth of those individuals who havemigrated a year ago moved again in 1994, less than half a per cent of those who stayedfor ten years moved again in 1994. To illustrate the simultaneous working of thedifferent partial effects in our probit model, we have simulated the probability of stayingby duration of stay for some typical individuals depicted in figure 4.13 It demonstrateshow duration of stay makes a more important difference for individuals who are �at risk�of moving.14
13 All the simulations depicted in figure 3 and 5 use the coefficients estimated in model 3.14 The small magnitude of the duration effect at mean characteristics is first of all because the average
individual is immobile prone, but it also results from several different explanatory variablessimultaneously moving away from mean characteristics if somebody is less immobile. In probitestimations the predicted mean probability of staying corresponds to the mean distribution of thebivariate variable in the sample. In our case, where about 98 per cent of people are stayers, thepredicted probability of staying for individuals with mean characteristics and an average duration ofstay is thus about 0.98. In other words, at average characteristics and the mean age of 40, all peopleare highly unlikely to move. The difference in the probability of staying implied by our probitestimation results between the representative average individual who has moved a year ago and theone who has remained in the same region for the last ten years is close to three per cent.
23
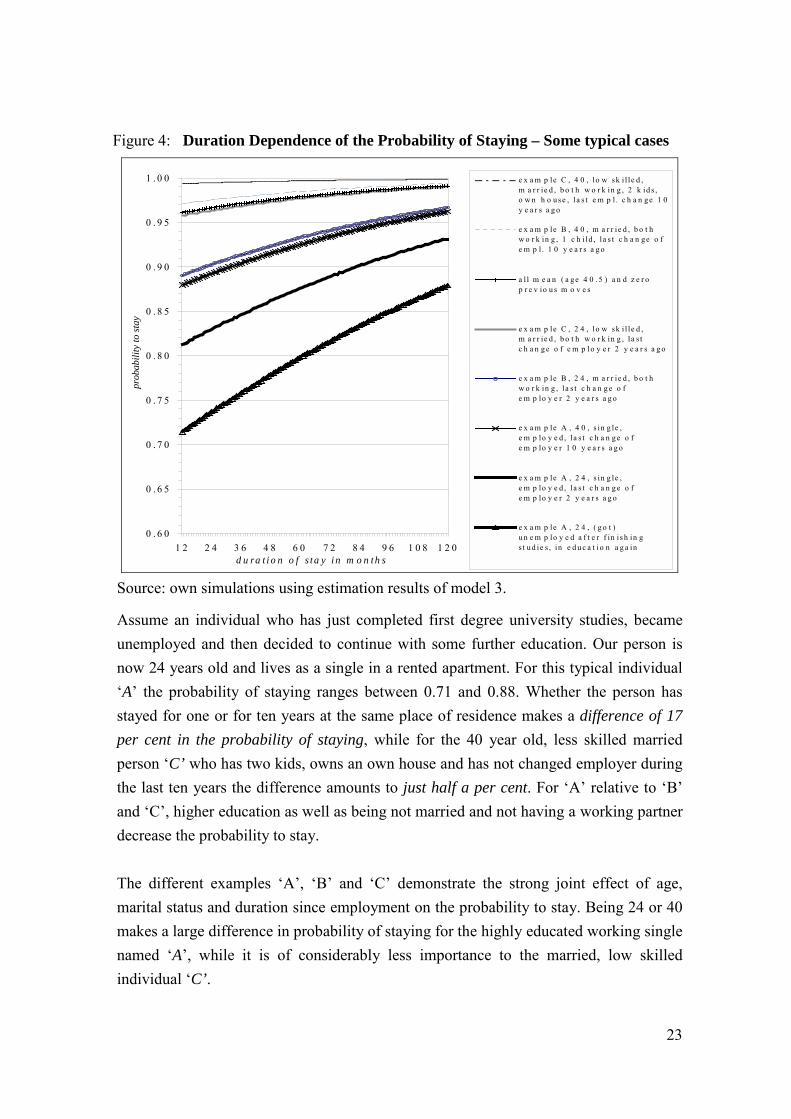
Figure 4: Duration Dependence of the Probability of Staying – Some typical cases
0 . 6 0
0 . 6 5
0 . 7 0
0 . 7 5
0 . 8 0
0 . 8 5
0 . 9 0
0 . 9 5
1 . 0 0
1 2 2 4 3 6 4 8 6 0 7 2 8 4 9 6 1 0 8 1 2 0d u ra t i o n o f s ta y i n m o n th s
prob
abili
ty to
stay
e x a m p le C , 4 0 , lo w sk i l le d ,m a r r ie d , b o t h w o r k in g , 2 k id s ,o w n h o u s e , la s t e m p l . c h a n g e 1 0y e a r s a g o
e x a m p le B , 4 0 , m a r r ie d , b o t hw o r k in g , 1 c h i ld , la s t c h a n g e o fe m p l . 1 0 y e a r s a g o
a l l m e a n ( a g e 4 0 . 5 ) a n d z e r op r e v io u s m o v e s
e x a m p le C , 2 4 , lo w sk i l le d ,m a r r ie d , b o t h w o r k in g , la s tc h a n g e o f e m p lo y e r 2 y e a r s a g o
e x a m p le B , 2 4 , m a r r ie d , b o t hw o r k in g , la s t c h a n g e o fe m p lo y e r 2 y e a r s a g o
e x a m p le A , 4 0 , s in g le ,e m p lo y e d , la s t c h a n g e o fe m p lo y e r 1 0 y e a r s a g o
e x a m p le A , 2 4 , s in g le ,e m p lo y e d , la s t c h a n g e o fe m p lo y e r 2 y e a r s a g o
e x a m p le A , 2 4 , ( g o t )u n e m p lo y e d a f t e r f in is h in gs t u d ie s , in e d u c a t i o n a g a in
Source: own simulations using estimation results of model 3.
Assume an individual who has just completed first degree university studies, becameunemployed and then decided to continue with some further education. Our person isnow 24 years old and lives as a single in a rented apartment. For this typical individual�A� the probability of staying ranges between 0.71 and 0.88. Whether the person hasstayed for one or for ten years at the same place of residence makes a difference of 17per cent in the probability of staying, while for the 40 year old, less skilled marriedperson �C’ who has two kids, owns an own house and has not changed employer duringthe last ten years the difference amounts to just half a per cent. For �A� relative to �B�and �C�, higher education as well as being not married and not having a working partnerdecrease the probability to stay.
The different examples �A�, �B� and �C� demonstrate the strong joint effect of age,marital status and duration since employment on the probability to stay. Being 24 or 40makes a large difference in probability of staying for the highly educated working singlenamed �A�, while it is of considerably less importance to the married, low skilledindividual �C’.
24
All in all, duration of stay proves to be an important determinant of the probability ofstaying which becomes enforced by changes in age, family formation etc. that typicallyoccur while people stay immobile. Altogether they explain the strong overall relationbetween duration of stay and probability of staying shown in graph 3.
Although adding in model (2) individual socio-economic characteristics and regionaldifferences in macro variables increases the goodness of fit only moderately, theincrease in the validity of the model as measured in terms of the Log-Likelihood ishighly significant.15 Socio-economic variables show the expected signs and provesignificant. Apart from age, education turns out to be an important determinant ofimmobility. Presumably the skills of less educated people are less transferablelocationally than those of the highly skilled and the return on moving is lower. Inprevious work using census information on the socio-economic position of individualswe found less skilled blue collar worker as well as farmers to be particularly immobilewhile white collar highly skilled are particularly mobile (Fischer and Malmberg 1998).Foreign born individuals are in general significantly less immobile than the native born,but with years since immigration increasing the difference fades away. As the mobilityenhancing effect of education is significantly less pronounced for foreign born than fornatives, the (im)mobility patterns of high skilled foreign born approach these of thenative born faster than those of the unskilled.16
Houseownership obviously contributes significantly to explaining immobility. Owninga house probably entails individual and place-specific rents that are sunk in case of amove and which are relevant enough to keep people from moving.17
15 The fact that the pseudo-R2 increases only marginally despite highly significant variables being added
is indeed somewhat puzzling. This could e.g. be due to multicollinearity, but correlations between thedifferent variables are all below 0.8.
16 In our simulations the propensity to stay of a highly skilled foreign born �A� equals the one of a nativeborn after roughly 11 years while for the unskilled �C� it may take more than 20 years to line up withtheir native born �twin�. At the mean duration of 14 years since immigration (for which estimationresults are most reliable) �average� foreign born individuals are thus still somewhat more mobile thanthe native born population, even if we account for differences in the other explanatory variables.However, compared to general socio-economic criteria, being foreign born proves to be of relativelymarginal importance for the probability of staying.
17 It could be argued that houseownership is endogenous to the decision to stay immobile. We tend tobelieve that owning a house is often a prior target that individuals try to achieve without thinkingabout potential consequences for their (im)mobility. Often they realise what problems and costs achange of house would entail only after having seriously considered a certain move.
25
Furthermore it proves very fruitful to include the individuals� family situation. Not onlywhether one is married or not but even more so whether one has a working partneraffects the probability of staying strongly. The more a partner earns, the larger thepotential costs or insider advantages that are sunk in case of a move.18 Having childrensignificantly increases the probability of staying too. In line with the premises ofeconomic labour market theory people are found to be more mobile if they or a familymember becomes unemployed. Our findings thus confirm the literature that stresses theimportance of the family in migration decisions (Bloom and Stark 1985). The disutilityfrom moving is the sum of all the lost insider advantages of the whole family, includingthose of school-age children moving schools.
4.2 Poor Performance of Regional Macro Variables
Contrary to what one would expect from traditional migration theory, regionaldifferences in macroeconomic variables performed very poorly in explainingimmobility. We constructed and tested various indicators of regional differences inemployment and unemployment intensities, average income and wage levels as well asvacancies rates. They proved usually insignificant and regularly even showed the wrongsign. Because regional employment patterns and wage levels are highly correlated, wehad to choose a few particular indicators. As a crude proxy for the possibility thatindividuals value opportunities in the proximity different than more remote ones, weconstructed regional indicators relative to the average in the neighbouring region on theone hand and relative to all other, more remote regions on the other hand. Ourestimations suggest that (im)mobility patterns do not seem to be dependent on regionalemployment intensity differences. People tend to be more immobile in regions whereworker�s mean income level is relatively higher. The variable we used measures meanincome in thousands of Swedish Kroner for those who earned at least SKr 50,000 a year(as a proxy for regional development). But the effect is very small. The effect of thedifference between the average income level in the labour market in which one wasresident at the beginning of 1994 and the average in the surrounding labour marketsturns out to be insignificant. This is the more surprising as differences between the
18 In examining the data a logistic specification of income proved more appropriate than a linear one.
Note that this implies that it matters a lot whether or not a partner earns some income fromemployment. But the marginal effect of additional income on the probability of staying decreasesexponentially.
26
levels of average regional income from work were not that minor: the lowest was morethan 40,000 Swedish Kroner or 40 per cent less than the highest average income. Thedifference between average work incomes in the �home� and neighbouring regionsranged between SKr �16,000 and SKr +27,000. Also relative vacancy rates turned outto have been insignificant in determining individual probabilities to stay.
Generally, mobility patterns do not show distinct regional patterns in Sweden.19 Oneregional difference turns out to be clearly significant and noteworthy, however: Peopleliving in the three large metropolitan regions of Sweden (Stockholm, Gothenburg andMalmö) are significantly and considerably more immobile than individuals living in therest of the country. We have tested whether people living in larger, more urban labourmarkets are generally less mobile because they have more alternative opportunitiesnearby (we included the size of a region�s population in the estimations). We alsochecked whether the metropolitan effect could be primarily related to regionsincorporating university towns. Both hypotheses we had to reject. We are thus inclinedto conclude that metropolitan regions offer more scope for the accumulation of location-specific insider advantages and thereby keep people staying.
Furthermore, our results indicate that people are more inclined to leave labour marketsthat are characterised by a large share of industry, while they are especially likely tostay in labour markets that are characterised by the relatively high importance of theeducational sector.
4.3 Life-course Specificity and the Labour Market
The life-course hypothesis stipulates that probabilities of staying or moving are stronglylife-course situation-specific. These life events may be labour market related but arealso often not. The dissolution of a household e.g. will deprive the splitting individualfrom a good deal of his society-specific leisure oriented insider advantages. We wouldthus expect her probability to move significantly. On the other hand, engaging ineducation constraints the ability to move for a certain period of time, while completingan education will correspondingly decrease the probability to stay. We have added some
19 Including region-specific fixed dummies results in the estimation of significant coefficients for only
10 out of 108 labour markets. Included in these 10 are the three metropolitan areas covered by themetropolitan dummy.
27
life-course events for which we had information in our data in model (3). This againsignificantly improves its validity in terms of log-likelihood very significantly. Frommodel (3) it becomes clear that being in education is one of the most important causesfor mobility.20 It increases the probability of moving by more than being unemployed.That individuals engaging in education are often also out of the labour force enforcesthe effect even further and probably explains much of the high relevance of the out ofthe labour force variable.
Notwithstanding the fact that most people are young when they move, building a new orsplitting from a previous household are also highly significant factors that induce peopleto move over labour market borders. Having a baby may also increase mobility, but forthat the estimated coefficient is insignificant. Note also that while having a new babyrepresents a new life-course situation that initially may decreases the probability ofstaying, having an additional child (who also accumulates place-specific insideradvantages) significantly increases immobility.
With respect to labour market issues we have also tested for the importance of becoming(and not just being) unemployed in 1994, for both, oneself and the partner, irrespectiveof the length of actual unemployment and the sum of benefits received. Both �lifeevents� increase mobility and the coefficient of becoming unemployed oneself washighly significant.21
20 Indeed, 23.6 per cent of all movers have been recorded as �in education�. The corresponding share in
the total population has been only 8.1 per cent.21 The probability that the �partner gets unemployed� coefficient is significant at the 10 per cent
significance level too.
28
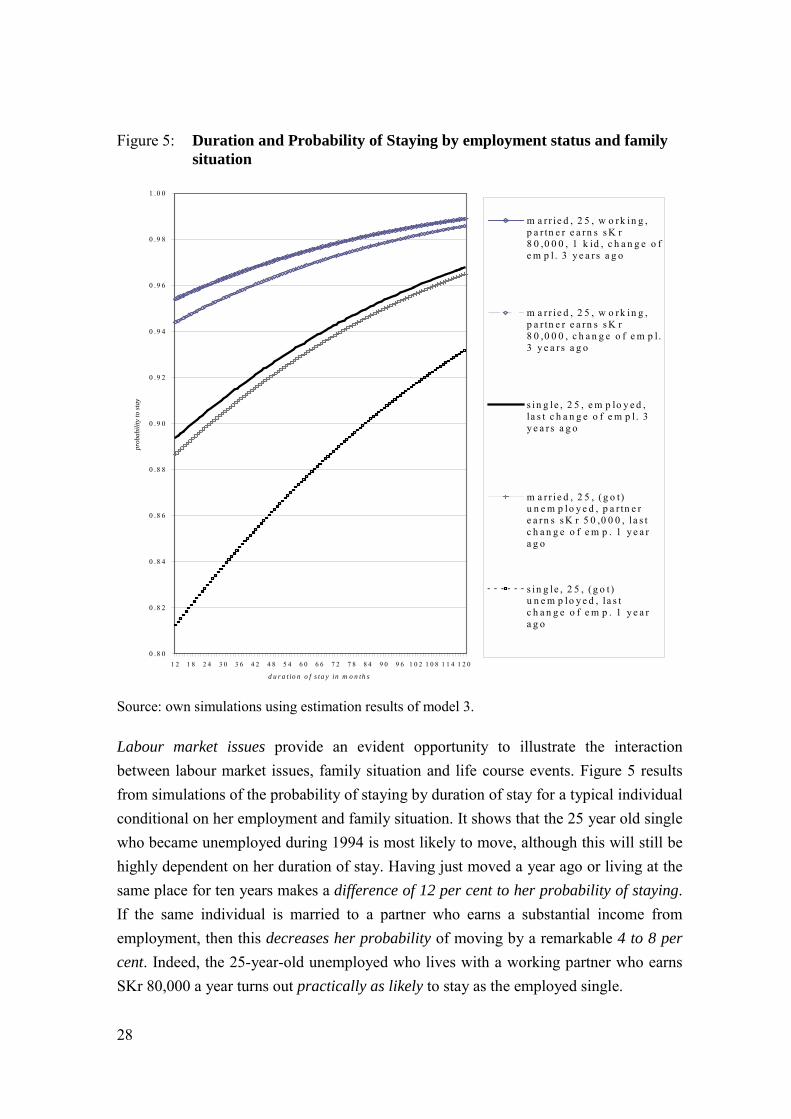
Figure 5: Duration and Probability of Staying by employment status and familysituation
0 .8 0
0 .8 2
0 .8 4
0 .8 6
0 .8 8
0 .9 0
0 .9 2
0 .9 4
0 .9 6
0 .9 8
1 .0 0
1 2 1 8 2 4 3 0 3 6 4 2 4 8 5 4 6 0 6 6 7 2 7 8 8 4 9 0 9 6 1 0 2 1 0 8 1 1 4 1 2 0
d u r a t io n o f s ta y in m o n th s
prob
abili
ty to
stay
m a r r ie d , 2 5 , w o rk in g ,p a r tn e r e a rn s s K r8 0 ,0 0 0 , 1 k id , c h a n g e o fe m p l . 3 y e a r s a g o
m a r r ie d , 2 5 , w o rk in g ,p a r tn e r e a rn s s K r8 0 ,0 0 0 , c h a n g e o f e m p l.3 y e a r s a g o
s in g le , 2 5 , e m p lo y e d ,la s t c h a n g e o f e m p l. 3y e a r s a g o
m a r r ie d , 2 5 , (g o t)u n e m p lo y e d , p a r tn e re a rn s s K r 5 0 ,0 0 0 , l a s tc h a n g e o f e m p . 1 y e a ra g o
s in g le , 2 5 , (g o t )u n e m p lo y e d , l a s tc h a n g e o f e m p . 1 y e a ra g o
Source: own simulations using estimation results of model 3.
Labour market issues provide an evident opportunity to illustrate the interactionbetween labour market issues, family situation and life course events. Figure 5 resultsfrom simulations of the probability of staying by duration of stay for a typical individualconditional on her employment and family situation. It shows that the 25 year old singlewho became unemployed during 1994 is most likely to move, although this will still behighly dependent on her duration of stay. Having just moved a year ago or living at thesame place for ten years makes a difference of 12 per cent to her probability of staying.If the same individual is married to a partner who earns a substantial income fromemployment, then this decreases her probability of moving by a remarkable 4 to 8 percent. Indeed, the 25-year-old unemployed who lives with a working partner who earnsSKr 80,000 a year turns out practically as likely to stay as the employed single.
29
Being employed and married to a partner who also earns an income of SKr. 80,000increases the likelihood to stay for the employed by another two to six per cent,depending on the duration of stay. Having a child makes then the minor difference ofless than a per cent additional increase in the probability of staying.
In brief the mobility effect of unemployment is not only dependent on individual socio-economic characteristics, but also on whether one became unemployed recently, issingle or married, has children or not and last but not least whether the partner earns asubstantial own income. Becoming unemployed is likely to be a relevant incentive tointer-regional labour market mobility in certain life course situations, namely when oneis young and single or young and married to a non-working partner.
4.4 Place of Birth and Occupation make little Difference
Are individual propensities to move significantly different depending on the countrysomebody comes from? Model (4) checks for this possibility by adding region of origin-specific dummies. Though it seems that immigrants from more developed countries aremore mobile than others and the respective coefficients are significant, country-specificeffects do not contribute notably to the explanation of the probability of staying.Immigrants are more mobile after immigration and adapt to native patterns over theyears,22 but this difference does not significantly depend on their region of origin.Model (4) which distinguishes between different groups of country of birth does not fitthe data significantly better than model (3) which includes a general dummy for foreignborn only.
In model (5) we test for the hypotheses that mobility patterns are occupational-specific,e.g. due to insider advantages being more important for some occupations than others.Model (5) adds to model (3) 14 occupational dummies which all are in reference tooccupations in industry. Farmers and construction workers seem to be significantlymore immobile than people occupied in industry, while people working in the hotel andrestaurant business, banking and insurance, general public administration as well as indifferent unspecified services show significantly higher mobility rates. All other groups
22 This finding corresponds well to the implications of the assimilation literature (Chiswick1986, 1992),
but of course the general caveat for cross-sectional investigations applies here too, that one cannotreally distinguish cohort from real assimilation effects (Borjas 1985)
30
exhibit no significant differences. Contrary to our expectations individuals engaged inresearch as well as those engaged in teaching are not found significantly more mobilethan industrial workers and those working with real estate were not less mobile. Thesignificantly lower mobility in construction is likely to be a kind of statistical artefact.Construction workers in Sweden are known to be particularly mobile but do not usuallychange their registered residence when they move to work at a different place for alimited period of time.
Adding occupational dummies to our model does not improve the indicators ofgoodness of fit. Contrary to the country dummies it does significantly increase the log-likelihood, but this increase is still relatively small. Instead of occupation we have alsoin vain tested for differences according to profession. An indicator measuring thegeographical dispersion of jobs over labour markets by occupation did not provesignificant neither. All in all we conclude that (im)mobility pattern in Sweden havegenerally not been occupational-specific.
4.5 Group-specific Heterogeneity
On the one hand, the above results have the advantage of being rather general and ofmaking optimal use of the variation in the data. On the other hand, they areunfortunately prone to group-specific heterogeneity that the general model does notmanage to capture sufficiently.23 Out of different group-specific estimations,distinguishing between �young� and �old� and between �employed� and �not employed�seems to cover the most important sources of heterogeneity.24 Separate estimationresults of model 3 for all people aged 19 to 29 (the age in which the majority of movesactually occur) as compared to people aged 30 to 64 and for those employed versus
23 What we discuss here concerns heterogeneity with respect to the determinants of mobility (i.e. the
coefficients). Another problem which often appears in large cross-sectional data is heterogeneity withrespect to the random variance term (Davidson and McKinnon 1993). This may first of all affect thestandard errors of the estimated coefficients in the sense that they become too large, a problem that isunlikely to affect our results. But in binary choice models it may also bias the coefficients itself(Yatchew and Griliches 1984). Some testing for heterogeneity produced inconclusive results. Probitmodels with heterogeneity are often weakly identified. Multicollinearity is a common problem(Greene 1993:423). Unfortunately, standard software procedures � including those implemented inlimdep that we used- do not allow to estimate heterogeneity corrected probit models with the kind ofchoice based samples we had to work with.
24 Separate estimations by gender result in minor differences in the estimated coefficients only. Resultsare available from the authors on request.
31
those not employed (i.e. either unemployed or out of the labour force) are provided inappendix 2. They show that while the mobility of the young group is estimated toincrease strongly and significantly during the first years, age does not matter anymorein the estimation of the probability of staying for the older ones.25
The mobility enhancing effect of education turns out considerably stronger for theyoung group than the older ones, but only for the native born. Not too surprisingly, the(very strong) importance of the in education dummy applies to the younger age grouponly, but somewhat surprisingly the mobility enhancing effect of being out of the labourforce is significantly stronger for the older age group, possibly due to early retirementrelocations. The life-course events that concern the partner (splitting from an existinghousehold or having a partner who becomes unemployed) are important in the older agegroup only. But for both groups, being married and having children increasesimmobility similarly.
Qualitatively, the separate estimation results for those employed and not employed arerather similar. For both groups, the effect of duration of staying in a labour market isimportant, highly significant and similar in magnitude. Unexpectedly, years since lastchange of employer turns out significant for the not employed only. From our point ofview it may further underline the importance of place- and society-specific insideradvantages relative to firm-specific ones. As one would expect, the income of thepartner, the �migration history� in terms of numbers of previous moves as well as familyand life-course event specific variables are somewhat more important for those notemployed than for those employed. The strong mobility enhancing effect of being ineducation concerns mainly those not employed. It illustrates that an important part ofthose who are out of the labour force consists of (presumably predominantly young)students and people in vocational training.
To see whether our 1994 results (a time when Sweden was hit by a severe economicdownturn) were sensitive to business cycle effects we ran comparative estimations forthe probability of staying in 1989 (an absolute boom year in the Swedish economy). Theresults provided surprisingly little evidence for strong business-cycle specific effects on
25 However, the shift in sign and strong change in magnitude between the two models indicates that
neither of the submodels manages to capture correctly a probably gradually changing effect of age onthe probability of staying.
32
immobility.26 Patterns are very similar for both estimations. Contrary to the estimationsfor 1994, however, the variable capturing differences in average work income in theown versus neighbouring regions was for the 1989 sample significant at the one per centlevel and showed the right sign. Also, the mobility enhancing effect of beingunemployed was significantly stronger in 1989 than in 1994. But the labour income of aworking partner was a more important reason to stay immobile in 1994 than in 1989.Probably, due to more opportunities being available, relative regional work incomedifferences play a somewhat more important role in better economic times while havinga partner who still has a job is more of a reason to stay in periods of economicdownturn.27
5. Conclusions and Interpretation
Our empirical investigation of mobility between Swedish labour markets identifiesimmobility as a strong and persistent behavioural strategy for the large majority ofpeople. The estimation results support our argument that insider advantages andduration effects of staying are crucial in gaining a better understanding of theimmobility phenomenon. We suggest that people stay because in time they haveaccumulated so many location-specific insider advantages that would be sunk in thecase of migration that moving would decrease their individual utility even if wage levelsdiffer substantially between regions.
Even though the insider advantage approach explains why the migration of people isusually a marginal phenomenon, it also points to the fact that actual mobility may havemore important long term effects on regional development. In line with the implicationsof traditional migration theory It adds to the explanation why those who move do notrepresent the average population. They are usually those who are young, who possesstransferable skills and who are in special life-course situations. Many of them come tostay, because when they accumulate location-specific insider-advantages, get olderand/or change their family situation, they will soon find it unattractive to move on.
26 Estimation results are available from the authors on request.27 The paradox that macro variables have relatively low effects and that for example employment
intensities prove insignificant is valid for the 1989 sample too, though. Note also that the incomedifference variable in the 1989 data will partly take up the effect of differences in vacancies-rates forwhich no information has been available.

33
Attracting people is thus bound to have longer lasting effects on the region of in-migration through respective changes in demographic composition and skill intensity.
Immobility of people is not (only) a market imperfection but often a necessary conditionfor individual utility maximisation and the generation of insider advantage intensiveknowledge. From an individual point of view, immobility is usually an optimal strategy.Generally, mobility would facilitate macroeconomic regional adjustment in a MonetaryUnion and may thus generate some positive externalities. But to the extent thatimmobility allows industries to make more efficient use of insider advantage-intensiveknowledge in production and the allocation of leisure time, it is also macroeconomicallyefficient.
If insider advantages are related to the behaviour of other residents in the local society,our insider advantages approach could explain the existence of internationallysustainable different mobility patterns. In Europe where almost everybody stays insideradvantages are especially relevant. By contrast, in places like the US where it is part ofthe dominant culture to be mobile, it ought to be less rewarding to invest in theaccumulation of insider advantages as part of them are at risk when other people andwork mates decide to move away.
34
ReferencesAmemiya, T. (1981).
Qualitative Response Models: A Survey. Journal of Economic Literature 19, pp1483-1536.
Bauer, T., Zimmermann, K.F. (1997)Network Migration of Ethnic Germans. In International Migration Review 31, pp143-149.
Becker, G. (1962).Investment in Human Capital: a Theoretical Analysis. Journal of Economics 70: 9-49.
Bengtson, T., Johansson, M. (1993)Economic and Social Factors Behind the Slowdown of Migration in NorthernSweden. In Jussila, H., Persson, L-O., Wiberg, U., Shifts in Systems at the Top ofEurope. FORA, Royal Institute of Technology, Stockholm.
Bentolila, S., Jimeno, J.F. (1995)Regional Unemployment Persistence (Spain 1976-94). CEPR Discussion Paper1259, Centre for Economic Policy Research, London.
Blanchard, O.J., Katz, L.F. (1992)Regional Evolutions. Brookings Papers on Econmic Activity, pp. 1-76.
Borjas, G.J. (1985)Assimilation, Changes in cohort Qualitz and the Earnings of Immigrants. Journal ofLabour Economics 3, pp 463-489.
Burda, M.C. (1995)Migration and the option value of waiting. The Economic and Social Review 27,pp. 1 � 19.
Chiswick, B.R. (1986).Human Capital and the Labour Market Adjustment of Immigrants. In: Migration,Human Capital and Development, edited by O. Stark, pp 1-26.
Chiswick, B.R. (1992).The Performance of Immigrants in the Labour Market; A Review Essay. HebrewUniversity of Jerusalem.
Davidson, R., McKinnon,J.G. (1993)Estimation and Inference in Econometrics. Oxford University Press, Oxford.
Decressin, J., Fatas, A. (1995)Regional Labour Market Dynamics in Europe. European Economic Review 39, pp.1627-1655.
35
Eichengreen, B. (1993)Labour Markets and European Monetary Unification. In Masson, P.R., Taylor,M.P., Policy Issues in the Operation of Currency Unions, Cambridge UniversityPress, Cambridge, pp. 130-162.
Faini, R. et al (1997)An Empirical Puzzle: Falling Migration and Growing UnemploymentDifferentials Among Italian Regions. European Economic Review 41, pp. 571-579.
Faist, Th. (1997)Migration und der Transfer sozialen Kapitals oder: warum gibt es relativ wenigeinternationale Migranten? In Pries, L. (Ed.), Transnationale Migration, NomosBaden �Baden, pp. 63-83.
Finansdepartementet (1994).Sveriges Ekonomiska Geografi. Bilaga till Långtidsutredningen 1995. Stockholm.
Fischer, P.A. and Malmberg, G. (1998).Immobility in Sweden: Are Baltic Born Less Mobile than Swedish and FinnishBorn? Finnish Yearbook of Population Research 34, pp. 71-86.
Friedberg, R.M. (2000).You Can´t Take It with You? Immigrant Assimilation and the Portabilitz of HumanCapital. Journal of Labour Economics 18/2, pp. 221-251.
Ghatak, S., Levine, P. and Wheatley Price, S. (1996).Migration Theories and Evidence: An Assessment. Journal of Economic Surveys10(2): 159-98.
Gordon, I.R. and Molho, I. (1995).Duration Dependence in Migration Behaviour: Cumulative Inertia versusStochastic Change. Environment and Planning A.
Greene, W.H. (1993).Econometric Analysis (2nd edition). Englewood Cliffs NJ et al: Prentice Hall.
Hägerstrand, T. (1975)Space, Time and Human Conditions. In Karlqvist, A. (ed.) Dynamic Allocation ofUrban Space, Farnborough.
Hägerstrand, T. (1993)Om tidens vidd och tingens ordning. Liber, Stockholm.
Hammar, T., Brochmann, G., Tamas, K. and Faist, Th. (eds.) (1997).International Migration Immobility and Development: MultidisciplinaryPerspectives. Oxford: Berg Publishers.
Korcelli, P. (1994).On the interrelations between internal and international migration. Innovation: TheEuropean Journal of Social Sciences 7(2), pp151-163.
36
Laitila, Th. (1993).A Pseudo-R2 Measure for Limited and Qualitative Dependent Variable Models.Journal of Econometrics 56: 341-356.
Lindbeck, A., Snower,, D.J. (1994)Patterns of Unemployment: An Insider-Outsider Analysis. CEPR Discussion Paper960, Centre for Economic Policy Research, London.
Lindbeck, A., Snower,D.J. (1988)The Insider-Oursider Theory of Employment and Unemployment. MIT Press,Cambridge, Mass.
McFadden, D. (1974).Conditional Logit Analysis of Qualitative Choice Behaviour. In: Zarembka, P.(ed.), Frontiers in Econometrics, Academic Press, New York, pp 105-142.
McKelvey, R.D. and Zavoina, W. (1975).A Statistical Model for the Analysis of Ordinal Level Dependent Variables. Journalof Mathematical Sociology 4: 103-120.
Obstfeld, M., Peri, G. (1998)Regional non-adjustment and fiscal policy. In: Begg, D., von Hagen, J., Wyplosz,Ch. and Zimmermann, K.F. (eds.), EMU: Prospects and Challenges for the Euro.Blackwell Publishers, Oxford.
Stark, O. (1991)The Migration of Labour, Basil Blackwell, Cambridge, Mass.
Stark, O. and Bloom D.E. (1985)The New Economics of Labour Migration. American Economic Review 75, pp173-178.
Stark, O., Helmenstein, Ch., Yegorov, Y. (1997).Migrants� Savings, Purchasing Power Parity, and the Optimal Duration ofMigration.
Veall, M.R. and Zimmermann, K.F. (1992).Pseudo-R2�s in the Ordinal Probit Model, Journal of Mathematical Sociology 16,pp 333-342.
Windmeijer, F.A., (1995).Goodness of fit Measures in Binary Choice Models. Econometric Reviews 14(1),pp 101-116.
Yatchew, A., Griliches, Z. (1984)Specification Error in Probit Models. Review of Economics and Statistics 66, pp.134-139.
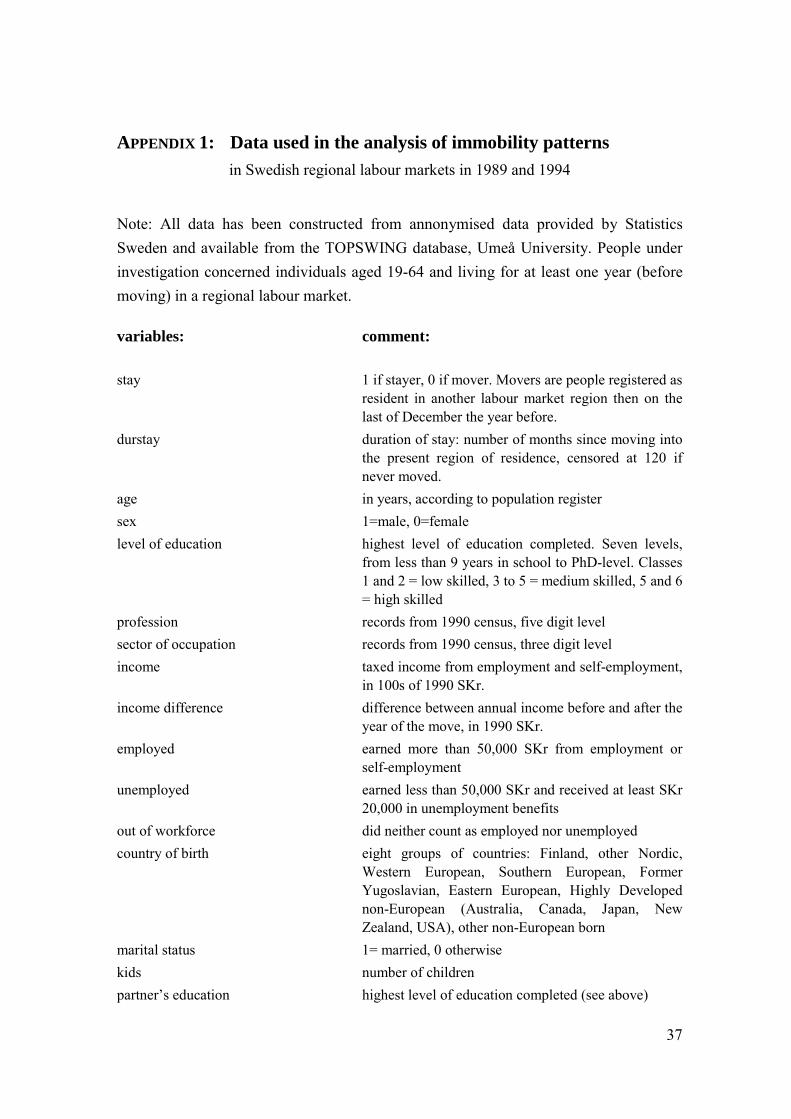
37
APPENDIX 1: Data used in the analysis of immobility patternsin Swedish regional labour markets in 1989 and 1994
Note: All data has been constructed from annonymised data provided by StatisticsSweden and available from the TOPSWING database, Umeå University. People underinvestigation concerned individuals aged 19-64 and living for at least one year (beforemoving) in a regional labour market.
variables: comment:
stay 1 if stayer, 0 if mover. Movers are people registered asresident in another labour market region then on thelast of December the year before.
durstay duration of stay: number of months since moving intothe present region of residence, censored at 120 ifnever moved.
age in years, according to population registersex 1=male, 0=femalelevel of education highest level of education completed. Seven levels,
from less than 9 years in school to PhD-level. Classes1 and 2 = low skilled, 3 to 5 = medium skilled, 5 and 6= high skilled
profession records from 1990 census, five digit levelsector of occupation records from 1990 census, three digit levelincome taxed income from employment and self-employment,
in 100s of 1990 SKr.income difference difference between annual income before and after the
year of the move, in 1990 SKr.employed earned more than 50,000 SKr from employment or
self-employmentunemployed earned less than 50,000 SKr and received at least SKr
20,000 in unemployment benefitsout of workforce did neither count as employed nor unemployedcountry of birth eight groups of countries: Finland, other Nordic,
Western European, Southern European, FormerYugoslavian, Eastern European, Highly Developednon-European (Australia, Canada, Japan, NewZealand, USA), other non-European born
marital status 1= married, 0 otherwisekids number of childrenpartner�s education highest level of education completed (see above)
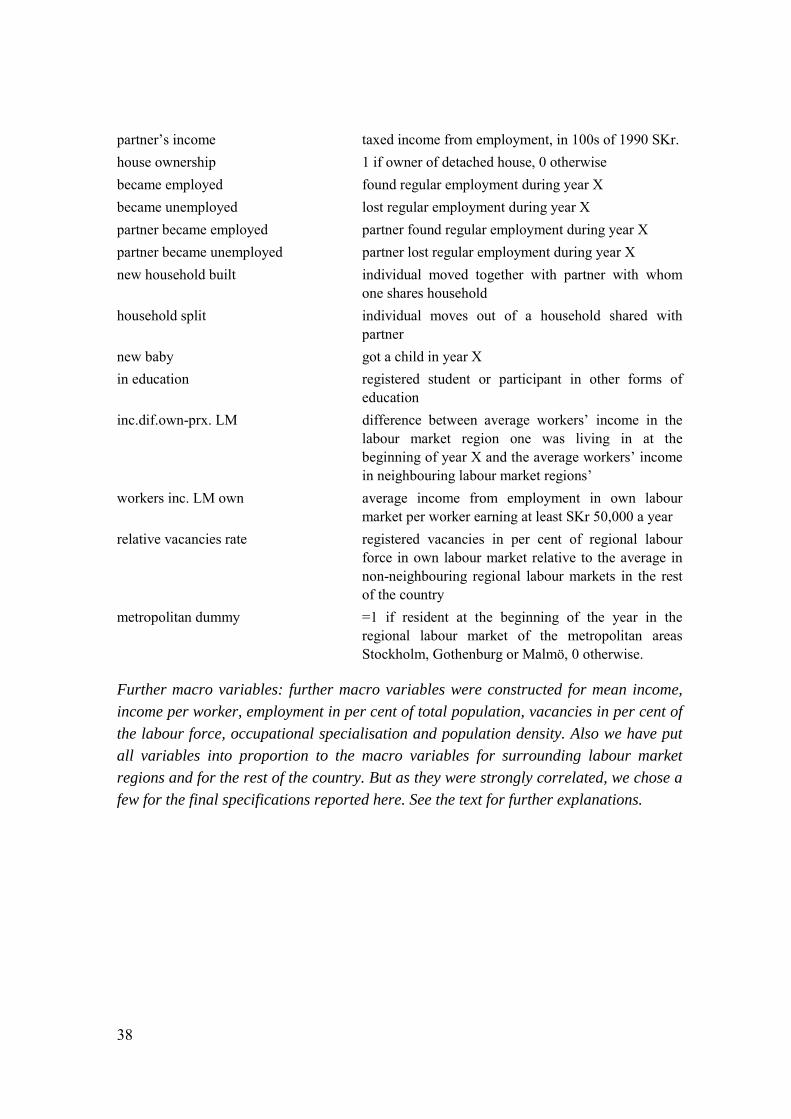
38
partner�s income taxed income from employment, in 100s of 1990 SKr.house ownership 1 if owner of detached house, 0 otherwisebecame employed found regular employment during year Xbecame unemployed lost regular employment during year Xpartner became employed partner found regular employment during year Xpartner became unemployed partner lost regular employment during year Xnew household built individual moved together with partner with whom
one shares householdhousehold split individual moves out of a household shared with
partnernew baby got a child in year Xin education registered student or participant in other forms of
educationinc.dif.own-prx. LM difference between average workers� income in the
labour market region one was living in at thebeginning of year X and the average workers� incomein neighbouring labour market regions�
workers inc. LM own average income from employment in own labourmarket per worker earning at least SKr 50,000 a year
relative vacancies rate registered vacancies in per cent of regional labourforce in own labour market relative to the average innon-neighbouring regional labour markets in the restof the country
metropolitan dummy =1 if resident at the beginning of the year in theregional labour market of the metropolitan areasStockholm, Gothenburg or Malmö, 0 otherwise.
Further macro variables: further macro variables were constructed for mean income,income per worker, employment in per cent of total population, vacancies in per cent ofthe labour force, occupational specialisation and population density. Also we have putall variables into proportion to the macro variables for surrounding labour marketregions and for the rest of the country. But as they were strongly correlated, we chose afew for the final specifications reported here. See the text for further explanations.
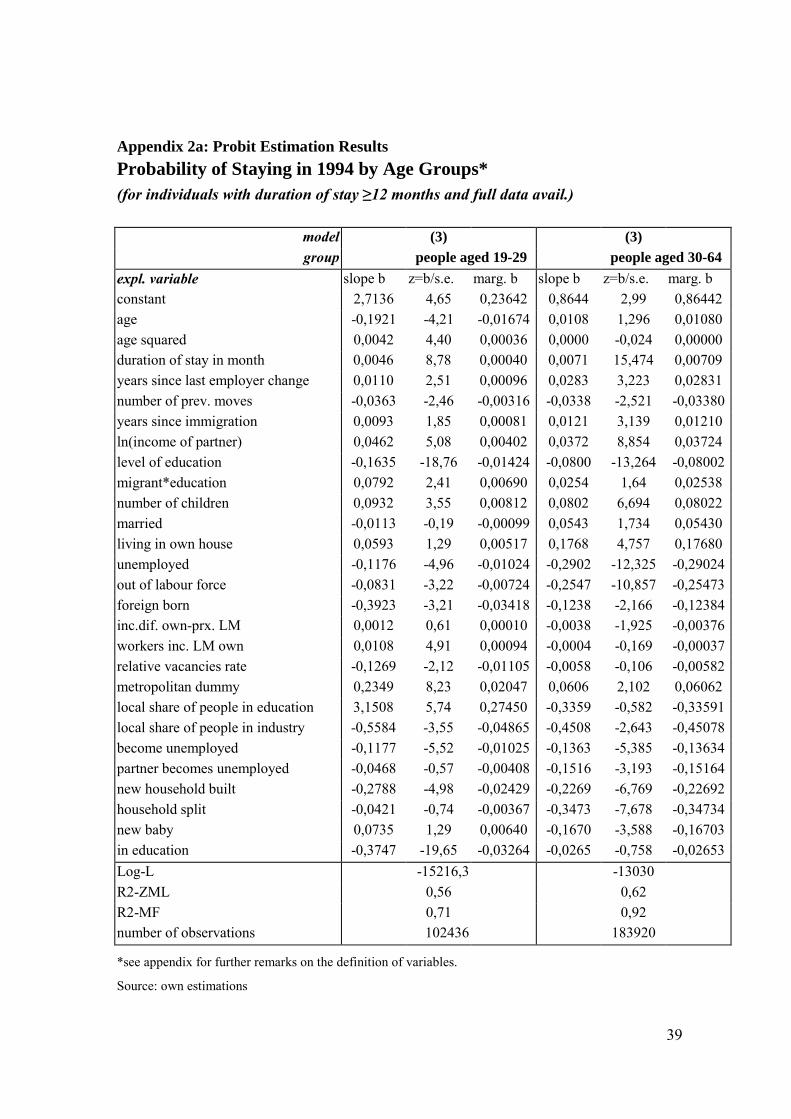
39
Appendix 2a: Probit Estimation ResultsProbability of Staying in 1994 by Age Groups*(for individuals with duration of stay ≥12 months and full data avail.)
model (3) (3)group people aged 19-29 people aged 30-64
expl. variable slope b z=b/s.e. marg. b slope b z=b/s.e. marg. bconstant 2,7136 4,65 0,23642 0,8644 2,99 0,86442age -0,1921 -4,21 -0,01674 0,0108 1,296 0,01080age squared 0,0042 4,40 0,00036 0,0000 -0,024 0,00000duration of stay in month 0,0046 8,78 0,00040 0,0071 15,474 0,00709years since last employer change 0,0110 2,51 0,00096 0,0283 3,223 0,02831number of prev. moves -0,0363 -2,46 -0,00316 -0,0338 -2,521 -0,03380years since immigration 0,0093 1,85 0,00081 0,0121 3,139 0,01210ln(income of partner) 0,0462 5,08 0,00402 0,0372 8,854 0,03724level of education -0,1635 -18,76 -0,01424 -0,0800 -13,264 -0,08002migrant*education 0,0792 2,41 0,00690 0,0254 1,64 0,02538number of children 0,0932 3,55 0,00812 0,0802 6,694 0,08022married -0,0113 -0,19 -0,00099 0,0543 1,734 0,05430living in own house 0,0593 1,29 0,00517 0,1768 4,757 0,17680unemployed -0,1176 -4,96 -0,01024 -0,2902 -12,325 -0,29024out of labour force -0,0831 -3,22 -0,00724 -0,2547 -10,857 -0,25473foreign born -0,3923 -3,21 -0,03418 -0,1238 -2,166 -0,12384inc.dif. own-prx. LM 0,0012 0,61 0,00010 -0,0038 -1,925 -0,00376workers inc. LM own 0,0108 4,91 0,00094 -0,0004 -0,169 -0,00037relative vacancies rate -0,1269 -2,12 -0,01105 -0,0058 -0,106 -0,00582metropolitan dummy 0,2349 8,23 0,02047 0,0606 2,102 0,06062local share of people in education 3,1508 5,74 0,27450 -0,3359 -0,582 -0,33591local share of people in industry -0,5584 -3,55 -0,04865 -0,4508 -2,643 -0,45078become unemployed -0,1177 -5,52 -0,01025 -0,1363 -5,385 -0,13634partner becomes unemployed -0,0468 -0,57 -0,00408 -0,1516 -3,193 -0,15164new household built -0,2788 -4,98 -0,02429 -0,2269 -6,769 -0,22692household split -0,0421 -0,74 -0,00367 -0,3473 -7,678 -0,34734new baby 0,0735 1,29 0,00640 -0,1670 -3,588 -0,16703in education -0,3747 -19,65 -0,03264 -0,0265 -0,758 -0,02653Log-L -15216,3 -13030R2-ZML 0,56 0,62R2-MF 0,71 0,92number of observations 102436 183920
*see appendix for further remarks on the definition of variables.
Source: own estimations
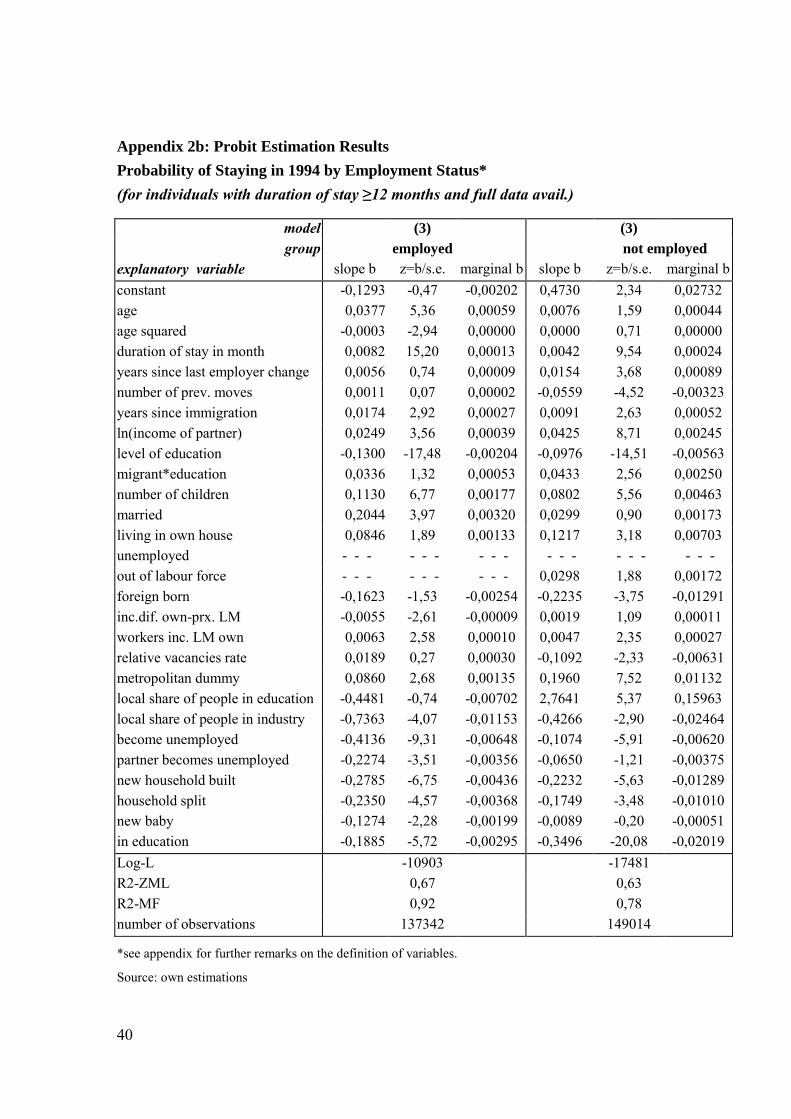
40
Appendix 2b: Probit Estimation ResultsProbability of Staying in 1994 by Employment Status*(for individuals with duration of stay ≥12 months and full data avail.)
model (3) (3)group employed not employed
explanatory variable slope b z=b/s.e. marginal b slope b z=b/s.e. marginal bconstant -0,1293 -0,47 -0,00202 0,4730 2,34 0,02732age 0,0377 5,36 0,00059 0,0076 1,59 0,00044age squared -0,0003 -2,94 0,00000 0,0000 0,71 0,00000duration of stay in month 0,0082 15,20 0,00013 0,0042 9,54 0,00024years since last employer change 0,0056 0,74 0,00009 0,0154 3,68 0,00089number of prev. moves 0,0011 0,07 0,00002 -0,0559 -4,52 -0,00323years since immigration 0,0174 2,92 0,00027 0,0091 2,63 0,00052ln(income of partner) 0,0249 3,56 0,00039 0,0425 8,71 0,00245level of education -0,1300 -17,48 -0,00204 -0,0976 -14,51 -0,00563migrant*education 0,0336 1,32 0,00053 0,0433 2,56 0,00250number of children 0,1130 6,77 0,00177 0,0802 5,56 0,00463married 0,2044 3,97 0,00320 0,0299 0,90 0,00173living in own house 0,0846 1,89 0,00133 0,1217 3,18 0,00703unemployed - - - - - - - - - - - - - - - - - -out of labour force - - - - - - - - - 0,0298 1,88 0,00172foreign born -0,1623 -1,53 -0,00254 -0,2235 -3,75 -0,01291inc.dif. own-prx. LM -0,0055 -2,61 -0,00009 0,0019 1,09 0,00011workers inc. LM own 0,0063 2,58 0,00010 0,0047 2,35 0,00027relative vacancies rate 0,0189 0,27 0,00030 -0,1092 -2,33 -0,00631metropolitan dummy 0,0860 2,68 0,00135 0,1960 7,52 0,01132local share of people in education -0,4481 -0,74 -0,00702 2,7641 5,37 0,15963local share of people in industry -0,7363 -4,07 -0,01153 -0,4266 -2,90 -0,02464become unemployed -0,4136 -9,31 -0,00648 -0,1074 -5,91 -0,00620partner becomes unemployed -0,2274 -3,51 -0,00356 -0,0650 -1,21 -0,00375new household built -0,2785 -6,75 -0,00436 -0,2232 -5,63 -0,01289household split -0,2350 -4,57 -0,00368 -0,1749 -3,48 -0,01010new baby -0,1274 -2,28 -0,00199 -0,0089 -0,20 -0,00051in education -0,1885 -5,72 -0,00295 -0,3496 -20,08 -0,02019Log-L -10903 -17481R2-ZML 0,67 0,63R2-MF 0,92 0,78number of observations 137342 149014
*see appendix for further remarks on the definition of variables.
Source: own estimations


![[CRISIL] Literature review on insider trading and insider ... · Literature review on Insider Trading and Insider Trading Regulation Abstract Views on insider trading and its effects](https://img.pdfslide.net/doc/110x75/5ad077037f8b9a71028de0eb/crisil-literature-review-on-insider-trading-and-insider-review-on-insider.jpg)