Embed Size (px)
Citation preview
Why Do We CAPWAP?
Pile Dynamics, Inc. Representative Days
September 27 – 29, 2017
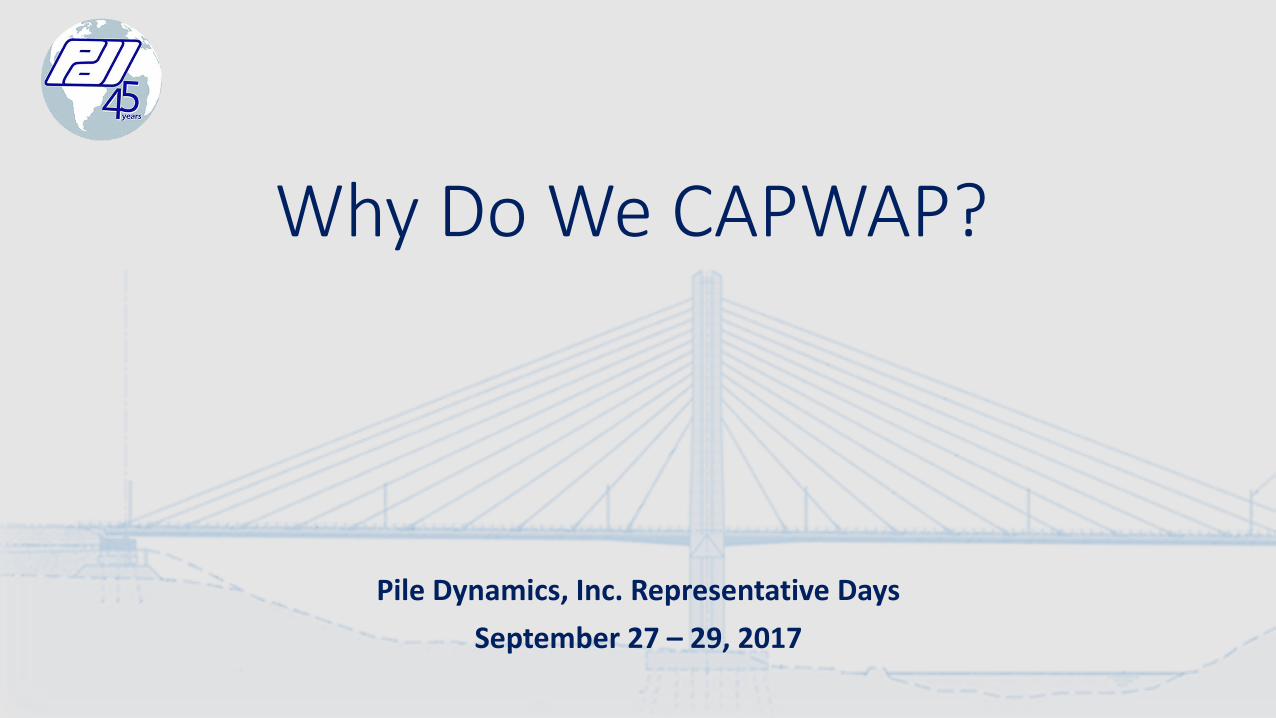
• Incomplete Resistance Activationsmall set per blow< 1/10 inch; 2.5 mm
• What to do?Bigger hammer;higher energy hammer
• Caution Watch stresses!
• No point exceeding 6 to 8 mm set per blow( 1/4 to 1/3 inch per blow )
CAPWAP Limitations
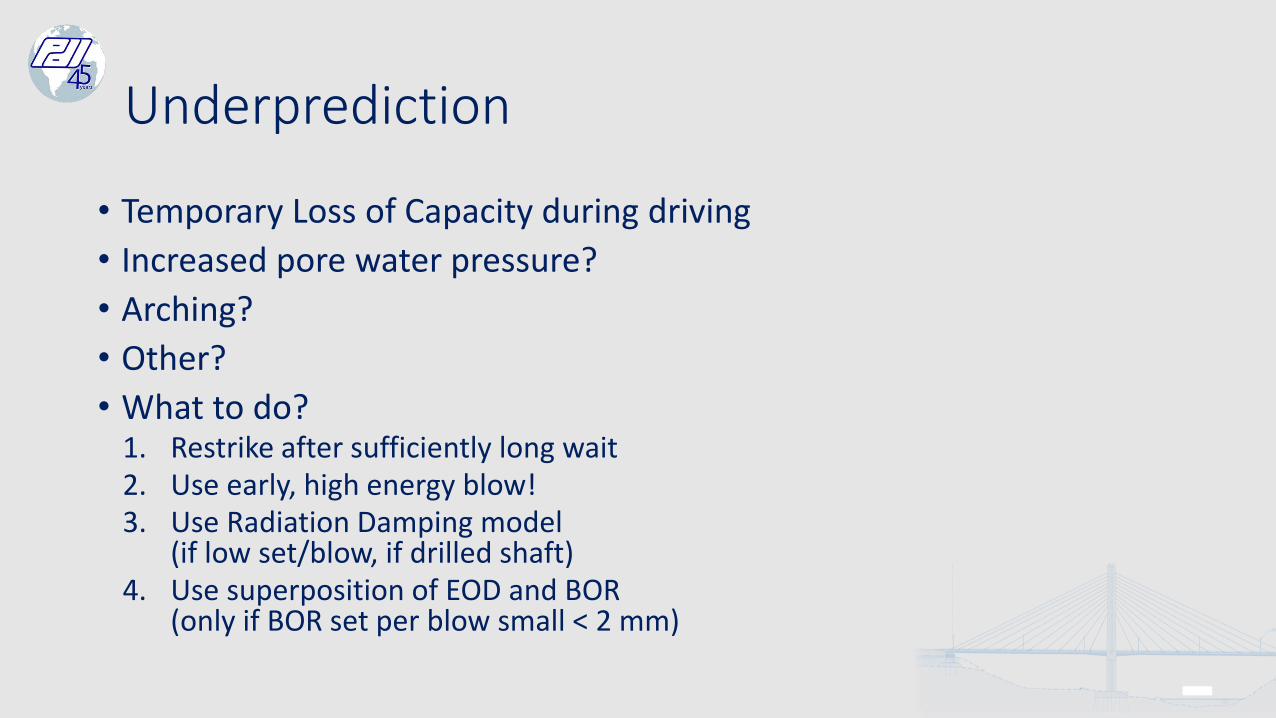
Underprediction
• Temporary Loss of Capacity during driving
• Increased pore water pressure?
• Arching?
• Other?
• What to do?1. Restrike after sufficiently long wait2. Use early, high energy blow!3. Use Radiation Damping model
(if low set/blow, if drilled shaft)4. Use superposition of EOD and BOR
(only if BOR set per blow small < 2 mm)
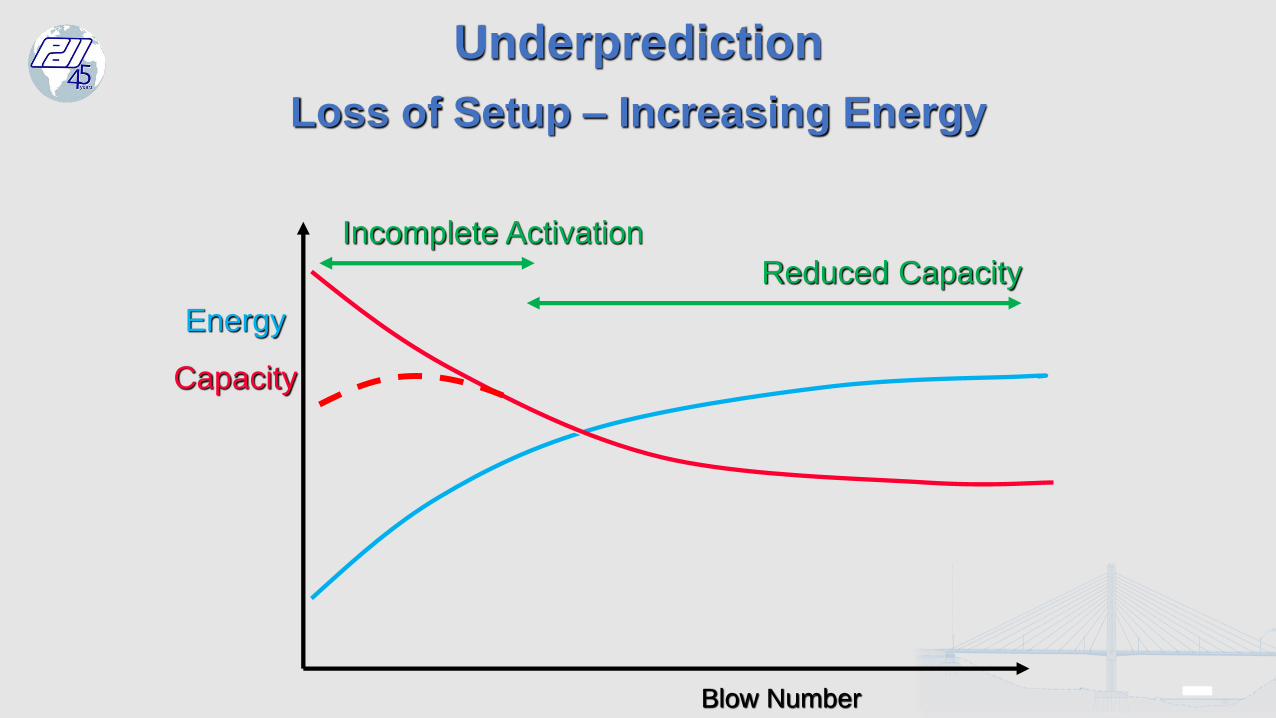
Underprediction
Loss of Setup – Increasing Energy
Energy
Capacity
Incomplete Activation
Reduced Capacity
Blow Number
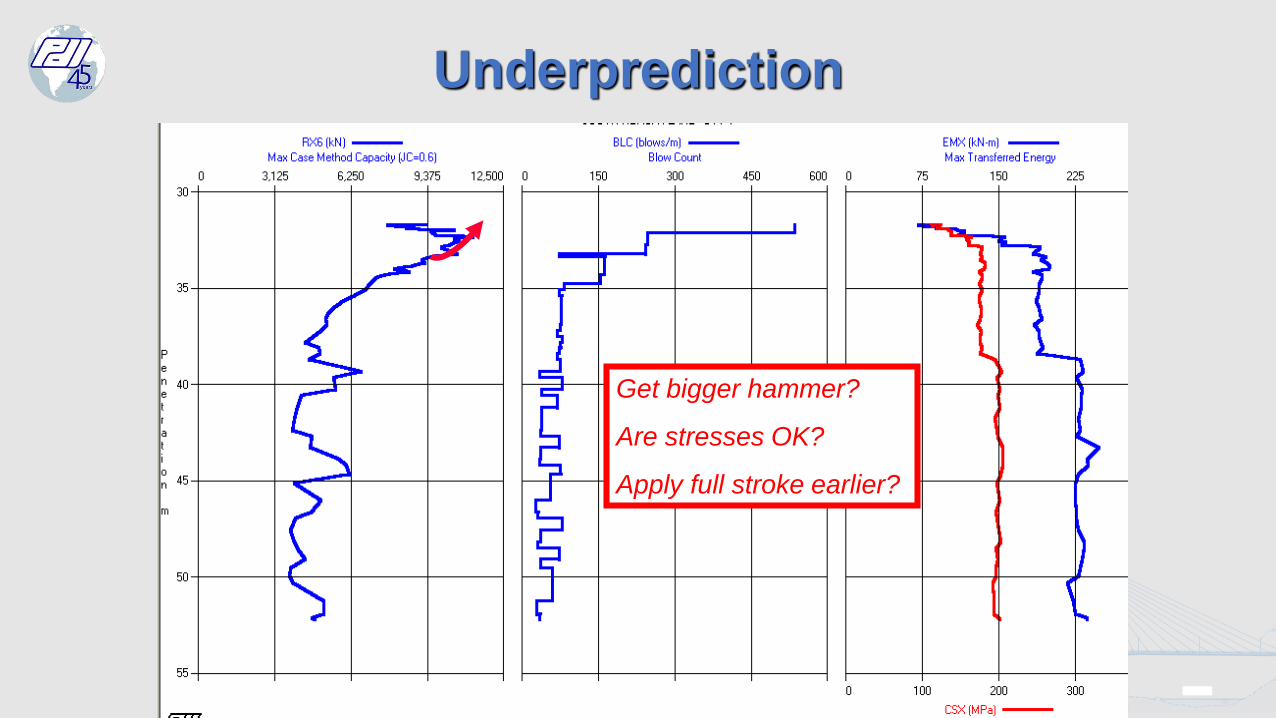
Underprediction
Get bigger hammer?
Are stresses OK?
Apply full stroke earlier?
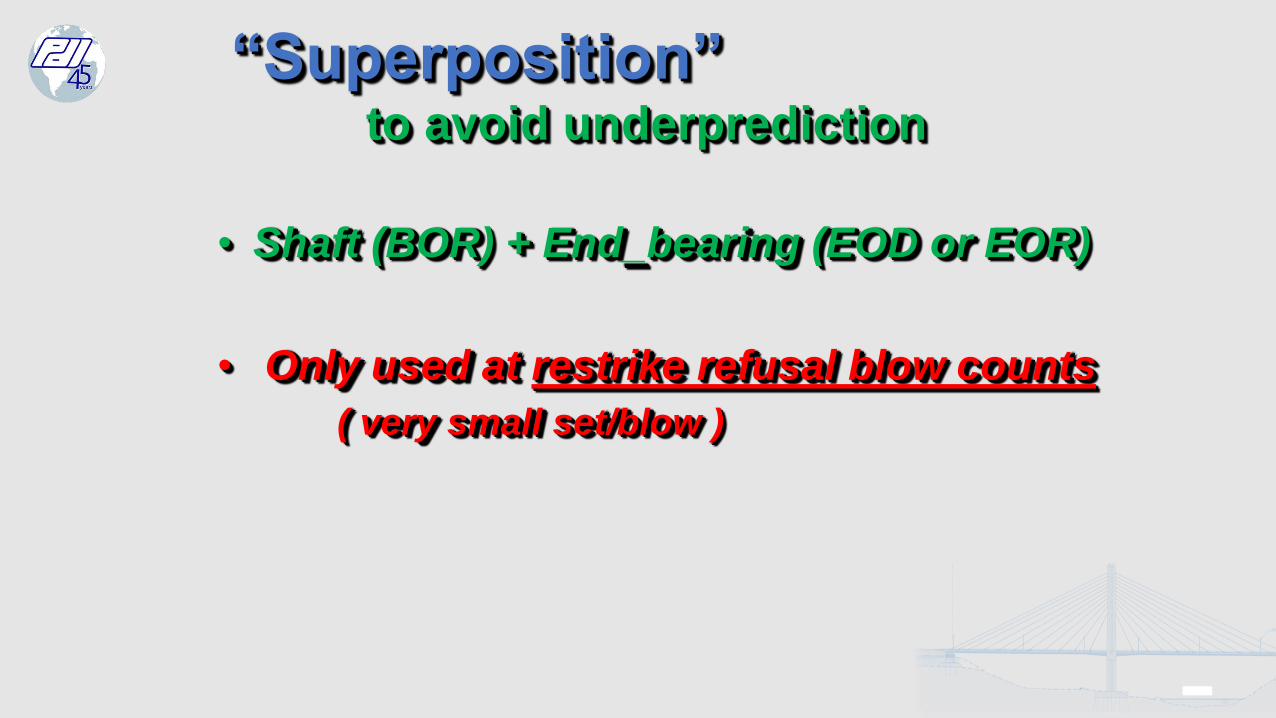
“Superposition” to avoid underprediction
• Shaft (BOR) + End_bearing (EOD or EOR)
• Only used at restrike refusal blow counts
( very small set/blow )
“The Use of Superposition for Evaluating Pile
Capacity”
Mohamad H. Hussein – GRL
Michael R. Sharp – URS
William “Bubba” Knight - PSI (FDOT District Geotechnical Engineer during the project work)
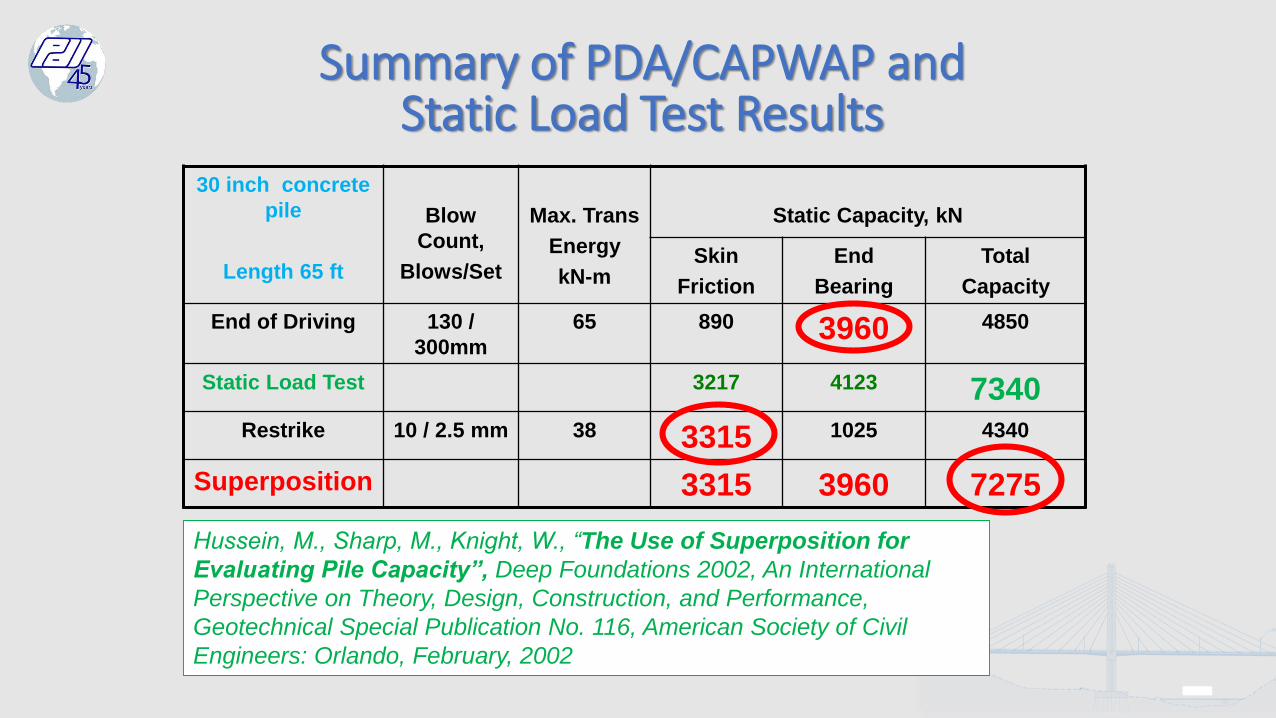
30 inch concrete
pile
Length 65 ft
Blow
Count,
Blows/Set
Max. Trans
Energy
kN-m
Static Capacity, kN
Skin
Friction
End
Bearing
Total
Capacity
End of Driving 130 /
300mm
65 890 3960 4850
Static Load Test 3217 4123 7340
Restrike 10 / 2.5 mm 38 3315 1025 4340
Superposition 3315 3960 7275
Summary of PDA/CAPWAP and Static Load Test Results
Hussein, M., Sharp, M., Knight, W., “The Use of Superposition for
Evaluating Pile Capacity”, Deep Foundations 2002, An International
Perspective on Theory, Design, Construction, and Performance,
Geotechnical Special Publication No. 116, American Society of Civil
Engineers: Orlando, February, 2002
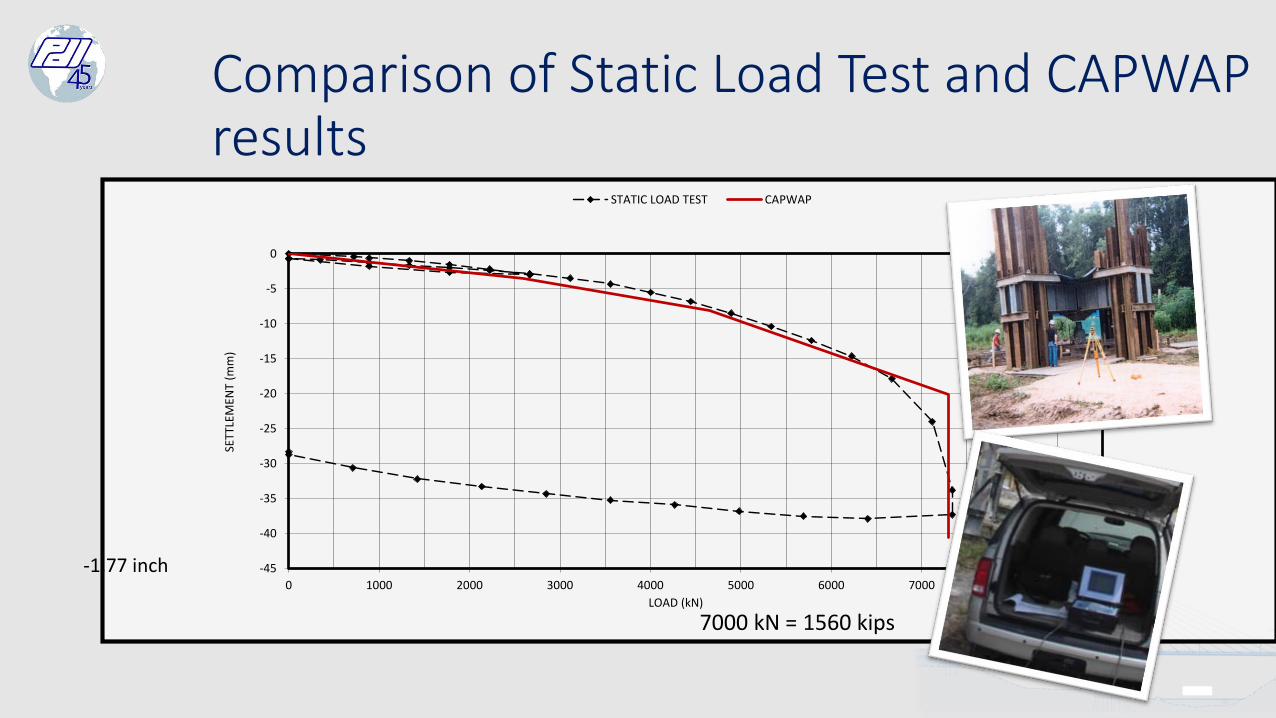
-45
-40
-35
-30
-25
-20
-15
-10
-5
0
0 1000 2000 3000 4000 5000 6000 7000 8000 9000
SETT
LEM
ENT
(mm
)
LOAD (kN)
STATIC LOAD TEST CAPWAP
Comparison of Static Load Test and CAPWAP results
-1.77 inch
7000 kN = 1560 kips
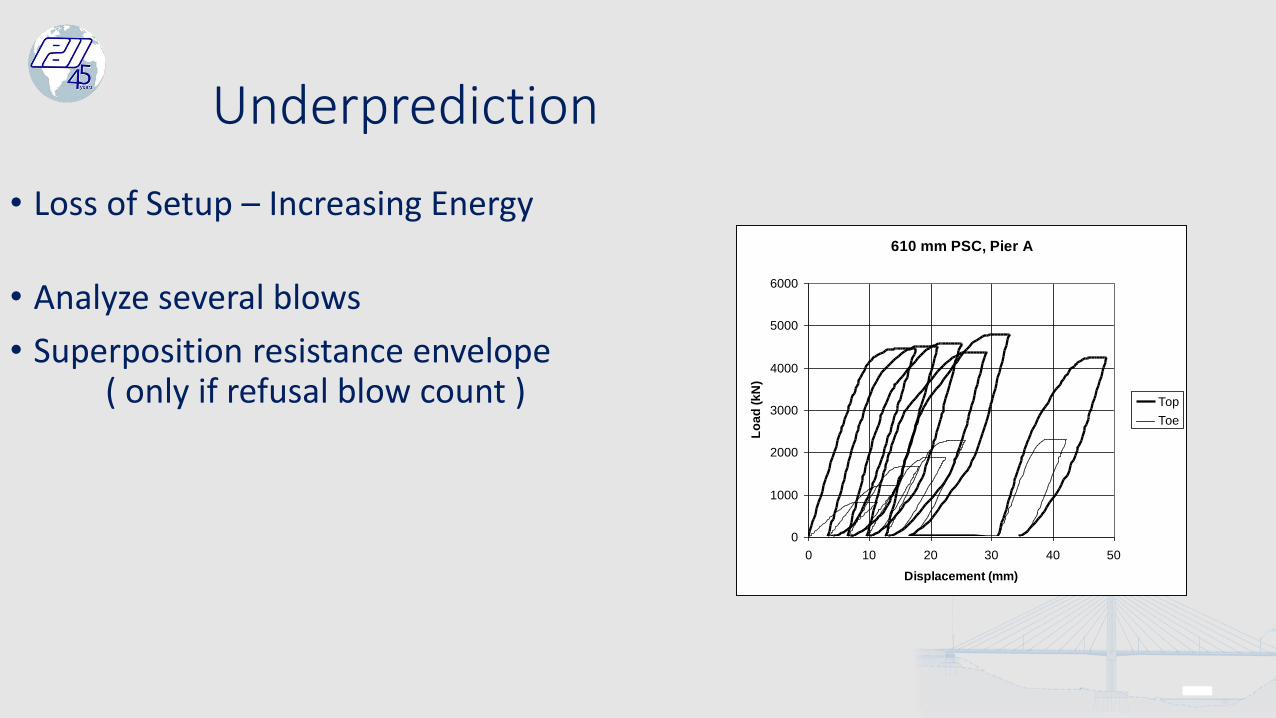
610 mm PSC, Pier A
0
1000
2000
3000
4000
5000
6000
0 10 20 30 40 50
Displacement (mm)
Lo
ad
(k
N)
Top
Toe
Underprediction
• Loss of Setup – Increasing Energy
• Analyze several blows
• Superposition resistance envelope( only if refusal blow count )
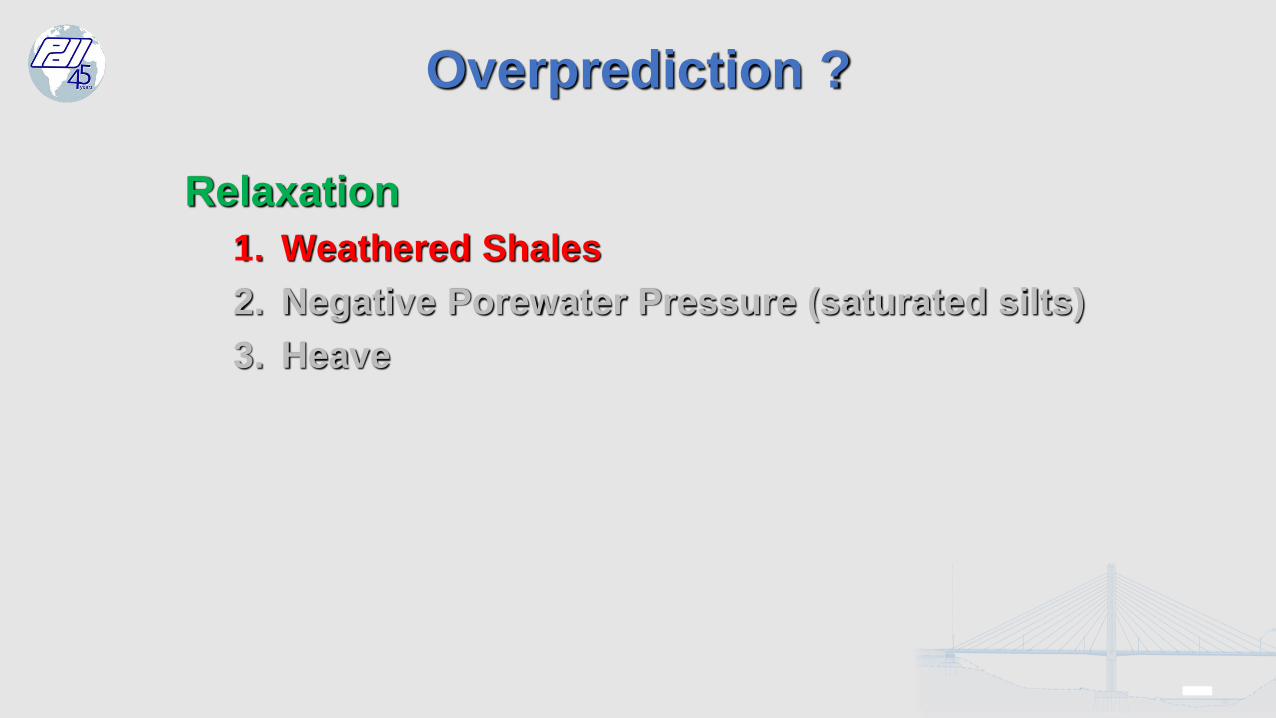
Overprediction ?
Relaxation
1. Weathered Shales
2. Negative Porewater Pressure (saturated silts)
3. Heave
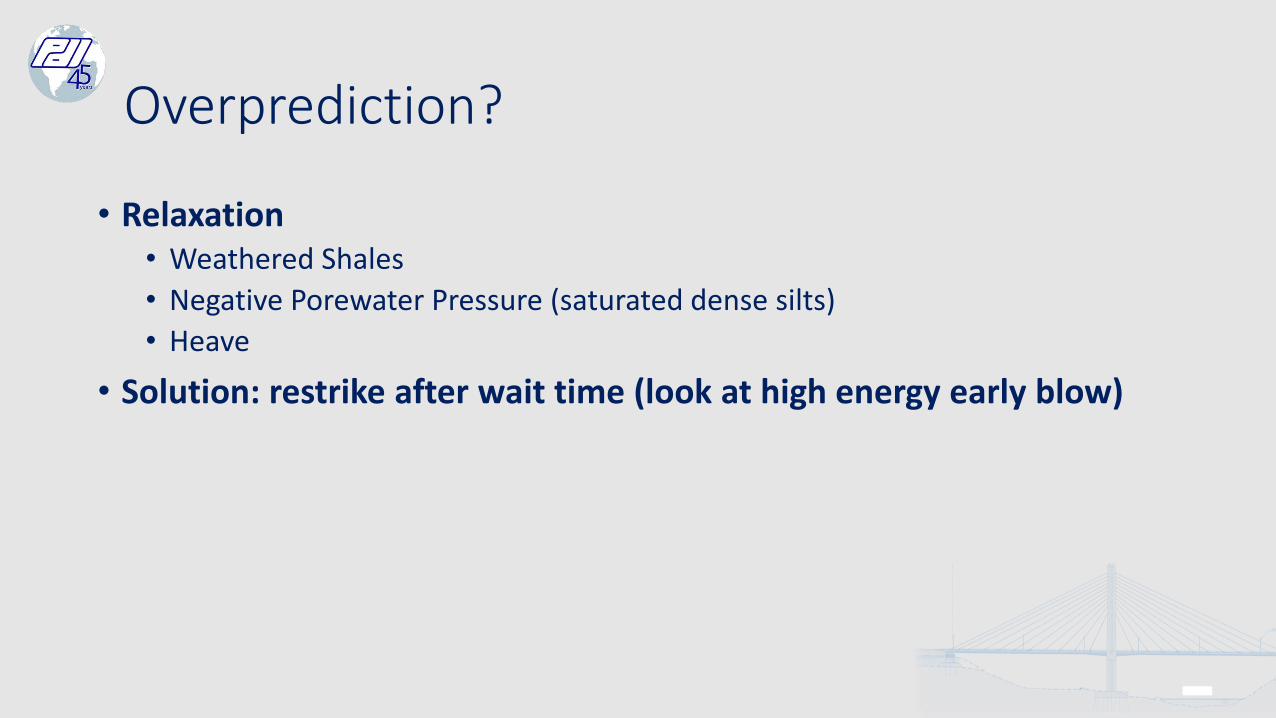
Overprediction?
• Relaxation• Weathered Shales
• Negative Porewater Pressure (saturated dense silts)
• Heave
• Solution: restrike after wait time (look at high energy early blow)
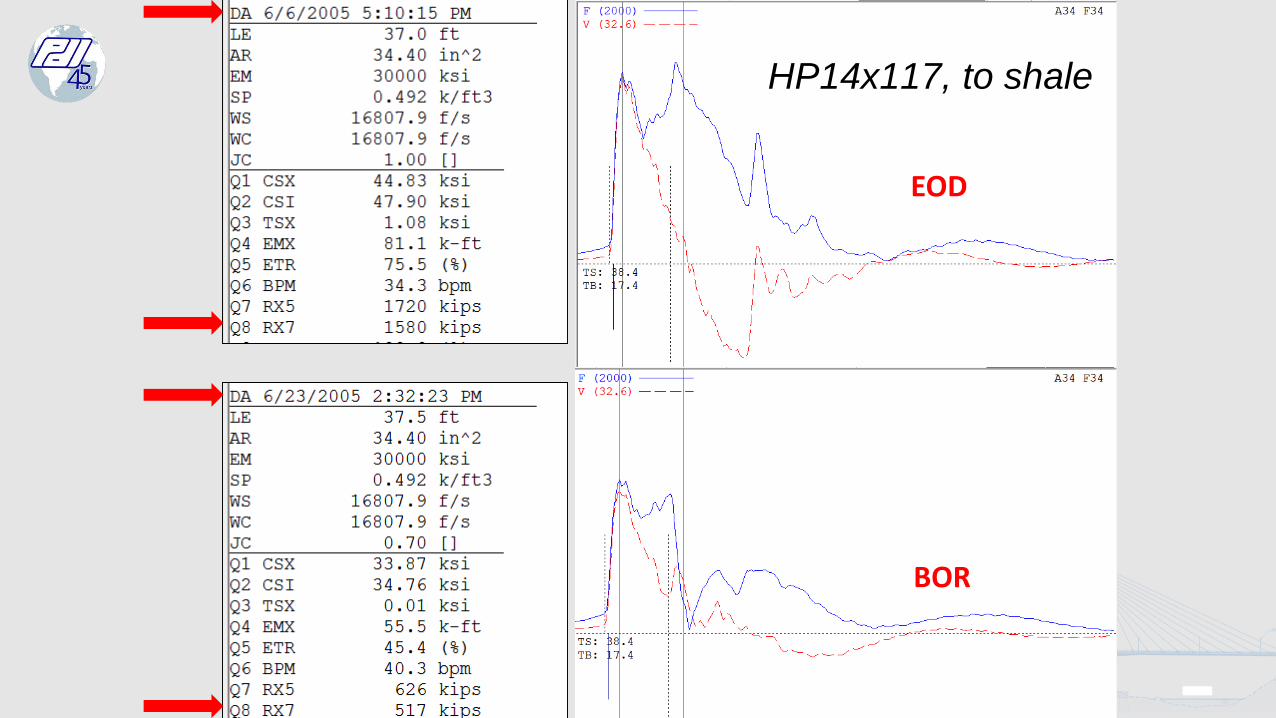
HP14x117, to shale
EOD
BOR
Does CAPWAP have aUnique Solution?
Basic
CAPWAP®
Model
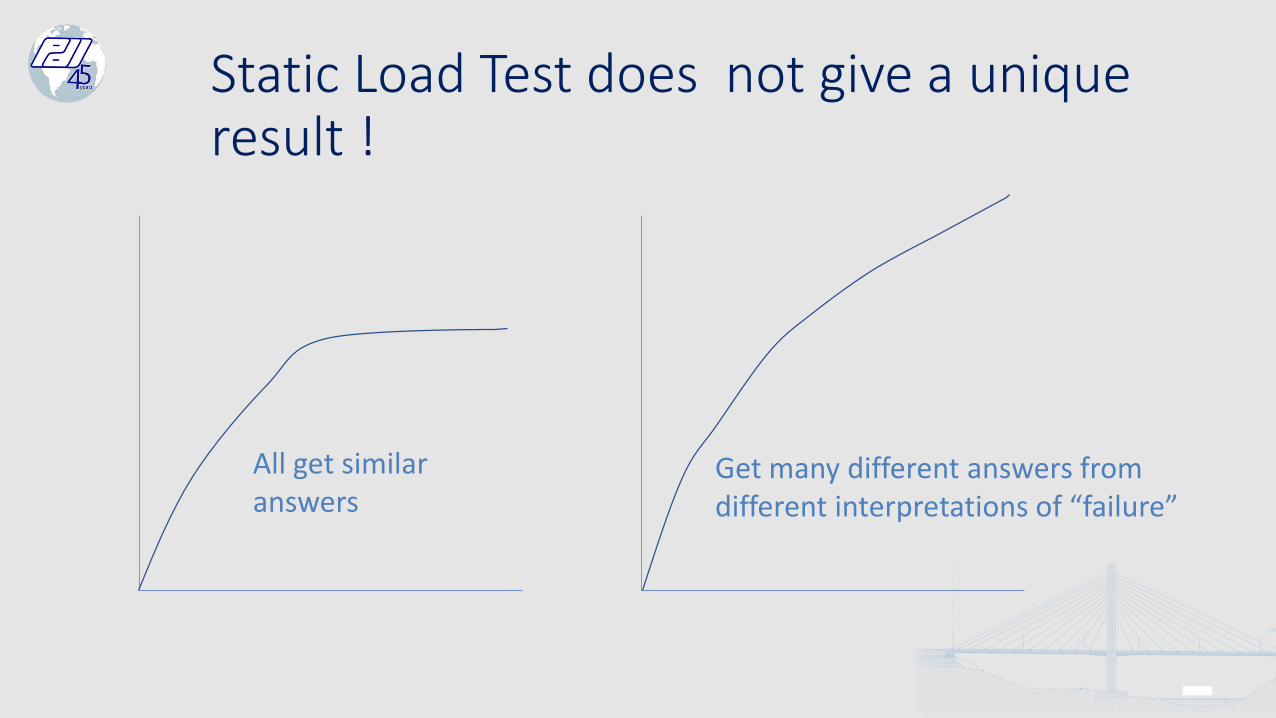
All get similar answers
Get many different answers from different interpretations of “failure”
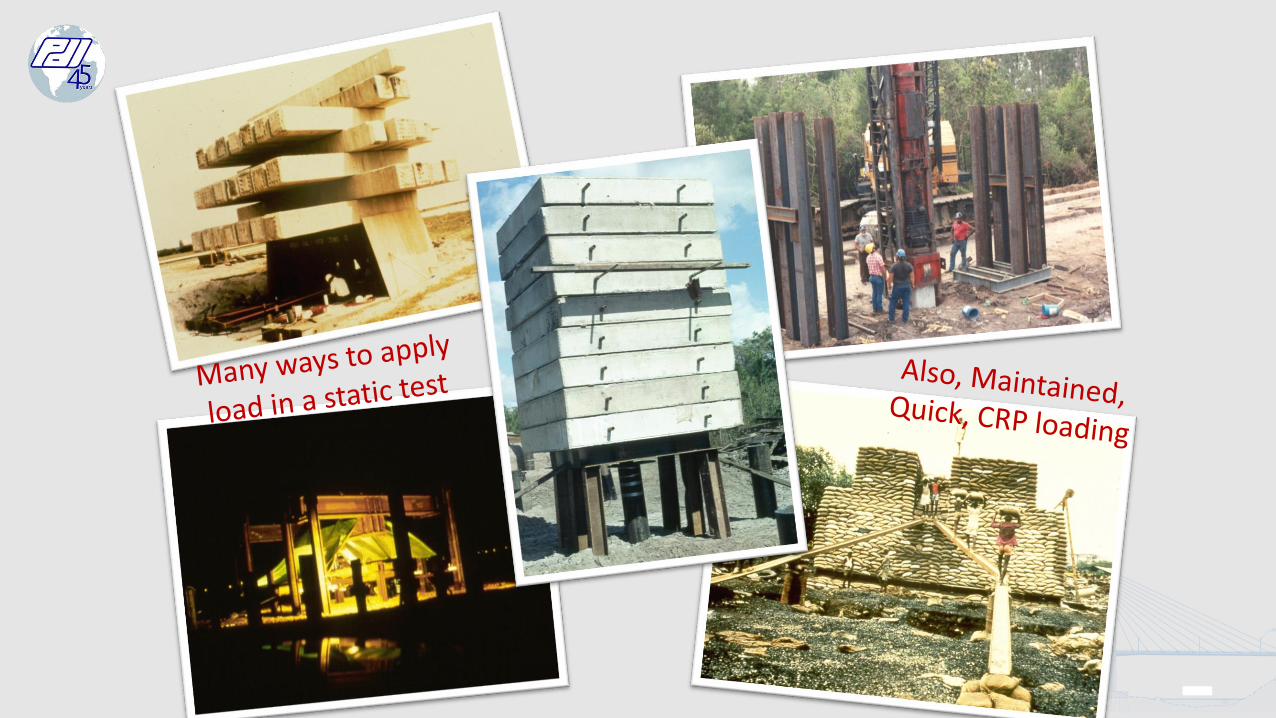
Static Load Test does not give a unique result !
0
50
100
150
200
250
0.0 0.5 1.0 1.5 2.0
Load
(to
ns)
Movement (inch)
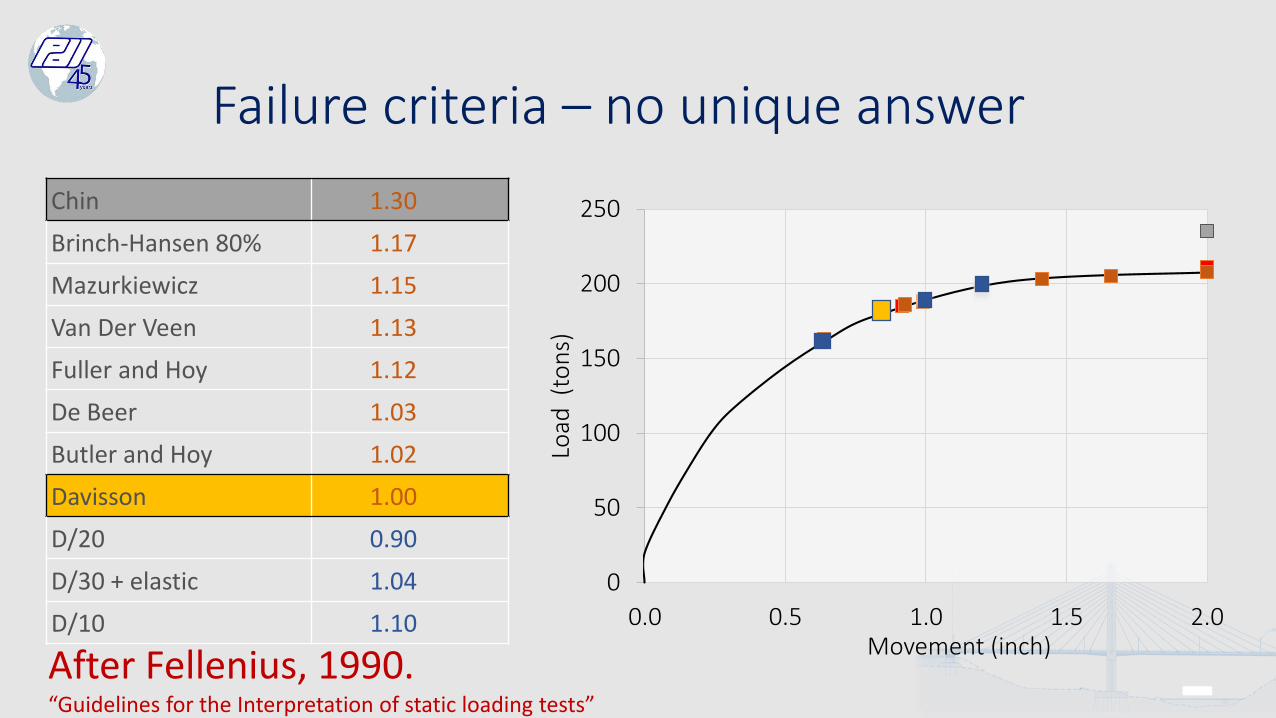
Chin 1.30
Brinch-Hansen 80% 1.17
Mazurkiewicz 1.15
Van Der Veen 1.13
Fuller and Hoy 1.12
De Beer 1.03
Butler and Hoy 1.02
Davisson 1.00
D/20 0.90
D/30 + elastic 1.04
D/10 1.10
After Fellenius, 1990.“Guidelines for the Interpretation of static loading tests”
Failure criteria – no unique answer
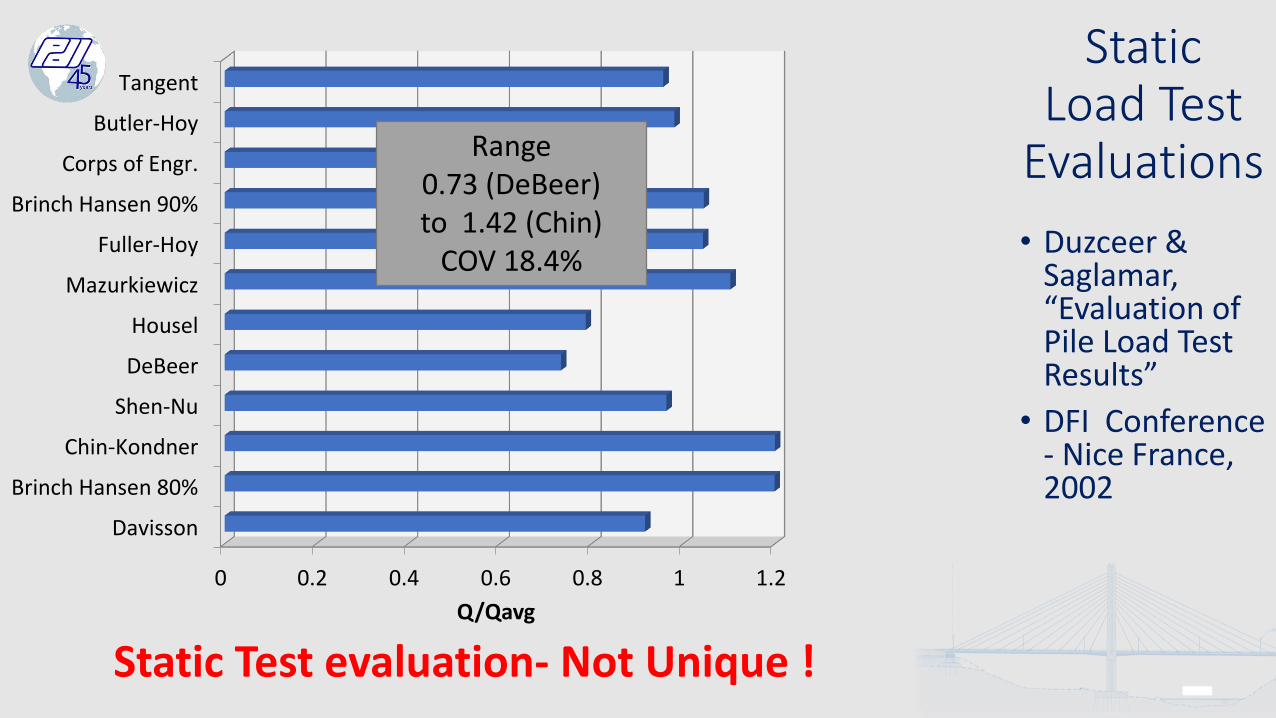
Static Test evaluation- Not Unique !
• Duzceer & Saglamar, “Evaluation of Pile Load Test Results”
• DFI Conference - Nice France, 2002
Static Load Test
Evaluations
0 0.2 0.4 0.6 0.8 1 1.2
Davisson
Brinch Hansen 80%
Chin-Kondner
Shen-Nu
DeBeer
Housel
Mazurkiewicz
Fuller-Hoy
Brinch Hansen 90%
Corps of Engr.
Butler-Hoy
Tangent
Q/Qavg
Range 0.73 (DeBeer) to 1.42 (Chin)
COV 18.4%
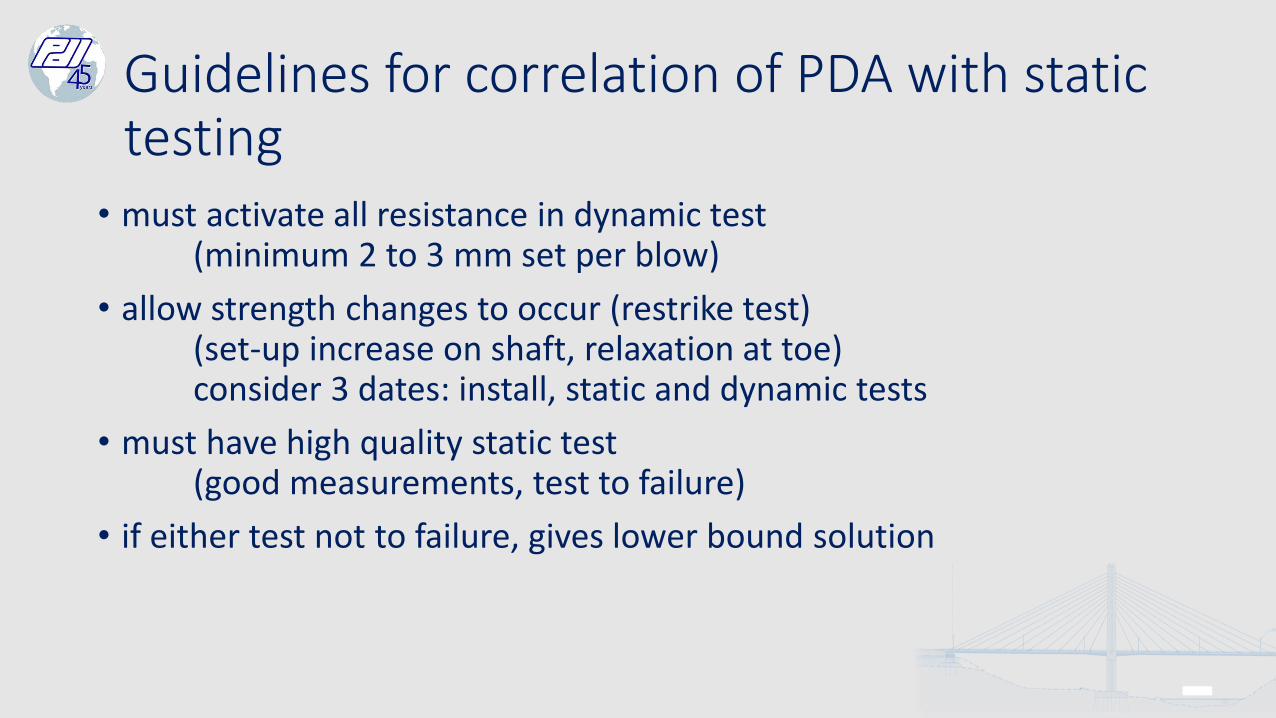
Guidelines for correlation of PDA with static testing
• must activate all resistance in dynamic test(minimum 2 to 3 mm set per blow)
• allow strength changes to occur (restrike test)(set-up increase on shaft, relaxation at toe)consider 3 dates: install, static and dynamic tests
• must have high quality static test(good measurements, test to failure)
• if either test not to failure, gives lower bound solution
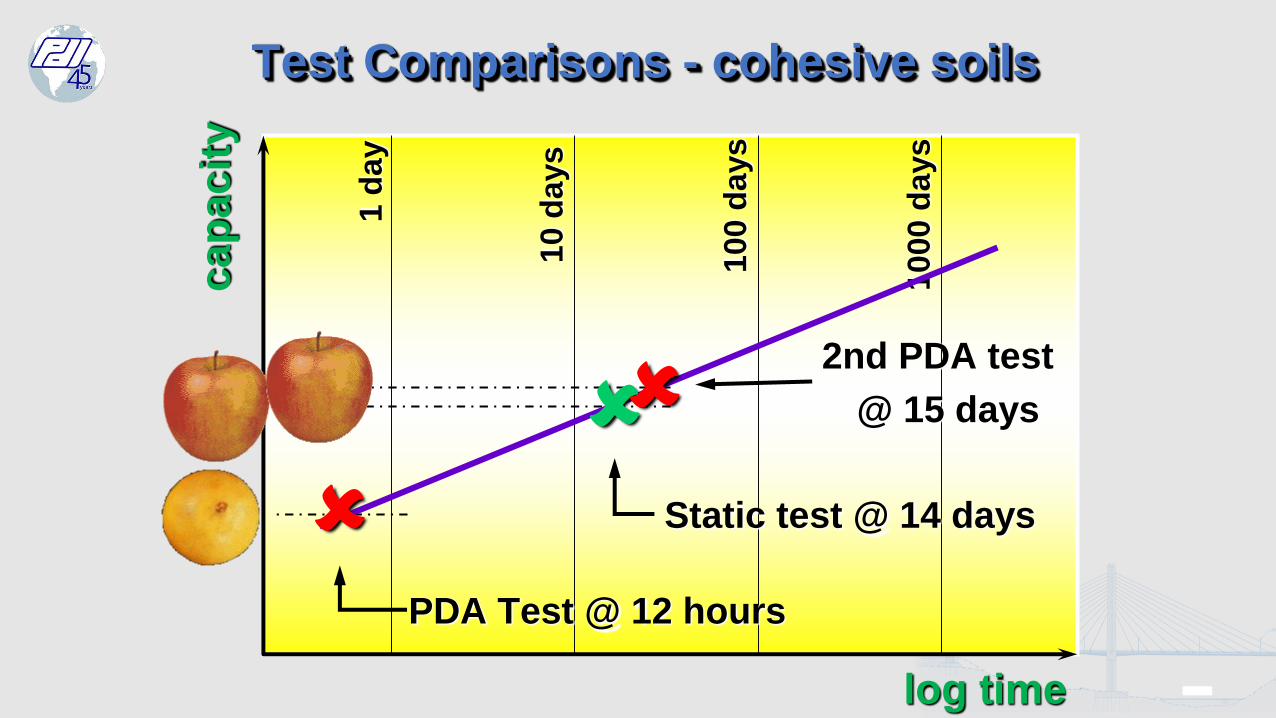
Test Comparisons - cohesive soils
cap
acit
y
1 d
ay
10 d
ays
100 d
ays
1000 d
ays
log time
PDA Test @ 12 hours
Static test @ 14 days
2nd PDA test
@ 15 days
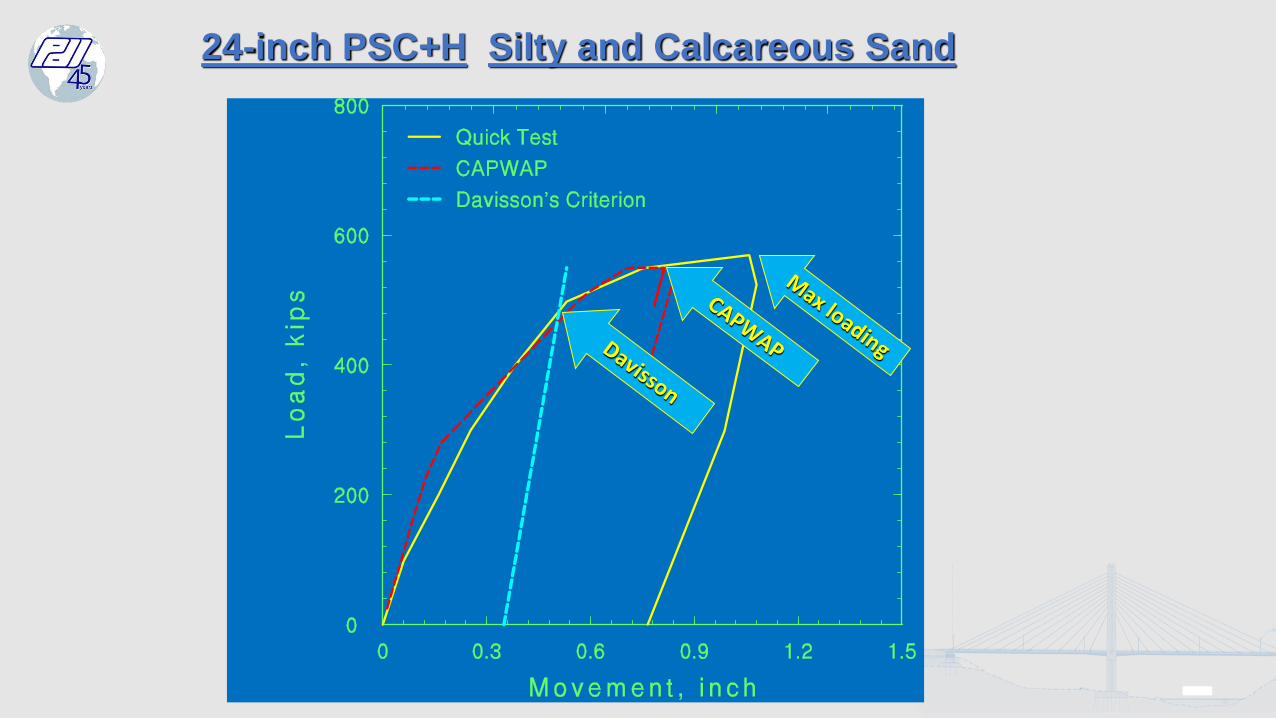
24-inch PSC+H Silty and Calcareous Sand
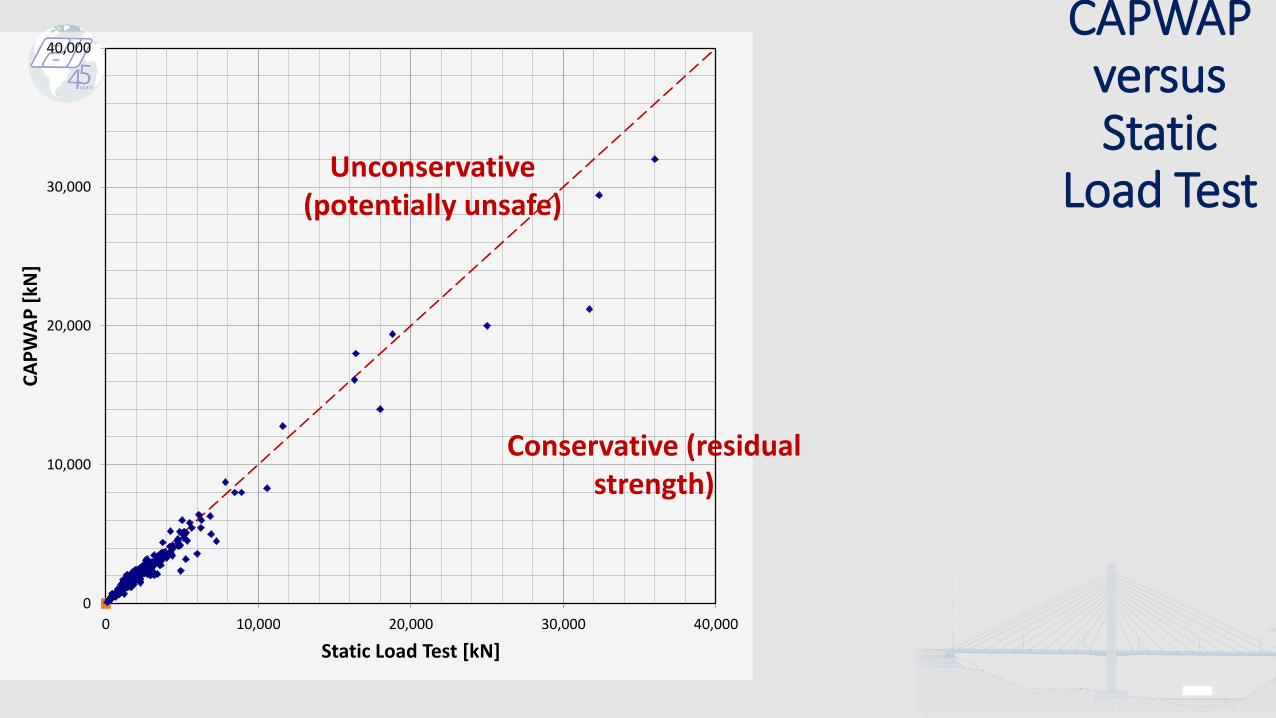
CAPWAP versus Static
Load Test
0
10,000
20,000
30,000
40,000
0 10,000 20,000 30,000 40,000
CA
PW
AP
[kN
]
Static Load Test [kN]
Unconservative(potentially unsafe)
Conservative (residual strength)
0
500
1000
1500
2000
2500
3000
1 2 3 4 5 6 7 8 9 10 11 12 13 14 15 16 17 18
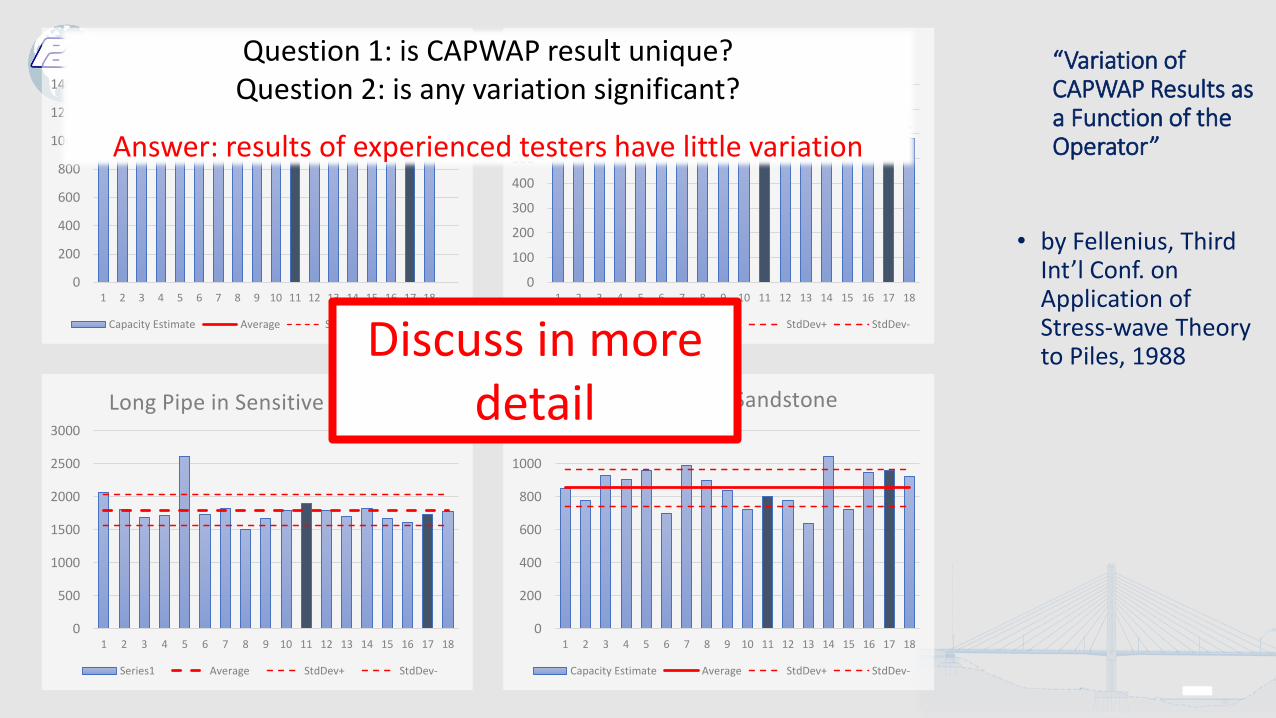
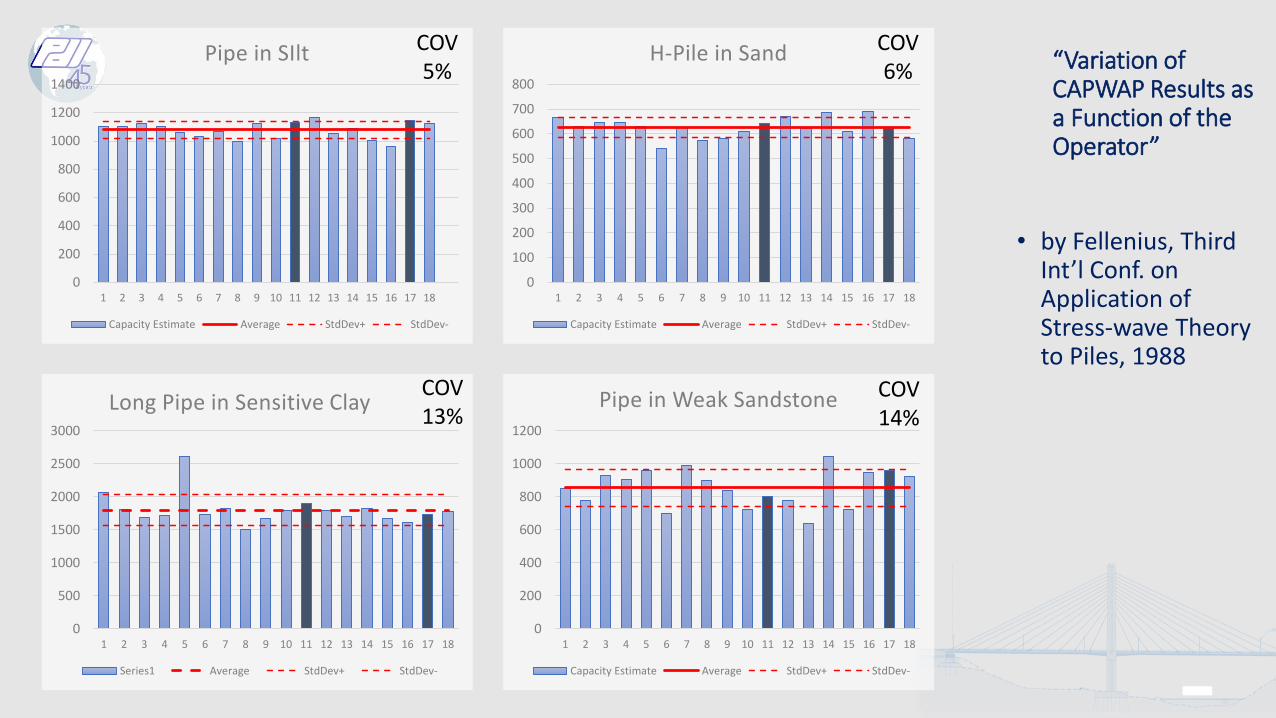
Long Pipe in Sensitive Clay
Series1 Average StdDev+ StdDev-
“Variation of CAPWAP Results as a Function of the Operator”
• by Fellenius, Third Int’l Conf. on Application of Stress-wave Theory to Piles, 1988
0
200
400
600
800
1000
1200
1400
1 2 3 4 5 6 7 8 9 10 11 12 13 14 15 16 17 18
Pipe in SIlt
Capacity Estimate Average StdDev+ StdDev-
0
100
200
300
400
500
600
700
800
1 2 3 4 5 6 7 8 9 10 11 12 13 14 15 16 17 18
H-Pile in Sand
Capacity Estimate Average StdDev+ StdDev-
0
200
400
600
800
1000
1200
1 2 3 4 5 6 7 8 9 10 11 12 13 14 15 16 17 18
Pipe in Weak Sandstone
Capacity Estimate Average StdDev+ StdDev-
Discuss in more detail
Question 1: is CAPWAP result unique?Question 2: is any variation significant?
Answer: results of experienced testers have little variation
0
500
1000
1500
2000
2500
3000
1 2 3 4 5 6 7 8 9 10 11 12 13 14 15 16 17 18
Long Pipe in Sensitive Clay
Series1 Average StdDev+ StdDev-
COV13%
0
200
400
600
800
1000
1200
1400
1 2 3 4 5 6 7 8 9 10 11 12 13 14 15 16 17 18
Pipe in SIlt
Capacity Estimate Average StdDev+ StdDev-
0
100
200
300
400
500
600
700
800
1 2 3 4 5 6 7 8 9 10 11 12 13 14 15 16 17 18
H-Pile in Sand
Capacity Estimate Average StdDev+ StdDev-
0
200
400
600
800
1000
1200
1 2 3 4 5 6 7 8 9 10 11 12 13 14 15 16 17 18
Pipe in Weak Sandstone
Capacity Estimate Average StdDev+ StdDev-
COV14%
COV6%
COV5% “Variation of
CAPWAP Results as a Function of the Operator”
• by Fellenius, Third Int’l Conf. on Application of Stress-wave Theory to Piles, 1988
0
500
1000
1500
2000
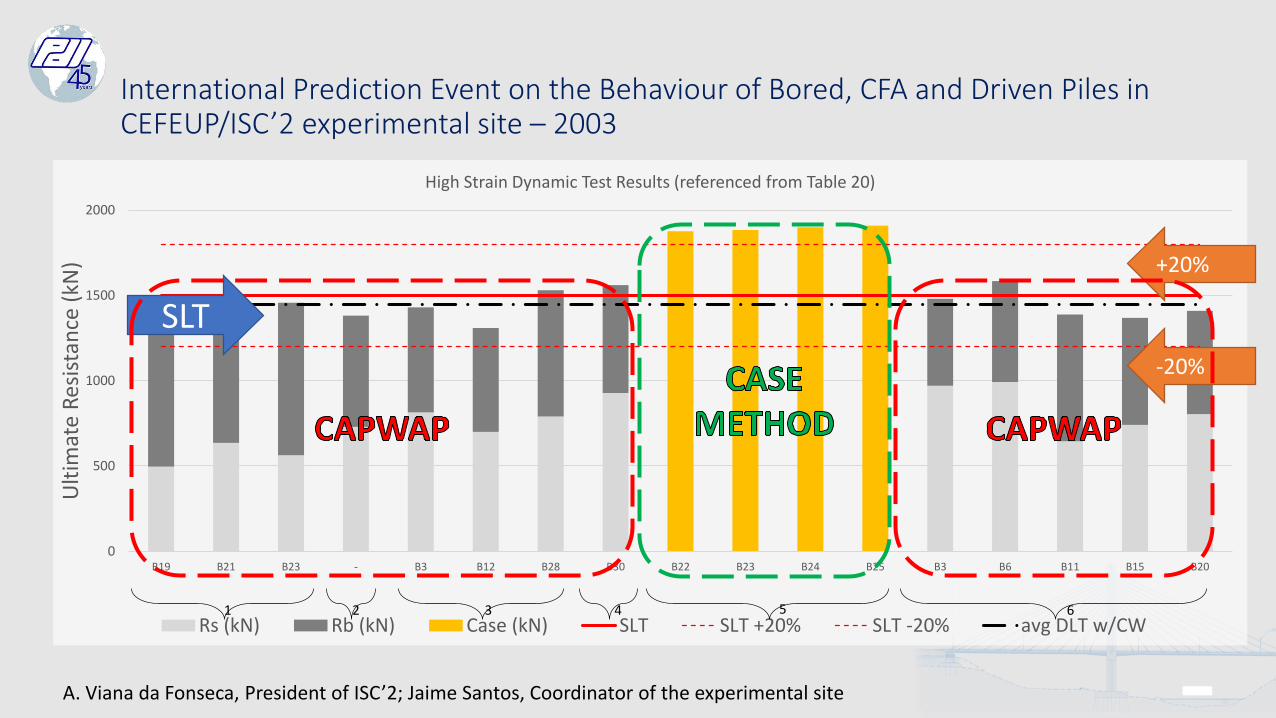
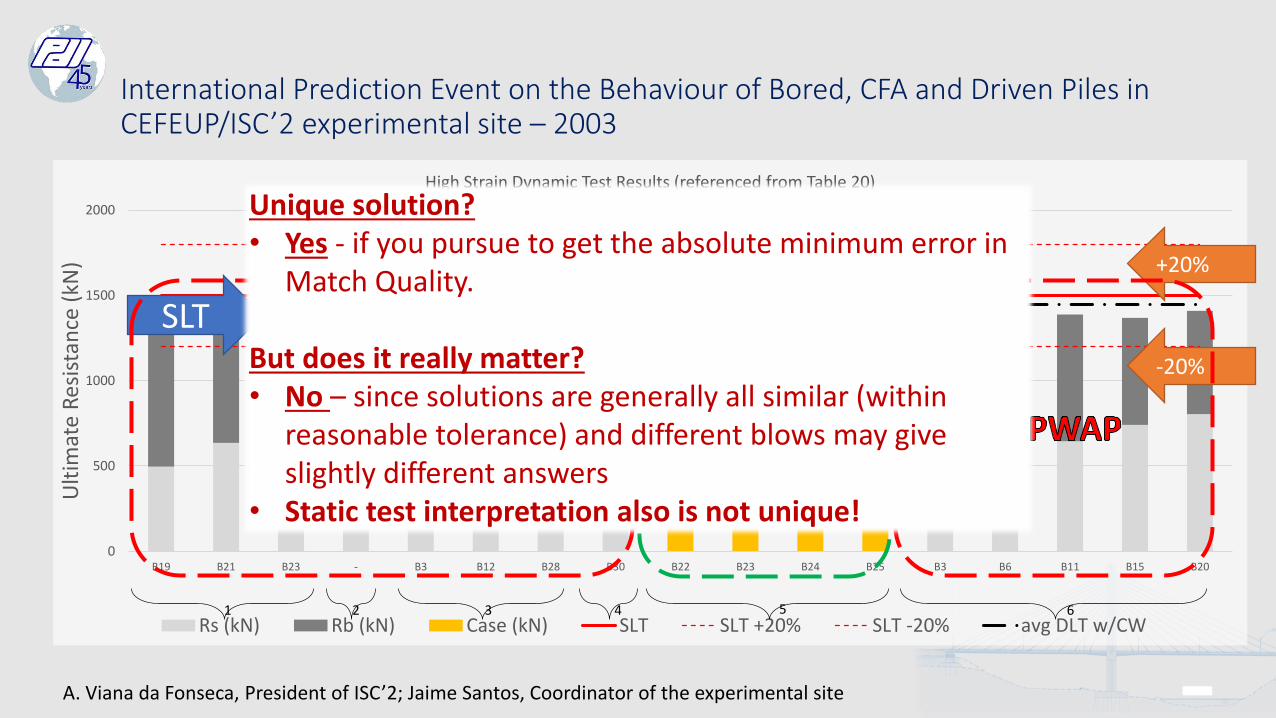
B19 B21 B23 - B3 B12 B28 B30 B22 B23 B24 B25 B3 B6 B11 B15 B20
Ult
imat
e R
esis
tan
ce (
kN)
High Strain Dynamic Test Results (referenced from Table 20)
Rs (kN) Rb (kN) Case (kN) SLT SLT +20% SLT -20% avg DLT w/CW1 5432 6
International Prediction Event on the Behaviour of Bored, CFA and Driven Piles in CEFEUP/ISC’2 experimental site – 2003
SLT
+20%
-20%
A. Viana da Fonseca, President of ISC’2; Jaime Santos, Coordinator of the experimental site
0
500
1000
1500
2000
B19 B21 B23 - B3 B12 B28 B30 B22 B23 B24 B25 B3 B6 B11 B15 B20
Ult
imat
e R
esis
tan
ce (
kN)
High Strain Dynamic Test Results (referenced from Table 20)
Rs (kN) Rb (kN) Case (kN) SLT SLT +20% SLT -20% avg DLT w/CW1 5432 6
International Prediction Event on the Behaviour of Bored, CFA and Driven Piles in CEFEUP/ISC’2 experimental site – 2003
SLT
+20%
-20%
A. Viana da Fonseca, President of ISC’2; Jaime Santos, Coordinator of the experimental site
Unique solution?• Yes - if you pursue to get the absolute minimum error in
Match Quality.
But does it really matter?• No – since solutions are generally all similar (within
reasonable tolerance) and different blows may give slightly different answers
• Static test interpretation also is not unique!
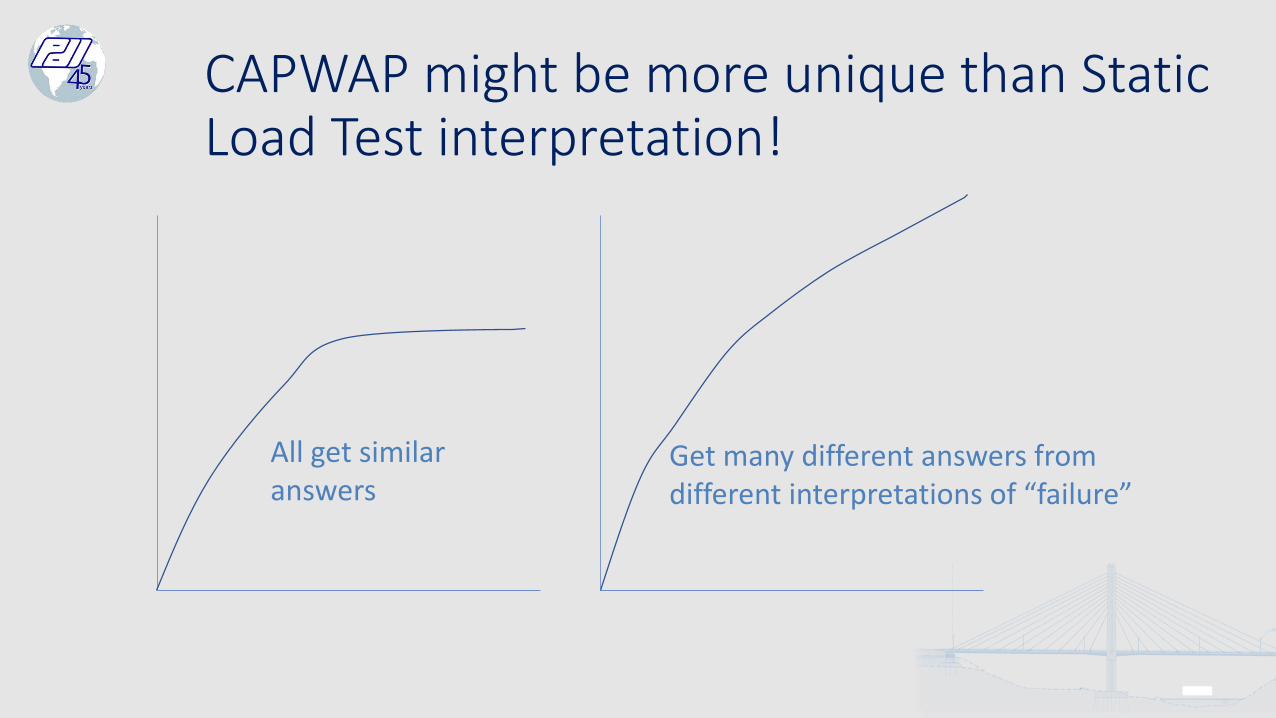
All get similar answers
Get many different answers from different interpretations of “failure”
CAPWAP might be more unique than Static Load Test interpretation!
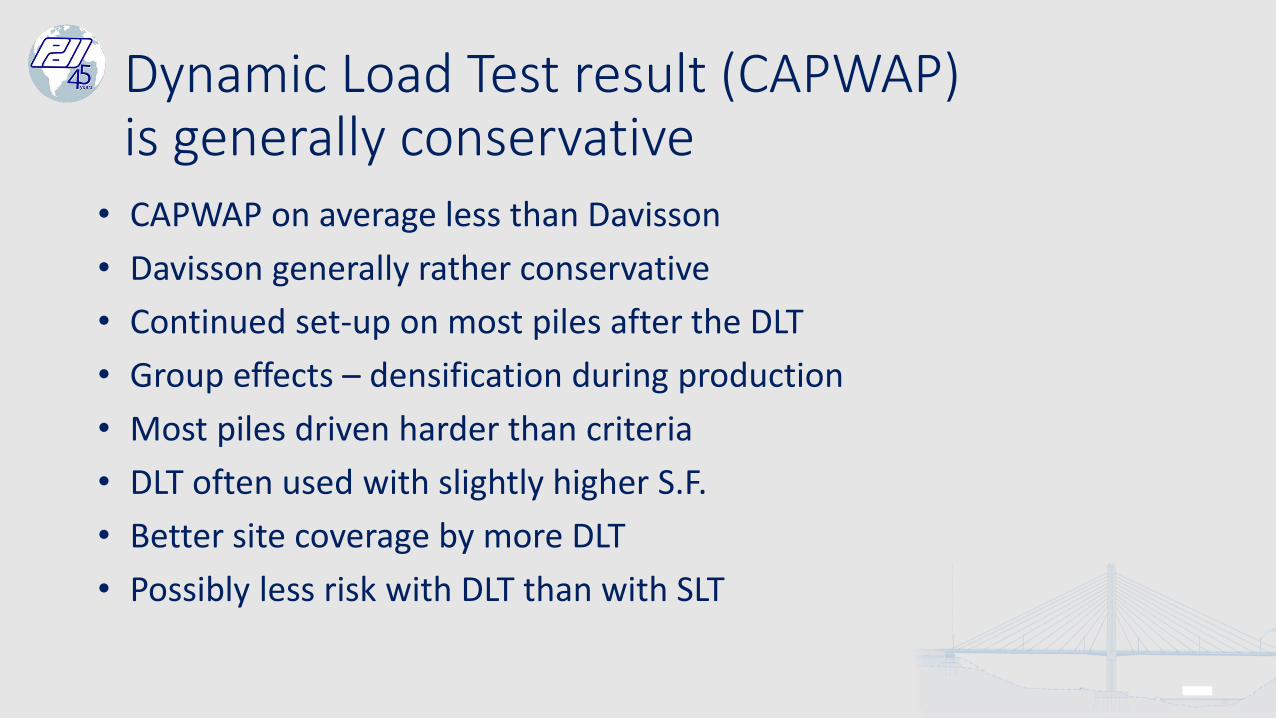
Dynamic Load Test result (CAPWAP) is generally conservative
• CAPWAP on average less than Davisson
• Davisson generally rather conservative
• Continued set-up on most piles after the DLT
• Group effects – densification during production
• Most piles driven harder than criteria
• DLT often used with slightly higher S.F.
• Better site coverage by more DLT
• Possibly less risk with DLT than with SLT
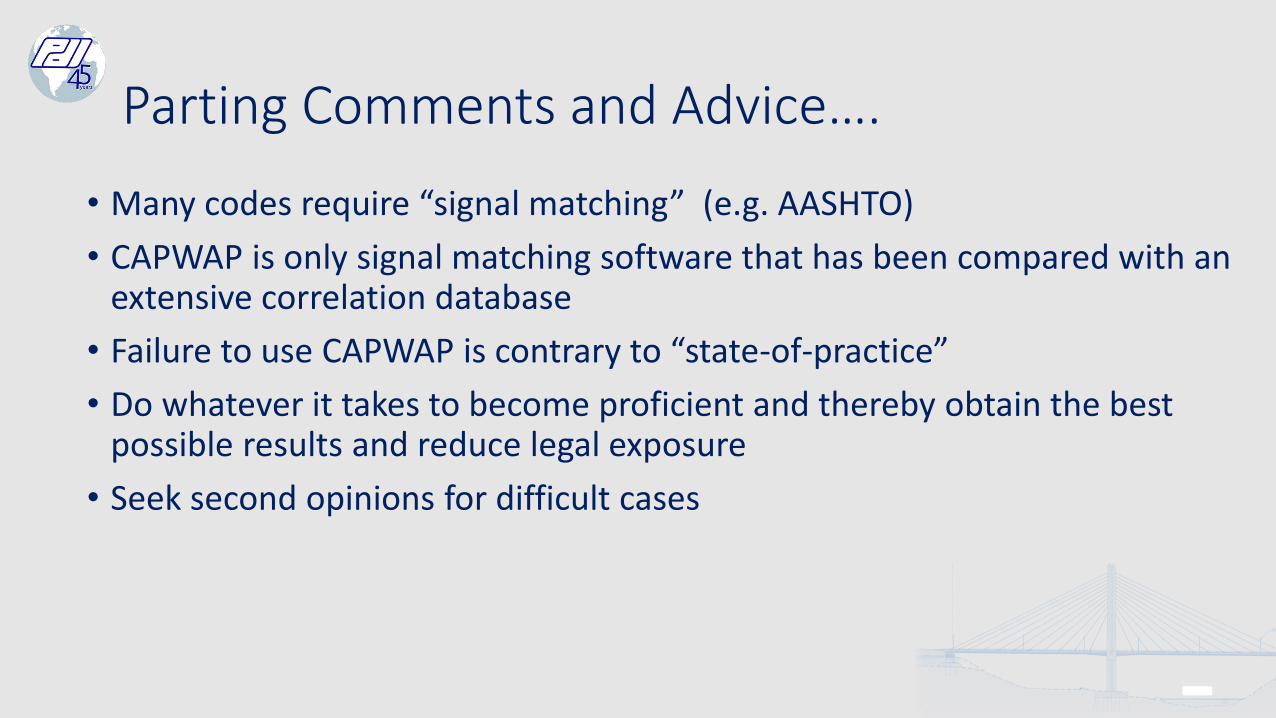
Parting Comments and Advice….
• Many codes require “signal matching” (e.g. AASHTO)
• CAPWAP is only signal matching software that has been compared with an extensive correlation database
• Failure to use CAPWAP is contrary to “state-of-practice”
• Do whatever it takes to become proficient and thereby obtain the best possible results and reduce legal exposure
• Seek second opinions for difficult cases