Embed Size (px)
Citation preview
L O W - I N C O M E W O R K I N G F A M I L I E S
RE S E AR C H RE P O R T
Why Does Cash Welfare
Depend on Where You Live? How and Why State TANF Programs Vary
Heather Hahn Laudan Aron Cary Lou Eleanor Pratt
Adaeze Okoli
June 2017
AB O U T T H E U R BA N I N S T I T U TE
The nonprofit Urban Institute is dedicated to elevating the debate on social and economic policy. For nearly five
decades, Urban scholars have conducted research and offered evidence-based solutions that improve lives and
strengthen communities across a rapidly urbanizing world. Their objective research helps expand opportunities for
all, reduce hardship among the most vulnerable, and strengthen the effectiveness of the public sector.
Copyright © June 2017. Urban Institute. Permission is granted for reproduction of this file, with attribution to the
Urban Institute. Cover image by Tim Meko.
Contents Acknowledgments iv
Why Does Cash Welfare Depend on Where You Live? 1
A Brief Overview of TANF 2
State TANF Policies 9
Generosity: What a Family Gets, Has, or Can Keep 10
Restrictiveness: What a Family Must or Must Not Do 11
Duration: How Long a Family Can Receive Cash Assistance 12
How State TANF Policy Choices Relate to One Another 14
Racial Implications 18
Explaining State Policy Choices 18
Prior Research 18
State Characteristics 19
State Characteristics Explaining TANF Policy Choices 23
Results 30
Conclusion 33
Appendix A. Data and Methods 34
Appendix B. Correlation and Regression Tables 37
Notes 40
References 43
About the Authors 46
Statement of Independence 47
I V A C K N O W L E D G M E N T S
Acknowledgments This report was funded by the Annie E. Casey Foundation through the Urban Institute’s Low-Income
Working Families initiative, a multiyear effort that focuses on the private- and public-sector contexts
for families’ well-being. We are grateful to them and to all our funders, who make it possible for Urban
to advance its mission.
The views expressed are those of the authors and should not be attributed to the Urban Institute,
its trustees, or its funders. Funders do not determine research findings or the insights and
recommendations of Urban experts. Further information on the Urban Institute’s funding principles is
available at www.urban.org/support.
The authors also thank Burt Barnow, Sara Edelstein, Linda Giannarelli, Pamela Loprest, Margaret
Simms, and Doug Wissoker for their contributions.

Why Does Cash Welfare
Depend on Where You Live? The term “welfare” usually brings to mind government assistance of some kind—often cash—for people
living in poverty. The primary government program associated with cash welfare is Temporary
Assistance for Needy Families (TANF), which provides cash assistance to low-income families with
children (childless adults are not eligible). TANF gives states broad flexibility to determine the mission,
design, and benefits of their own programs. As a result, the cash support available to families and the
conditions under which they can receive it largely depend on where they live. This report explores the
variation in state TANF policies and factors that might explain these variations. Given the large and
growing levels of income and wealth inequality in the United States and a relatively weak social safety
net in general, understanding why benefits vary so greatly by state is of critical importance to families
experiencing poverty nationwide. Our results show that race is part of the answer.
States are under no legal obligation to provide cash assistance to families living in poverty. All states
(and Washington, DC) participate in TANF, and each sets its own rules (within broad federal guidelines)
for who receives TANF benefits, how much they receive, under what conditions, and for how long.
These rules reflect some combination of the state’s willingness and ability to help people living in
poverty. The result is great variation in TANF benefits. In a dozen states, for every 100 families with
children in poverty, fewer than 10 receive TANF cash assistance, compared with more than 60 in two
other states.1 In 2014, only 23 families received assistance for every 100 such families nationwide
(CBPP 2016b).2 In an average month in 2016, about 1 percent of the total population received TANF
cash assistance.3
This report begins with a brief overview of the TANF program and its history, goals, and mission.
We next describe key dimensions of state TANF policies and summarize where states fall along these
dimensions. We loosely group policies into three broad categories:
1. Generosity: What a family gets, has, or can keep (e.g., maximum monthly benefits, maximum
monthly income for initial eligibility, and asset limits).
2. Restrictiveness: What a family must or must not do to receive or maintain benefits (e.g., work
requirements and exemptions, allowances for postsecondary education, and sanctions).
3. Duration: How long a family can receive assistance (e.g., time limits for spells of assistance and
transitional cash benefits).4
2 W H Y D O E S C A S H W E L F A R E D E P E N D O N W H E R E Y O U L I V E ?
This profile reveals the breadth and complexity of state TANF programs and examines how states
balance these characteristics. Are states with relatively more generous TANF benefits also less
restrictive in terms of requirements and benefit duration? Or are states with more generous benefits
counterbalancing that generosity by being more restrictive in their requirements and benefit duration?
We also observe the effects of state differences on selected racial groups.
We next examine factors behind the variation in state policies. Building on literature from the early
years of TANF, which found that the relative size of a state’s African American population was a
significant factor in its policy choices, we present an updated picture of how TANF programs vary
according to several state characteristics, including demographics, economics, and politics. This report
provides only a preliminary analysis of what drives variation in state TANF programs. However, our
analyses suggest some answers, and we conclude with our overarching observations and suggestions
for further research.
A Brief Overview of TANF
To understand TANF, consider the history of welfare programs in the United States. Federal
antipoverty efforts began in earnest during the Great Depression with the New Deal, a combination of
federal social insurance programs intended to alleviate the risks of income loss and means-tested
programs that assisted selected disadvantaged groups. The primary cash welfare program, Aid to
Dependent Children, was available to children of single mothers who could demonstrate they were
“moral” and “deserving” of assistance. But not all states participated, and women of color were excluded
in some areas (Cammisa 1998; Skocpol 1995).
By the early 1960s, policymakers and the public began to recognize that tens of millions of
Americans remained poor despite this benefit structure. At the same time, new causes of poverty, such
as the prevalence of single-parent families, racial discrimination, geographically concentrated poverty,
high youth unemployment, and low levels of education and earning power, emerged or became more
evident. Concerns also arose regarding the potential disincentives welfare programs created for work
and marriage, the incentives they created for having additional children, how they intruded into
people’s lives, and the inadequacy of benefits relative to need. In 1961, Aid to Dependent Children
became Aid to Families with Dependent Children (AFDC) and began letting states extend aid to two-
parent families with one unemployed or incapacitated parent and adopted new, relatively objective
economic eligibility criteria that opened access to more people of color.
W H Y D O E S C A S H W E L F A R E D E P E N D O N W H E R E Y O U L I V E ? 3
Over time, means-tested programs grew increasingly complex. Cash welfare benefits were further
supplemented by in-kind benefits for nutrition, health care, housing, energy, child care, and job training.
But public backlash against government-sponsored benefits led to a growing focus on reducing possible
malfeasance and increasing personal responsibility among those receiving assistance. Welfare recipients
initially were penalized for earning wages, but as more women entered the labor force during the 1970s,
public resentment grew over the misperception that welfare recipients did not want to be employed.
AFDC added work requirements in the 1980s and early 1990s. In 1996, TANF replaced AFDC and
instituted mandatory work requirements and, for the first time, imposed time limits on receipt of cash
assistance. An emphasis on work as a condition for receiving public benefits continues to this day.
TANF also returned power to the states to shape their own programs. Under AFDC, the federal
government matched state welfare spending (based on a match formula inversely related to per capita
income) and guaranteed benefit receipt to all eligible applicants. States could adjust certain rules,
including income limits for eligibility and benefit levels, but other aspects of eligibility were determined
by the federal government.
TANF is a federal block grant that gives states a fixed amount of funding that has not changed,
even to account for inflation, since 1997. Each state’s TANF grant was established based on its
historical spending on welfare-related activities under AFDC, so states that spent more under AFDC
continue to receive larger TANF grants. To receive federal TANF funds, states must continue spending a
minimum amount of state funds based on their historical spending—known as the maintenance-of-
effort requirement.5 States may use federal block grant and state maintenance-of-effort funds for any
of the program’s four broad purposes:
1. Provide assistance to needy families so that children can be cared for in their own homes or in
the homes of relatives.
2. End the dependency of needy parents on government benefits by promoting job preparation,
work, and marriage.
3. Prevent and reduce the incidence of out-of-wedlock pregnancies.
4. Encourage the formation and maintenance of two-parent families.6
Reducing poverty is not one of the purposes of TANF.
Although TANF is best known for providing cash assistance to low-income families—the focus of
this report—states are under no legal obligation to provide cash assistance, and most TANF dollars now
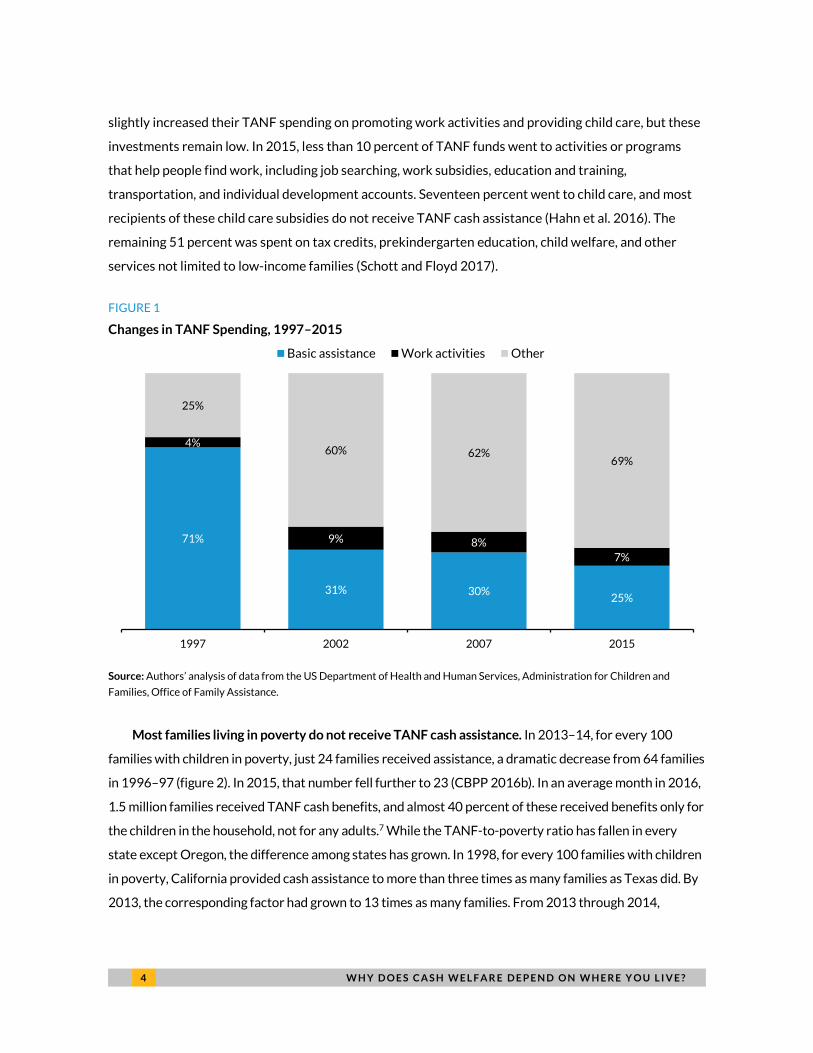
go toward other purposes. In 2015, only 25 percent of TANF funds nationwide went toward basic cash
payments, a dramatic reduction from 71 percent of TANF funds in 1997 (figure 1). Over time, states
4 W H Y D O E S C A S H W E L F A R E D E P E N D O N W H E R E Y O U L I V E ?
slightly increased their TANF spending on promoting work activities and providing child care, but these
investments remain low. In 2015, less than 10 percent of TANF funds went to activities or programs
that help people find work, including job searching, work subsidies, education and training,
transportation, and individual development accounts. Seventeen percent went to child care, and most
recipients of these child care subsidies do not receive TANF cash assistance (Hahn et al. 2016). The
remaining 51 percent was spent on tax credits, prekindergarten education, child welfare, and other
services not limited to low-income families (Schott and Floyd 2017).
FIGURE 1
Changes in TANF Spending, 1997–2015
Source: Authors’ analysis of data from the US Department of Health and Human Services, Administration for Children and
Families, Office of Family Assistance.
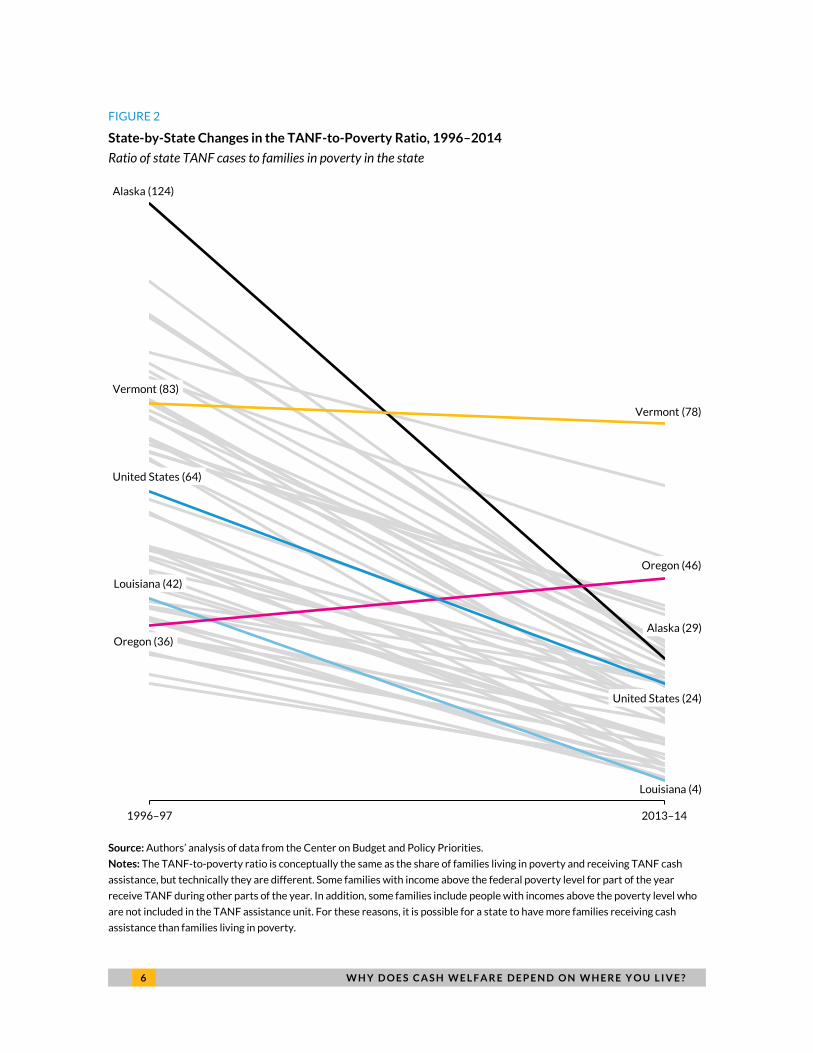
Most families living in poverty do not receive TANF cash assistance. In 2013–14, for every 100
families with children in poverty, just 24 families received assistance, a dramatic decrease from 64 families
in 1996–97 (figure 2). In 2015, that number fell further to 23 (CBPP 2016b). In an average month in 2016,
1.5 million families received TANF cash benefits, and almost 40 percent of these received benefits only for
the children in the household, not for any adults.7 While the TANF-to-poverty ratio has fallen in every
state except Oregon, the difference among states has grown. In 1998, for every 100 families with children
in poverty, California provided cash assistance to more than three times as many families as Texas did. By
2013, the corresponding factor had grown to 13 times as many families. From 2013 through 2014,
71%
31% 30%25%
4%
9% 8%
7%
25%
60% 62%69%
1997 2002 2007 2015
Basic assistance Work activities Other
W H Y D O E S C A S H W E L F A R E D E P E N D O N W H E R E Y O U L I V E ? 5
Louisiana, Texas, and Wyoming provided TANF cash assistance, on average, to fewer than 5 families for
every 100 with children in poverty.8
6 W H Y D O E S C A S H W E L F A R E D E P E N D O N W H E R E Y O U L I V E ?
FIGURE 2
State-by-State Changes in the TANF-to-Poverty Ratio, 1996–2014
Ratio of state TANF cases to families in poverty in the state
Source: Authors’ analysis of data from the Center on Budget and Policy Priorities.
Notes: The TANF-to-poverty ratio is conceptually the same as the share of families living in poverty and receiving TANF cash
assistance, but technically they are different. Some families with income above the federal poverty level for part of the year
receive TANF during other parts of the year. In addition, some families include people with incomes above the poverty level who
are not included in the TANF assistance unit. For these reasons, it is possible for a state to have more families receiving cash
assistance than families living in poverty.
Alaska (124)
Alaska (29)
Louisiana (42)
Louisiana (4)
Vermont (83)
Vermont (78)
Oregon (36)
Oregon (46)
United States (64)
United States (24)
1996–97 2013–14
W H Y D O E S C A S H W E L F A R E D E P E N D O N W H E R E Y O U L I V E ? 7
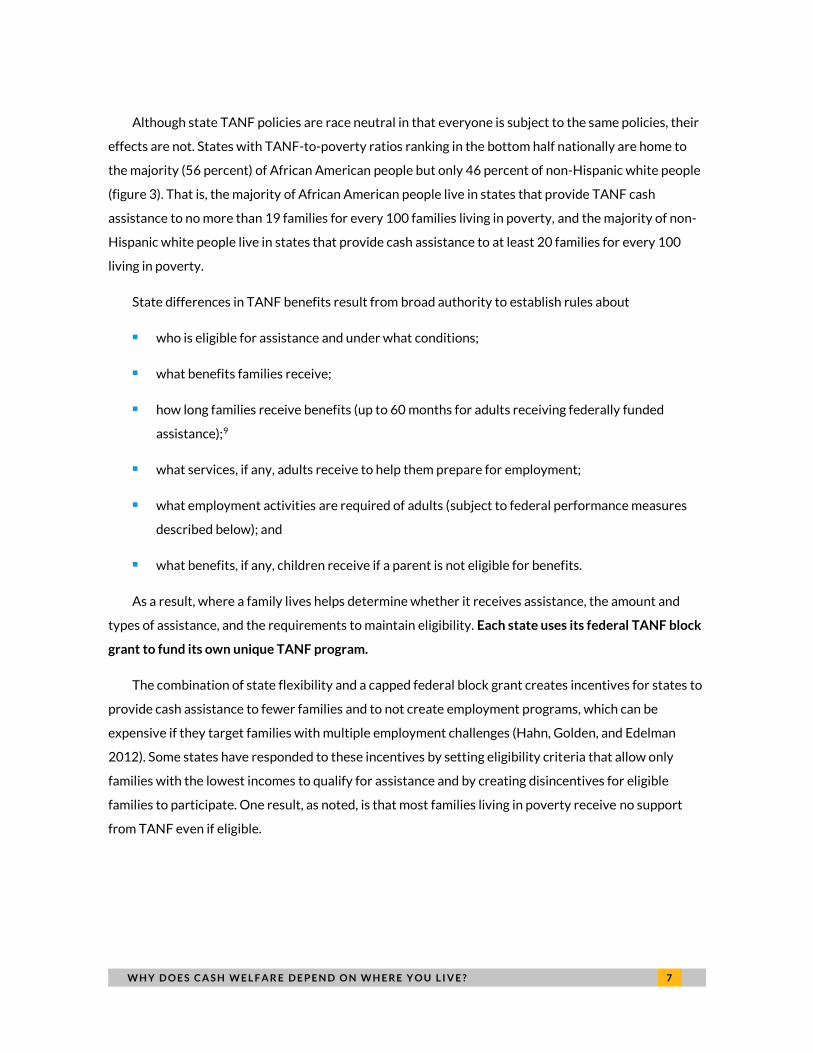
Although state TANF policies are race neutral in that everyone is subject to the same policies, their
effects are not. States with TANF-to-poverty ratios ranking in the bottom half nationally are home to
the majority (56 percent) of African American people but only 46 percent of non-Hispanic white people
(figure 3). That is, the majority of African American people live in states that provide TANF cash
assistance to no more than 19 families for every 100 families living in poverty, and the majority of non-
Hispanic white people live in states that provide cash assistance to at least 20 families for every 100
living in poverty.
State differences in TANF benefits result from broad authority to establish rules about
who is eligible for assistance and under what conditions;
what benefits families receive;
how long families receive benefits (up to 60 months for adults receiving federally funded
assistance);9
what services, if any, adults receive to help them prepare for employment;
what employment activities are required of adults (subject to federal performance measures
described below); and
what benefits, if any, children receive if a parent is not eligible for benefits.
As a result, where a family lives helps determine whether it receives assistance, the amount and
types of assistance, and the requirements to maintain eligibility. Each state uses its federal TANF block
grant to fund its own unique TANF program.
The combination of state flexibility and a capped federal block grant creates incentives for states to
provide cash assistance to fewer families and to not create employment programs, which can be
expensive if they target families with multiple employment challenges (Hahn, Golden, and Edelman
2012). Some states have responded to these incentives by setting eligibility criteria that allow only
families with the lowest incomes to qualify for assistance and by creating disincentives for eligible
families to participate. One result, as noted, is that most families living in poverty receive no support
from TANF even if eligible.
8 W H Y D O E S C A S H W E L F A R E D E P E N D O N W H E R E Y O U L I V E ?
FIGURE 3
State TANF-to-Poverty Ratios, 2014
Source: Center on Budget and Policy Priorities, Chart Book: TANF at 20, (Washington, DC: Center on Budget and Policy Priorities,
2016).
455
67
78888
910
1212131313
161717
1818191919
2022
242425
26262627
28292930
3131
323333
3940
4146
5165
78
Louisiana
Texas
Wyoming
Georgia
Arkansas
Oklahoma
Indiana
North Carolina
Arizona
Idaho
Utah
Mississippi
Florida
Alabama
South Carolina
North Dakota
Kansas
Nevada
Montana
Illinois
Michigan
West Virginia
Nebraska
South Dakota
Kentucky
Colorado
New Mexico
New Jersey
New Hampshire
Tennessee
Virginia
Ohio
Wisconsin
Iowa
Missouri
Maryland
Alaska
Rhode Island
Maine
Pennsylvania
Connecticut
Delaware
Washington
Massachusetts
New York
Minnesota
Oregon
Hawaii
California
Vermont
The 25 states with the lowest TANF-to-poverty ratios are home to the majority of the African American population (56 percent) but less than half of the non-Hispanic white population (46 percent).
W H Y D O E S C A S H W E L F A R E D E P E N D O N W H E R E Y O U L I V E ? 9
The work participation rate creates additional incentives for states to avoid helping hard-to-employ
families. Federal law requires that at least half of all TANF families with a work-eligible member be
involved in a specific set of work or work-related activities for a minimum average of 30 hours per
week each month. States that do not meet this requirement may lose part of their TANF block grant.10
However, states can reduce their required work participation rates by one percentage point for each
percentage point drop in the share of families receiving TANF or by spending more maintenance-of-
effort funds than required. This creates a direct incentive for states to reduce their caseloads
irrespective of the underlying needs of children and families. To meet the required work participation
rate, states often steer TANF clients toward the narrow list of countable work or work-related activities
that bolster their work participation rates but do not necessarily help clients become self-sufficient or
support their families. These countable activities, defined by the federal government, include subsidized
and unsubsidized employment and community service programs. They can also include job search and
job readiness activities (limited to six weeks per year) and vocational education training (with a lifetime
limit of 12 months). States generally do not receive credit if recipients participate in basic skills
education, such as remedial math or reading classes, or longer-term education and training.
States have responded to these federal incentives by providing remarkably different levels of
cash and employment assistance. This variation most likely reflects a range of state-specific economic,
political, and demographic factors detailed in the next section.
State TANF Policies
We categorize TANF policies into three broad areas—generosity, restrictiveness, and duration—and
compare state policy choices in each of these areas. Generosity (what a family gets, has, or can keep)
includes policies about benefit levels, diversion programs that steer families away from cash assistance,
income eligibility levels, and asset limits. Restrictiveness (what a family must or must not do to receive
or maintain benefits) includes health and behavioral requirements, activities exemptions, and sanctions.
Duration (how long a family can receive assistance) includes lifetime limits, spell limits, and whether
children can continue receiving benefits when their parents reach the time limits.11
We focus our analyses on the major TANF policy decisions on which states differ. States make many
additional policy choices, but we exclude these because there was little variation across states or
because they seemed overly detailed for the purposes of this report. Information on the policy choices
reported here, as well as comprehensive information on all state TANF policies, is available through the
1 0 W H Y D O E S C A S H W E L F A R E D E P E N D O N W H E R E Y O U L I V E ?
Welfare Rules Database, sponsored by the Department of Health and Human Services and maintained
by the Urban Institute since 1996.12 The policies described in this section are summarized in tables 1
and 2. (See appendix table A.1 for additional details.)
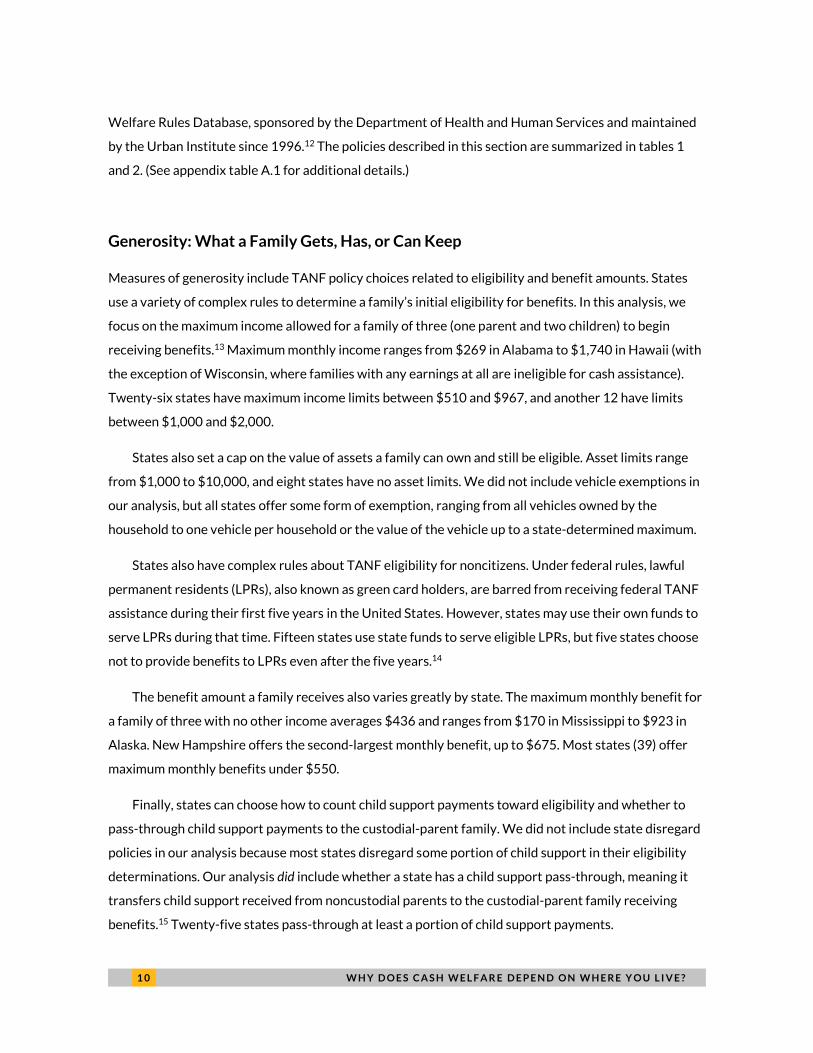
Generosity: What a Family Gets, Has, or Can Keep
Measures of generosity include TANF policy choices related to eligibility and benefit amounts. States
use a variety of complex rules to determine a family’s initial eligibility for benefits. In this analysis, we
focus on the maximum income allowed for a family of three (one parent and two children) to begin
receiving benefits.13 Maximum monthly income ranges from $269 in Alabama to $1,740 in Hawaii (with
the exception of Wisconsin, where families with any earnings at all are ineligible for cash assistance).
Twenty-six states have maximum income limits between $510 and $967, and another 12 have limits
between $1,000 and $2,000.
States also set a cap on the value of assets a family can own and still be eligible. Asset limits range
from $1,000 to $10,000, and eight states have no asset limits. We did not include vehicle exemptions in
our analysis, but all states offer some form of exemption, ranging from all vehicles owned by the
household to one vehicle per household or the value of the vehicle up to a state-determined maximum.
States also have complex rules about TANF eligibility for noncitizens. Under federal rules, lawful
permanent residents (LPRs), also known as green card holders, are barred from receiving federal TANF
assistance during their first five years in the United States. However, states may use their own funds to
serve LPRs during that time. Fifteen states use state funds to serve eligible LPRs, but five states choose
not to provide benefits to LPRs even after the five years.14
The benefit amount a family receives also varies greatly by state. The maximum monthly benefit for
a family of three with no other income averages $436 and ranges from $170 in Mississippi to $923 in
Alaska. New Hampshire offers the second-largest monthly benefit, up to $675. Most states (39) offer
maximum monthly benefits under $550.
Finally, states can choose how to count child support payments toward eligibility and whether to
pass-through child support payments to the custodial-parent family. We did not include state disregard
policies in our analysis because most states disregard some portion of child support in their eligibility
determinations. Our analysis did include whether a state has a child support pass-through, meaning it
transfers child support received from noncustodial parents to the custodial-parent family receiving
benefits.15 Twenty-five states pass-through at least a portion of child support payments.
W H Y D O E S C A S H W E L F A R E D E P E N D O N W H E R E Y O U L I V E ? 1 1
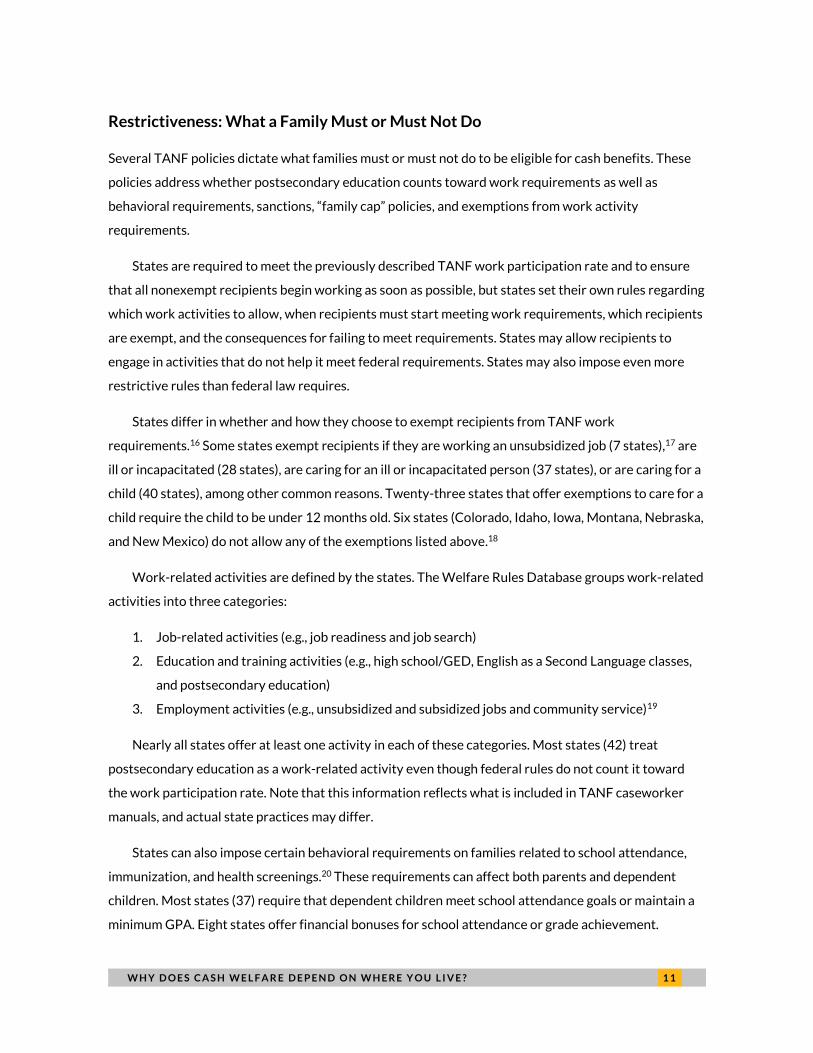
Restrictiveness: What a Family Must or Must Not Do
Several TANF policies dictate what families must or must not do to be eligible for cash benefits. These
policies address whether postsecondary education counts toward work requirements as well as
behavioral requirements, sanctions, “family cap” policies, and exemptions from work activity
requirements.
States are required to meet the previously described TANF work participation rate and to ensure
that all nonexempt recipients begin working as soon as possible, but states set their own rules regarding
which work activities to allow, when recipients must start meeting work requirements, which recipients
are exempt, and the consequences for failing to meet requirements. States may allow recipients to
engage in activities that do not help it meet federal requirements. States may also impose even more
restrictive rules than federal law requires.
States differ in whether and how they choose to exempt recipients from TANF work
requirements.16 Some states exempt recipients if they are working an unsubsidized job (7 states),17 are
ill or incapacitated (28 states), are caring for an ill or incapacitated person (37 states), or are caring for a
child (40 states), among other common reasons. Twenty-three states that offer exemptions to care for a
child require the child to be under 12 months old. Six states (Colorado, Idaho, Iowa, Montana, Nebraska,
and New Mexico) do not allow any of the exemptions listed above.18
Work-related activities are defined by the states. The Welfare Rules Database groups work-related
activities into three categories:
1. Job-related activities (e.g., job readiness and job search)
2. Education and training activities (e.g., high school/GED, English as a Second Language classes,
and postsecondary education)
3. Employment activities (e.g., unsubsidized and subsidized jobs and community service)19
Nearly all states offer at least one activity in each of these categories. Most states (42) treat
postsecondary education as a work-related activity even though federal rules do not count it toward
the work participation rate. Note that this information reflects what is included in TANF caseworker
manuals, and actual state practices may differ.
States can also impose certain behavioral requirements on families related to school attendance,
immunization, and health screenings.20 These requirements can affect both parents and dependent
children. Most states (37) require that dependent children meet school attendance goals or maintain a
minimum GPA. Eight states offer financial bonuses for school attendance or grade achievement.
1 2 W H Y D O E S C A S H W E L F A R E D E P E N D O N W H E R E Y O U L I V E ?
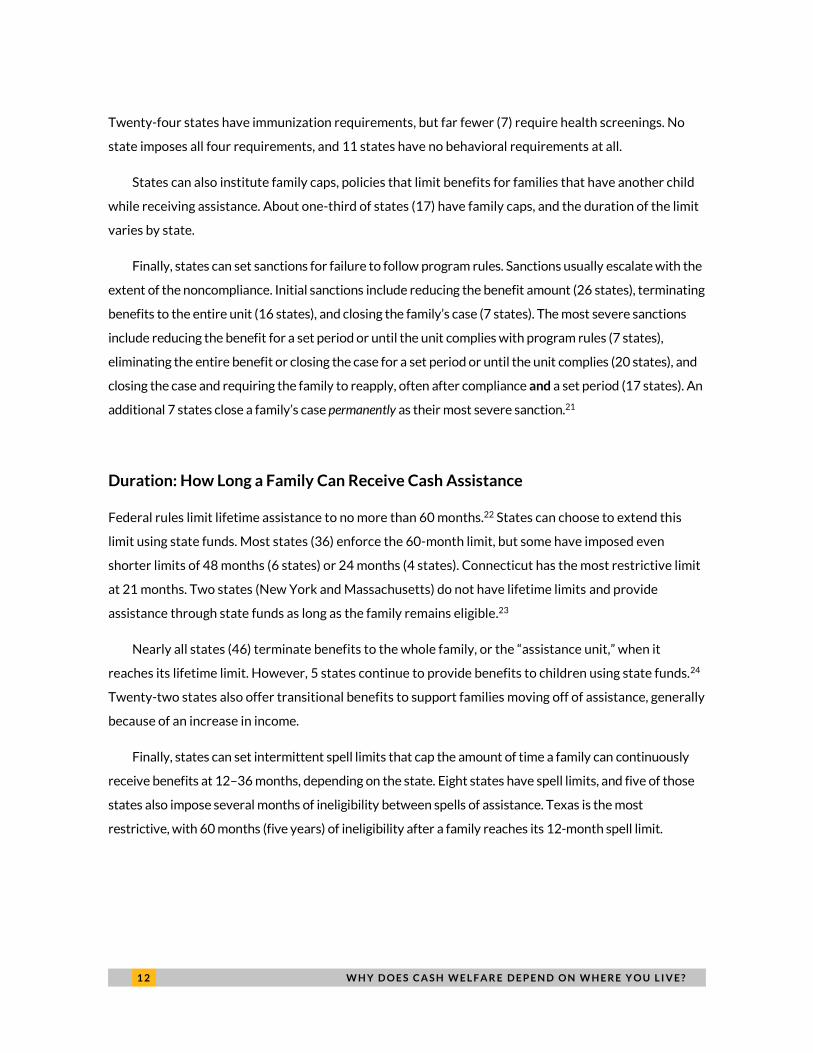
Twenty-four states have immunization requirements, but far fewer (7) require health screenings. No
state imposes all four requirements, and 11 states have no behavioral requirements at all.
States can also institute family caps, policies that limit benefits for families that have another child
while receiving assistance. About one-third of states (17) have family caps, and the duration of the limit
varies by state.
Finally, states can set sanctions for failure to follow program rules. Sanctions usually escalate with the
extent of the noncompliance. Initial sanctions include reducing the benefit amount (26 states), terminating
benefits to the entire unit (16 states), and closing the family’s case (7 states). The most severe sanctions
include reducing the benefit for a set period or until the unit complies with program rules (7 states),
eliminating the entire benefit or closing the case for a set period or until the unit complies (20 states), and
closing the case and requiring the family to reapply, often after compliance and a set period (17 states). An
additional 7 states close a family’s case permanently as their most severe sanction.21
Duration: How Long a Family Can Receive Cash Assistance
Federal rules limit lifetime assistance to no more than 60 months.22 States can choose to extend this
limit using state funds. Most states (36) enforce the 60-month limit, but some have imposed even
shorter limits of 48 months (6 states) or 24 months (4 states). Connecticut has the most restrictive limit
at 21 months. Two states (New York and Massachusetts) do not have lifetime limits and provide
assistance through state funds as long as the family remains eligible.23
Nearly all states (46) terminate benefits to the whole family, or the “assistance unit,” when it
reaches its lifetime limit. However, 5 states continue to provide benefits to children using state funds.24
Twenty-two states also offer transitional benefits to support families moving off of assistance, generally
because of an increase in income.
Finally, states can set intermittent spell limits that cap the amount of time a family can continuously
receive benefits at 12–36 months, depending on the state. Eight states have spell limits, and five of those
states also impose several months of ineligibility between spells of assistance. Texas is the most
restrictive, with 60 months (five years) of ineligibility after a family reaches its 12-month spell limit.
W H Y D O E S C A S H W E L F A R E D E P E N D O N W H E R E Y O U L I V E ? 1 3
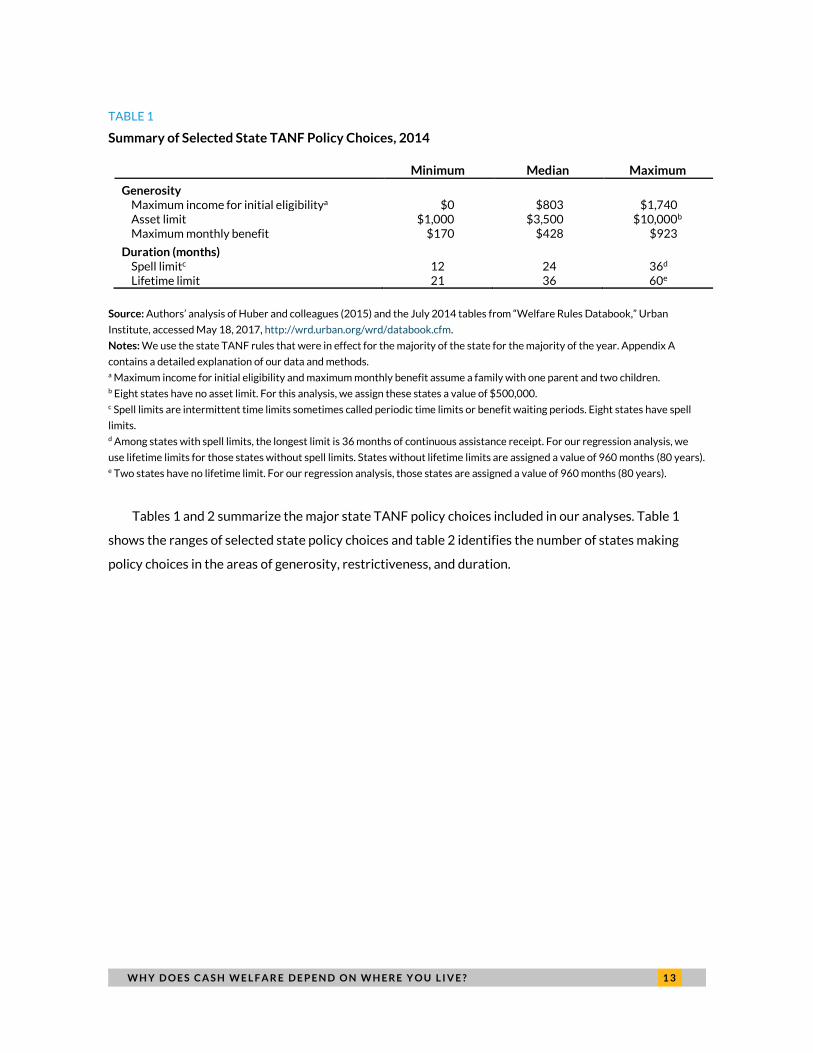
TABLE 1
Summary of Selected State TANF Policy Choices, 2014
Minimum Median Maximum
Generosity Maximum income for initial eligibilitya $0 $803 $1,740 Asset limit $1,000 $3,500 $10,000b
Maximum monthly benefit $170 $428 $923
Duration (months) Spell limitc 12 24 36d
Lifetime limit 21 36 60e
Source: Authors’ analysis of Huber and colleagues (2015) and the July 2014 tables from “Welfare Rules Databook,” Urban
Institute, accessed May 18, 2017, http://wrd.urban.org/wrd/databook.cfm.
Notes: We use the state TANF rules that were in effect for the majority of the state for the majority of the year. Appendix A
contains a detailed explanation of our data and methods. a Maximum income for initial eligibility and maximum monthly benefit assume a family with one parent and two children. b Eight states have no asset limit. For this analysis, we assign these states a value of $500,000. c Spell limits are intermittent time limits sometimes called periodic time limits or benefit waiting periods. Eight states have spell
limits. d Among states with spell limits, the longest limit is 36 months of continuous assistance receipt. For our regression analysis, we
use lifetime limits for those states without spell limits. States without lifetime limits are assigned a value of 960 months (80 years). e Two states have no lifetime limit. For our regression analysis, those states are assigned a value of 960 months (80 years).
Tables 1 and 2 summarize the major state TANF policy choices included in our analyses. Table 1
shows the ranges of selected state policy choices and table 2 identifies the number of states making
policy choices in the areas of generosity, restrictiveness, and duration.
1 4 W H Y D O E S C A S H W E L F A R E D E P E N D O N W H E R E Y O U L I V E ?
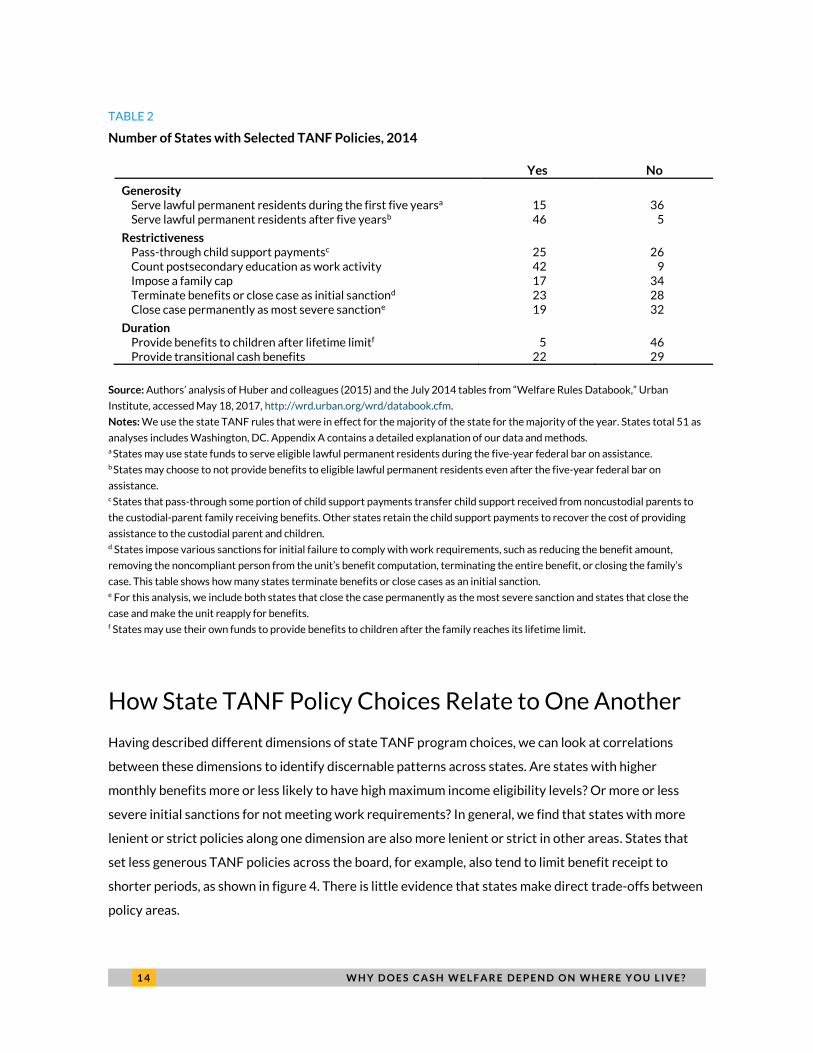
TABLE 2
Number of States with Selected TANF Policies, 2014
Yes No
Generosity
Serve lawful permanent residents during the first five yearsa 15 36 Serve lawful permanent residents after five yearsb 46 5
Restrictiveness Pass-through child support paymentsc 25 26 Count postsecondary education as work activity 42 9 Impose a family cap 17 34 Terminate benefits or close case as initial sanctiond 23 28 Close case permanently as most severe sanctione 19 32
Duration Provide benefits to children after lifetime limitf 5 46 Provide transitional cash benefits 22 29
Source: Authors’ analysis of Huber and colleagues (2015) and the July 2014 tables from “Welfare Rules Databook,” Urban
Institute, accessed May 18, 2017, http://wrd.urban.org/wrd/databook.cfm.
Notes: We use the state TANF rules that were in effect for the majority of the state for the majority of the year. States total 51 as
analyses includes Washington, DC. Appendix A contains a detailed explanation of our data and methods. a States may use state funds to serve eligible lawful permanent residents during the five-year federal bar on assistance. b States may choose to not provide benefits to eligible lawful permanent residents even after the five-year federal bar on
assistance. c States that pass-through some portion of child support payments transfer child support received from noncustodial parents to
the custodial-parent family receiving benefits. Other states retain the child support payments to recover the cost of providing
assistance to the custodial parent and children. d States impose various sanctions for initial failure to comply with work requirements, such as reducing the benefit amount,
removing the noncompliant person from the unit’s benefit computation, terminating the entire benefit, or closing the family’s
case. This table shows how many states terminate benefits or close cases as an initial sanction. e For this analysis, we include both states that close the case permanently as the most severe sanction and states that close the
case and make the unit reapply for benefits. f States may use their own funds to provide benefits to children after the family reaches its lifetime limit.
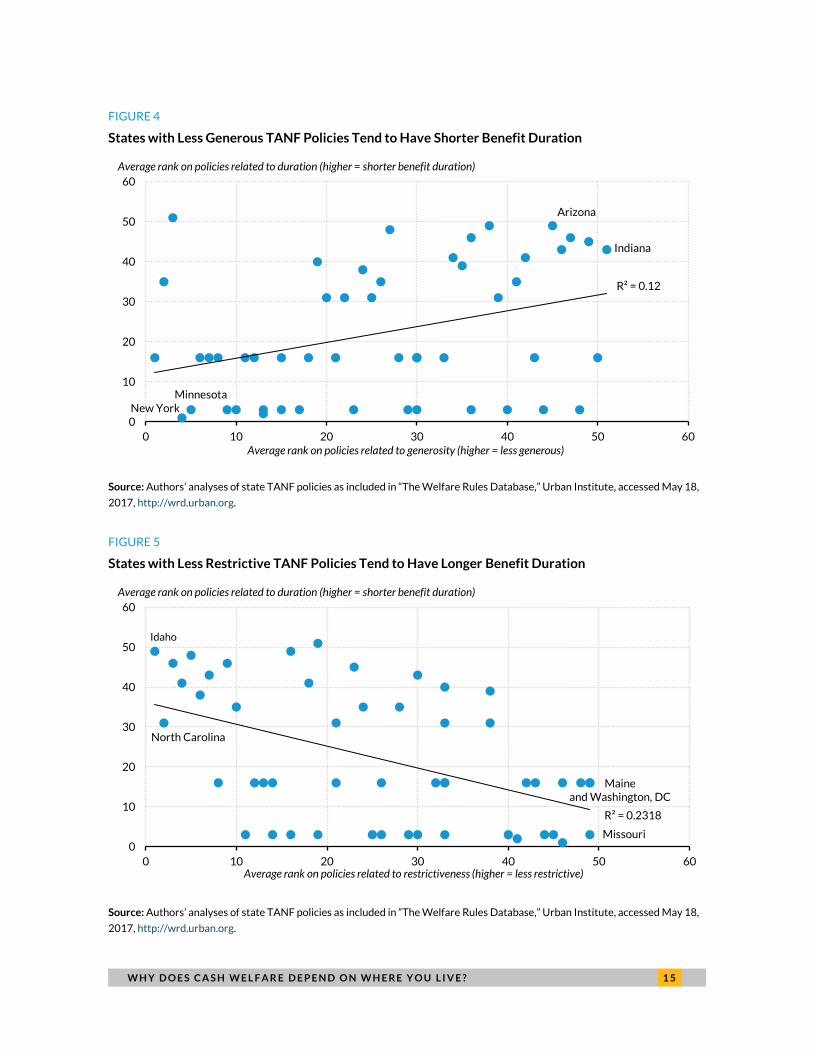
How State TANF Policy Choices Relate to One Another
Having described different dimensions of state TANF program choices, we can look at correlations
between these dimensions to identify discernable patterns across states. Are states with higher
monthly benefits more or less likely to have high maximum income eligibility levels? Or more or less
severe initial sanctions for not meeting work requirements? In general, we find that states with more
lenient or strict policies along one dimension are also more lenient or strict in other areas. States that
set less generous TANF policies across the board, for example, also tend to limit benefit receipt to
shorter periods, as shown in figure 4. There is little evidence that states make direct trade-offs between
policy areas.
W H Y D O E S C A S H W E L F A R E D E P E N D O N W H E R E Y O U L I V E ? 1 5
FIGURE 4
States with Less Generous TANF Policies Tend to Have Shorter Benefit Duration
Source: Authors’ analyses of state TANF policies as included in “The Welfare Rules Database,” Urban Institute, accessed May 18,
2017, http://wrd.urban.org.
FIGURE 5
States with Less Restrictive TANF Policies Tend to Have Longer Benefit Duration
Source: Authors’ analyses of state TANF policies as included in “The Welfare Rules Database,” Urban Institute, accessed May 18,
2017, http://wrd.urban.org.
New YorkMinnesota
Arizona
Indiana
R² = 0.12
0
10
20
30
40
50
60
0 10 20 30 40 50 60Average rank on policies related to generosity (higher = less generous)
Average rank on policies related to duration (higher = shorter benefit duration)
Missouri
Maine and Washington, DC
North Carolina
Idaho
R² = 0.2318
0
10
20
30
40
50
60
0 10 20 30 40 50 60Average rank on policies related to restrictiveness (higher = less restrictive)
Average rank on policies related to duration (higher = shorter benefit duration)
1 6 W H Y D O E S C A S H W E L F A R E D E P E N D O N W H E R E Y O U L I V E ?
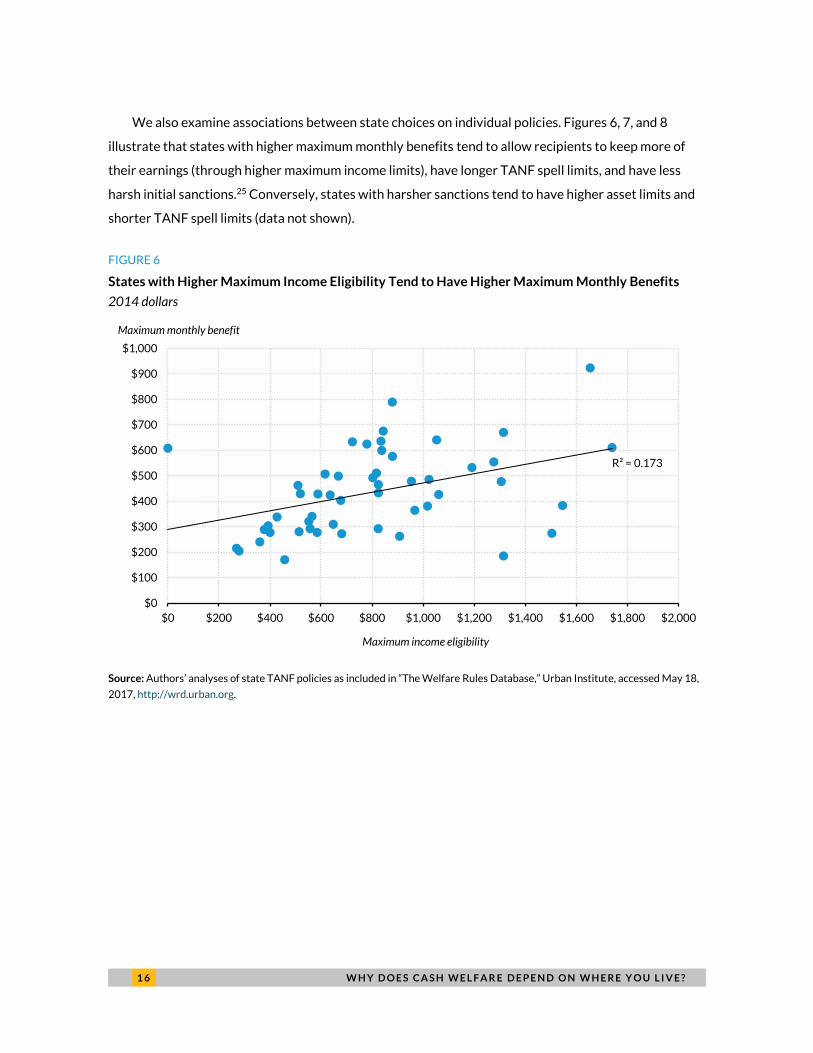
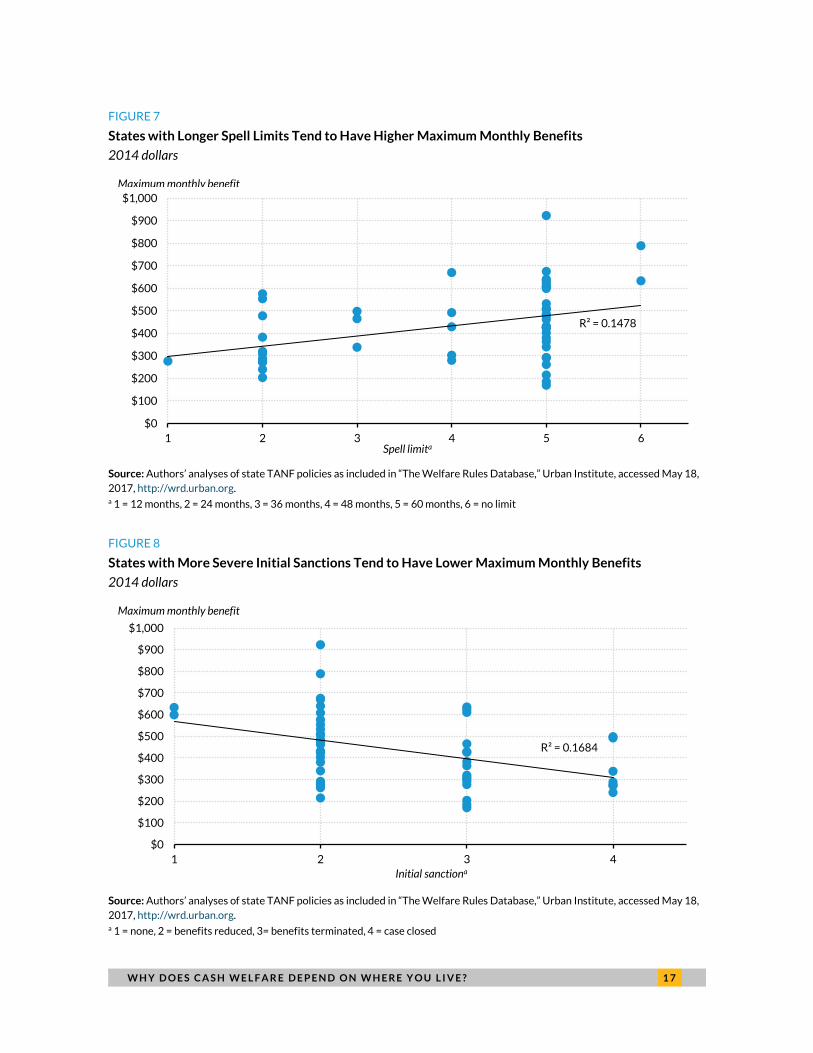
We also examine associations between state choices on individual policies. Figures 6, 7, and 8
illustrate that states with higher maximum monthly benefits tend to allow recipients to keep more of
their earnings (through higher maximum income limits), have longer TANF spell limits, and have less
harsh initial sanctions.25 Conversely, states with harsher sanctions tend to have higher asset limits and
shorter TANF spell limits (data not shown).
FIGURE 6
States with Higher Maximum Income Eligibility Tend to Have Higher Maximum Monthly Benefits
2014 dollars
Source: Authors’ analyses of state TANF policies as included in “The Welfare Rules Database,” Urban Institute, accessed May 18,
2017, http://wrd.urban.org.
R² = 0.173
$0
$100
$200
$300
$400
$500
$600
$700
$800
$900
$1,000
$0 $200 $400 $600 $800 $1,000 $1,200 $1,400 $1,600 $1,800 $2,000
Maximum income eligibility
Maximum monthly benefit
W H Y D O E S C A S H W E L F A R E D E P E N D O N W H E R E Y O U L I V E ? 1 7
FIGURE 7
States with Longer Spell Limits Tend to Have Higher Maximum Monthly Benefits
2014 dollars
Source: Authors’ analyses of state TANF policies as included in “The Welfare Rules Database,” Urban Institute, accessed May 18,
2017, http://wrd.urban.org. a 1 = 12 months, 2 = 24 months, 3 = 36 months, 4 = 48 months, 5 = 60 months, 6 = no limit
FIGURE 8
States with More Severe Initial Sanctions Tend to Have Lower Maximum Monthly Benefits
2014 dollars
Source: Authors’ analyses of state TANF policies as included in “The Welfare Rules Database,” Urban Institute, accessed May 18,
2017, http://wrd.urban.org. a 1 = none, 2 = benefits reduced, 3= benefits terminated, 4 = case closed
R² = 0.1478
$0
$100
$200
$300
$400
$500
$600
$700
$800
$900
$1,000
1 2 3 4 5 6Spell limita
Maximum monthly benefit
R² = 0.1684
$0
$100
$200
$300
$400
$500
$600
$700
$800
$900
$1,000
1 2 3 4
Initial sanctiona
Maximum monthly benefit
1 8 W H Y D O E S C A S H W E L F A R E D E P E N D O N W H E R E Y O U L I V E ?
Racial Implications
As shown in figure 3, the majority of African American people live in the 25 states that rank lowest on
TANF-to-poverty ratio. A similar pattern appears when examining state policies affecting the
generosity, restrictiveness, and duration of TANF assistance. Our analysis shows that the majority of
African American and non-Hispanic white people live in states with less generous maximum benefits,
more restrictive behavioral requirements, and shorter time limits.
African American people are especially and disproportionately concentrated in these low-ranking
states. Sixty-three percent of African American people live in states ranking in the bottom half on
generosity, compared with 52 percent of non-Hispanic white people. Likewise, 68 and 59 percent of
African American people live in states with more restrictive behavioral requirements or shorter time
limits, respectively, compared with 64 and 53 percent of non-Hispanic white people. Although our limited
analysis focuses on disparate effects for African American and non-Hispanic white populations, additional
analyses of the implications of state policy choices for other racial and ethnic groups are warranted.
Explaining State Policy Choices
States make TANF policy decisions that affect the generosity, restrictiveness, and duration of cash
assistance. So far, this report has described those policy choices, shown how they interact, and
illustrated their disparate effects on African American and non-Hispanic white populations. But what
explains the variety of different state policies? Studies of TANF from its first decade of operation
identified associations between state TANF policies and key demographic and political factors. We
contribute to the literature by using multivariate regression analysis to explore how demographic,
economic, and political characteristics relate to states’ recent TANF policy choices. To fully understand
the nation’s cash assistance system, we must also consider the history, social context, and local
implementation of TANF policies.
Prior Research
Previous studies have examined the factors that influence state TANF policy choices, and one of the
most consistent predictors of stricter and less generous policies was the African American share of the
TANF caseload.26 States with a larger share of African American recipients had shorter time limits, more
severe sanctions, and stricter family caps, all else equal.27 A larger share of African American recipients
W H Y D O E S C A S H W E L F A R E D E P E N D O N W H E R E Y O U L I V E ? 1 9
was also associated with lower benefit amounts and less comprehensive welfare coverage (Bentele and
Nicoli 2012; Fellowes and Rowe 2004).28 These early studies also showed that states with a higher
proportion of Hispanic TANF recipients are more likely to have shorter time limits and lower benefit
amounts (Fellowes and Rowe 2004; Gais and Weaver 2002; Moller 2002).
Studies also show that more politically conservative states have more severe sanctions, shorter
time limits, and stricter work requirements (Fellowes and Rowe 2004; Gais and Weaver 2002).29
One study found that states that receive more TANF block grant dollars per child experiencing
poverty have more generous policies, such as a higher earned income disregard (Gais and Weaver
2002). However, a different study found that states with higher benefit amounts also have stricter
eligibility rules and less flexible work requirements (Fellowes and Rowe 2004). This suggests that states
might be choosing to serve fewer people with higher benefit amounts rather than serve more people
with lower benefits.
State Characteristics
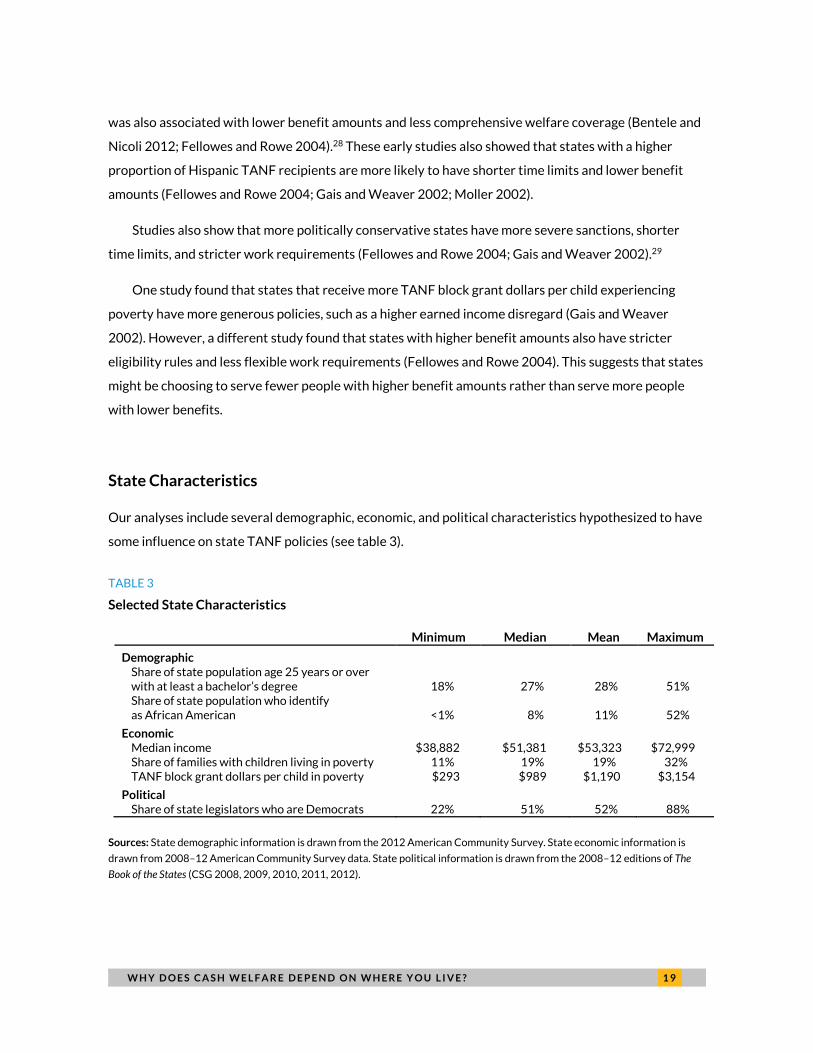
Our analyses include several demographic, economic, and political characteristics hypothesized to have
some influence on state TANF policies (see table 3).
TABLE 3
Selected State Characteristics
Minimum Median Mean Maximum
Demographic
Share of state population age 25 years or over with at least a bachelor’s degree 18% 27% 28% 51% Share of state population who identify as African American <1% 8% 11% 52%
Economic Median income $38,882 $51,381 $53,323 $72,999 Share of families with children living in poverty 11% 19% 19% 32% TANF block grant dollars per child in poverty $293 $989 $1,190 $3,154
Political
Share of state legislators who are Democrats 22% 51% 52% 88%
Sources: State demographic information is drawn from the 2012 American Community Survey. State economic information is
drawn from 2008–12 American Community Survey data. State political information is drawn from the 2008–12 editions of The
Book of the States (CSG 2008, 2009, 2010, 2011, 2012).
2 0 W H Y D O E S C A S H W E L F A R E D E P E N D O N W H E R E Y O U L I V E ?
DEMOGRAPHIC FACTORS
People from different demographic groups may have different perspectives on the causes and
consequences of poverty and the ideal role of government in assisting people in need. People may also
have different perceptions of who needs financial or other supports, perceptions that may be influenced
by the racial composition of the state, level of racial segregation, or other socioeconomic conditions that
differ by race/ethnicity. These perspectives may influence state legislators or other officials responsible
for establishing TANF policies. Our analysis includes the African American share of a state’s population
as a measure of racial composition30 and the share of the population age 25 years or over with at least a
bachelor’s degree as a measure of educational attainment.
Racial composition. A key motivator of welfare reform was the perception that welfare was benefiting an
undeserving (i.e., capable of working) and predominantly African American population and possibly
contributing to growing rates of out-of-wedlock childbearing (Fording, Soss, and Schram 2011; Gilens
1999; Neubeck and Cazenave 2001). The racial composition of a state’s population might directly drive
decisionmaking by moderating public perceptions of the causes of welfare dependency and influencing
policymakers. If voters or policymakers perceive people receiving welfare as different from themselves,
they may believe that welfare dependency is caused more by personal shortcomings than by
circumstances beyond one’s control. For example, a largely white public may find it easier to identify
with a predominantly white base of welfare recipients and may, as a result, believe that welfare
dependency is caused by circumstances beyond one’s control, leading them to encourage elected
officials and other policymakers to support more generous policies. On the other hand, given the
pervasiveness and persistence of racist attitudes, the more the white public believes that welfare
recipients are predominantly people of color, the more likely they may be to believe that welfare
dependency is caused by personal shortcomings and to support more restrictive policies.
Given this history, we expect a higher concentration of African American people in a state to be
associated with policy decisions that are less generous, more restrictive, and limit families to receiving
cash assistance for a shorter time. To test this hypothesis, we include data on the share of state
populations that identify as black or African American in the Census Bureau’s 2012 American
Community Survey (ACS).31 On average, 11.4 percent of state populations are non-Hispanic African
American, ranging from 0.4 percent in Montana to 37.2 in Mississippi (and 51.6 in Washington, DC).
Educational attainment. More educated people are less likely to believe that government benefit
programs are unaffordable, that beneficiaries of these programs “have it easy” and receive benefits
without doing anything in return, and that African American people who do not succeed in the economy
are responsible for their own condition (Pew Research Center 2016). Given this more positive
W H Y D O E S C A S H W E L F A R E D E P E N D O N W H E R E Y O U L I V E ? 2 1
perception of public assistance, we expect higher average educational attainment in a state to be
associated with TANF policy decisions that support benefits that are more generous, less restrictive,
and of longer duration.
Data on educational attainment, measured as the share of a state’s population age 25 years or over
with at least a bachelor’s degree, are drawn from the 2012 ACS. On average, 28.2 percent of adults
have at least a bachelor’s degree, ranging from a low of 17.9 percent in West Virginia to a high of 38.9 in
Massachusetts (and 51.2 in Washington, DC).
ECONOMIC FACTORS
Economic characteristics might also influence a state’s TANF policies by shaping perceptions of its
capacity to pay for benefits as well as the level of demand or need for the program. States with more
higher-income residents are able to afford more generous benefit policies but have lower demand for
benefits, and those with more low-income families have greater need for benefits without the
corresponding fiscal capacity. To a large degree, states’ historical commitment to and capacity to
support welfare were locked in as a result of block granting TANF, which froze the amount of federal
dollars given to each state from 1996 onward. Our analysis includes three state economic factors:
median income, the share of families with children living in poverty, and the size of the TANF block
grant relative to the number of children living in poverty.
Median income. A state with lower median income may have more residents struggling financially (even
if their incomes are not low enough to qualify for TANF) and a lower tax base. Struggling residents may
resent that others receive benefits while they must make ends meet without assistance, and they may
be less likely to support relatively generous assistance for very low–income families. When state
median incomes are higher and more residents are financially comfortable, they may be more amenable
to supporting assistance for low-income families and the state may have greater financial resources to
do so. We hypothesize that higher median income are associated with state TANF policies that are more
generous, less restrictive, and allow families to receive cash assistance longer.
Estimates of state median household incomes are from 2008–12 five-year ACS data. Average
median income was $53,323, ranging from $38,882 in Mississippi to $72,999 in Maryland.
Families with children living in poverty. States with a higher share of families with children in poverty
could face greater financial demand and strain from paying out benefits. They would also likely have
lower tax revenues and capacity to fund these programs because of their greater proportion of low-
2 2 W H Y D O E S C A S H W E L F A R E D E P E N D O N W H E R E Y O U L I V E ?
income residents. Thus, we hypothesize that higher shares of families living in poverty are associated
with TANF policies that are less generous, more restrictive, and limit the duration of cash assistance.
The share of families with children under age 18 and income that fell below the federal poverty
level at any point in the preceding 12 months is drawn from 2008–12 ACS data. The average across
states is 19.4 percent, ranging from 10.5 percent in New Hampshire to 31.7 percent in Mississippi.
TANF block grant dollars per child living in poverty. The amount of TANF block grant dollars per child
living in poverty is a combined measure of the state’s historical commitment to welfare and current
need (i.e., the number of children now living in poverty). Considered independently, a larger TANF block
grant and more block grant dollars per child living in poverty might indicate a greater commitment to
funding welfare and helping low-income residents as well as greater financial capacity to do so, which
would suggest more generous and less restrictive policies with longer time limits. Conversely, more
children living in poverty would drive down the block grant dollars available per child living in poverty
and put greater strain on available funding for benefits, potentially leading to more restrictive and less
generous policies with shorter time limits. However, we also know that child populations are growing in
states that historically have spent relatively less on children (Isaacs 2017), so we expect an association
between more TANF block grant dollars per child living in poverty and state policy decisions that
support benefits that are more generous, less restrictive, and of longer duration.
To calculate each state’s TANF block grant dollars per child living in poverty, we divide its TANF
block grant, as identified by the Congressional Research Service (Falk 2013), by the average number of
children living below the federal poverty line in that state, as reflected in the 2008–12 ACS data. The
average TANF block grant per child living in poverty is $1,190, ranging from $293 in Texas to $3,154 in
Washington, DC.
POLITICAL FACTORS
The political makeup of a state’s population is also likely to influence its TANF policies. Democrats tend to
advance more liberal policies and support public assistance programs, and Republicans are often
concerned about government waste and the work and marriage disincentives public benefits may present.
We include one political factor in our analysis: the share of state legislators who are Democrats.
State legislators who are Democrats. Democrats tend to support public assistance on the belief that both
structural issues and personal choices affect a person’s financial circumstances (Pew Research Center
2015).32 We expect a greater proportion of Democrats in a state’s legislature to be associated with TANF
policies that are more generous, less restrictive, and allow families to receive cash assistance longer.
W H Y D O E S C A S H W E L F A R E D E P E N D O N W H E R E Y O U L I V E ? 2 3
The average share of Democrats in a state’s legislature is 51.9 percent, ranging from 22 percent in
Idaho to 88 percent in Hawaii. This figure is a five-year average (2008–12) calculated from the total
share of Democrats in all state legislative bodies as listed in The Book of the States, an annual publication
from the Council of State Governments.33
State Characteristics Explaining TANF Policy Choices
To better understand state variation in TANF program generosity, restrictiveness, and benefit duration,
we ran three sets of multivariate regression models that examined how demographic, economic, and
political characteristics are associated with these dimensions of state TANF policies.34
The first regression models each include as the dependent variable one of three policies that
indicate the relative generosity of a state’s TANF program: the maximum monthly benefit for a family of
three, the maximum monthly income for initial eligibility for a family of three, or the asset limit for initial
eligibility. The second models examine three policies that reflect the restrictiveness of state TANF
programs: the number of work activity exemptions, whether postsecondary education counts as a work
activity, and initial sanctions.35 The dependent variable in the third model is a measure of duration of
assistance: the maximum TANF spell limit.36 We focus on this subset of TANF policies to limit the scope
of our analysis to only the most prominent policies and those on which states differ most.
GENERAL FINDINGS
Overall, our analysis reveals that demographic, economic, and political factors are associated with state
TANF program generosity but are only weakly or not at all explanatory of restrictiveness and benefit
duration.
A larger share of African American people in a state’s population is generally associated with less
generous and more restrictive policies, controlling for other factors in the model. Other state
characteristics, including the share of adults with a bachelor’s degree, TANF block grant dollars per
child living in poverty, the share of Democrats in state legislatures, and median income, are also
associated with multiple TANF policies, but the direction of these relationships is not consistent. These
findings suggest states may be responding to the same contexts and constraints differently depending
on the specific TANF policy in question.
2 4 W H Y D O E S C A S H W E L F A R E D E P E N D O N W H E R E Y O U L I V E ?
TANF POLICIES RELATED TO GENEROSITY
State characteristics are better at predicting differences in maximum monthly benefits than differences
in income eligibility limits or asset limits.
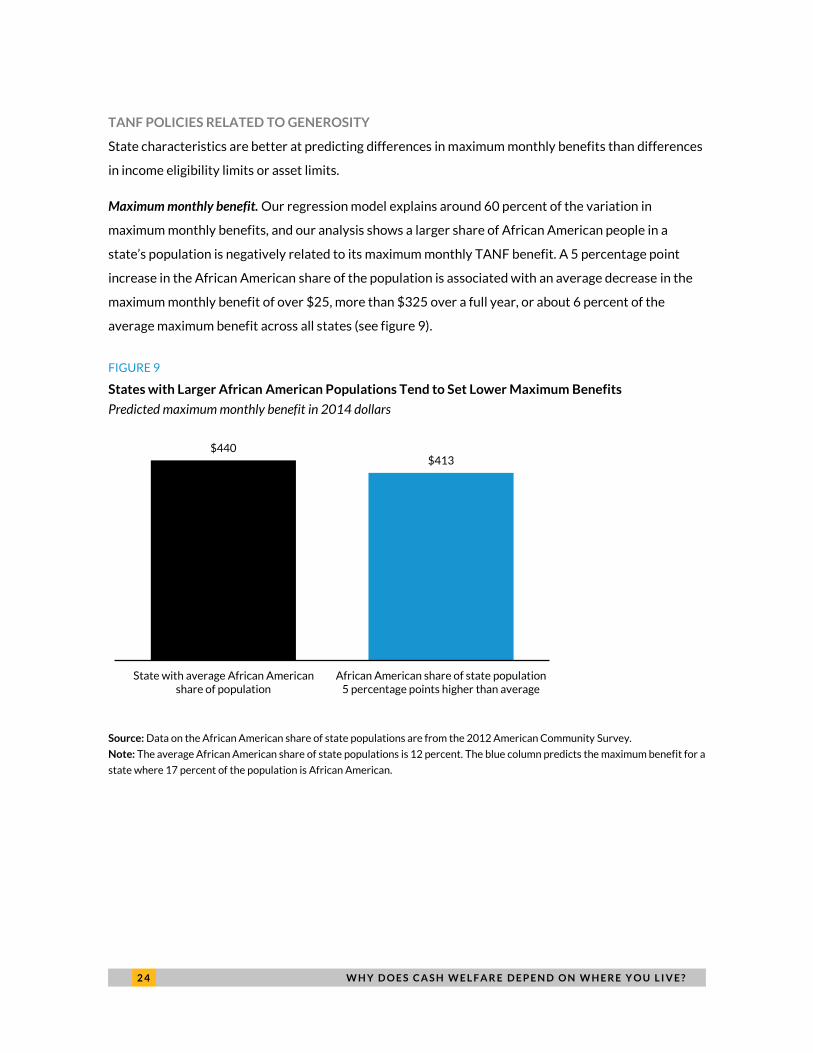
Maximum monthly benefit. Our regression model explains around 60 percent of the variation in
maximum monthly benefits, and our analysis shows a larger share of African American people in a
state’s population is negatively related to its maximum monthly TANF benefit. A 5 percentage point
increase in the African American share of the population is associated with an average decrease in the
maximum monthly benefit of over $25, more than $325 over a full year, or about 6 percent of the
average maximum benefit across all states (see figure 9).
FIGURE 9
States with Larger African American Populations Tend to Set Lower Maximum Benefits
Predicted maximum monthly benefit in 2014 dollars
Source: Data on the African American share of state populations are from the 2012 American Community Survey.
Note: The average African American share of state populations is 12 percent. The blue column predicts the maximum benefit for a
state where 17 percent of the population is African American.
$440$413
State with average African Americanshare of population
African American share of state population5 percentage points higher than average
W H Y D O E S C A S H W E L F A R E D E P E N D O N W H E R E Y O U L I V E ? 2 5
BOX 1
Methodological Issues with TANF Block Grant Dollars per Child Living in Poverty
TANF block grant dollars per child living in poverty is a variable used in previous research on state
TANF policies as a measure of state capacity relative to need. We include it in each of our models except
the model predicting maximum monthly benefits. As a measure of both capacity and need, TANF dollars
per child living in poverty may be directly linked to the maximum benefit level and therefore bias the
results of the model. As a result, we believe it is appropriate to exclude block grant dollars per child
living in poverty from this model.
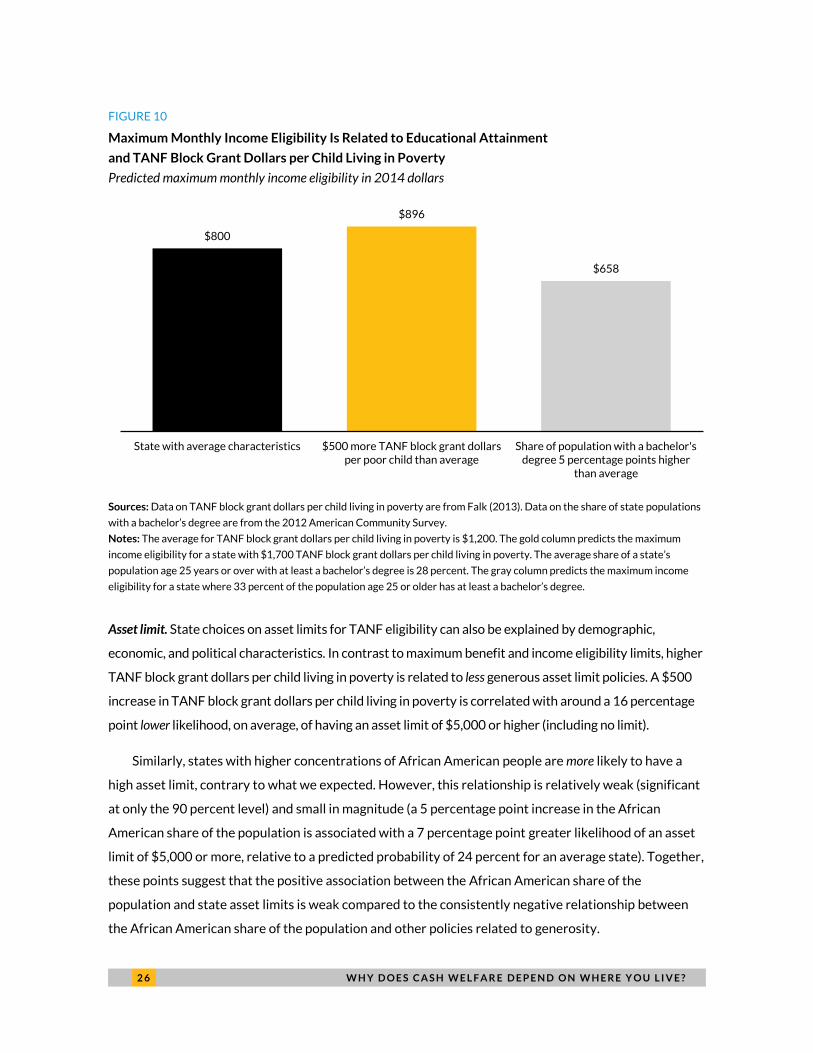
Maximum monthly income for initial eligibility. The generosity of state TANF programs is also reflected in
the maximum income allowed for initial eligibility, or how much income a family can earn and still be
eligible for cash assistance. The amount of block grant dollars a state receives per child living in poverty
is positively associated with this measure of generosity, with more block grant dollars per child living in
poverty resulting in a higher income limit. A $500 increase in TANF block grant dollars per child living in
poverty is associated with a $96 increase, on average, to the maximum monthly income limit—around
12 percent of the average maximum income limit of $800.
The correlation between a state’s maximum income for initial eligibility and level of educational
attainment is positive. However, the relationship is negative when controlling for other factors. A 5
percentage point increase in adults with bachelor’s degrees is associated with an average decrease of
around $140 in a state’s income eligibility limit, suggesting that other factors may have a stronger
relationship with this policy (figure 10).
2 6 W H Y D O E S C A S H W E L F A R E D E P E N D O N W H E R E Y O U L I V E ?
FIGURE 10
Maximum Monthly Income Eligibility Is Related to Educational Attainment
and TANF Block Grant Dollars per Child Living in Poverty
Predicted maximum monthly income eligibility in 2014 dollars
Sources: Data on TANF block grant dollars per child living in poverty are from Falk (2013). Data on the share of state populations
with a bachelor’s degree are from the 2012 American Community Survey.
Notes: The average for TANF block grant dollars per child living in poverty is $1,200. The gold column predicts the maximum
income eligibility for a state with $1,700 TANF block grant dollars per child living in poverty. The average share of a state’s
population age 25 years or over with at least a bachelor’s degree is 28 percent. The gray column predicts the maximum income
eligibility for a state where 33 percent of the population age 25 or older has at least a bachelor’s degree.
Asset limit. State choices on asset limits for TANF eligibility can also be explained by demographic,
economic, and political characteristics. In contrast to maximum benefit and income eligibility limits, higher
TANF block grant dollars per child living in poverty is related to less generous asset limit policies. A $500
increase in TANF block grant dollars per child living in poverty is correlated with around a 16 percentage
point lower likelihood, on average, of having an asset limit of $5,000 or higher (including no limit).
Similarly, states with higher concentrations of African American people are more likely to have a
high asset limit, contrary to what we expected. However, this relationship is relatively weak (significant
at only the 90 percent level) and small in magnitude (a 5 percentage point increase in the African
American share of the population is associated with a 7 percentage point greater likelihood of an asset
limit of $5,000 or more, relative to a predicted probability of 24 percent for an average state). Together,
these points suggest that the positive association between the African American share of the
population and state asset limits is weak compared to the consistently negative relationship between
the African American share of the population and other policies related to generosity.
$800
$896
$658
State with average characteristics $500 more TANF block grant dollarsper poor child than average
Share of population with a bachelor'sdegree 5 percentage points higher
than average
W H Y D O E S C A S H W E L F A R E D E P E N D O N W H E R E Y O U L I V E ? 2 7
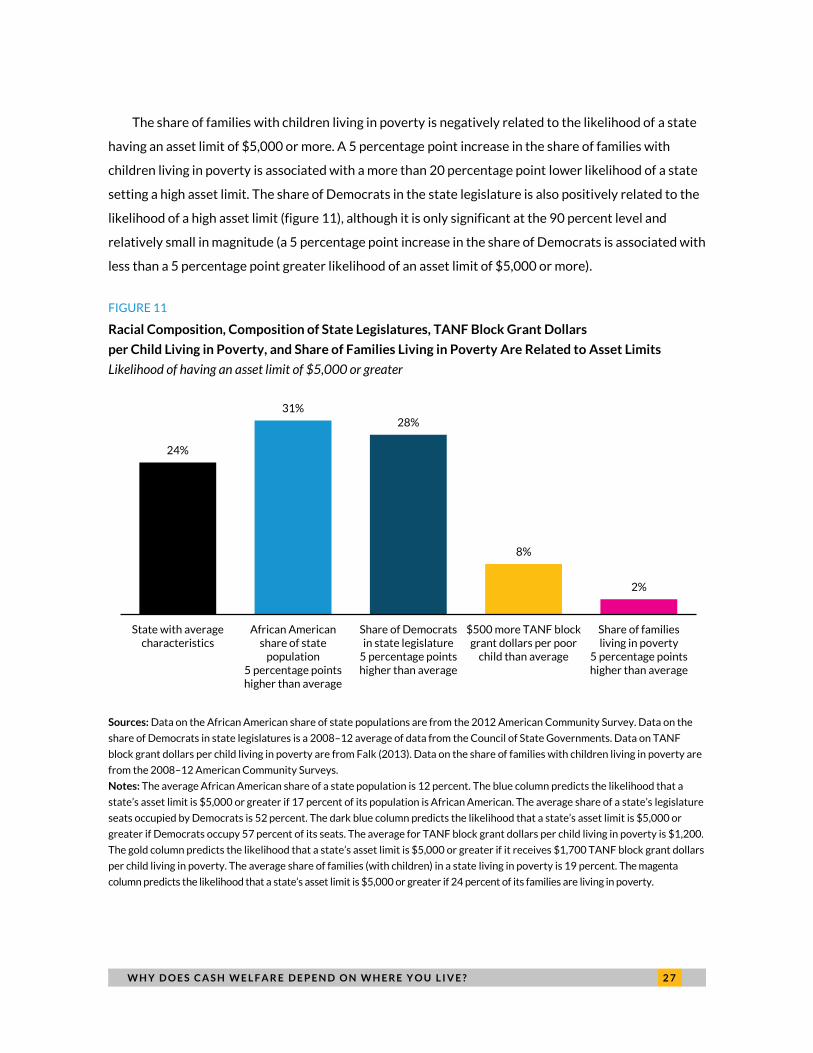
The share of families with children living in poverty is negatively related to the likelihood of a state
having an asset limit of $5,000 or more. A 5 percentage point increase in the share of families with
children living in poverty is associated with a more than 20 percentage point lower likelihood of a state
setting a high asset limit. The share of Democrats in the state legislature is also positively related to the
likelihood of a high asset limit (figure 11), although it is only significant at the 90 percent level and
relatively small in magnitude (a 5 percentage point increase in the share of Democrats is associated with
less than a 5 percentage point greater likelihood of an asset limit of $5,000 or more).
FIGURE 11
Racial Composition, Composition of State Legislatures, TANF Block Grant Dollars
per Child Living in Poverty, and Share of Families Living in Poverty Are Related to Asset Limits
Likelihood of having an asset limit of $5,000 or greater
Sources: Data on the African American share of state populations are from the 2012 American Community Survey. Data on the
share of Democrats in state legislatures is a 2008–12 average of data from the Council of State Governments. Data on TANF
block grant dollars per child living in poverty are from Falk (2013). Data on the share of families with children living in poverty are
from the 2008–12 American Community Surveys.
Notes: The average African American share of a state population is 12 percent. The blue column predicts the likelihood that a
state’s asset limit is $5,000 or greater if 17 percent of its population is African American. The average share of a state’s legislature
seats occupied by Democrats is 52 percent. The dark blue column predicts the likelihood that a state’s asset limit is $5,000 or
greater if Democrats occupy 57 percent of its seats. The average for TANF block grant dollars per child living in poverty is $1,200.
The gold column predicts the likelihood that a state’s asset limit is $5,000 or greater if it receives $1,700 TANF block grant dollars
per child living in poverty. The average share of families (with children) in a state living in poverty is 19 percent. The magenta
column predicts the likelihood that a state’s asset limit is $5,000 or greater if 24 percent of its families are living in poverty.
24%
31%
28%
8%
2%
State with averagecharacteristics
African Americanshare of state
population5 percentage pointshigher than average
Share of Democratsin state legislature
5 percentage pointshigher than average
$500 more TANF blockgrant dollars per poor
child than average
Share of familiesliving in poverty
5 percentage pointshigher than average
2 8 W H Y D O E S C A S H W E L F A R E D E P E N D O N W H E R E Y O U L I V E ?
TANF POLICIES RELATED TO RESTRICTIVENESS
Policies related to the restrictiveness of state TANF programs are more weakly associated with
demographic, economic, and political characteristics. The likelihood of counting postsecondary
education as a work activity is not related to any of our explanatory factors, and the number of work
activity exemptions is positively associated with block grant dollars per child living in poverty at only
the 90 percent level (on average, a $500 increase is related to a 9 percentage point greater likelihood of
a state having three or more exemptions).
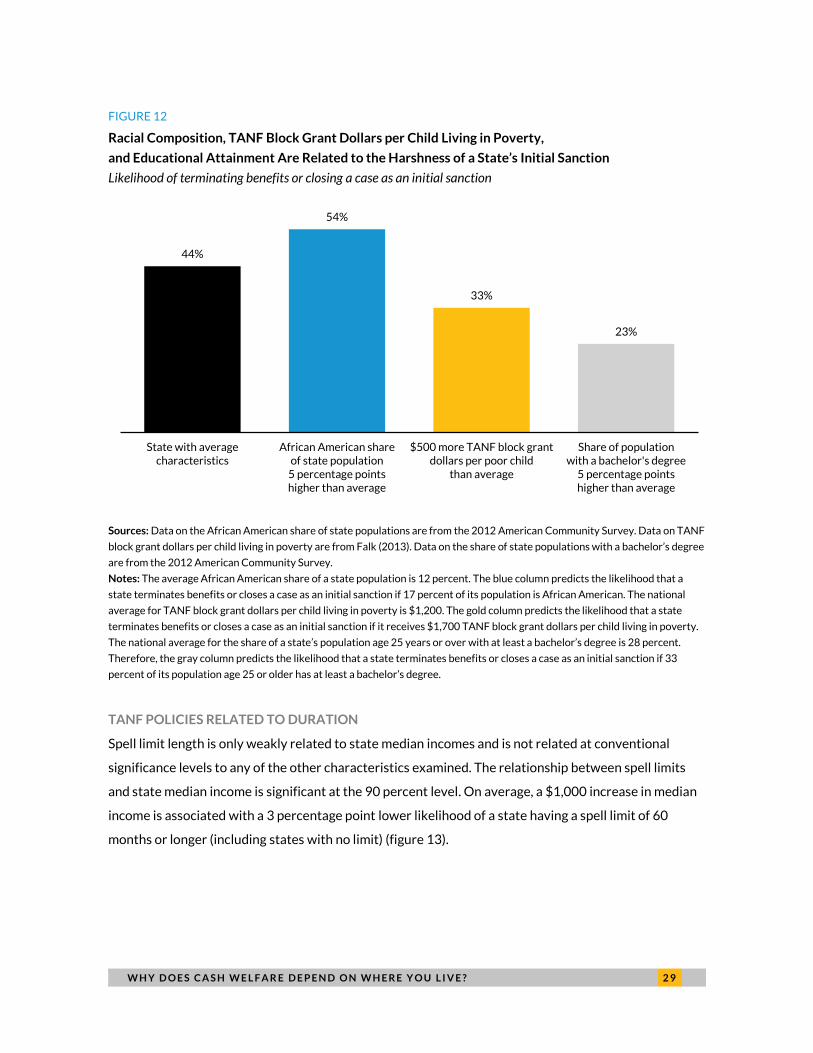
Initial sanctions for failure to comply with work requirements are the only exception, as the African
American share of the population, the share of adults with bachelor’s degrees, and TANF block grant
dollars per child living in poverty are all related to the probability of more punitive initial sanctions (e.g.,
benefits terminated to the entire unit or case closure).
States with higher concentrations of African American people are more likely to have strict initial
sanctions. A 5 percentage point increase in the African American share of the population is associated
with a nearly 10 percentage point increase in the probability of having harsher initial sanctions. In
contrast, states with highly educated populations are less likely to have harsh initial sanctions. A 5
percentage point increase in the share of adults with bachelor’s degrees is related to a more than 20
percentage point lower likelihood, on average, of a state having more punitive initial sanctions. Finally,
states receiving more TANF block grant dollars per child living in poverty, suggesting a greater
historical financial commitment to welfare and greater current capacity to fund benefits, are less likely
to impose stricter initial sanctions. A state receiving $500 more in TANF block grant dollars per child
living in poverty has an 11 percentage point lower probability, on average, of imposing harsh initial
sanctions (figure 12).
W H Y D O E S C A S H W E L F A R E D E P E N D O N W H E R E Y O U L I V E ? 2 9
FIGURE 12
Racial Composition, TANF Block Grant Dollars per Child Living in Poverty,
and Educational Attainment Are Related to the Harshness of a State’s Initial Sanction
Likelihood of terminating benefits or closing a case as an initial sanction
Sources: Data on the African American share of state populations are from the 2012 American Community Survey. Data on TANF
block grant dollars per child living in poverty are from Falk (2013). Data on the share of state populations with a bachelor’s degree
are from the 2012 American Community Survey.
Notes: The average African American share of a state population is 12 percent. The blue column predicts the likelihood that a
state terminates benefits or closes a case as an initial sanction if 17 percent of its population is African American. The national
average for TANF block grant dollars per child living in poverty is $1,200. The gold column predicts the likelihood that a state
terminates benefits or closes a case as an initial sanction if it receives $1,700 TANF block grant dollars per child living in poverty.
The national average for the share of a state’s population age 25 years or over with at least a bachelor’s degree is 28 percent.
Therefore, the gray column predicts the likelihood that a state terminates benefits or closes a case as an initial sanction if 33
percent of its population age 25 or older has at least a bachelor’s degree.
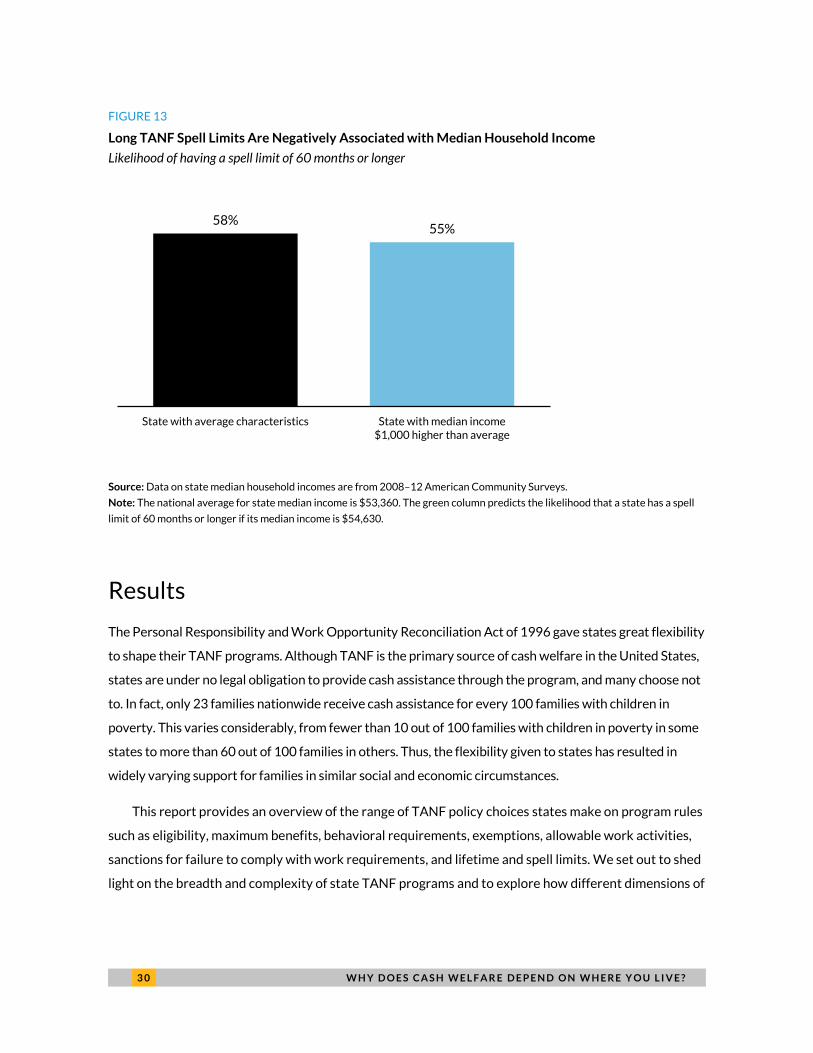
TANF POLICIES RELATED TO DURATION
Spell limit length is only weakly related to state median incomes and is not related at conventional
significance levels to any of the other characteristics examined. The relationship between spell limits
and state median income is significant at the 90 percent level. On average, a $1,000 increase in median
income is associated with a 3 percentage point lower likelihood of a state having a spell limit of 60
months or longer (including states with no limit) (figure 13).
44%
54%
33%
23%
State with averagecharacteristics
African American shareof state population
5 percentage pointshigher than average
$500 more TANF block grantdollars per poor child
than average
Share of populationwith a bachelor's degree
5 percentage pointshigher than average
3 0 W H Y D O E S C A S H W E L F A R E D E P E N D O N W H E R E Y O U L I V E ?
FIGURE 13
Long TANF Spell Limits Are Negatively Associated with Median Household Income
Likelihood of having a spell limit of 60 months or longer
Source: Data on state median household incomes are from 2008–12 American Community Surveys.
Note: The national average for state median income is $53,360. The green column predicts the likelihood that a state has a spell
limit of 60 months or longer if its median income is $54,630.
Results
The Personal Responsibility and Work Opportunity Reconciliation Act of 1996 gave states great flexibility
to shape their TANF programs. Although TANF is the primary source of cash welfare in the United States,
states are under no legal obligation to provide cash assistance through the program, and many choose not
to. In fact, only 23 families nationwide receive cash assistance for every 100 families with children in
poverty. This varies considerably, from fewer than 10 out of 100 families with children in poverty in some
states to more than 60 out of 100 families in others. Thus, the flexibility given to states has resulted in
widely varying support for families in similar social and economic circumstances.
This report provides an overview of the range of TANF policy choices states make on program rules
such as eligibility, maximum benefits, behavioral requirements, exemptions, allowable work activities,
sanctions for failure to comply with work requirements, and lifetime and spell limits. We set out to shed
light on the breadth and complexity of state TANF programs and to explore how different dimensions of
58%55%
State with average characteristics State with median income$1,000 higher than average
W H Y D O E S C A S H W E L F A R E D E P E N D O N W H E R E Y O U L I V E ? 3 1
TANF policies—generosity, restrictiveness, and duration—might relate to one another and whether and
how states make trade-offs on these dimensions.
In general, we found that state decisionmaking is not the result of such trade-offs, and states that
are more generous are also less restrictive and allow families to receive benefits for longer. For
example, higher maximum monthly cash benefits, an indicator of more generous policies, are associated
with less restrictiveness and longer benefit duration. Similarly, harsher initial sanctions are strongly
correlated with shorter spell limits, although they are also weakly associated with higher asset limits.
Of course, decisions about TANF policies are not made in isolation. States may not make careful
trade-offs among different dimensions of TANF, but they are making decisions and trade-offs in other
ways, depending on their ability and willingness to tax and spend their own dollars to supplement federal
funds. A second set of analyses examined a variety of demographic, economic, and political characteristics
that might explain state TANF policies. This portion of our analysis reveals more mixed results.
State median income, the share of the adult population with at least a bachelor’s degree, and the
share of Democrats in state legislature are associated with stricter TANF policies on some dimensions
but not others. Thus, states with similar demographic, economic, and political contexts are responding
differently in their TANF policy decisionmaking.
Consistent with previous literature, we find that state TANF policy decisions are significantly related
to race. The association between larger shares of African American people among TANF recipients and
more restrictive, less generous programs is well documented. Our analysis reveals that a larger African
American share of a state’s total population is also associated with less generous, more restrictive TANF
policies (with the exception of asset limit policies). States with larger African American populations also
tend to have less generous maximum benefits and income eligibility limits and harsher initial sanctions, all
else equal. Consistent with prior studies, we find that more block grant dollars per child living in poverty is
positively related to more generous and less restrictive TANF policies (once again, asset limits are an
exception). Unlike prior research, we did not find a significant association between a state’s political
orientation and the restrictiveness of its TANF programs or duration of its benefits.
These findings should be interpreted with caution for several reasons. Although we explored
several demographic, economic, and political characteristics of states, many other factors not included
in our analysis are likely to influence state TANF policies. Further, many of our variables are likely
related to one another, introducing complications and statistical biases due to multicollinearity.
3 2 W H Y D O E S C A S H W E L F A R E D E P E N D O N W H E R E Y O U L I V E ?
Focusing our analysis on a single year of data may also limit our findings, as variation in state
policies could be a result of unmeasured, preexisting state differences or historical decisions. We
attempt to account for this by including TANF block grant dollars per child living in poverty, in which the
dollar component is constant in nominal terms. It would also be ideal to investigate changes in state
policy and characteristics over time, though limited variation in these factors may again bias results
toward zero. Subsequent research would do well to further explore these areas and examine potentially
disparate effects of policies across a wider range of racial and ethnic groups.
W H Y D O E S C A S H W E L F A R E D E P E N D O N W H E R E Y O U L I V E ? 3 3
Conclusion Race and ethnicity continue to shape our modern social welfare system. Studies have found that
negative stereotypes of African American people heavily influence public perceptions of welfare
(Fording, Soss, and Schram 2011; Gilens 1999; Neubeck and Cazenave 2001). Some scholars, including
the lead author of this study (as Heather McCallum), have argued that racial biases in TANF policies
maintain and reinforce racial inequalities (McCallum 1999; Schram 2005). Others note that the
devolution of authority to states has negatively affected low-income people of color by allowing states
to institute disparate and discriminatory policies (Hallums and Lewis 2003).
Although this study reflects official state TANF policies, local policy implementation is also subject
to racial biases that affect the experiences of welfare recipients. Studies have found that policy
implementation varies by community and is influenced by factors like ideological orientation and racial
and ethnic composition (Fording, Soss, and Schram 2007; Keiser, Mueser, and Choi 2004; Monnat
2010). For example, one study found that Missouri counties with larger minority populations also had
higher sanction rates (Keiser, Mueser, and Choi 2004).
Many aspects of the TANF program are filtered through frontline workers with varying degrees of
training, professionalism, and discretion. Recipients may have very different experiences depending on
their caseworkers. Some studies suggest that caseworkers serve as gatekeepers to particular services
and that caseworker bias can affect access to those services and exposure to sanctions.37 Racial
differences have been observed in several aspects of TANF, including sanctions,38 receipt of work
support services like child care, and access to education and training.39
As Congress and state legislatures consider the possibility of block granting other social welfare
programs and perhaps refining TANF, they would do well to understand the effects of previous welfare
reform. States certainly gained autonomy and flexibility in how to structure and deliver TANF benefits,
but many families in need are worse off. Obviously, any public policy or change in policy will involve
necessary trade-offs, but Americans and their elected leaders must fully understand the choices and
trade-offs being made.
3 4 A P P E N D I X A . D A T A A N D M E T H O D S
Appendix A. Data and Methods
TANF Policy Variables
This study generally classified state TANF policies as they are listed in the Welfare Rules Database.40 In
some cases, we classified policies differently than the Welfare Rules Database, as detailed in the notes.
In addition, we collapsed certain TANF policy choices into fewer variables.41 When states had multiple
components in the Welfare Rules Database tables, we chose the rule that applied to the majority
component (majority of the state for the majority of the year).
The areas where we differed from the Welfare Rules Database, and the applicable states, are as
follows:
Diversion counts to time limit (Arkansas, California, and Florida).
Drug felon eligibility (Kansas, Louisiana, and North Dakota).
Asset limits: We assumed family units to include one adult and two children and no elderly
household members.
Child support transferred: We included Montana and Texas among states that transfer child
support; they do not, but they but do add money to the TANF payment.
Behavioral requirements: We classified requirements on a scale of zero to four, including
school requirements and bonuses, immunization requirements, and health screening
requirements (on the basis that these policies intrude into the lives of applicants).
Allowable activities: We only measure whether a state allows postsecondary education as a
work-related activity given that almost all states offered at least one activity in each category of
work-related activities, education and training activities, and employment activities.
Activities exemptions: We classified exemptions on a scale of zero to four, including working in
unsubsidized jobs, ill or incapacitated, caring for an ill or incapacitated person, and caring for a
child under a certain age. Participants in the majority component of Massachusetts’s program
(known as the “exempt” program) are automatically exempt from activities requirements, so we
classified Massachusetts as having four exemptions. We classified Nebraska as offering no
A P P E N D I X A . D A T A A N D M E T H O D S 3 5
exemptions because ill recipients and recipients caring for an ill person are put in other
components but are not clearly exempt.
Initial sanction: South Dakota does not have an initial sanction and Massachusetts does not
have work requirements, so we listed South Dakota as “none” and Massachusetts as “N/A.”
Most severe length of sanction: We classified “must reapply” at the same level as “case closed”
because of the bureaucratic hurdle of reapplying. We classified Kansas as “case closed” because
the sanction length is 10 years.
Spell limits: Texas has different monthly limits depending on education level and recent work
experience. We classified Texas as having a 12-month limit because “the 12-month limit applies
to nonexempt recipients who (1) did not complete the 11th grade and have 18 months or more
of recent work experience or (2) have a high school diploma or GED, a certificate from
postsecondary school, or a certificate or degree from vocational or technical school and any
work experience” (Cohen et al. 2016). Most TANF recipients have a high school diploma and
some work experience.42 For the purposes of the quantitative analysis, a state’s lifetime limit
was considered its spell limit if it did not specify a spell limit.
Methodology
To test for significant relationships among the overarching policy areas (generosity, restrictiveness, and
duration), states receive a separate ranking for every policy within each of the three categories.43 A
composite measure of generosity, restrictiveness, and duration is then calculated using their average
rank across policies in each area. Finally, we assess whether significant associations exist among the
three areas by running Spearman rank correlations on states’ average rank on generosity,
restrictiveness, and duration.
When investigating correlations among specific policies, we focus our analysis on the seven policies
included in the regression analysis. Significant relationships among these specific TANF policies are also
investigated using Spearman rank correlation, which is robust to the inclusion of outliers. All
associations significant at the 90 percent level or higher are reported in both the correlation and
regression analyses.
Multiple regression models are used to discern significant relationships between TANF policies set
by states in 2014 and their demographic, economic, and political characteristics. All models are run
3 6 A P P E N D I X A . D A T A A N D M E T H O D S
using ordinary least squares and robust standard errors. A one-year cross-section of state policies is
used rather than changes in state policy over time, as relatively low variation in policies from year to
year makes it difficult to distinguish relationships statistically.
States that did not set an asset limit are assigned a value of $500,000, and those with no spell or
lifetime limits are assigned limits of 960 months (80 years) so that they are not dropped from the
correlation and multiple regression analyses. To ensure that these results are not driven by these
outliers, robustness tests are conducted using models that are not sensitive to outliers (Spearman rank
correlation and ordinal logistic regression) to confirm that coefficients’ sign and significance do not
change substantively. Additionally, the regression analysis is conducted using binary versions of these
variables where zero indicates states with low limits (an asset limit of $3,500 or less and a spell limit of
less than 60 months) and one indicates states with higher limits (an asset limit of $5,000 or more,
including no limit, and a 60-month spell limit or no limit) to ensure that results are not sensitive to
outliers and to simplify interpretation.
TANF policies with more than two categories are also collapsed into binary versions (two
categories) in regression models to facilitate explanation. The number of work activity exemptions is set
to zero for states that have zero to two exemptions and one for states that have three or more
exemptions. States that impose an initial sanction of reduced benefits or that have no sanction or no
work requirements (N/A) have a value of zero in the binary version of this variable, and those that
terminate benefits to the entire unit or close the case are assigned a value of one.
Models with binary dependent variables, including asset limit, spell limit, whether a state counts
postsecondary education as a work activity, number of work activity exemptions, and initial sanction,
are run using linear probability models to allow for interpretation. However, the sign and significance
level of coefficients are not sensitive to using logistic regression, except where noted.
Nebraska is dropped from all regression models and correlations that include the percentage of
Democrats in state legislatures variable because the state holds nonpartisan elections and does not
disclose the party of legislators. All dollar figures are in nominal terms, with five-year ACS data
reflecting dollars in the most recent year of the survey.
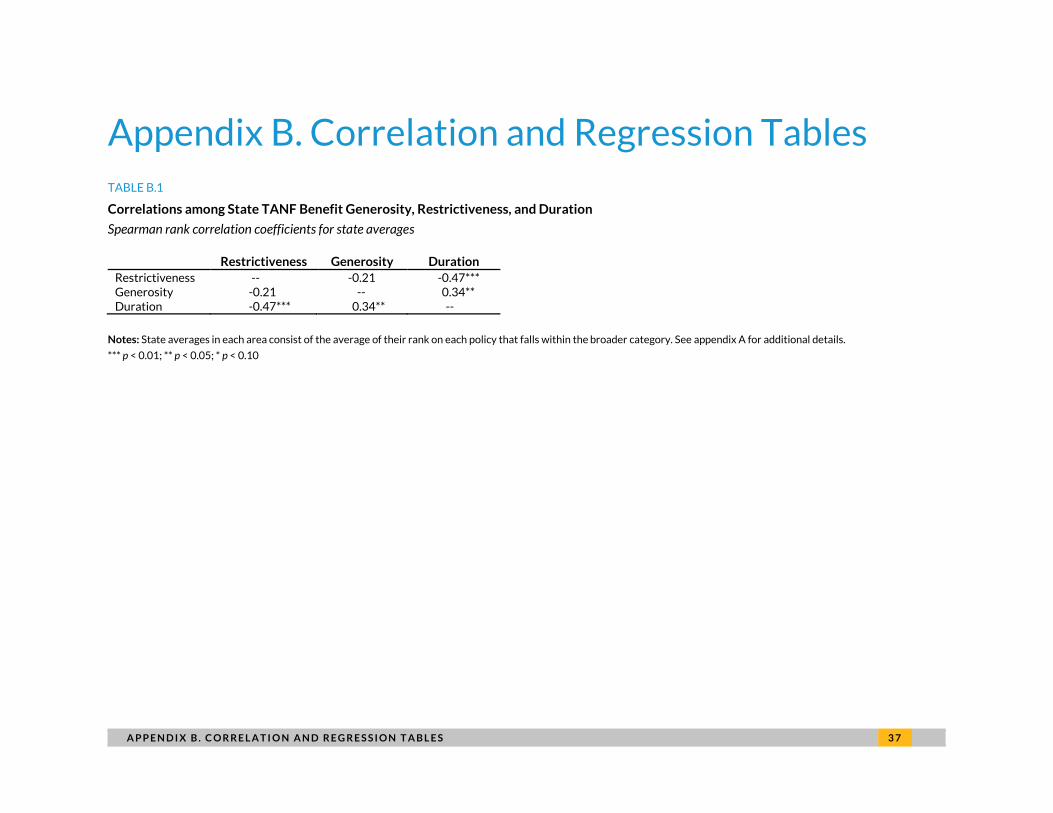
A P P E N D I X B . C O R R E L A T I O N A N D R E G R E S S I O N T A B L E S 3 7
Appendix B. Correlation and Regression Tables TABLE B.1
Correlations among State TANF Benefit Generosity, Restrictiveness, and Duration
Spearman rank correlation coefficients for state averages
Restrictiveness Generosity Duration
Restrictiveness -- -0.21 -0.47*** Generosity -0.21 -- 0.34** Duration -0.47*** 0.34** --
Notes: State averages in each area consist of the average of their rank on each policy that falls within the broader category. See appendix A for additional details.
*** p < 0.01; ** p < 0.05; * p < 0.10
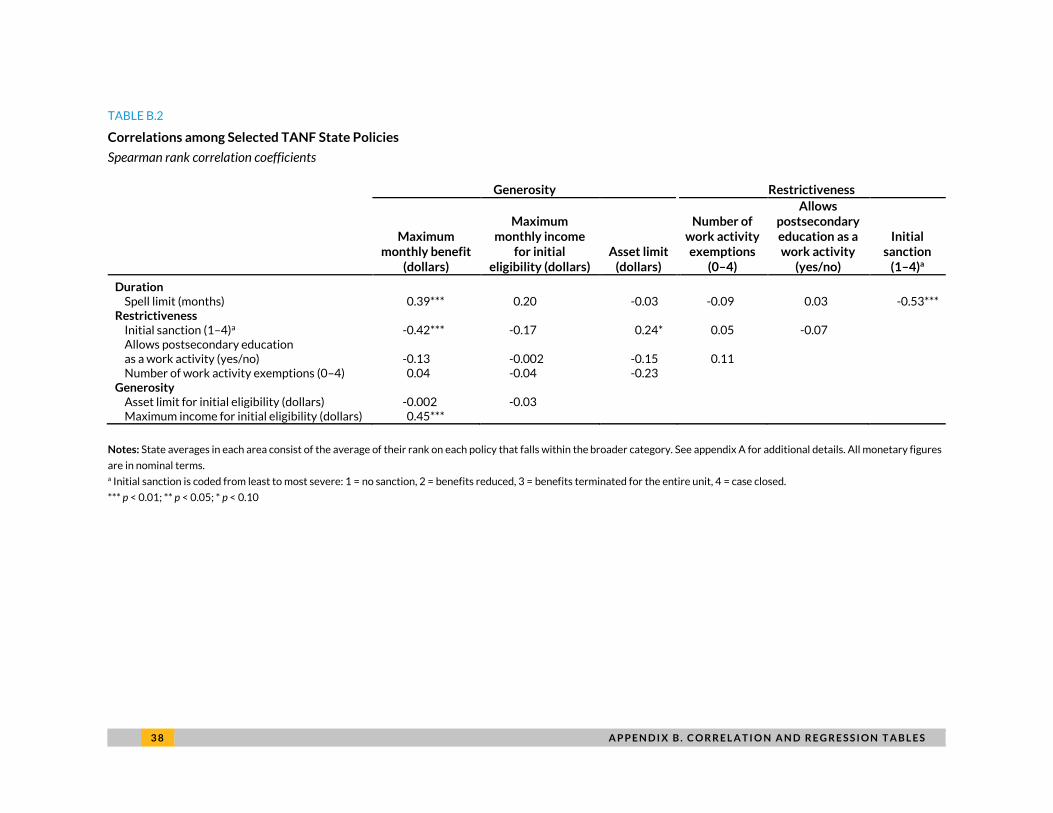
3 8 A P P E N D I X B . C O R R E L A T I O N A N D R E G R E S S I O N T A B L E S
TABLE B.2
Correlations among Selected TANF State Policies
Spearman rank correlation coefficients
Generosity Restrictiveness
Maximum monthly benefit
(dollars)
Maximum monthly income
for initial eligibility (dollars)
Asset limit (dollars)
Number of work activity exemptions
(0–4)
Allows postsecondary education as a work activity
(yes/no)
Initial sanction
(1–4)a
Duration Spell limit (months) 0.39*** 0.20 -0.03 -0.09 0.03 -0.53***
Restrictiveness Initial sanction (1–4)a -0.42*** -0.17 0.24* 0.05 -0.07 Allows postsecondary education as a work activity (yes/no) -0.13 -0.002 -0.15 0.11
Number of work activity exemptions (0–4) 0.04 -0.04 -0.23 Generosity
Asset limit for initial eligibility (dollars) -0.002 -0.03 Maximum income for initial eligibility (dollars) 0.45***
Notes: State averages in each area consist of the average of their rank on each policy that falls within the broader category. See appendix A for additional details. All monetary figures
are in nominal terms. a Initial sanction is coded from least to most severe: 1 = no sanction, 2 = benefits reduced, 3 = benefits terminated for the entire unit, 4 = case closed.
*** p < 0.01; ** p < 0.05; * p < 0.10
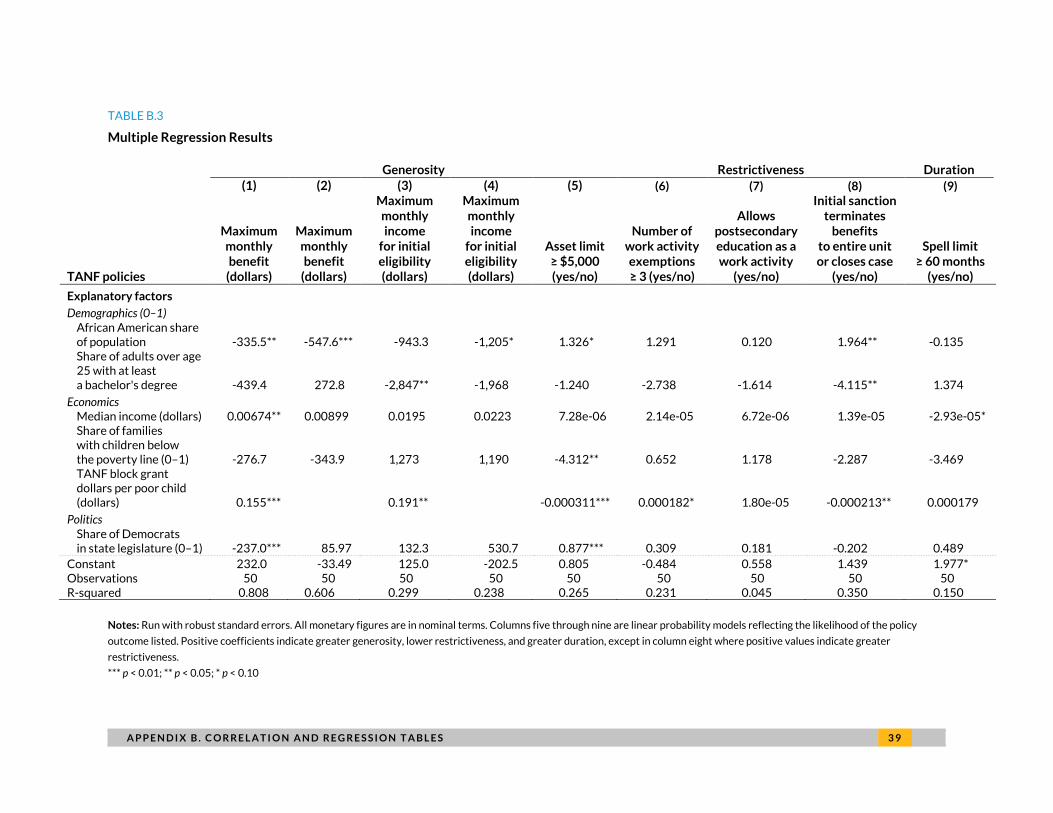
A P P E N D I X B . C O R R E L A T I O N A N D R E G R E S S I O N T A B L E S 3 9
TABLE B.3
Multiple Regression Results
Generosity Restrictiveness Duration
(1) (2) (3) (4) (5) (6) (7) (8) (9)
TANF policies
Maximum monthly benefit
(dollars)
Maximum monthly benefit
(dollars)
Maximum monthly income
for initial eligibility (dollars)
Maximum monthly income
for initial eligibility (dollars)
Asset limit ≥ $5,000 (yes/no)
Number of work activity exemptions ≥ 3 (yes/no)
Allows postsecondary education as a work activity
(yes/no)
Initial sanction terminates
benefits to entire unit or closes case
(yes/no)
Spell limit ≥ 60 months
(yes/no)
Explanatory factors
Demographics (0–1) African American share of population -335.5** -547.6*** -943.3 -1,205* 1.326* 1.291 0.120 1.964** -0.135 Share of adults over age 25 with at least a bachelor's degree -439.4 272.8 -2,847** -1,968 -1.240 -2.738 -1.614 -4.115** 1.374
Economics Median income (dollars) 0.00674** 0.00899 0.0195 0.0223 7.28e-06 2.14e-05 6.72e-06 1.39e-05 -2.93e-05* Share of families with children below the poverty line (0–1) -276.7 -343.9 1,273 1,190 -4.312** 0.652 1.178 -2.287 -3.469 TANF block grant dollars per poor child (dollars) 0.155*** 0.191** -0.000311*** 0.000182* 1.80e-05 -0.000213** 0.000179
Politics Share of Democrats in state legislature (0–1) -237.0*** 85.97 132.3 530.7 0.877*** 0.309 0.181 -0.202 0.489
Constant 232.0 -33.49 125.0 -202.5 0.805 -0.484 0.558 1.439 1.977* Observations 50 50 50 50 50 50 50 50 50 R-squared 0.808 0.606 0.299 0.238 0.265 0.231 0.045 0.350 0.150
Notes: Run with robust standard errors. All monetary figures are in nominal terms. Columns five through nine are linear probability models reflecting the likelihood of the policy
outcome listed. Positive coefficients indicate greater generosity, lower restrictiveness, and greater duration, except in column eight where positive values indicate greater
restrictiveness.
*** p < 0.01; ** p < 0.05; * p < 0.10
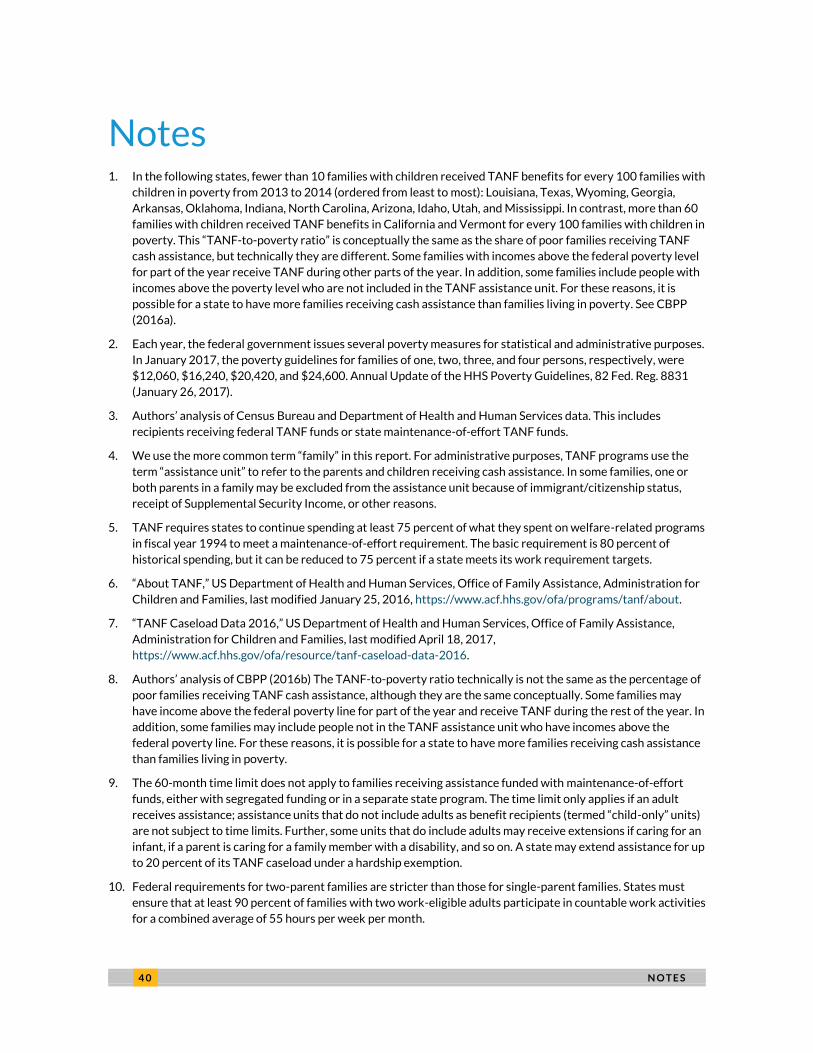
4 0 N O T E S
Notes 1. In the following states, fewer than 10 families with children received TANF benefits for every 100 families with
children in poverty from 2013 to 2014 (ordered from least to most): Louisiana, Texas, Wyoming, Georgia,
Arkansas, Oklahoma, Indiana, North Carolina, Arizona, Idaho, Utah, and Mississippi. In contrast, more than 60
families with children received TANF benefits in California and Vermont for every 100 families with children in
poverty. This “TANF-to-poverty ratio” is conceptually the same as the share of poor families receiving TANF
cash assistance, but technically they are different. Some families with incomes above the federal poverty level
for part of the year receive TANF during other parts of the year. In addition, some families include people with
incomes above the poverty level who are not included in the TANF assistance unit. For these reasons, it is
possible for a state to have more families receiving cash assistance than families living in poverty. See CBPP
(2016a).
2. Each year, the federal government issues several poverty measures for statistical and administrative purposes.
In January 2017, the poverty guidelines for families of one, two, three, and four persons, respectively, were
$12,060, $16,240, $20,420, and $24,600. Annual Update of the HHS Poverty Guidelines, 82 Fed. Reg. 8831
(January 26, 2017).
3. Authors’ analysis of Census Bureau and Department of Health and Human Services data. This includes
recipients receiving federal TANF funds or state maintenance-of-effort TANF funds.
4. We use the more common term “family” in this report. For administrative purposes, TANF programs use the
term “assistance unit” to refer to the parents and children receiving cash assistance. In some families, one or
both parents in a family may be excluded from the assistance unit because of immigrant/citizenship status,
receipt of Supplemental Security Income, or other reasons.
5. TANF requires states to continue spending at least 75 percent of what they spent on welfare-related programs
in fiscal year 1994 to meet a maintenance-of-effort requirement. The basic requirement is 80 percent of
historical spending, but it can be reduced to 75 percent if a state meets its work requirement targets.
6. “About TANF,” US Department of Health and Human Services, Office of Family Assistance, Administration for
Children and Families, last modified January 25, 2016, https://www.acf.hhs.gov/ofa/programs/tanf/about.
7. “TANF Caseload Data 2016,” US Department of Health and Human Services, Office of Family Assistance,
Administration for Children and Families, last modified April 18, 2017,
https://www.acf.hhs.gov/ofa/resource/tanf-caseload-data-2016.
8. Authors’ analysis of CBPP (2016b) The TANF-to-poverty ratio technically is not the same as the percentage of
poor families receiving TANF cash assistance, although they are the same conceptually. Some families may
have income above the federal poverty line for part of the year and receive TANF during the rest of the year. In
addition, some families may include people not in the TANF assistance unit who have incomes above the
federal poverty line. For these reasons, it is possible for a state to have more families receiving cash assistance
than families living in poverty.
9. The 60-month time limit does not apply to families receiving assistance funded with maintenance-of-effort
funds, either with segregated funding or in a separate state program. The time limit only applies if an adult
receives assistance; assistance units that do not include adults as benefit recipients (termed “child-only” units)
are not subject to time limits. Further, some units that do include adults may receive extensions if caring for an
infant, if a parent is caring for a family member with a disability, and so on. A state may extend assistance for up
to 20 percent of its TANF caseload under a hardship exemption.
10. Federal requirements for two-parent families are stricter than those for single-parent families. States must
ensure that at least 90 percent of families with two work-eligible adults participate in countable work activities
for a combined average of 55 hours per week per month.
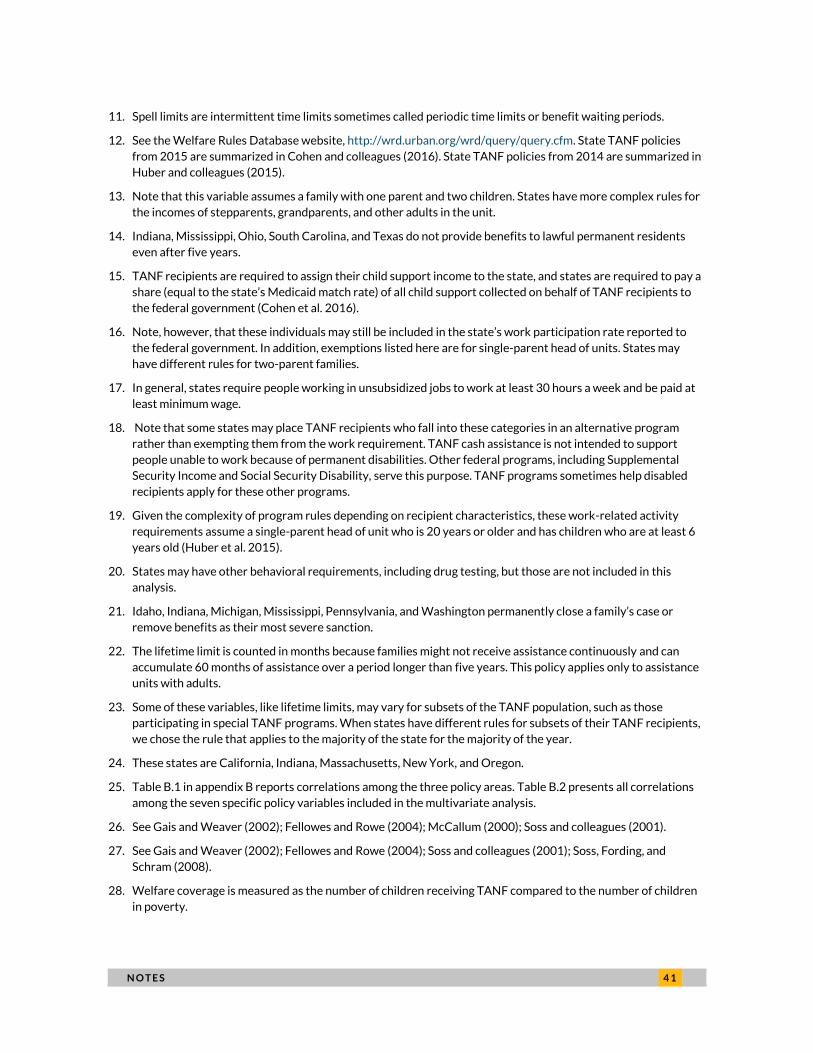
N O T E S 4 1
11. Spell limits are intermittent time limits sometimes called periodic time limits or benefit waiting periods.
12. See the Welfare Rules Database website, http://wrd.urban.org/wrd/query/query.cfm. State TANF policies
from 2015 are summarized in Cohen and colleagues (2016). State TANF policies from 2014 are summarized in
Huber and colleagues (2015).
13. Note that this variable assumes a family with one parent and two children. States have more complex rules for
the incomes of stepparents, grandparents, and other adults in the unit.
14. Indiana, Mississippi, Ohio, South Carolina, and Texas do not provide benefits to lawful permanent residents
even after five years.
15. TANF recipients are required to assign their child support income to the state, and states are required to pay a
share (equal to the state’s Medicaid match rate) of all child support collected on behalf of TANF recipients to
the federal government (Cohen et al. 2016).
16. Note, however, that these individuals may still be included in the state’s work participation rate reported to
the federal government. In addition, exemptions listed here are for single-parent head of units. States may
have different rules for two-parent families.
17. In general, states require people working in unsubsidized jobs to work at least 30 hours a week and be paid at
least minimum wage.
18. Note that some states may place TANF recipients who fall into these categories in an alternative program
rather than exempting them from the work requirement. TANF cash assistance is not intended to support
people unable to work because of permanent disabilities. Other federal programs, including Supplemental
Security Income and Social Security Disability, serve this purpose. TANF programs sometimes help disabled
recipients apply for these other programs.
19. Given the complexity of program rules depending on recipient characteristics, these work-related activity
requirements assume a single-parent head of unit who is 20 years or older and has children who are at least 6
years old (Huber et al. 2015).
20. States may have other behavioral requirements, including drug testing, but those are not included in this
analysis.
21. Idaho, Indiana, Michigan, Mississippi, Pennsylvania, and Washington permanently close a family’s case or
remove benefits as their most severe sanction.
22. The lifetime limit is counted in months because families might not receive assistance continuously and can
accumulate 60 months of assistance over a period longer than five years. This policy applies only to assistance
units with adults.
23. Some of these variables, like lifetime limits, may vary for subsets of the TANF population, such as those
participating in special TANF programs. When states have different rules for subsets of their TANF recipients,
we chose the rule that applies to the majority of the state for the majority of the year.
24. These states are California, Indiana, Massachusetts, New York, and Oregon.
25. Table B.1 in appendix B reports correlations among the three policy areas. Table B.2 presents all correlations
among the seven specific policy variables included in the multivariate analysis.
26. See Gais and Weaver (2002); Fellowes and Rowe (2004); McCallum (2000); Soss and colleagues (2001).
27. See Gais and Weaver (2002); Fellowes and Rowe (2004); Soss and colleagues (2001); Soss, Fording, and
Schram (2008).
28. Welfare coverage is measured as the number of children receiving TANF compared to the number of children
in poverty.
4 2 N O T E S
29. States are identified as conservative or liberal based on the share of state legislators who are Republican,
whether the governor is Republican, and the popular vote for Bill Clinton in the 1996 presidential election.
30. To limit the number of variables in the analysis, we included only one race variable. We chose the African
American share of state populations for consistency with prior literature.
31. “Annual Estimates of the Resident Population by Sex, Race, and Hispanic Origin for the United States, States,
and Counties: April 1, 2010 to July 1, 2012,” US Census Bureau, accessed May 18, 2017,
https://factfinder.census.gov/faces/tableservices/jsf/pages/productview.xhtml?src=bkmk.
32. Jens Manuel Krogstad and Kim Parker, “Public is Sharply Divided in Views of Americans in Poverty,” Pew
Research Center, Fact Tank (blog), September 16, 2014, http://www.pewresearch.org/fact-
tank/2014/09/16/public-is-sharply-divided-in-views-of-americans-in-poverty/.
33. See CSG (2008, 2009, 2010, 2011, 2012). The share of Democrats in state legislatures variable excludes
Nebraska, which holds nonpartisan elections and does not disclose the party of legislators.
34. Although we look at TANF policy variation for a single year (2014), many policies in effect that year may have
been established much earlier (any time between 1997 and 2014), so our analysis does not necessarily capture
conditions that existed at the time a given policy decision was made. However, the relative stability of TANF
policies over time, and particularly the stability of state rankings on policies relative to one another, suggests
that there are enduring conditions within states that make this aspect of our analysis less limiting.
35. The number of work activity exemptions is a count of zero to four, indicating how many of the following
exemptions the state allows: working in unsubsidized jobs, being ill or incapacitated, caring for an ill or
incapacitated person, and caring for a child under a certain age. States may have other work activity
exemptions that are not included, and some exemptions may only apply to certain types of recipients. The
exemptions included in our analysis are for single-parent head of units, and states may have different rules for
two-parent families. Initial sanctions are categorized into a binary variable. States that impose an initial
sanction of reduced benefits or that have no sanction or no work requirements (N/A) have a value of zero in
the binary version of this variable, and those that terminate benefits to the entire unit or close the case are
assigned a value of one.
36. See table B.1 in appendix B for the full results of the regression analysis.
37. See Lee and Yoon (2012); Mannix and Freedman (2013); Monnat (2010); Schram and colleagues (2009).
38. See Fein and Lee (1999); Hasenfeld, Ghose, and Larson (2004); Koralek (2000); Ong and Houston (2003);
Fording, Soss, and Schram (2011); Keiser, Mueser, and Choi (2004); Gais and Weaver (2002); Kalil, Seefeldt,
and Wang (2002); Pavetti and colleagues (2004); Wu and colleagues (2006); UIS (2000); Monnat (2010);
Gooden (2003); Lee and Yoon (2012).
39. See Bonds (2006); Freedman (2002); Gooden (1998); Marchevsky and Theoharis (2008); Richardson (2002).
40. As of July 2014.
41. Some policies that we classified included sanction severity and length, behavioral requirements, allowable
activities, activities exemptions, and so on.
42. See table 1 in Bloom, Loprest, and Zedlewski (2001).
43. States’ average rank within each policy umbrella was based on all of the policy variables described in the “State
TANF Policies” section, not just the seven policies included in the regression analysis.
R E F E R E N C E S 4 3
References Bentele, Keith G., and Lisa Thiebaud Nicoli. 2012. “Ending Access as We Know It: State Welfare Benefit Coverage in
the TANF Era.” Social Service Review 86 (2): 223–68.
Bloom, Dan, Pamela J. Loprest, and Sheila R. Zedlewski. 2011. “TANF Recipients with Barriers to Employment.”
Washington, DC: Urban Institute.
Bonds, Michael. 2006. “The Continuing Significance of Race: A Case Study of the Impact of Welfare Reform.”
Journal of African American Studies 4 (9): 18–31.
Cammisa, Anne Marie. 1998. From Rhetoric to Reform? Welfare Policy in American Politics. Boulder, CO: Westview
Press.
CBPP (Center on Budget and Policy Priorities). 2016a. Chart Book: TANF at 20. Washington, DC: Center on Budget
and Policy Priorities.
———. 2016b. “National and State TANF to Poverty Data: 1979 to 2014.” Washington, DC: Center on Budget and
Policy Priorities.
CSG (The Council of State Governments). 2008. The Book of the States 2008. Lexington, KY: CSG.
———. 2009. The Book of the States 2009. Lexington, KY: CSG.
———. 2010. The Book of the States 2010. Lexington, KY: CSG.
———. 2011. The Book of the States 2011. Lexington, KY: CSG.
———. 2012. The Book of the States 2012. Lexington, KY: CSG.
Cohen, Elissa, Sarah Minton, Megan Thompson, Elizabeth Crowe, and Linda Giannarelli. 2016. Welfare Rules
Databook: State TANF Policies as of July 2015. OPRE Report 2016-67. Washington, DC: US Department of
Health and Human Services, Administration for Children and Families, Office of Planning, Research and
Evaluation.
Falk, Gene. 2013. “The Temporary Assistance for Needy Families (TANF) Block Grant: A Primer on TANF Financing
and Federal Requirements.” Washington, DC: Congressional Research Service.
Fein, David J., and Wang S. Lee. 1999. “The ABC Evaluation: Carrying and Using the Stick: Financial Sanctions in
Delaware’s A Better Chance Program.” Cambridge, MA: Abt Associates.
Fellowes, Matthew C. and Gretchen Rowe. 2004. “Politics and the New American Welfare States.” American Journal
of Political Science 48 (2): 362–73.
Fording, Richard C., Joe Soss, and Sanford F. Schram. 2007. “Devolution, Discretion, and the Effect of Local Political
Values on TANF Sanctioning.” Social Service Review 81 (2): 285–316.
———. 2011. “Race and the Local Politics of Punishment in the New World of Welfare.” American Journal of Sociology
116 (5): 1610-1657.
Freedman, Henry A. 2002. “The Welfare Advocate’s Challenge: Fighting Historic Racism in the New Welfare
System.” Clearinghouse Review Journal of Poverty Law and Policy 36 (1–2): 31–38.
Gais, Thomas, and R. Kent Weaver. 2002. “State Policy Choices under Welfare Reform.” Washington, DC:
Brookings Institution.
Gilens, Martin. 1999. Why Americans Hate Welfare: Race, Media and the Politics of Antipoverty Policy. Chicago:
University of Chicago Press.
4 4 R E F E R E N C E S
Gooden, Susan T. 1998. “All Things Not Being Equal: Differences in Caseworker Support toward Black and White
Welfare Clients.” Harvard Journal of African American Public Policy 4: 23–33.
———. 2003. “Contemporary Approaches to Enduring Challenges: Using Performance Measures to Promote Racial
Equality Under TANF.” In Race and the Politics of Welfare Reform, edited by Sanford F. Schram, Joe Soss, and
Richard C. Fording, 254–75. Ann Arbor: University of Michigan Press.
Hahn, Heather, Gina Adams, Shayne Spaulding, and Caroline Heller. 2016. Supporting the Child Care and Workforce
Development Needs of TANF Families. Washington, DC: Urban Institute.
Hahn, Heather, Olivia Golden, and Peter Edelman. 2012. Strengthening TANF for States and Needy Families.
Washington, DC: Urban Institute.
Hallums, Melanie, and Maureen Lewis. 2003. Welfare, Poverty, and Racism: The Impact of Race on Welfare Reform.
Washington, DC: Lawyers’ Committee for Civil Rights Under Law.
Hasenfeld, Yeheskel, Toorjo Ghose, and Kandyce Larson. 2004. “The Logic of Sanctioning Welfare Recipients: An
Empirical Assessment.” Social Services Review 78 (2): 304–19.
Huber, Erika, Elissa Cohen, Amanda Briggs, and David Kassabian. 2015. Welfare Rules Databook: State TANF Policies
as of July 2014. OPRE Report 2015-81. Washington, DC: US Department of Health and Human Services,
Administration for Children and Families, Office of Planning, Research and Evaluation.
Isaacs, Julia. 2017. Unequal Playing Field? State Differences in Spending on Children in 2013. Washington: DC: Urban
Institute.
Kalil, Ariel, Kristin S. Seefeldt, and Hui-chen Wang. 2002. “Sanctions and Material Hardship under TANF.” Social
Service Review 76 (4): 642–62.
Keiser, Lael R., Peter R. Mueser, and Seung-Whan Choi. 2004. “Race, Bureaucratic Discretion, and the
Implementation of Welfare Reform.” American Journal of Political Science 48 (2): 14–27.
Koralek, Robin. 2000. “South Carolina Family Independence Program Process Evaluation: Conciliation and
Sanctioning.” Washington, DC: Urban Institute.
Lee, Kyoung Hag, and Dong Pil Yoon. 2012. “A Comparison of Sanctions in African American and White TANF
Leavers.” Journal of Evidence-Based Social Work 9 (4): 396–413.
Mannix, Mary R., and Henry A. Freedman. 2013. “TANF and Racial Justice”. Clearinghouse Review Journal of Poverty
Law and Policy 47 (5–6): 221–28.
Marchevsky, Alejandra, and Jeanne Theoharis. 2008. “Dropped from the Rolls: Mexican Immigrants, Race, and
Rights in the Era of Welfare Reform.” Journal of Sociology and Social Welfare 35 (3): 71–96.
McCallum, Heather. 1999. The Political and Ideological Foundations of Welfare Reform. Palo Alto, CA: Stanford
University.
Moller, Stephanie. 2002. “Supporting Poor Single Mothers: Gender and Race in the U.S. Welfare State.” Gender and
Society 16 (4): 465–84.
Monnat, Shannon. 2010. “The Color of Welfare Sanctioning: Exploring the Individual and Contextual Roles of Race
on TANF Case Closures and Benefit Reductions.” The Sociological Quarterly 51 (4): 678–707.
Neubeck, Kenneth, and Noel Cazenave. 2001. Welfare Racism: Playing the Race Card against America’s Poor.
Abingdon, UK: Routledge.
Ong, Paul, and Douglas Houston. 2003. “CALWORKS Sanction Patterns in Four Counties: A Technical Analysis.”
Oakland: University of California, California Policy Research Center, Welfare Policy Research Project.
R E F E R E N C E S 4 5
Pavetti, LaDonna, Michelle K. Derr, Gretchen Kirby, Robert G. Wood, and Melissa A. Clark. 2004. “The Use of TANF
Work-Oriented Sanctions in Illinois, New Jersey, and South Carolina: Final Report.” Washington, DC:
Mathematica Policy Research, Inc.
Pew Research Center. 2015. Beyond Distrust: How Americans View Their Government. Washington, DC: Pew
Research Center.
———. 2016. “A Wider Ideological Gap between More and Less Educated Adults.” Washington, DC: Pew Research
Center.
Richardson, Phil. 2002. “Depression and Other Mental Health Barriers Among Welfare Recipients – Results from
Three States.” Reston, VA: Maximus.
Schott, Liz, and Ife Floyd. 2017. “Policy Brief: How States Use Funds Under the TANF Block Grant.” Washington,
DC: Center on Budget and Policy Priorities.
Schram, Sanford F. 2005. “Contextualizing Racial Disparities in American Welfare Reform: Toward a New Poverty
Research.” Perspectives on Politics 3 (2): 253–68.
Schram, Sanford F., Richard C. Fording, Joe Soss, and Linda Houser. 2009. “Deciding to Discipline: Race, Choice, and
Punishment at the Frontlines of Welfare Reform.” American Sociological Review 74 (3): 398–422.
Skocpol, Theda. 1995. Social Policy in the United States: Future Possibilities in Historical Perspective. Princeton, NJ:
Princeton University Press.
Soss, Joe, Richard C. Fording, and Sanford F. Schram. 2008. “The Color of Devolution: Race, Federalism, and the
Politics of Social Control.” American Journal of Political Science 52 (3): 536–53.
Soss, Joe, Sanford F. Schram, Thomas P. Vartanian, and Erin O’Brien. 2001. “Setting the Terms of Relief: Explaining
State Policy Choices in the Devolution Revolution.” American Journal of Political Science 45 (2): 378–95.
UIS (University of Illinois at Springfield, Institute for Public Affairs). 2000. Illinois Study of Former TANF Clients: Final
Report. Chicago: Illinois Department of Human Services.
Wu, Chi-Fang, Maria Cancian, Daniel R. Meyer, and Geoffrey L. Wallace. 2006. “How Do Welfare Sanctions Work?”
Social Work Research 30 (1): 33−50.

4 6 A B O U T T H E A U T H O R S
About the Authors Heather Hahn is a senior fellow in the Center for Labor, Human Services, and
Population at the Urban Institute. Throughout her career, Hahn has conducted
nonpartisan research on the wide range of issues related to the well-being of children
and families, including cash assistance, nutrition assistance, and other supports for low-
income families.
Laudan Aron is a senior fellow in the Center on Labor, Human Services, and Population
at the Urban Institute. Since joining Urban in 1992, she has spent over 25 years
conducting research and policy analysis on a wide range of social welfare issues,
including health and disability, education, employment and training, homelessness, and
family violence.
Cary Lou is a research associate in the Center on Labor, Human Services, and
Population at the Urban Institute, focusing on policies related to poverty and
opportunity.
Eleanor Pratt is a research associate in the Center on Labor, Human Services, and
Population at the Urban Institute, where she works on projects centered on low-
income families. Her research focuses on the US social safety net, racial inequality, and
immigration.
Adaeze Okoli is a research assistant in the Center on Labor, Human Services, and
Population at the Urban Institute. Okoli is passionate about the intersection of data,
research, and policy to drive sustainable social change.
ST A T E M E N T O F I N D E P E N D E N C E
The Urban Institute strives to meet the highest standards of integrity and quality in its research and analyses and in
the evidence-based policy recommendations offered by its researchers and experts. We believe that operating
consistent with the values of independence, rigor, and transparency is essential to maintaining those standards. As
an organization, the Urban Institute does not take positions on issues, but it does empower and support its experts
in sharing their own evidence-based views and policy recommendations that have been shaped by scholarship.
Funders do not determine our research findings or the insights and recommendations of our experts. Urban
scholars and experts are expected to be objective and follow the evidence wherever it may lead.
2100 M Street NW
Washington, DC 20037
www.urban.org