Embed Size (px)
Citation preview
Why Don’t Merchant Ships Encounter Very Extreme Sea States (VESS) More Frequently?
Vincent J. Cardone, Andrew T. Cox, B. T. Callahan and Michael A. Morrone
Oceanweather Inc., Cos Cob, Connecticut
Val R. Swail Environment Canada, Toronto, Ontario,
Canada
Henry Chen Jeppesen Marine
Almeda, CA
This study is an abridgement of part of paper that will appear in International Journal of Climatology (2013).
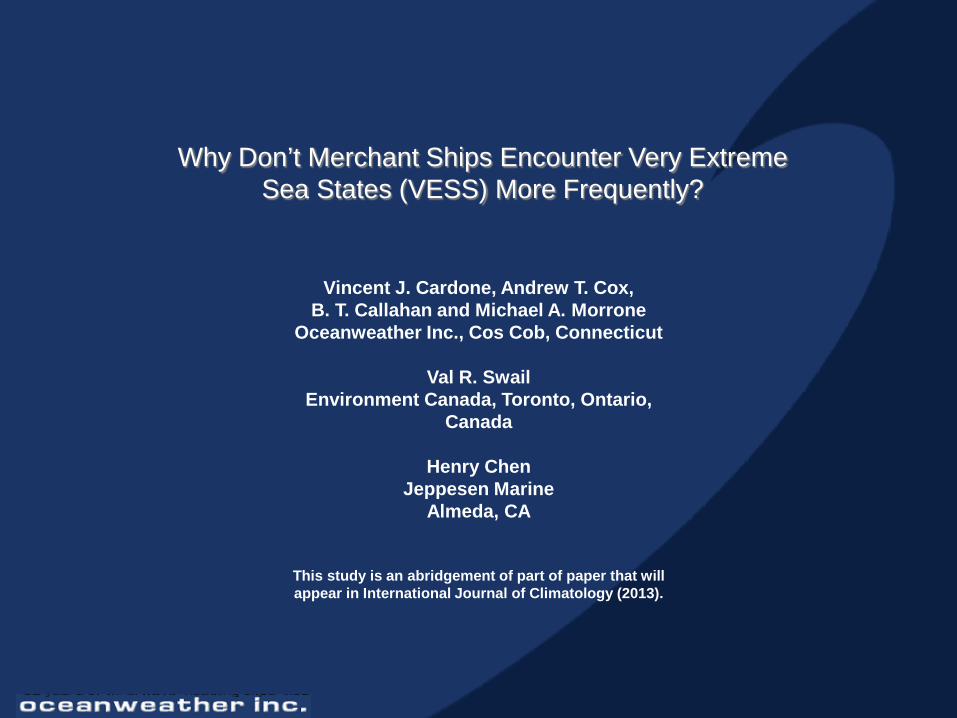
Motivation • GlobWave has revealed that our global
oceans produce copious “extreme” VESS occurrences (HS > 16 m) and up to at least HS ~ 20 m) especially in Northern Hemisphere basins occupied by most of the world’s shipping activity.
• A 16 m - 20 m HS sea state MIGHT harbor catastrophic rogue waves in the 32 m – 40 m + range (~ 120 feet) but almost all “heavy weather” ship accidents are reported in much lower peak sea states.
• GlobWave data validation of the GROW2012 hindcast in VESS range suggests that, in combination with a voyage simulator, TowSim, the probability may be estimated that a vessel plying a given route will encounter extreme VESS during its design lifetime (~25 years).

Methodology • Establish with aid of GlobWave, the skill in GROW2012 over the VESS
upper dynamic range of naturally occurring sea states generated in extratropical wave regimes (mainly “winter hurricanes”).
• Estimate residual small basin-dependent biases for the upper VESS thresholds studied in the continuous 33-year hindcast (0.5 m – 1.5 m)
• For nine indicative global shipping routes and transit speeds, use a voyage simulator to extract from the hindcast database the wind and wave encounter statistics. Adjust the probability distributions for the small residual biases in peak VESS.
• Assess the risk of a merchant vessel that does not avail itself of weather routing of encountering extreme VESS sea states.

GlobWave Altimeter Database
Background Information
• GlobWave provides a new, homogenized, quality controlled, single point of access database containing virtually the entire record of satellite altimeter HS and WS measurements acquired since 1991.
• The database is described in a general way in the Wave Data Handbook for GlobWave (Ash et al, 2011) with an in-depth description of the quality control and calibration of each of the missions by Queffeulou and Croize-Fillon (2010)
Table detailing each of the altimeter missions contained in GlobWave contained in documentation for database
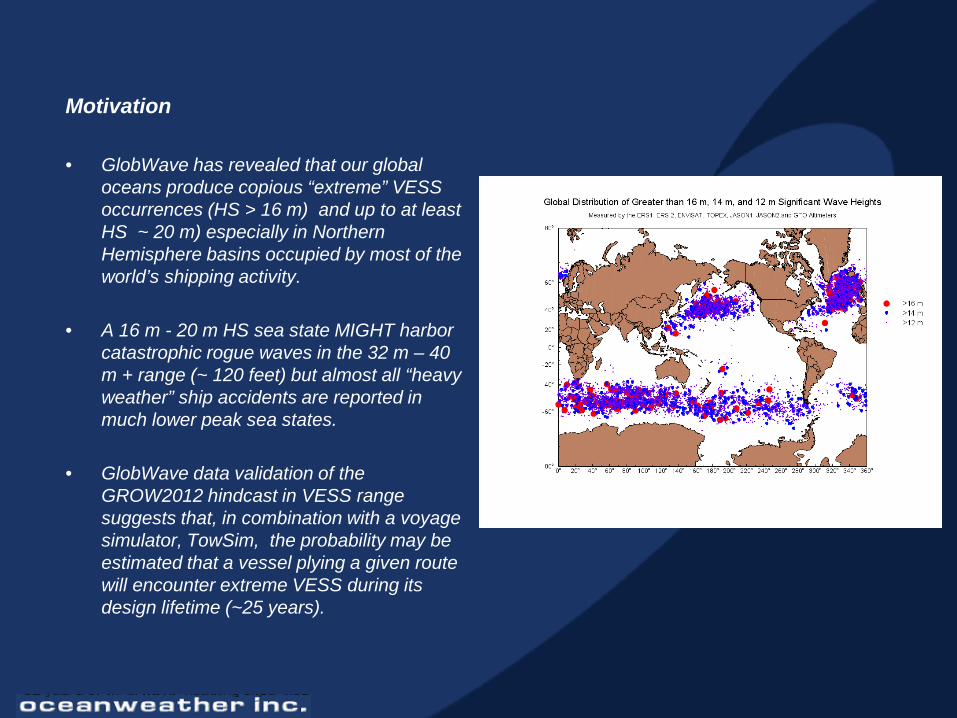
Our Latest GlobWave VESS Detection by Significant Wave Height This table gives orbit segment 1Hz peaks (counts and relative percentage
occurrence) sorted by basin for indicated HS thresholds. 1991-2010
- North Atlantic (NATL) has 26% occurrences of VESS versus 32% Southern Indian Ocean (SIND) despite NATL being a factor of three smaller than SIND!
- At 16 m threshold , North Atlantic ties Southern Indian Ocean - HS peaks ~ 20 m only seen in North Atlantic and North Pacific
- 5 samples of 5256 associated with tropical cyclones (poor detectability – negligible here)
Hs NATL %NATL NPAC %NPAC SATL %SATL SPAC %SPAC SIND %SIND TOTAL %TOTAL
>16 m 65 4.83 34 3.43 6 1.71 15 1.68 65 3.87 185 3.52
>14 m 310 23.05 222 22.38 58 16.57 138 15.49 318 18.95 1046 19.90
>12 m 1345 25.59 992 18.87 350 6.66 891 16.95 1678 31.93 5256 100.00
Maximum Hs (m) 20.24 20.63 16.57 17.51 18.84

What a VESS Storm Typically Looks Like and Comparison with New GROW 2012 Hindcast
From the global distribution of VESS, 185 peaks were discovered with Hs greater than or equal to 16 m. Using time series plots of altimeter data plotted against the output of GROW2012 as well as weather map sequences, these 185 peaks were found to be associated with 120 unique VESS storms. GlobWave scan found NATL storm of February 10, 2007 yielded highest 1Hz HS of 20.24 m, median filtered (over 50 km bin) of 18.95 m. GROW2012 peak is 18.33 m. Slight clipping of absolute orbit-segment VESS peaks typical and this bias varied by basin. More general validation of GROW2012 hindcast given this AM

Bias in New GROW 2012 Hindcast – Global Basis
Plot shows mean difference between GROW2012 and altimeter HS (below) in 1 m bins of 0.5 m width of satellite measurements over the full data range. WS diffs above. The mean HS difference is within +/- 0.5 m over the bins centered on 0.25 m up to 14.75 m, which is remarkable considering the tendency for previous continuous hindcasts driven by atmospheric reanalysis products to exhibit considerable negative bias at much lower HS thresholds. GROW2012 bias does not attain ~ 1.0 m until HS ~ 17 m and in the highest bin centered on 19 m, it is -1.75 m, or less than 10% of the signal level. Stratification of this bias by major basins indicates that at the highest sea states (HS > 16 m) the bias is least in the NPAC (~ 0.5 m), greater in the NATL (~ 1.0 m) and greatest in the Southern Oceans (~ 1.5 m). These small negative biases in GROW2012 in the upper VESS range are accounted for in the adjustment of the probability distrbutions produced the voyage simulator (TowSim) which are stratified into 0.5 m HS bins.

Voyage Simulations
TowSim is a simulator developed by Dr. Henry Chen originally to develop trans-ocean tow design criteria and was first applied with GROW2000. By adopting typical merchant vessel speeds along specific routes it can be used to simulate a lifetime of voyages. Map and table at right show 9 indicative routes simulated. Speed of 16 knots assumed for all with no allowance for speed reduction, ship responses or use of heavy weather avoidance algorithms considered. Each route specified by a departure port, an arrival port, and a set of way points with great circle or rhumb line navigation between each waypoint. A vessel departure is initiated every 6-hours for the 33 years (1979-2011) covered by the hindcast database, resulting in a total of up to 48,180 simulations if the full period and all months are simulated. The vessel sails along the prescribed route and along the way, environmental conditions (winds and waves only) are retrieved from the hindcast data base according to dead-reckoned positions every six hours.
Ports Distance
(Nmi) Speed (knts)
Time Hours
NORTH ATLANTIC OCEAN
Delaware Bay - Bishop Rock DB-BR 3122.8 16 195.2
Ambrose-Bishop Rock AM-BR 3071.8 16 192.0
Ambrose –Gibralter AM-GB 3180.9 16 198.8
NORTH PACIFIC OCEAN Busan – San Pedro
BU-SP 5292.2 16 330.8 Seattle-Yokohama
SE-YK 4348.2 16 271.8 Kao-Hsiung – Los Angeles
KH-LA 6168.3 16 385.5 SOUTHERN OCEAN
Rio de Janeiro Singapore
RO-SG 8134.6 16 508.4 Capetown - Melbourne
CP-ML 5484.7 16 342.8 Hobart – Valparaiso
HB-VP 5903.5 16 369.0

Sample Voyage Simulation Output
Sample bivariate distributions of HS and TP accumulated from the 6-hourly samples encountered over the entire ensemble of simulations for a given route and month of departure. These three routes that exhibited the most extreme monthly statistics. The granulation in sampled TP is a result of the wave model spectral resolution, which becomes rather coarse at higher frequencies. For NATL DB-BR route for January VESS sea states tend to be associated with TP in the range of about 14 -18 seconds. Sea states with TP > 20 seconds associated with low HS and hence probably “swell” sea states. For NPAC YK-SE route for January. there are considerably more TP > 20 second “swell” encounters, as expected for this much larger basin; however, VESS remain constrained to the TP range of ~ 14-18 sec.. For SIND CP-ML route for July, which is the most extreme route found for the Southern Oceans. There are a seen here a few cases of “swell” encounters with TP > 22 seconds.
.

Results Monthly Exceedance Probability (%) (MEP) for HS thresholds of 5 m, 8 m, 11 m and 14 m along nine trade
routes based on voyage simulations for 6-hourly departure through the 33-year GROW2012 global wave hindcast for the indicated “winter month”. Given the reliability over a wide dynamic range of HS in the GROW2012 hindcast as noted above, these probabilities did not need to be bias corrected. At the 5 m threshold, MEP is highest, at 44.78% in the SO along the route that ventures south of 45 degrees (Cape Town-Melbourne CP-ML). The highest MEP for 5 m HS in the NH is for the YK-SE (Yokohama-Seattle) rhumb line route at 35.43%, while in the NA MEP for 5 m threshold is greater for the DB-BR (Delaware Bay-Bishop rock) route at 29.12%. At the 11 m threshold, the MEP are approximately the same at ~ 1% for these same routes in each basin, but for the VESS threshold of 14 m, the highest MEP are in the NPAC and NATL routes exemplified above at about 0.1%. .
.
North
Atlantic North
Atlantic North
Atlantic North Pacific
North Pacific
North Pacific
Southern Ocean
Southern
Ocean
Southern Ocean
HS Threshold JAN
DB-BR
JAN
AM-BR
JAN
AM-GB JAN
BU-SP JAN
YK-SE JAN
KH-LA JUL
RO-SG
JUL
CP-ML JUL
HB-VP
>5 m 29.12 27.65 19.06 15.55 35.43 22.91 13.54 44.78 23.42
>8 m 5.95 5.18 2.91 1.70 5.71 3.38 1.07 6.80 2.80
>11 m 1.13 .89 .43 .15 1.05 .55 .13 .99 .24
>14 m .07 .05 .02 <.01 .09 .05 <.01 .04 <.01

North
Atlantic North
Atlantic North
Atlantic North Pacific
North Pacific
North Pacific
Southern Ocean
Southern
Ocean
Southern
Ocean
Month DB-BR AB-BR AB-GB BS-SP YK-SE KH-LA RO-SG CP-ML HB-VP
Jan 2.00 1.39 .42 .29 1.34 3.15 - .10 -
Feb 2.31 2.55 .54 .08 .51 3.11 - .35 .08
Mar 1.30 .61 .10 .10 1.12 1.52 - .56 .15
Apr .05 .13 - - .15 .35 - .88 .08
May - - - - - - .17 .66 .10
Jun - - - - - - .10 1.36 .28
Jul - - - - - - .07 1.54 .22
Aug - - - - - - .27 1.39 .15
Sep .05 .15 .08 - .38 .20 .08 1.26 .08
Oct .32 .22 .02 .10 .51 .76 - .61 -
Nov .98 .71 .20 .31 1.54 .93 .10 .25 .08
Dec 2.88 1.64 .29 .24 1.81 3.25 - .10 .07
Annual .82 .62 .14 .09 .61 1.11 .07 .76 .11
Monthly and annual probability of exceedance of voyage maximum HS > 14 m based on simulated voyages through the GROW2012 wave hindcast based on 6-hourly departures over 33 years for nine routes
Monthly exceedance probability of the single maximum peak sea state to be expected for a simulated voyage for any month (MEPm). Table at right gives this probability for HS > 14 m. The highest single MEPm are found in the NPAC along the KH-LA (Kao-Hsiung-Los Angeles) route for the months of Dec, Jan and Feb at slightly greater than 3%. The second most extreme route is the NATL DB-BR route with nearly 3% exceedance in Dec and greater than 2% for Jan and Feb. In no month and for no route in the SO does MEPm exceed 1.54% and this is for CP-ML in the month of July. Impression is that while the SO are more likely to present sea states that present operational challenges, a vessel is more apt to be exposed to dangerous sea states along NATL and NPAC mid and high latitude routes.

Summary • The GlobWave database of global satellite derived estimates of significant wave height (HS) and
surface marine wind speed from seven missions spanning the period August, 1991 – March, 2010, has been scanned and yielded over 5000 ocean basin specific orbit segments with peak HS > 12 m. This population may be subsequently distilled to a population of 120 individual storms (so-called VESS storms), in which there was at least one altimeter estimate of HS > 16 m.
• The highest HSs were observed in the Northern Hemisphere with ten orbits segments in the North Atlantic Ocean (NAO) with a peak HS of > 18 m followed by four segments in the North Pacific Ocean (NPO). Only three HS peaks > 18 m were seen in the entire Southern Oceans. Three of the > 5000 orbit segments had a peak HS greater than 20 m with the highest at 20.6 m. The number of VESS storms detected is greatest in the NAO (the smallest basin), a result that appears to be consistent with general circulation studies of extratropical cyclogenesis frequency and intensity in general atmospheric circulation models.
• A new continuous 33-year global wave hindcast (GROW2012) based on the new CFSR
atmospheric reanalysis wind field product appears to provide unbiased estimates of the probability of exceedance of VESS in extratropical storms and small-basin dependent biases (0.5 m to 1.5 m) of peak HS greater than ~16 m.

Summary (continued) • GROW2012 was, applied with a voyage simulator for nine trade routes to assess the risk of a
merchant vessel that does not avail itself of weather routing of encountering VESS sea states.
• The highest monthly exceedance probabilities (MEP) at the VESS threshold of 14 m are found in the NATL and NPAC at ~ 0.1% during winter months.
• The alternative statistical distribution of the monthly exceedance probability of the single maximum peak sea state to be expected for a voyage for any month (MEPm) shows that the highest MEPm is for the month of December in the NAO along the great circle route between the middle US East Coast and entrance to English Channel and in the NPO along the Yokohama – Seattle route, at about 3%.
Conclusions • The overall probability of a vessel encountering sea states that may contain waves capable of
catastrophic damage over a 33-year lifetime is small with mean number of hours of exposure to a vessel typically less than ~ 3 hours for six of the nine routes and a maximum of 10 hours for two of the routes.
• Still, consequences of cargo or vessel damage or loss are so catastrophic that the risk is lowered further by use of strategic route planning and on-route weather guidance.
• The World Meteorological Organization (WMO) coordinates well the efforts of the major international weather forecasting centers to ensure that marine forecast products available on a global basis to the maritime community to aid these efforts.
• Uncertainties in such forecast products may be addressed by utilizing ensembles of weather model forecasts.
• Skill of weather guidance stems from the great strides made in the past few decades in the ability of modern numerical weather prediction models (NWP) at the major NWP centers, to predict the tracks and intensity at horizons out to at least five days, of the class of storms , namely “winter hurricanes” responsible for most VESS , and the ability of advanced third-generation wave models to propagate that skill into reliable sea state predictions.

Work Ongoing
• Unbias the GROW2012 hindcast itself in extreme VESS storms (HS > 16 m) by reanalyzing kinematically wind fields of events identified through the GlobWave as well as analogous events that appear to satisfy the extreme VESS conceptual storm model presented at 12th Waves.
• Continue to pursue homogenization of GROW2012
Visible satellite image of the ERICA IOP 4 January 4, 1989 cyclone--the most intense winter cyclone ever measured in the central Atlantic. Image from www.wunderground.com