Embed Size (px)
Citation preview
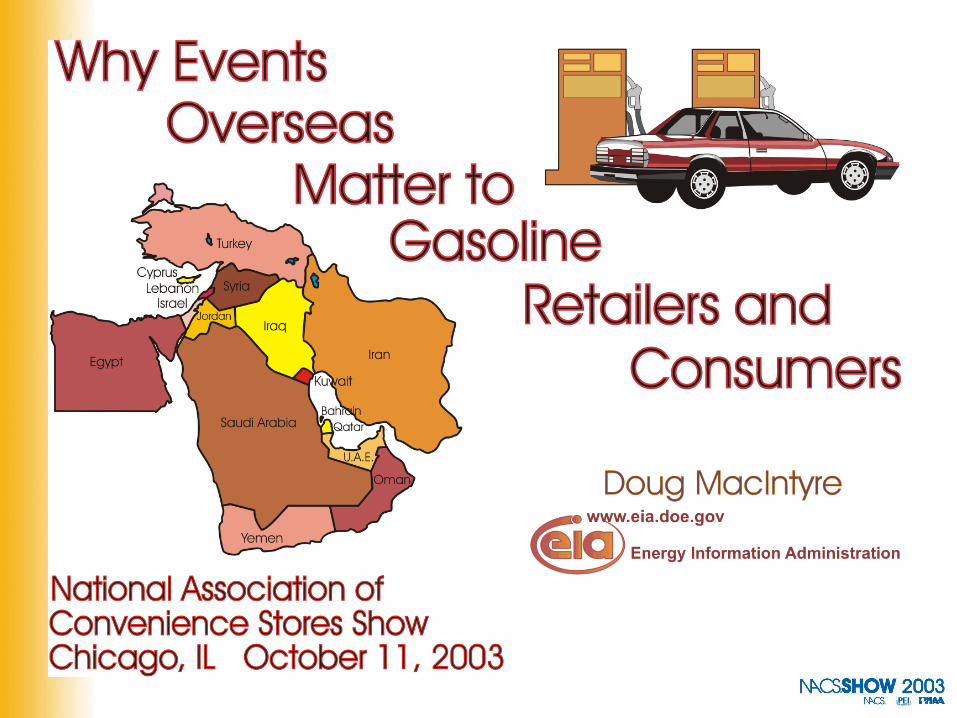
Why Events Overseas Matter to Gasoline Retailers and Consumers

WTI and Retail Gasoline Prices Generally Move In Unison
10
15
20
25
30
35
40
Jan
-00
Ap
r-00
Jul-
00
Oct
-00
Jan
-01
Ap
r-01
Jul-
01
Oct
-01
Jan
-02
Ap
r-02
Jul-
02
Oct
-02
Jan
-03
Ap
r-03
Jul-
03
Oct
-03
Do
llar
s P
er B
arre
l
100
125
150
175
Cen
ts p
er G
allo
n
Retail Gasoline Price
WTI Spot Price

What Comprises theGasoline Price?
43%
23%
26%
8%
Taxes
Distribution &Marketing Costsand Profits
Refining Costs andProfits
Crude Oil
Retail $1.62 August 2003
Spot Gasoline Price
Glo
bal
Reg
ion
al

Main Reasons BehindGasoline Price Spikes
• High Crude Oil Prices, and/or
• Regional Gasoline Infrastructure Problems, and/or
• High Demand with Low Inventories

Analysis of 3 Recent Gasoline Price Spikes
• Midwest Price Spike of 2001
• March 2003 Price Spike
• August 2003 Price Spike

Analysis of 3 Recent Gasoline Price Spikes
• Midwest Price Spike of 2001
• March 2003 Price Spike
• August 2003 Price Spike

Low Total OECD Oil Stocks* Keep Market Balance Tight
*Total includes commercial and government stocks.
3,400
3,500
3,600
3,700
3,800
3,900
4,000
4,100
Jan-94 Jan-95 Jan-96 Jan-97 Jan-98 Jan-99 Jan-00
Mil
lio
n B
arre
ls
Normal Actual
OECD Total Petroleum Inventories
Source: Energy Information Administration, April 2001.

OPEC 10 Production Cutin First Half of 2001
0
5 0
1 9 9
9 Q 1
2 0 0
1 Q 4
OPEC 10 (OPEC excluding Iraq) Iraq0
5 0
1 9 9 9 Q 1 2 0 0 1 Q 3
OPEC 10 (OPEC excluding Iraq) Iraq
0
5 0
1 9 9
9 Q 1
2 0 0
1 Q 4
OPEC 10 (OPEC excluding Iraq) Iraq
15
17
19
21
23
25
27
29
31
'98 Q1 '98 Q3 '99 Q1 '99 Q3 '00 Q1 '00 Q3 '01 Q1
Mill
ion
Ba
rre
ls p
er
Da
y
OPEC 10 Crude Oil Production Iraq
Source: Energy Information Administration.

Quarterly World Oil Demand Growth from Previous Year
0.0
0.2
0.4
0.6
0.8
1.0
1.2
1.4
1.6
1.8
2.0
1Q00 2Q00 3Q00 4Q00 1Q01 2Q01
Mil
lio
n B
arre
ls p
er D
ay
Source: Energy Information Administration.

Overview of Market Fundamentals• Tight balance in global petroleum market • Tight balance means low inventories• Low inventories mean upward price pressure
and potential for increased volatility• Exacerbating regional volatility factors
– Refinery system runs near maximum during summer
– U.S. distribution system showing signs of strain -- local ramifications
– Increasing distinct types of gasoline
• All of the above contributing to prices this year

Midwest RFG Prices RiseDue to Tight Supplies
0
20
40
60
80
100
120
140
160
180
Feb-1 Mar-1 Apr-1 May-1 Jun-1 Jul-1 Aug-1
Cen
ts P
er G
allo
n
Chicago RBOB Daily Spot Prices
20002001
Source: Reuters database.
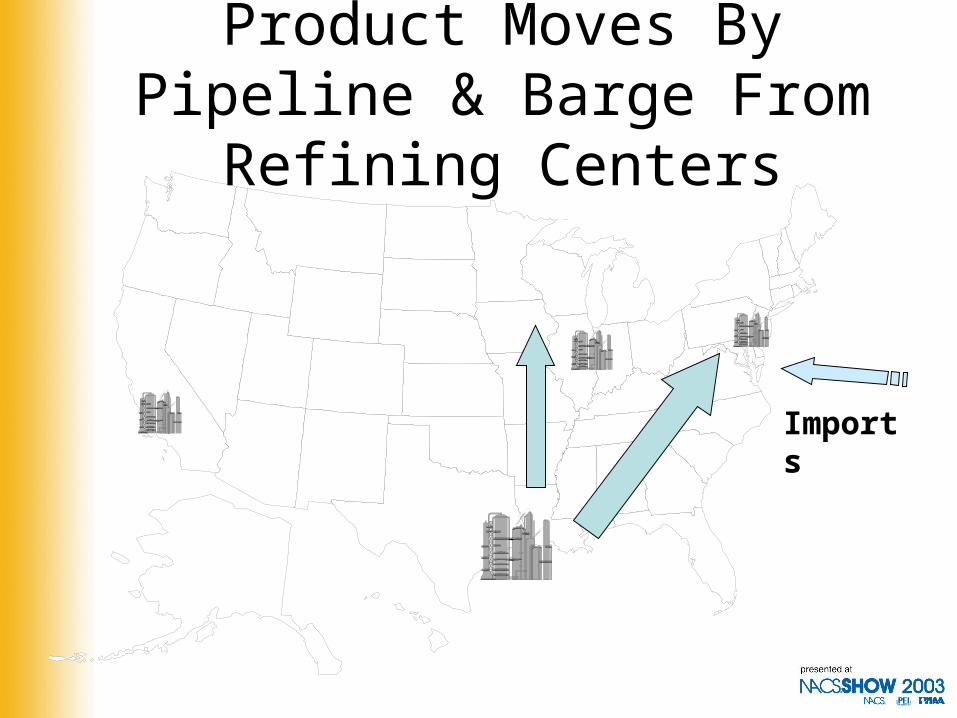
Product Moves By Pipeline & Barge From Refining Centers
Imports

Dependence on Distant Supply Can Increase Response Time
78%
28%
100%
22%
52%
16%
0%
25%
50%
75%
100%
Midwest East Coast Gulf Coast
Net Imports
Other USRegionalSupply
LocalProduction
Stock Draw
Typical July Supply as Percent of Demand
Source: Energy Information Administration.

Analysis of 3 Recent Gasoline Price Spikes
• Midwest Price Spike of 2001
• March 2003 Price Spike
• August 2003 Price Spike
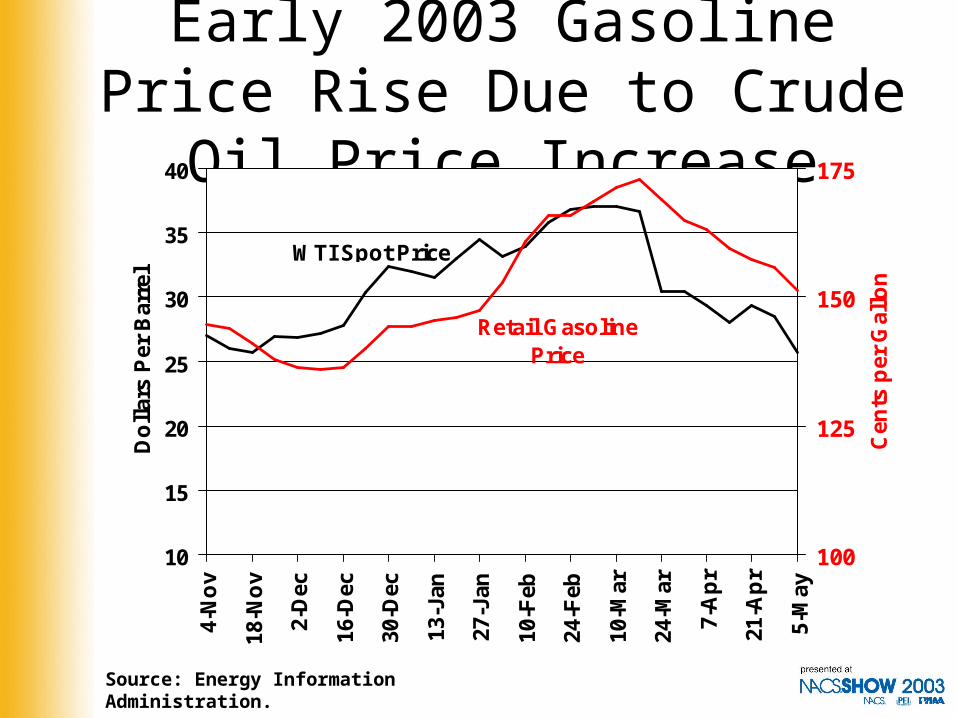
Early 2003 Gasoline Price Rise Due to Crude Oil Price Increase
10
15
20
25
30
35
40
4-N
ov
18-N
ov
2-D
ec
16-D
ec
30-D
ec
13-J
an
27-J
an
10-F
eb
24-F
eb
10-M
ar
24-M
ar
7-A
pr
21-A
pr
5-M
ay
Do
llar
s P
er B
arre
l
100
125
150
175
Cen
ts p
er G
allo
n
Retail Gasoline Price
WTI Spot Price
Source: Energy Information Administration.

OPEC 10 Production Much Lower in December and January
0
5 0
1 9 9
9 Q 1
2 0 0
1 Q 4
OPEC 10 (OPEC excluding Iraq) Iraq0
5 0
1 9 9 9 Q 1 2 0 0 1 Q 3
OPEC 10 (OPEC excluding Iraq) Iraq
0
5 0
1 9 9
9 Q 1
2 0 0
1 Q 4
OPEC 10 (OPEC excluding Iraq) Iraq
15
16
17
18
19
20
21
22
23
24
25
Oct '02 Nov '02 Dec '02 Jan '03
Millio
n B
arr
els
pe
r D
ay
Mar 2003 STEO Dec 2002 STEO
Sources: History: EIA; Projections: Short-Term Energy Outlook (STEO).

Crude Oil Production forVenezuela and Saudi Arabia
Sources: History: EIA; Projections: Short-Term Energy Outlook (STEO).
Venezuela Crude Oil Production
0.0
0.5
1.0
1.5
2.0
2.5
3.0
3.5
4.0
J-0
2
M-0
2
M-0
2
J-0
2
S-0
2
N-0
2
J-0
3
M-0
3
Mill
ion
Ba
rre
ls p
er
Da
y
Estimate Before VZ Strikes
6.0
6.5
7.0
7.5
8.0
8.5
9.0
9.5
10.0
J-0
2
M-0
2
M-0
2
J-0
2
S-0
2
N-0
2
J-0
3
M-0
3
Mill
ion
Ba
rre
ls p
er
Da
y
Saudi Arabia Crude Oil Production
Estimate Before VZ Strikes

2.3
2.4
2.5
2.6
2.7
2.8
2.9
Jan Feb Mar Apr May Jun Jul Aug Sep Oct Nov Dec
Bil
lio
n B
arre
ls
NOTE: Colored Band is Normal Stock Range
OECD Commercial Inventories
2003
Dec 2002 STEO
OECD Commercial Oil Stocks Remain Below Average in 2003
Source: International Energy Agency database, January 2003 andEIA’s Short-Term Energy Outlook, March 2003.

U.S. Crude Oil Inventories
260
270
280
290
300
310
320
330
340
350
360
Jan Feb Mar Apr May Jun Jul Aug Sep Oct Nov Dec
Mil
lio
n B
arre
ls
Crude Oil Lower Operational Inventory
NOTE: Colored Bands are Normal Stock Ranges
Sources: History: EIA; Projections: Short-Term Energy Outlook, March 2003.
2003

U.S. Total Gasoline Inventories
180
190
200
210
220
230
Jan Feb Mar Apr May Jun Jul Aug Sep Oct Nov Dec
Mil
lio
n B
arre
ls
Gasoline Lower Operational Inventory
NOTE: Colored Band is Normal Stock Range
Sources: History: EIA; Projections: Short-Term Energy Outlook, March 2003.
2003

Analysis of 3 Recent Gasoline Price Spikes
• Midwest Price Spike of 2001
• March 2003 Price Spike
• August 2003 Price Spike
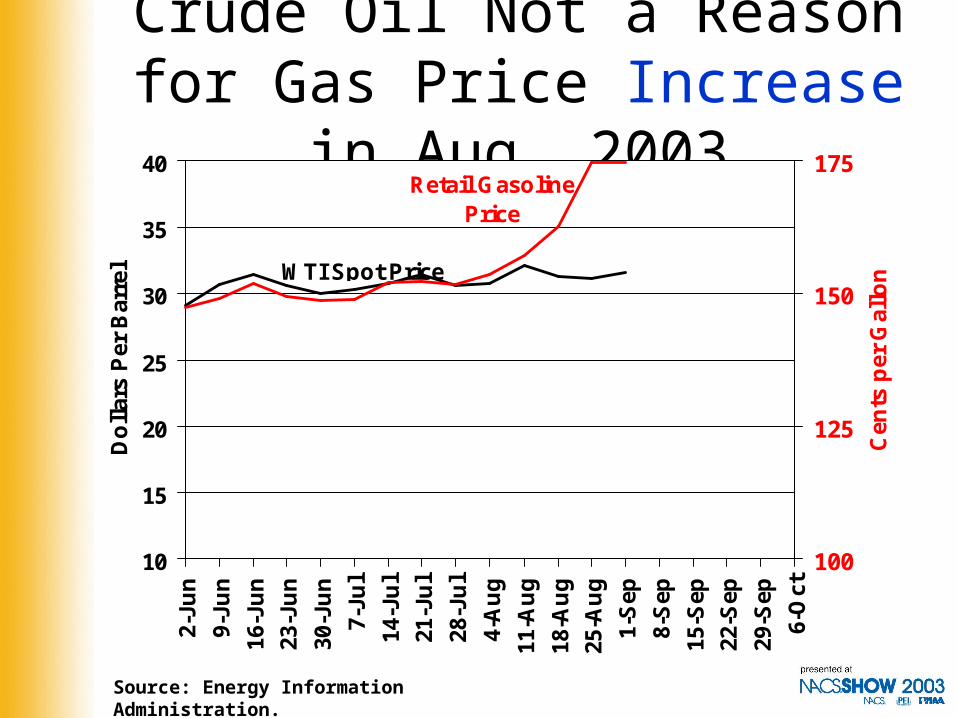
Crude Oil Not a Reason for Gas Price Increase in Aug. 2003
10
15
20
25
30
35
402-
Jun
9-Ju
n
16-J
un
23-J
un
30-J
un
7-Ju
l
14-J
ul
21-J
ul
28-J
ul
4-A
ug
11-A
ug
18-A
ug
25-A
ug
1-S
ep
8-S
ep
15-S
ep
22-S
ep
29-S
ep
6-O
ct
Do
llar
s P
er B
arre
l
100
125
150
175
Cen
ts p
er G
allo
n
Retail Gasoline Price
WTI Spot Price
Source: Energy Information Administration.

Reasons Behind August 2003 Gasoline Price Increase
• Tight Market– Record Gasoline Demand– Low Gasoline Inventories
• Refinery Outages– Due to Power Blackout in Midwest– California– East Coast
• Kinder-Morgan Pipeline Rupture in Arizona

Gasoline Refinery ProductionAcross Three Regions
0.8
1.0
1.2
1.4
1.6
1.8
2.0
2.26-
Jun
13-J
un
20-J
un
27-J
un
4-Ju
l
11-J
ul
18-J
ul
25-J
ul
1-A
ug
8-A
ug
15-A
ug
22-A
ug
29-A
ug
5-S
ep
12-S
ep
19-S
ep
26-S
ep
3-O
ct
Mil
lio
n B
arre
ls p
er D
ay
East Coast
West Coast
Midwest
Source: Energy Information Administration.

Gasoline Demand ReachedRecord Levels in August 2003
8
9
9
10
104
-Ja
n1
-Fe
b1
-Ma
r2
9-M
ar
26
-Ap
r2
4-M
ay
21
-Ju
n1
9-J
ul
16
-Au
g1
3-S
ep
11
-Oc
t8
-No
v6
-De
c3
-Ja
n3
1-J
an
28
-Fe
b2
8-M
ar
25
-Ap
r2
3-M
ay
20
-Ju
n1
8-J
ul
15
-Au
g1
2-S
ep
Mil
lio
n B
arr
els
pe
r D
ay
Source: Energy Information Administration.
180
190
200
210
220
230
240
Dec-99 Jun-00 Dec-00 Jun-01 Dec-01 Jun-02 Dec-02 Jun-03 Dec-03
Mil
lio
n B
arre
ls
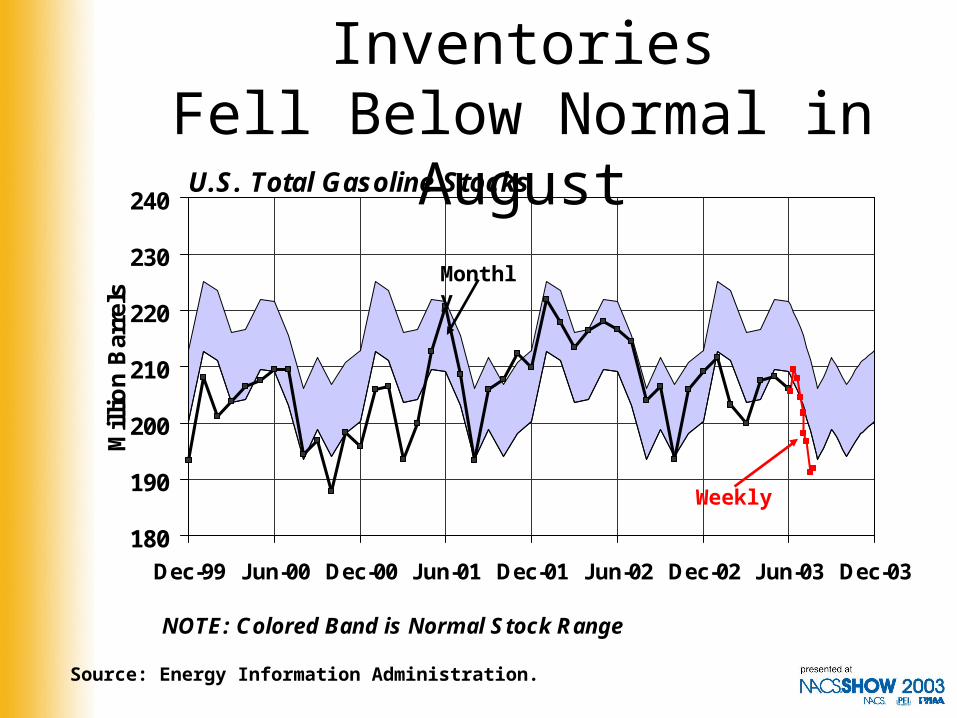
NOTE: Colored Band is Normal Stock Range
U.S. Total Gasoline Stocks
U.S. Gasoline InventoriesFell Below Normal in August
Monthly
Source: Energy Information Administration.
Weekly

Regular Gasoline Spot Prices
60
70
80
90
100
110
120
130
140
150
160
170
1/2/
2003
2/2/
2003
3/2/
2003
4/2/
2003
5/2/
2003
6/2/
2003
7/2/
2003
8/2/
2003
9/2/
2003
Cen
ts p
er G
allo
n
NYH RFGUSG Conv.Chi. Conv.LA CARBWTI c/gal
Source: Reuters database.

Gasoline Price Rise Varied Among Locations
Source: American Automobile Association
40.6
42.2
6.2
16.0
15.2
30.8
20.6
18.2
15.3
15.6
22.1
25.1
21.031.9
Numbers represent the difference, in cents per gallon, of the average price for retail regular gasoline between Aug. 29, 2003 and Aug. 1, 2003.

Important Web Sites
• From EIA– Gasoline and Diesel Fuel Update (Prices)– This Week In Petroleum– Weekly Petroleum Status Report– A Primer on Gasoline Prices (an EIA
Gasoline Brochure)
• AAA Prices by State and Locality– (http://www.aaanewsroom.net/Main.asp)