Embed Size (px)
Citation preview
FEDERAL RESERVE BANK OF SAN FRANCISCO
WORKING PAPER SERIES
Why Have Negative Nominal Interest Rates Had Such a Small Effect on Bank Performance? Cross Country Evidence
Jose A. Lopez
Federal Reserve Bank of San Francisco
Andrew K. Rose University of California, Berkeley
ABFER, CEPR, and NBER
Mark M. Spiegel Federal Reserve Bank of San Francisco
June 2018
Working Paper 2018-07
https://www.frbsf.org/economic-research/publications/working-papers/2018/07/
Suggested citation:
Lopez, Jose A., Mark M. Spiegel. 2018. “Why Have Negative Nominal Interest Rates Had Such a Small Effect on Bank Performance? Cross Country Evidence,” Federal Reserve Bank of San Francisco Working Paper 2018-07. https://doi.org/10.24148/wp2018-07 The views in this paper are solely the responsibility of the authors and should not be interpreted as reflecting the views of the Federal Reserve Bank of San Francisco or the Board of Governors of the Federal Reserve System.
Why Have Negative Nominal Interest Rates Had Such a Small Effect on Bank Performance? Cross Country Evidence
Jose A. Lopez, Andrew K. Rose, and Mark M. Spiegel* June 20, 2018
Abstract We examine the effect of negative nominal interest rates on bank profitability and behavior using a cross-country panel of over 5,100 banks in 27 countries. Our data set includes annual observations for Japanese and European banks between 2010 and 2016, which covers all advanced economies that have experienced negative nominal rates, including currency union members as well as both fixed and floating exchange rates countries. When we compare negative nominal interest rates with low positive rates, banks experience losses in interest income that are almost exactly offset by savings on deposit expenses and gains in non-interest income, including capital gains on securities and fees. We find heterogeneous effects of negative rates: floating exchange rates, small banks, and banks with low deposit ratios drive most of our results. Low-deposit banks have enjoyed particularly striking gains in non-interest income, likely from capital gains on securities. There have only been modest differences between high and low deposit-ratio banks’ changes in interest expenses; high deposit banks do not seem disproportionately vulnerable to negative rates. Overall, our results indicate surprisingly benign implications of negative rates for commercial banks thus far. Keywords: zero, effective, lower, bound, data, firm, empirical, regression, panel, deposit, size. JEL Classification Numbers: E43, G21 *Lopez is Vice President, FISC, Federal Reserve Bank of San Francisco ([email protected]); Rose is B.T. Rocca Jr. Professor, Haas School of Business, University of California, Berkeley, ABFER senior fellow, CEPR research fellow, and NBER research associate ([email protected]); Spiegel is Vice President, Economic Research, Federal Reserve Bank of San Francisco ([email protected]). Rebecca Regan and Ben Shapiro provided research assistance. The views expressed below do not represent those of the Federal Reserve Bank of San Francisco or the Board of Governors of the Federal Reserve System.
1
1. Introduction
Low interest rates around the world due to accommodative monetary policy regimes
have been a source of concern for the banking industry for some time. In the immediate wake
of the global financial crisis of 2007-09, policy rates in several advanced economies were
reduced to levels close to the so-called “zero lower bound.” This interest rate environment has
raised concerns that nominal deposit rates could not be reduced below zero without eroding
banks’ customer base. Accordingly, the low interest rate environment was viewed as an
obstacle to bank profitability due to narrowing interest rate margins [e.g. Jobst and Lin (2016)].
This claim has been confirmed empirically in the literature; for example, Borio, et al (2017)
found that bank profitability is reduced at low rates of interest and that the sensitivity of
profitability to rate reductions is enhanced as interest rates fall. Moreover, Borio and
Gambacorta (2017) found that bank lending becomes less responsive to reductions in policy
rates as they approach zero, suggesting that the financial channel of the monetary transmission
mechanism is weakened as interest rates approach zero.1
In any case, monetary policies in a substantial number of countries have, in fact, broken
through zero, and now have negative policy rates.2 Any arguments made for a weak monetary
transmission mechanism at low positive rates (due to the adverse implications for bank
profitability) should apply even more forcefully to negative nominal interest rates, as
1 Reductions in short-term interest rates have been shown to affect the characteristics of both borrowers [e.g. Bernanke and Gertler (1995)] and lenders [e.g. Kashyap and Stein (2000)], inducing increased lending activity [e.g. Bernanke and Blinder (1992) and Jiménez, et al (2012)]. 2 See Arteta, et al (2017) for a discussion of the motivation of central banks to move interest rates below the zero-lower bound.
2
adjustments in deposit rates hit a hard stop at the zero bound. In practice, banks have been
generally unwilling to charge negative nominal interest rates on deposits, especially for smaller
customers. Eggertson, et al (2017) make this argument and provide a theoretical foundation
for the special role of negative rates in disrupting the financial monetary transmission channel.
Their empirical evidence is based on aggregate data from five countries and the euro area as
well as bank-level data from Sweden. Rostagno, et al (2016) found that movements into
negative rates may induce lending by making it costlier for banks to hoard cash.
Several studies, reviewed below, have examined the implications of negative interest
rates for bank profitability and behavior; almost all use bank-level data for an individual country
or currency. Most studies conclude that responses at the bank level have mitigated the adverse
effect of negative rates on bank profitability and lending. Specifically, some banks have been
adept at increasing non-interest income (such as through increased fees), while others have
adjusted funding allocations so as to rely less on deposits. The nature of adjustments taken by
any individual bank has been shown to depend on both its business model and size, as both
influence a bank’s reliance on deposit funding as opposed to more market-based wholesale
funding.
A challenge with any study that relies on the experience of a single economy is that the
move to negative rates reflects prevailing economic conditions. This endogeneity makes it
difficult to identify any change in bank profitability and/or behavior that stems solely from
negative rates. In this paper, we move towards partially addressing this challenge by
considering a panel of cross-country data. Since different economies move to negative rates at
different times, this feature of the panel allows us to include fixed time effects to control for
3
responses to global conditions. Many have argued that global financial shocks – particularly
monetary policy shocks – have been particularly relevant during our sample period, e.g., Rey
(2015). Further, since some countries in our panel never experience negative nominal rates,
our work can be viewed as a difference-in-difference study; i.e., we compare banks in
economies that experienced negative rates (as opposed to those that did not), after policy rates
turned negative (as opposed to before). Local conditions are also likely to affect both bank
profitability and monetary policy. We respond to this econometric challenge by instrumenting
for negative policy rates with proxies for local conditions, using variables commonly associated
with conventional monetary rules, such as unemployment, GDP growth, the output gap, and
inflation.
Our sample includes annual income statements for 5,113 banks from the European
Union and Japan, between 2010 (before the advent of negative nominal rates) and 2016 (the
most recent period available), and includes observations (with gaps) for fourteen different
currencies, one of which is the 19-country Euro. Our sample also allows us to examine
countries that “go negative” at different times and for different reasons. Presumably,
movements into negative rates are different in floating exchange rate countries as opposed to
those with pegged exchange rates, since the latter respond more to foreign pressures that
might undermine the peg. We exploit this difference below by examining our results across
exchange rate regimes. More generally, our study differs from the existing literature in looking
at bank performance in a large set of banks from a variety of different monetary regimes. To
our knowledge, it is the first study that pools European and Japanese data on bank
performances at negative rates, providing substantial variability in the data. Moreover, our
4
sample includes a large number of banks, allowing us to analyze precisely the banks most
exposed to adverse effects from negative interest rates. Accordingly, we split our data into
sub-samples along two interesting dimensions: a) bank size, and b) reliance on deposits.
Our results suggest that bank profitability as a whole has, thus far, been unaffected by
negative nominal interest rates. We find no substantive effect on overall net income from
negative rates. These results are notable because relative to the existing literature, our sample
includes a relatively large share of small banks and banks that are more reliant on deposit
funding (i.e., high-deposit banks), both of which would be expected to be more exposed to
losses under negative interest rates.
While banks have generally experienced only negligible income effects, we find that
they suffer statistically significant losses in net interest income. More precisely, banks
experience statistically significant losses both on lending income and “other” interest income.3
These losses are mitigated somewhat by reductions in interest expenses, but not sufficiently to
avoid overall interest income losses. Notably, banks do not substantially reduce deposit
expenses, probably because most nominal deposit rates are sticky at zero. Large banks appear
to be more capable of adjusting their funding costs, as they achieve statistically significant
reduction in deposit expenses, while changes in small bank deposit expenses are insignificant.
To make up for losses on net interest income, banks have achieved significant gains in net non-
interest income; we find statistically significant increases in both fees and (especially) other
3 Other interest income is defined as interest income generated from all non-loan assets such as debt securities, trading book items, short-term funds, and investment securities, excluding insurance related interest.
5
non-interest income, such as capital gains and gains on securities and insurance. Large banks
also reduce other interest expenses more than their smaller counterparts.
Furthermore, we find that banks that rely relatively less on deposits (hereafter low-
deposit or “LD”), do better under negative interest rates than their high-deposit (HD)
counterparts; HD banks are more vulnerable to losses attributable to a zero-lower bound on
deposits than their LD counterparts. LD banks suffer bigger reductions in net interest income
but also receive larger increases in net non-interest income under negative rates.
2. A Brief Literature Review
As nominal interest rates in advanced economies have been low by historic standards
since the global financial crisis of 2007-09, it is unsurprising that a literature has examined bank
performance at low positive rates. Borio, et al (2017) find that bank profitability is reduced at
low interest rates, and that the sensitivity of profitability to rate reductions is enhanced as
interest rates fall; Borio and Gambacorta (2017) find that bank lending becomes less responsive
to reductions in policy rates as these approach zero. Delis and Kouretas (2011) find that bank
risk tolerance increases at low interest rates.
Bikker and Vervliet (2017) examine a panel of US banks from 2001-2015 and find that
bank profitability is reduced at low interest rates; the primary cause is reduced net interest
margins. They also find that American banks can maintain overall profitability under low rates
by adjusting on other margins, a result echoed below. Bikker and Vervliet speculate that
6
defaults drop under low rates, allowing banks to reduce provisioning for bad loans; they do not
find evidence of increased risk exposure.
A literature also examines bank behavior in economies that have experienced negative
nominal interest rates. Bech and Malkhozov (2016) study the movement into negative territory
by four central banks in Europe since 2014. They note that the transmission between policy
and money market interest rates is similar under negative and low positive rates, banks appear
loathe to charge negative deposit rates. Turk (2016) examines samples of Danish and Swedish
banks and finds that bank margins were roughly stable across the zero threshold; losses
experienced in interest income were offset by reductions in wholesale funding costs and
increased fees.
A number of studies examine negative rates and banking activity using micro data.
Heider, et al (2017) examine lending activity by 46 eurozone banks to a large number of
individual firms between 2013 and 2015. Relative to similar rate cuts with positive rates, they
find that the introduction of negative rates in the euro area in 2014 induced deposit-dependent
banks to cut lending, and to reallocate loans towards more risky firms. They deal with the
potential problem of monetary policy endogeneity by including industry-year and country-year
fixed effects. Nucera, et al (2017) examine 111 eurozone banks and find that negative rates
induced change in a bank’s propensity to become undercapitalized in a financial crisis, a
characteristic known as “SRisk”; smaller, more traditional banks exhibited a disproportionate
increase in riskiness relative to large banks, in response to interest rate cuts below zero.
7
Basten and Mariathasan (2018) examine 68 Swiss banks, using the share of excess
reserves as a proxy for exposure to negative rates. They find that banks with higher excess
reserves raised fees and interest income to compensate for negative liability margins. Banks
also adjusted liabilities, primarily through reductions in bond issuance, thus increasing maturity
mismatch.
Demiralp, et al (2017) examine data for 205 Euro area banks and find the portfolio
adjustments at negative rates differ by bank characteristic. Banks that rely heavily on deposit
funding extend more loans when rates are negative, investment banks adjust by reducing
excess liquidity, and wholesale banks raise the share of government bonds in their portfolios.
Demiralp, et al note that identifying the impact of negative rates is difficult because of the
confluence of other policies adopted by the ECB as it moved to negative rates.4 They respond
by asserting that a bank’s sensitivity to negative rates depend on its business model. They
further claim that banks will be more sensitive to negative rates the higher their excess
liquidity, as these assets particularly suffer from negative returns on excess reserves. Basten
and Mariathasan (2018) confirm that Swiss banks with greater initial excess reserves reduced
these more aggressively compared to banks with smaller holdings. For all these reasons, we
examine differences across bank types below, splitting banks by both size and reliance on
deposit funding.
4 For example, the movement into negative territory on June 2014 was shortly followed by the introduction of targeted long-term refinancing operations in September of that year, while subsequent rate cuts under negative values coincided with the introduction or the extension of the ECB asset purchase program, Demiralp, et al (2017).
8
3. The Data Set
Our data set consists of balance sheet and income statement variables for individual
banks between 2010 through 2016, taken from the Fitch Global Banking database. The
observations come from 28 European countries and Japan, thus covering a variety of monetary
regimes including monetary unions, exchange rate peggers, and inflation targeters. Our data
set begins two years before the onset of negative nominal interest rates and includes all
countries that experienced negative nominal interest rates through the end of our observations
in 2016.5, 6
Our data set differs from the existing literature primarily in two dimensions. First, we
include a variety of countries with different monetary regimes; these entered negative rates at
different points in time, if at all. During our sample, five economies experienced negative
nominal policy interest rates: Denmark, the EMU, Japan, Sweden, and Switzerland. Denmark
first crossed into negative rates in July 2012, while the Swiss interest rates have been most
negative (with rates on sight deposits at -0.75%).7 We also include similar countries that did
not go negative: Bulgaria, Czech Republic, Hungary, and the UK.8 This allows us to include time
5 We remove a number of categories of non-banks from the original Fitch data set, including: a) branches; b) bond banks; c) securities brokers; d) credit card banks; e) leasing subsidiaries; f) factor subsidiaries; and g) other brokerages.
6 Data on policy rates are taken from central bank websites for: the official British bank rate; the Bulgarian base rate; the 2-week Czech repo rate; the Danish certificate of deposit rate; the ECB deposit facility rate; the Estonian Talibor rate; the 3-month Hungarian base rate; the Japanese uncollateralized overnight call rate; the Latvian refinancing rate; the Lithuanian Vilibor overnight rate; the Swedish repo rate; and the Swiss 3-month LIBOR.
7 https://www.snb.ch/en/ifor/finmkt/operat/id/qas_gp_ums_2 and https://www.nationalbanken.dk/en/publications/Documents/2012/10/MON3Q_P1_2012_Negative%20Interest%20Rates.pdf .
8 Poland and Romania do not enter our sample since their nominal policy rates never fell low enough; we also exclude Croatia since it only entered the EU in 2013.
9
fixed effects to account for global economic conditions, and, more generally, employ a
difference-in-differences strategy, since not all our economies experienced negative rates, and
none for the entire sample.
The second difference from the literature is that, with over 5,100 banks and more than
30,00 observations, our data set is relatively large. The database allows us to examine closely
the effects of negative rates on banks that differ along several dimensions, such as size and
deposit-reliance. We identify a bank as large if its assets exceed $10 billion during the sample;
about an eighth of our banks are large. Similarly, we define a bank as high-deposit if its
deposits exceeded 75% of total funding at some point in the sample, as is true of four-fifths of
our sample.
Our data set has a few complications. One is that banks report information using
different (sometimes multiple) accounting methods. While we used bank-level fixed effects
throughout, we are interested in using as consistent a sample as possible. Towards that end,
when we have duplicate time series of banks reported in different accounting methods, we
drop the less-popularly-used method for the bank’s country. We also drop banks that use
accounting systems unconventional for their own country.9 Finally, we generally choose
unconsolidated observations, only reporting consolidated observations if unconsolidated are
unavailable. Our annual observations are typically reported in the fourth quarter, though our
Japanese banks report them in the first quarter. Since our data set also has suspicious outliers,
we typically truncate variables at the first and ninety-ninth percentiles, dropping the outliers (a
few exceptions to this rule are tabulated below).
9 We define an accounting method as unconventional if it is used in less than 10% of a country’s observations.
10
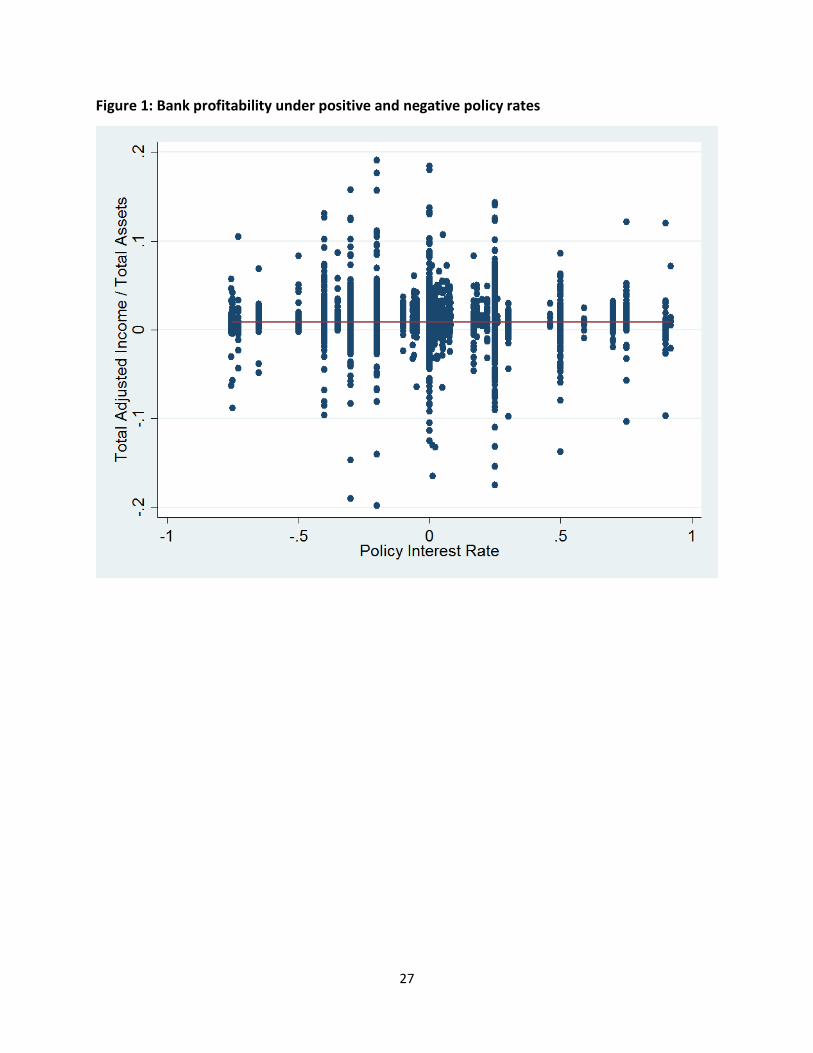
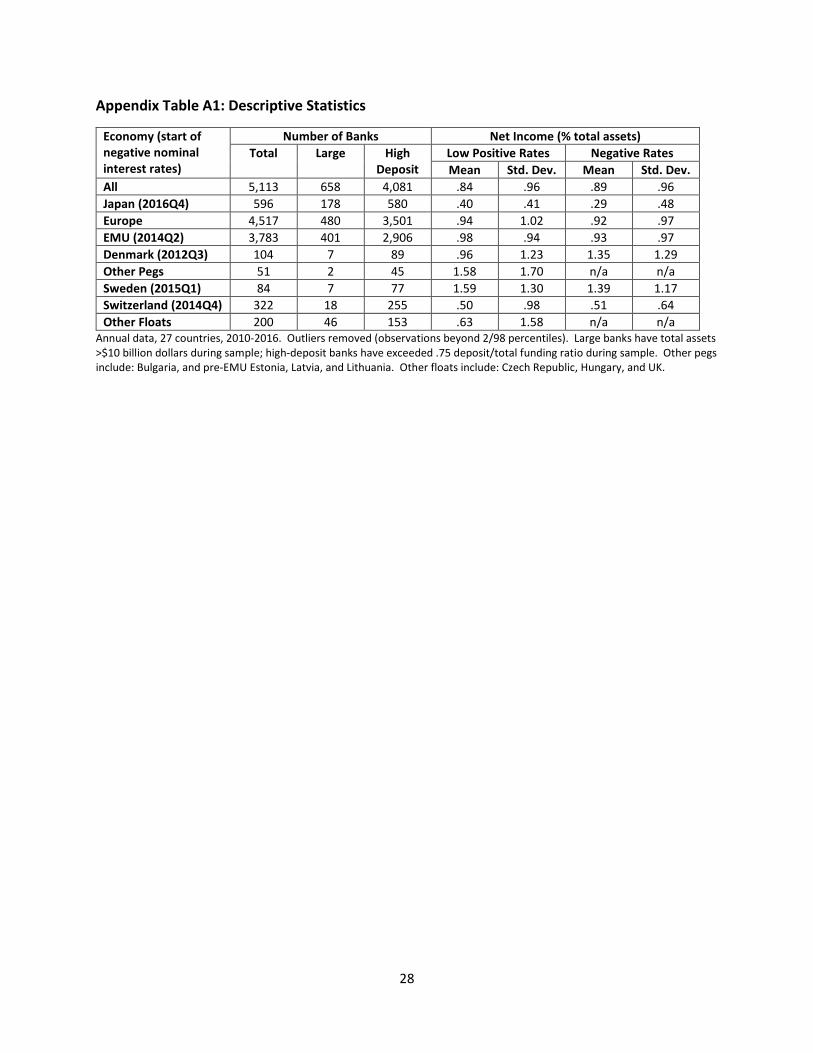
Descriptive statistics for our data set are tabulated in Appendix Table A1. At the right of
the table, we present mean values for bank income (measured as a percentage of total assets),
along with standard deviations. These are presented for nine different monetary regimes, in
rows. We compare bank profitability under negative and low positive nominal interest rates,
defining the latter as a policy rate that is within the [0, 1%) range (hereafter we refer to
“positive” rather than “low positive” rates, for the sake of brevity).10 Of the five economies
that experienced negative nominal interest rates, net income was, on average, higher under
positive rates for the EMU, Japan, and Sweden. However, the differences between positive and
negative rates were small, and both Danish and Swiss banks did slightly better with negative
rates. This impression is corroborated by Figure 1, which scatters bank profitability against the
policy rate. The fitted regression line has essentially no slope, suggesting little effect of interest
rates on bank profitability.
4. Bank profitability under negative rates
Our empirical strategy is to use a plain-vanilla approach, relying on the richness of our
data set rather than elaborate econometrics. Accordingly, we begin with a conventional least-
squares panel specification:
Yijt = βNEGIjt + {δi} + {θt} + εijt (1)
10 We use official policy rates to characterize nominal interest rates in this study, and these vary in term from overnight to three-months. In future research, we plan to repeat this study with a common-term market-based measure of prevailing interest rates.
11
where:
• Yijt is the dependent variable of interest for bank i in economy j for year t,
• NEGIjt is a binary variable which is one if country j had a negative nominal policy interest
rate during year t, and is zero if the nominal policy interest rate was low and positive,
meaning either zero or below 1% (observations with higher nominal rates are dropped),
• {δ} and {θ} are comprehensive sets of bank- and time-specific fixed effects, and
• ε represents a residual, assumed to be well-behaved.
The coefficient of interest to us is β, the average effect of negative (as opposed to low positive)
nominal interest rates on the dependent variable of interest. We use robust standard errors,
clustered by bank.
We are interested in a number of overall and disaggregated measures of bank
performance; we measure these as ratios of total assets.11 Also, we drop outliers of our
dependent variables, typically defining those as observations outside the (1, 99) percentiles of
the univariate distribution.12
Benchmark Results
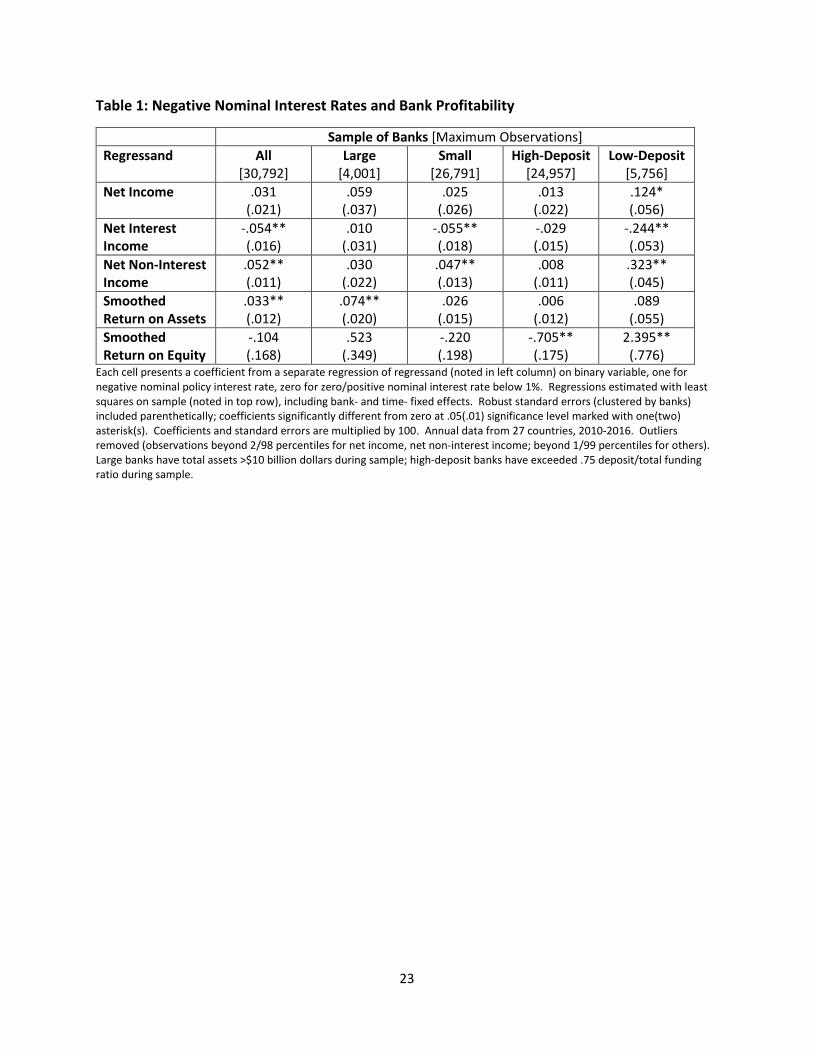
Our single most striking set of results can be seen in the top three cells at the left of
Table 1. This presents estimates of β (multiplied by 100 for ease of presentation), for five
11 We have confirmed that our results are insensitive to the use of earning assets – assets that are expected to earn an actual return and thus excluding accounting-related items - instead.
12 In the case of net income (fraction of total assets), we exclude values greater than 20% in absolute value.
12
different regressands estimated with (1). The top cell shows negative interest rates have had
an economically small – but positive – and statistically insignificant effect on bank net income,
compared with low positive rates. The cells underneath reveal that while net interest income
has fallen significantly by around 5.4 bp, this has been almost precisely offset by gains in net
non-interest income of 5.2 bp. These offsetting results suggest banks are reluctant to charge
their depositors negative rates, and are willing to endure losses from interest income, while
compensating these losses surprisingly well with gains from non-interest income.
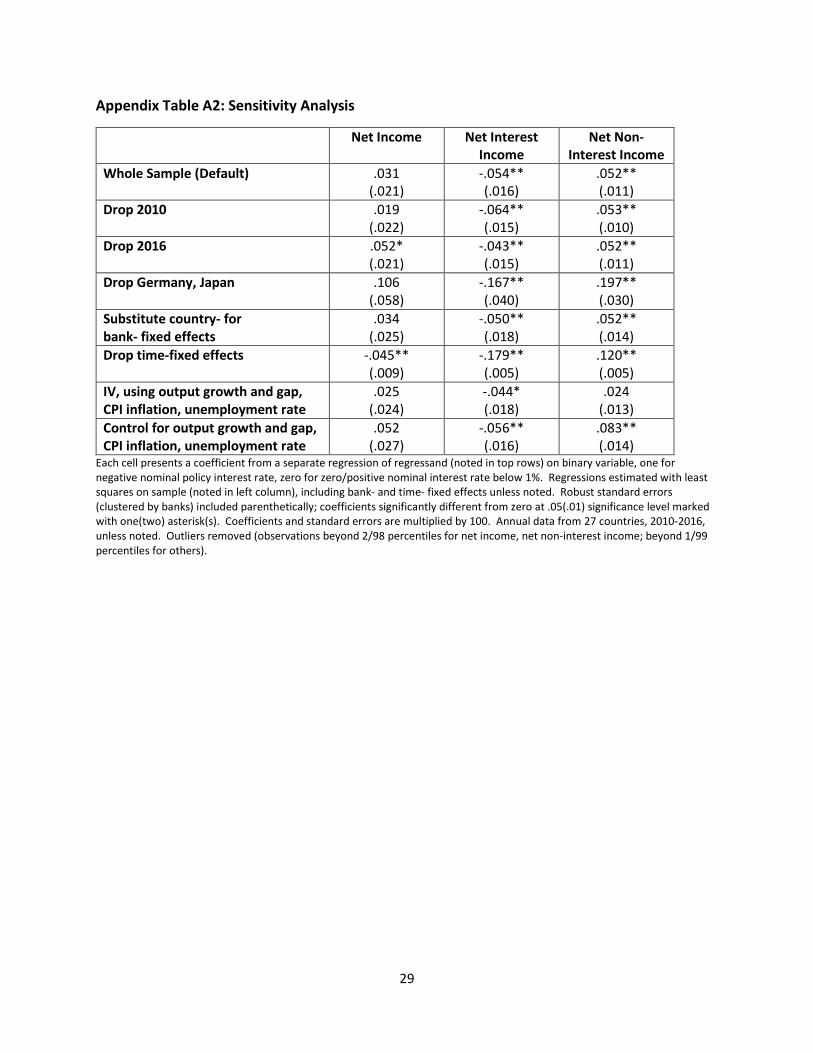
These results are robust to a variety of perturbations to our methodology, as
summarized in Appendix Table A2. In particular, it shows that the results are robust to a
number of perturbations to the methodology, including: a) dropping either the first (2010) or
last (2016) year of the sample; b) dropping Germany and Japan, the two biggest countries in the
sample; c) substituting country- for bank-specific fixed effects; d) dropping time fixed effects; e)
using four macroeconomic variables commonly used as determinants of Taylor monetary rules
(output growth, the output gap, CPI inflation, and the unemployment rate) as instrumental
variables for NEGI; and f) adding the same four variables to (1) as controls.13 In all cases, the
effect of negative nominal rates on net interest income remains negative and significant;
similarly, the effect on net non-interest income stays positive and is significant except for the IV
13 Inflation is measured as annual percent change by the IMF. Sources for the activity measures are unemployment from the IMF, output gap from the OECD, and GDP from the IMF. While these instruments are unlikely to satisfy their exclusion restrictions (poor macroeconomic conditions are associated with both negative rates and low profitability on bank lending), the direction of endogeneity should act against our headline result of a surprisingly benign impact on bank profitability from negative rates.
13
estimator. The effects of negative rates on aggregate net income remains insignificant except
for the unreliable estimator without time effects; we pursue that further below.14
While the left of Table 1 includes our entire sample of banks, columns to the right
disaggregate our sample by bank size and dependence on deposits. While, on average, banks
experience increases in net income when rates are negative, these are marginally significant
only for low-deposit banks. The reduction in interest income and offsetting rise in non-interest
income stems primarily from small and low-deposit banks; large and high-deposit banks seem
insignificantly affected by negative (as opposed to low positive) nominal interest rates.
The two rows at the bottom of Table 1 examine overall performance in terms of two
alternative measures of profitability. We examine both smoothed returns on assets (ROA,
defined as net income divided by average rather than year-end total assets), and smoothed
returns on equity (ROE, defined as net income divided by average common equity). The impact
of negative rates on ROA for all banks has a coefficient like that for net income, but is now
significantly positive, suggesting substantive noise in annual movements in total assets; the
same is true of large banks. Still, the ROA results indicate an even more positive picture of bank
fortunes under negative rates, especially for large banks. The effect of negative rates on ROE
are insignificant except for banks divided by depositor-dependence. LD banks experienced
marginally positive increases in total profitability, since they were able to increase non-interest
income more than their interest income fell. This shows up strikingly in the ROE results which
are significant and large for LD banks, quite the opposite of HD banks. Our point estimates of
14 We have also dropped subsidiaries and affiliates from our sample without substantively changing results.
14
these differences are substantial, with negative rates associated with a 71bp decline in
smoothed ROE for HD banks, and a 210 bp increase in smoothed ROE for LD banks.
To summarize, the overall effect on bank profitability of moving from low positive
nominal interest rates into negative territory seems negligible. But this masks two underlying
effects that offset each other; a decline in net interest income that is counterbalanced by an
improvement in bank non-interest income. Further, these results stem from smaller banks and
banks that depend comparatively less on deposits; large and high-deposit banks are less
affected.
To shed further light on the matter, we now explore further by decomposing the
components of interest and non-interest income.
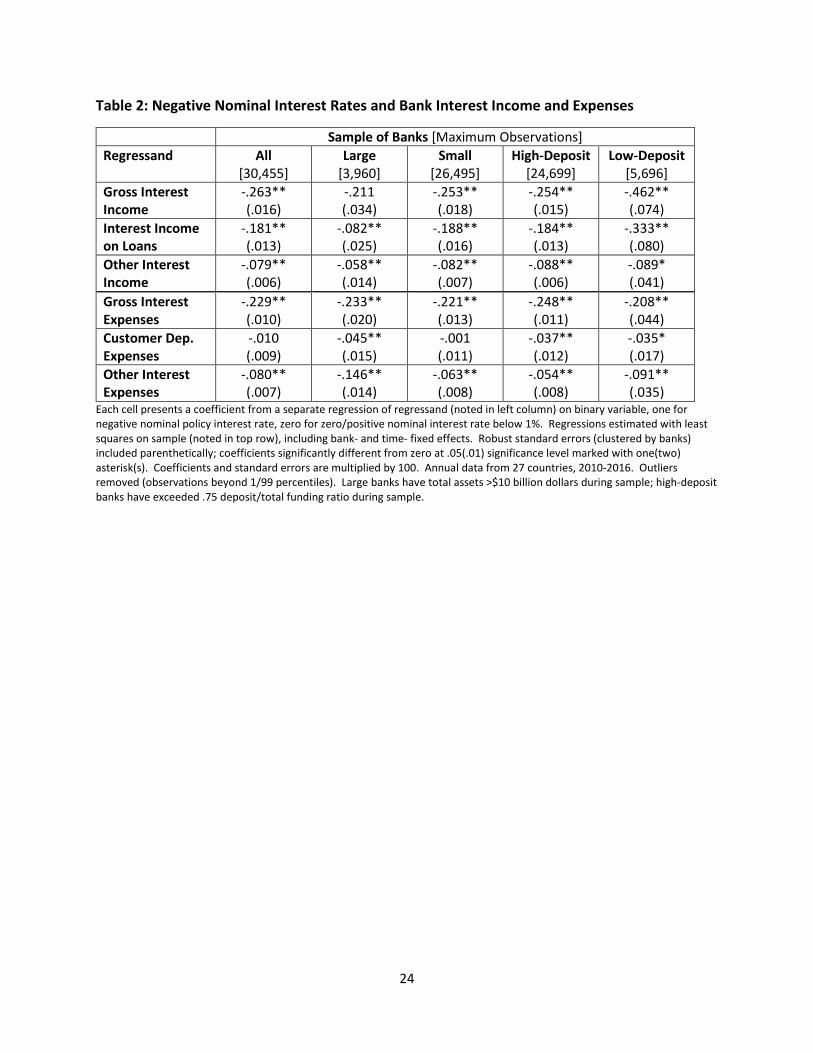
5. Decomposing net interest and non-interest income
Interest Income and Expenses
We begin by examining the components of net interest income further. Our results are
in Table 2. We first split net interest income into gross interest income and expenses. We then
further decompose gross interest income into interest income on loans and “other” interest
income, while splitting gross interest expense into spending on customer deposits and other
interest expenses.15
15 Other interest income is defined as (gross interest and dividend income - interest income on loans), while other interest expense is defined as (total interest expense - interest expenses on customer deposits). As always, all components of Table 2 are normalized by total assets.
15
When we examine the full sample of banks at the left of the table, both gross interest
income and expense show economically significant and statistically significant declines, but the
decline in expenses is smaller than that of income, resulting in the decline in net interest
income reported in Table 1. The decline in gross interest income is largest for loan income,
though other interest income also falls and both declines are significant. The only part of gross
interest expenses to decline significantly is not attributable to customer deposits. This all
matches conventional wisdom: banks suffer interest income losses under negative rates on
loans and are unable or unwilling to pass these losses fully on to their depositors; hence, bank
net interest income declines with negative interest rates.
The columns to the right of Table 2 show that large banks seem more nimble than
smaller banks. The large suffer smaller and statistically insignificant declines in gross interest
income and cut their expenses further, enabling them to avoid the losses on net income
suffered by small banks. LD banks suffer significantly greater losses in gross interest income,
especially income from loans. To help offset this decline in interest income, both LD and HD
banks lower their deposit expenses. However, LD banks lower other interest expenses more
since they are more reliant on other, market-based sources. Any differences between HD and
LD banks in terms of expenses are much smaller by way of comparison.
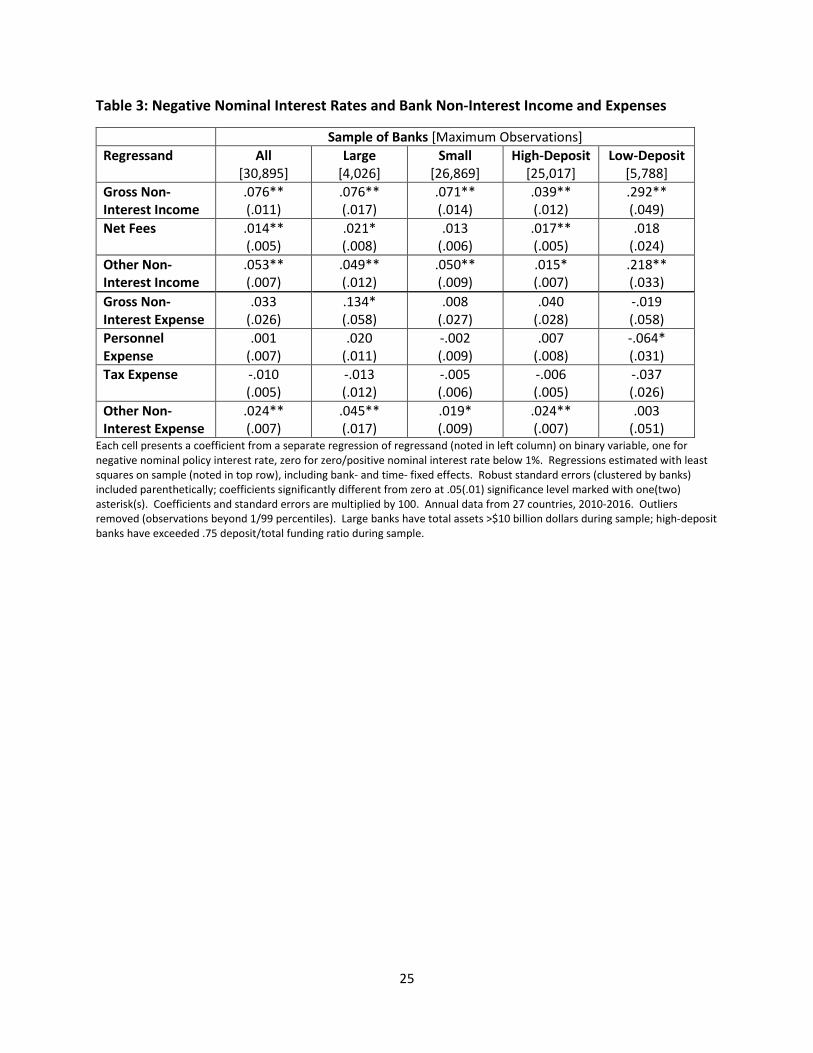
Non-Interest Income and Expenses
Our key result is that declines in bank net interest income are offset on average by
improvements in net non-interest income, so it is important to analyze the latter; our results
are in Table 3.
16
Tabulated at the left of Table 3 are results for the entire sample of banks. The increase
in net non-interest income stems from an increase in gross income rather than a decline in
expenses. The income increases come from two sources, both statistically significant: a) an
increase in net fees and b) improvements in other types of non-interest income such as capital
gains and gains on securities and insurance. By way of contrast, most non-interest expenses
are insignificantly different between negative and low positive interest rates, though “other
non-interest expenses,” including capital gains on securities and interest expenses, rise by a
statistically significant amount.)
There are few substantive differences between large and small banks in the components
of non-interest income and expenses. However, there are relatively large discrepancies across
HD and LD banks. While there are differences in our point estimates between HD and LD banks
for non-interest expenses, these are modest. The effect of negative interest rates on the
increase in gross non-interest income for LD banks is about ten times the size of that enjoyed by
HD banks, and most of this is the result of increases in non-fee income, which may reflect gains
on securities. These may in part be associated with unanticipated movements into negative
rates, suggesting that a monetary shock that moves rates into negative territory might be
benign due to immediate capital gains on bond holdings for LD banks, remaining under negative
rates may not be painless. As such, the medium-tern implications of negative rates may differ
from those we have observed so far.16
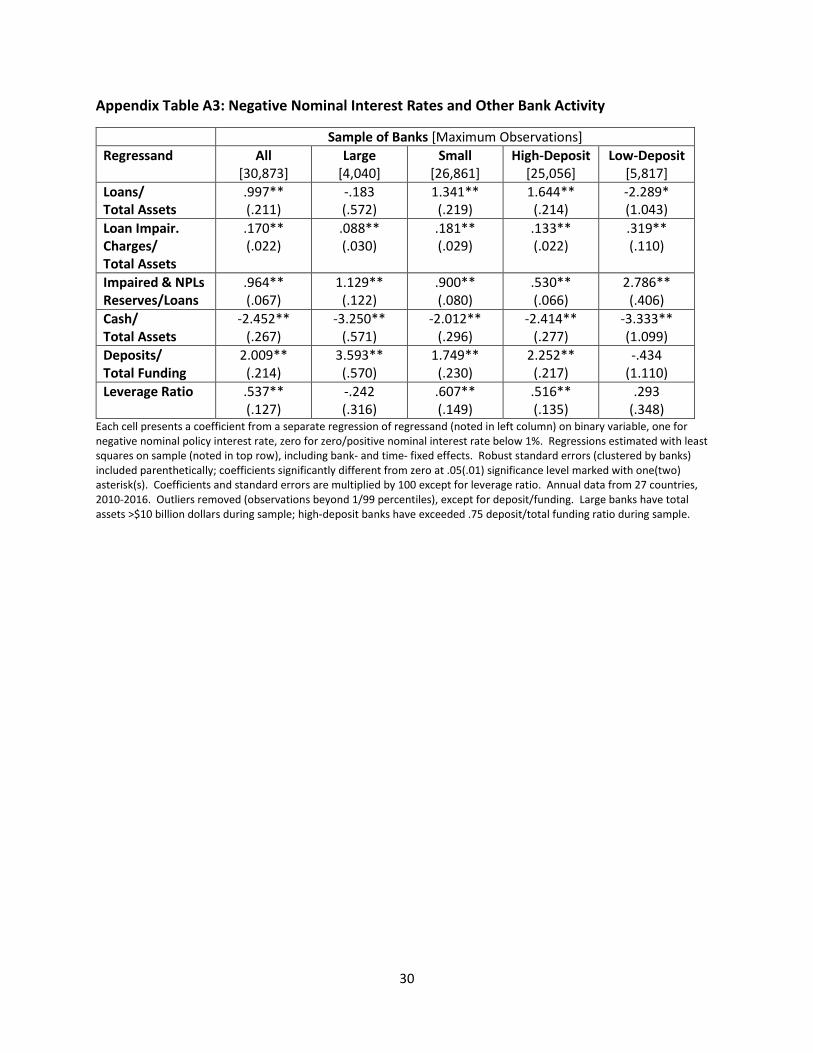
16 Appendix Table A3 provides more evidence of heterogeneous behavior across different types of banks. It uses the methodology of (1) to investigate six regressands of interest: a) loans, b) loan impairment charges; and c) cash, all expressed as fractions of total assets; d) impaired and non-performing loans, as a fraction of total loans; e) deposits as a fraction of total funding; and f) the leverage ratio. Negative nominal rates are associated with
17
6. Differences Across Monetary Regimes
One of the strengths of our data set is that it includes countries with three different
types of monetary regimes. A large number of countries were members of the European
Economic and Monetary Union (EMU); indeed, three Baltic countries joined EMU during the
sample. EMU is the largest economy to have experienced negative rates. Japan and several
European countries maintained floating exchange rates during the sample; of these, Japan,
Sweden and Switzerland (but not Czech Republic, Hungary or the UK) experienced negative
nominal interest rates. Finally, while Bulgaria and Denmark maintained fixed Euro exchange
rates (as did Estonia, Latvia and Lithuania prior to their EMU entries), only Denmark
experienced negative interest rates. In our analysis above, we have implicitly exploited this
panel variation across time and monetary regimes. In this section, we explore it directly, asking
how banks in different monetary regimes are affected by negative nominal interest rates.
We do this by estimating (1) for key measures of bank income statements variables but
restricting the sample to observations from a particular monetary regime. We focus on seven
different measures of bank performance, most importantly the three aggregate measures of
net income, net interest and net non-interest income. To provide a little more color into the
movement of these aggregates, we also look at four sub-components that provide particular
insights: gross interest income and income from loans, as well as gross non-interest income and
expenses.
substantive divergences of these ratios across type, both bank size and deposit-dependence. Investigating and understanding such differences is worthy of further research.
18
For each of measure of bank performance, we provide results for seven monetary
regimes in Table 4. First, we tabulate results at the left for the two biggest countries in our
sample, Japan and Germany (the latter a critical part of EMU). In both cases, we are unable to
control for time fixed effects, since these would be collinear with the key variable of interest
(NEGI).17 Excluding time effects means that all macroeconomic consequences for bank
performance from, e.g., monetary policy, are simply ignored. This is likely to give a distorted
impression, especially with respect to the precision of our estimates, so a strong note of caution
is appropriate. We provide these results for two reasons: a) to demonstrate the advantage of
using a cross-country panel; and b) as a comparison with the literature, which often uses banks
from a single monetary regime.
We have more confidence in the results to the middle and right of Table 4, since these
columns all exploit cross-country panel data, enabling us to include time fixed effects. We
provide five different sets of results, for: a) countries with exchange rates pegged to the Euro
(Bulgaria, Denmark, and the three Baltics before they joined EMU); b) peggers plus Eurozone
banks; c) European countries that maintained flexible exchange rates vis-à-vis EMU (Czech
Republic, Hungary, Sweden, Switzerland and the UK); d) flexers plus Eurozone banks; and e) all
economies with flexible exchange rates (essentially d) with the addition of Japanese banks).
The most striking aspect of the results in Table 4 is the heterogeneity across monetary
regimes. Consistent with the headline results of Table 1, none of the five panel estimates in the
top row of Table 4 are significantly different from zero (two are negative, and three are
17 The same issue would be present if we included banks from Eurozone countries other than Germany.
19
positive); that is, there is no substantive reliable effect of negative nominal interest rates on
bank profitability. This is in stark contrast to the unreliable national results tabulated at the
left, which indicate a significant decline in bank profits from negative nominal rates in both
Japan and Germany. This is the first indication that it is important to use a cross-country panel
approach to generate an estimate of the effect of negative nominal interest rates on bank
performance that is both reliable and general.
More evidence of the importance of the panel approach is apparent elsewhere in Table
4. Where there is a significant effect of negative rates on net interest income it is always
negative; likewise, all significant coefficients for net non-interest income are positive. But the
magnitudes of such effects vary substantially across monetary regimes. The effects of negative
nominal rates on sub-components of bank performance vary even more wildly. For instance,
the two panel estimates of gross interest (and loan) income effects for peggers are big and
positive, while the three for different sets of floating exchange rate countries are similar in
absolute value and negative. Similarly, the effects of negative nominal rates on gross interest
expenses differ substantively by monetary regime; they are large and positive for peggers, and
the opposite for floats. One can only discern the differences across monetary regimes by using
a panel which involves different countries.
To summarize, our key result – negative nominal interest rates only have a small overall
effect on bank profitability, since losses in interest income are offset by gains in non-interest
income – stems from economies with floating exchange rates.
20
7. Conclusion
This paper investigates the behavior of banks experiencing negative nominal interest
rates, using a large recent cross-country data set of bank income statements. To our
knowledge, this is the first study that examines a wide variety of banks under negative rates for
different monetary regimes. We find little overall impact of negative nominal rates on bank
profitability, compared with low positive rates. However, different components of income
respond significantly; a decline in net interest income is largely offset by increases in non-
interest income stemming from, e.g., increased fees and “other income” such as capital gains
on securities. The richness of our panel allows us to condition for global shocks, and to dis-
aggregate banks by both size and dependence on deposit-funding. Our key results are driven
by countries with floating (but not fixed) exchange rates, and banks that are either small or
have low deposit-dependence (or both).
Overall, our results suggest that banks fare relatively well under negative nominal
interest rates, compared to low positive rates. The considerable heterogeneity we find makes
us cautious to conclude that the financial channel of the monetary transmission mechanism
remains unchanged as policy rates cross zero. That is especially true since the positive returns
in “other non-interest income” enjoyed by banks under negative rates may well be
unsustainable if they are driven by the capital gains stemming from negative interest rate
surprises.
21
References
Arteta, Carlos, M. Ayhan Kose, Marc Stocker, and Temel Taskin, (2017), “Negative Interest Rate Policies: Sources and Implications,” Policy Research Paper 7791, World Bank, Washington DC.
Basten, Christoph, and Mike Mariathasan, (2018), “How Banks Respond to Negative Interest Rates: Evidence from the Swiss Exemption Threshold,” CESIFO Working Paper 6901-2018, February. Bech, M and A Malkhozov (2016): “How have central banks implemented negative policy rates?”, BIS Quarterly Review, March, pp 31–44. Bernanke, B. S., and M. Gertler, (1995), “Inside the Black Box: The Credit Channel of Monetary Bikker, Jacob and Tobias Vervliet, (2017), “Bank Profitability and Risk-Taking Under Low Interest Rates, DNB Working paper no. 560, July.
Borio, Claudio, and Leonardo Gambacorta, (2017), “Monetary policy and bank lending in a low interest rate environment: diminishing effectiveness?,” Journal of Macroeconomics, 54(B), 217-231.
Borio, Claudio, Leonardo Gambacorta, and Boris Hofmann, (2017), “The influence of monetary policy on bank profitability,” International Finance, 20, 48-63.
Demiralp, S., J. Eisenschmidt, and T. Vlassopoulos, (2017), “Negative Interest Rates, Excess Liquidity, and Bank Business Models: Banks’ Reaction to Unconventional Monetary Policy in the Euro Area, mimeo, February.
Eggertsson, Gauti, Ragnar E. Juelsrud, (2017), “Are Negative Nominal Interest Rates Expansionary?,” NBER Working Paper 24039, November.
Heider, Florian, Farzad Saidi, and Glenn Schepens, (2017), “Life Below Zero: Bank Lending Under Negative Policy Rates,” mimeo, January 14.
Jiménez, G., S. Ongena, J.-L. Peydró and J. Saurina, (2012), “Credit Supply and Monetary Policy: Identifying the Bank Balance-Sheet Channel With Loan Applications,” American Economic Review, 102, 2301–2326. Jobst, Andreas, and Huidan Lin, (2016), “Negative Interest Rate Policy (NIRP): Implications for Monetary Transmission and Bank Profitability in the Euro Area,” IMF Working Paper WP/16/172, August. Kashyap, A. K., and J. C. Stein, (2000), “What Do a Million Observations on Banks Say About the Transmission of Monetary Policy?” American Economic Review, 90, 407–428.
Nucera, Federico, Andre Lucas, Julia Schaumberg, and Bernd Schwaab, (2017), “Do Negative Interest Rates Make Banks Less Safe?,” Tinbergen Institute Discussion Paper TI 2017-041/IV,

22
Obstfeld, Maurice, Jay C. Shambaugh, and Alan M. Taylor, (2005), “The Trilemma in History: Tradeoffs Among Exchange Rates, Monetary Policies, and Capital Mobility,” The Review of Economics and Statistics, 87(3), 423-438. Rostagno, M, U Bindseil, A Kamps, W Lemke, T Sugo and T Vlassopoulos (2016): “Breaking through the zero line: the ECB’s negative interest rate policy”, Brookings Institution, Washington DC, 6 June. Turk R A (2016): “Negative Interest Rates: How Big a Challenge for Large Danish and Swedish Banks?”, IMF Working Paper no 198.
23
Table 1: Negative Nominal Interest Rates and Bank Profitability
Sample of Banks [Maximum Observations] Regressand All
[30,792] Large
[4,001] Small
[26,791] High-Deposit
[24,957] Low-Deposit
[5,756] Net Income .031
(.021) .059
(.037) .025
(.026) .013
(.022) .124* (.056)
Net Interest Income
-.054** (.016)
.010 (.031)
-.055** (.018)
-.029 (.015)
-.244** (.053)
Net Non-Interest Income
.052** (.011)
.030 (.022)
.047** (.013)
.008 (.011)
.323** (.045)
Smoothed Return on Assets
.033** (.012)
.074** (.020)
.026 (.015)
.006 (.012)
.089 (.055)
Smoothed Return on Equity
-.104 (.168)
.523 (.349)
-.220 (.198)
-.705** (.175)
2.395** (.776)
Each cell presents a coefficient from a separate regression of regressand (noted in left column) on binary variable, one for negative nominal policy interest rate, zero for zero/positive nominal interest rate below 1%. Regressions estimated with least squares on sample (noted in top row), including bank- and time- fixed effects. Robust standard errors (clustered by banks) included parenthetically; coefficients significantly different from zero at .05(.01) significance level marked with one(two) asterisk(s). Coefficients and standard errors are multiplied by 100. Annual data from 27 countries, 2010-2016. Outliers removed (observations beyond 2/98 percentiles for net income, net non-interest income; beyond 1/99 percentiles for others). Large banks have total assets >$10 billion dollars during sample; high-deposit banks have exceeded .75 deposit/total funding ratio during sample.
24
Table 2: Negative Nominal Interest Rates and Bank Interest Income and Expenses
Sample of Banks [Maximum Observations] Regressand All
[30,455] Large
[3,960] Small
[26,495] High-Deposit
[24,699] Low-Deposit
[5,696] Gross Interest Income
-.263** (.016)
-.211 (.034)
-.253** (.018)
-.254** (.015)
-.462** (.074)
Interest Income on Loans
-.181** (.013)
-.082** (.025)
-.188** (.016)
-.184** (.013)
-.333** (.080)
Other Interest Income
-.079** (.006)
-.058** (.014)
-.082** (.007)
-.088** (.006)
-.089* (.041)
Gross Interest Expenses
-.229** (.010)
-.233** (.020)
-.221** (.013)
-.248** (.011)
-.208** (.044)
Customer Dep. Expenses
-.010 (.009)
-.045** (.015)
-.001 (.011)
-.037** (.012)
-.035* (.017)
Other Interest Expenses
-.080** (.007)
-.146** (.014)
-.063** (.008)
-.054** (.008)
-.091** (.035)
Each cell presents a coefficient from a separate regression of regressand (noted in left column) on binary variable, one for negative nominal policy interest rate, zero for zero/positive nominal interest rate below 1%. Regressions estimated with least squares on sample (noted in top row), including bank- and time- fixed effects. Robust standard errors (clustered by banks) included parenthetically; coefficients significantly different from zero at .05(.01) significance level marked with one(two) asterisk(s). Coefficients and standard errors are multiplied by 100. Annual data from 27 countries, 2010-2016. Outliers removed (observations beyond 1/99 percentiles). Large banks have total assets >$10 billion dollars during sample; high-deposit banks have exceeded .75 deposit/total funding ratio during sample.
25
Table 3: Negative Nominal Interest Rates and Bank Non-Interest Income and Expenses
Sample of Banks [Maximum Observations] Regressand All
[30,895] Large
[4,026] Small
[26,869] High-Deposit
[25,017] Low-Deposit
[5,788] Gross Non-Interest Income
.076** (.011)
.076** (.017)
.071** (.014)
.039** (.012)
.292** (.049)
Net Fees .014** (.005)
.021* (.008)
.013 (.006)
.017** (.005)
.018 (.024)
Other Non-Interest Income
.053** (.007)
.049** (.012)
.050** (.009)
.015* (.007)
.218** (.033)
Gross Non-Interest Expense
.033 (.026)
.134* (.058)
.008 (.027)
.040 (.028)
-.019 (.058)
Personnel Expense
.001 (.007)
.020 (.011)
-.002 (.009)
.007 (.008)
-.064* (.031)
Tax Expense -.010 (.005)
-.013 (.012)
-.005 (.006)
-.006 (.005)
-.037 (.026)
Other Non-Interest Expense
.024** (.007)
.045** (.017)
.019* (.009)
.024** (.007)
.003 (.051)
Each cell presents a coefficient from a separate regression of regressand (noted in left column) on binary variable, one for negative nominal policy interest rate, zero for zero/positive nominal interest rate below 1%. Regressions estimated with least squares on sample (noted in top row), including bank- and time- fixed effects. Robust standard errors (clustered by banks) included parenthetically; coefficients significantly different from zero at .05(.01) significance level marked with one(two) asterisk(s). Coefficients and standard errors are multiplied by 100. Annual data from 27 countries, 2010-2016. Outliers removed (observations beyond 1/99 percentiles). Large banks have total assets >$10 billion dollars during sample; high-deposit banks have exceeded .75 deposit/total funding ratio during sample.
26
Table 4: Negative Nominal Interest Rates Effects Across Economies
Regressand Japan. [4,093]
German [11,096]
Euro. Pegs [723]
EMU, Euro. Pegs
[23,607]
Euro. Floats [3,195]
EMU, Euro. Floats
[26,079]
No Pegs [30,172]
Net Income -.122** (.008)
-.152** (.010)
.528 (.304)
.187 (.110)
-.067 (.069)
-.044 (.063)
.006 (.019)
Net Interest Income
-.203** (.006)
-.201** (.007)
.435 (.228)
.082 (.072)
-.329** (.044)
-.327** (.044)
-.075** (.015)
Net Non-Interest Income
.089** (.005)
.050** (.005)
.155 (.131)
.034 (.047)
.227** (.038)
.228** (.035)
.054** (.011)
Gross Interest Income
-.257** (.006)
-.916** (.007)
.955** (.153)
.270** (.060)
-.329** (.044)
-.456** (.043)
-.341** (.013)
Interest Income on Loans
-.196** (.005)
-.685** (.007)
1.04** (.13)
.278** (.050)
-.357** (.041)
-.382** (.041)
-.252** (.011)
Gross Non-Interest Income
-.119** (.008)
-.071** (.018)
.162 (.197)
.015 (.075)
-.099 (.106)
-.054 (.097)
.031 (.027)
Gross Interest Expenses
-.052** (.002)
-.714** (.005)
.557** (.094)
.115* (.046)
-.026 (.028)
-.145** (.027)
-.279** (.008)
Each cell presents a coefficient from a separate regression of regressand (noted in left column) on binary variable, one for negative nominal policy interest rate, zero for zero/positive nominal interest rate below 1%. Regressions estimated with least squares on sample (noted in top row), including bank- and time- fixed effects (bank effects only for Japan, Germany). Robust standard errors (clustered by banks) included parenthetically; coefficients significantly different from zero at .05(.01) significance level marked with one(two) asterisk(s). Coefficients and standard errors are multiplied by 100. Annual data, 2010-2016. Outliers removed (observations beyond 2/98 percentiles for net income, net non-interest income; beyond 1/99 percentiles for others). Large banks have total assets >$10 billion dollars during sample; high-deposit banks have exceeded .75 deposit/total funding ratio during sample.
27
Figure 1: Bank profitability under positive and negative policy rates
28
Appendix Table A1: Descriptive Statistics
Economy (start of negative nominal interest rates)
Number of Banks Net Income (% total assets) Total Large High
Deposit Low Positive Rates Negative Rates Mean Std. Dev. Mean Std. Dev.
All 5,113 658 4,081 .84 .96 .89 .96 Japan (2016Q4) 596 178 580 .40 .41 .29 .48 Europe 4,517 480 3,501 .94 1.02 .92 .97 EMU (2014Q2) 3,783 401 2,906 .98 .94 .93 .97 Denmark (2012Q3) 104 7 89 .96 1.23 1.35 1.29 Other Pegs 51 2 45 1.58 1.70 n/a n/a Sweden (2015Q1) 84 7 77 1.59 1.30 1.39 1.17 Switzerland (2014Q4) 322 18 255 .50 .98 .51 .64 Other Floats 200 46 153 .63 1.58 n/a n/a
Annual data, 27 countries, 2010-2016. Outliers removed (observations beyond 2/98 percentiles). Large banks have total assets >$10 billion dollars during sample; high-deposit banks have exceeded .75 deposit/total funding ratio during sample. Other pegs include: Bulgaria, and pre-EMU Estonia, Latvia, and Lithuania. Other floats include: Czech Republic, Hungary, and UK.
29
Appendix Table A2: Sensitivity Analysis
Net Income Net Interest Income
Net Non-Interest Income
Whole Sample (Default) .031 (.021)
-.054** (.016)
.052** (.011)
Drop 2010 .019 (.022)
-.064** (.015)
.053** (.010)
Drop 2016 .052* (.021)
-.043** (.015)
.052** (.011)
Drop Germany, Japan .106 (.058)
-.167** (.040)
.197** (.030)
Substitute country- for bank- fixed effects
.034 (.025)
-.050** (.018)
.052** (.014)
Drop time-fixed effects -.045** (.009)
-.179** (.005)
.120** (.005)
IV, using output growth and gap, CPI inflation, unemployment rate
.025 (.024)
-.044* (.018)
.024 (.013)
Control for output growth and gap, CPI inflation, unemployment rate
.052 (.027)
-.056** (.016)
.083** (.014)
Each cell presents a coefficient from a separate regression of regressand (noted in top rows) on binary variable, one for negative nominal policy interest rate, zero for zero/positive nominal interest rate below 1%. Regressions estimated with least squares on sample (noted in left column), including bank- and time- fixed effects unless noted. Robust standard errors (clustered by banks) included parenthetically; coefficients significantly different from zero at .05(.01) significance level marked with one(two) asterisk(s). Coefficients and standard errors are multiplied by 100. Annual data from 27 countries, 2010-2016, unless noted. Outliers removed (observations beyond 2/98 percentiles for net income, net non-interest income; beyond 1/99 percentiles for others).
30
Appendix Table A3: Negative Nominal Interest Rates and Other Bank Activity
Sample of Banks [Maximum Observations] Regressand All
[30,873] Large
[4,040] Small
[26,861] High-Deposit
[25,056] Low-Deposit
[5,817] Loans/ Total Assets
.997** (.211)
-.183 (.572)
1.341** (.219)
1.644** (.214)
-2.289* (1.043)
Loan Impair. Charges/ Total Assets
.170** (.022)
.088** (.030)
.181** (.029)
.133** (.022)
.319** (.110)
Impaired & NPLs Reserves/Loans
.964** (.067)
1.129** (.122)
.900** (.080)
.530** (.066)
2.786** (.406)
Cash/ Total Assets
-2.452** (.267)
-3.250** (.571)
-2.012** (.296)
-2.414** (.277)
-3.333** (1.099)
Deposits/ Total Funding
2.009** (.214)
3.593** (.570)
1.749** (.230)
2.252** (.217)
-.434 (1.110)
Leverage Ratio .537** (.127)
-.242 (.316)
.607** (.149)
.516** (.135)
.293 (.348)
Each cell presents a coefficient from a separate regression of regressand (noted in left column) on binary variable, one for negative nominal policy interest rate, zero for zero/positive nominal interest rate below 1%. Regressions estimated with least squares on sample (noted in top row), including bank- and time- fixed effects. Robust standard errors (clustered by banks) included parenthetically; coefficients significantly different from zero at .05(.01) significance level marked with one(two) asterisk(s). Coefficients and standard errors are multiplied by 100 except for leverage ratio. Annual data from 27 countries, 2010-2016. Outliers removed (observations beyond 1/99 percentiles), except for deposit/funding. Large banks have total assets >$10 billion dollars during sample; high-deposit banks have exceeded .75 deposit/total funding ratio during sample.