Embed Size (px)
Citation preview

Why Hydrogen?
The solution for real problems
Mark Crowther
Director
GASTEC at CRE
29th Feb 2012

1) The world is not short of renewable energy – 6,200 km2 of Sahara desert would produce all UK final energy needs
2) The world does require an energy vector – reliable and modestly priced to move this energy from its point of
production/capture and transfer it to the consumer when it is required
3) Historically, storage has enabled transparent markets - the separation of production from use improves the efficiency of both
4) Ideally the vector should not be poisonous, or of short life
5) Ideally no greenhouse gas emissions at point of use
ASSERTIONS:
© GASTEC at CRE a trading division of Kiwa Ltd
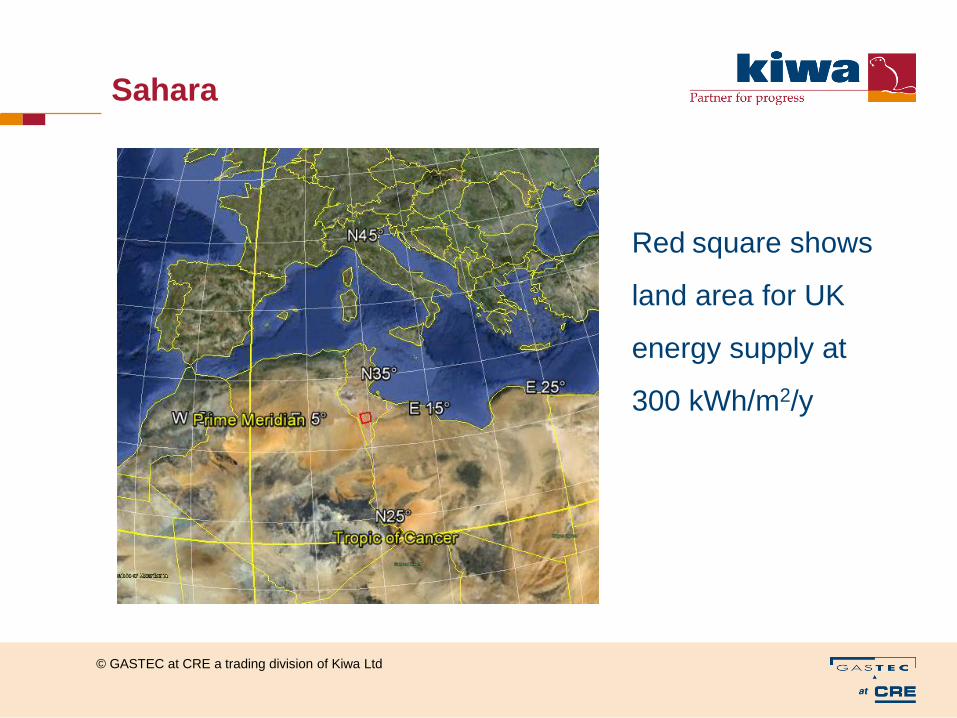
Red square shows
land area for UK
energy supply at
300 kWh/m2/y
Sahara
© GASTEC at CRE a trading division of Kiwa Ltd

1) Electricity
2) Hot water/steam
3) Methane with a biologically derived carbon atom
4) Ammonia etc
5) Hydrogen
Today I will major on Hydrogen
Options for energy vectors include:
© GASTEC at CRE a trading division of Kiwa Ltd

• Flammable, colourless, biologically inert gas
burns to water
• Very light gas, density ~0.08kg/m3
(about 1/8 methane, ~0.67 kg/m3 )
• Low calorific value of about 12,750kJ/m3
(about 1/3 methane, ~39,000kJ/m3)
• Flammable limits 4-74%
(methane 4-15%)
• Risk of detonation 18-?%
HYDROGEN:
© GASTEC at CRE a trading division of Kiwa Ltd

Fuel gas Upper index
MJ/m3
Lower index
MJ/m3
Approximate
Molecular Weight
Hydrogen 48.23 40.65 2
Methane 53.28 47.91 16
Natural gas 53.71 48.52 Mixture
Propane 81.07 74.54 44
LPG 86.84 79.94 Mixture
Carbon monoxide 12.80 12.80 28
The Wobbe Number is an indicator of the interchangeability of
fuel gases - similar Wobbe Number indicates similar flow
characteristics on an energy basis
HYDROGEN:
Wobbe Number (CV/ √Density) of hydrogen similar to natural gas:
© GASTEC at CRE a trading division of Kiwa Ltd

• Town’s Gas was about 50% • still used in parts of the world (Town’s Gas also contains high concentrations
of carbon monoxide, a poisonous gas - CO is also produced from poor
natural gas combustion)
• Buoyant in air • hydrogen flames ascend rapidly and cause less damage than hydrocarbon
fires
• Objections due to experience of the old airships • cause of the Hindenburg disaster unclear, probably an atmospheric-related
static spark. 2/3 of the passengers and crew survived. Many deaths were the
result of falls or burning diesel fuel.
• Essentially an energy vector (similar to electricity or steam) • rather than a source, it has to be created (often from water) using another
form of energy
Other properties of Hydrogen:
© GASTEC at CRE a trading division of Kiwa Ltd

Hydrogen is not a solution looking for a problem
BUT a solution to very real and complex issues, the
principal one being:
UK inter-seasonal variation in energy
demand
HYDROGEN:
© GASTEC at CRE a trading division of Kiwa Ltd

UK inter-seasonal variation
in energy demand
0.0
10.0
20.0
30.0
40.0
50.0
60.0
70.0Jan-9
6
Jul-9
6
Jan-9
7
Jul-9
7
Jan-9
8
Jul-9
8
Jan-9
9
Jul-9
9
Jan-0
0
Jul-0
0
Jan-0
1
Jul-0
1
Jan-0
2
Jul-0
2
Jan-0
3
Jul-0
3
Jan-0
4
Jul-0
4
Jan-0
5
Jul-0
5
Jan-0
6
Jul-0
6
Jan-0
7
Jul-0
7
Jan-0
8
Jul-0
8
Jan-0
9
Gas
/Ele
ctri
city
Use
pe
r D
ay p
er
Pe
rso
n in
th
e U
K
kWh
/day
GAS
ELEC
14 Years energy demand
© GASTEC at CRE a trading division of Kiwa Ltd

Hydrogen to replace natural gas in the existing
plastic low pressure distribution systems (some
~2barg, but principally 75-25millibarg)
As required, these would be inter-connected with a new
high pressure national/international hydrogen
transmission system at 85bar
Hypothesis of this paper
© GASTEC at CRE a trading division of Kiwa Ltd

Siemens gasifier
HP electrolyser
CO2
Biomass gasifier
Underground H2
store
Rutland plastics
Domestic
Commercial Transport
Industry
Existing PE network
DC
H2
© GASTEC at CRE a trading division of Kiwa Ltd

Low cost to:
• Produce (especially when credited for low emissions)
• Transport
• Store
• Distribute
• Use
Furthermore:
• Guaranteed zero carbon at point of use
• Already widely used in industry
• Well proven technologically
• Offers no chemical or biological risks other than flammability
And, it can be traded and valued like any other storable commodity
Why hydrogen?
© GASTEC at CRE a trading division of Kiwa Ltd

• Currently the UK has eight gas distribution networks (GDNs):-
• each covers a separate geographical region of Britain
• always ‘local’ hence the former name local low pressure distribution zones
• fed by a local medium pressure system via off-takes from the natural gas
national transmission system.
Often a GDN itself physically comprises several almost independent gas
networks eg Bristol, Barnsley or Bournemouth
The plan offered here is to convert these local gas networks to hydrogen
on a piecemeal basis in order to provide zero carbon energy supplies for:-
• Current users of natural gas including industry, commerce and the domestic
sectors
• Transport, via the installation of hydrogen dispensing pumps at the filling
station forecourts within the zone
Overview of concept
© GASTEC at CRE a trading division of Kiwa Ltd

Map showing
High pressure gas
transmission system
(mauve) for Ordnance
Survey Area SO
Gloucester,
Cheltenham, etc
are all fed by medium
and low pressure lines
Ordnance Survey Area ‘SO’
© GASTEC at CRE a trading division of Kiwa Ltd

Thus BOTH stationary and transport sectors
addressed with ONE energy vector
The areas for conversion would be chosen by local
‘society’ and the utilities
The high pressure National Gas Grid would remain
unaffected
Overview of concept
© GASTEC at CRE a trading division of Kiwa Ltd
• Conceptually simple
• No substantial change to the infrastructure is required either in the street,
or in the home, although appliances will need to be converted/replaced
• Transition can be locally based and locally decided
• Meets localism criteria
• No impact on international carriage of natural gas through the UK
• No impact on power generation or other very large gas users
• Gas infrastructure is inherently low cost and hydrogen is a well proven and
low cost technology
ADVANTAGES
© GASTEC at CRE a trading division of Kiwa Ltd

Low cost to:
• Produce
• Transport
• Store
• Distribute
• Use
Why hydrogen?
© GASTEC at CRE a trading division of Kiwa Ltd

Hydrogen production
$/GJ £/kWh
40 0.091
35 0.080
30 0.068
25 0.057
20 0.046
15 0.034
10 0.023
5 0.011
£= $1.58
kWh/kg % HHV
40 98%
45 87%
50 78%
55 71%
60 65%
65 60%
70 56%
© GASTEC at CRE a trading division of Kiwa Ltd

Table I Plant Performance and costs
Coal Gasification Without With CO2 capture
CO2 capture
Electricity Electricity Hydrogen
Performance •
Coal feed, MW (LHV) 1800.8 1962.5 1962.5
Electricity gross output, MW 891.9 875 208.6
Electricity net output. MW 762.3 655.8 0.1
Hydrogen net output, MW - - 1110.7
Efficiency to electricity, % 42.3 33.4 -
Efficiency to hydrogen, % - - 56.6
CO2 emitted and stored
CO2 to storage, g/kWh, 836
CO2 emitted. g/k-Wh, 776 147
Costs
Capital cost, M euro € 1,266.00 € 1,560.00 € 1,196.00
Capital cost, euro/kW, € 1,661.00 € 2,379.00
Cost of hydrogen, euro/kWh - - € 0.034
Cost of electricity, euro/kWh € 0.052 € 0.072 -
Cost of CO-2 avoided, euro/tonne € 31.30
From co-production of Hydrogen and Electricity by coal gasification with CO2 capture. Ref IEA Greenhouse Gas Programme 2007
Currently €7/tonne
But likely to go back to
this over next 10years
Coal Gasification
© GASTEC at CRE a trading division of Kiwa Ltd

0.0000
0.0100
0.0200
0.0300
0.0400
0.0500
0.0600
0.0700
0.0800
0.0000 0.0050 0.0100 0.0150 0.0200 0.0250 0.0300 0.0350 0.0400
Hyd
rge
n £
/kW
h
Natural Gas £/kWh
Real US cost of H2 Vs Nat Gas (without CCS) corrected to 2004 prices
36MW
130MW
972MW
C. E. G. Padro and V. Putsche, "Survey of the Economics of Hydrogen Technologies", NREL/TP-570-27079, 1999. http://www.afdc.doe.gov/pdfs/27079.pdf
From Natural Gas
© GASTEC at CRE a trading division of Kiwa Ltd

By electrolysis from renewable sources - eg this electrolyser operates at
an efficiency of around 80% (including ancillary power consumption)
By Electrolysis
© GASTEC at CRE a trading division of Kiwa Ltd

$/kg $/kWh Approx £/kWh
Central SMR 1.47 0.038
0.025
Distributed SMR 2.63 0.068
0.044
Coal gas with CCS 1.82
0.047
0.030
Coal gas without CCS
1.21
0.031
0.020
Biomass
1.44
0.037
0.024
Distributed electrolysis
6.75
0.174
0.113
Central wind
3.82
0.098
0.064
Distributed Wind
7.26
0.187
0.121
Nuclear
1.39
0.036
0.023
US Energy Information Administration ref US EIA 2008 (act 2004)
Current range of hydrogen costs
© GASTEC at CRE a trading division of Kiwa Ltd

Biomass plant £ 2,600.00 £/kW
Cost of biomass £ 0.020 £/kW
Electric efficiency 45%
Cost of fuel to electric £ 0.044 £/kW
Depreciation 20 y
O&M 4%
Investor return 8%
Annual cost £ 442.00 £/kW
Cost of electricity
7500hours/y Note 1 £ 0.10 £/kWh
2000hours/y Note 2 £ 0.27 £/kWh
Note 1. Approximate base-load design Note 2. Upper end of hours to provide electric space heating +DHW
The higher the capital cost (eg nuclear power) the greater the effect Value of storage in this instance 0.17p/kWh
Comparison with electricity price
© GASTEC at CRE a trading division of Kiwa Ltd

Costs of low-
carbon
generation
technologies
May 2011
CCC
Comparative costs of electricity
© GASTEC at CRE a trading division of Kiwa Ltd

Evaluating the true costs of electricity from intermittent
sources is very challenging
• Hydrogen production is ONLY production constrained
NEVER demand constrained (unlike electricity)
• Maximising operating h/y substantially reduces cost/kWh
• Hydrogen production can be of considerably higher thermal
efficiency than electricity. This reduces the cost of
feedstock, and the size of any thermal dump equipment eg
cooling towers
• Carbon capture is relatively easy as the CO2 is available
concentrated, cool and at pressure. It still needs to be
transported and sequestered.
Comparative costs of electricity
© GASTEC at CRE a trading division of Kiwa Ltd

Summarising these together gives the following ‘rules of thumb’ for the cost of hydrogen (£/kWh) on an ‘as and when’ required basis:-
• From fossil carbon fuels (direct) involving CCS H2 cost = £0.025 to 0.035 /kWh (8000h/y); about 50% of electricity at similar LOAD factor
• From biomass (direct) H2 cost = £0.02 to £0.04 /kWh (8000hrs/yr): <50% of electricity at similar LOAD factor
• From PV, wind and tide via electricity the economics are more complex, but the hydrogen generators know they will never be refused a market. Their business plan can be simply based on a robust sale price.
Costs of hydrogen
© GASTEC at CRE a trading division of Kiwa Ltd

Low cost to:
• Produce
• Transport
• Store
• Distribute
• Use
Why hydrogen?
© GASTEC at CRE a trading division of Kiwa Ltd

Low pressure H2 - broadly similar transport properties to natural gas
At 85barg it has a lower compressibility factor and is somewhat more
difficult to compress so a new hydrogen transmission system will need
slightly larger pipes and more complex compressor stations, but the
cost is still very low
Natural gas can be brought from Siberia to UK for <1p/kWh
MW Dist km Project Cost £/MW.km Ref GaC from public data
Brit Ned 1000 240 £540,000,000 £2,250 Sub-sea HVDC
Scotland wind 2700 220 £350,000,000 £589 Beauly-Denny, Scotland
S Wales NTS 24000 316 £700,000,000 £92 Milford Haven to Stroud
Anecdotally the transportation/delivery cost of fuel vectors was:
Nat gas Elecricity District heat
Relative cost kWh/km 1 X7 X49
Hydrogen transport
© GASTEC at CRE a trading division of Kiwa Ltd

Hydrogen Analysis Resource Center:
European Hydrogen Pipeline Miles by Country
Country Miles
Belgium 381
France 188
Germany 242
Italy 5
Netherlands 147
Sweden 11
Switzerland 1
United Kingdom 25
Total 1001
Source for all but Germany: http://www.roads2hy.com; European Hydrogen
Infrastructure Atlas. J. Perrin. July 2007.
Source for Germany: Germany - Taking the Fast Lane to Hydrogen
Infrastructure Development. P. Schmidt. August 2008.
In summary the long distance transportation of hydrogen is well
proven and cost competitive
Hydrogen transport
© GASTEC at CRE a trading division of Kiwa Ltd

• Icelandic geothermal power would most cheaply be exported
by H2 pipeline.
• For solar sources, even North Africa could be considered. The
relative low cost and simplicity of long distance hydrogen
transport makes its generation in the Sahara very feasible.
At about 3,000km, this is much nearer than Siberia or the
Middle East. (Guesstimate of cost of new pipeline for UK energy supply £100billion)
• This could be generated either via PV or solar thermal. Costs
currently debatable for the latter but it is simple low risk
competitive technology.
Costs could be in range £0.05 to £0.1/kWh
• At 300kWh/m2/year (ie about 15-20% yield) it would take an area ~6200km2 ~80km square to produce total UK end use
Alternative sources:
© GASTEC at CRE a trading division of Kiwa Ltd

Low cost to:
• Produce
• Transport
• Store
• Distribute
• Use
Why hydrogen?
© GASTEC at CRE a trading division of Kiwa Ltd

Compressed underground hydrogen storage is entirely proven
and new sites are under-construction today eg PRAXAIR in Texas
This last facility has the capacity of about 4mboe or 2.5% of UK
annual energy demand or 50 Cruachan pumped storage stations
Hydrogen Storage
© GASTEC at CRE a trading division of Kiwa Ltd

Hydrogen storage cavern for Air Liquide at the Spindletop Dome near Beaumont
in southeast Texas
= 50 off of these:
Hydrogen Storage
© GASTEC at CRE a trading division of Kiwa Ltd

Upper Lower
Methane Cap Cost $ $ 25,000,000.00 $ 10,000,000.00
Depreciation 20yrs $ 1,250,000.00 $ 500,000.00
O&M 4% $ 1,000,000.00 $ 400,000.00
Return 8% $ 2,000,000.00 $ 800,000.00
Annual cost $ 4,250,000.00 $ 1,700,000.00
Ann: Storage kWh 278,000,000 278,000,000
Annual/kWh $ 0.015 $ 0.006
£/kWh £ 0.010 £ 0.004
Hydrogen BY 4 £ 0.042 £ 0.017
This is about 1/4 to 1/10 the ‘value’ arising from the intermittent
use of biomass generation (ie 0.17p/kWh).
The surest route to reducing energy production cost is to increase
operating hours of the producer and/or not restrict output.
Indicative costs of storage
© GASTEC at CRE a trading division of Kiwa Ltd

Not a solution looking for a problem
BUT a solution to very real and complex issues
0.0
10.0
20.0
30.0
40.0
50.0
60.0
70.0Jan-9
6
Jul-9
6
Jan-9
7
Jul-9
7
Jan-9
8
Jul-9
8
Jan-9
9
Jul-9
9
Jan-0
0
Jul-0
0
Jan-0
1
Jul-0
1
Jan-0
2
Jul-0
2
Jan-0
3
Jul-0
3
Jan-0
4
Jul-0
4
Jan-0
5
Jul-0
5
Jan-0
6
Jul-0
6
Jan-0
7
Jul-0
7
Jan-0
8
Jul-0
8
Jan-0
9
Gas
/Ele
ctri
city
Use
pe
r D
ay p
er
Pe
rso
n in
th
e U
K
kWh
/day
GAS
ELEC
14 Years energy demand
© GASTEC at CRE a trading division of Kiwa Ltd

By uncoupling supply and demand a free market can exist in both
UK Annual energy (final) 159,000,000 toe
kWh/toe 11,630
UK annual kWh 1.8492E+12
91days use 4.6229E+11
GCV Hydrogen 12760 kJ/m3
GCV Hydrogen 3.54 kWh/m3
Equivalent volume of H2 at
STP 1.3043E+11 m3
At 85barg 1,534,439,425 m3
Edge of cube 1074. m
By historical standards at hole ~1km cube is small and would give
complete freedom from the inter-seasonal problem.
© GASTEC at CRE a trading division of Kiwa Ltd

Low cost to:
• Produce
• Transport
• Store
• Distribute
• Use
Why hydrogen?
© GASTEC at CRE a trading division of Kiwa Ltd

Most of the UK low
pressure distribution
system is now
polyethylene and
operates at
25 to 75mbar
(ie 0.025 to 0.075barg)
Gas Distribution
© GASTEC at CRE a trading division of Kiwa Ltd

In summary, according to the tests performed in this study, we have found strong indications that polyethylene gas pipes PE80 and PE100 can be used for transportation of hydrogen without any adverse long-term effects on antioxidants, polymer structure or the mechanical performance of the polymer pipes. The same indications have been found for both new and old pipes that has been used in the Danish natural gas distribution network for more than 20 years.
Ref Detlef Stolten, Thomas Grube (Eds.): 18th World Hydrogen Energy Conference 2010 - WHEC 2010
Diffusion of hydrogen through PE pipelines is five times higher than diffusion of NG, but still negligible. Calculations have shown that the yearly loss of hydrogen by leakage amounts to approximately 0.0005–0.001% of the totally transported volume.
Ref The use of the natural-gas pipeline infrastructure for hydrogen transport in a changing market structure Dries Haeseldonckx,William D’haeseleer∗ Division of Energy Conversion, University of Leuven (K.U. Leuven), Celestijnenlaan 300A, 3001 Leuven, Belgium
Suitability of polyethylene widely studied
© GASTEC at CRE a trading division of Kiwa Ltd

• 1967 to 1977
• 13m homes & 40m appliances
• Cost then £563m (£42/customer)
• Now equivalent to £6b (based on RPI) or
£14b (based upon % UK GDP) or
£70b based upon on-going conversion of the
Isle of Man to Natural Gas from Towns Gas
(above costs exclude hydrogen production)
• Very competitive against the all electric world
Town’s Gas to Natural Gas
conversion programme
(ref Leicester Gas Museum)
© GASTEC at CRE a trading division of Kiwa Ltd

Low cost to:
• Produce
• Transport
• Store
• Distribute
• Use – Space Heating
Why hydrogen?
© GASTEC at CRE a trading division of Kiwa Ltd

Dramatic reductions in energy use from improvements in efficiency is
very challenging. (Ref Tadj Oreszczyn UCL - Our innate ability to think of new ways to use energy)
0
5
10
15
20
25
30
0
10
20
30
40
50
60
19
70
19
72
19
74
19
76
19
78
19
80
19
82
19
84
19
86
19
88
19
90
19
92
19
94
19
96
19
98
20
00
20
02
20
04
20
06
20
08
20
10
Ene
rgy
con
sum
op
tio
n (
MW
h)
SAP
20
05
Rat
ing SAP 2005 Rating
Energyconsumption perhousehold
Energy Efficiency?
© GASTEC at CRE a trading division of Kiwa Ltd

The use of hydrogen in boilers, fuel cells, hybrid units of fuel cells and heat
pumps offers potential for good COP values especially during spring and autumn.
By not taking carbon into the community we can immediately have total
confidence in the true extent of carbon saving.
Hydrogen versions of many appliances already exist or are relatively simple to
transform.
Existing
Appliance
Replacement H2
technology Cost implications Available
Boiler Boiler Little change Yes
Boiler Fuel Cell Increase but with benefit Yes
Boiler + Heat Pump Hybrid unit Increase but with benefit Yes
Cooker Gas under glass Modest increase Yes
Gas fire Catalytic heater Little change Yes
Hydrogen Appliances
© GASTEC at CRE a trading division of Kiwa Ltd
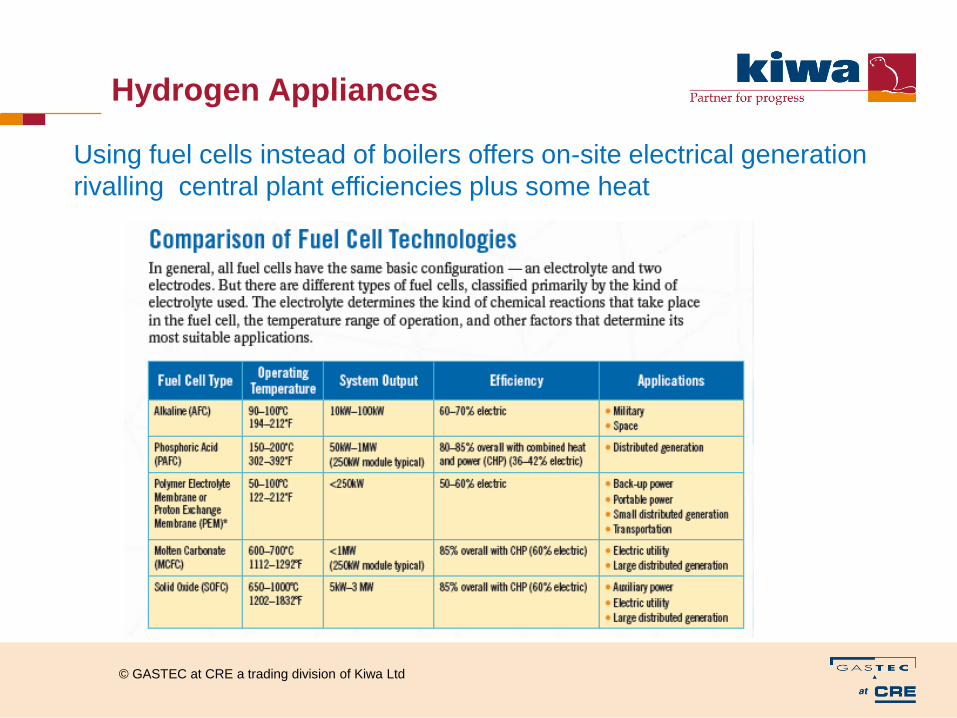
Using fuel cells instead of boilers offers on-site electrical generation
rivalling central plant efficiencies plus some heat
Hydrogen Appliances
© GASTEC at CRE a trading division of Kiwa Ltd

A fundamental problem of ASHP is their performance in the coldest
weather or with high water temperatures.
Fuel Cell
Hydrogen In 2.000 kW
Electricity OUT 1.300 kW
Heat out (80-60C) 0.300 kW
Overall FC Eff: HHV 80%
ASHP COP (55-?C) 2.3
Power system loss 10%
Heat from ASHP 2.691 kW
TOTAL Heat out 2.991 kW
Overall COP 1.50
This gives the possibility of hydrogen hybrid fuel cell/ASHP
Such a unit is currently under development in the UK
In practice it will still need a hydrogen boiler for winter loads
Hybrid Appliances
Ref Mitsubishi
literature
© GASTEC at CRE a trading division of Kiwa Ltd

ON A ZONE-BY-ZONE BASIS and supported by the locality and
gas distribution company:-
1) Construct local hydrogen production facilities (or extend those
available)
2) Construct local hydrogen storage
3) Reinforce local network where necessary
4) Replace current appliance stock with new boilers, fuel cells,
cookers and fires
5) Change over current LDZ systems to hydrogen
6) Install hydrogen filling pumps on garage forecourts
This is almost the exact reverse of Town’s Gas conversion!
MORE PRACTICAL DETAILS
© GASTEC at CRE a trading division of Kiwa Ltd

Low cost to:
• Produce
• Transport
• Store
• Distribute
• Use – Transport Sector
Why hydrogen?
© GASTEC at CRE a trading division of Kiwa Ltd

• 28m vehicles on UK roads
• About 9,000 filling stations in the UK
• Would equate to £9bn at £1m/station (ref California today about
£1.6m/fill point including generation)
• Compares with £30bn for HS2 rail-line
• Hydrogen vehicles are available now with similar performance to
existing gasoline/diesel stock
• Hydrogen seems to be the preferred fuel for the future of the
world automotive industry
• Connecting these filling stations up to the existing LDZ would be
relatively easy
• This would ensure the UK stayed in the world league in this important manufacturing sector.
Use in Transport
© GASTEC at CRE a trading division of Kiwa Ltd
Hydrogen is a realistic avenue to low carbon personal
transport
Battery vehicles have problems with cab heating in cold
climates, and realistically offer only short range
Slow charging of vehicles is expected to require >40million
sockets plus their infrastructure
Boost charging requires either massive new electrical
infrastructure and/or battery swopping infrastructure
Both electric approaches requires a substantial change in
culture
Comparison with Batteries
© GASTEC at CRE a trading division of Kiwa Ltd

Stuttgart/Munich, 1 June 2011 – Car manufacturer Daimler and the technology company The Linde Group are pressing ahead with the development of an infrastructure for hydrogen-powered fuel-cell vehicles. Over the coming three years, the two companies plan to construct an additional 20 hydrogen filling stations in Germany, thereby ensuring a supply of hydrogen produced purely from renewable resources for the steadily increasing number of fuel-cell vehicles on the roads. The initiative links in with the existing H2 Mobility and Clean Energy Partnership infrastructure projects, which are being subsidised by the National Innovation Programme for hydrogen and fuel-cell technology (NIP). This places Germany at the international forefront of hydrogen infrastructure development.
News
© GASTEC at CRE a trading division of Kiwa Ltd

Wolfgang Tiefensee, Minister for Transportation, Building and Urban Affairs Germany, with its excellent ideas from all over the country, is to become the market leader for modern drive technologies. This will secure and create new employment in the markets of the future. Our aim is to continue consistent and systematic promotion of electromobility based on batteries and fuel cells. Today we can see that Germany is setting the
pace when it comes to hydrogen and fuel cell technology. We are aiming at establishing the nation-wide supply with hydrogen in Germany at around 2015 in order to support the serial-production of fuel cell vehicles.”
Most of the large automotive companies have large hydrogen vehicle development programmes. By way of example…….
News
© GASTEC at CRE a trading division of Kiwa Ltd
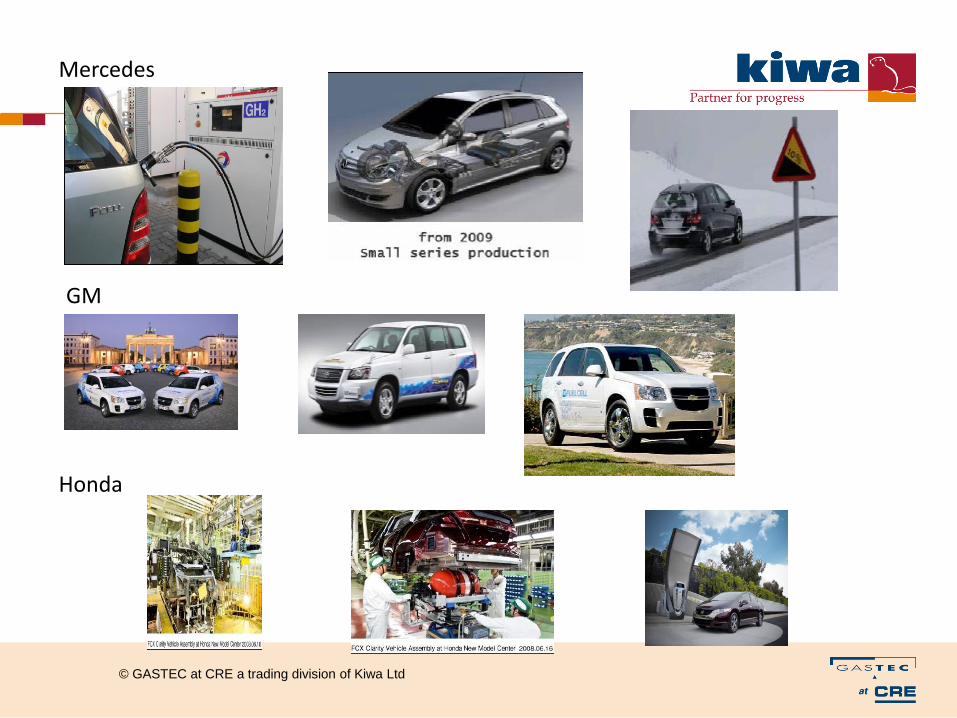
Mercedes
GM
Honda
© GASTEC at CRE a trading division of Kiwa Ltd

Source: Peter Froeschle, Daimler AG, WHEC2010, Essen, May 2010
Fuel Cells
© GASTEC at CRE a trading division of Kiwa Ltd

Use in Transport
© GASTEC at CRE a trading division of Kiwa Ltd
Low cost to:
• Produce
• Transport
• Store
• Distribute
• Use – Industry
Why hydrogen?
© GASTEC at CRE a trading division of Kiwa Ltd

For many years UK manufacturing has been moving towards
higher added value products. A generous supply of low cost
hydrogen would greatly assist this.
The existing petrochemical use of hydrogen is widespread. The
addition of low carbon hydrogen as a chemical feedstock will
expand the commercial possibilities, across a wide range of ‘low
carbon’ goods eg low carbon copper, steel or other metals.
The market for low carbon manufactured goods will grow.
Those companies who wished to remain on Natural Gas could
be assisted to run dedicated medium pressure lines to the existing (and remaining) National Grid.
Industrial uses of hydrogen
© GASTEC at CRE a trading division of Kiwa Ltd

The next slides pull the whole of the hydrogen chain together
Thus:-
• Hydrogen generation by Petroleum Coke gasification and
CCS
• Hydrogen storage
• Conversion of a town the size of Bristol plus immediate
environs (about 600,000 persons)
• Without and with free appliances to the space heating sector and filling stations to hydrogen
The way forward
© GASTEC at CRE a trading division of Kiwa Ltd

• With a subsidy of 1.7p/kWh (ie modest by FIT and RHI
standards) it should be possible to convert the WHOLE
ENERGY SUPPY CHAIN of a city (eg Bristol) to a zero
carbon fuel, including appliance conversion.
• It must be noted that current FIT subsidies (eg solar PV) are
only addressing one part of the energy supply system; they
omit any support to the necessary back-up supply, upgrading
of the electrical infrastructure or installation of heat pumps.
• This subsidy is ‘end to end’ and provides a package solution.
The way forward
© GASTEC at CRE a trading division of Kiwa Ltd

expecting householder to pay conversion cost of appliances (ie similar to other micro-generation) -
carbon subsidy £14/t (ref Nat Gas +oil)
Cost of H2 £/kWh £ 0.030 £/kWh INCOME
Cost of storage £/kWh £ 0.015 Road fuel £/kWh £ 0.0900
Billing etc £/kWh £ 0.008 Income £ 216,000,000.00
TOTAL Hydrogen £ 0.053
MW 1000 MW Space Heat £/kWh £ 0.0550
Annual hrs 8000 hrs Income £ 308,000,000.00
Annual demand 8,000,000,000 kWh
% Space heat 70% TOTAL INCOME £ 524,000,000.00
% transport 30%
kWh to space heat 5,600,000,000 kWh Cost of hydrogen £ 0.053
Av demand/prop 19,000 kWh/yr Total cost H2 gas £ 424,000,000.000
No of dom prop equiv 294,737
Av conv cost per prop £ 750 Gross Margin £ 100,000,000
Total cost of prop £ 221,052,632 Annual H2 bill/house £ 1,045
No of filling stat(FS) £ 121
Av cost per FS £ 1,000,000 Carbon saving tonne 1,720,000
Total cost of FS £ 120,574,163 Carbon subsidy £14
Total value £24,080,000
Investment £ 341,626,794 Sub £/kWh £0.0030
O&M at 4% £ 13,665,072 TOTAL INCOME £124,080,000
Deprec 25 yrs £ 13,665,072 TOTAL: MARGIN £69,419,713
Return 8% £ 27,330,144
Ann: capital charges £ 54,660,287 MARGIN % 13.25%
Conversion economics
© GASTEC at CRE a trading division of Kiwa Ltd

free issue of appliances to householder carbon subsidy £80/tonne
Cost of H2 £/kWh £ 0.030 £/kWh INCOME
Cost of storage £/kWh £ 0.015 Road fuel £/kWh £ 0.0900
Billing etc £/kWh £ 0.008 Income £ 216,000,000.00
TOTAL Hydrogen £ 0.053
MW 1000 MW Space Heat £/kWh £ 0.0550
Annual hrs 8000 hrs Income £ 308,000,000.00
Annual demand 8,000,000,000 kWh
% Space heat 70% TOTAL INCOME £ 524,000,000.00
% transport 30%
kWh to space heat 5,600,000,000 kWh Cost of hydrogen £ 0.053
Av demand/prop 19,000 kWh/yr Total cost H2 gas £ 424,000,000.000
No of dom prop equiv 294,737
Av conv cost per prop £ 3,500 Gross Margin £ 100,000,000
Total cost of prop £ 1,031,578,947 Annual H2 bill/house £ 1,045
No of filling stat(FS) £ 121
Av cost per FS £ 1,000,000 Carbon saving tonne 1,720,000
Total cost of FS £ 120,574,163 Carbon subsidy £80
Total value £137,600,000
Investment £ 1,152,153,110 Sub £/kWh £0.0172
O&M at 4% £ 46,086,124 TOTAL INCOME £237,600,000
Deprec 25 yrs £ 46,086,124 TOTAL: MARGIN £53,255,502
Return 8% £ 92,172,249
Ann: capital charges £ 184,344,498 MARGIN % 10.16%
Conversion economics
© GASTEC at CRE a trading division of Kiwa Ltd

Hydrogen is currently receiving little attention in the UK except
in the transport sector – Why?
• Little UK owned hydrogen industry
• UK hydrogen industry currently in retraction eg closure of
Bristol fertiliser plant ~2008
• No incentive from Government
• Pipes and wires companies were not incentivised to be truly
innovative except in cost cutting
• Energy sector dominated by companies who know and
wish to promote the electric option
• Only modest interest in CCS, and pre-combustion route not
currently popular
BUT:
• Some significant indication that the situation may be changing
Current state of play
© GASTEC at CRE a trading division of Kiwa Ltd

• Establish a hydrogen working party (under independent chair) with a
budget and support from:-
o HMG (DECC /DoT/BIS/OFGEM)
o Gas infrastructure providers
• Compare the electric and gas routes to low carbon space heating
bearing in mind:-
o Gas (natural gas or hydrogen) pipes exist & are fully written off
o Electricity needs complete new infrastructure
• Devise a regulatory framework for local decision making of
hydrogen conversion and address outstanding safety issues,
especially regarding the GS(M)R and GS(I&U)R
• Allow the carbon credits currently directed towards the nuclear
industry to be equally available to hydrogen products
• Announce that zero carbon hydrogen in the transport sector will be tax exempt for the next 25years
What to do?
© GASTEC at CRE a trading division of Kiwa Ltd

Hydrogen has a future because it is low cost to:
• Produce. As production is never demand constrained, reducing the risk
premium compared to that associated with future electric plant
• Transport. Because it is a gas of reasonable Wobbe No.
• Store. Because it a compressible flammable gas of reasonable CV.
• Distribute. Because it is compatible with current PE pipe and was >50% of
Town’s Gas.
• Use. It has excellent and proven potential in all three sectors (space
heating, transport and industry) either directly or via fuel cells.
and
• Compliments electricity as an energy vector and addresses the inevitable
intermittency issues for electricity generation (especially renewable)
To return and validate my
original hypotheses
© GASTEC at CRE a trading division of Kiwa Ltd

• Electricity is most efficiently used when supplied as and when the customer
demands
• This requires stand-by generating plant that will be only infrequently used and
thus must produce electricity of high unit cost
• This effect must be magnified with the principle generators wind, wave and
solar power where there may be little correlation between supply and demand
• Hydrogen plant, however, can always generate 8,000 hours/y and the product
can be stored
• This can then be transported to consumers as and when they demand. On-
site fuel cells of excellent power to heat ratio can give flexibility to this
process.
This is reflected in the current gas system that has almost zero grid management
charges compared to the electricity grid that has substantial system management
fees to keep stations warm etc. Hydrogen would reflect the current gas system.
Relative cost and value of generating
electricity or hydrogen is complex:
© GASTEC at CRE a trading division of Kiwa Ltd

Mark Crowther
GASTEC at CRE
Questions
© GASTEC at CRE a trading division of Kiwa Ltd
This presentation was complied specifically for delivery to a private audience – it is strictly copyrighted to Kiwa Ltd.
All of the information is or has been derived from freely available public domain sources,
however specific permission has not been gained in all instances.