Embed Size (px)
Citation preview
Why I don’t understand the assessment results
(and what I can do about it)
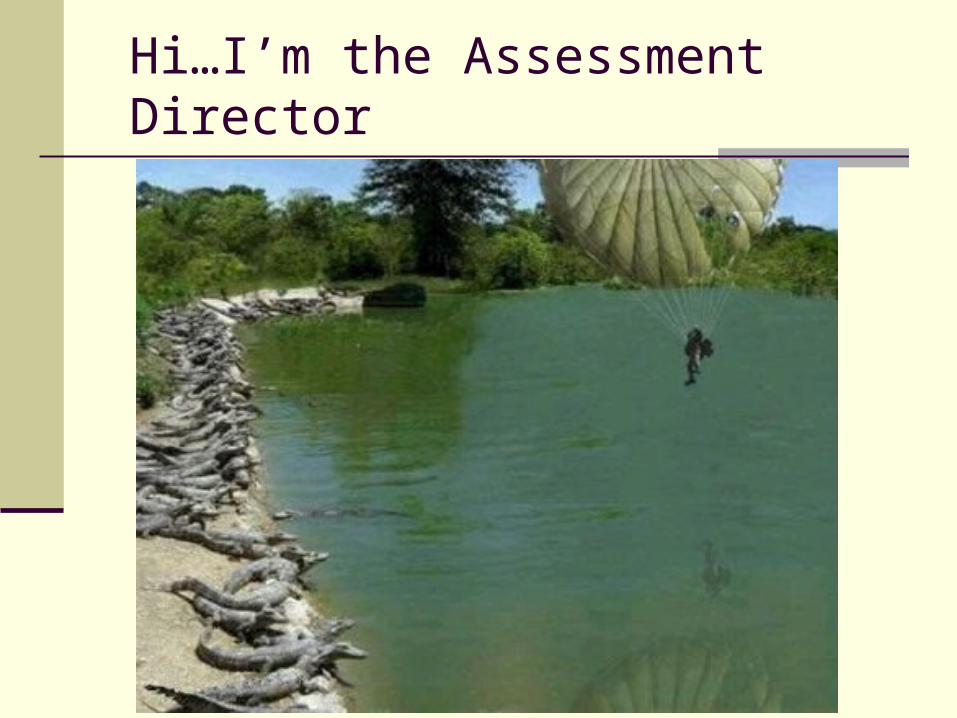
Hi…I’m the Assessment Director
Reasons for Assessment
Accreditors demand it Institutional leaders ought to care Faculty members probably do care Students should know what we think of them
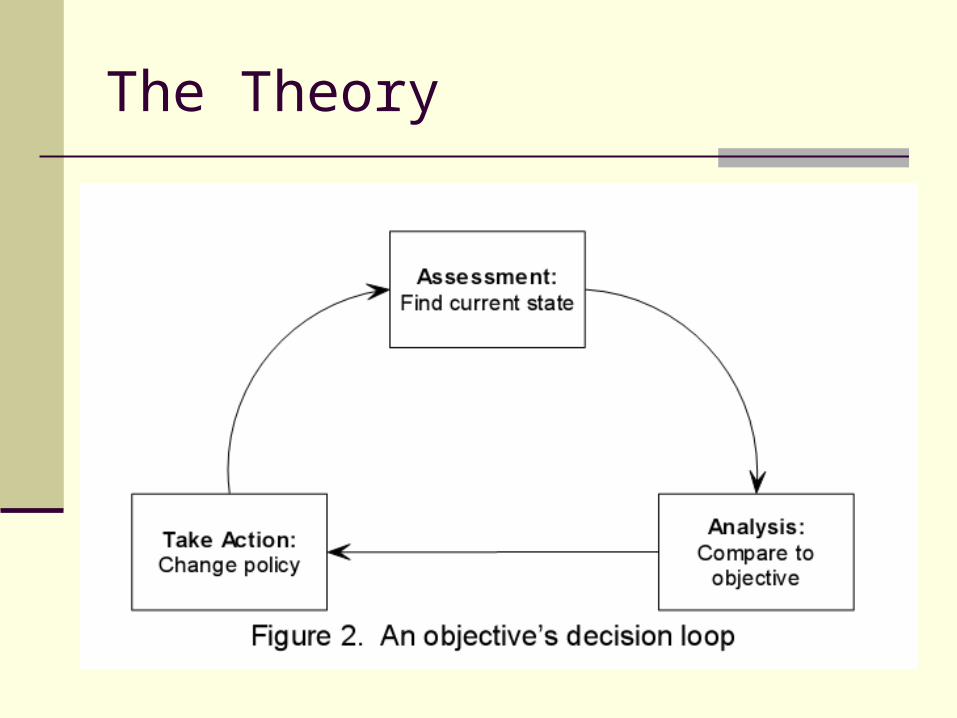
The Theory
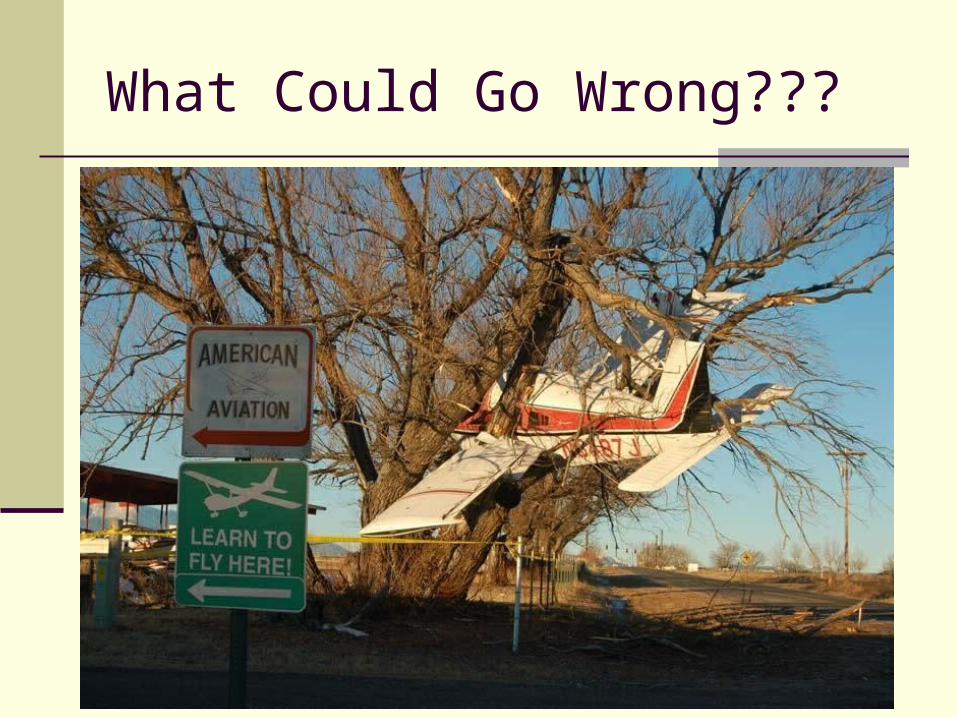
What Could Go Wrong???
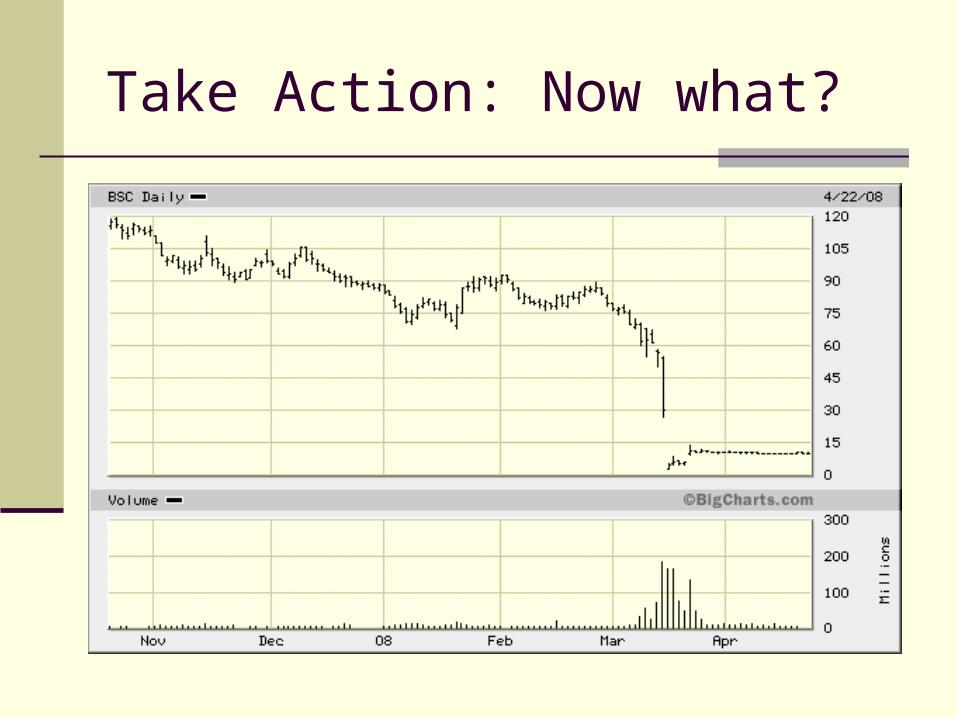
Take Action: Now what?
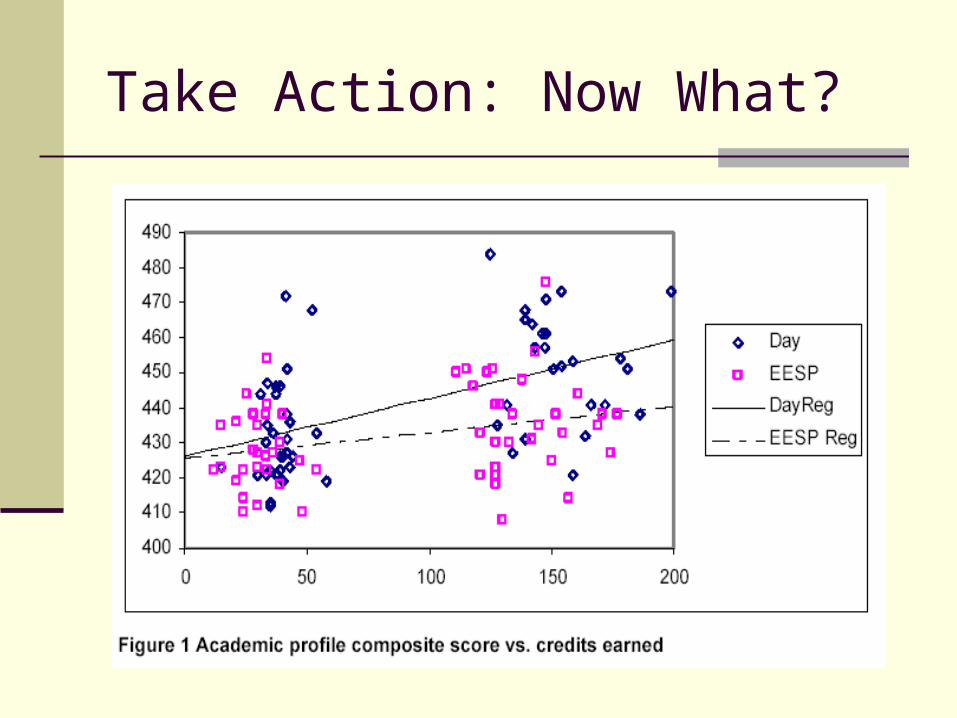
Take Action: Now What?
Assessment: The Process
1. Design
2. Implementation
3. Reporting
4. Follow-up
Design
Design: Validity and Reliability
The emphasis [on validity] is not on the instrument itself; rather, it is on the interpretation of the scores yielded by a test.
-- College BASE Technical Manual
The CLA measures were designed by nationally recognized experts in psychometrics and assessment, and field tested in order to ensure the highest levels of validity and reliability.
-- Collegiate Learning Assessment Advertisement
Design: Epistemology
We say that a sentence is factually significant to any given person, if and only if, [she or] he knows how to verify the proposition which it purports to express—that is, if [she or] he knows what observations would lead [her or him], under certain conditions, to accept the proposition as being true, or reject it as being false. – A. J. Ayer, Language, Truth, and Logic
[T]he meaning of a word is its usage in the language. – L. Wittgenstein
Design: Complexity and Validity
Collegiate learning is complex
Assessment should be:
•Authentic•Contextual•Rigorous•Reliable•Understandable
Design: Measurement Smeasurement
Measurement requires: Units Ability to aggregate
What we actually do is estimation
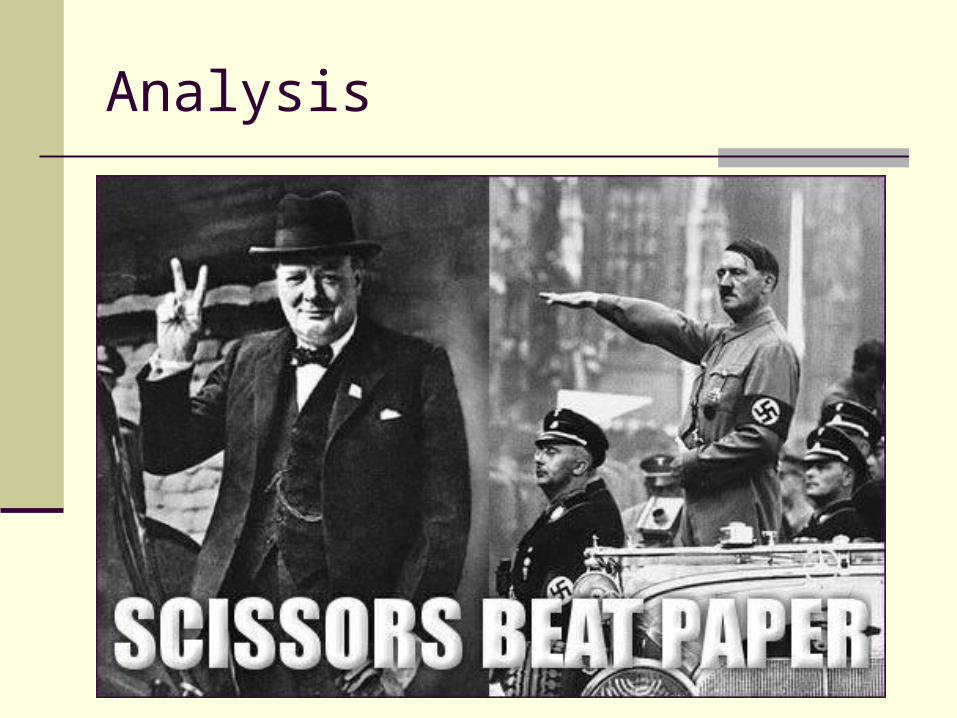
Analysis
Analysis: Using the Data
Pieper, Fulcher, and Erwin –
1. Differences
2. Relationships
3. Change
4. Competency
Analysis: Tools
MS Access Spreadsheet software
Pivot Tables Statistics packages:
Excel SPSS SAS Logistic Regression:
http://statpages.org/logistic.html
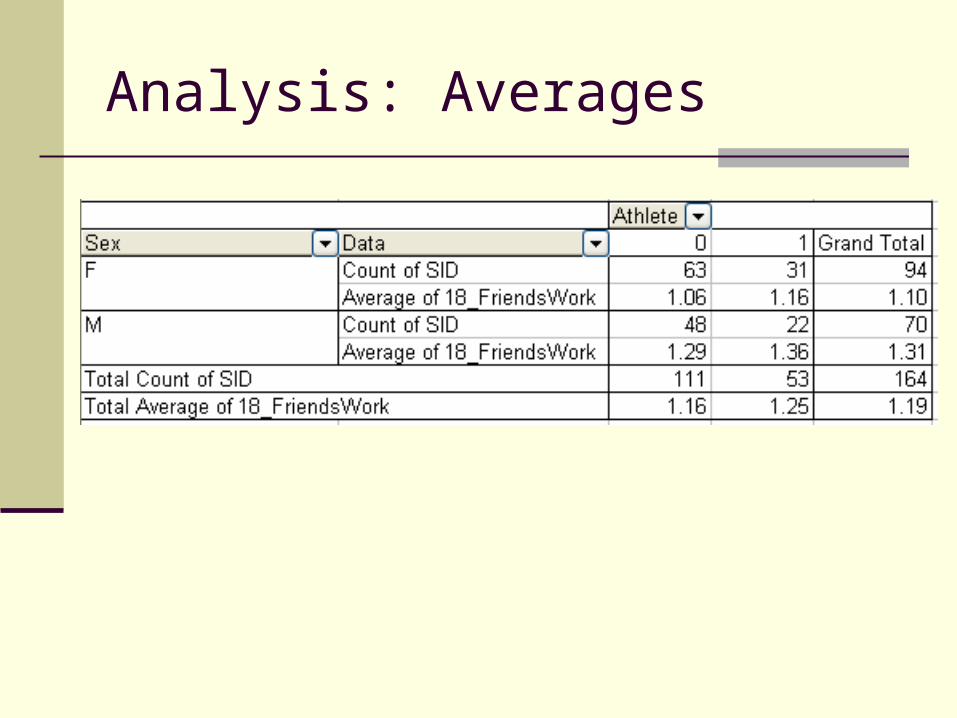
Analysis: Averages
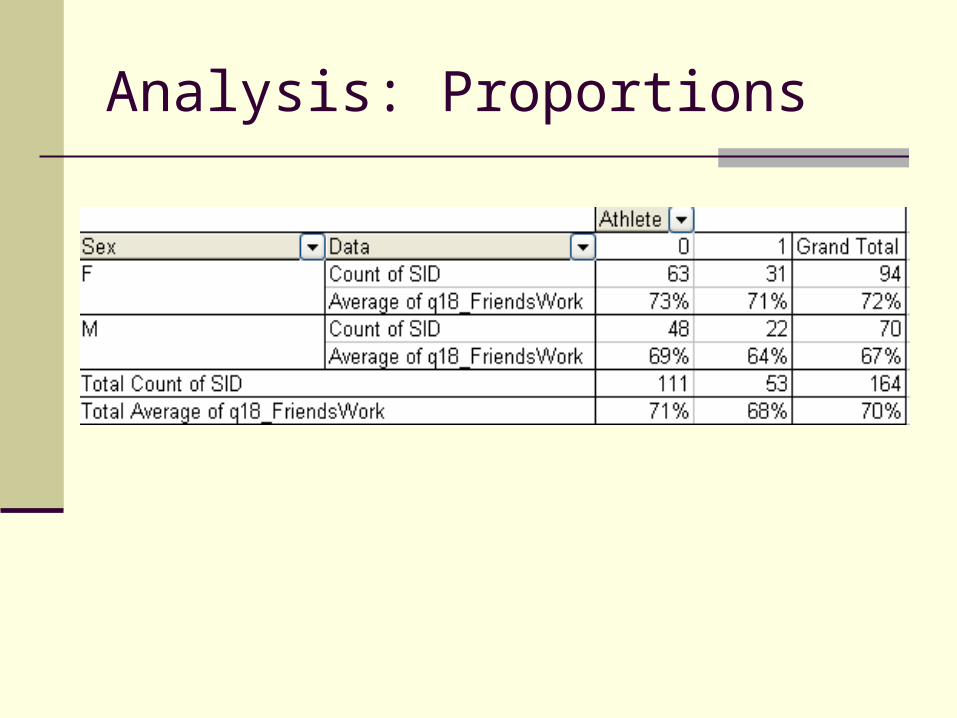
Analysis: Proportions
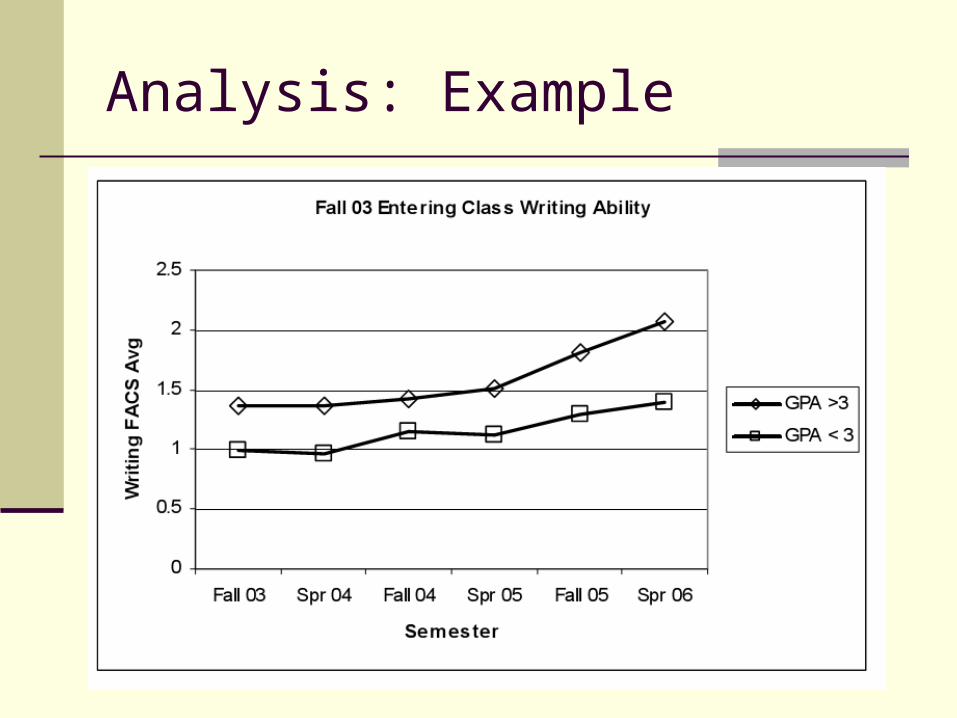
Analysis: Example
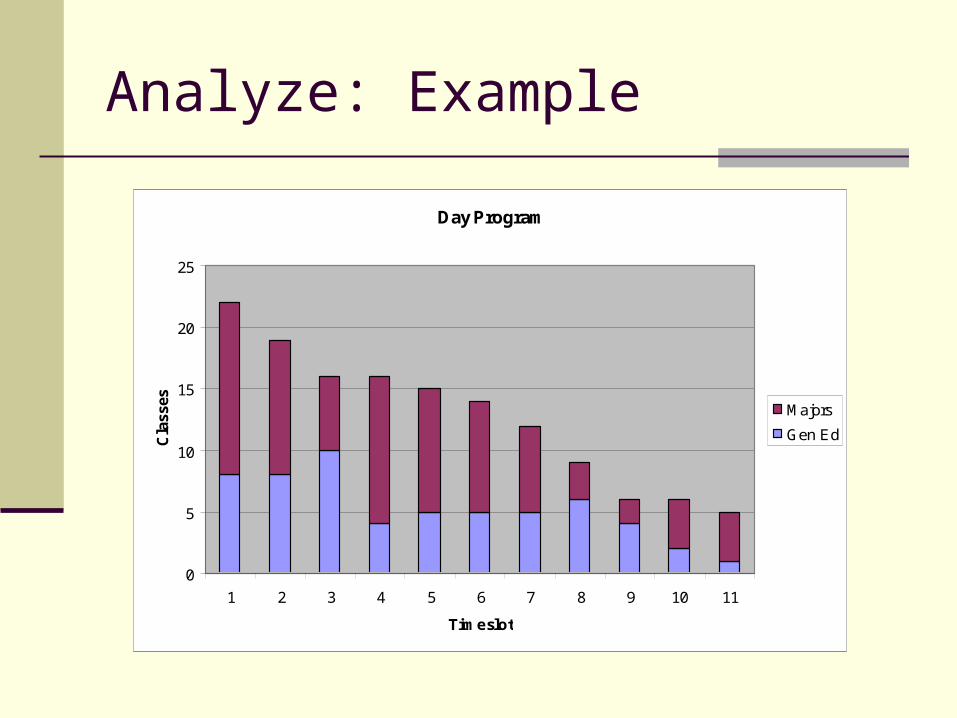
Analyze: Example
Day Program
0
5
10
15
20
25
1 2 3 4 5 6 7 8 9 10 11
Timeslot
Cla
sses Majors
Gen Ed
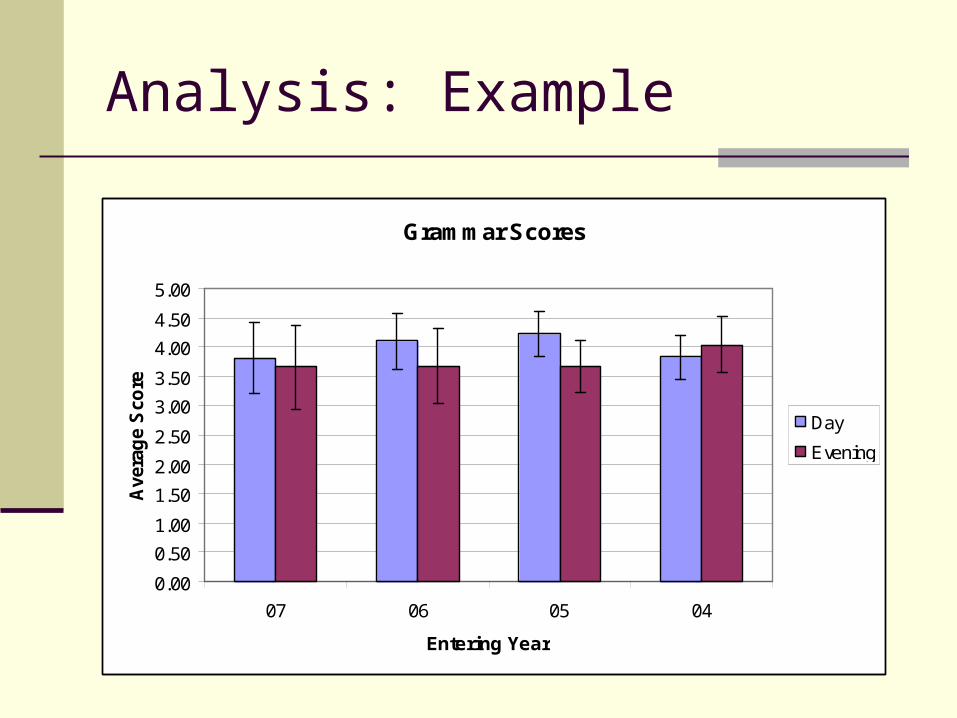
Analysis: Example
Grammar Scores
0.00
0.50
1.00
1.50
2.00
2.50
3.00
3.50
4.00
4.50
5.00
07 06 05 04
Entering Year
Ave
rag
e S
core
Day
Evening
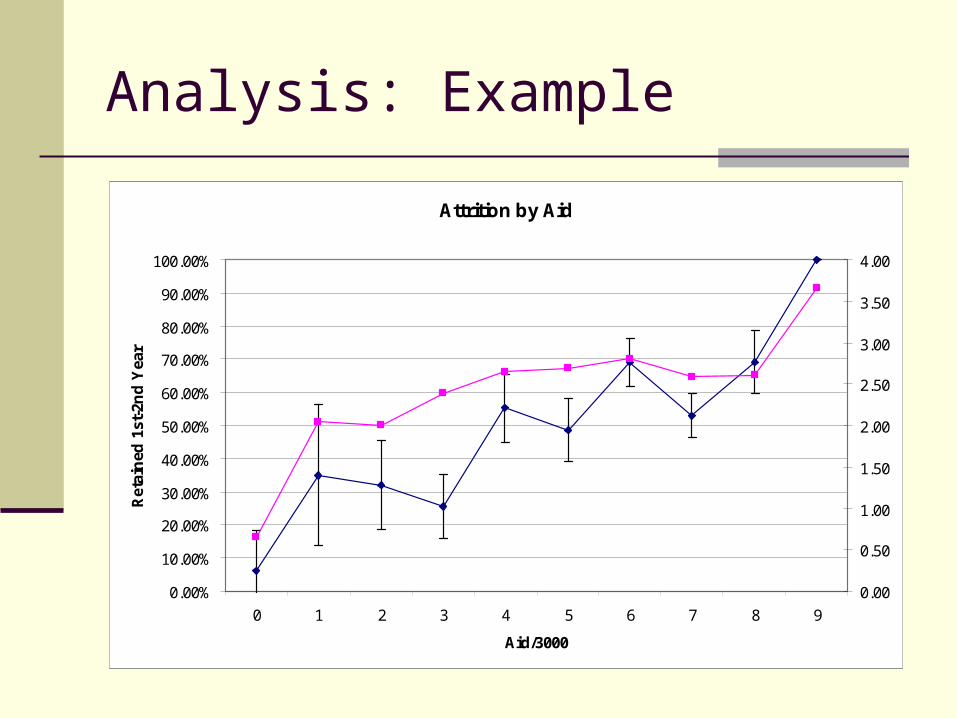
Analysis: Example
Attrition by Aid
0.00%
10.00%
20.00%
30.00%
40.00%
50.00%
60.00%
70.00%
80.00%
90.00%
100.00%
0 1 2 3 4 5 6 7 8 9
Aid/3000
Ret
ain
ed 1
st-2
nd
Yea
r
0.00
0.50
1.00
1.50
2.00
2.50
3.00
3.50
4.00
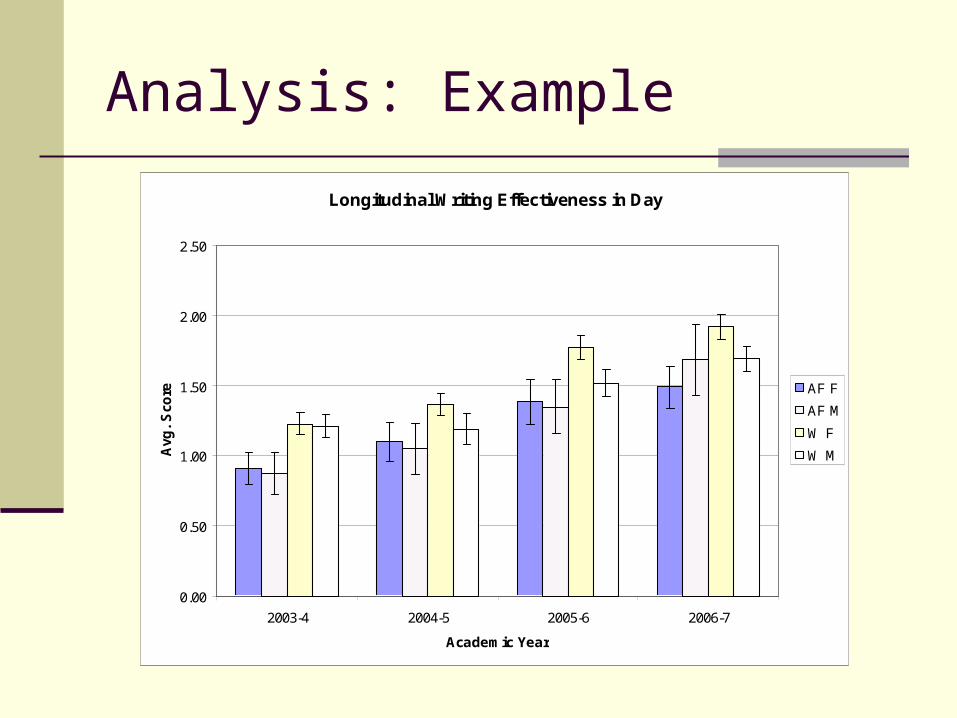
Analysis: Example
Longitudinal Writing Effectiveness in Day
0.00
0.50
1.00
1.50
2.00
2.50
2003-4 2004-5 2005-6 2006-7
Academic Year
Avg
. S
core AF F
AF M
W F
W M
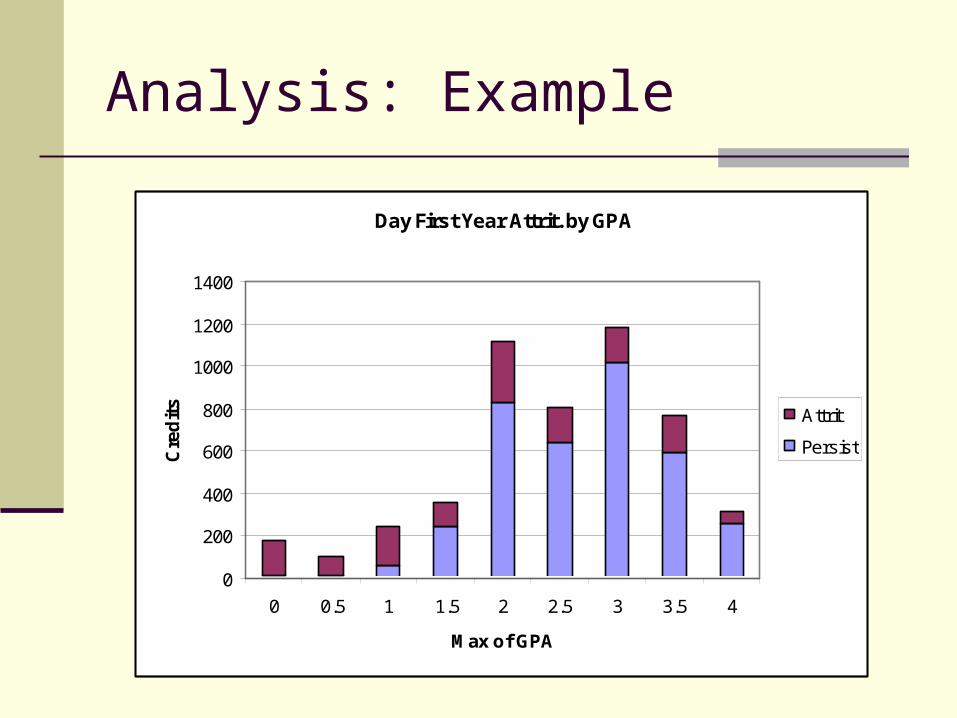
Analysis: Example
Day First Year Attrit. by GPA
0
200
400
600
800
1000
1200
1400
0 0.5 1 1.5 2 2.5 3 3.5 4
Max of GPA
Cre
dit
s Attrit
Persist
Analysis: Example
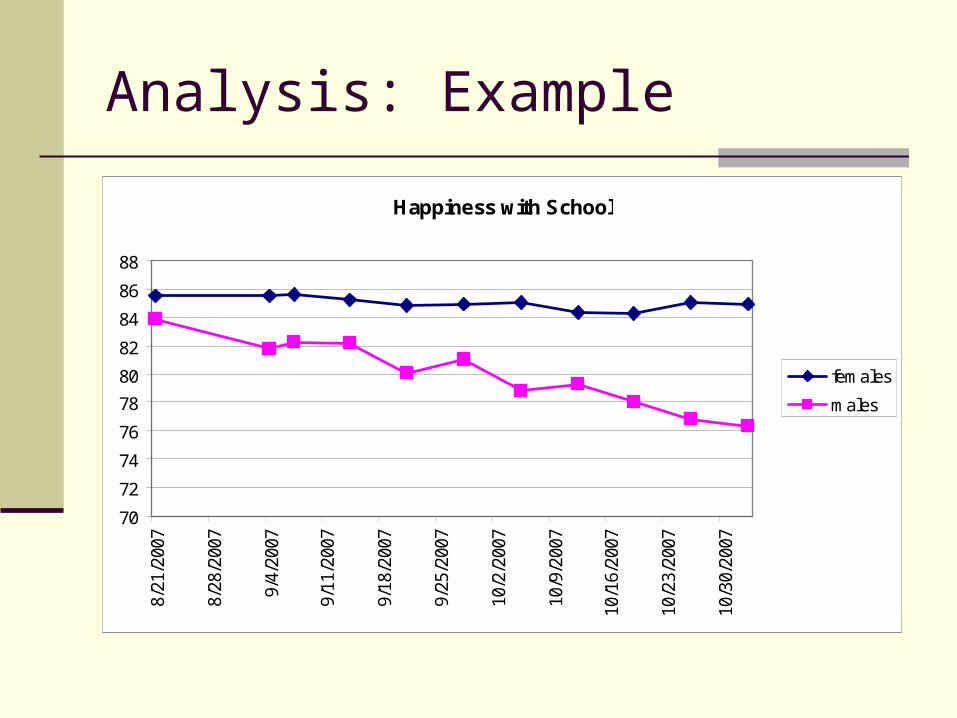
Happiness with School
70
72
74
76
78
80
82
84
86
88
8/21
/200
7
8/28
/200
7
9/4/
2007
9/11
/200
7
9/18
/200
7
9/25
/200
7
10/2
/200
7
10/9
/200
7
10/1
6/20
07
10/2
3/20
07
10/3
0/20
07
females
males

Analysis: Example
CIRP Self-Assessed Mathematical ability
Frequen
cy PercentValid
PercentCumulative
Percent
Valid Lowest 10% 10 5.2 5.2
5.2
Below average 46 23.7 23.8
29.0
Average79 40.7 40.9
69.9
Above average 48 24.7 24.9
94.8
Highest 10% 10 5.2 5.2
100.0
Total 193 99.5 100.0
Missing System 1 .5
Total 194 100.0
Analysis: Example
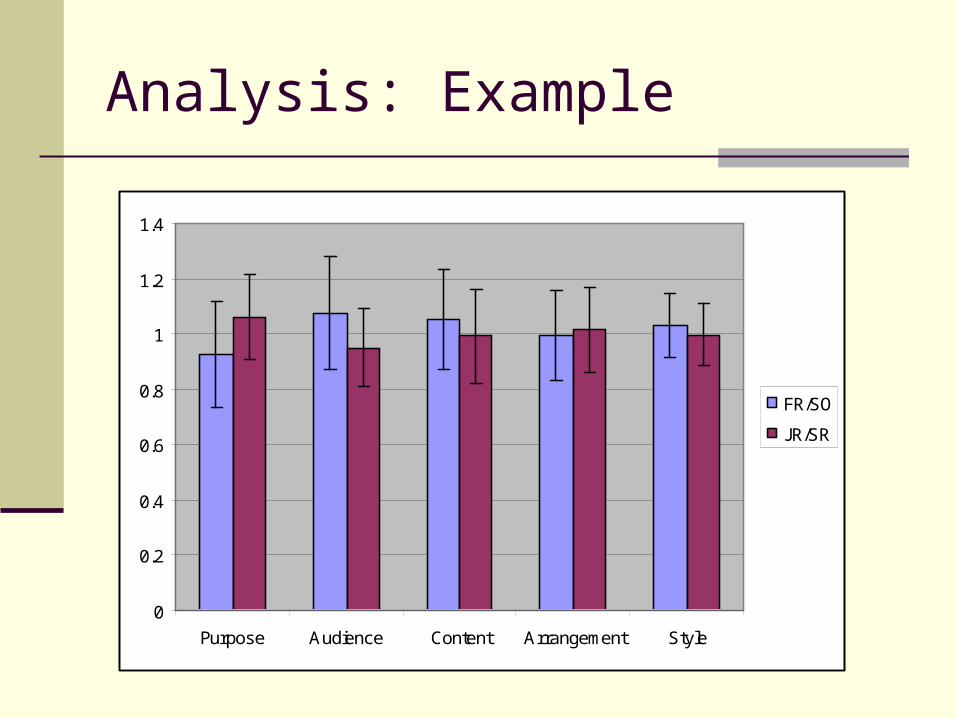
Analysis: Example
0
0.2
0.4
0.6
0.8
1
1.2
1.4
Purpose Audience Content Arrangement Style
FR/SO
JR/SR

Analysis: Example
Writing by Class and Library Use
0
0.2
0.4
0.6
0.8
1
1.2
1.4
1.6
1.8
Fall 05 Fall 04 Fall 03 Fall 02
Start Term
Avg
. W
riti
ng
Sco
re
> Library
< Library
Analysis: Example
Analysis: Example
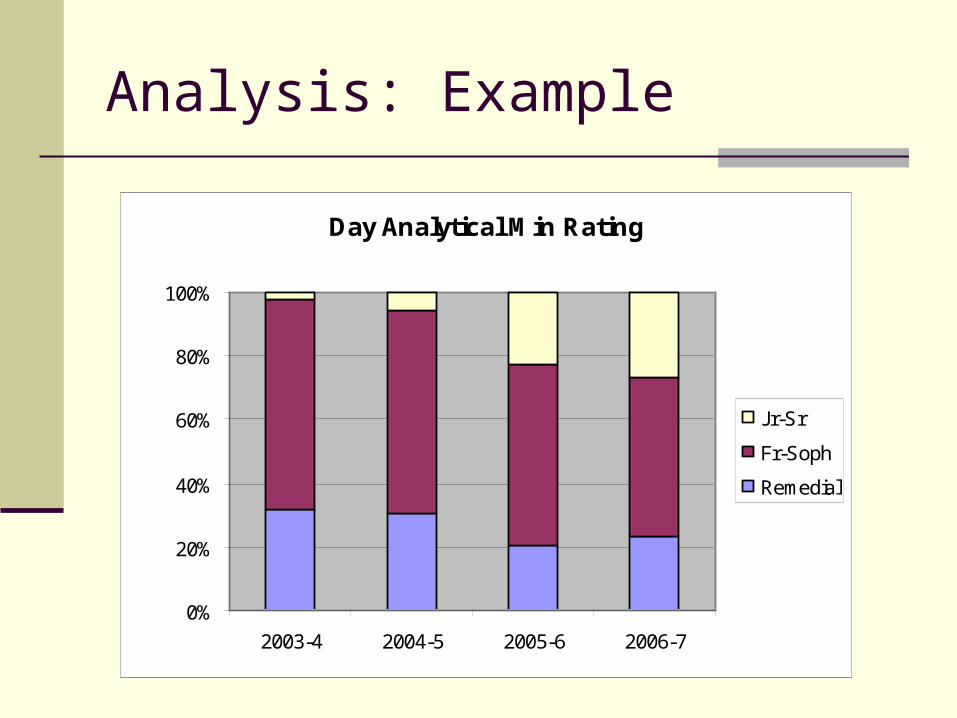
Day Analytical Min Rating
0%
20%
40%
60%
80%
100%
2003-4 2004-5 2005-6 2006-7
Jr-Sr
Fr-Soph
Remedial
Analysis: Example
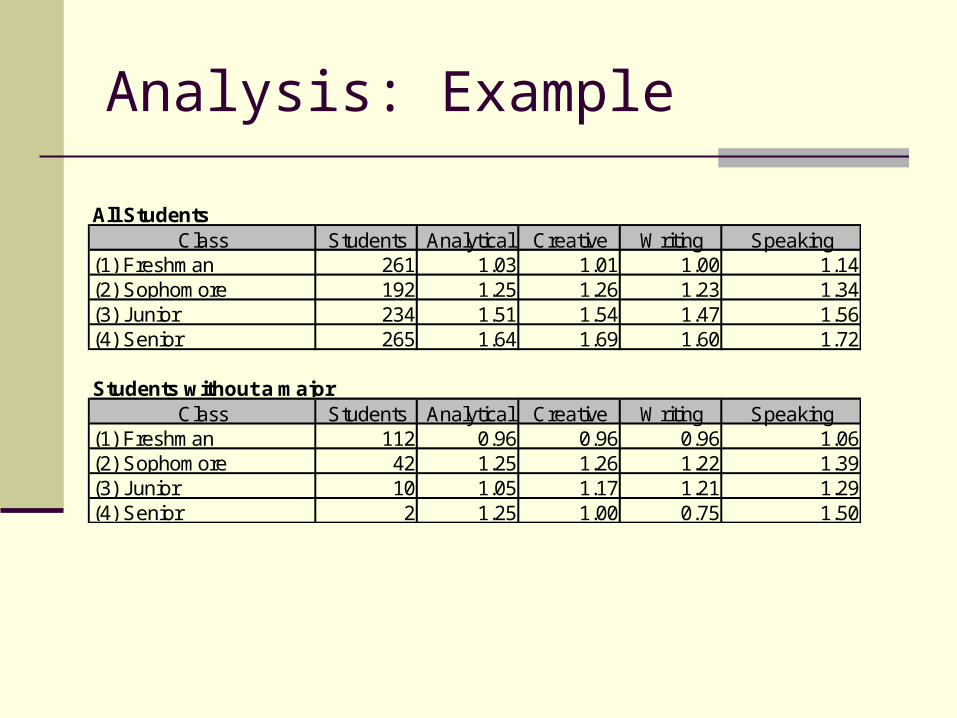
All StudentsClass Students Analytical Creative Writing Speaking
(1) Freshman 261 1.03 1.01 1.00 1.14(2) Sophomore 192 1.25 1.26 1.23 1.34(3) Junior 234 1.51 1.54 1.47 1.56(4) Senior 265 1.64 1.69 1.60 1.72
Students without a majorClass Students Analytical Creative Writing Speaking
(1) Freshman 112 0.96 0.96 0.96 1.06(2) Sophomore 42 1.25 1.26 1.22 1.39(3) Junior 10 1.05 1.17 1.21 1.29(4) Senior 2 1.25 1.00 0.75 1.50

Analysis: Example
Major Code Class Student ID Last First ObservationsArt (4) Senior xxxxxxx Stanislav Zza 10
Min Max AvgAnalytical Thinking Fr/So Jr/Sr 1.63Creative Thinking Fr/So Jr/Sr 1.50Writing Effectiveness Fr/So Jr/Sr 1.56Speaking Effectiveness Remedial Jr/Sr 1.33
Analysis: Example
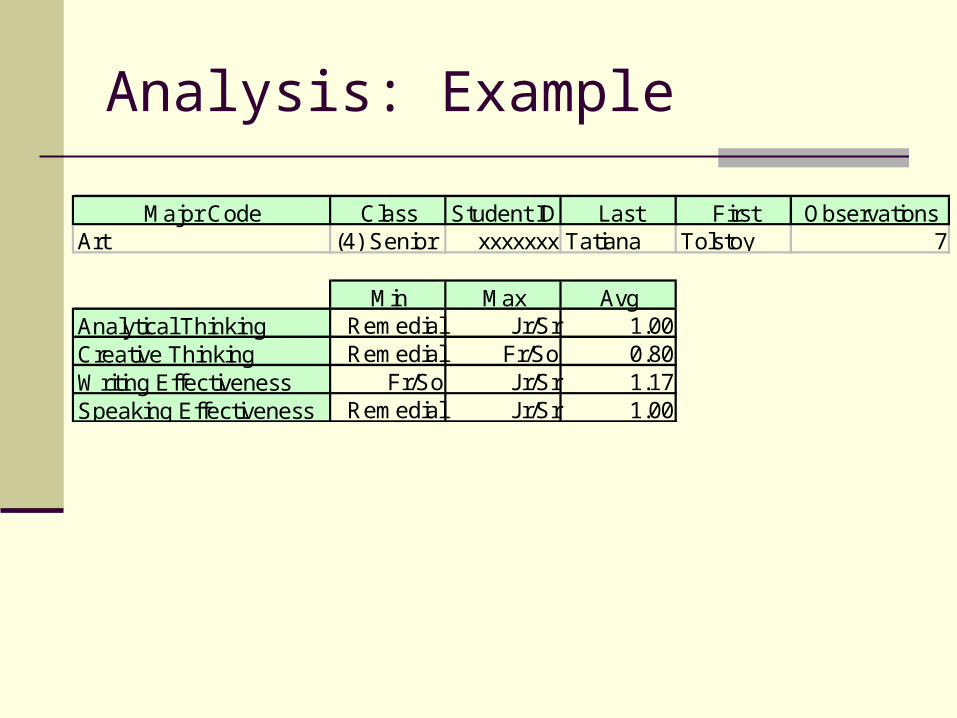
Major Code Class Student ID Last First ObservationsArt (4) Senior xxxxxxx Tatiana Tolstoy 7
Min Max AvgAnalytical Thinking Remedial Jr/Sr 1.00Creative Thinking Remedial Fr/So 0.80Writing Effectiveness Fr/So Jr/Sr 1.17Speaking Effectiveness Remedial Jr/Sr 1.00
Analysis: Example
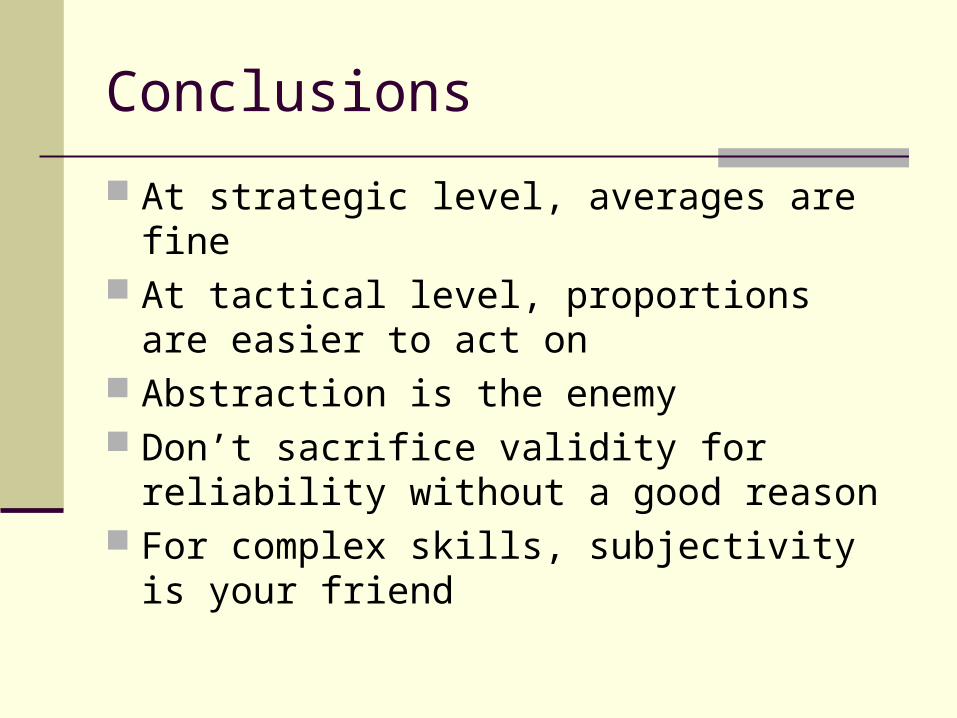
Conclusions
At strategic level, averages are fine At tactical level, proportions are easier to act
on Abstraction is the enemy Don’t sacrifice validity for reliability without a
good reason For complex skills, subjectivity is your friend

Last Requests?
highered.blogspot.com