Embed Size (px)
Citation preview

Why include bibliometric analysis in the activities of a library specialized in Astronomy?: notes from
the libraries of INTA
Miguel Ángel Alonso Valdivielso - Centro de Astrobiologia (CSIC-INTA)
Estefanía González Antonio (CAM)

BECAUSE…THE COMPETITIVE INTELLIGENCE & BIBLIOMETRY
ARE A LIBRARY TOOLS FACING THE CHALLENGE
OF NEW KNOWLEDGE SOCIETY
Miguel Ángel Alonso Valdivielso
CAB (INTA/CSIC)
Estefanía González Antonio (CAM)

Historically, from century to century and in all great cultures and societies, libraries have been the motor of the community.

XX century-XXI century
XX century--- Internet
XXI century ---Information Society
“Information is Power"

Competitive Intelligence
Evidently Competitive Intelligence acquires a completely different meaning in a public library than in a specialized library, a research centre or a private company.
Different types of monitoring (economic, social,
scientific, technological… determined by the environment).
Forecast Benchmarking Marketing

The Ten Steps of Keiser
Competitive Intelligence for libraries
Barbie E. Keiser is an information resources management consultant located in the Metro DC area.
Information Outlook Vol.6, No.12, December 2002.

Step 1: Identify Your Competition
In determining which libraries you will monitor, and to what extent, considerer both your current and potential competitors.
Identify libraries that are considered leaders, regardless of their location.
Who are the innovators and why are they so successful?

Step 2: Select the Qualitative and Quantitative Information
Select both the qualitative and quantitative information
you will need to adequately assess your competitors
strengthsweaknessesstrategies

STEP 3: Collecting the Data
• Identify papers presented at conferences by staff members of your main competitors.
• Search databases for articles written by staff members of your main competitors.
• Read any articles written about your competitors that mention their information operations.
• Conduct a formal survey, or hire party to do so (particularly useful in obtaining compensation range data)
• Network with library directors for personnel data and the “inside coop.”• See what information is available from library directories (e.g., directories of
the American Library Association and the Special Library Association).• Visit libraries (announced or unannounced) to assess the atmosphere and
see the staff in action.• Consult library. Web pages.
STEP 4: Assing responsabilities….
Assign responsibilities for gathering information and providing initial analysis.
To be effective, your competitive intelligence effort should involve your entire staff, both professional and paraprofessional. If all staff members are involved in assessing the need for creating new products and services, and improving the way in which they perform every tasks.

STEP 5: Organize and integrate the information
• In Step 5, you organize and integrate the information you have gathered and share it with staff members and a select team of supporters from outside your library/information center. Once the information is collected, the real work begins. isolate the key factors that contribute to its success.
• The bibliometric information gained from the library from time to time is used by the management of the centre as much is to evaluate its trajectory and its global position in the field of Astrobiology, as a hint for planning the strategic future of the centre.

STEP 6: Benchmarking I
• What makes your library special?
• How do you/could you differentiate your library from others?
• Are your customers loyal? If your competition offered a similar service, would they try it? Could you lose them? How might you prevent this from happening?

STEP 6: Benchmarking II
Benchmarking is a Total Quality tool used to measure and compare your library´s work processes with those in other libraries . The goal of benchmarking is to increase your library´s work processes with those in other libraries. The goal of benchmarking is to increase your library´s performance by adopting the best practises of your library benchmarking partners. Since best library practices are always evolving, benchmarking should be applied at least annually
Holly J. Muir, Library Benchmarking Explained

Step 7: gather your staff for regulary scheduled discussions
• what opportunities exist?
• Now that you understand how your competitors operate, considerer using the same strategies they use to deliver products and services to your target market. Some of your competitor will have skills similar to your staff in a favourable light vis-á-vis the competition.
This can be done by:
- Understanding what attracts customers to your competitors;- Determinig how yo can acquire the essential characteristics for success; and- Identifying the areas in which your organization is stronger than its competitors.

STEP 8
Using the results of the competitive intelligence process, considerer nor only which new products and services you can or should develop, but how you can improve your existing operations. Which features can you add to existing ones to enhance the products/services you offer? How will you alter your marketing targets and approaches?
Some improvement projects will focus on operational design:
• How can coordination and responsiveness be improved?• How can delays be eliminated?• How can decisions be made faster?

STEP 9
Involves communication of the results of your staff´s observations to management and users, including what you and your staff intend to do to improve operations, develop new products/services, or increase market share (number of users or targeted user communities). A formal report may be useful in some circumstances, but a few presentation slides that highlight where your organization stands vis-à-vis the competition may prove more effective.

STEP 10
The purpose of competitive intelligence is not merely to gather today´s information on your competitors or to anticipate what they will do tomorrow. Use the intelligence you gather to transform your own organization , building in the flexibility you´ll need to make fast changes, creating new products and services, establishing new alliances, altering the products mix, or changing the way in which your products/services are created/delivered.

Astrobiology Centre
Associated with the Astrobiology Institute of the NASA, this centre carries out research into the origin of life and its presence and influence in the Universe.
Scientists and technicians who are specialised in subjects such as astronomy, fluid dynamics, geology, biochemistry, genetics, remote sensing, ecology, computer sciences, robotics, etc.
Is a mixed centre INTA/CSIC

CAB(INTA/CSIC)
INTA
The Nacional Institute of Aerospace Technology is the Public Research Body specialized in Aeronautics and Space Research and Technology Development, attached to the Spanish Ministry of Defense.
The CSIC is the largest public research body in Spain.
CSIC
The CSIC (Consejo Superior de Investigaciones Científicas) is a multisector, multidisplinary public research entity attached to the Spanish Ministry of Science and Technology. It is a scientific institution which collaborates with the state, comunidades autónomas (regional authorities) and local authorities, as well as with other research institutions (universities, public and private research entities )

Library
• Relatively small centre, with about 100 investigators .
• Same requirements as far as consumption of information (specialized magazines, data bases…) as an University.
• The only solution was to incorporate
ourselves to the library network of the CSIC. At the moment we belong to this network and we are working on the task of belonging to the future library network of the Ministry of Defense.
CSIC Library Network
• One million monographs and 67,000 journal collections.
• One of the largest computerised catalogues in the country, known as CIRBIC. This catalogue contains 56% of the monographs and 100% of the journals available in all the CSIC libraries.
• CSIC Library Network situated in 21 cities of
10 regional authorities. • Of these, 17 belong to centres based in
different universities. As a whole, they are a highly specialized library resource of more than 1,400,000 monographs and more than 44,408 periodical titles (but through duplication, some 76,157 print subscriptions) as a well a maps, photographs, archives and manuscripts.

STEP 5: Bibliometric Indicators
• Bibliometric indicators seek to measure the quantity an impact of scientific publications- as a Proxy for the overall output of scientific research- and are base don a count of scientific papers and the citations they receive. Together with patent indicators, they are one of the most frequently used indicators of research and experimental development (R&D) “output”. Bibliometric indicators have been widely used in national science and technology statistics publications to measure scientific capacity and linkages to world science, both in developed and developing countries. (UIS Bulletin on Science and Technology Statistics, Issue No.2, September 2005)
• The most important bibliometrics studies are based in the SCI.

At CAB Studies of bibliometrics seek:
•Knowing the research lines of our researchers and their evolution over time.
•Analyze the characteristics of consumption and production of scientific information.
•Analyze trends in production and consumption of information.
•To evaluate the productivity of researchers and laboratories.
•Monitoring the quality of the publications that publish our research (impact factor) and guide our policies of publication toward magazines that are in the first percentile in our area, of course, in a center of excellence.•Measure the use being made of the resources engaged.
•Statistical justification for the financing of future projects.
•Detecting communication networks established between scientists
•Detect invisible colleges•Improving our service of information
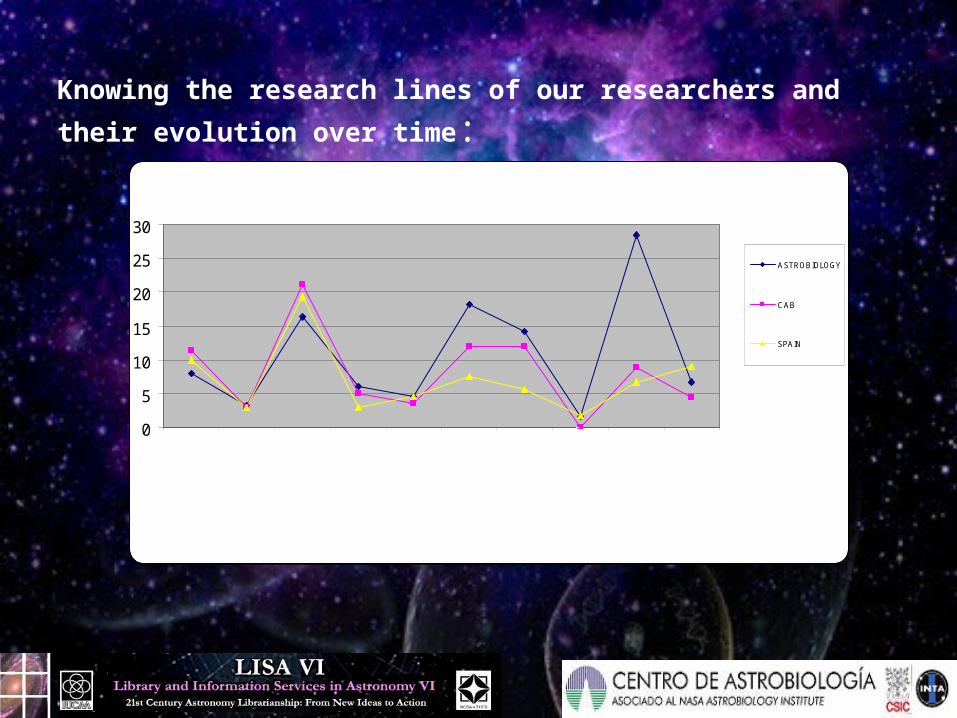
Knowing the research lines of our researchers and their
evolution over time:
Average Citations by Subjebt Areas (ASTROBIOLOGY)
0
5
10
15
20
25
30
AS
TR
ON
OM
Y &
AS
TR
OP
HY
SIC
S
GE
OS
CIE
NC
ES
,M
ULT
IDIS
CIP
LIN
AR
Y
MU
LTID
ISC
IPLI
NA
RY
SC
IEN
CE
S
GE
OC
HE
MIS
TR
Y &
GE
OP
HY
SIC
S
BIO
LOG
Y
BIO
CH
EM
IST
RY
&M
OLE
CU
LAR
BIO
LOG
Y
MIC
RO
BIO
LOG
Y
EN
GIN
EE
RIN
G,
AE
RO
SP
AC
E
GE
NE
TIC
S &
HE
RE
DIT
Y
PH
YS
ICS
,M
ULT
IDIS
CIP
LIN
AR
Y
ASTROBIOLOGY
CAB
SPAIN

Analyze the characteristics of consumption and production of scientific information.
1% 14%
18%
7%8%9%
14%
3%
1%
4%
9%
1% 8%
1% 1%
1%2%
0%
B (Philosophy)G (Geography)H (Social Sciences)P (Language)Q (Science-General)QA (Mathematics-Computers)QB (Astronomy)QC (Physics)QD (Chemistry)QE (Geology)QH /Biology)QK (Botany)QL (Zoology)QP (Physiology)QR (Microbiology)R (Medicine)T (Technology)Z (Information Resources)

Analyze trends in production and consumption of information.
0
20
40
60
80
100
120
140
160
180
1998 1999 2000 2001 2002 2003 2004 2005 2006 2007 2008
A&A GEOSCIENCES, MULTIDISCIP LINARY BIOLOGY
GEOCHEMISTRY MULTIDISCIP LINARY SCIENCES MICROBIOLOGY
BIOCHEMISTRY ENGINEERING, AEROSP ACE

To Evaluate the productivity of researchers and laboratories.
514,711037LAMMER, H
21,57117JENNISKENS, P
615,121218SELSIS, F
513,251068MAS-HESSE, JM
638,383078CHARNLEY, SB
43,56329WICKRAMASINGHE, NC
62626010EHRENFREUND, P
920,6226813SONG, I
112133616ZUCKERMAN, B
H-IndexAverageCitesPapersAuthor
Table 1. CAB Authors in Astronomy & Astrophysics.
1242AMILS, R
26183SCHULZE-MAKUCH, D
26183KYTE, FT
22,6783JENNISKENS, P
23,67113DAVIES, PCW
416,25654VIDAL, N
2994MANRUBIA, SC
34,75194LINEWEAVER, CH
517,831076HEDGES, SB
H-IndexAverageCitesPapersAuthor
Table 2. CAB Authors in Biology.

Monitoring the quality of the publications that publish our research (impact factor) and guide our policies of publication toward magazines that are in the first quartile in our subject area…
3258PLANETARY AND SPACE SCIENCE
1128METEORITICS & PLANETARY SCIENCE
168CHEMICAL GEOLOGY
1, 1 y 132, 4, 159MOLECULAR BIOLOGY AND EVOLUTION
4389ASTROPHYSICS AND SPACE SCIENCE
1 y 15 y 210PHYSICAL REVIEW E
1710JOURNAL OF GEOPHYSICAL RESEARCH-PLANETS
3, 4 y 416, 42, 12011JBIS-JOURNAL OF THE BRITISH INTERPLANETARY SOCIETY
1712MONTHLY NOTICES OF THE ROYAL ASTRONOMICAL SOCIETY
22213ORIGINS OF LIFE AND EVOLUTION OF THE BIOSPHERE
1213GEOLOGY
1513EARTH AND PLANETARY SCIENCE LETTERS
1 y 121 y 1915APPLIED AND ENVIRONMENTAL MICROBIOLOGY
1319PNAS
1121SCIENCE
21425ICARUS
11028ASTRONOMY & ASTROPHYSICS
1245NATURE
1355GEOCHIMICA ET COSMOCHIMICA ACTA
1568ASTROPHYSICAL JOURNAL
2 y 117 y 1380ASTROBIOLOGY
QuartileRank.CAB PAPERSJORNAL

Detecting communication networks established between scientists

Bibliometric Indicators
Subject distribution in Astrobiology
30%
15%11%
9%
7%4%
3%3%
2%2%2%2%2%2%2%1%1%1%1%1%
ASTRONOMY & ASTROPHYSICS GEOSCIENCES, MULTIDISCIPLINARY
BIOLOGY GEOCHEMISTRY & GEOPHYSICS
MULTIDISCIPLINARY SCIENCES MICROBIOLOGY
BIOCHEMISTRY & MOLECULAR BIOLOGY ENGINEERING, AEROSPACE
BIOTECHNOLOGY & APPLIED MICROBIOLOGY PHYSICS, MULTIDISCIPLINARY
METEOROLOGY & ATMOSPHERIC SCIENCES GENETICS & HEREDITY
CHEMISTRY, PHYSICAL CHEMISTRY, MULTIDISCIPLINARY
ENVIRONMENTAL SCIENCES EVOLUTIONARY BIOLOGY
GEOLOGY SPECTROSCOPY
PHYSICS, ATOMIC, MOLECULAR & CHEMICAL PHYSICS, MATHEMATICAL

BENCH:18th Century in Sweden there was a magazine "Den Goteborg
Spionen" which reported on technological developments in other countries.
• We analyze how their use of bibliometrics these institutions:
• University of Stockholm• KTH of Stockholm• Karolinska Institutet• University of Umea
The most significant thing for us was to know the routine use of a series of bibliometric markers by the bibliometric markers by the Karolinska Institutet,Karolinska Institutet,

CAB usage: At CAB we currently give every contributing unit full credit for the publication, i.e. no fractionalization or weighting between authors or institution
is used
• Description: The number of scientific Publications produced by the analyzed unit Turing the analyzed time span. Sometimes results are also presented separately per document type.
• Calculation: Count the full number of scientific publications produced at the analyzed unit during the analyzed time span.
Advantges:
• Relatively easy to produce.
Disadvantages:
• Does not take the size of the analyzed unit into account and does not say anything about the impact of the publications
NUMBER OF PUBLICATION

CAB usage: At CAB , publications where the analyzed unit is only a part contributor is fully accounted to the unit, i.e. not fractionalization or weighting
between authors is currently used.
• Description: The number of scientific publications produced by the analyzed unit during the analyzed time span, found in the Thomson ISI indices.
• Calculation: Count the full number of publications in Thomson ISI indices, produced at the analyzed time span.
Advantages:
• Easy to retrieve from the Thomson ISI web of science.
Disadvantages:
• Does not take the size of the analyzed unit into account and does not say anything about the impact of the publications. Does not take into account publications not present in the Thomson ISI indices.
NUMBER OF ISI PUBLICATIONS

CAB usage: At CAB, journals classified as being focused on other subject than life sciences are sometimes excluded from the journal list to make the indicator more
relevant for assessmets of life science research. No fractionalization or weghtin between authors is currently used. At CAB, we also sometimes limit the selection of journals to
journals containing original research articles, that is not pure review journals.
• Description: The number of publications the analyzed unit has published in a selected number of journals during the analyzed time span.
• Calculation: Select journals according to a suitable criterion. Check how many of the unit, s publications that are published in these journals during the analyzed time span.
Advantages:
• Does reflect the potential impact of the unit´s articles more than a more publication count.
Disadvatages:
• Does not take the size of the analyzed unit into account
NUMBER OF PUBLICATIONS IN TOP JOURNALS

CAB usage: At CAB, publications where the analyzed unit is only a part contributor of the publication is fully accounted to the unit, and thus also the
corresponding citation count.
• Description: The total number of citations to articles published by analyzed unit during the analyzed time span.
• Calculation: Find all articles published by the analyzed unit during the analyzed time span and sum their citation values (usually retrieved from the Thomson ISI indices via Web of Science or another source to the indices)
Advantages:
• Gives an indication of the scientific impact the unit´s published articles as a whole.
Disadvantages:
• Does not take into account that older articles usually are more cited and that citation rates vary between document types and subject areas. Does not compensate for the size of the unit.
CITATIONS

CAB usage: At CAB, citations to publications where the analyzed unit is only a part contributor of the publication is fully accounted to the unit.
• Description: The average number of citations to articles published by an analyzed unit during the analyzed time span
• Calculation: Find all articles published by the analyzed unit during the analyzed time span in a citation indez, sum up the citations and divide by the number of publications.
Advantages:
• Gives and indication of the average scientific impact of the unit´s published articles.
Disadvantages:
• Does not take into account that older articles usually are more cited if a variable, cumulative citation time window is used, and that citation rates vary between document types and subject areas..
CITATIONS PER PUBLICATION

CAB usage: At CAB, publications where the analyzed unit is only a part contributor of the publication is fully accounted to the unit, and thus also the
corresponding citation count.
• Description: The h-index is the number of publications (h), attributed to the analyzed unit duringthe analyzed time span, tha have least h citations.
• Calculation: Find the unit´s published articles in a citation index and sort them in descending order by number of citations. Count articles from the top of the list and downwards, and when the number of an article rises above the citation count for that very article, the number of the preceding article is to be counted as the h-index.
Advantages:
• Very easy to calculate in the ISI Web of Science
Disadvantages:
• h-index gives positive bias to senior researchers with older articles, since these have had more time to be cited, though the demand that new articles with comparable citation levels has to be added has a certain damping effect on that bias .
H-INDEX

• Description: The share of a unit´s publications that remain uncited after a certain time period. Self-citations should be removed from the citation count.
Calculation:
• Count the number of publications that have never been cited during a specified time period, excluding self-citations.
• Divide with the total number of publications from the same unit during the same time period.
UNCITEDNESS

• Description: The share of a unit´s received citations where authors refer to their own papers.
Calculation:
• Count the total number of citations to the unit´s publications during the analyzed time span. Check where citations are coming from and count the number coming from the unit itself. Divide the second number with the first to get share of self citedness.
SELF CITEDNESS

Calculation: Count the number of articles published by the analyzed unit during the analyzed time span and check how many that was co-authored together with a selected
other unit. Divide the second figure by the first one to get the share of articles co-authored between the units.
Description:
This group of indicators is used to show to what extent an analyzed unit cooperates with other units in the production of articles.:
• International collaboration- share of publications with co-authors from organizations in at least two different countries.
• Natinal collaboration-share of publications with co-authors from at least two organizations within the same country.
• Department collaboration- share of publications with co-authors from at leasttwo department within the same organization.
• Unit collaboration-share of publications with co-authors from two or more research units.
CO-AUTHORING Share of articles co-authored with another unit.

• Usage: Used to measure the impact of scientific journals.
• Description: The ISI impact factor is a number that corresponds to the average number of citations a publication in a specific journal has received during the two years following the year of publication.
Calculation:
• The ISI impact factor for a specific journal (j), one specific year (y) is calculated by counting the number of citations to articles in that journals the two preceding years (Y-1 and Y-2) from publications in year Y and dividing this with number of publications defined by Thomson ISI as “citeable” in journal J the two preceding years (Y-1 and Y-2)
ISI JOURNAL IMPACT FACTOR

This indicator is the mean value of all the normalized citation counts for publications in this journal.
• Description: Equal to an item oriented field normalized citation score for articles from only journal.
This indicator corresponds to the relative number of citations to publications in one specific journal, compared to the world average of citations to publications of the same document type, age and subject area.
The indicator is stated as a decimal number that shows the relation of the number of citations to the world average. As an example, 0,9 meansthat publications in this journal are cited 10% below average and 1.2 that they are cited 20% above average.
• Calculation: The number of citation to each of the journal´s publications is normalizaed by dividing it with the world average of citations to publications of the same document type, publication year and subject area, which is called the field citation sore. If as article is classified as belonging to several subject areas, the mean value of the field citation scores is used..
NORMALIZED JOURNAL IMPACT

Usage:
• Used to measure the relative impact of scientific journals
Description:
• A more advanced journal impact factor than the ISI Impact Factor that takes both journal subject areas and document types into consideration. This makes comparison possible between journals in different subject areas.
• The journal to field impact score compares citations to one specific journal to the world average of citation to journals in the same subject area.
• An improvement of the ISI impact factor is to extend the period of measurement to for instance 5 years, since most articles hae their citation peak 2-3 year after publication.
• A Second improvement is to extend the ISI range of “citable publications” to include documents of type “letter”, to make it more difficult to manipulate the impact score and to have the same publications types in bothe the numerator and the denominator..
JOURNAL TO FIELD IMPACT SCORE

UMEA INFORSK GROUP
• More than twenty years apllying library scientist research methods to answer fundamental questions of research areas such as library science an infomation science
• The group is one of the most prestigious in the world in bibliometrics, Olle Persson, a “referent” in the discipline has published over 35 articles ISI

BibExcel
The tool is designed for analyzing bibliographic data, or any type of data in text format. The idea is to create data files that can be exported to Excel or similar programs for further processing.
• Bibliometric citation analysis
• Co-citation
• Shared references
• Bibliographic coupling
• Cluster analysis
• Prepare bibliometric maps, mappingPajek, NetDraw
• Bibexcel uses ISI records, SCI, SSCI, but Bibexcel can also convert other format

Networks of collaboration betwen Astrobiology's Centres.

It is difficult to predict the accurate nature of changes in libraries during the next years, but it may be the moment for certain issues,
such as open access, benchmarking, prospective, Knowledge Management or marketing, to be used as tools for libraries to overcome Information and Knowledge Societies challenges.
Dhanyavaad Thank You