Embed Size (px)
Citation preview

Printed: 7/22/2020 Preliminary Draft: Comments Welcome
0
Why is Chester, Pennsylvania, So Poor?
John P. Caskey1
Department of Economics
Swarthmore College
January 2020
Abstract: Chester, with a poverty rate of 36 percent, is one of the poorest cities in the Philadel-
phia metropolitan region and, indeed, the country. Chester’s poverty is often blamed on deindus-
trialization and a decline in employment opportunities. But a far more important factor is the
concentration of the region’s low-cost rental housing in the City. Much of this housing consists
of project-based government-subsidized apartments that are restricted to low-income households.
In addition, as an old industrial City, Chester has an abundant supply of antiquated private hous-
ing with low market values and low rental rates. Low-cost housing is relatively scarce in most of
the county surrounding Chester. Poor households move to Chester, or remain in Chester, be-
cause that is where they can afford to live.
1 I am grateful to my friends at Chester Community Improvement Project (CCIP) for sparking
my interest in Chester over twenty years ago and for sharing their deep commitment to the wel-
fare of the community. I thank Swarthmore College students, especially Laura Wagner and Ian
Street, for significant contributions to my broader Chester research project. I also thank numer-
ous friends, colleagues, and outside experts who provided helpful comments on earlier drafts of
this paper. The views expressed in this paper are my own, and do not necessarily represent the
views of any organization with which I am affiliated.

Printed: 7/22/2020 Preliminary Draft: Comments Welcome
1
Why is Chester, Pennsylvania, So Poor?
John P. Caskey
Department of Economics
Swarthmore College
January 2020
I. Introduction
Chester, Pennsylvania, is a city of 34,000 people located along the Delaware River, about
fifteen miles south of Philadelphia. According to the federal poverty standard, 36 percent of the
people who live in Chester are poor. That is three times the national average, and substantially
higher than the poverty rate in Philadelphia, which itself has one of the highest poverty rates
among large U.S. cities.
This paper asks why Chester has so much poverty. There is a compelling rationale for
tackling this question. As substantial evidence demonstrates, children who grow up in neighbor-
hoods with high levels of poverty are adversely affected by their community surroundings
(Chetty and Hendren, 2018). Data from the renowned Moving-to-Opportunity experimental
study, to cite just one example, show that children who were young when their families moved
from high-poverty neighborhoods to low-poverty neighborhoods had notably higher earnings as
adults than did the children in similar families who remained in the high-poverty neighborhoods
(Chetty, Hendren, and Katz, 2016).
There is also a compelling rationale for focusing on Chester, rather than asking why con-
centrated pockets of poverty exist more generally in U.S. cities.2 Chester is a small city both in
terms of population and land area. Its boundaries encompass about five square miles. By focus-
ing on Chester, I can offer a more detailed account of the factors that account for its high poverty
rate than I could it I were to try to explain concentrations of urban poverty generally. At the
same time, Chester’s story is not unique and can, to some extent, shed light on the experiences of
2 For a recent description of trends and cross-city differences with respect to urban concentra-
tions of poverty more generally, see the report by Paul A. Jargowsky (2013).

Printed: 7/22/2020 Preliminary Draft: Comments Welcome
2
other cities. Chester is an old industrial city that has lost substantial population since the 1950s.
As it did so, it became a predominantly African American city and a city with high rates of pov-
erty. In many ways, its story is similar to the stories of Detroit, Michigan, Gary, Indiana, Cam-
den, New Jersey, and numerous other old industrial cities that have fallen on hard times.
It is common to argue that cities, such as Chester, are poor because industrial decline
took away people’s jobs. Deindustrialization certainly plays a role in the historical evolution that
led to Chester’s current poverty. But I will argue that the main reason that Chester has such a
high poverty rate is because people with low incomes can more easily find affordable housing in
Chester than they can in surrounding communities. In other words, there are two ways to ap-
proach the opening question: Why is Chester so poor? One approach asks: Why do so many
Chester residents have low incomes? A second approach, and the one I emphasize in this paper,
asks: Why do so many people with low incomes become, or remain, Chester residents?
As noted, my argument is that Chester is home to a disproportionate share of poor house-
holds because it hosts a disproportionate share of the region’s “affordable” housing. This hous-
ing is of two types. The first is site-specific rental housing subsidized by the federal government.
This includes public housing, housing built with low-income housing tax credits, and housing
subsidized by programs known as “Project-based Section 8,” “Section 202,” and “Section 811.”
With minor exceptions, only low-income households can rent this housing. I estimate that Ches-
ter has 2,110 such housing units for its 11,502 households. The rest of the surrounding county
has 2,007 subsidized project-base housing units for 193,368 households. The heavy concentra-
tion of such housing in Chester effectively ensures that Chester will have a high poverty rate.
The second major source of low-cost housing in Chester is antiquated private housing that no
longer meets middle-class standards. As an old industrial city, such housing is abundant in
Chester. This housing sells and rents for substantially lower prices than the newer housing in the
surrounding geographic region. This too attracts lower-income households to Chester.
II. An Introduction to Chester and Its Post-War Decline
Chester (shaded in blue in Map 1 below) is a small city of 4.8 square miles located along
the Delaware River, about 15 miles south of downtown Philadelphia and 15 miles north of Wil-
mington, Delaware. It has long been directly connected to both cities by commuter and freight

Printed: 7/22/2020 Preliminary Draft: Comments Welcome
3
rail lines and an interstate highway, I-95. It is also connected to New Jersey by a bridge across
the Delaware.
Map 1
Chester is part of Delaware County (outlined in red in Map 2), an older suburban county
lying southwest of Philadelphia. In 1890, Chester was a small city of about 20,000 people, but it
grew rapidly over the subsequent three decades as existing industries in the City grew and new
ones opened. Given Chester’s location alongside the Delaware River, its long-standing rail con-
nections to major cities along the East Coast, and its proximity to Philadelphia, it was an ideal
location for heavy industry. It particularly boomed as industrial output jumped to meet the de-
mand created by World War I. By 1930, the city had a population of almost 60,000 and was
densely settled. Most people lived in modest brick rowhouses that dated from the 1910s and
1920s. Streetcar lines crisscrossed the city and passenger trains, headed to Philadelphia, New
York, and Washington, D.C., stopped regularly in the City.

Printed: 7/22/2020 Preliminary Draft: Comments Welcome
4
Map 2
Following a slump associated with the Great Depression, Chester boomed again in World
War II as its industries revved up to meet wartime demand. A major challenge for the City was
finding a way to house the workers flocking to the City to work in its shipyards and other indus-
tries. Using federal funding intended to counter the effects of the Great Depression, by the early
1940s a newly created Chester Housing Authority had constructed three public housing projects
intended for low-income families. During the war, however, the government set aside many of
the units in these projects to house workers in the war-related industries. In addition, local
homeowners commonly took in borders or subdivided their homes to create small apartments for
the families of industrial workers. By 1950, Chester was a city of about 66,000 people and was
the dominant commercial and residential center of Delaware County. The major employers con-
tinued to be large industrial operations located along the Delaware River. These included Sun
Shipbuilding and Dry Dock, Ford Motor Company, Scott Paper Company, American Dye
Works, and others. Chester also had a strong retail sector, with department stores, movie houses,
restaurants, etc.
Chester’s population peaked around 1950. After that, it began to decline due to several
factors. First, with the end of the wartime boom and the movement of U.S. industry to nonunion

Printed: 7/22/2020 Preliminary Draft: Comments Welcome
5
Southern states, many major industrial employers reduced their operations in Chester, and their
workers moved away to take jobs elsewhere. Second, with post-war prosperity and rapidly in-
creasing automobile ownership rates, new suburban communities grew rapidly in outlying parts
of Delaware County, and many middle-class white residents of Chester moved to these commu-
nities in search of newer homes with modern amenities, yards and attached garages.3 Third,
prior to the 1960s, Chester was rigidly segregated by race. While the overall population of Ches-
ter was about one-third African American in 1960, Blacks and whites did not attend the same
schools, did not attend the same churches, and did not live in the same neighborhoods. Even
Chester’s public housing projects were segregated by race. In the 1960s, the Civil Rights move-
ment challenged this system of de facto segregation, and community activists and the courts
forced Chester’s government to integrate the schools and public housing. Chester’s middle-class
whites could continue to live in nearly all-white communities by moving from Chester into the
newer suburban communities of Delaware County, and many did. All of these factors led to a
dramatic decline in Chester’s white population between 1950 and 1990. Chester’s Black popula-
tion grew but not sufficiently to offset the loss of its white population, and Chester’s population
fell dramatically (see Figure 1). At the same time, most of the retail stores in Chester that pre-
dominantly served whites closed, and by the 1980s Chester had become notorious for its large
number of vacant homes and vacant storefronts.
Figure 1
3 Some African Americans, who also tried to move into these communities in the 1950s and
1960s, were treated with open hostility by white residents (Mele, 2017).
0
10,000
20,000
30,000
40,000
50,000
60,000
70,000
1910 1920 1930 1940 1950 1960 1970 1980 1990 2000 2010
Chester Population Trends
Total Population
White Population
Black Population

Printed: 7/22/2020 Preliminary Draft: Comments Welcome
6
III. Contemporary Poverty in Chester
Although Chester retains middle-class neighborhoods, some beautiful old homes, and his-
toric buildings, contemporary Chester is a strikingly poor city. As shown in Table 1, more than a
third of Chester’s residents live in poverty. This is nearly three times the poverty rate of the
greater Philadelphia metropolitan area, and it is more than three times the poverty rate of Dela-
ware County, the county that encompasses Chester. It is ten percentage points higher than that of
the City of Philadelphia, whose poverty rate is second only to Detroit (with a 34.5% poverty rate)
among the 25 largest U.S. cities.
Table 1
Population Number in
Poverty
Poverty
Rate
Median
Household
Income
Percentage
Black
Percentage
Hispanic
(any race)
City of Chester 34,102 11,107 35.9% $29,954 70.3 11.9
Philadelphia
metro area4 6,065,644 773,077 13.1% $66,285 21.0 9.0
Philadelphia 1,569,657 393,924 25.8% $40,649 42.6 14.1
Delaware
County 563,384 56,639 10.4% $69,839 21.2 3.6
Source: American Community Survey (ACS) 2013-17 (PolicyMap)
A city’s official poverty rate measures the percentage of people living in households with
very low cash incomes, adjusted for household size and composition. An alternative measure of
the prosperity of a city is its median household income, i.e. the income of a household in the
middle of the city’s income distribution. By this standard, Chester is also strikingly low income.
As shown in the table above, Chester’s median household income is less than half that of the
Philadelphia metropolitan area. It is 43% of that of its surrounding county and 74% of that of
4 The Philadelphia metro area is called the Philadelphia-Camden-Wilmington Metro area by the
U.S. Census Bureau. This metro area includes five counties in Pennsylvania (Bucks, Chester,
Delaware, Montgomery, and Philadelphia), four counties in New Jersey (Burlington, Camden,
Gloucester, and Salem) and two counties in Delaware (Cecil and New Castle). Despite the con-
fusing overlap in names, the City of Chester is part of Delaware County, not Chester County.

Printed: 7/22/2020 Preliminary Draft: Comments Welcome
7
Philadelphia. As also shown in the Table, 70 percent of Chester’s residents are African Ameri-
cans and twelve percent are Hispanic. In other words, Chester is not only poor relative to neigh-
boring urban and suburban communities, it is a city comprised of racial and ethnic minorities.5
To understand the poverty of Chester, one must analyze Chester’s housing and employ-
ment opportunities in the context of a larger geographic market than just Chester. Since 5-
square-mile Chester is surrounded by 191-square-mile Delaware County, it is helpful to contrast
it with other large municipalities in the County. Delaware County consists of 49 “subdivisions,”
with their own local governments. These subdivisions include Chester (a “city” under Pennsyl-
vania law) and 48 “townships” and “boroughs.” The subdivisions range in size from 83,000 peo-
ple to fewer than 1,000. Table 2 provides summary socioeconomic data for the County and its
six municipalities with populations over 20,000. Chester has a notably higher poverty rate and
representation of African American and Hispanic households than do the others.
Table 2
Population
Percentage
Black
Percent
Hispanic
Median HH
Income
Poverty
Rate
Delaware County 563,384 21.2 3.6 $69,839 10.4
Upper Darby Township 82,993 33.8 6.0 $52,974 14.2
Haverford Township 49,089 3.3 1.7 $102,838 3.5
Chester (City) 34,102 70.3 11.9 $29,954 35.9
Radnor Township 31,710 6.2 4.3 $111,607 9.9
Ridley Township 31,117 6.4 3.4 $69,347 7.5
Springfield Township 24,253 0.9 1.2 $106,926 2.4
Source: ACS 2013-17 (PolicyMap)
5 Within the Philadelphia metropolitan area, Camden, NJ, is another city that closely parallels
Chester in socioeconomic characteristics. With nearly 76,000 residents in 9 square miles, Cam-
den is somewhat larger by population and geography. Its poverty rate of 37.4% and median
household income of $26,105 indicate that it is even slightly poorer than Chester. A notably
smaller percentage of its population is African-American (45.4%) and a larger percentage is His-
panic (48.5%).

Printed: 7/22/2020 Preliminary Draft: Comments Welcome
8
Map 3 illustrates overall patterns with respect to poverty rates in census tracts across Del-
aware County. A typical census tract in the County has about 4,000 people, but they range in
size from 1,200 to 9,700. As shown in the map, the census tracts in Delaware County with pov-
erty rates of 35 percent or higher (the darkest shades of blue) and 30 to 35 percent (the second
darkest shading) are all clustered in and around Chester and along the border with Philadelphia.
Map 3
Source: PolicyMap
IV. Is Chester’s Poverty Due to a Lack of Jobs in Chester?
Many people approach the opening question, “Why is Chester so Poor?,” as asking why
so many people in Chester have low incomes. Taking this perspective, a common response is

Printed: 7/22/2020 Preliminary Draft: Comments Welcome
9
that Chester’s poverty is due to a shortage of jobs, or good-paying jobs, in the City. A recent ex-
ample is found in the “City of Chester Act 47 Exit Plan,” a report on the city government’s fiscal
challenges prepared by a Philadelphia-based consulting firm (Econsult Solutions, 2018):
Devastated by decades of deindustrialization and population loss, the City of
Chester is one of Pennsylvania’s poorest jurisdictions, with a weak economy ex-
hibiting little or no growth, and correspondingly high unemployment with few job
opportunities to reverse the course. (p. 3)
Any account of how Chester evolved to become a poor city must recognize the major role
played by deindustrialization. As the manufacturing firms located mainly along the Delaware
River shrank and closed between 1950 and 1990, local jobs were lost and the City lost tax reve-
nue. But this does not imply that bringing more jobs to Chester in the current era will make a
significant contribution to reducing poverty in the City. In the contemporary U.S. economy, peo-
ple frequently work outside the communities in which they live. Most people drive to work, and
commutes of 30 minutes or more are common. In other words, the job market for Chester resi-
dents does not just consist of the jobs available in the City of Chester. Chester residents work
throughout Delaware County and the Philadelphia metropolitan region. Moreover, jobs in Ches-
ter are filled by Chester residents and many nonresidents. From this perspective, adding 100 or
1,000 jobs in Chester would do little to change the metropolitan job market in which Chester res-
idents work, or look for work. This is not to say that adding such jobs would bring no benefits to
Chester residents. More local jobs might enable some Chester residents to work closer to home.
More jobs in the City could also generate more municipal tax revenue, enabling the City to im-
prove local public services. But to the extent that employment problems contribute to the low
incomes of Chester residents, adding jobs in Chester itself will have almost no effect on their
employment opportunities in a big metropolitan labor market.
Census data support this description of how people commute to work and where they
work. As shown in Table 3, 70 percent of employed Chester residents drive to work, meaning
they could easily reach nearly all jobs in Delaware County and many jobs in Philadelphia and
Wilmington with a half hour commute. Another 16 percent of employed Chester residents take
public transportation to work. This is not surprising. Chester is relatively well-served by com-
muter rail and bus lines that connect its residents to many major employment centers in the re-

Printed: 7/22/2020 Preliminary Draft: Comments Welcome
10
gion. It is true that nearly a third of Chester residents belong to a “carless” household as com-
pared to 11% in Delaware County generally. But many of these carless Chester households are
headed by individuals who do not work due to age, health, or child-care responsibilities. In
short, only a very small share of Chester residents in the labor market are restricted to working
within the City’s boundaries.
Table 3
Of residents who work: Delaware
County City of Chester
Percentage who drive to their job 80.2% 69.9%
Percentage who take public transportation to their job 10.5% 16.0%
Percentage who walk to their job 3.8% 8.9%
Of all households:
Percentage households without a vehicle 10.6% 31.3%
Average number of vehicles per household 1.7 1.0
Source: ACS 2013-17 (PolicyMap)
A second way to emphasize that the labor market for Chester residents extends far be-
yond the borders of the City itself is to show where Chester residents work. As shown in Table
4, only 9.2 percent of employed Chester adults in 2017 worked in the City of Chester.6 More
Chester residents worked in Philadelphia than in Chester itself.
6 These data are for primary jobs. The 2017 data do not include employment counts for employ-
ees of the federal government. The 2015 data do, and the pattern of employment is nearly identi-
cal. This is also true for the data in Table 5 below.

Printed: 7/22/2020 Preliminary Draft: Comments Welcome
11
Table 4
Location of Work for Employed Chester
Residents in 2017 Number of Workers
Percentage of Chester
Working Adults
Total workers living in Chester 11,844
Live & work in Chester 1,092 9.2%
Work in Delaware County, but not in Chester 4,181 35.3%
Philadelphia, PA 1,973 16.7%
Montgomery County, PA 1,040 8.8%
Chester Co, PA 735 6.2%
New Castle Co, DE 696 5.9%
Other 2,127 18.0%
Source: U.S. Census Bureau, Longitudinal Employer Household Dynamics (2017)
Just as Chester residents can work outside the City, non-residents fill a large share of
Chester’s jobs. In fact, as shown in Table 5, only twelve percent of the jobs in Chester in 2017
were held by Chester residents.
Table 5
Location of Residence for People Working
in Chester Number of Workers
Percentage of Jobs in
Chester
Total working in Chester 9,021
Live & work in Chester 1,092 12.1%
Live in Delaware County, but not in Chester 2,970 32.9%
Philadelphia, PA 1,250 13.9%
New Castle Co, DE 726 8.0%
Chester Co, PA 565 6.3%
Other 2,418 26.8%
Source: U.S. Census Bureau, Longitudinal Employer Household Dynamics (2017)
The point is simple. Chester residents in the labor market, who are poor, are not poor be-
cause there are not enough jobs, or high-paying jobs, on their block or in the City of Chester.
Rather, they are poor because they cannot, or do not, obtain jobs with adequate pay within a rea-
sonable commute of where they live. Numerous factors can explain this. The workers may lack

Printed: 7/22/2020 Preliminary Draft: Comments Welcome
12
the skills needed for better-paying jobs. They might have the skills, but employers may assume
that they do not. Child-care, elder-care, or their own health problems could prevent them from
working enough hours to achieve an adequate income. Employers could shun them due to crimi-
nal records. In addition, many people who are poor live in households where no one is in the la-
bor market. These include households headed by those too old or too unhealthy to work, as well
as those taking care of very young children. More jobs in Chester will not affect the poverty rate
among such households.
I am certainly not the first person to argue that it is a mistake to assume that the employ-
ment opportunities of the residents of a small geographic region are closely tied to the jobs in
that small region. Alan Mallach, a city planner who specializes in regional development issues,
recently studied the economic status of thirteen small formerly-industrial cities in Pennsylvania,
New Jersey, and Delaware. Chester was one of the thirteen cities. Mallach concludes (2012, pp.
47-48):
The presence of a strong job base within a city may or may not benefit the resi-
dent workforce, as large numbers of those jobs may be held by workers who com-
mute from outside the city. …This has significant implications for public policy.
It makes clear that creating jobs in a city, in and of itself, may have little or no ef-
fect on the workforce opportunities, for city residents….A weak local economy
does not prevent its residents from finding gainful employment within the re-
gion… This is likely to be particularly true with respect to small cities, where the
suburbs are literally around the corner…
V. Chester’s Poverty and the Concentration of Affordable Housing in Chester
Just as labor markets are not defined by the boundaries of a small community in a big ur-
ban area, neither are housing markets. The adults living in Chester choose to live there, and not
somewhere else in the metropolitan area. And, tautologically, Chester has a high poverty rate
because a disproportionate share of poor people lives there. From this perspective, the opening
question, “Why is Chester So Poor?” becomes: Why do so many low-income households choose
to live in Chester? To make this tractable, I’ll focus just on Delaware County and ask: Why do
so many poor people choose to live in Chester and not in other parts of Delaware County?
The answer to this question is straightforward: To a large extent, the choice is made for
them --- Chester is one of the few communities in Delaware County where low-income house-
holds can find affordable housing. This is illustrated in Table 6, which lists poverty rates, home
values, and two-bedroom rental rates for Delaware County and its six largest municipalities. The
Printed: 7/22/2020 Preliminary Draft: Comments Welcome
13
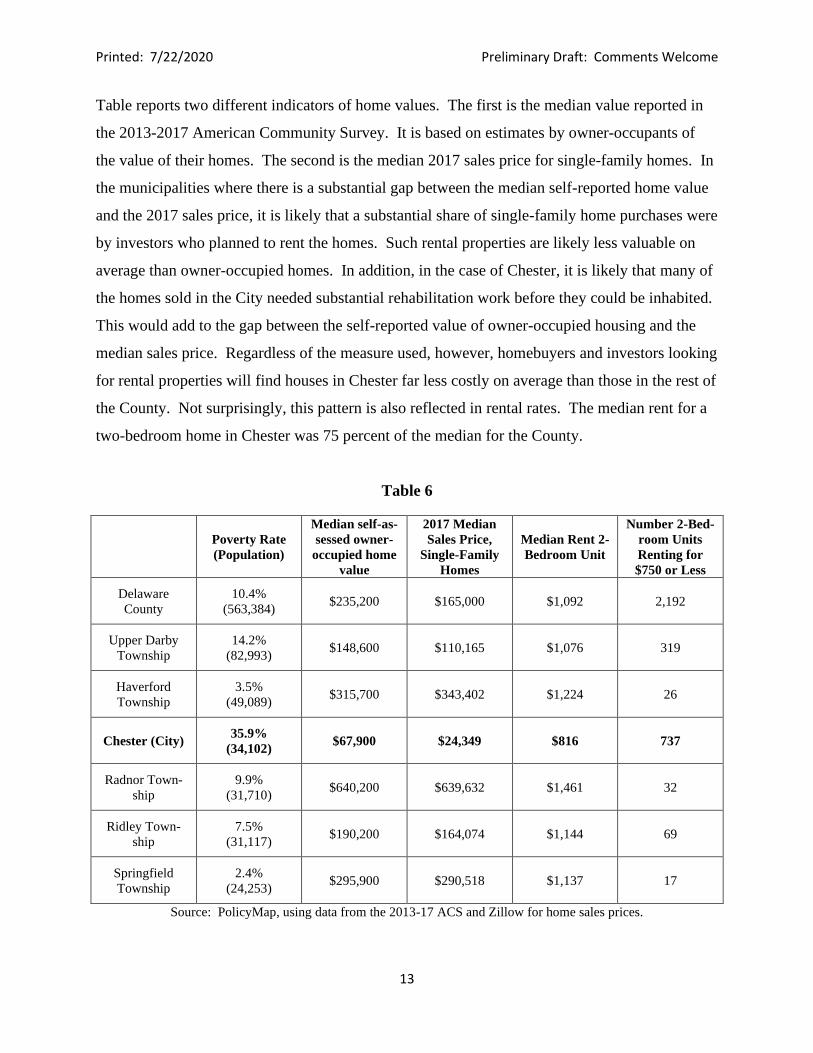
Table reports two different indicators of home values. The first is the median value reported in
the 2013-2017 American Community Survey. It is based on estimates by owner-occupants of
the value of their homes. The second is the median 2017 sales price for single-family homes. In
the municipalities where there is a substantial gap between the median self-reported home value
and the 2017 sales price, it is likely that a substantial share of single-family home purchases were
by investors who planned to rent the homes. Such rental properties are likely less valuable on
average than owner-occupied homes. In addition, in the case of Chester, it is likely that many of
the homes sold in the City needed substantial rehabilitation work before they could be inhabited.
This would add to the gap between the self-reported value of owner-occupied housing and the
median sales price. Regardless of the measure used, however, homebuyers and investors looking
for rental properties will find houses in Chester far less costly on average than those in the rest of
the County. Not surprisingly, this pattern is also reflected in rental rates. The median rent for a
two-bedroom home in Chester was 75 percent of the median for the County.
Table 6
Poverty Rate
(Population)
Median self-as-
sessed owner-
occupied home
value
2017 Median
Sales Price,
Single-Family
Homes
Median Rent 2-
Bedroom Unit
Number 2-Bed-
room Units
Renting for
$750 or Less
Delaware
County
10.4%
(563,384) $235,200 $165,000 $1,092 2,192
Upper Darby
Township
14.2%
(82,993) $148,600 $110,165 $1,076 319
Haverford
Township
3.5%
(49,089) $315,700 $343,402 $1,224 26
Chester (City) 35.9%
(34,102) $67,900 $24,349 $816 737
Radnor Town-
ship
9.9%
(31,710) $640,200 $639,632 $1,461 32
Ridley Town-
ship
7.5%
(31,117) $190,200 $164,074 $1,144 69
Springfield
Township
2.4%
(24,253) $295,900 $290,518 $1,137 17
Source: PolicyMap, using data from the 2013-17 ACS and Zillow for home sales prices.

Printed: 7/22/2020 Preliminary Draft: Comments Welcome
14
In explaining the distribution of low-income households across the County, the number
of low-cost rental units in various communities is even more important than the median price.
Most low-income households rent and, if low-cost rental units in a community are scarce, few
such households will be able to find housing in that community.7 The final column of Table 6
shows the number of two-bedroom housing units in the various municipalities renting for $750
or less. Such units should be affordable to families making about $25,000 or more, or to an even
lower-income family lucky enough to receive a Housing Choice Voucher.8 As shown in the Ta-
ble, Chester has about six percent of the County’s population, but it contains a third of the
County’s low-cost two-bedroom rental units. Upper Darby, an inner-ring suburb adjacent to
Philadelphia, also has a large share of such rental units, but its population is more than twice
Chester’s. The four other large municipalities have much smaller numbers of such rental units,
and notably lower poverty rates. Given the scarcity of low-cost housing in Radnor, its poverty
rate is surprisingly high. But this poverty is concentrated in the sections of Radnor that border
Villanova University. Undoubtedly, groups of students with low incomes are joining together to
rent higher-cost off-campus housing.9
Figure 2 illustrates the link between the availability of “affordable” rental housing and
poverty rates for 143 of Delaware County’s 144 census tracts. The excluded tract has a popula-
tion of zero. For the purposes of this graph, I define affordable rental housing as one-bedroom
units that rent for $750 or less, two-bedroom units that rent for $1,000 or less, or three-bedrooms
or larger units than rent for $1,500 or less. For each census tract, the horizontal axis shows the
percentage of its housing units that are affordable rental units and the vertical axis shows the
tract’s poverty rate. The high correlation (0.89) between the two variables is striking. It is also
notable that the census tracts in the extreme Northeast corner of the graph are tracts in Chester.
7 According to the 2018 Current Population Survey, 34 percent of all American households rent
their homes, but somewhat over half of all households with incomes below $30,000 rent. 8 In 2016, the federal poverty threshold for a family with one adult and two children was
$19,337.
9 Students who live in dormitories are not included in the poverty rate of a census tract. But stu-
dents who live in off-campus housing, and not with relatives, are included. In Chester, Widener
students who live off-campus certainly raise the poverty rate (43%) of the surrounding census
tract, but 58 percent of the housing units in this tract are affordable rental units by my classifica-
tion.

Printed: 7/22/2020 Preliminary Draft: Comments Welcome
15
Figure 2
Source: ACS 2013-17
Unfortunately, for my purposes, there are there are no surveys, that I am aware of, of
low-income Chester residents asking them why they live in Chester and not elsewhere.10 But
there are numerous academic studies of the factors that influence people’s residential choices
within metropolitan areas generally. Much of this literature focuses on low-income households.
A comprehensive survey of this literature would take me far afield, but some key points are the
following:
10 The 2013 Annual Report of the Chester Housing Authority states (p. 14) that, at that time, it
had 1,566 Housing Choice Vouchers outstanding. It writes that its voucher holders, “…continue
to seek housing outside the City of Chester. Three of five families begin their housing search
outside Chester. Crime and the sustained problems at Chester High School are families’ two
most frequently cited reasons for leaving the city. Delaware County, Pennsylvania, and New
Castle County, Delaware, are where they usually seek housing first. Currently, 330 of our 1,566
families, about one-fifth, live outside Chester.”
Chester
Chester
Chester
Tract in Radnor next to Villanova University
Chester
Chester
Chester
Chester
Chester
Chester
Chester
Chester
Chester
0
10
20
30
40
50
60
0 10 20 30 40 50 60 70 80
Po
ver
ty R
ate
Share of Housing that is "Affordable" Rentals
Census Tract Poverty Rates Versus Share of Housing that is "Affordable" Rentals
(Chester's 12 census tracts flagged)

Printed: 7/22/2020 Preliminary Draft: Comments Welcome
16
1. Major changes in the socioeconomic characteristics of a neighborhood are largely driven by
people moving into and out of the community (Ellen and O’Regan, 2011). Americans move fre-
quently. About 12 percent of U.S. households relocate yearly, and residential mobility rates are
even higher among low-income households, renters, and younger families (Coulton, 2014).
About half of all homeowners move within ten years and about half of all renters move within
two years (Rosenthal and Ross, 2015). In the case of Chester, the 2013-17 American Commu-
nity Survey found that 33 percent of its households had moved into their units since 2009 and 63
percent had moved in since 1999.
2. When searching for a new home, low-income families have a much more limited set of realis-
tic choices than do middle-income or high-income families, since affordability is an essential
consideration. As Laura Carrillo and her co-authors write (2016, p. 124) in their study of the
housing choices of low-income families in Chicago: “Respondents cited the affordability of the
apartment as a principal factor in the selection of their current dwelling, which was unsurprising
given their limited incomes.”
3. Due to funding caps, only about a quarter of the low-income families that are eligible for fed-
eral housing assistance actually receive that assistance (Center on Budget and Policy Priorities,
2019). For the subset of households that do receive federal assistance, the search for rental hous-
ing can be highly constrained. Households, who are offered a chance to live in public housing,
must live in the community where that housing is located, or live without a subsidy. This take-it-
or-leave-it rule also applies to households that are offered a unit in privately-owned apartments
that receive “project-based” federal rental assistance. Households that receive “Housing Choice
Vouchers” have more choice about where to live since they can use the vouchers to subsidize
their rent in eligible privately-owned apartments located almost anywhere. But the key word
here is “eligible.” To be eligible the landlord must be willing to accept the voucher. In addition,
the apartment must pass an inspection by the local public housing authority and there is a cap on
the rent the landlord can charge for the unit.11 As numerous studies have documented, landlords
11 The rent cap is somewhat complicated. A household with a Housing Choice Voucher (HCV)
is generally required to pay 30 percent of their adjusted gross income toward rent and utilities.

Printed: 7/22/2020 Preliminary Draft: Comments Welcome
17
who accept vouchers disproportionately have properties located in communities where rents tend
to be low and poverty rates are high, and families with vouchers tend to search for rental oppor-
tunities in those neighborhoods (Small et al, 2013, Garboden et al, 2018, and Wood, 2014).
In 2018, 4,680 Delaware County households used vouchers (PolicyMap, based on HUD
data). Of these, 1,092 lived in Chester. That is, Chester accounts for six percent of the County’s
population but is home to 23 percent of its households using housing vouchers.
4. Beyond affordability, there are other factors that attract or repel low-income families from
certain neighborhoods. For the subset of low-income families that depend on public transit, good
transit access can be an important factor (Rosenblatt and DeLuca, 2017, and Rosenthal, 2008).
In addition, numerous studies have documented that the racial and ethnic composition of com-
munities affect the likelihood that people of the same or different races and ethnicities move into
the neighborhood (Aliprantis et al, 2019, Pendall et al, 2016, and Sampson and Sharkey, 2008).
Interestingly, the quality of local schools must also matter, but recent academic studies of hous-
ing choice by low-income families rarely emphasize this factor. High crimes rates make neigh-
borhoods undesirable, but several studies have found that many low-income families do not auto-
matically disqualify high-crime communities. In choosing between a larger or higher-quality
apartment in a high-crime neighborhood and a similarly-priced low-quality apartment in a low-
crime neighborhood, many poor households choose the better apartment in the high-crime com-
munity. They make this trade-off because they believe that they can protect themselves within a
high-crime community by selecting a home on a relatively safe street, by staying indoors and
keeping their children indoors, and by “minding their own business.” As Stefanie DeLuca and
Peter Rosenblatt (2017, p. 256) write in their study of the residential location decisions of low-
The housing authority that issued the voucher pays the landlord the difference between what the
tenant pays and the lesser of (a) the housing authority’s payment standard for the unit or (b) the
gross rent for the unit. Housing authorities can set their payments standards between 90 percent
and 110 percent of the “fair market rent” (FMR) The FMR varies by the number of bedrooms in
the rental unit, and is typically set at a level that would encompass the lowest cost 40% of rental
units of a particular size in a metropolitan area. Since 2018, in the case of the Philadelphia met-
ropolitan region, FMR is based on the 40 percent threshold for rental units in a particular zip
code. A landlord can choose to charge more than FMR, but new tenants using vouchers cannot
devote more than 40 percent of their adjusted grow income to rent and utilities. In 2018, the
FMR for a two-bedroom unit (including basic utilities) in Chester was $1,090. In adjacent zip
codes, it was $1,110 and $1,150.

Printed: 7/22/2020 Preliminary Draft: Comments Welcome
18
income families in Baltimore: “We find that families’ confidence in their strategies to stay safe
in poor, violent neighborhoods allowed them to make the consequential trade-offs between
neighborhood safety and unit quality. It was these skills, honed over the years of surviving in
dangerous places, rather than discomfort in low-poverty communities, preferences for same-race
neighbors, or desire to be close to kin, which seemed to be more important for shaping where
families moved…”
5. The way people search for housing tends to reinforce patterns of segregation by income, race,
and ethnicity. Almost no one begins a search by gathering formal data about the characteristics
of a wide range of various communities they might live in. Rather, when moving within a met-
ropolitan area, most people limit their searches to communities they are broadly familiar with
through personal experiences or information gained from friends, family members, or co-work-
ers (Kryson and Crowder, 2017). Since social networks frequently divide along lines of race,
ethnicity, and income, this search process helps perpetuate socioeconomic segregation in hous-
ing.12
In the case of low-income renters, many moves are “forced” moves that occur because
the landlord evicts the tenants, the tenant believes the landlord is not maintaining the apartment
adequately, or, in the case of a tenant with a Housing Choice Voucher, the public housing au-
thority determines that the landlord is not maintaining the apartment adequately. Such moves
must often be made quickly, which further reinforces the tendency to look only in neighborhoods
that are already familiar to the searcher (Deluca et al, 2019, and Carrillo et al, 2016).
12 Research does suggest, however, that low-income families will voluntarily move to unfamiliar
communities likely to offer better opportunities for their children if they are assisted in their ef-
forts and can find affordable housing in those communities. In a 2018/19 random assignment
study with 421 first-time housing voucher recipients in Seattle and King County, Washington,
researchers found that by offering housing search assistance, landlord interventions, and short-
term financial assistance to the families in a treatment group, they could increase the share of
families that leased units in “high-opportunity” neighborhoods from 14.3% in the control group
to 54.3% in the treatment group (Bergman et al, 2019). High opportunity neighborhoods are
those where children from low-income families in the past have had high rates of upward income
mobility. These neighborhoods typically have substantially higher mean household incomes and
education levels than do low-opportunity neighborhoods in the same region.
Printed: 7/22/2020 Preliminary Draft: Comments Welcome
19
In short, the academic literature on residential choice broadly supports my argument for
why Chester has such a high poverty rate. Undoubtedly, many people choose to live in Chester
because of family and social ties. Some people move to the City or remain there because they
want to work as insiders to improve the community. Some African American residents choose
the City because they feel uncomfortable or unwelcome in white-dominated communities. The
minority of Chester residents who depend on public transportation might value Chester for its
commuter rail connections to Wilmington and Philadelphia and bus connections to major em-
ployers along the Delaware River, and to other commercial centers and public transportation
hubs in Delaware County. But, in the case of low-income Chester residents, the major factor
drawing them to the City must be the relatively abundant supply of low-cost housing, and its ab-
sence in much of the rest of Delaware County.
VI. Why Does Chester Have So Much Low-Cost Housing?
I have argued that a high percentage of Chester’s residents are poor because Chester has a
large supply of low-cost housing, and that is not true for most of the rest of Delaware County.
But why does Chester have so much affordable housing and the rest of the County does not? A
fully satisfactory answer to this question would require an extensive historical analysis of the de-
velopment of private and public housing in the County and local governments’ zoning policies.
This is not possible in a short paper, but here I make two key points. First, housing that is af-
fordable to lower-income households consists of three main types: (1) relatively low-quality
non-subsidized private housing; (2) subsidized public housing; and (3) privately-owned housing
that receives government subsidies in exchange for the landlord’s commitment to rent to lower-
income households at affordable prices. Second, for a variety of reasons, such housing is abun-
dant in and around Chester, but largely absent in much of the rest of Delaware County.
The most common source of low-cost housing is low-quality non-subsidized private
housing. And, due to zoning regulations, most low-quality private housing is old housing that
has not been reconditioned to meet modern standards. While it is possible to build a cheap con-
temporary home using cinder blocks for walls, plywood for floors, and corrugated steel for a
roof, local zoning regulations would never permit this in U.S. urban areas. Just as no automobile
that meets contemporary safety and performance standards can be produced for less than
$10,000, no home in the Philadelphia metropolitan area that complies with zoning codes and
Printed: 7/22/2020 Preliminary Draft: Comments Welcome
20
modern standards can be built for less than about $100,000. But used cars and old homes of
lower quality do sell for less than these minimums.
Such old homes are common in Chester. The City had a well-developed residential sec-
tor by the 1920s. At that time, many of Chester’s homes were modest rowhomes, constructed in
the 1910s and 20s for the families of men working in the industries lining the Delaware River.
These densely developed homes had no yards, or tiny yards, and no garages. Their inhabitants
walked to work and to shop, or they traveled by streetcar. The homes generally had indoor
plumbing and electricity, but they were very small by modern standards, especially for the size
of the families they typically housed. In the 1930s and 1940s, due to the Great Depression and
war-time restrictions, almost no new private housing was built in the City. There were two im-
portant exceptions. First, in the late 1930s, federal legislation funded the construction of public
housing for low-income families by local housing authorities. Chester was a pioneer in this pro-
gram and between 1941 and 1943 its newly created Housing Authority built three such projects,
one for African Americans and two for whites, with just over 1,000 housing units. As noted ear-
lier, from 1942 through 1946, many of these units were set aside for the families of workers in
war-related industries, such as Sun Shipyards. Second, in 1942-43, private developers built sev-
eral hundred attached homes in an area of the City known as Highland Gardens. These too were
set aside for workers in defense industries.
As shown in Table 7, at the time of the 1950 census, only about 7 percent of the homes in
Chester were detached single-family homes, the type of housing commonly associated with sub-
urban communities.13 Moreover, the homes were relatively old. Two-thirds of Chester’s hous-
ing had been built before 1920. In the rest of Delaware County, only 15 percent of homes were
this old. And, while half the residents of Chester rented their homes, only a quarter did in the
rest of Delaware County.
13 Rowhomes and twins were also common in some other Delaware County communities. This
reflects Delaware County’s status as an “inner-ring” Philadelphia suburb that was rapidly devel-
oping in the early 1900s. In fact, by 1930, the County had a population of 280,000, mainly liv-
ing in dense communities along rail and trolley lines extending from Philadelphia.

Printed: 7/22/2020 Preliminary Draft: Comments Welcome
21
Table 7
Data from 1950 Census Chester Delaware County
(excluding Chester)
Number of dwelling units 18,208 98,727
Percentage dwelling units vacant 2.2% 2.5%
Of occupied, percentage owner-occupied 50.3% 75.1%
Of occupied, percentage rented 49.7% 24.9%
Percentage dwelling units in single-unit de-
tached structure 6.7% 42.6%
Percentage dwelling units in single-unit at-
tached structure 39.1% 17.4%
Percentage dwelling units in 1 and 2 unit semi-
detached structure14 30.0% 24.4%
Number occupied dwelling units built prior to
1920 (% of total)
11,895
(67.7%)
24,515
(15.3%)
Number built 1920-1929 2,555
(14.6%)
31,245
(33.0%)
Number built 1930-39 480
(2.7%)
11,740
(12.4%)
Number built 1940 – early 1950 2,630
(15.0%)
27,190
(28.7%)
In response to pent-up wartime demand, a post-war housing boom began in the Philadel-
phia metropolitan region and across the nation. But this boom did not involve massive renova-
tions of old urban homes. Rather, it was based on the large-scale development of suburban
homes and communities structured around the automobile. The new homes had garages, lawns,
and modern kitchens and bathrooms. It was far cheaper per house for a developer to buy open
land in outlying communities and build homes there than to build on densely developed urban
land that would have to be cleared. In addition, generous post-war government funding for the
14 An “attached” dwelling unit is one of a row of three or more adjoining structures. A “semi-
detached” structure is one of two adjoining residential structures, each with open space on the
remaining three sides.
Printed: 7/22/2020 Preliminary Draft: Comments Welcome
22
construction of highways and near-universal automobile ownership among middle-class house-
holds meant that the residents of these new suburban developments would have convenient ac-
cess to rapidly spreading suburban shopping centers and offices.
As demand shifted toward newer homes in the outlying suburbs, the older homes in
Chester did not disappear. After all, housing is durable and fixed in place. Rather, the reduction
in demand caused the price of Chester housing to fall relative to newer housing. The lower
price, in turn induced families that needed low-cost housing to move to Chester.15 This slowly
initiated a vicious cycle. As Chester became poorer, this fed social problems that are associated
with concentrated poverty, such as higher crime rates and poorly performing public schools.16
This encouraged more people who could afford to leave to do so, further lowering the relative
price of housing in Chester and attracting more low-income families. In addition, as the City’s
black population grew and demanded an end to segregated schools and housing, many whites
moved out and sold or rented their Chester homes. This white flight further spurred home price
declines and the vicious cycle.
By the mid-1950s, Chester’s political leaders were well aware that the City was declin-
ing, as much of the rest of the County boomed. Using newly available federal funding for urban
renewal initiatives and the power of eminent domain, the leadership embarked on a 15-year ef-
fort to clear dense “slum” areas of the City. When possible, the City sold the cleared land to
commercial firms, non-profit organizations, and developers for the construction of office build-
ings, multi-family housing, or parking facilities. Some of the land was also used for the con-
struction of two new public housing projects and for widening of City roadways. At the same
time, the federal government funded the construction of the interstate highway system; I-95 was
15 Edward Glaeser and Joseph Gyourko (2005) explain this process for older American cities
generally. Rolf Pendall and his co-authors (2016, p.34) summarize the idea in a pithy form:
“…high-poverty neighborhoods are built literally on the bricks and mortar of the durable housing
stock.”
16 Chester’s school district includes the small adjacent communities of Chester Township and
Upland Borough. In 2019, the Pittsburgh Business Times ranked the Chester-Upland School
District as 493 out of the 493 Pennsylvania school districts it ranked across the state using three
years’ of standardized test scores (www.bizjournals.com/pittsburgh /news/2019/05/09/2019-
school-guide-rankings-thehighest-scoring.html). FBI data from 2017 indicate that Chester had a
violent crime rate of 161 incidents per 10,000 residents. In Delaware County, it was 37 per
10,000 residents (PolicyMap).

Printed: 7/22/2020 Preliminary Draft: Comments Welcome
23
routed right through Chester. In addition, in 1971, a flood severely damaged nearly 200 homes,
and the City used state funding to clear this flood-prone area.
The federal government ended its support for urban renewal initiatives in the early 1970s,
and Chester’s renewal projects ground to a halt. There is no comprehensive record of the num-
ber of older Chester homes and commercial buildings that were destroyed in urban renewal and
highway projects between 1957 and 1973, but it was clearly in the thousands.17 Since the end of
this era, the federal government has continued to provide financial support to local governments
through its Community Development Block Grant (CDBG) program, but this funding has not
been sufficient for large-scale clearance projects. The City has, however, frequently used part of
its CBDG funds to remove isolated abandoned homes that were thought to be particularly dan-
gerous or to serve as sites of criminal activity.
As Chester’s Redevelopment Authority destroyed old homes in its urban renewal efforts,
other organizations built new subsidized housing. Several church groups, for example, raised
funds to build rental housing affordable to low-and moderate-income residents. Developers ob-
tained federal funding to build subsidized rental housing for the elderly, people with disabilities,
and other low-income households. The Chester Housing Authority built two apartment towers in
the early 1970s with 296 units for low-income elderly residents. This pattern continued after the
end of urban renewal, but with three new aspects. First, beginning in 1987, the federal govern-
ment began to offer “Low-Income Housing Tax Credits” to developers who built rental housing
that would be affordable to low- and moderate-income households. More than ten such projects
were built in Chester. Second, from the mid-1990s to the mid-2000s, the federal government
provided funds under the “Hope VI” program to enable local housing authorities to destroy and
replace, or to renovate, old public housing projects. The Chester Housing Authority used this
funding to replace four of its projects and to renovate a fifth. Third, in addition to the construc-
tion of subsidized rental housing, a small number of not-for-profit and for-profit developers used
subsidies to construct, or rehabilitate, homes that moderate-income households could purchase.
17 The 1950 census showed Chester to have 14,930 dwelling units built before 1940. The 1980
census showed it to have 9,364 such dwelling units remaining, a decline of 5,566. But these
numbers are only approximations since they are based on residents’ reports of when their homes
were constructed and, in many cases, residents may not know, and guess inaccurately.

Printed: 7/22/2020 Preliminary Draft: Comments Welcome
24
Table 8 contrasts the contemporary housing market in Chester with that in the rest of Del-
aware County. Chester’s 21.4 percent housing vacancy rate is striking. Undoubtedly this is due
to the City’s low home prices and its old housing stock. It is costly to maintain an old home in
habitable condition. When home prices are low, homeowners and landlords recognize that they
may never recoup the cost of periodically needed major repairs, and they are more likely to aban-
don a home rather than pay that repair cost. Chester’s low percentage of homeowners is also
striking. This reflects three factors. The first is the City’s high poverty rate --- low-income
households are more likely to rent than own. Second, a large share of housing construction in
the City since 1950 has been rental housing. Third, many homeowners who moved out of the
City rented the homes they left behind or sold them to investors who rented them. As shown in
the Table, 72 percent of the homes in Chester are in single-unit structures, yet 63 percent of the
households in Chester rent, i.e. many of these single-unit structures are rental properties. A third
of the homes in the City are over 80 years old and two-thirds are over 60 years old. Two-thirds
are rowhomes or twins. In other words, despite Chester’s large-scale urban renewal projects and
more recent selective efforts to clear abandoned homes that are dangerous or thought to foster
crime, Chester continues to host an abundant supply of old, dense housing that no longer meets
middle-class standards.

Printed: 7/22/2020 Preliminary Draft: Comments Welcome
25
Table 8
Data from 2013-17
American Community Survey Chester
Delaware County
(excluding Chester)
Number of dwelling units 14,636 209,133
Percentage dwelling units vacant 21.4% 7.5%
Of occupied, percentage owner-occupied 37.2% 71.5%
Of occupied, percentage rented 62.8% 28.5%
Percentage dwelling units in single-unit de-
tached structure 9.0% 48.15%
Percentage dwelling units in single-unit at-
tached structure 62.7% 28.3%
Number dwelling units built prior to 1940
(% of total reporting age)
4,800
(32.8%)
43,561
(20.8%)
Number built 1940-1959 5,017
(34.2%)
81,648
(39.0%)
Number built 1960 – 79 2,738
(18.7%)
46,745
(22.4%)
Number built 1980-99 931
(6.4%)
25,234
(12.1%)
Number built 2000 and later 1,150
(7.9%)
11,945
(5.7%)
In addition to low-cost private-sector housing, Chester has a disproportionate share of the
County’s public housing. Since only low-income households can live in public housing and they
do not pay more than 30 percent of their income to rent a public housing unit, this too attracts the
poor to Chester.18 Delaware County is served by two local housing authorities: the Chester
Housing Authority (CHA), which serves the City of Chester, and the Delaware County Housing
Authority (DCHA), which serves all of the County except Chester. Counting the exact number
18 A household does not need to be below the federal poverty line to be eligible for federal hous-
ing assistance. For most programs, households with incomes below 60 percent of the size-ad-
justed median household income in a metropolitan area are eligible. However, given the short-
age of federal housing assistance relative to the need, most local public housing authorities limit
new federal housing assistance to the families with incomes well below this threshold. Once a
family receives the assistance, it generally will not lose it due to a rising income until the family
income exceeds the maximum eligibility cut-off.

Printed: 7/22/2020 Preliminary Draft: Comments Welcome
26
of public housing units provided by the CHA and the DCHA is challenging. The information
that both agencies provide on their websites is incomplete or dated. Data available from the U.S.
Department of Housing and Urban Development’s (HUD) “Picture of Subsidized Households”
(www.huduser.gov/portal/datasets/assthsg.html) dataset is similarly incomplete. Nevertheless,
by combining and cross-checking the data from the CHA and DCHA websites, HUD, and the
Pennsylvania Housing Finance Agency, I estimate (see Appendix I and II) that the CHA pro-
vides 885 units of subsidized public housing in the City. In the rest of the County, the DCHA
provides 855 units. Thus, although Chester contains 6.1 percent of the county’s population, it
hosts 51 percent of the public housing units in the County. In addition, of the 619 public housing
units that DCHA sets aside for families, the largest (with 215 units) is in Chester Township, a
small community adjacent to the City of Chester. In fact, 264 of DCHA’s family units are in ei-
ther Chester Township or Upland Borough, two communities whose residents belong to the same
school district as Chester. The second largest DCHA development for families (Kinder Park,
with housing for 154 low-income families) is located outside of Chester’s school district, but
within a few hundred yards of Chester’s borders. In other words, public housing in Delaware
County, especially for families with children, is heavily concentrated in and around Chester.
Beyond public housing, there are two other major sources of site-specific subsidized
rental housing in Chester and Delaware County. First, under programs known as “Project-based
Section 8,” “Section 202,” and “Section 811,” HUD provides rental subsidies to private for-profit
and not-for-profit developers of low-income rental housing. In these programs, the developers
sign long-term contracts with HUD to rent exclusively to qualifying low-income tenants who pay
no more than 30 percent of their income in rent. HUD makes up the difference between what the
property owners receive in rent from the tenants and the “fair market rent” for the units, up to a
specified maximum. In the case of the Section 202 and 811 programs, the housing is for elderly
or disabled low-income residents. Second, in addition to these HUD-subsidized private develop-
ments, as noted earlier, private developers of low-income housing can also obtain a federal sub-
sidy in the form of tax credits under the Low-Income Housing Tax Credit (LIHTC) program. As
in the case of the HUD-subsidized private-sector rental units, the developers of these housing
projects also commit for 15 to 30 years to rent at affordable prices to low-income households.19
19 Corianne Scalley et al. (2018) provide a good overview of the Low-Income Housing Tax
Credit Program.
Printed: 7/22/2020 Preliminary Draft: Comments Welcome
27
Often developers of low-income housing need very substantial subsidies, and will combine fund-
ing from several government programs, making the simple classification into one of three cate-
gories --- public housing, other site-specific HUD-subsidized housing, or LIHTC housing ---
misleading. Some housing projects fit in all three categories. For my purposes, clearly catego-
rizing available subsidized housing for low-income households is not important. The key point
is to show the heavy concentration of housing that is restricted to low-income households in
Chester.
Table 9 reports my estimates of the number of public housing units, HUD-subsidized
site-specific private housing units, and LIHTC-subsidized housing units in Chester, the rest of
Delaware County, and for the five most populous townships in the county. The pattern is quite
striking. Nearly 20 percent of the households in Chester live in housing that is restricted to peo-
ple with low incomes. In the rest of Delaware County, about 1 percent of households live in
such housing. The only township in the Table with a significant representation of site-specific
subsidized housing is Ridley, and even there it makes up only about 3 percent of that commu-
nity’s housing. Moreover, the public housing in Ridley Township is located adjacent to Ches-
ter’s border. This clustering of housing in Chester and near Chester that can only be rented by
low-income households ensures that Chester will always have a high percentage of low-income
residents.

Printed: 7/22/2020 Preliminary Draft: Comments Welcome
28
Table 9
Estimated
Number House-
holds (ACS)
Estimated
Number Public
Housing Units
Estimated
Number Other
Site-Specific
HUD-Subsi-
dized Housing
Units
Estimated
Number
LIHTC Units
Estimated To-
tal Site-Spe-
cific Rental
Units for Low-
Income
Households
Delaware
County (exclud-
ing Chester)
193,368 855 573 579 2,007
Upper Darby
Township 30,312 0 8 53 61
Haverford
Township 17,593 0 0 0 0
Ridley Town-
ship 12,056 314 0 49 363
Chester (City) 11,502 885 670 555 2,110
Radnor Town-
ship 9,557 50 0 0 50
Springfield
Township 8,327 0 0 0 0
Source: Author’s estimates. See notes for Appendix I and II.
A complete account of why so much project-based subsidized housing in Delaware
County is clustered in and around Chester is beyond the scope of this paper. Certainly, many of
the more-affluent communities in Delaware County opposed such developments in their own
neighborhoods out of racism, concerns about added local government expenses without offset-
ting tax benefits, concerns over adverse impacts from adding low-income children to their school
systems, and concerns over added traffic congestion from apartment buildings. At the same
time, there have long been political pressures in Chester to build more quality, low-cost housing
in the City. This is common for cities with high poverty rates. Many constituents of politicians
representing low-income communities struggle to find decent, affordable housing and they press
their politicians to facilitate its construction in their communities.
The long-term consequence of clustering project-based subsidized housing for poor
households in low-income communities is to perpetuate high rates of poverty in these communi-
ties. As noted above, in Chester’s case, almost 20 percent of its households live in such housing.

Printed: 7/22/2020 Preliminary Draft: Comments Welcome
29
An additional large share of Chester’s housing is old housing that does not meet modern stand-
ards, and rents or sells for much less than prevailing prices in the rest of Delaware County. This
too attracts low-income households. This combination of site-specific subsidized housing and
low-cost old housing ensures that Chester is home to a disproportionate share of poor households
in the region.
VII. What Can be Done to Reduce Poverty in Chester?
This study has three strong implications for strategies to reduce the poverty rate in Ches-
ter. First, strategies that are based on attracting jobs to Chester are likely to have, at best, very
modest effects on Chester’s poverty rate. As argued above, Chester residents work throughout
the Philadelphian metropolitan area and the availability of jobs in the City of Chester itself is
largely irrelevant to their employment prospects. This is not to say that attracting employers to
Chester would not bring other benefits to the City. Chester has a wage tax as well as a property
tax, so additional employment and commercial development in the City can bring fiscal benefits
and allow for improved city services. Of course, for there to be a positive fiscal effect, it is criti-
cal that the City does not offer excessive incentives to attract the new jobs or development, and
that the new firms do not themselves create offsetting increases in city expenditures.
Second, if one were able to implement a development strategy for Chester that somehow
significantly raised the incomes of its current residents, this would have a muted effect on Ches-
ter’s poverty rate due to housing turnover. If low-income residents living in low-cost substand-
ard Chester housing were to become middle-income residents, many would likely move out of
the City in search of better housing and better neighborhood conditions. They would be replaced
by other low-income households in the Philadelphia metropolitan area looking for affordable
housing. And if low-income Chester residents living in project-based subsidized housing, such
as public housing, were to become middle-income, they would be forced to move since they
would no longer qualify for that housing. They too would be replaced by qualifying low-income
households. Clearly, there would be a social benefit to raising the incomes of Chester’s current
poor residents, but one should not assume that the same households stay in place and that Ches-
ter’s poverty rate falls commensurately. As long as Chester has a disproportionate share of Dela-
ware County’s low-cost housing, it will house a disproportionate share of it poor.

Printed: 7/22/2020 Preliminary Draft: Comments Welcome
30
Third, any effective long-term strategy to reduce Chester’s poverty rate would require a
more even distribution across Delaware County of housing that is affordable to low-income
households. This would mean developing more low-cost housing in the communities of Dela-
ware County with low poverty rates and inducing low-income families in Chester to move into
this housing. It would also require building housing in Chester that can attract middle-income
households. This would be politically difficult. Communities with low poverty rates typically
oppose the development of housing for low-income households, especially those with school-age
children. Beyond prejudice, communities recognize that such families create a local fiscal bur-
den, using more in city services than they pay in city taxes. In addition, Chester residents are
acutely aware that many of their low-income neighbors struggle to find decent housing. They
may see any initiative that focuses on developing housing for middle-income households in
Chester, as opposed to good-quality housing affordable to the poor, as a misguided use of scarce
resources.
This study of poverty in Chester clearly has implications for other cities. It is common
for politicians representing cities with high poverty rates to proclaim two of their priorities to be
reducing poverty in their city and facilitating the development of good-quality local housing that
is affordable to the poor. The painful truth is that the second priority is at odds with the first.
Local governments should encourage the development of quality housing that is affordable to the
poor, but this must be a responsibility of all local governments, not just those with significant
numbers of poor households. If it is only communities with high poverty rates that work to pro-
vide decent, affordable housing for the poor, then poverty will remain geographically concen-
trated, and the social problems that accompany high-poverty neighborhoods will persist.

Printed: 7/22/2020 Preliminary Draft: Comments Welcome
31
Bibliography
Aliprantis, Dionissi, Daniel R. Carroll, and Eric R. Young. 2019. “What Explains Neighborhood
Sorting by Income and Race?” Federal Reserve Bank of Cleveland, Working Paper no. 18-08R.
https://doi.org/10.26509/frbc-wp-201808r.
Bergman, Peter, Raj Chetty, Stefanie DeLuca, Nathaniel Hendren, Lawrence F. Katz, and Chris-
topher Palmer. 2019. “Creating Moves to Opportunity: Experimental Evidence on Barriers to
Neighborhood Choice,” NBER Working Paper No. 26164.
Carrillo, Laura, Mary Pattillo, Erin Hardy, and Dolores Acevedo-Garcia. 2016. “Housing Deci-
sions among Low-Income Hispanic Households in Chicago,” Cityscape: A Journal of Policy
Development and Research, 18:2, 109-49.
Center on Budget and Policy Priorities, 2019. “Policy Basics: Federal Rental Assistance,”
https://www.cbpp.org/sites/default/files/atoms/files/12-10-19hous-factsheet-us.pdf.
Chester Housing Authority. 2013. “Annual Report,” http://chesterha.org/wp-content/up-
loads/2014/03/AnnualReport20131.pdf
Chetty, Raj, and Nathaniel Hendren, 2018. “The Impacts of Neighborhoods on Intergenerational
Mobility I: Childhood Exposure Effects,” Quarterly Journal of Economics, 133, 1107–1162.
Chetty, Raj, N. Hendren, and L.F. Katz, 2016. “The Effects of Exposure to Better Neighbor-
hoods on Children: New Evidence from the Moving to Opportunity Experiment,” American
Economic Review 106:4, 855-902.
Coulton, Claudia J. 2014. “Using Data to Understand Residential Mobility and Neighborhood
Change,” in What Counts: Harnessing Data for America’s Communities edited by Federal Re-
serve Bank of San Francisco and Urban Institute, https://community-wealth.org/sites/clone.com-
munity-wealth.org/files/downloads/WhatCounts.pdf.
DeLuca, Stefanie and Peter Rosenblatt. 2017. “Walking Away from The Wire: Housing Mobility
and Neighborhood Opportunity in Baltimore,” Housing Policy Debate, 27:4, 1-28.
Deluca, Stefanie, Holly Wood, and Peter Rosenblatt. 2019. “Why Poor Families Move (And
Where They Go): Reactive Mobility and Residential Decisions” City & Community, 18:2 (May):
556-93.
Econsult Solutions, Inc. 2018. “City of Chester Act 47 Exit Plan,” http://chesterwater.com/wp-
content/uploads/2018/11/Chester_Act_47_Exit_Plan_8-20-2018_FILED.pdf.
Ellen, Ingrid Gould and Katherine M. O’Regan. 2011. “How low income neighborhoods change:
Entry, exit, and enhancement,” Regional Science and Urban Economics, 41:2, 89-97.

Printed: 7/22/2020 Preliminary Draft: Comments Welcome
32
Philip M. E. Garboden, Eva Rosen, Stefanie DeLuca & Kathryn Edin. 2018. “Taking Stock:
What Drives Landlord Participation in the Housing Choice Voucher Program,” Housing Policy
Debate, 28:6, 979-1003.
Glaeser, Edward L. and Joseph Gyourko. 205. “Urban Decline and Durable Housing,” Journal of
Political Economy, 113:2, 345-75.
Harris, Richard E. 2008. Politics and Prejudice: Small-town Blacks Battle a Corrupt System.
Media, PA: Changing Outlook Press.
Jargowsky, Paul A. 2013. “Concentration of Poverty in the New Millennium: Changes in Preva-
lence, Composition, and Location of High Poverty Neighborhoods,” A Report by The Century
Foundation and Rutgers Center for Urban Research and Education.
Krysan, Maria and Kyle Crowder. 2017. Cycle of Segregation: Social Processes and Residential
Segregation. New York, NY: Russell Sage Foundation.
Mallach, Alan. 2012. “In Philadelphia’s Shadow: Small Cities in the Third Federal Reserve Dis-
trict,” A Special Report by the Community Development Studies and Education Department,
Federal Reserve Bank of Philadelphia, https://www.philadelphiafed.org/-/media/community-de-
velopment/publications/special-reports/small-cities-in-third-federal-reserve-district.pdf.
Mele, Christopher. 2017. Race and the Politics of Deception: The Making of an American City.
New York, NY: New York University Press.
Pendall, Rolf, Brett Theodos, and Kaitlin Hildner. 2016. “Why High-Poverty Neighborhoods
Persist: The Role of Precarious Housing,” Urban Affairs Review, vol 52:1, 33-65.
Rosenblatt, Peter and Stefanie DeLuca. 2012. “’We Don’t Live Outside, We Live in Here’:
Neighborhood and Residential Mobility Decisions Among Low-Income Families,” City & Com-
munity, 11:3 (September): 254-84.
Rosenthal, Stuart S. 2008. “Where Poor Renters Live in Our Cities: Dynamics and Determi-
nants,” in Revisiting Rental Housing: Policies, Programs, and Priorities, ed. By Nicolas Retsi-
nas and Eric Belsky. Cambridge, MA: Joint Center of Housing Studies.
Rosenthal, Stuart S and Stephen Ross. 2015. “Change and Persistence in the Economic Status of
Neighborhoods and Cities,” Ch. 16 in Handbook of Regional and Urban Economics, Vol. 5, eds.
Gilles Duranton, S. Vernon Henderson, and William Strange. Oxford: North Holland.
Sampson, Robert J. and Patrick Sharkey. 2008. “Neighborhood Selection and the Social Repro-
duction of Concentrated Racial Inequality,” Demography 45: 1-29.
Scally, Corianne Payton, Amanda Gold, and Nicole DuBois. 2018. “The Low-Income Housing
Tax Credit: How It Works and Who It Serves.” Washington, DC: Urban Institute.

Printed: 7/22/2020 Preliminary Draft: Comments Welcome
33
Small, Mario L, Scott W. Allard, Stefanie DeLuca, Philip M. E. Garboden, Peter Rosenblatt,
2013. “Segregating Shelter: How Housing Policies Shape the Residential Locations of Low-In-
come Minority Families,” Annals of the American Academy of Political and Social Science, 647:
1, 268-99.
Wood, Holly. 2014. “When Only a House Makes a Home: How Home Selection Matters in the
Residential Mobility Decisions of Lower-Income, Inner-City African American Families,” So-
cial Service Review, 88:2, 264-94.

Printed: 7/22/2020 Preliminary Draft: Comments Welcome
34
Appendix I
Site-Specific Subsidized Housing in Chester
Development Name Public Housing
Units
Project-based Section 8 &
202/811 units LIHTC Units
Population served
Benjamin Banneker Plaza 70 Family
Chatham Estates 110 Family
Chatham Estates Senior Vil-lage
40 Seniors
Chatham Terrace Apart-ments
48 Family
Chester Apartments 104 Family
Cliff House & Cliff House As-sisted Living 165 Seniors
Crosby Square Apartments 81 Family
Daniel Scott Commons 72 Family
Dorian Court Apartments 12 Family
Edgmont Senior Apartments 87 Seniors
Fifth St. Apartments 22 Family
Flower Manor Apartments 68 Family
Gateway Senior Apartments (aka Chester Gateway)
23 41 Seniors
Heartley Homes 10 Family
Jefferis School (aka Jefferis Square)
36 Family
Madison Senior Apartments 13 25 Seniors
Madison St & Madison St Target Area
63 Family
Matopos Hills Senior Apart-ments
29 53 Seniors
Palmerhouse Senior Apart-ments
124 Seniors

Printed: 7/22/2020 Preliminary Draft: Comments Welcome
35
Penn Street Apartments 15 Family
Pentecostal Square 69 Seniors
Robert H. Stinson Tower 150 Seniors
Ruth L. Bennett Homes 257 Family
Senior Village at Lamokin 40 Seniors
Upland Street 15 Family
Wellington Ridge & Welling-ton Ridge II
110 Family
William Penn Homes 158 Family
Total Number Units 885 670 555 2,110
Source: Data were gathered by author from information available from the website of the Chester Housing Author-
ity, HUD’s “Picture of Subsidized Households” data, and the Pennsylvania Housing Finance Agency. In many
cases, projects have funding from numerous grant and tax credit sources and can have a mix of public-sector and
private-sector managers, so they do not always fit completely into any one category. This does not affect, however,
the overall count of housing units reserved for low-income households. Many developments labelled as restricted to
“seniors” are also open to younger individuals with disabilities.

Printed: 7/22/2020 Preliminary Draft: Comments Welcome
36
Appendix II
Site-Specific Subsidized Housing in Delaware County (outside of Chester)
Development Name Location Public Housing
Units
Project-based Section 8 &
202/811 units LIHTC Units
Population Served
Alician Senior Upper Darby
Township 53 Seniors
Bethel Road Homes Aston Town-
ship 9 Seniors
Bridgeview Apart-ments
Chester Town-ship
48 Seniors
Calcon Gardens Sharon Hill
Borough 50 Family
Concord Pointe Concord
Township 65 Seniors
Darby Court Apart-ments
Darby Borough 27 Seniors
Darby Homes (scat-tered site)
Darby Borough 12 Family
Darby Townhouses Sharon Hill
Borough 172 Family
Delaware County Fairgrounds
Chester Town-ship
215 Family
Greenhill Court Sharon Hill
Borough 46 Family
Highland Homes Radnor Town-
ship 50 Family
Kinder Park Apart-ments
Ridley Town-ship
160 Seniors
Kinder Park Town-homes, Phases I, II, &
III
Ridley Town-ship
154 Family
Lincoln Park Sharon Hill
Borough 35 Family
Lutheran Knolls & Lu-theran Knolls North
and West
Upper Chich-ester Town-
ship 220 Seniors

Printed: 7/22/2020 Preliminary Draft: Comments Welcome
37
Mercy Elderly Hous-ing (aka Grace Court)
Yeadon Bor-ough
101 Seniors
Meson Upper Darby
Township 8 Family
Nether Providence (scattered site)
Nether Provi-dence
8 Family
Park Row Place (aka Episcopal Place at
Park Row)
Upland Bor-ough
63 Seniors
Park View at Naaman Creek
Upper Chich-ester Town-
ship 80 Seniors
Parkview Apartments Upland Bor-
ough 28 Seniors
Parkview Homes Upland Bor-
ough 49 Family
Penn Hills (aka Penn Ridge)
Ridley Town-ship
49 Family
Pusey Estates Brookhaven
Borough 77 Family
Sharon Hill Commons Sharon Hill
Borough 51 Family
Simpson Gardens Lansdowne
Borough 41 Seniors
Studevan School Sharon Hill
Borough 35 Seniors
Upland Estates Upland Bor-
ough 50 Family
Upland Terrace Apartments (aka Mills
at Parkview)
Brookhaven Borough
51 Family
Total Number
Units 855 573 579 2,007
Source: Data were gathered by author from information available from the website of the Delaware County Hous-
ing Authority, HUD’s “Picture of Subsidized Households” data, and the Pennsylvania Housing Finance Agency. In
many cases, projects have funding from numerous grant and tax credit sources and can have a mix of public-sector
and private-sector managers, so they do not always fit completely into any one category. This does not affect, how-
ever, the overall count of housing units reserved for low-income households. Many developments labelled as re-
stricted to “seniors” are also open to younger individuals with disabilities.