Embed Size (px)
Citation preview

WHY IS HOUSING SO UNAFFORDABLE IN THE SACRAMENTO REGION?
AN INVESTIGATION OF HOUSING SUPPLY CONSTRAINTS AND DEMAND
CHARACTERISTICS
A Thesis
Presented to the faculty of the Department of Public Policy and Administration
California State University, Sacramento
Submitted in partial satisfaction of
the requirements for the degree of
MASTER OF PUBLIC POLICY AND ADMINISTRATION
by
Sean A. Johnson
SUMMER
2015

ii
© 2015
Sean A. Johnson
ALL RIGHTS RESERVED

iii
WHY IS HOUSING SO UNAFFORDABLE IN THE SACRAMENTO REGION?
AN INVESTIGATION OF HOUSING SUPPLY CONSTRAINTS AND DEMAND
CHARACTERISTICS
A Thesis
by
Sean A. Johnson
Approved by:
__________________________________, Committee Chair
Robert Wassmer, Ph.D.
__________________________________, Second Reader
Peter Detwiler, MA
____________________________
Date

iv
Student: Sean A. Johnson
I certify that this student has met the requirements for format contained in the University format
manual, and that this thesis is suitable for shelving in the Library and credit is to be awarded for
the thesis.
__________________________, Department Chair ___________________
Mary Kirlin, D.P.A Date
Department of Public Policy and Administration

v
Abstract
of
WHY IS HOUSING SO UNAFFORDABLE IN THE SACRAMENTO REGION?
AN INVESTIGATION OF HOUSING SUPPLY CONSTRAINTS AND DEMAND
CHARACTERISTICS
by
Sean A. Johnson
When housing affordability becomes a problem, it can have complex effects on society.
First, it can damage local and regional consumer economies if moderate- or higher-income
households refrain on spending because they devote more of their disposable income on housing
costs. The real problem is when housing affordability takes away housing opportunities for low-
income households. Housing advocates pressure local governments when land use decisions
exclude low-income residents from housing opportunities. Homeowners and their interest groups
pressure local governments when they feel that housing developers threaten their communities by
proposing more housing projects, most often, affordable housing.
Most academics found that restrictive regulatory environments and constrained geography
have created housing shortages in many California regions. Advocates for housing, and the poor,
pointed to the power of homeowners in California (to use the legal system to block housing
developments) and shortages in federal, state, and local funding (to subsidize more affordable
housing) as major factors in the affordability crisis. My study sought from local government
officials in the Sacramento region what their thoughts were on the causes of the housing
vi
affordability problem. Through interviews with eight local officials, I found that the problem in
the Sacramento region is a combination of those issues raised by academics and advocates.
Analyzing their responses, I concluded that the foundation of this complex problem was the
conflict between state and local priorities with respect to growth and housing opportunities.
Given the strict environmental and housing regulatory environment in California, an
absolute solution will likely never surface. Policy makers must understand that developing any
kind of housing in regions in the state require a balance between private interests and the interest
of society at large. The degree of balance has long favored homeowners with the cost of fees and
requirements imposed on developers passing directly onto housing prices. This has forced
prospective homeowners to bear the external cost of growth. It has also caused contraction in the
housing market making housing a scarce resource, pricing out the lowest-income populations.
The solution I propose gives homeowner groups continued ability to shape their communities and
protect their home value, while contributing their fair share of the cost of growth through tax
assessment districts similar to Mello-Roos. The solution would also give more power to the
Sacramento Area Council of Governments to influence land uses from the regional level.
_______________________, Committee Chair
Robert Wassmer, Ph.D.
_______________________
Date

vii
DEDICATION
To Christina, Cash, and Grady, my loving family who heroically inspired me through the
last three grueling years of balancing family, work, and graduate school in a faraway land.

viii
ACKNOWLEDGEMENTS
I do not have enough space to use the positive adjectives I would like to use to describe
my experience with the faculty in the Public Policy and Administration department. I humbly
thank Mary Kirlin, Rob Wassmer, Su Jin Jez, Andrea Venezia, Steve Boilard, Ted Lascher, and
Peter Detwiler for sharing their wisdom with me and engendering my interest in public policy and
public administration. Special thanks to Rob for keeping me focused and helping me navigate this
broad topic of housing affordability. Another special thanks to Peter, whom I am fortunate
enough to have been his 46th and (alleged) final thesis. I wish you a rewarding retirement. Of
course, I also thank my family and friends. I would have not been able to achieve this goal
without all of your support that I could go on about for days. I am grateful to have you all.
ix
TABLE OF CONTENTS Page
Dedication ............................................................................................................................. vii
Acknowledgements .............................................................................................................. viii
List of Tables ......................................................................................................................... xi
List of Figures ....................................................................................................................... xii
1. INTRODUCTION…………….. ……………………………………………………….. 1
What is Housing Affordability? ...................................................................................... 2
What is the Role of Government in Affordable Housing? ............................................. 13
Introduction Summary................................................................................................... 23
Structure of this Thesis .................................................................................................. 24
2. LITERATURE REVIEW ................................................................................................ 25
Housing Affordability and its Measurement Metrics..................................................... 25
Regulations Affecting Housing Supply and Affordability ............................................. 33
Public Policy and Demand Spikes ................................................................................. 41
Literature Summary....................................................................................................... 45
3. METHODOLOGY.......................................................................................................... 47
Sample Description ....................................................................................................... 48
Interview Questions....................................................................................................... 49
Qualitative Data Analysis ............................................................................................. 49
Method Summary .......................................................................................................... 50
4. FINDINGS AND ANALYSIS ........................................................................................ 53
Sacramento Region Housing Affordability Definition .................................................. 54

x
Regulating Housing Development in the Sacramento Region ....................................... 63
Public Policy and Housing Demand .............................................................................. 73
Findings and Analysis Summary ................................................................................... 77
5. CONCLUSION ............................................................................................................... 81
Revisiting the Housing Affordability Problem .............................................................. 82
Summary of Affordable Housing Stakeholders ............................................................. 84
Public Policy Options .................................................................................................... 95
Final thoughts on Housing Affordability ..................................................................... 102
Appendix A. Wharton Residential Land Use Regulation Index .......................................... 104
Appendix B. Interview Respondent Consent to Participate Form ...................................... 108
Appendix C. Interview questions – Housing Affordability in the Sacramento Region ..... 110
References........................................................................................................................... 112
xi
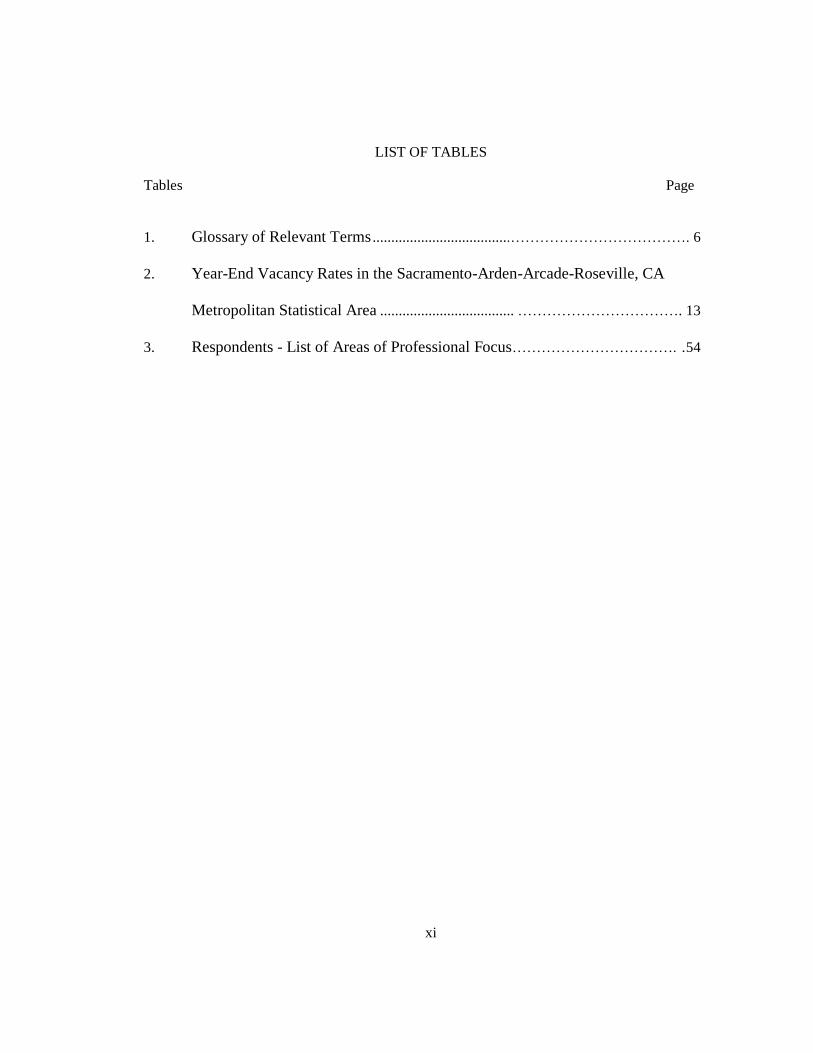
LIST OF TABLES
Tables Page
1. Glossary of Relevant Terms .....................................………………………………. 6
2. Year-End Vacancy Rates in the Sacramento-Arden-Arcade-Roseville, CA
Metropolitan Statistical Area .................................... ……………………………. 13
3. Respondents - List of Areas of Professional Focus……………………………. . 54

xii
LIST OF FIGURES
Figures Page
1. Sacramento County percentage change in rents (2 & 3 bedroom), income,
population and households since 2005 (in 2013 dollars)………………………. 9
2. Sacramento County percentage change in median household income, median
house prices, fair market rents, households and the percentage of households
paying 30-35% or more of their income on rent since 2005 (in 2013 dollars)
...................................................................................... ……………………………. 10
3. 2013 & 2014 Year-end Rental Vacancy Rates by US Region………………. ... 12

1
Chapter 1
INTRODUCTION
The phrase ‘affordable housing’ is inherently political and often the subject of debate.
Why is it a political? Because affordability is a perception that relies on a set of choices on how
to allocate household income. Representative Nydia Velázquez (D-NY) (2014) once said, “Fair
and affordable housing is a basic right for all New Yorkers and all Americans.” In California,
housing advocates often imply the ‘right’ to affordable housing. Affordable housing advocates
say there should be more affordable housing, while homeowners often disagree. Housing is
shelter to some, an investment to others, and an environmental threat from the perspective of yet
others. Developers seeking investment opportunities want to acquire land and build new housing
to meet the demand of California’s growing population and shifting demographics, while more
enlightened environmental advocates push smart growth that does not limit population growth,
but encourages denser, more sustainable development. Homeowners want to protect their
investment; while a growing number of low-and medium-income households want shelter they
can afford. Elected officials want to please their constituency by approving the best way to
develop land, while environmental advocates want to preserve protected space. Drawing from the
economic law of supply and demand, we know that in any free market, price will increase as
demand outpaces supply.
The California housing markets make for interesting studies because there are many
interested parties, abundant natural resources, a variety of climates, geographical and regulatory
constraints to development, and the largest and most diverse population in the country. This
master’s thesis investigates the degree of the housing affordability problem in the Sacramento
region through a review of the academic literature and interviews with local government officials.

2
The final chapter offers ideas for local government officials on how to solve the housing
affordability problem.
This introductory chapter provides context on what housing affordability means. It
describes the roles of the federal, state, and local governments in the provision of affordable
housing. I also describe what some jurisdictions in the Sacramento region are doing to address the
affordable housing problem. The introduction concludes by explaining the remainder of this
thesis, offering a quick reference for what each chapter covers.
What is Housing Affordability?
Housing affordability is an abstract concept. People understand it in different ways
because what is affordable to one person is not to another. Beginning in the late 1920s, the Great
Depression created an urgency for government intervention in housing assistance. From 1928 to
1933, residential construction fell by 95% (Jackson, 1985, p. 193) and many middle-class
families were entering poverty. By the mid-1930s, the newly created Federal Housing
Administration (FHA) began the notion of more desirable versus less desirable neighborhoods by
subsidizing new housing construction in suburbs. New houses popping up like weeds in the
suburbs provided those that could afford it, desirable housing out of the cities, while those
households that could not afford to leave saw their housing values plummet as all the demand was
steered to the suburbs. This demand steering effect may have been the birth of government-
sponsored gentrification. By introducing ‘redlining,’ (Jackson, 1985, p. 203) the FHA steered
investors away from lending to low-income households that might benefit from homeownership
while promoting investment in new suburbs that attracted higher-income households. Redlining
drew a clear distinction between renting and owning. Renting became synonymous with lower
incomes and home owning became the middle-class ideal. Therefore, much of the conversation

3
about affordability for renters would be about survival, whereas the conversation of affordability
for owners would focus on the quality of life.
The federal government became involved in the housing affordability discussion with the
National Housing Act of 1937 (PL. 75-412, September 1 1937), or the Wagner-Steagall Act,
which created local public housing authorities and provided funds to subsidize housing for low-
income households. The Housing Act of 1949 then added federal funds toward the building of
affordable housing to promote urban renewal. At the time, President Truman (1949) proclaimed
that an objective of government was to ensure that all American households would have a “decent
home in a suitable living environment.”
Most local public housing authorities had the power to raise the rents as needed and
throughout the 1960s, they increased the rents amidst rising operational costs (Schwartz, Wilson,
2008) and for building renovations (Husock, 2015). The Housing and Urban Development Act of
1969 (PL. 91-152, December 24, 1969) then amended the Housing Act of 1937, establishing the
standard of affordability by limiting public housing rents to 25% of household income. The basis
of the 25% threshold is unclear, but I found a study that thought it might derive from an 1875
study of spending patterns of laborers and mill workers in Massachusetts that found that workers
spent 20% – 25% of their income on housing (Oh, 1995). Thus, the public housing cap became
the standard for measuring affordability. Before 1969, rents funded 95% of the cost of public
housing; by 1980 however, the U.S. Department of Housing and Urban Development (HUD)
subsidies funded over 40% of the cost (Husock, 2015). The Housing and Community
Development Act of 1974 (PL. 93-383, August 22, 1974) established the bulk of these subsidies
with the creation of the Section 8 and the Community Development Block Grant programs.
The 1980 election of President Reagan symbolized the country’s political interest to
reduce domestic spending and increase defense spending, as was the message in his election
4
campaign. In response to a recession in the late 1970s and early 1980s, The Omnibus Budget
Reconciliation Act of 1981 (PL. 97-35, August 13, 1981) established a new definition of “lower-
income families” (Title III, Part 2, Section 3(b)(2)) to include those households with income not
exceeding 80% of the median income for the area. The definition served a multi-faceted purpose
as the Low-Income Home Energy Assistance Program block grant started at the same time
requiring the U.S. Department of Health and Human Services to use low-income household
energy usage data to determine grant distribution (Whitaker, Pearl, 2006). The 1981 Act also
increased the affordability threshold from 25% to 30% of household gross income, the percentage
still recognized today by HUD. The increase to 30% reduced federal spending, but has now
become the standard for determining housing affordability.
Some stakeholders in the housing industry interpret their own definition of housing
affordability through various forms of measurement and housing tenure type (owning or renting).
For example, the National Low-Income Housing Coalition (NLIHC) interprets affordability using
their Housing Wage calculation, which determines the household hourly wages needed (assuming
a standard 40-hour, 52-week, full-time job) to afford a two-bedroom apartment in states
throughout the country. Furthermore, the calculation gives an amount of hours needed to work in
each week to afford the same apartment at the states’ minimum wage (Arnold, et al., 2014).
Challengers to the NLIHC calculation suggest flaws because many people paying more than 30%
of their income do so by choice and because no one is entitled to a two-bedroom apartment
(Phillips, 2014). The National Association of Realtors (NAR) interprets housing affordability
with an index determining whether households can qualify for a mortgage loan. The NAR
Housing Affordability Index (assumes a 20% down payment and mortgage principle and interest
does not exceed 25% of household income) is a complex comingling of formulae accounting for
interest rates, median single-family home sale price, median family income, necessary and

5
qualifying income, and monthly payments (NAR, n.d.). The two indices clearly represent
divergent thinking about target populations and their tenure choice. Nevertheless, beyond the
variations of definitions and measurements, housing affordability is always a manifestation of
housing costs and some view on the ability to pay.
The 30% of household income is the standard for measuring housing affordability, but
some argue it works, some argue it does not. The argument for the 30% threshold suggests that it
is the point where housing costs become a burden, affecting a household’s ability to pay other
nondiscretionary expenses (Schwartz, Wilson, 2008). The argument against the 30% threshold
not only challenges the number, but some challenge the rationale for government intervention in
housing. A reasonable argument against the 30% of income threshold is that it does not include
transportation costs (Phillips, 2014). For example, someone choosing to pay more than 30% of
their income for housing near transit that greatly reduces their total costs and is a matter of
housing preference. However, it may require moderate to upper levels of income to have the
opportunity to exercise that choice. On the other hand, a low-income household may find housing
that requires only 25% of total income, but accrue exorbitant transportation costs as a result.
Other critics suggest that government intervention in housing has exacerbated the problem the
government solution intended to solve (Husock, 2015). This argument contends that as
government engineers housing opportunities for low-income households, it creates a disincentive
for those households to achieve good housing by unrestricted means. In other words, housing as a
handout makes people feel like they do not need to work for it. Furthermore, the argument
suggests that the increase from 25% to 30% of income for those that receive housing assistance
only meant that the more they earned, the more they would need to pay, creating an incentive to
earn less (Husock, 2015). This argument is reasonable; however, it only applies to public housing
rentals that are subject to Section 8. When low-income households have the choice of where to
6
live, this argument seems to become less relevant and one has to believe that local housing
affordability statistics compute from choice.
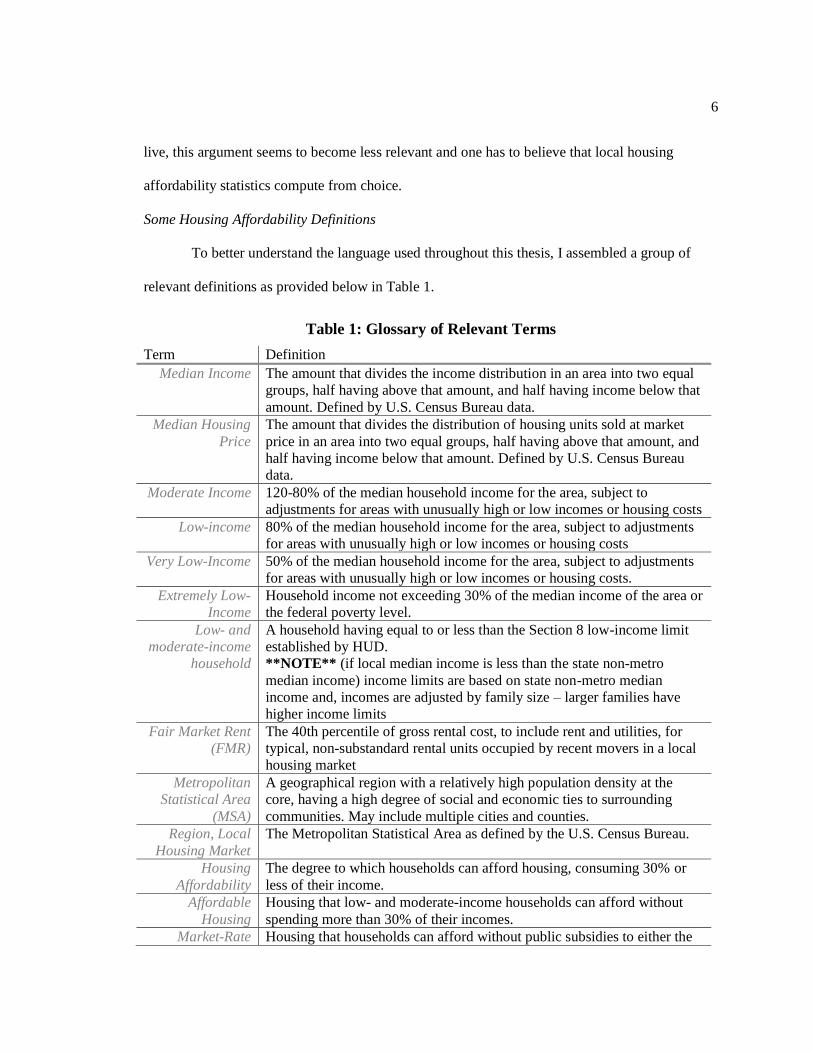
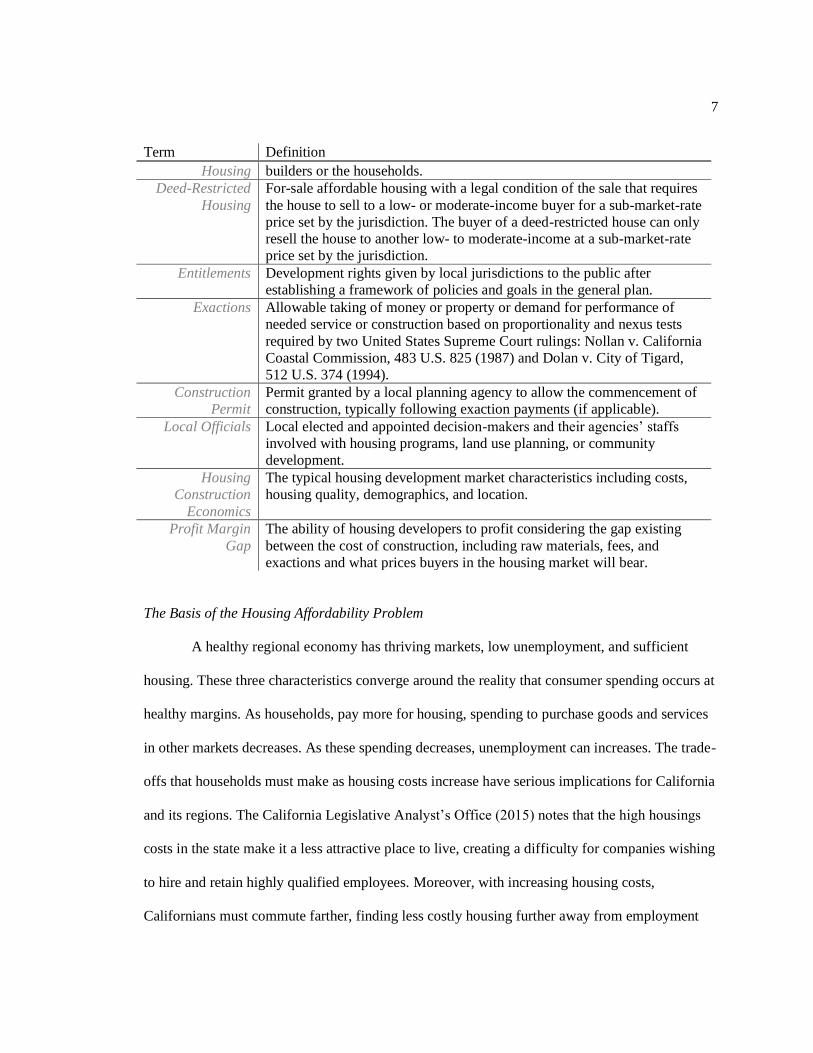
Some Housing Affordability Definitions
To better understand the language used throughout this thesis, I assembled a group of
relevant definitions as provided below in Table 1.
Table 1: Glossary of Relevant Terms
Term Definition
Median Income The amount that divides the income distribution in an area into two equal
groups, half having above that amount, and half having income below that
amount. Defined by U.S. Census Bureau data.
Median Housing
Price
The amount that divides the distribution of housing units sold at market
price in an area into two equal groups, half having above that amount, and
half having income below that amount. Defined by U.S. Census Bureau
data.
Moderate Income 120-80% of the median household income for the area, subject to
adjustments for areas with unusually high or low incomes or housing costs
Low-income 80% of the median household income for the area, subject to adjustments
for areas with unusually high or low incomes or housing costs
Very Low-Income 50% of the median household income for the area, subject to adjustments
for areas with unusually high or low incomes or housing costs.
Extremely Low-
Income
Household income not exceeding 30% of the median income of the area or
the federal poverty level.
Low- and
moderate-income
household
A household having equal to or less than the Section 8 low-income limit
established by HUD.
**NOTE** (if local median income is less than the state non-metro
median income) income limits are based on state non-metro median
income and, incomes are adjusted by family size – larger families have
higher income limits
Fair Market Rent
(FMR)
The 40th percentile of gross rental cost, to include rent and utilities, for
typical, non-substandard rental units occupied by recent movers in a local
housing market
Metropolitan
Statistical Area
(MSA)
A geographical region with a relatively high population density at the
core, having a high degree of social and economic ties to surrounding
communities. May include multiple cities and counties.
Region, Local
Housing Market
The Metropolitan Statistical Area as defined by the U.S. Census Bureau.
Housing
Affordability
The degree to which households can afford housing, consuming 30% or
less of their income.
Affordable
Housing
Housing that low- and moderate-income households can afford without
spending more than 30% of their incomes.
Market-Rate Housing that households can afford without public subsidies to either the
7
Term Definition
Housing builders or the households.
Deed-Restricted
Housing
For-sale affordable housing with a legal condition of the sale that requires
the house to sell to a low- or moderate-income buyer for a sub-market-rate
price set by the jurisdiction. The buyer of a deed-restricted house can only
resell the house to another low- to moderate-income at a sub-market-rate
price set by the jurisdiction.
Entitlements Development rights given by local jurisdictions to the public after
establishing a framework of policies and goals in the general plan.
Exactions Allowable taking of money or property or demand for performance of
needed service or construction based on proportionality and nexus tests
required by two United States Supreme Court rulings: Nollan v. California
Coastal Commission, 483 U.S. 825 (1987) and Dolan v. City of Tigard,
512 U.S. 374 (1994).
Construction
Permit
Permit granted by a local planning agency to allow the commencement of
construction, typically following exaction payments (if applicable).
Local Officials Local elected and appointed decision-makers and their agencies’ staffs
involved with housing programs, land use planning, or community
development.
Housing
Construction
Economics
The typical housing development market characteristics including costs,
housing quality, demographics, and location.
Profit Margin
Gap
The ability of housing developers to profit considering the gap existing
between the cost of construction, including raw materials, fees, and
exactions and what prices buyers in the housing market will bear.
The Basis of the Housing Affordability Problem
A healthy regional economy has thriving markets, low unemployment, and sufficient
housing. These three characteristics converge around the reality that consumer spending occurs at
healthy margins. As households, pay more for housing, spending to purchase goods and services
in other markets decreases. As these spending decreases, unemployment can increases. The trade-
offs that households must make as housing costs increase have serious implications for California
and its regions. The California Legislative Analyst’s Office (2015) notes that the high housings
costs in the state make it a less attractive place to live, creating a difficulty for companies wishing
to hire and retain highly qualified employees. Moreover, with increasing housing costs,
Californians must commute farther, finding less costly housing further away from employment

8
centers, and face living in crowded housing as family generations consolidate. People who cannot
afford high housing costs must take on these additional external costs, which generally justifies
government intervention.
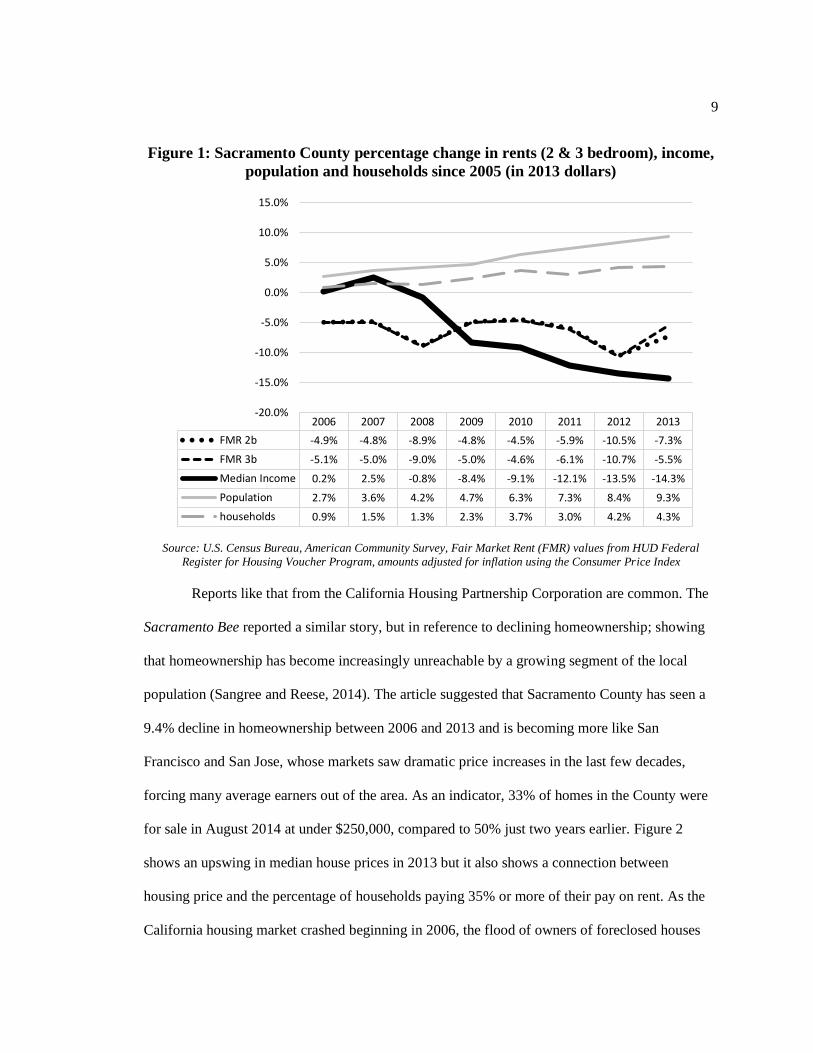
As household income, adjusted for inflation has continued to decrease (Figure 1), fair
market rents have not kept pace, creating a problem of affordability. I presented this gap in
percentage-change inflation adjusted (2013-dollar value) figures because I think it is interesting
that rents and incomes have failed to keep up with the decreasing value of the dollar. Figure 1
shows that the median household income in Sacramento County has decreased at a steady pace
while the population and number of households has steadily increased, creating a greater need for
housing in the area. Rent and income are not keeping pace with inflation, but rents are keeping
much closer to the inflation rate than the median income, which is the core of the affordability
problem. This thesis investigates the drivers of this problem.
To highlight the magnitude of the problem, the California Housing Partnership
Corporation (2014) released a report identifying that 90% of low-income households in
Sacramento County pay over 30% of their pay on rent. Moreover, nearly 70% of very-low
income households pay over 50% of their pay on rent. Possibly the strongest point from the report
is that Sacramento County has a shortfall of nearly 53,000 homes affordable to very- and
extremely-low income households. This clearly suggests the problem of affordability hinges on
housing supply (Van der Meer, 2014).
9
Figure 1: Sacramento County percentage change in rents (2 & 3 bedroom), income,
population and households since 2005 (in 2013 dollars)
Source: U.S. Census Bureau, American Community Survey, Fair Market Rent (FMR) values from HUD Federal
Register for Housing Voucher Program, amounts adjusted for inflation using the Consumer Price Index
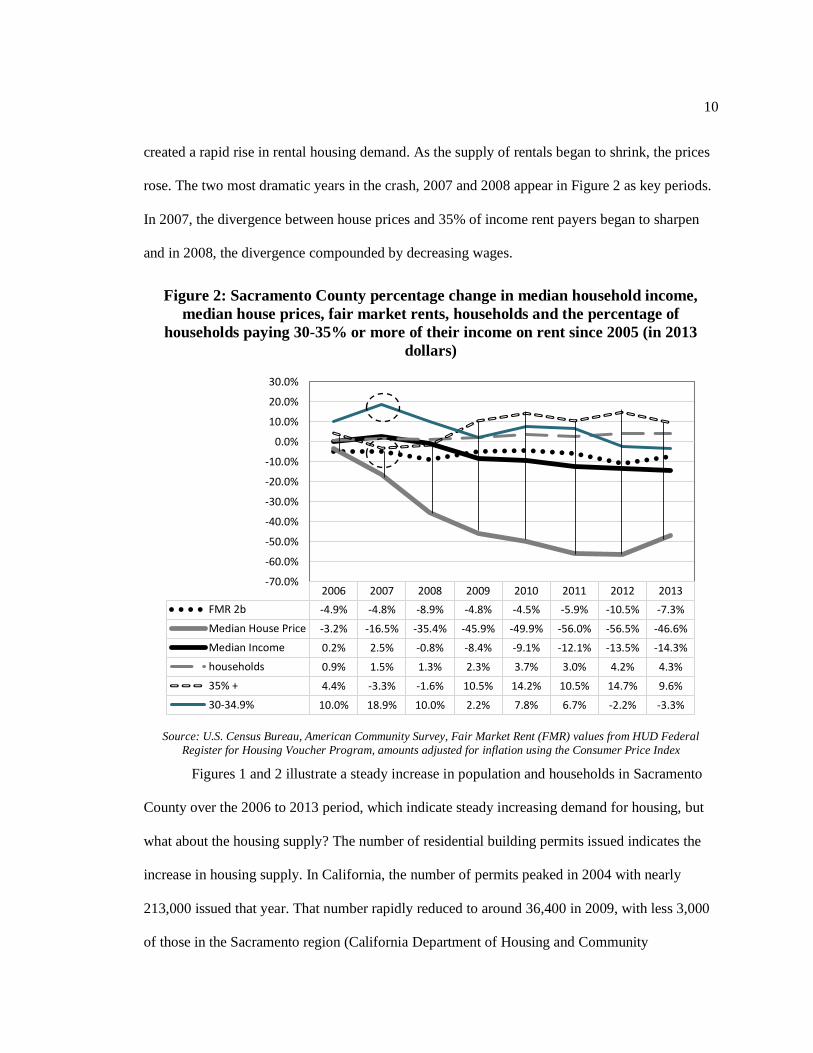
Reports like that from the California Housing Partnership Corporation are common. The
Sacramento Bee reported a similar story, but in reference to declining homeownership; showing
that homeownership has become increasingly unreachable by a growing segment of the local
population (Sangree and Reese, 2014). The article suggested that Sacramento County has seen a
9.4% decline in homeownership between 2006 and 2013 and is becoming more like San
Francisco and San Jose, whose markets saw dramatic price increases in the last few decades,
forcing many average earners out of the area. As an indicator, 33% of homes in the County were
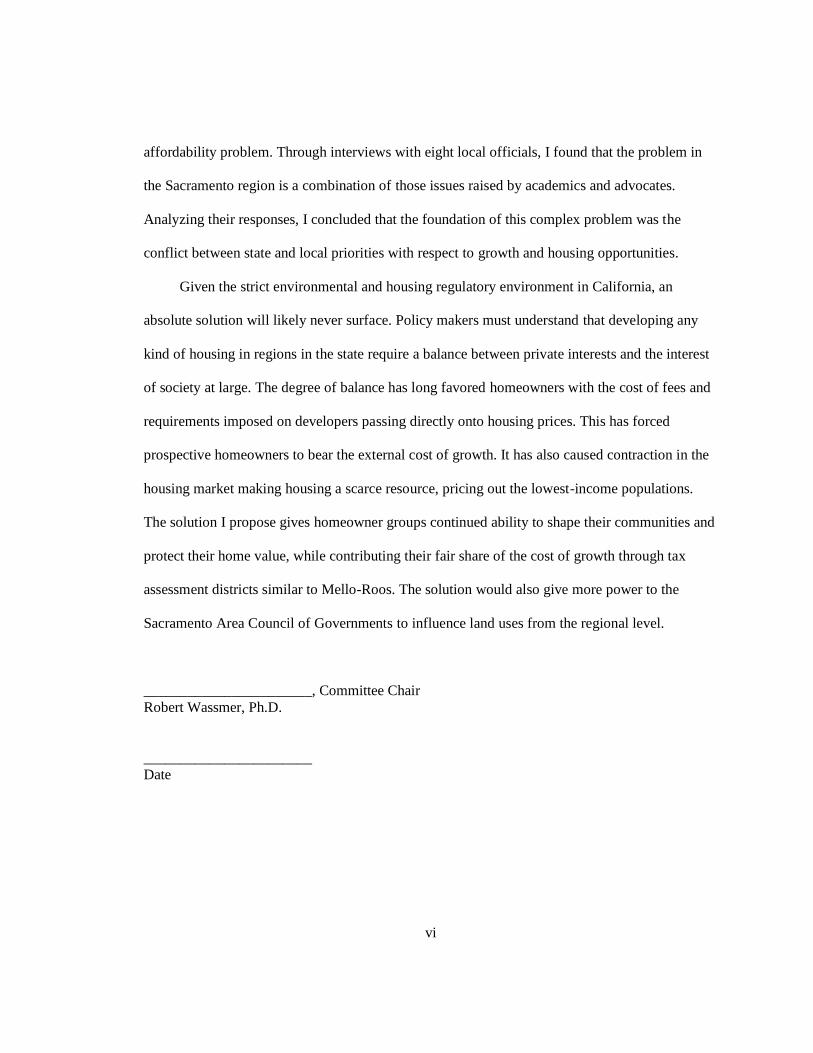
for sale in August 2014 at under $250,000, compared to 50% just two years earlier. Figure 2
shows an upswing in median house prices in 2013 but it also shows a connection between
housing price and the percentage of households paying 35% or more of their pay on rent. As the
California housing market crashed beginning in 2006, the flood of owners of foreclosed houses
2006 2007 2008 2009 2010 2011 2012 2013
FMR 2b -4.9% -4.8% -8.9% -4.8% -4.5% -5.9% -10.5% -7.3%
FMR 3b -5.1% -5.0% -9.0% -5.0% -4.6% -6.1% -10.7% -5.5%
Median Income 0.2% 2.5% -0.8% -8.4% -9.1% -12.1% -13.5% -14.3%
Population 2.7% 3.6% 4.2% 4.7% 6.3% 7.3% 8.4% 9.3%
households 0.9% 1.5% 1.3% 2.3% 3.7% 3.0% 4.2% 4.3%
-20.0%
-15.0%
-10.0%
-5.0%
0.0%
5.0%
10.0%
15.0%
10
created a rapid rise in rental housing demand. As the supply of rentals began to shrink, the prices
rose. The two most dramatic years in the crash, 2007 and 2008 appear in Figure 2 as key periods.
In 2007, the divergence between house prices and 35% of income rent payers began to sharpen
and in 2008, the divergence compounded by decreasing wages.
Figure 2: Sacramento County percentage change in median household income,
median house prices, fair market rents, households and the percentage of
households paying 30-35% or more of their income on rent since 2005 (in 2013
dollars)
Source: U.S. Census Bureau, American Community Survey, Fair Market Rent (FMR) values from HUD Federal
Register for Housing Voucher Program, amounts adjusted for inflation using the Consumer Price Index
Figures 1 and 2 illustrate a steady increase in population and households in Sacramento
County over the 2006 to 2013 period, which indicate steady increasing demand for housing, but
what about the housing supply? The number of residential building permits issued indicates the
increase in housing supply. In California, the number of permits peaked in 2004 with nearly
213,000 issued that year. That number rapidly reduced to around 36,400 in 2009, with less 3,000
of those in the Sacramento region (California Department of Housing and Community
2006 2007 2008 2009 2010 2011 2012 2013
FMR 2b -4.9% -4.8% -8.9% -4.8% -4.5% -5.9% -10.5% -7.3%
Median House Price -3.2% -16.5% -35.4% -45.9% -49.9% -56.0% -56.5% -46.6%
Median Income 0.2% 2.5% -0.8% -8.4% -9.1% -12.1% -13.5% -14.3%
households 0.9% 1.5% 1.3% 2.3% 3.7% 3.0% 4.2% 4.3%
35% + 4.4% -3.3% -1.6% 10.5% 14.2% 10.5% 14.7% 9.6%
30-34.9% 10.0% 18.9% 10.0% 2.2% 7.8% 6.7% -2.2% -3.3%
-70.0%
-60.0%
-50.0%
-40.0%
-30.0%
-20.0%
-10.0%
0.0%
10.0%
20.0%
30.0%

11
Development, 2014). From that low point in 2009, the annual number of permits has slowly
increased, but the dramatic drop following the housing crash left a substantial gap and 53,000-
unit shortfall.
Figure 2 illustrates another interesting reality with sharp decline in house prices
paralleling the rise in the percentage of households paying more than 35% of their incomes on
rent. The Legislative Analyst’s Office (2013) reported that in 2012, house prices began to rise
quickly because investors purchased houses with cash when houses prices bottomed out after the
recession. Many households that had their houses foreclosed, entered the rental market, and as
low-income households saw the opportunity to purchase, they found themselves excluded as the
cash investors provided sellers easier transactions. Those excluded households also competed in
the rental housing market and, as investors converted houses into single-family rentals, the supply
was not enough to serve the demand. In 2013, the Sacramento Bee reported that Wall Street
investor Blackstone, with its property management firm Invitation Homes, purchased 1,500
houses in Sacramento County (Sangree, 2013). The firm bundled the rental revenue for 239 of
those homes into rental-backed securities sold to global investors, similar to mortgage-backed
securities that characterized the housing market crash in 2008. The fear is that the perceived
success of this new kind of securitization will pressure Blackstone to raise rents, avoid
maintenance, and execute mass evictions without consequence with no connection to the
community (Sangree, 2013).
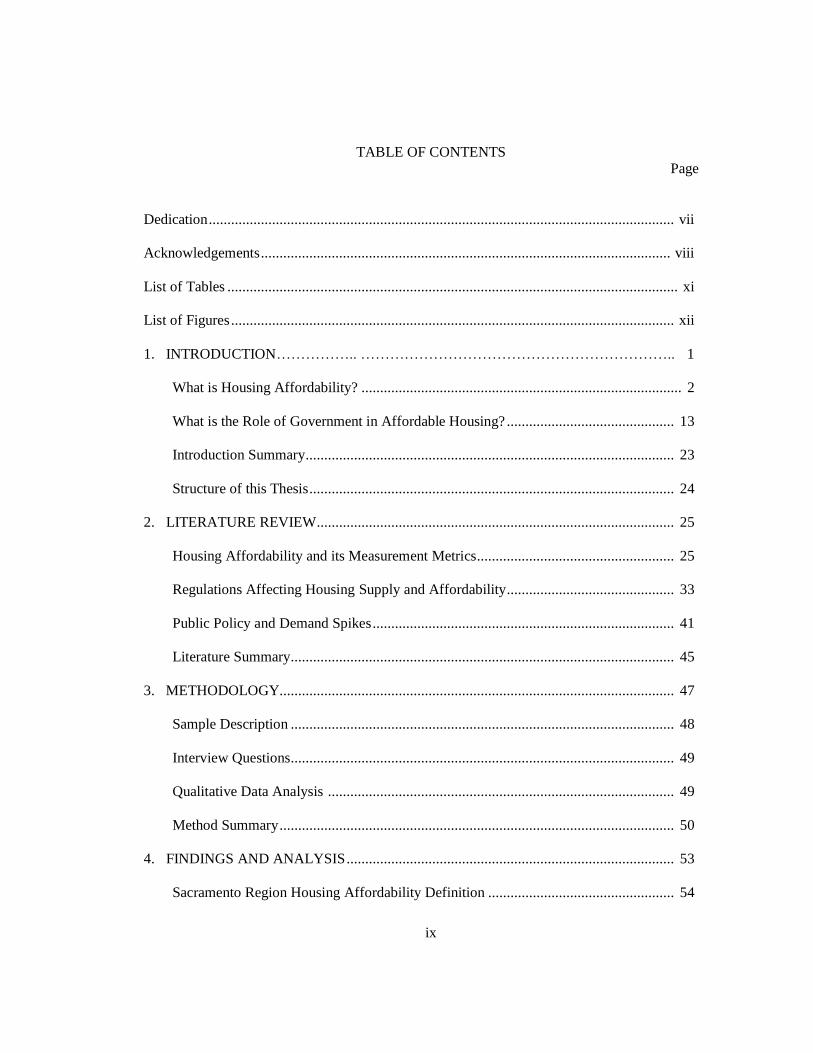
Vacancy rates are another important element of housing affordability as it is a measure of
demand. Housing construction stagnation has kept vacancy rates very low. Recall Figures 1 and 2
show that the number of households in the Sacramento County continues to grow despite the lack
of housing production. Not surprising, the vacancy rate is the lowest in the country as denoted by
region in Figure 3. The 2013 and 2014 vacancy rate in the west region is well below the national
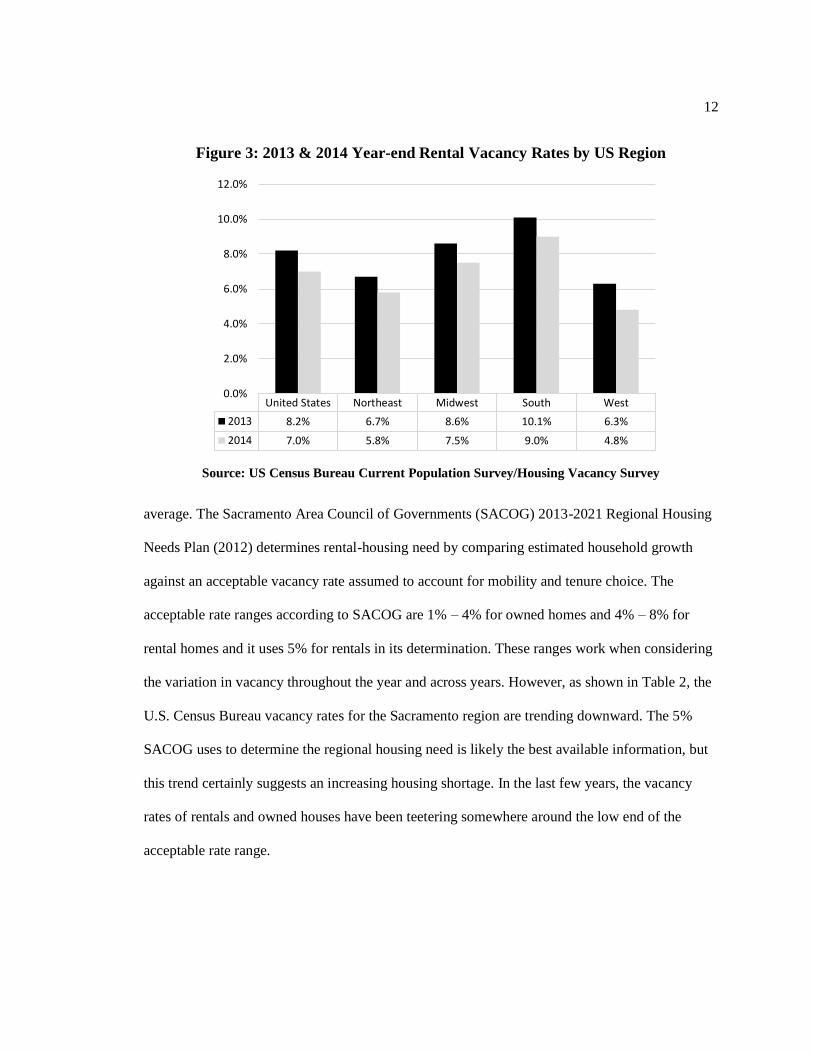
12
Figure 3: 2013 & 2014 Year-end Rental Vacancy Rates by US Region
Source: US Census Bureau Current Population Survey/Housing Vacancy Survey
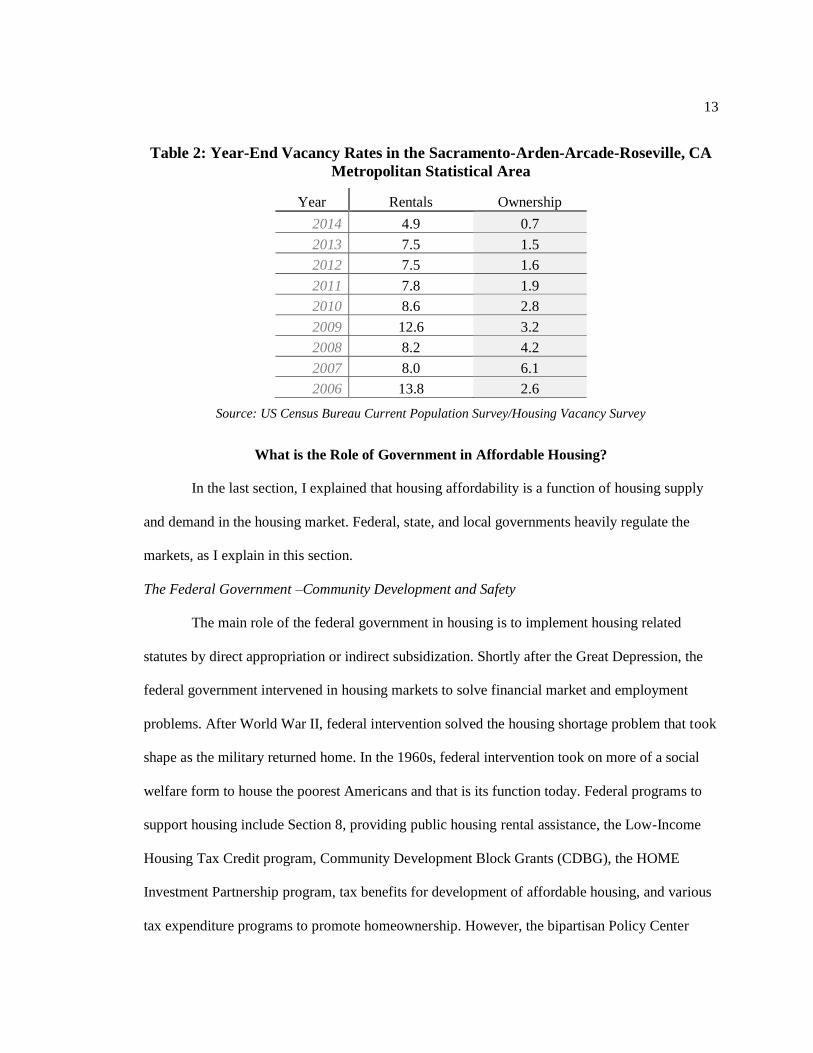
average. The Sacramento Area Council of Governments (SACOG) 2013-2021 Regional Housing
Needs Plan (2012) determines rental-housing need by comparing estimated household growth
against an acceptable vacancy rate assumed to account for mobility and tenure choice. The
acceptable rate ranges according to SACOG are 1% – 4% for owned homes and 4% – 8% for
rental homes and it uses 5% for rentals in its determination. These ranges work when considering
the variation in vacancy throughout the year and across years. However, as shown in Table 2, the
U.S. Census Bureau vacancy rates for the Sacramento region are trending downward. The 5%
SACOG uses to determine the regional housing need is likely the best available information, but
this trend certainly suggests an increasing housing shortage. In the last few years, the vacancy
rates of rentals and owned houses have been teetering somewhere around the low end of the
acceptable rate range.
United States Northeast Midwest South West
2013 8.2% 6.7% 8.6% 10.1% 6.3%
2014 7.0% 5.8% 7.5% 9.0% 4.8%
0.0%
2.0%
4.0%
6.0%
8.0%
10.0%
12.0%
13
Table 2: Year-End Vacancy Rates in the Sacramento-Arden-Arcade-Roseville, CA
Metropolitan Statistical Area
Year Rentals Ownership
2014 4.9 0.7
2013 7.5 1.5
2012 7.5 1.6
2011 7.8 1.9
2010 8.6 2.8
2009 12.6 3.2
2008 8.2 4.2
2007 8.0 6.1
2006 13.8 2.6
Source: US Census Bureau Current Population Survey/Housing Vacancy Survey
What is the Role of Government in Affordable Housing?
In the last section, I explained that housing affordability is a function of housing supply
and demand in the housing market. Federal, state, and local governments heavily regulate the
markets, as I explain in this section.
The Federal Government –Community Development and Safety
The main role of the federal government in housing is to implement housing related
statutes by direct appropriation or indirect subsidization. Shortly after the Great Depression, the
federal government intervened in housing markets to solve financial market and employment
problems. After World War II, federal intervention solved the housing shortage problem that took
shape as the military returned home. In the 1960s, federal intervention took on more of a social
welfare form to house the poorest Americans and that is its function today. Federal programs to
support housing include Section 8, providing public housing rental assistance, the Low-Income
Housing Tax Credit program, Community Development Block Grants (CDBG), the HOME
Investment Partnership program, tax benefits for development of affordable housing, and various
tax expenditure programs to promote homeownership. However, the bipartisan Policy Center

14
2013 Housing Commission Report, Housing America’s Future, reports that the federal
government spends about $180 billion a year to support housing. The U.S. Housing and Urban
Development (HUD) Department directs $48 billion to low-income renters, the rest supports
homeownership through mortgage interest and property tax deductions for homeowners (Arnold,
et al., 2014).
Some cities and counties receive CDBG and HOME awards directly from HUD.
Jurisdictions use CDBG awards for a variety of community development priorities, which may or
may not include affordable housing. The HOME awards are specifically for “building, buying,
and/or rehabilitating affordable housing for rent or homeownership or providing direct rental
assistance to low-income people” (HUD, n.d.). Larger cities and counties are entitled to CDBG
awards; others receive portions of the state grant. Sacramento County received around $6 million
each year from 2006 – 2010, but saw a decline to $4.5 million in 2012 (HUD, 2014). The HOME
works the same CDBG; except smaller cities can counties can collaborate to meet the minimum
formula allocation limit of $750,000. For example, the Sacramento County consortium received
over $3 million per year from 2006 – 2011 and about $2 million in 2012 and 2013, which
allocated funds between the unincorporated areas in Sacramento County, Citrus Heights, Folsom,
Isleton, and Galt. Elk Grove and Rancho Cordova were members of the consortium until 2009.
The federal government also plays a role in limiting the supply of housing through
financial constraints and regulatory power in a few ways. First, by limiting the land available for
any kind of development. The federal government owns 47.7% of the total surface area of
California (Gorte, et al., 2012). Much of the federal land managed in the Sacramento region
encompasses forests in El Dorado County, interstate highway easements, wildlife refuges, and
considerable floodplain areas. The federal government does not own these, but the Federal
Emergency Management Agency (FEMA) encourages state and local governments to zone these
15
areas as open space and can restrict development in these areas if needed (FEMA, 2014). The
Sacramento Natomas area is a good example as FEMA imposed a building moratorium in the
area in 2008, halting all construction for levee repair and upgrades. While FEMA recently lifted
(Weiser and Bizjak, 2015), it still requires flood insurance creating a disincentive to build and
buy in the area.
California Policies and Affordable Housing
California housing policies include requirements for housing elements in local general
plans and regional housing needs assessments and programs to encourage affordable housing. All
of which must consider environmental impacts. It is hard to discuss California housing policies
without briefly discussing Proposition 13 (1978) which resulted in local officials using fees and
assessments to replace property taxes. Proposition 13 took property-taxing power from local
jurisdictions and limited property taxes to one percent of the assessed value of a property’s
acquisition value. Local officials began to prefer zoning and entitlements toward sales-tax
generating building, to accommodate the shift to fees and assessments. Together, the increased
sales tax, fees and assessments supplanted lost property tax revenue. Housing was less of a source
of revenue to local governments. Housing only generated property tax at 1% assessed value and
housed people that would require the provision of public services. Affordable housing
development began to give way to sales tax-rich projects, and high residential property value
projects through fiscal zoning (Fulton and Shigley, 2012).
It is equally as difficult to discuss California housing policies without also discussing the
California Environmental Quality Act (CEQA). NIMBYs (“Not In My Back Yard,” (Rosa,
2012)), and open space and environmental advocates have used CEQA, passed in 1970, to
complicate and to prevent the construction of housing. CEQA is a single-issue (project specific)
law that is highly procedural, leaving plenty of room for litigation. The intent of the law (Public

16
Resources Code § 21000) is to protect the environment and to inform of the interrelationship
between ecological systems and regulatory actions and private development interests. CEQA is a
full disclosure law that requires developments to provide complete environmental impact
reporting, and because of its complex procedures, almost any residential project is vulnerable to
lawsuits (Fulton, Shigley, 2012). Therefore, housing developments face statutory requirements
(adherence to CEQA Guidelines) and court-made laws (through CEQA precedent). However,
CEQA is not a barrier in communities that welcome development, but can be a formidable
obstacle where NIMBYs influence local development decisions. No Oil, Inc. v. City of Los
Angeles (1975) 13 Cal.3d 68 made CEQA a tool for blocking projects at-will by requiring an
Environmental Impact Report (EIR) of any project where a “fair argument” suggested
environmental damage. The EIR, being costly and time consuming, could kill any project on the
grounds of political distaste (Fulton and Shigley, 2012). The ruling was significant because one of
the major costs in development is time.
Perhaps the best example of CEQA related delay costs is the Sacramento Railyards
development proposed in 2006. The proposal included around 12,000 residential units. The
developer completed the EIR and the City of Sacramento certified it in 2007 to amend the city
general plan with the “Railyard Specific Plan.” In 2008, two Sacramento County Superior Court
cases, Downtown Plaza, LLC v. City of Sacramento and Sacramento Citizens Concerned about
the Railyards, et al. v. City of Sacramento (City of Sacramento, 2009), challenged the EIR. In
both cases, the Superior Court ruled in favor of the city, stating that the EIR was consistent with
CEQA Guidelines. The combination of the demise of redevelopment agencies and the timing of
the economic recession had weighed heavily on the project failing to get underway (Will, 2013);
however, the cost of delay caused the developer to go bankrupt and the project has yet to see
shovels hit the ground.

17
However much a potential deterrent to affordable housing CEQA might be, the California
legislature addressed the need to soften the restrictive power of the law over residential
development that might actually prevent environmental degradation. In 2008, the legislature
passed SB 375, the Sustainable Communities and Climate Protection Act, which requires
coordination with councils of governments’ regional housing needs assessment activities with
metropolitan transportation planning to reduce the effect of greenhouse gases from cars and
trucks on the environment. SB 375 assumed that transit oriented development will reduce
automobile dependency and reduce CO2 emissions to meet 1990 levels as required by AB 32, the
Global Warming Solutions Act of 2006. The key provision in SB 375, to promote transit-oriented
development, qualifying as “transit priority projects,” is to exempt (or partially exempt) these
developments from CEQA requirements, thereby protecting them from litigation. To qualify, they
must align with the California Air Resources Board accepted regional sustainable community
strategy (Institute for Local Government, 2010). In other words, the law encourages local general
plans to mirror regional plans. The law intends to create resistance-reduced housing by dulling
the sharp edge of the CEQA tool communities typically use to fight new residential
developments. Furthermore, SACOG adopted a “Preferred Blueprint Scenario” (SACOG, n.d.)
for land use and transportation planning in the region, expecting that local jurisdictions will
comply. However, the CEQA requirements apply to the Blueprint as well as local general plans
that conform to the Blueprint, but nothing requires local jurisdictions to comply. SB 375
encourages but does not require compliance. If desired politically, local decision-makers could
ignore the Blueprint and continue with sprawling construction patterns. However, they would
likely face stronger CEQA based opposition. SB 375 could indirectly lead to added housing units,
assuming local governments, and developers can come to agreements in developing within the
policies and goals stated in general plans.
18
Since the passage of Proposition 218 in 1996 (which closed revenue raising loopholes left
from Proposition 13), local governments have been seriously constrained on their use of fees and
assessments to pay for development infrastructure. They turned to redevelopment revenues and
developer exactions for public projects (LAO, 1996). However, because the demise of
redevelopment agencies and exhausting of Propositions 46 and 1C state (state affordable housing
bonds passed in 2002 and 2006, respectively) funding, exactions are among the few remaining
fiscal tools. My next section explains more about developer exactions. In fiscal year 2007-08,
redevelopment agencies and Propositions 46 and 1C produced $20.4 million and $83.6 million in
affordable housing funds for communities in Sacramento County. Those funds evaporated by
2012-13. It is unclear whether those funds made much difference to affordable housing markets
in Sacramento County; housing shortages persist. Even if there was enough money, state and
local officials may not have distributed the dollars effectively. CDBG and HOME funds also fell
from $20 million in 2007-08 to just $6.4 million in 2012-13 (California Housing Partnership
Corporation, 2014). Of the $6.4 million, $4.5 million is community development block grant
money, which local official often spend on other general plan goals, not just affordable housing.
Recently, the legislature has considered ways to replace some of the redevelopment. AB
35 (Chiu D–San Francisco) would increase the annual Low Income Housing Tax Credit funds
from $70 million to $370 million. AB 90 (Atkins D–San Diego) would redefine how California
distributes National Housing Trust Fund dollars, established by the federal Housing and
Economic Recovery Act of 2008. AB 1335 (Atkins D–San Diego) would establish a dedicated
fund for affordable housing with a $75 fee on real estate transactions documentation (White,
2015).
19
Local Government Land Use Regulations
The local control over land use planning, granted by the federal and state constitutions,
has long been at the heart of housing availability. The 10th Amendment to the U.S. Constitution
makes local government a state matter. The California Constitution, Article XI, grants local
governments the power to implement projects and programs, the power to raise revenue, the
power to take private property for public use (with respect to the 5th, 10th, and 14th Amendments
of the U.S. Constitution), and power to regulate private behavior for public health, safety, and
general welfare (Detwiler, 2015). In addition to the state and federal roles, the local regulatory
power drives legislative decision-making about land uses through general and specific plans and
the zoning ordinances. Implementations of policies are adjudicative with subdivisions and
construction permitting decisions generally made by local planning commissions. Legislative
actions, adopted by city councils or county boards of supervisors, are subject to voter repeal or
revision (initiative or referendum, authorized by California Constitution Article II), while
adjudicatory actions are not. Both are discretionary or subjective based on consideration of
alternatives, which are subject to CEQA rules (Fulton and Shigley, 2012). Therefore, city
councils and county boards of supervisors have the legal incentive to develop their general plans
and zoning ordinances according to the will of their residents. Furthermore, Government Code
§66473.5 requires that all planning be consistent with the local general plan, which means that all
zoning ordinances must further the goals and policies stated in the plan. Therefore, power of local
governments flow from the will of residents and that has important ramifications for regional
planning efforts encouraged by SB 375 and proposed with the SACOG Blueprint. If the residents
do not want development, it will not happen.
Housing affordability has become more of a priority because of Government Code
§65583(c), which requires jurisdictions to develop programs to ensure enough housing affordable

20
for low- and moderate- income households. As a result, many cities have adopted exaction
ordinances such as inclusionary zoning and with amendments to their general plans. The City of
Sacramento adopted Mixed Income Housing Ordinance for New Growth Areas in 2000. The city
ordinance requires that developers of housing projects with eight dwelling units or more build
10% of the units affordable enough for very low-income households and 5% for low-income
households. It also requires the developer to build the affordable units on site; however, the
developer can dedicate land within the new growth area to the Sacramento Housing and
Redevelopment Agency for extremely low-income housing development. The City offers
incentives to developers subject to the inclusionary housing ordinance including developer fee
waivers, density bonuses, streamlined permitting processing, and public funding through tax
credits (Low Income Housing Tax Credit) and state and federal funds (CDBG and HOME
program) (City of Sacramento, 2000). According to the city’s mapped “new growth areas”
subject to the Mixed Income Housing policy, these inclusionary zoned areas are on the city fringe
south of Consumnes River Boulevard, the area south of Folsom Boulevard and East of Power Inn
Road, and the Natomas/Del Paso area north of Interstate 80. The Railyards is in a new growth
area also—development has stalled in litigation. Development in the Natomas area has been
restricted.
In 2014, the County of Sacramento revised its Affordable Housing Ordinance, which is
similar to the City’s 2000 ordinance. The ordinance requires developers to build 10% of their
units as affordable housing, exempting restoration projects, and conversions of non-residential
buildings to residential use. The County's ordinance also exempts mixed-income developments of
17 dwelling units per acre or more, where 20% of units are affordable to low-income renters. The
County ordinance now offers a variety of ways to meet the affordable requirement including land
dedication, 15% affordable units, payment of in-lieu fees of $2.50 per habitable square foot of all
21
market-rate dwelling units, or some combination of these alternatives (Sacramento County,
2015). The building industry thought the prior affordable housing ordinance was too restrictive
with 15% of units required as affordable—6% for low-income, 6% for very low-income, and 3%
for extremely low-income (CALegalAdvocates.com, 2006). As of 2014, the unincorporated areas
in Sacramento County only had 263 affordable units built since 2004, compared to 1,500 units in
the City of Elk Grove, with less restrictive inclusionary housing policies (Locke, 2014).
The City of West Sacramento passed its inclusionary housing ordinance in 2005. The
City revised its housing element in 2013 and the first stated goal is for adequate land for a
balanced range of housing. The City will use inclusionary housing requirements to meet the goal
objective of meeting the housing need as stated in the SACOG Regional Housing Needs
Assessment. The ordinance requires rental-housing developers to build 5% of dwelling units
affordable enough for low-income households and 5% affordable enough for very low-income
households. It requires development of ownership housing to make 10% of dwelling units
available to low-income households. The City intends flexibility for its inclusionary housing
program and negotiates with Housing Trust Fund Program support or other alternatives to achieve
its inclusionary housing goals. The alternatives include acquiring existing market rate units to
rehabilitate and convert to affordable inclusionary units, construction of affordable units off-site,
and the acquisition and preservation of existing affordable units (City of West Sacramento, 2013).
The City of Folsom attempted to repeal its inclusionary housing program, citing that it
prevented housing development and threatened the ability of the City to meet the housing needs
at all income levels. However, the Sacramento Housing Alliance sued the City, arguing that
removing the policy created an inconsistency with the housing element and that the City failed to
amend the element with alternatives to inclusionary housing (Sacramento Housing Alliance, n.d.).
22
The city council decided to keep the inclusionary program, but reduced the affordable unit
requirement to 10% from 15% (Locke, 2014).
Elk Grove and Rancho Cordova do not have inclusionary housing policies, but do have
affordable housing provisions by collecting fees determined through nexus studies or with
incentives tied to density bonus programs. The Elk Grove general plan requires the City to plan
for adequate housing for all income levels by maintaining an Affordable Housing Fund. The City
maintains the fund by levying Affordable Housing Fees to market rate housing and non-
residential construction (City of Elk Grove, 2015). Rancho Cordova requires developers seeking
to build in vacant areas to prepare an Affordable Housing Plan, which allows the developer to
choose from either on- or off-site construction of affordable dwelling units, land dedication,
rehabilitation of existing housing stock, or payment of in-lieu fees. The City does not require a
statement of a certain amount of affordable units, but it does require the developer to state its
intent. The City encourages affordable housing construction with the typical array of modes
including density bonus, reduced parking standards, expedited processing, fee waivers, and
development standard modifications (City of Rancho Cordova, 2013).
While cities with inclusionary zoning or housing programs have adopted their respective
policies to promote affordable housing, building and housing advocates continue to squabble
about the effectiveness of the policies. Before Sacramento County relaxed its inclusionary
program late in 2014, a representative for the North State Building Industry Association called it
“a huge roadblock” (Locke, 2014). Building advocates say that paying fees toward an affordable
housing trust is the way to go while housing advocates fear jurisdictions will not charge enough
to produce the level of affordable housing needed (Locke, 2014). Folsom city officials, after
relaxing their inclusionary housing program, are struggling to secure a huge development on
vacant land south of Highway 50 because they feel developing the area between Prairie City

23
Road and Scott Road is inevitable and that if they cannot get it done, then developer friendly
Rancho Cordova or Sacramento County will develop it (Bizjak, 2015).
Introduction Summary
The U.S. Census Bureau median household income, median house price, and the HUD
Fair Market Rents show an increasing housing affordability problem. The generally accepted
measure of affordability, 30% of household income devoted to housing costs appears to be
growing further out of reach by large segments of the population. Many low-, very low-, and
extremely low-income households pay much more than 30% of their income towards housing
costs, leaving little money to spend in other areas of a sluggish economy.
The law of supply and demand suggests that housing costs have risen to the current levels
because the housing supply is not keeping up with the pace of demand. However, while much of
the attention paid by the media and by housing advocates points to inadequate housing supply as
the reason for unaffordability, none mentions decreases in demand, which could produce the
same goal of affordability. The data available for this study shows affordability trends in
Sacramento County, but none is available for neighborhood level, where demand characteristics
are most important. Presumably, neighborhoods with the best amenities (e.g., good schools,
parks, shopping, and low crime) are in highest demand. Less desirable neighborhoods, with fewer
amenities, must then be affordable.
All levels of government have a role in constraining the supply of housing for safety,
health, or general welfare. The CEQA rules provide anti-growth and environmental advocates
with the ability to block undesirable housing developments with a simple “fair argument” that
may only be fair to the opponent. However, local governments have the largest role because they
regulate the land use activity within their planning areas. All local jurisdictions must produce
general plans that coordinate goals and policies with their implementation actions and in most
24
cases, result in some sort of affordable housing policy that places a burden on developers. The
next chapter provides a literature review looking at the academic definition of housing
affordability, the economics of housing regulation, and some of the implications of demand
regulation that affects housing supply.
The Structure of this Thesis
After this introduction is a detailed literature review, a discussion of my research method, and an
analysis and conclusion based on my findings. In the literature review chapter, I looked at
academic perspectives on housing affordability including the definition, the workings of supply
and demand, and government regulations affecting supply and demand. In the methodology
chapter, I introduced questions about local housing affordability I used to interview local
officials. The analysis chapter compared the interview responses with information obtained
through this introduction and the literature review. In the conclusion chapter, I carried my
findings statements over to provide informed ideas on how best to deal with the housing
affordability problem in the Sacramento region.
25
Chapter 2
LITERATURE REVIEW
An abundance of literature exists about various elements of affordable housing. Many
researchers have looked at the supply side of the housing market and some have looked at
determinants of demand for housing. I consider the literature in these areas to look specifically at
three specific themes. First, I look at the academic definition of housing and the metrics, for
which it is measured. Next, I review research on constraints on the development, including the
supply of housing. Thereafter, I focus on determinants of housing consumption demand spikes. I
believe these three themes contribute to a rich understanding of the housing market conditions
and the role government plays. This review is the foundation for interview questions I developed
to understand the role of government and regulation in the Sacramento region housing market.
Housing Affordability and its Measurement Metrics
Is your home affordable? The typical answers are yes, no, or maybe depending on how
the term “affordable” is defined. The impulsive answers are yes or no. The academic answer is
maybe. The ‘maybe’ answer is because the idea of affordability in a housing market is complex.
There is an abundance of literature on the idea of affordable housing; and in one way or another,
all of the literature revolves around the economic principles of supply and demand. Despite the
various determinates, affordability is always a question of housing cost relative to the income that
residents possess to bear that cost. Academics tend to look at housing affordability in a much
more complex way than the media or even the normal housing consumer.
How do academics define housing affordability and its metrics?
The literature does not offer a distinct definition of housing affordability outside of the
common measurement concepts. Nevertheless, academics and economists offer ideas on the
scope of unaffordability and how it happens. Raphael and Quigley (2004) reasoned a complex
26
theoretical concept of housing affordability asserting that it is the intermingling of a disparate set
of issues. These issues include the distribution of housing (in terms of quality) and income
(ability to pay), the capacity of households to borrow, public policies affecting housing markets,
the conditions in the local market affecting housing supply, and the choices households make in
determining the level housing to consume among other competing consumption alternatives. This
view suggests there is a complex formula with many inputs to get a true understanding.
Some of the literature favored the demand side to describe affordability. For example,
Matlack and Vigdor (2006) suggested that decreasing affordability in regional housing markets
was synonymous with rising income inequality. Gellen (2014) recognized the traditional
definition as a balance between prices and income. However, he noted that the definition does not
account for the socially derived difference between single and dual-income earner households
that adds family values to the affordability equation. Fingleton (2008) also defined affordability
by income over prices; but he used averages, which raised questions about intra-place variability
in income and housing (assuming some constant in supply elasticity). He attempted to correct for
this variability by incorporating a competitive industry production formula, assuming general
equilibrium, with a wage model that considers worker efficiency.
Housing supply and affordability
Other literature leans more toward supply to explain the meaning of affordability.
Although it is difficult to conceive of any definition that does not include ability to pay, an
inherent demand characteristic, Ryan and Enderle (2012) approached the issue from an
availability standpoint; suggesting that affordability is a social argument of accessibility to
available housing on high-value land. They argued that affordable housing is not just about ability
to pay, it involves the distribution of social capital of reduced segregation. In other words,
political demands essentially makes the sharing of high-value land among social classes virtually

27
impossible. The combination of density bonus seeking and political opposition (presumably
deriving from stigmatized distaste for affordable housing) forces developers to concentrate
affordable housing on low-value land.
Housing supply often emerges as the preface for explaining affordability problems
because of price volatility (Paciorek, 2013; Green, et al., 2005). Smith, et al., (1988) told us that
housing is a durable good and because of its long life cycle, the existing stock weighs heavily on
decisions to construct new stock. In other words, housing development involves a commitment
and opportunity cost and its supply does not adjust easily in response to demand shocks. Paciorek
(2013) and Green, et al., (2005) studied factors reducing supply elasticity by looking across
metropolitan statistical areas. This vantage point appeared appropriate considering local housing
development choices and the spillover effect, where a housing shortage in one city could spill
demand for housing over to a neighboring city, creating a shortage there too (Malpezzi, 1996;
Quigley and Raphael, 2004; Levine, 1999).
Most researchers used a ratio of median household income over median housing price to
determine aggregate housing affordability (Chakrabarti and Zhang, 2014; Gellen, 2014). Others
compared percentage of income used for monthly rent or mortgage (Quigley and Raphael, 2004).
Some studies noted the variation in housing prices between owners and renters. Chakrabarti and
Zhang (2014) examined California municipalities by using county-level incomes (using census
data) over city-level prices using data (Business and Economic Statistics Section of RAND
California). However, the metrics depend largely on the definition. Moreover, in all cases, an
increase in housing supply in an area will lower the price of housing. No matter how a researcher
or practitioner measures affordability, a shortage of housing will necessarily increase the price.
Some of the literature looks at affordability as bifurcated between owner-occupiers and
renters, recognizing the difference in housing cost (Smith, et al., 1988; Malprezzi, 1996; Quigley

28
and Raphael, 2004), and Smith, et al., (1988) noted that with taxes and interest rates, owning a
home to live in or as means to provide rental housing, user costs vary. This owner/renter
bifurcation may challenge the notion that a housing price/household income ratio accurately
describes affordability and sets up a situation where households may consider arbitrage. The
separation of the rental and owner markets creates an important distinction about the difference
between housing stock and housing services, which respectively defines investors and consumers
in the consolidated housing market (Smith, et al., 1988). Affordability might then be the
difference between incentivized investment arbitrage and criteria for a consumption choice.
Quigley and Raphael (2004) found that there is little evidence that housing has become
less affordable for owners, while housing for renters in lower-income quintiles has become quite
unaffordable between 1960 and 2000. They measured affordability by the proportion of income
spent for housing costs. For example, they analyzed American Community Survey data, dividing
the sample into quintiles by income distribution, to explain that rent as a percentage on income,
for the lowest and second lowest quintiles have shifted from 47% to 55% and 23% to 29%
respectively from 1960 to 2000. Looking at the same quintiles, the percentage of renters devoting
more than 30% of their incomes to rent shifted from 62% to 79% and 21% to 44% respectively.
The other three quintiles changed very little during the period (Quigley and Raphael, 2004).
While the change in the lower quintiles showed a vast decrease in affordability, it may speak
more to income inequality. However, they then looked at the percentage of rental stock affordable
to household income quintiles, which suggested a lack of available housing supply for lower
income households. They found that the highest three income quintiles during the period have
been able to afford 90% or more of the available rental stock. The second lowest shifted from
65% in 1960 to 50% in 2000, and the lowest quintile shifted from 13% in 1960 to 7% in 2000.
29
Measuring regulation effects on housing supply
To measure the effect of regulation on housing supply, one could count the denied
development projects in a city or county during a prescribed period. However, the denied projects
would not capture the breadth or depth of regulation within a jurisdiction. Regulation can also
create prohibitive costs without directly prohibiting construction (Gyourko, et al., 2008).
According to Gyourko, et al.:
The proliferation of barriers and hurdles to development has made the local
regulatory environment so complex that it is now virtually impossible to describe
or map in its entirety. (p.694).
No measure exists that can exactly measure the impact of regulation on the housing market.
However, Gyourko, et al., (2008) developed a tool intended to gauge how the local people,
processes, and state-level policies affect project approval outcomes. They referred to it as the
Wharton Residential Land Use Regulation Index (WRI) and it is a set of indices measuring the
intensity of the regulatory environment (nine local regulation indices and two state-level indices).
Three studies I looked at, assessing regulation impact on housing supply and
affordability, used the Gyourko, et al., (2008) index. Saiz (2010) used the index in conjunction
with geographic land availability metrics to develop a conceptual framework relating land
availability to urban growth, and housing prices across regions and over time. Paciorek (2013)
used the index to compare MSAs by interacting the WRI results with house price data, new
housing investment data, housing density and geography data, real cost of construction (excluding
regulatory and land cost), and exogenous demand equilibrium shifters (changes in local demand
for labor and migration levels). Kok, et al., (2013) similar to Saiz (2010) measured the regulatory
environment with economic and geographic determinants of land and housing prices. They
looked at regulatory impact using a variant of the index, including difficulty of obtaining permits
30
or zoning changes. Moreover, unlike Saiz (2010), Kok, et al. (2013) measured impacts within a
region, surveying 110 jurisdictions in the San Francisco Bay Area.
Malpezzi (1996) used an earlier variation of the Wharton index with seven measures of
city-specific regulatory environment including changes in single-family housing projects
approval time (in a prescribed time period), time between rezoning application for residential
subdivisions and permit issuance, acreage of land zoned for single-family/multifamily housing,
percentage of zoning changes approved, and a scale for adequate infrastructure. For state-level
regulatory environment measurement, the Malpezzi (1996) model used the Survey of State Land
Use Planning Activity developed by the American Institute of Planners in 1976. The state level
measures were dummy variables looking for the presence of statewide comprehensive planning,
coastal zone management plans, wetland management regulations, floodplain management,
designation of critical land use planning locations, enabling legislation for new towns,
requirement for environmental impact reporting, and regulations giving the state power over local
regulation for development of statewide importance. Malpezzi (1996) applied the model to
Sacramento and 55 other cities across the United States. Sacramento scored higher than all but
San Francisco and Honolulu on the city-specific regulatory index, highest on the state-level index
(like all other California cities, tied with Minneapolis, Minnesota), and had a higher census
median house value than all but nine California and northeastern coastal cities (Malpezzi, 1996).
Gyourko, et al. (2008) compared states for regulatory strictness with their WRI form revised (see
Appendix A) from the version Malpezzi (1996) used, which considered additional state executive,
legislative and court activity. California ranked number nine, with over one-half standard
deviation over the mean regulatory strictness, coming in behind number one Hawaii, six coastal
states in the northeast, and Washington State. Saiz (2010) applied the revised WRI (Gyourko, et
al., 2008) at the MSA level while considering geographic constraints (steep slopes and water

31
bodies). He ranked MSAs by the percentage of undevelopable land and found eight of the top 25
in California. Seven of the top 25 had a WRI under the mean—New Orleans, Louisiana, coming
in at number four most undevelopable, was least regulated in the sample with 1.24 standard
deviations below the mean. Those seven MSAs below the mean were all in the south or Midwest.
The remainder of the top 25 in undevelopable land were all along the east coast except Seattle
and Milwaukee (Saiz, 2010). Unfortunately, the study did not capture Sacramento data, as the
WRI survey respondents were International City Managers Association members, which may
have excluded the MSA (Gyourko, et al., 2008).
Geographical constraints
The economic concept of housing supply reflects forces constraining the development of
new housing in regions. Most metropolitan areas throughout the country have elastically supplied
housing simply by zoning more land for development. However, in addition to regulations, the
geography of most California regions constrains the location of new housing. Saiz (2010)
proposed that as land availability decreases, so does price sensitivity to demand shocks. He tested
this by using GIS data and the US Geological Service satellite-based geographic data and Digital
Elevation Model tool to assess exogenous levels of undevelopable land.
Implications of unaffordability
Chakrabarti and Zhang (2014) said that unaffordable housing could adversely affect local
economic growth by making the area less attractive to businesses and low- and medium-wage
earners. Their study measured affordability, education, and population, controlled by electricity
prices and amenities, to gauge these variables’ effect on local employment growth. Simply put,
increased prices because of housing supply constraints disproportionately affect lower-income
households (Quigley and Raphael, 2004).

32
Lower-income households could be low-skilled working families, young families with
the primary earner at an entry-level in the workforce, or immigrant families with little knowledge
of employment opportunities. As housing prices rise, low-income households devote a larger
percentage of their incomes toward housing costs, relative to wealthier households. However,
Smith, et al. (1988) notes that we typically measure prices in the housing market by transactions
or services. Existing owner-occupiers pay housing services transactions to themselves in the form
of rising equity (assuming prices rise at or above the inflation rate). If they have a fixed mortgage
rate, they are unaffected by rising prices. Renters pay housing property owners for housing
services temporarily. When they move, the rise or fall in housing prices will dictate their new cost
of housing services. New entrants into the housing market will pay housing services to an existing
owner selling the house. They too are subject to movement in housing prices. Because lower-
income households have a greater probability of moving (Smith, et al., 1988), they absorb more
of the burden of price increases and perhaps enjoy the relief of price decreases.
Definition and metrics summary
In summary, academic evaluation of housing affordability expands on the federal 30% of
income devoted to housing costs standard. Using the 30% threshold as a proxy, they developed
methods to explain that housing prices rely on the relationship between supply and demand.
Further, they sought to measure the determinants of both. Many studies have linked housing
supply shortages to land available for development. Clearly, geography plays a part, but the role
of regulation has been much more difficult to explain as many studies have relied on the Wharton
Residential Land Use Regulation Index as a data collection tool for the examination.
I sought to learn how jurisdictions define housing affordability and whether they think it
is a problem. I wanted to understand if and how they measured affordability. However, I am still

33
unclear about who the low- and very-low income households are. Therefore, I asked my interview
respondents attempting to answer this question from their perspectives.
Regulations Affecting Housing Supply and Affordability
Regulatory constraints on housing supply come in a variety of forms. Gellen (2014)
referred to “legal, political, or institutional limits on the utilization of the major inputs in housing
production—land, labor, capital, infrastructure, and public services,” (p. 3) as major limits on
new housing developments. These regulations often occur in cities and counties in the form of
zoning standards, subdivisions, and construction permitting. In more detail, local policies include
open space requirements, height restrictions, minimum lot sizes, historical preservation, limits on
permitting, and farmland preservation (Sowell, 2009).Why are these regulations needed? Are they
effective? The economics of regulations could provide some insight.
Economic theory of regulation in housing markets
When I think of regulation, I tend to think it punishes or restrains an activity harmful to
the public welfare. Regulations certainly protect the public welfare, but the questions, with
respect to housing, is who the public is, and what is the welfare? Housing is an important aspect
of life because it represents security, personal expression, and a source of wealth or as Gellen
(2014) called it, “a commodity” (p. 4). While housing provides these elements of private utility, it
is also creates an extensive network of services, catering to private and social prosperity. Services
to create and repair roads, parks, and schools, police and fire protection, and location near
employment opportunities all create desirable social neighborhood environments and thriving
economies surrounding housing (Gellen, 2014).
Perhaps regulating a housing market generally intends to raise prices, in theory, to
prevent or reduce perceived negative externalities of housing development. Regulation either
stops the externality from happening, or requires more spending to mitigate it. The increased

34
prices should force consumers of housing to internalize externality costs, when the social cost of
housing grows beyond the current private cost. Malprezzi (1996) considered these externalities to
include congestion, environmental costs, infrastructure costs, costs arising from increased
demand for services, and existing owners’ perceived cost of neighborhood deterioration when
new households enter creating heterogeneity in the neighborhood. Most often, regulations restrict
the supply of housing, which has the effect of increased prices, assuming constant or increasing
demand. Relying solely on economic theory for justification for regulation may ignore the
problem of affordability as prices seek to correct market failures rather than establish
affordability.
Perhaps market correction and affordability are opposing forces, one undoing the other.
Nearly all of the literature about housing affordability builds models assuming that the market is
moving toward an equilibrium. Equilibrium is the point where supply and demand converge at a
market-clearing price. Glaeser and Gottlieb (2009) introduced the spatial equilibrium model
where labor, employers, and homebuilders work, employ and build at equilibrium respectively
over the span of a metropolis. Spatial equilibrium implies that while prices within an area (or
across regions) may differ, the rise in one area will naturally offset the decline in another.
Another variation is Matlack and Vigor (2008) who employed partial and general equilibrium
models to show how income inequality relates to housing affordability. The former (partial
equilibrium) split high and low socioeconomic (SES) groups and assuming homogeneity in
housing differentiation, while the latter (general equilibrium) expanded the model to allow
housing quality differentiation, which is expected. Their models used the GINI coefficient as a
predictor for inequality and MSA and time fixed effects. The partial model showed that if housing
is undifferentiated (with controls for household size, education, and race and sex of head of
household), then income inequality in any form exacerbates housing unaffordability and lower

35
living standards for low-SES households with lower disposable income and more crowding
within the home (assuming inelastic housing supply and housing as a normal good). However,
with housing differentiated by size and quality, an income increase in the 90th percentile, with
constant income in the 10th percentile, low-SES households simply responded by consuming less
housing to avoid an increase in housing costs. Although, both models were highly dependent on
the level of slack in the local housing market as effects are much less significant in areas like
Detroit where lower housing cost due to vacancy rate offset loss of income in the 10th percentile
(Matlack and Vigor, 2008).
The differentiated housing market findings in the Matlack and Vigor (2008) study are
important to my study because it implies the economic effect of filtering (Matlack and Vigor,
2008, p. 8; Quigley and Raphael, 2004, p. 205; Smith, et al.1988, p. 46). Filtering happens when
new housing available in the local market becomes desirable to high-SES households, thereby
increasing supply of older, lower quality housing, creating affordable options for low-SES
households. Somerville and Holmes (2001) used American Housing Survey data from 1984 to
1994 to build a time-series model that looks at the movement of housing into and out of
affordable status at the MSA level. They found that the prominence of filtering depends on
neighborhood conditions (ratios of rental units, percentage of African American heads of
households, public housing as a percentage of rentals, and age of units). The Somerville and
Holmes (2001) study essentially uncovered the gentrification demand characteristic (covered later
in this review), that Smith, et al., (1988, p. 46) called “a sort of reverse filtering,” which can
diffuse the benefits of filtering when new housing development is constrained (Vigdor, 2002;
Quigley and Raphael, 2004). Affordable units in better neighborhoods are at most risk of filtering
upward, or gentrifying, which suggests local policies that encourage affordable housing may be
36
misaligned with those that promote neighborhood diversity (Somerville and Holmes, 2001). I
discuss gentrification in more detail later in this review.
Risk, perverse incentives, and housing supply
One way that regulation can affect the supply of housing is by adding risk to the private
decision to build. The generally accepted definition of regulatory risk is the degree to which
regulation can alter the level of cost of development through increased uncertainty of approval
outcomes and future residual values. Mayo and Sheppard (2001) developed this concept into their
theory of stochastic development controls. They used a typical development cost function
accounting for time and speculative value of two development alternatives under two different
states of certainty. With a quadratic estimate, they tested the effects of random changes in
planning delays, noting that increasing uncertainty in planning approval adversely affected
housing supply.
Some literature looks at the interesting phenomenon where government intervention
designed to create more affordable housing, fails to do so. Titman (1985) found, using a simple
land value model, that government initiatives intended to promote housing construction often
stymie development activity by creating uncertainty about future residual value (assuming vacant
land generates no costs or benefits). The initiatives then created the perverse incentive to hold
land vacant, suggesting an arbitrage situation. The Titman (1985) finding is somewhat consistent
with the Ryan and Enderle (2012) where their model estimated the effectiveness of the California
density bonus program (a voluntary participation program) intended to promote construction of
affordable housing in high land value areas giving low-SES households access to the amenities of
high land value areas. The outcome resulted in clustering of affordable housing in low land value
areas, presumably as arbitrage against the higher cost of more building on more valuable land.
The Ryan and Enderle (2012) study also included interviews with local housing officials who
37
noted the decision of where to build took into account the cost of political opposition to
affordable housing. Uncertainty in California is likely higher than most places given the price
volatility discussed and local preferences to exercise growth controls. Levine (1999) looked at
1988 and 1992 survey responses of jurisdictions asked about their provision of affordable housing
development incentives. These incentives included development encouragers such as density
bonuses, fast track permitting, city block grants, redevelopment funding, and development fee
waivers. He noted that 73% of jurisdictions had at least one incentive available, but with no
significant relationship to net housing change.
Zoning and permitting effects on housing supply and affordability
City and county officials use zoning standards and other permitting tools to limit or
expand development opportunities. Levine (1999) discussed some earlier views on the conditions
encouraging growth controls in California surrounding population growth, declining funds for
infrastructure, people shifting to the peripheries of metro areas, and communities with a growing
distaste for low-income and minority populations. Levine (1999) examined the strength of
significant negative correlation between enactment of specific growth control ordinances and the
change in housing stock from 1980 to 1990 with a time-series estimation model. He found that
rezoning of residential land to farmland had the strongest negative relationship to housing stock.
He also found that rezoning to lower-density development had similar significance, albeit at a
lower magnitude. Rezoning commercial or industrial land to less-intense use development and
height limits on commercial or office buildings also had significant negative effects; perhaps,
because less dense commercial required less housing because of fewer employees. Levine (1999)
found a significant negative correlation between the presence of growth-control ordinances in a
jurisdiction and the number of families, rented units, owned units, new homeowners, and
Hispanic, African American, and other non-white populations. He found a strong significant
38
positive correlation between growth-control and home values; so much so, that the increase in
home value was stronger in correlation than the decrease in Hispanic and African American
populations combined, and nearly as strong as the decrease in all the others combined. The
Levine (1999) findings show that growth-control enactments were clearly good for the
homeowners, but a burden for all others.
Glaeser, et al., (2005) proposed that the local planning authorities must weigh not only
the costs and benefits of zoning alternatives, but the politics of permitting specific projects.
Zoning limits on housing results in costs consisting of higher prices and misallocation of labor
and benefits from internalization of construction-related externalities (Glaeser, et al., 2005).
Fischel (1990) claimed that zoning is effective only among political equals and that zoning
disputes featuring one dominant political force, such as a group of existing homeowners, will
usually favor the dominant, especially in the low-density suburbs.
Inclusionary zoning to increasing affordable housing
The most widely known tool to promote affordable housing are inclusionary zoning
programs. These local programs can either promote voluntary development of affordable housing
or make it a requirement. Housing developments under inclusionary zoning must build a
percentage of units for sale at below-market rates. Voluntary programs offer an incentive to
participate, required programs make designating a portion as affordable units mandatory. Talbert
and Costa (2003) reviewed a myriad of court cases involving the constitutionality of inclusionary
zoning. They explained that developers have sued over the idea of taking property and the
constitutionality of requiring developers pay fees to build affordable housing trust funds. Court
rulings defeated most efforts, putting a stamp on inclusionary zoning as a permanent practice.
While much of the research on inclusionary zoning has been descriptive, some studies
have attempted empirical approaches. Schuetz, et al., (2011) used a reduced-form panel
39
regression model including characteristic variables for inclusionary programs, housing prices,
permit data, and typical supply and demand factors to determine the impact of inclusionary
zoning on the number of affordable units produced. Their model looked at 55 jurisdictions in the
San Francisco Bay Area and showed a statistically significant positive relationship between the
number of affordable units and time since the inclusionary program adoption, the presence of a
density bonus, and the presence of a minimum unit requirement. The magnitude was highest with
the time since adoption; as a 1% increase in affordable units was associated with a 1% increase in
time since adoption. The density bonus had nearly the same magnitude. When they looked supply
and demand factors (omitting the inclusionary zoning variables), they found that a 1% increase in
affordable units correlated with smaller increases in African American population and the percent
of jurisdictions in the area with inclusionary zoning. They found a 1% increase in affordable
housing to correlate with a 0.3% increase in stronger growth controls. This result is interesting
because it suggests that strong growth controls helps create affordable housing. Notably, there
was a significant negative correlation between affordable units and units built with the Low
Income Housing Tax Credit, which Schuetz, et al., (2011) thought could be due to
substitutability. Combining the market forces and institutional inclusionary zoning factors, they
again find strong significant correlations. A 1% increase in affordable units correlates with a
0.9% increase in time since adoption and a 0.75% increase in the presence of density bonus.
However, with this model, they find that a 1% increase in affordable units has a negative
relationship with housing built for the very low-income population, showing that 0.7% less very-
low income households can afford housing. The data and results in the Schuetz, et al., (2011)
presented an interesting notion that time and density bonuses make inclusionary programs more
effective at producing more affordable housing. The surprising finding is that the construction of
affordable units, considering supply and demand, made it harder for very-low income households
40
to secure housing. This finding may suggest another connection with income inequality, but it
likely also means that the supply of affordable housing is still a problem. If more households are
dropping into the very-low income segment, then the next problem to grapple with will be if
prices set for affordable housing is affordable enough.
Regulation and supply summary
After reviewing the literature about the effect of zoning on housing affordability, it seems
clear to me that all the benefits seems to always concentrate with homeowners. I found that
zoning leads to higher home prices and greater racial segregation. I see the NIMBY notion
practically everywhere when looking at housing affordability issues and perhaps there is
unquantifiable truth to the notion. Do homeowners deserve to receive more of the benefits?
Arguably, they have contributed more or encumbered greater costs by their effort to secure their
status. On the other hand, is this a zero-sum game question? Does the success of homeowners
impede very-low income households from finding that path? To that end, I found that
inclusionary zoning creates more affordable units, but not for the most vulnerable, perhaps those
that need it the most.
Reflecting on this section devoted to how regulations affect housing supply and
affordability, I consider some questions that will strengthen my interview research. First, I will
consider the economic question of how regulation reduces the effect of housing externalities. If
prices are a manifestation of internalizing externalities, do prices equitably distribute the external
cost? Next, I considered questions about the effects of zoning and permitting. The literature
suggested one of the main deterrents of increasing housing supply is the developer uncertainty
because of unpredictable rezoning and permit approval times. I asked about this problem to
understand if there are specific reasons for time delays and about the sources of time variation. In
addition, 14 out of 33 jurisdictions (8 counties and 25 cities) in the Sacramento region have

41
adopted inclusionary housing programs; the City of Sacramento’s program is 15 years old. I
would ask about the results of inclusionary zoning. Gyourko, et al., (2008) noted that heavily
regulated areas (those with high WRI values) all had multiple pressure groups interested in land
use controls. These questions, following with a discussion with local officials might provide some
data to compare pro-growth and anti-growth jurisdictions.
Public Policy and Demand Spikes
This review has primarily focused on supply-side related issues affecting housing
affordability, but for this last section, I look at demand. After all, supply issues surface when
demand either outpaces or falls short of supply. Government actions and policy can affect
demand. One way is through subsidies. Smith, et al., (1988) reminded us of the debate about
intervening in the housing market to reach a standard by which all Americans have “decent
housing in suitable living environments” (p. 41; also Truman, 1949). On one side of the debate,
critics say that government involvement creates unfair distribution and an inefficient distribution
of housing and income according to risk versus reward. The other argument is that all people
should have a minimum level of housing. Politicians and advocates often argue for a minimum
level of housing, but I could not find a specific standard. Smith, et al., (1988) called it specific
egalitarianism that considers housing a special exception among the efficiencies of markets. One
might consider the value of housing assistance subsidies and welfare entitlements, the combined
value of “money for nothing” as the minimum guaranteed level of housing.
Factors and consequences of demand equilibrium shifts
I have discussed some of the literature associating growth control regulations to
inadequate supply of housing and higher prices, but now I will look at the effects on demand and
some common characteristics that shift demand. Regulations can raise prices, but they can also
create desirable places or improve the quality of life of residents (or specific area residents).
42
Cho (1997) explained that establishing growth restrictions and boundaries create
endogenous social costs and benefits. The benefits are amenities and include green spaces,
consolidated services and infrastructure, prevention of excessive leapfrogging land consumption,
and reduction or prevention of longer commute times. As these amenities increase in the
jurisdiction, housing prices will rise as people seek to enjoy them. Areas without restrictions can
experience rising housing prices as the location demand effect draws people to the locale. In other
words, as the demand for the land and amenities increase (population increase), so does the level
of congestion. Amenity seekers may not find housing within the jurisdiction, but may locate close
enough where they can still enjoy the amenities. This proximity of location gets back to the
spillover concept and the cost of boundaries and controls, which Cho (1997) considered crowding
of amenity usage and affected public services. Because of the political environment in which
public planning officials operate, they are slow to react to population surges. The spillover might
occur and planning officials avoid the need for infrastructure services provisions because of
political opposition to providing a means for increasing population. Perhaps because amenities
and capital improvements intend to stabilize some intended level of population and consumption.
To explain typical land consumption with amenities, Cho (1997) established an optimization
function (with no growth boundaries) by including individual budget, level of amenity benefit,
and amount of land zoned for residential use and home value for the demand side utility function.
He included (considering land rent from the proprietor at the opportunity cost against agricultural
use) the value of the capital investment, population density, and land availability on the supply
side of the function. He noted that the optimum level determines the level of congestion tax, an
externality cost consistent with Smith, et al., (1988), levied on all that would consume the land
and amenity. Cho (1997) asserted that with the absence of congestion tax, the cost of congestion
is a new upward-shifted rent schedule (or housing cost). The effect of adding growth restriction
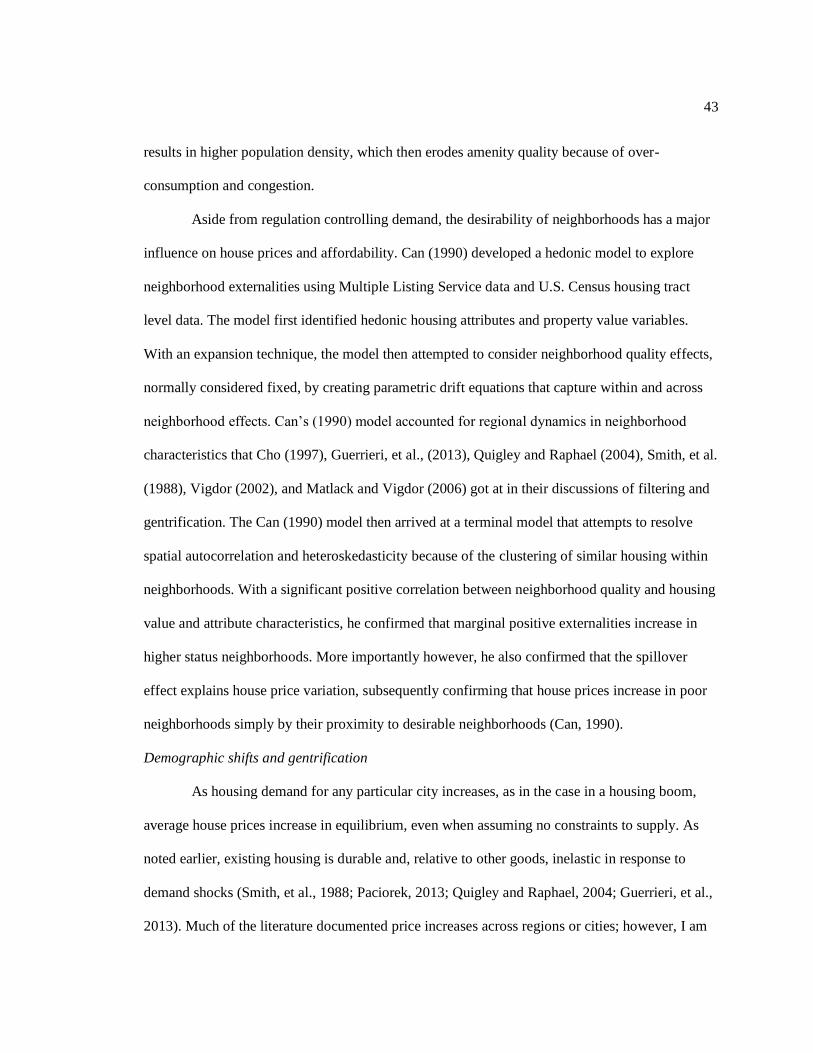
43
results in higher population density, which then erodes amenity quality because of over-
consumption and congestion.
Aside from regulation controlling demand, the desirability of neighborhoods has a major
influence on house prices and affordability. Can (1990) developed a hedonic model to explore
neighborhood externalities using Multiple Listing Service data and U.S. Census housing tract
level data. The model first identified hedonic housing attributes and property value variables.
With an expansion technique, the model then attempted to consider neighborhood quality effects,
normally considered fixed, by creating parametric drift equations that capture within and across
neighborhood effects. Can’s (1990) model accounted for regional dynamics in neighborhood
characteristics that Cho (1997), Guerrieri, et al., (2013), Quigley and Raphael (2004), Smith, et al.
(1988), Vigdor (2002), and Matlack and Vigdor (2006) got at in their discussions of filtering and
gentrification. The Can (1990) model then arrived at a terminal model that attempts to resolve
spatial autocorrelation and heteroskedasticity because of the clustering of similar housing within
neighborhoods. With a significant positive correlation between neighborhood quality and housing
value and attribute characteristics, he confirmed that marginal positive externalities increase in
higher status neighborhoods. More importantly however, he also confirmed that the spillover
effect explains house price variation, subsequently confirming that house prices increase in poor
neighborhoods simply by their proximity to desirable neighborhoods (Can, 1990).
Demographic shifts and gentrification
As housing demand for any particular city increases, as in the case in a housing boom,
average house prices increase in equilibrium, even when assuming no constraints to supply. As
noted earlier, existing housing is durable and, relative to other goods, inelastic in response to
demand shocks (Smith, et al., 1988; Paciorek, 2013; Quigley and Raphael, 2004; Guerrieri, et al.,
2013). Much of the literature documented price increases across regions or cities; however, I am
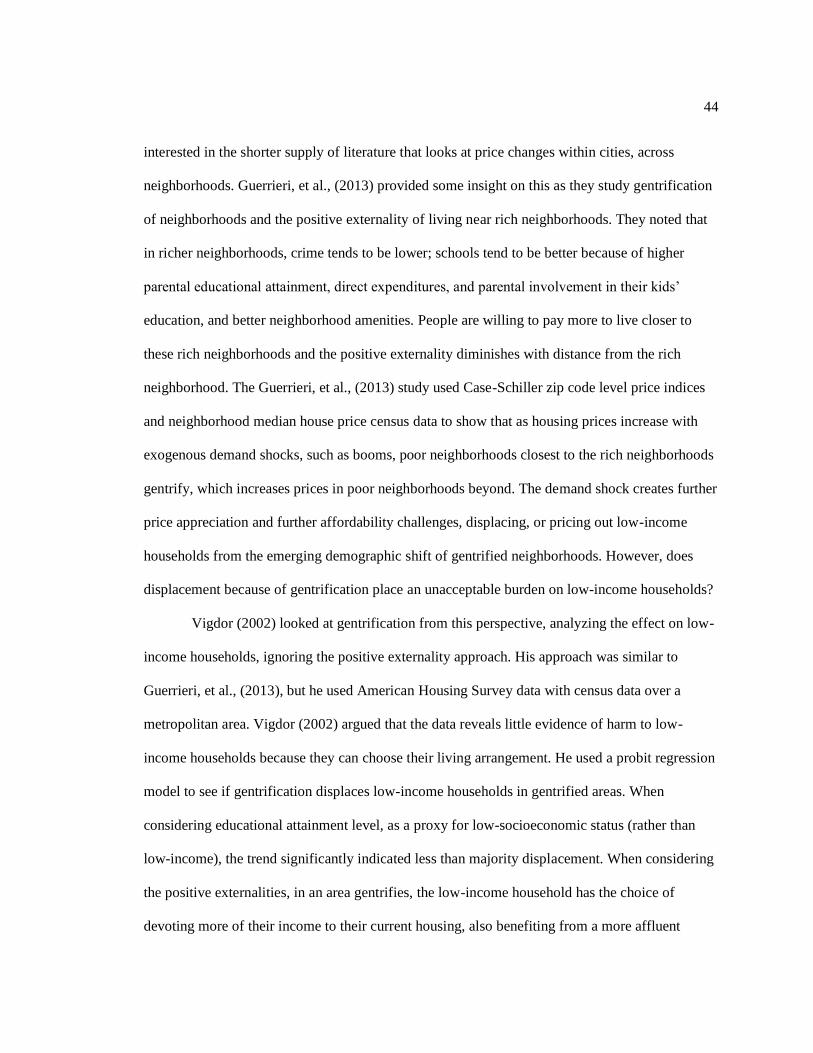
44
interested in the shorter supply of literature that looks at price changes within cities, across
neighborhoods. Guerrieri, et al., (2013) provided some insight on this as they study gentrification
of neighborhoods and the positive externality of living near rich neighborhoods. They noted that
in richer neighborhoods, crime tends to be lower; schools tend to be better because of higher
parental educational attainment, direct expenditures, and parental involvement in their kids’
education, and better neighborhood amenities. People are willing to pay more to live closer to
these rich neighborhoods and the positive externality diminishes with distance from the rich
neighborhood. The Guerrieri, et al., (2013) study used Case-Schiller zip code level price indices
and neighborhood median house price census data to show that as housing prices increase with
exogenous demand shocks, such as booms, poor neighborhoods closest to the rich neighborhoods
gentrify, which increases prices in poor neighborhoods beyond. The demand shock creates further
price appreciation and further affordability challenges, displacing, or pricing out low-income
households from the emerging demographic shift of gentrified neighborhoods. However, does
displacement because of gentrification place an unacceptable burden on low-income households?
Vigdor (2002) looked at gentrification from this perspective, analyzing the effect on low-
income households, ignoring the positive externality approach. His approach was similar to
Guerrieri, et al., (2013), but he used American Housing Survey data with census data over a
metropolitan area. Vigdor (2002) argued that the data reveals little evidence of harm to low-
income households because they can choose their living arrangement. He used a probit regression
model to see if gentrification displaces low-income households in gentrified areas. When
considering educational attainment level, as a proxy for low-socioeconomic status (rather than
low-income), the trend significantly indicated less than majority displacement. When considering
the positive externalities, in an area gentrifies, the low-income household has the choice of
devoting more of their income to their current housing, also benefiting from a more affluent

45
neighborhood, with better schools’ performance, cleaner public spaces, and reduced crime. Other
low-income households might choose to relocate to a lower cost area, foregoing the positive
externalities. Although, Vigdor (2002) did contend that the evidence left much room for omitted
variable errors. He suggested future research look more at the underlying causes of gentrification,
how revitalization affects housing costs for poor households and their willingness to pay for
housing.
Demand summary
The Cho (1997) and Can (1990) studied reveal the challenges of determining and valuing
externalities with changing demand and how to force internalization of the costs. First,
restrictions on growth can transfer wealth, as in increased housing costs, to land proprietors
unless congestion taxes eliminate the gains. On the other hand, that congestion could reflect
negatively on the value of land, thereby eliminating the welfare transfer (Cho, 1997).
Alternatively, the growth restriction could diminish optimal increases in amenity provision or
have the long-run effect of shifting the equilibrium price to the point of reducing the population to
correct the congestion externality. Can (1990) explained that prices are indeed a function of high-
value amenities in an area. The spillover effect, manifested by demand, increases prices in nearby
areas, which, as Vigdor (2002) explained, presents low-income households the option to stay and
absorb the higher pecuniary prices in exchange for the positive externalities or relocate to
maintain current level of pecuniary housing cost. Through the work of Guerrieri, et al., (2013),
Matlack and Vigdor (2006), and Vigdor (2002), it is clear that a link between housing filtering
and gentrification exists.
Literature Summary
This literature review organized previous research into three themes: academic definition
of housing affordability, regulatory effect on affordability through housing supply, and demand
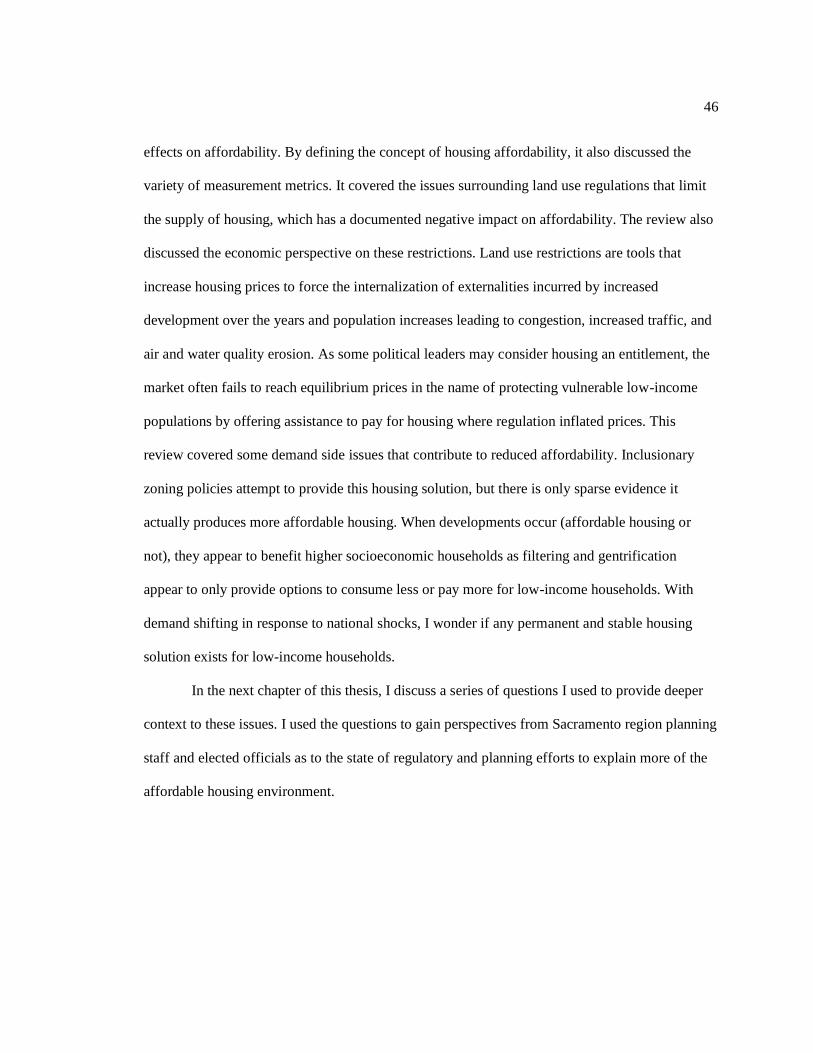
46
effects on affordability. By defining the concept of housing affordability, it also discussed the
variety of measurement metrics. It covered the issues surrounding land use regulations that limit
the supply of housing, which has a documented negative impact on affordability. The review also
discussed the economic perspective on these restrictions. Land use restrictions are tools that
increase housing prices to force the internalization of externalities incurred by increased
development over the years and population increases leading to congestion, increased traffic, and
air and water quality erosion. As some political leaders may consider housing an entitlement, the
market often fails to reach equilibrium prices in the name of protecting vulnerable low-income
populations by offering assistance to pay for housing where regulation inflated prices. This
review covered some demand side issues that contribute to reduced affordability. Inclusionary
zoning policies attempt to provide this housing solution, but there is only sparse evidence it
actually produces more affordable housing. When developments occur (affordable housing or
not), they appear to benefit higher socioeconomic households as filtering and gentrification
appear to only provide options to consume less or pay more for low-income households. With
demand shifting in response to national shocks, I wonder if any permanent and stable housing
solution exists for low-income households.
In the next chapter of this thesis, I discuss a series of questions I used to provide deeper
context to these issues. I used the questions to gain perspectives from Sacramento region planning
staff and elected officials as to the state of regulatory and planning efforts to explain more of the
affordable housing environment.

47
Chapter 3
METHODOLOGY
Some combination of housing market forces, demographic changes, and government
intervention best explains the complex issue of housing affordability. Local governments are
responsible for understanding and dealing with these elements, to mitigate housing affordability
problems, among safety, health, and other general welfare priorities. This thesis explores the
Sacramento regional housing affordability problem through the lens of local officials. I analyzed
the problem by reflecting on their perspectives, previous research, publications from advocates,
and media contributions.
The previous academic studies approached the housing affordability problem by
analyzing nationwide or statewide data comparing states or regions. While those are important for
looking at variances across these areas, making recommendations to deal with the problem are
difficult because solutions begin with local governments given their land use decision-making
powers. These studies tried to determine why housing becomes unaffordable. Most measured the
effects of regulation on housing supply, some looked at geography and its relationship to housing
supply, and others analyzed the effects of demand characteristics on housing prices. I did not find
any studies that analyzed affordability within a specific region; therefore, my study looked within
the Sacramento region, specifically at local governments. Most of those previous studies
suggested that within-region studies would provide a better sense of the affordability problem.
Local land uses characterize housing supply and demand and vary from region to region because
economies, politics, and resources vary. Therefore, to provide exploratory research for the
Sacramento region, I obtained perspectives from local officials in its jurisdictions through
unstructured, open-ended 30-60 minute interviews.

48
Sample Description
My unit of analysis was jurisdictions in in the Sacramento region. Ideally, I would have
liked to interview officials in all 34 planning jurisdictions (eight counties, 25 cities, and SACOG,
the region’s council of governments and metropolitan planning organization [MPO])1 to provide
robust findings. I had time and budget constraints for this thesis preventing me from achieving
this ideal; therefore, my sample size arrived at eight interviews, accounting for six jurisdictions in
the region.
While my sample size only accounts for about 18% of the population of jurisdictions, I
feel confident that my sample represents the population well in terms of percentage of the
population and size of jurisdictions. The responses I obtained provided enough thematic
saturation to analyze and conclude with policy options. My sample included respondents from
one county, three of the largest cities in the region by population (between 50,000 and 400,000
residents), one smaller city (fewer than 50,000 residents), and SACOG. Moreover, one
respondent spent significant time in two counties and spoke on behalf of experience gained in
each jurisdiction. All respondents qualified because of their relevant experience in planning or
community development departments, or as elected officials. Many of the planning officials had
direct experience in approving or rejecting development projects and developing general plan
housing elements for their respective jurisdictions.
Human subjects review
To conduct interviews with relevant local officials, the Sacramento State University
Department of Public Policy and Administration institutional review board reviewed my research
design. The purpose of the review was to safeguard the Department and interview respondents
1SACOG is both the MPO (for transportation planning & SB 375 purposes) and the COG (for housing
planning purposes). Additionally, the Sacramento Housing and Redevelopment Agency (SHRA)
administers the Sacramento City and County housing programs financing. The SHRA is a Joint Powers
Authority created by the two jurisdictions in 1982.
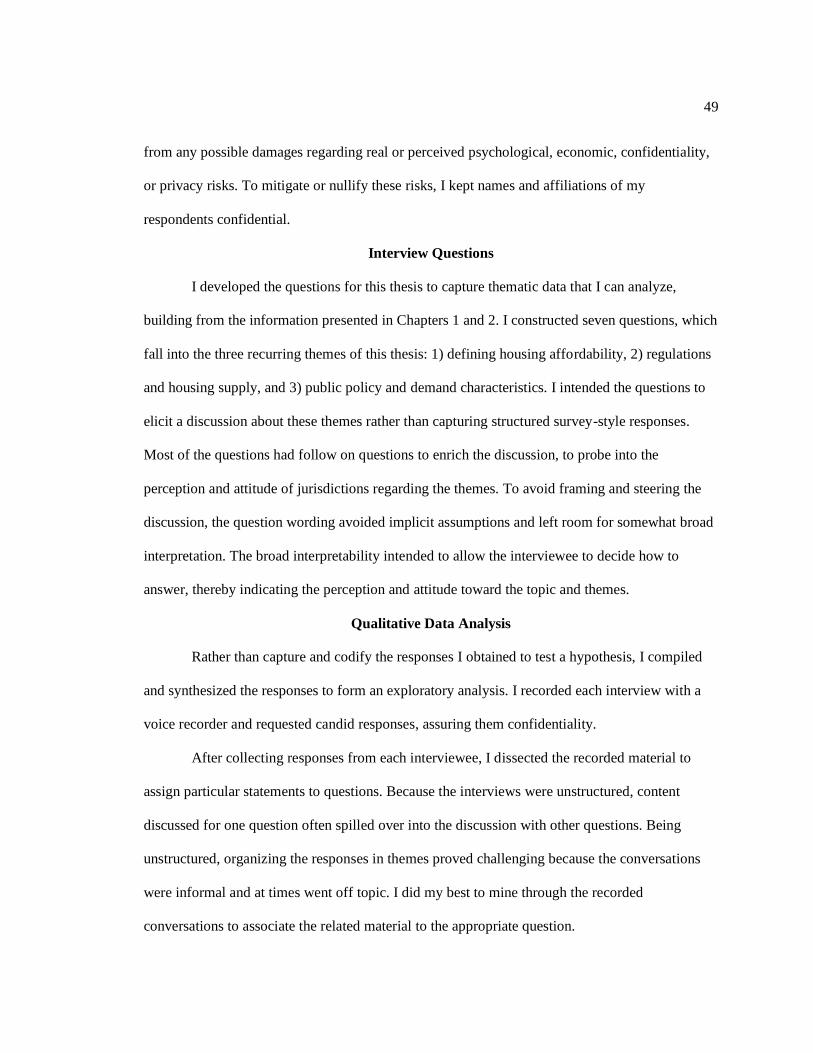
49
from any possible damages regarding real or perceived psychological, economic, confidentiality,
or privacy risks. To mitigate or nullify these risks, I kept names and affiliations of my
respondents confidential.
Interview Questions
I developed the questions for this thesis to capture thematic data that I can analyze,
building from the information presented in Chapters 1 and 2. I constructed seven questions, which
fall into the three recurring themes of this thesis: 1) defining housing affordability, 2) regulations
and housing supply, and 3) public policy and demand characteristics. I intended the questions to
elicit a discussion about these themes rather than capturing structured survey-style responses.
Most of the questions had follow on questions to enrich the discussion, to probe into the
perception and attitude of jurisdictions regarding the themes. To avoid framing and steering the
discussion, the question wording avoided implicit assumptions and left room for somewhat broad
interpretation. The broad interpretability intended to allow the interviewee to decide how to
answer, thereby indicating the perception and attitude toward the topic and themes.
Qualitative Data Analysis
Rather than capture and codify the responses I obtained to test a hypothesis, I compiled
and synthesized the responses to form an exploratory analysis. I recorded each interview with a
voice recorder and requested candid responses, assuring them confidentiality.
After collecting responses from each interviewee, I dissected the recorded material to
assign particular statements to questions. Because the interviews were unstructured, content
discussed for one question often spilled over into the discussion with other questions. Being
unstructured, organizing the responses in themes proved challenging because the conversations
were informal and at times went off topic. I did my best to mine through the recorded
conversations to associate the related material to the appropriate question.

50
After compiling and synthesizing the interview responses, I reflected on the introduction
and literature review to compare and contrast my findings with the academic research and the
advocate and popular media perspectives on housing affordability. I organized my analysis by
discussing my findings in Chapter 4 and explaining in Chapter 5 how my findings, along with
academic and popular knowledge, come together in the region. Additionally, in Chapter 5, I
offered recommendations for dealing with housing affordability in the Sacramento region,
including further research and public policy. I discussed my findings using the same thematic
structure that I presented my literature review: housing affordability definition, regulation and
housing supply, and demand characteristics affecting housing affordability. I presented my
conclusions by revisiting the housing affordability problem with respect to my findings in the
Sacramento region. I assessed at what I found to be the essential elements of the problem
including the stakeholders, the consequences of current regulations and financing policies, and
the viability of affordable housing. Following my assessment, I offered three recommendations to
help combat the housing affordability problem in the region and because housing, environmental
and revenue generating laws link all regions in California, my recommendations apply
universally in California.
Method Summary
My thesis explores the complex issue of housing affordability by reviewing popular
perspectives and academic research providing the most current knowledge. Most researchers
acknowledged the complexity and recommended more narrowly focused research, which is what
my thesis provides. Moreover, they suggested that housing affordability varies depending on
many economic and regulatory inputs. My hope is that my exploratory qualitative research leads
to focused hypothesis testing using financial data and consideration by local officials to
implement my recommendations.

51
Method strengths and weaknesses
The most glaring weaknesses in my method is the sample size and stratified areas of
focus among respondents. Eight interviews might provide enough data to make preliminary
conclusions, but I learned that local government organizational structure and demographics
within local jurisdictions confounded the comparability of my findings. The focus of the
responses depended on the area of responsibility. I spoke with a few planners and where one
focused on long range planning, another focused specifically on the jurisdiction’s housing
element. A few respondents’ primary focus was housing or special programs. Their responses
also varied by what their work entailed, but they talked considerably about programs
incentivizing or subsidizing housing developments and assistance for renters and owners. The
elected official and planning commission member spoke broadly about the jurisdiction, mainly
focused on constituency perspectives. All of these various perspectives provided me with a
comprehensive look at the positions of stakeholders, but the disparate responses make the sample
smaller. The areas of focus create stratified sub-populations among local officials. With more
time and resources, a stronger analysis would include multiple responses from each area of focus.
In other words, future research should collect responses from a few elected officials, long-range
and short-range planners, commissioners, and other pertinent roles focused on housing and
community development.
Rather than a weakness, the unstructured nature of response gathering with my method
presented interpretation challenges, notwithstanding a stronger learning situation. I developed my
questions somewhat ambiguous with the intent to allow the respondents to dictate how they
wanted to answer the questions, rather than confine them to my own implicitly biased narrow
questioning. I found that respondents often spoke globally, speaking on behalf of all jurisdictions
rather than the specifics in their jurisdictions. On the other hand, the value I found from these
52
broad responses was the safe assumption that local jurisdictions all face the same issues in
California. I have no doubt that if I were to increase my sample size, and allow for longer
discussions, I would have found regression toward the mean, the phenomenon common in
statistics.
One of the strengths of my method is that my findings can direct other researchers to new
quantitative methods with local jurisdiction data. The literature that I read contributed to broad
understandings of housing affordability, but my findings provided details about what local
jurisdictions are doing, what is working, and what is not. A researcher looking to make policy
recommendations based on quantitative data driven hypothesis testing can use my findings to
develop variables, as explained in Chapter 5.
Another strength is that my findings provide a voice to the difficult-to-explain complexity
of housing affordability at the local jurisdiction level. If local officials and other stakeholders read
this thesis, they might come away with a better understanding of the complexity and that all
stakeholders have a responsibility to do their part to deal with the problem. The perception of the
problem often gets lost in the position of that person or entity, which leads to irrational biases.
Therefore, the strength of this thesis removes bias barriers.

53
Chapter 4
FINDINGS AND ANALYSIS
In Chapters 1 and 2 I presented the perceptions of housing affordability from news
media, advocates, and from the academic community, while in Chapter 3 I explained how I used
the lessons from those sources to develop questions for another source, local officials
knowledgeable in housing development. In this chapter, I synthesized my findings from the eight
interviews (questions in Appendix C) to present the perception of housing and community
development public officials in the Sacramento region on housing affordability. I organized my
findings using the same themes found in the first two chapters. Each theme contains a subset of
the questions that I used in my interviews. I informed each respondent that the interview would
be a conversation and that I would extrapolate critical comments for comparing and contrasting
jurisdictions in the region. With these similarities and differences, I looked for additional themes
that link the themes of this thesis (housing affordability definition, regulations and housing
supply, and public policy and housing demand effect). In each of these three themes, I
summarized by explaining how the responses from Sacramento region officials relate to the
lessons from advocates and academics. I used the thematic findings and analysis of this chapter to
conclude in Chapter 5 with a discussion and recommendations on the housing affordability
problem in the Sacramento region.
I ensured respondents confidentiality by withholding the name of their jurisdictions.
However, I found that although all respondents had a stake in the housing affordability problem,
they had varying perspectives because of their focus. Therefore, I listed the areas of professional
focus and coded them below to associate responses with areas of focus:
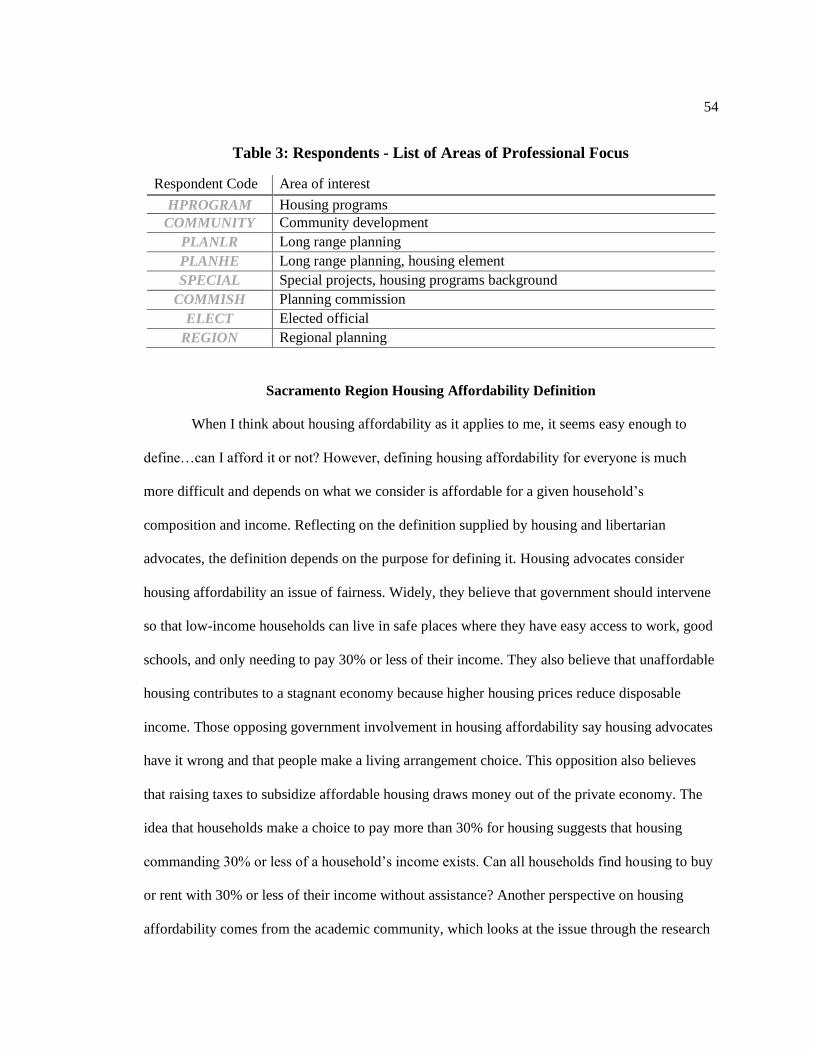
54
Table 3: Respondents - List of Areas of Professional Focus
Respondent Code Area of interest
HPROGRAM Housing programs
COMMUNITY Community development
PLANLR Long range planning
PLANHE Long range planning, housing element
SPECIAL Special projects, housing programs background
COMMISH Planning commission
ELECT Elected official
REGION Regional planning
Sacramento Region Housing Affordability Definition
When I think about housing affordability as it applies to me, it seems easy enough to
define…can I afford it or not? However, defining housing affordability for everyone is much
more difficult and depends on what we consider is affordable for a given household’s
composition and income. Reflecting on the definition supplied by housing and libertarian
advocates, the definition depends on the purpose for defining it. Housing advocates consider
housing affordability an issue of fairness. Widely, they believe that government should intervene
so that low-income households can live in safe places where they have easy access to work, good
schools, and only needing to pay 30% or less of their income. They also believe that unaffordable
housing contributes to a stagnant economy because higher housing prices reduce disposable
income. Those opposing government involvement in housing affordability say housing advocates
have it wrong and that people make a living arrangement choice. This opposition also believes
that raising taxes to subsidize affordable housing draws money out of the private economy. The
idea that households make a choice to pay more than 30% for housing suggests that housing
commanding 30% or less of a household’s income exists. Can all households find housing to buy
or rent with 30% or less of their income without assistance? Another perspective on housing
affordability comes from the academic community, which looks at the issue through the research

55
lens. To research housing affordability, academics require a quantifiable definition. Therefore,
some researchers refer to the broad area median household income over median housing price to
explain the level of affordability in that area, while others look more closely using complex
equations to determine the degree that regulations, the natural environment, and demand
characteristics stimulate housing price volatility.
With this first theme, I described respondents’ definition of housing affordability in the
region. I asked what housing affordability means to housing and community development public
officials and whether they think there is a problem. Additionally, if respondents gave a ‘yes’
response when asked if housing affordability was a problem, I asked them to tell me what they
thought were the biggest drivers of the problem. The remainder of this section contains
subsections that describe the response to question asked.
How do you define housing affordability in your jurisdiction?
I asked local officials to tell me how they defined housing affordability in their
jurisdiction and a few themes began to take shape. I assumed that respondents would struggle
with the question because of the abstractness of affordability. I wanted to see what jurisdictions
focused on when confronted with the concept of affordability. Local governments’
responsibilities are to ensure health, safety, and well-being of their constituencies. In the eight
responses, the definition themes encompassed standard metrics, market conditions, and the
concept of affordable housing. Most respondents mentioned both themes in their definitions with
some variance in their justifications.
Five of the eight respondents (HPROGRAM, PLANLR, PLANHE, SPECIAL, REGION)
defined housing affordability citing the standard metrics used by media, advocates, and
academics. Those five respondents defined housing affordability as 30% or less of income toward
housing costs and they expanded on their definition. All five said that they use the 30% threshold
56
to determine the percentage of households that can afford the local median house price or rent.
Three of those five (HPROGRAM, PLANLR, PLANHE) said they considered the 30% threshold
in conjunction with the definition of low-,very low- and extremely low-income households;
identifying households earning the applicable percentage below the regional household income
median. Two of the three (PLANLR, PLANHE) referred to the low income groups because these
groups have been the focus of affordable housing developments. PLANLR explained that
increasingly, only households above 120% of the area median household income have been able
to purchase houses, as opposed to renting. Rents have gone up because many higher income
households preferred to rent, a consequence of price volatility. Moreover, higher-income
households have purchased affordable housing, placing the moderate-income households in the
discussion of the housing affordability problem. PLANHE noted that while the private housing
market has dictated affordability, it has not produced housing that is affordable for very low- and
extremely low-income households. The response did not offer much clarity as to whether
developers cannot or will not build this type of housing. I assume the latter as developers’
decisions to not build likely rest on gap analyses that reveal sizable differences between desired
and forecasted profits. Why build in the Sacramento region when a project requiring similar
resources can yield desirable profits elsewhere? Moreover, PLANHE explained that the fee
structure associated with new housing development in the jurisdiction intended to mitigate the
lack of opportunities for very low- and extremely low-income households, but it also forces new
homeowners to pay their way into desirable communities as fees are absorbed into the selling
price. HPROGRAM referred to the low-income categories, but with respect to housing assistance
programs both for the degree of tax credits for rental developments and down payment assistance
for buyers. COMMUNITY, COMMISH and ELECT did not mention the standard metrics, which
is understandable. These respondents’ areas of focus were higher-visibility as executive,

57
commissioner, and elected positions. Their responses were more abstract than professional
planners, with broader societal explanations of affordability, remaining consistent with their area
of focus.
Six of eight respondents (COMMUNITY, PLANLR, PLANHE, COMMISH, ELECT,
REGION) included broad housing market characteristics in their definitions of housing
affordability. All six stated subtle or overt comments pointing to ability to pay as an important,
albeit intuitive element of housing affordability. PLANLR, PLANHE, and REGION qualified
their definitions of housing affordability by acknowledging that households’ ability to pay has
fluctuated with recessionary conditions. REGION recognized that most low-income households
pay upwards of 50% of their income on housing costs, while PLANLR and PLANHE noted that
the recession lowered house prices, improving the perception of affordability, but other economic
problems (unemployment, debt) kept low prices irrelevant. COMMUNITY defined affordability
as affecting all income levels, making a distinction between general housing affordability and that
of housing developed by federal and state funding programs. COMMISH challenged the notion
that housing affordability was the real problem, favoring the degree of income growth and social
mobility as the true definition of affordability. Additionally, COMMISH noted that people often
fuse the concept of affordability with the notion that housing should be cheap or that households
are entitled to housing – a right missing in the United States Constitution. COMMISH and
ELECT included housing supply in their definitions. ELECT referred to affordability as a
function of changing housing supply, while COMMISH noted the disparity between current
reality and the concept of housing affordability as defined by post World War II officials, dealing
with open prairies and a seemingly endless supply of land.
Affordable housing is a concept that caused some confusion in my interviews. Through
nearly all of them, I felt I used the phrases ‘affordable housing’ and ‘housing affordability’

58
interchangeably. As respondent COMMUNITY discussed the overall economic issue that
affordability presents to all income levels, I realized the distinction between the two concepts.
Affordable housing is the housing solution relating to only the low-income levels, whereas
housing affordability is relational and perceptible, somewhat philosophical. All eight respondents
spoke of affordable housing as that which requires subsidy of one form or another to produce.
The distinction between the two phrases is important because for this thesis, they complement
each other as housing affordability has a regressive effect. The lower the income, the more
housing affordability becomes a problem for the individual household. Affordability goes beyond
a macro economic issue where the household has less disposable income for other economic
sectors; it challenges the ability to provide shelter, for survival in extreme cases. On the other
extreme, a billionaire might call a million dollar house affordable, the billionaire would likely not
classify that house as affordable housing. Somewhere in the middle, an affordability problem
forces low-income households to more to more affordable areas, often far from where they would
choose, or into affordable housing if they can find it.
Is there a housing affordability problem in your jurisdiction? If so, what are the drivers of the
problem?
After asking the respondents what housing affordability meant in their jurisdictions, I
asked them to consider their definition and tell me whether they thought there was an
affordability problem and why (or why not). I expected all respondents to say a problem exists
and to associate housing supply and economic conditions as drivers of the problem. I also
expected them to stay mum about locally originated regulations while criticizing state and federal
regulations because of a rational self-serving bias and because the federal/state/local division of
government in the United States creates exclusivity among jurisdictions. Not surprisingly, all
eight respondents said they believe housing affordability is a problem. I discovered three major

59
themes in their explanation of the problem: Construction economics, income/jobs, and
regulations. I separated construction economics and regulations, but the two are closely related.
The prominent theme I found in the responses is construction economics. I define
construction economics as the typical homebuilding market characteristics including costs (labor,
materials and fees), housing quality, demographics, and location. The cost of land is another
construction economics element that local governments manipulate with zoning policies and
regulations. With these policies and regulations, local official determine the availability of land
for housing, thus affecting the price. All eight respondents explained the variety of effects
construction economics have on housing prices. Seven of the eight (all but ELECT) respondents
said that the cost of construction either inflates the selling price or discourages building. Those
costs include that incurred because of zoning and building code requirements. Six respondents
(HPROGRAM, COMMUNITY, PLANLR, PLANHE, SPECIAL, REGION) referred to
affordable housing and the profit margin gap. HPROGRAM and COMMUNITY explained that
affordable housing construction relies on subsidy, which has become highly competitive due to
limited availability. REGION added that developing affordable housing is so complex that
market-rate housing builders do not understand the nuances of government housing subsidy
programs well enough. The complexity has propelled the market of builders specializing in
affordable housing. Those builders mastered the process of applying for and securing public
funding. COMMUNITY confirmed, mentioning that many builders specializing in affordable
housing have crowded the public funding applicant pool; however, with limited funds, only so
many projects receive funds. COMMUNITY, PLANHE, and SPECIAL identified the reduction
in federal funds and the end of redevelopment agencies as key factors for increased competition
for the remaining subsidies.

60
Surprisingly, only half (PLANHE, SPECIAL, COMMISH, REGION) mentioned
development fees as a major driver. COMMISH explained that the development fees, typically
per unit, affect affordability by inflating the selling price (fees passed on to buyer) and by
discouraging the builder. Builders tend to build fewer units if they think they will have a hard
time selling all units at the inflated price (PLANHE, SPECIAL, and REGION echoed this
response). The fewer units translate to undersupply.
Four respondents (COMMUNITY, PLANLR, SPECIAL, REGION) mentioned the
infrastructure exactions as a major driver of affordability pressure. Developers must usually build
roads, sewers, and wastewater systems before obtaining permits to build housing. REGION added
that infrastructure requirements for infill developments in older areas could especially hinder their
viability because major overhauls could stretch well beyond the immediate area. PLANLR said
infill infrastructure could mean converting from industrial to residential use, which usually kills
development plans. Moreover, nexus studies, which determine the impact the development
causes, can add all or some of the costs for traffic mitigation, new schools, and hospitals because
of additional people inhabiting the area. SPECIAL explained that developers look to the
jurisdictions general fund to help with these costs, but the reality is that with a tight budget, local
officials would have to take money from public safety or other popular municipal services.
PLANLR similarly explained that in other states, local governments could simply raise property
taxes to pay for infrastructure upgrades for infill projects. Local governments in California cannot
so easily raise taxes because of Propositions 13 and 218. Proposition 218 restricts jurisdictions
from increasing water or sewer rates to pay for infrastructure because those revenues can only
benefit the existing ratepayers, not expansions or improvements to accommodate new housing.
COMMUNITY suggested that the more infrastructure needed to support housing where people
have to drive long distances to work, the more the cost of housing increases. The public money

61
needed for continuous upkeep and operation of ever expanding infrastructure is an opportunity
cost. If development were vertical instead of sprawling there might be less to maintain,
potentially freeing up funding to support additional housing.
Housing quality has an interesting effect on housing affordability in the Sacramento
region because it has always caused mobility, shifting investment in amenities, changing the
social setting of neighborhoods. Five of eight respondents (HPROGRAM, COMMUNITY,
PLANHE, SPECIAL, COMMISH) mentioned that new housing developments typically produce
houses that are much bigger, with better features than older houses, commanding higher prices.
Houses that are more expensive attract higher-income households that require fewer municipal
services. This type of planning is consistent with the Misczynski’s (1986) fiscalization of land use
– local governments do not want to have a developer build small homes that may house a family
of six because property taxes paid will not cover the cost of local services provided to those
residents. Build large homes with three residents and property taxes do cover those costs.
PLANHE and COMMISH talked about poor quality houses built after World War II that
contributed to families selling and moving to newer, better built houses. As those low-quality
houses deteriorated, higher-income households chose to move to new houses rather than invest in
the smaller, low-quality homes. Low-income households moved into those aging houses while
community investment followed the higher-income. The cycle has perpetuated affordability
challenges because developers recognize that households that can afford new houses will not
want to live there. COMMISH suggested that before World War II, people built houses with
livability in mind. Since then, developers have cranked out houses with the automobile in mind;
with the idea that people would drive to spend time outside of the house.
Five of eight respondents (HPROGRAM, COMMUNITY, SPECIAL, COMMISH,
REGION) mentioned that jobs and income have a major part in the housing affordability
62
problem. COMMUNITY, speaking in terms of community development, stated that while
housing advocates focus on affordable housing, they often overlook the need for diverse housing
types within neighborhoods to satisfy the needs of diverse socioeconomic communities. Further,
that jurisdiction focuses on the challenge of providing estate housing, quite the opposite of
affordable housing. Without expensive housing on large lots, the jurisdiction fails to attract large
business owners to move in. While affordable housing provides for the low-income workforce,
without attracting business entrepreneurs, the prospect of social mobility diminishes.
HPROGRAM acknowledged that businesses within the jurisdiction did not pay enough for
employees to buy or rent in the jurisdiction. On the other hand, COMMUNITY and SPECIAL
recognized that without sufficient jobs in their jurisdictions, households work and spend much of
their discretionary income in other jurisdictions taking tax revenue from the general fund.
Another reality encouraging the fiscalization in land use decision-making. REGION mentioned
that jobs, like infrastructure has killed housing developments because without the right jobs
balance, jurisdictions cannot justify building new housing.
Four of eight respondents (PLANLR, SPECIAL, COMMISH, ELECT) referred to
regulations as a driver of the affordability problem. PLANLR highlighted how building codes
drive up prices, requiring, for example, certain equipment installed to meet energy efficiency
standards. SPECIAL and ELECT spoke about state mandates, specifically CEQA, adding cost
through environmental reviews and the risk of uncertainty. COMMISH expressed that the
inclusionary housing ordinance, though well intended, had the consequence of choking the supply
of housing, causing calculating developers to reduce their total unit production to reduce the
number of affordable units they would be responsible for building. Many developers subjected to

63
inclusionary housing were market-rate housing developers and did not have the expertise to build
affordable units.2
Housing affordability definition summary
Similar to what I found in the literature, housing affordability is hard to define.
Conducting the interviews, I realized that respondents’ definitions resembled the perspective of
their area of focus. The combination of their responses offered a comprehensive look at the
problem. The aggregated local officials’ responses also resembled the Raphael and Quigley
(2004) definition, which included the housing type distribution, income, borrowing capacity,
public policies affecting housing markets, local market conditions, and housing consumption
choice. While construction economics, income and jobs, and regulations might appear like
independent themes, they complement one another in the broader theme of funding community
development failures. Jurisdictions understand that the ideal level of affordability is households
devoting no more than 30% of their income toward housing costs, but with constrained budgets
and competing needs, that ideal is lower priority than favored local expenditures such as public
safety. As people move freely between jurisdictions, they can live in one, work in another, and
shop in yet another, land use planning in one of those jurisdictions must be daunting.
Regulating Housing Development in the Sacramento Region
Like all regions in California, local governments in the Sacramento area regulate housing
as part of the larger regulation of land uses established by their general plans. However,
compared to other aspects of land use decision-making, the state statute highly controls the
contents of housing elements and the Department of Housing and Community Development
reviews each one because “housing is a matter of statewide importance and that cooperation
2 This interview occurred before the California Supreme Court ruled in CALIFORNIA BUILDING
INDUSTRY ASSOCIATION v. CITY OF SAN JOSE (AFFORDABLE HOUSING NETWORK OF SANTA
CLARA COUNTY) (2015) Ct.App. 6 H038563, which upheld the use of inclusionary housing ordinances.

64
between government and the private sector is critical to attainment of the state’s housing goals”
(Governor’s Office of Planning and Research, 2003, p.61). While the statute (Government Code
§65030.1) grants continued control to the local level over the future growth through planning and
regulation, the statute also requires identification and demonstrated effort to reduce regulations
that might hinder housing development (Government Code §65583(a)(5)). The statute also
requires public participation (Government Code §65033) in the planning processes including
local general plan amendments (zoning changes, subdivisions, and other land use ordinances) and
the Regional Housing Needs Assessment fair share housing needs allocations to jurisdictions.
Many respondents mentioned regulations in their description of drivers of the housing
affordability problem in the Sacramento region. Because the literature focused mainly on how
regulation affects housing supply, I focused my questions on regulatory impact on project
approvals and public participation in housing development outcomes.
Housing development project approval delays
I could have asked an endless stream of questions to get an understanding of the effect of
specific regulations on housing production, which could be the basis of later studies, but to
manage the complexity I focused on affordable housing project approvals. I asked respondents to
tell me if it was common to delay housing project approvals and why delays occur. I discovered
two themes with this line of questioning: entitlement issues and permitting issues. However, even
with approval and construction permits, developers often delay or cancel construction because of
business related issues.
As expected, all respondents denied that intentional delays exist in general. However, six
of eight respondents (HPROGRAM, COMMUNITY, PLANLR, PLANHE, SPECIAL,
COMMISH) mentioned approval and permitting process related issues that can delay production.
HPROGRAM, COMMUNITY, and SPECIAL explained that developers often try to gain access

65
to entitlements by requesting zoning changes for their developments. These requests often require
general plan amendments, which coincidentally require several layers of review, including public
hearings. HPROGRAM and COMMUNITY mentioned entitlement approval time varies by the
intensity of developments and whether they conform to other guidelines such as the aesthetic
design. They also noted developers often come to the planning department to the planning
department with rezoning requests that substantially deviate from the established general plan.
HPROGRAM suggested it was often clear that developers and architects never looked at the
general plan policies and goals. Because the entitlement request process is public, there are no
guarantees that developers will get approvals. SPECIAL added that the public process of
approvals usually require environmental impact report reviews in addition to comprehensiveness
and consistency with the general plan and review by planning commissions and/or local
legislative bodies. In SPECIAL’s jurisdiction, the planning commission and the legislative body
schedule review of general plan amendments among many other matters requiring their review.
Therefore, the project review could push out for many weeks or months. Further, if local officials
reject the application, the proponent must make changes before seeking another review.
COMMUNITY, PLANLR, PLANHE, and COMMISH explained that delays happen in
the permitting process as opposed to the approval process. Approvals are mostly simple in their
jurisdictions because those jurisdictions established zoning and entitlements long ago with little
green field space left, a reality where rezoning makes little or no sense. COMMISH explained
that the traditional delays that occur in zoning and subdividing do not occur because the
(COMMISH’s) jurisdiction approved subdivisions 100 years ago. That jurisdiction does not get
the 600-acre projects; they get the 10,000 square foot infill proposals where developers can build
within the current zoning. PLANHE added that affordable housing projects receive expedited
planning entitlements making the permitting nearly ministerial. COMMUNITY and PLANLR

66
discussed the challenges in permitting in light of infrastructure needs. COMMUNITY mentioned
the local voter approved prohibition of building in flood risk areas unless the jurisdiction secures
200-year flood protection. PLANLR contrasted infill and green field construction permitting.
Green field developments face concerns like flood protection and habitat conservation that slows
permit issuance and construction because the developer must go through the federal permitting
process for species protection. The lack of or insufficient infrastructure delays infill project
permitting. Insufficient infrastructure typically correlates with less desirable neighborhoods;
therefore, where public opposition is slight in those areas, the infrastructure problem can make
developing harder.
PLANHE and COMMISH acknowledged that financial issues, often more complicated
than entitlement approvals, cause delays. COMMISH claimed that the mixture of federal, state,
and local rules around financing are difficult to navigate and market-rate housing developers,
attempting to include affordable housing in their projects often cannot successfully figure it out.
PLANHE has found that timing is an issue. Even with all fees paid and infrastructure in place,
ready for construction, some developers still do not build because they believe that with massive
swings in prices and uncertainty that interest rates will stay low, buyers will have a hard time, or
may lose the desire to secure financing. The self-imposed delay is consistent with the Mayo and
Sheppard (2001) study suggesting that uncertainty carries a cost affecting housing production.
Required public participation
Many of the respondents referred to the entitlement process as a major source of delay, or
even rejection of projects, especially made difficult by public participation in the process. To
gauge the public involvement, I asked respondents about public opposition toward affordable
housing and the challenges faced by affordable housing developers. To create context, I also
67
asked respondents who the opponents and proponents are and their arguments on the matter. All
eight respondents acknowledged opposition presenting challenges for developers.
All respondents identified NIMBYs as the major source of opposition toward affordable
housing. However, they all also mentioned that the NIMBYs recognize the need for affordable
housing; their opposition is against building it near where they live. For brevity, I did not explain
all the NIMBY responses, but nearly all respondents had stories about the efforts and actions
taken by NIMBYs to prevent housing construction near them. HPROGRAM, COMMUNITY,
SPECIAL, and ELECT explained that NIMBYs might oppose affordable housing less often if
they relied less on their assumption of the type of people living in affordable housing. The
majority of NIMBYs consider perceive no distinction between affordable housing and Section 8
public housing. HPROGRAM noted the reality that some real estate agents send out flyers telling
people those affordable housing developments would be these massive skyscrapers bringing in
undesirable people, seeking to create and strengthen the NIMBY perceptions. The misconception
of affordable housing is widespread because the opposition has had better outreach than that of
advocates. HPROGRAM, COMMUNITY, and SPECIAL explained that when affordable housing
rental complexes have good managers, they are cleaner and safer than most market rent apartment
complexes. HPROGRAM further explained that affordable housing is usually difficult for renters
to find because applicants have to provide background and income information for tax credit
verification. As a result, people living in affordable housing work hard to secure their affordable
places to live. Thinking that they would jeopardize that for which they devoted that effort is
misconceived. However, the perception persists because desirability is a matter of lifestyle
compatibility and NIMBYs clearly believe, hard working or not, the low-income household
lifestyle is a threat to the sanctity of their own.
68
SPECIAL, from an affluent jurisdiction, noted that NIMBYs oppose housing in general,
not just affordable housing. These NIMBYs typically oppose more development based on
conservation of trees and wildlife. However, SPECIAL suggested that the opposition might look
very different if the development was for office space instead of housing. People get used to
seeing certain undeveloped spaces stay undeveloped. NIMBYs might raise objections over
concerns about privacy to encourage the planning commission or legislative body to reject the
project. The developer might tweak the plans to accommodate the privacy concerns; then the
NIMBYs revert to concerns about tree removal. PLANLR, PLANHE, COMMISH, and ELECT
acknowledged specifically that NIMBYs want to protect their housing investment. The presence
of additional housing near them reduces value because of additional supply, but affordable
housing near their home reduces the value because of the lingering perception.
The NIMBY opposition presents challenges for developers and planners because of
affordable housing imbalance. Five of eight respondents (COMMUNITY, PLANLR, PLANHE,
COMMISH, ELECT) explained that the influential neighborhoods always resist housing
developments (including affordable housing). PLANHE added that those affluent neighborhoods
say that affordable housing should stay in the lower price neighborhoods because it would have
much less impact on housing values there, while lower-price neighborhoods say that they already
have enough affordable housing near them. As PLANLR noted, the conundrum for developers is
that building affordable housing in affluent neighborhoods would be more profitable, with better
buyer prospects, but the opposition often pushes the developments to less desirable locations,
where the developer then has to decide if the projects are worth the trouble. This conundrum
challenges planners because many of the good paying jobs are located in those more desirable
areas. With the affordable housing pushed more toward the less desirable areas, often the

69
jurisdictions core, planners face mitigating where low-income households live and the location of
the good jobs.
The respondents also identified proponents for affordable housing in the Sacramento
region. They mentioned the Sacramento Housing Alliance, Legal Service of Northern California,
homeless and church advocates, affordable housing developers, and of course, NIMBYs advocate
heavily for affordable housing, highlighting the lack of affordable housing in other areas of the
jurisdiction. PLANLR explained that proponents are typically involved at all levels from the
regional needs assessments, to the general plan and housing element development, to housing
ordinances. Therefore, they are active from a big policy perspective (federal, state, and local), but
they are also active at the specific plan and project decision-making levels. On the other hand, the
opponents are less active at the big policy level. They get involved when developers propose
projects that affect them.
Does inclusionary housing requirements help meet affordable housing goals?
In the literature I read about inclusionary housing, the authors referred to it as a zoning
practice, connoting land use implications in particular areas in the jurisdiction. However, after
speaking with local officials, I found that inclusionary housing programs exist as jurisdiction-
wide ordinances. Two of the jurisdictions, represented by four respondents (COMMUNITY,
PLANLR, COMMISH, ELECT) had inclusionary housing ordinances. Three jurisdictions
(HPROGRAM, PLANHE, SPECIAL) did not have inclusionary housing, but had alternative
programs to promote the development of affordable housing. Having regional focus, REGION
intentionally did not have a position on inclusionary housing. I asked the jurisdictions with
inclusionary housing whether their programs helped to meet affordable housing goals and for
them to explain what kinds of projects they have seen under those rules. I asked jurisdictions

70
without inclusionary housing programs what they thought about inclusionary housing, and I
asked them to describe why they do not have the program.
Three of the four respondents (COMMUNITY, PLANLR, COMMISH) in the
inclusionary housing jurisdictions said inclusionary housing has worked to produce affordable
housing units, but they all also said it had challenges. COMMUNITY said that the jurisdiction’s
program resulted in over 100 single-family affordable units; however, the majority of affordable
units are rentals. COMMUNITY also mentioned that for-sale restricted housing is challenging
because buyers face problems if they lose their job where they often have to walk away because
the seller can have a hard time finding another qualified low-income buyer. Managing numerous
single-family units requires sufficient staff and with a tight budget, minimal staff cannot manage
the program well; therefore, the jurisdiction has focused on rentals. COMMUNITY also
mentioned that the jurisdiction has changed the inclusionary policy, making it more flexible,
allowing alternatives to building a percentage of affordable units in a market-rate development.
PLANLR and COMMISH said inclusionary housing has failed to meet their jurisdiction’s goal of
housing parity or a mixture of income levels and housing types. PLANLR said the ordinance
helped produce over 1,000 deed-restricted, long-term affordable units while COMMISH said the
ordinance helped build new affordable housing in only certain areas in the city where the
jurisdiction expected new growth. COMMISH also spoke to the deed-restricted houses wondering
what happens to those people who buy those houses. The deed-restricted houses force the buyers
to absorb all the downside of ownership (working with the bank for a loan, depreciation risk, and
maintenance of the house) and none of the upside (appreciation, must occupy removing the
ability to collect rental revenue). ELECT denounced inclusionary housing as prohibitive to
private sector developers, limiting what they can earn. Inclusionary housing results in more non-
profit developers, less motivated by profit, requesting public assistance, and ultimately a less

71
cost-effective approach to developing affordable housing. All four respondents mentioned that
inclusionary housing could not be a long-term solution. As the housing market changes, the
jurisdictions must adjust their ordinances similar to that of COMMUNITY.
Of the three respondents (HPROGRAM, PLANHE, SPECIAL) in non-inclusionary
housing jurisdictions, two (HPROGRAM, SPECIAL) never had inclusionary housing, one
(PLANHE) recently removed its inclusionary housing ordinance. All three explained that there
was no inclusionary ordinance because the building industry successfully lobbied the legislative
bodies against the ordinance. Notably, the HPROGRAM and SPECIAL jurisdictions are on the
fringe of the Sacramento region, where the PLANHE jurisdiction is central to the region.
PLANHE said builders were able to convince the legislative body that inclusionary housing was
to blame for the lack of housing production, but the ordinance took effect shortly before the
recession. The building industry claimed that the only places they could build had low-price
houses anyway and the new construction could not compete. HPROGRAM and SPECIAL said
the constituencies never pressured the legislative bodies to adopt inclusionary housing.
HPROGRAM explained that the development fee the jurisdiction charges allows for leveraging
other funding sources and to control when and where to build affordable housing. SPECIAL said
that without the grants and other resources that bigger cities qualify for, housing development
would stop. The jurisdiction’s attitude toward inclusionary housing was that it did not want to
have developers pass money lost on inclusionary housing on to their market-rate projects.
SPECIAL said the jurisdiction had no problem reaching the affordable housing numbers.
Moreover, part of the reason jurisdictions adopted inclusionary housing was because it is one of
the easiest ways to reach the affordable housing numbers, by making progress toward it on every
development. Additionally, inclusionary housing is a good way to get a housing element

72
approved by HCD. It makes everyone happy except the builders who disappear. Then the goals
inclusionary housing was supposed to help achieve become unreachable.
Regulating housing development summary
Regulating housing development limits the supply of housing in the Sacramento region,
but the story is the same as the rest of California where conflicts of interests and priorities
become present. While the state government expresses priorities through statute and guidelines,
the players at the local level can choose to conform or do what they choose. The choice to
conform usually depends on the jurisdiction’s appetite for grant funding programs where the state
government can withhold eligibility for grants among the non-conforming jurisdictions. The
California Constitution grants local governments’ police power, which they use to further their
own particular priorities. Jurisdictions express those priorities through planning efforts influenced
by the most influential. In some jurisdictions, the influence might come from NIMBYs, in others
it may come from developers.
The literature often implicates governments and regulations as the source of prohibitive
fees, exactions, delays, and rejection of projects that would increase housing supply. However,
through discussions with these local officials, those delays and rejections are often the result of
developers proposing projects far beyond the policies and goals established in the general plans.
Although, jurisdictions do implement general plan policies using exactions and time consuming
reviews that add costs. Aggressive public participation by affluent communities in jurisdictions
can often defeat, or delay to death, the effort by developers to get affordable housing projects to
the point of breaking ground.
Inclusionary housing, an ordinance some jurisdictions use to promote affordable housing
has produced more affordable housing (small in scale), but at what cost? Could the affordable
units have come at the cost of lower overall housing production? If so, the trade-off is
73
affordability for low-income household categories, but affordability hardship for moderate-
income households. If inclusionary housing ordinances (the requirement to make 10-15% of units
affordable to low-income populations, as opposed to exacted inclusionary housing fees) were
subjected to nexus tests, jurisdictions may have predicted the trade-off. However, because an
ordinance is legal through traditional mandamus, jurisdictions need no official evidence or
findings to pass inclusionary housing ordinance. The ordinance is defensible in court simply
because of the legislative process. The legality of an ordinance is notably different from exactions
imposed to obtain construction permits. A jurisdiction must be able to justify an exaction in court
based on evidence of impact from a nexus study. The alternative fee that some developers opt to
pay, instead of dedicating land or affordable units, is an exaction and the size of the fee is subject
to administrative mandamus, which does require impact evidence on file to be defensible in court.
Public Policy and Housing Demand
A major component of housing affordability is desirability, which jurisdictions affect by
investments in amenities and public policy choices. Therefore, I asked respondents why they
thought some neighborhoods were less affordable than others. Additionally, I wanted to know
how investment choices affect the type of housing and amenities built. The California Housing
Partnership Corporation (2014) claimed that along with redevelopment agencies’ tax-increment
funds disappearing and California Housing Trust Fund (Proposition 46 and 1A) drying up,
Community Development Block Grant, and HOME Partnership Program money drastically
decreased as well by 2014. Therefore, I wanted to know how if jurisdictions received those funds,
and how they used them.
Affordability in neighborhoods
The seven respondents from local jurisdictions (excluding REGION) generally
mentioned the same reasons for differences in affordability across neighborhoods. With slight

74
variations, all respondents said that the most desirable neighborhoods were those with access to
the most amenities, driving up the prices in those areas. They described the amenities as good
(and newer) schools, perception of lower crime rates, more and nicely cared-for trees (all
positively correlated with a lower percentage of low-income households in neighborhood). They
all also described the difference in construction between most of the older and newer
neighborhoods, noting that older houses tended to be smaller. For example, the three-bedroom,
one bathroom, 1,000 square foot house on a small lot was common long ago, but most new
houses are at least double the size with many more features. HPROGRAM mentioned that density
tends to correlate positively with affordability in most cases. Although, the correlation likely
differs between the urban core and the fringe communities. COMMUNITY noted a trend, seeing
people moving to the jurisdiction from the foothills, wanting to reduce their environmental
footprint. The trend likely the result of kids moving out of the house, the desire to be closer to
work, and with the kids gone, no need to live in secluded, safe neighborhoods with good schools.
However, it is unlikely these people moved into the least desirable neighborhoods, limiting any
displacement effect, consistent with the Vigdor (2002) findings of gentrification causing little or
no harm to low-income households. If anything, the opposite might be true as PLANHE
explained that as wealthy households left the older, lower-quality houses for the newer houses,
the low-income households with little or no mobility choices moved in, but the public
investments followed the households with all the money.
Funding affordable housing
My respondents consistently brought up the problem of funding. They all spoke to the
hardship created by the ending of redevelopment agencies. Jurisdictions had relied on dedicated
tax increment money as a continuing stream of revenue to modernize identified redevelopment
areas and to keep housing affordable. Some jurisdictions had a significant proportion of their land

75
designated as redevelopment areas. The end of redevelopment hit those areas hardest. For
example, COMMUNITY stated that 50% of the jurisdiction was in a redevelopment area. Other
long-standing sources of continuing funds include is the Community Development Block Grant
(CDBG) and the HOME Investment Partnerships fund. The California Housing Trust bond funds
(Proposition 46 and 1C), since 2006, provided funding for affordable housing developments,
homeownership assistance, and urban infill infrastructure. Through a combination of local fees,
state grant programs, and federal pass-through funds, all jurisdictions also have local affordable
housing funds they use specifically for affordable housing production. I asked respondents what
kinds of projects these funding sources supported and what kind of barriers developers faced
securing these funds.
While I was able to get detailed responses from some respondents, for some, I overlooked
the fact that the Sacramento Housing and Redevelopment Agency (SHRA) administers housing
programs and funding. Therefore, I had to look at the SHRA website for details about the City
and County of Sacramento. The Agency’s role has diminished considerably as a former
redevelopment agency; however, as a Joint Powers Authority it retained a role in housing
programs administration for the two jurisdictions. According to SHRA, the California Trust Fund
provided infrastructure funds for the Township 9, Curtis Park, and Railyards developments. The
seven respondents representing the five local jurisdictions all stated that they had projects funded
by the state trust fund bond money. The bond money, distributed by HCD, mainly funded
infrastructure needs. The limited nature of the fund created the competitive environment and
considering the aforementioned projects, HCD favored ‘sustainable communities’ proposals
including greenhouse gas reducing components. PLANLR noted that the irony of the bond funds
(particularly the Proposition 1C bond) was that it promised infrastructure, but overlooked that the
affordable housing itself required subsidy also.

76
Respondents also spoke briefly about the CDBG and HOME federal funds. Four
respondents (COMMUNITY, PLANLR, SPECIAL, ELECT) described these funding sources as
supplementary and dedicated to continuing commitments. Those commitments include
infrastructure and capital improvements, homeownership assistance, and other miscellaneous
programs assisting the poor. All four added that the funding has diminished in the last decade;
therefore, so have the programs they supported.
Two respondents (COMMUNITY, REGION) talked about the AB 109 Cap and Trade
Investment Fund as a resource for affordable housing. SB 862 (2014) established the desired use
of state revenue from AB 109 for affordable housing. However, the bill lists affordable housing
among several other desired uses including high-speed rail, low-carbon transportation, energy
efficiency and renewable energy, and natural resources and waste diversion. Perhaps other
respondents did not speak to SB 862 because the legislature has not clearly defined how it will
allocate the money. COMMUNITY said the jurisdiction applied for the Cap and Trade funds
intending to further transit development, suggesting that highly developed transit will make
housing costs less burdensome on households by reducing their transportation cost. REGION
mentioned that the Cap and Trade funds were supposed to fill the funding gaps for affordable
housing developments, but early indications suggest that is not happening. Like all other state
funding sources, the Cap and Trade funds are highly competitive and with 87 pages of guidelines
for qualifying and applying, many projects fail because it simply takes too much time and energy
just to figure out if they qualify. Further, REGION mentioned that the state has approved only
about 50 projects, of which only about five in the Sacramento region. Somehow, the legislature
directs the funds at the state priorities, which with the ambiguous SB 862, fluctuates somewhere
between affordable housing, greenhouse gas reducing transit, and energy.

77
Six of eight respondents (HPROGRAM, COMMUNITY, PLANLR, SPECIAL, ELECT,
REGION) offered an explanation about barriers to receiving public funds. All but ELECT
mentioned the main barrier was competition. ELECT added that using state and federal funds is a
problem because if using that money means losing control on how to use it.
Public policy and demand summary
As neighborhoods sort, those with and without abundant amenities, it is clear that the
sorting reflects the ability to pay in the Sacramento region. Those with the means to afford to live
in desirable neighborhoods, do so by choice. As ELECT mentioned, we live in a free-market,
capitalistic society also by choice, where businesses rationally look to serve those that can make
their business thrive. Therefore, the amenities will always follow the money.
Findings and Analysis Summary
Housing affordability is hard to define because it involves a complex mixture of personal
choices and economic implications, but clearly, the public policy focus in the Sacramento region
is on affordable housing for low-income households. Although, a million people might produce a
million slightly different definitions because they answer based on their own perception and
situation. The same was the case speaking to local officials. They all provided responses
rationally biased toward their jobs, as expected. Housing program officials spoke to programs and
funding, planners mainly to developments and housing needs among other planning issues, the
community development official spoke to broader economic implications, and the elected official
and commissioner spoke broadly to constituency issues. All responses together provided a
comprehensive picture of the major tenet of the affordability problem, namely the housing
shortage due to lack of funding and restrictive regulations. People complicate the problem by
their nature, wanting to have their ideal place to live, but even more so because they want to keep
others out. Respondents spoke about jobs and income as a major driver of the problem, which is

78
intuitive, but the desire to have their ideal place, recognized by developers as a market
characteristic, has sprawled out housing in the region to the point where employers have to deal
with stressed out employees dealing with traffic congestion. People’s desire for ideal living over
the decades has resulted in regulations and public policy making it harder to build to respond to
the seemingly endless demand for housing.
Looking at regulations affecting housing development, the distinction between state
priorities and that of local jurisdictions becomes evident. The state sees the overall economic
ramifications of declining housing affordability, resulting in difficulty in attracting larger
employers and degradation of the environment because people drive further distances to live in
more affordable houses increasingly found further from employment centers. However,
jurisdictions driven by the desire of active citizens concerned about their individual investments
and security, seek to reject housing development or to push it away from where they live. The
legislature continues to acknowledge that local jurisdictions are in a better position to make land
use decisions (Government Code §65580(d)) using the police powers vested to them by the
California Constitution Article XI, Section 7. The conflict in priorities is also evident when
looking at Government Code §65580(a) stating, “The availability of housing is of vital statewide
importance, and the early attainment of decent housing and a suitable living environment for
every Californian, including farmworkers, is a priority of the highest order.” However, local
jurisdictions clear priority is public safety, where they devote the majority of their budgets.
Moreover, as SACOG works with jurisdictions to negotiate their fair share of responsibility to
build affordable housing, as HPROGRAM noted, they have no obligation build any affordable
housing even after accepting the allocation.
From one perspective, the same people identified as NIMBYs have the power to sway the
location of housing development, as well as the power to replace elected officials in their

79
jurisdictions and in the state legislature. Therefore, efforts to require jurisdictions to think
regionally or to align their priorities with that of the state have failed to materialize so far. Local
jurisdictions demonstrate their power to control their land uses, without regard to surrounding
jurisdictions or to state priorities with housing advocates active at all levels of planning only to
see projects challenged by public participation at the point of approvals and permit issuance.
From another perspective, if there were more economic certainty, the power and influence of
private developers may replace NIBMY power.
In this chapter, I covered a mountain of issues and characteristics contributing to the
housing affordability problem in the Sacramento region. After reviewing literature, popular
media, advocacy publications and interviewing local officials on housing affordability, I have
come to a few preliminary conclusions, which I present in the following chapter. The problem is a
result of a failure to match state and local priorities, because as we are now realizing the external
costs of expansive, low-density housing development, regulations and public policy assign most
of the cost of the externalities to new entrants into the housing market, as if households living
here for decades have no part in it. Further, the burden placed on new entrants include absorption
of problem mitigation fees, excessive property taxes on home prices artificially inflated by
regulations that hinder housing supply growth. Academic literature and advocate publications
seem to place the blame on government actions, which is partially justified. However, what seems
to go unrecognized is that governments are public policy makers and implementers that act on the
will of the public. When government fails, the corresponding constituency has failed.
Governments want to make the best society out of wants and needs expressed through direct
democracy or representation, but the conflicting priorities suggest a tragedy of the commons, the
tenets of which, made painfully clear by Hardin (1968). He suggested that demands of an ever-
expansive population is not sustainable as the cries for rights and freedoms erode all the essentials

80
we all need to survive. The land use priorities of local jurisdictions, clinging to their rights to land
use decisions, clearly take priority over many statewide priorities.

81
Chapter 5
CONCLUSION
Throughout my thesis, I concentrated on the problem of housing affordability as a
nebulous concept affecting all income levels. My study confirmed that affordability for low-
income households is a current public policy interest for local officials. Most academic literature
on housing affordability looks at land use regulations and housing supply as the major factor for
the affordability problem. The Sacramento region officials I interviewed partially agreed with the
literature, but steered away from local land use practices and zeroed in on the lack of funding as
the factor. It is not surprising that those officials focused on external forces, as the land use
practices within their jurisdictions reflect their constituents’ values. Those residents with aptitude
in land use legalities and voting politics leverage their power to ensure that local officials’
perceptions align with their desire for regulations to protect their communities. Less invested low-
income households that would benefit from less restrictive zoning requirements are probably lack
that political power and are less inclined to squeak. While academics quantified the degree of
land use regulation with tools such as the Wharton Residential Land Use Regulation Index, they
may overlook the amazing power of residents in localities in California. The planning design
landscape in the Sacramento region is similar to all other regions in California, and perhaps
different from localities in other states, because of Proposition 13. As William Fulton (2003)
declared, “the Proposition 13 psychology changed our view of growth from good to bad.” The
growth that Fulton described; which I have come to understand, is the increase in housing. It
increased the use of local land use regulations and decreased local revenues (Fulton, 2003),
covering the factors raised by both academics and local officials.
Do we do away with the laws enacted by Proposition 13? Obviously, it is not that easy
and allowing for more discretionary general fund revenue for local governments may not even be
82
a solution. As noted by Wassmer (2005), spatial segregation of like interests is a natural
occurrence, and Proposition 13 was a manifestation of voter’s desire to limit the ability of
government to spend tax money disproportionately. Wassmer (2005) also highlighted Charles
Tiebout’s theory from 1956 that claimed that people locate themselves according to their desired
level of public good (amenity) consumption. Obviously, the choice of location depends on
income; therefore, Tiebout’s theory places control of amenity consumption on those with the
means to decide. Low-income households deal with the leftovers after high-income households
decide. However, the power to decide is one of the attractive features of a free-market society, the
incentive to reach the high-income status. The decision-making power is also that which decides
where developers build affordable housing and what regulations exist in the jurisdiction.
Revisiting the Housing Affordability Problem
Housing affordability is a complex problem exacerbated by housing shortages partially
caused by restrictive housing and land use policies. Those policies serve desired environmental
purposes but restrict the supply of affordable housing. The reason for the shortage in the
Sacramento region is the same as other regions in the state. Academics identified regulatory
environments (Malpezzi, 1996; Gyourko, et al., 2008; Saiz, 2010; Paciorek, 2013), geographical
constraints (Saiz, 2010; Paciorek, 2013), and demand characteristics (Smith, et al., 1988; Can,
1990; Paciorek, 2013; Guerrieri, et al., 2013) as the major causes for housing shortages.
Although, recall that Smith, et al., (1988) called housing a durable good and that the existing
stock weighs heavily on decisions to add inventory because of opportunity cost implications and
that supply does not adjust easily in response to demand shocks. Therefore, a wild building spree
of affordable housing attempting to match demand is likely not a solution for these reasons and
the political/institutional ones that it are likely to curtail it. Quigley and Raphael (2004) found that
housing affordability is not a problem for homeowners, but is for renters, disproportionately
83
affecting low-income households confined to the rental market. Local officials in the Sacramento
region confirmed this assertion. Low-income households usually cannot secure financing to
purchase housing, and with many previous homeowners switching to renting after the recent
recession, they shorten supply of rental housing and price out low-income households. This
displacement pushes low-income households into neighborhoods known for congestion, high
crime, low performing public schools, and deteriorated housing creating health, safety, and well-
being concerns. Low-income households hold the same rights as anyone else, but in our market-
driven economy, they lose out on the bidding that decides how to allocate scarce resources. Some
politicians campaign on the idea that all households deserve decent housing, however, the reality
is that neither the federal nor state constitution declares the right to receive scarce resources.
Government has historically found reason to intervene in the housing market to force the
availability of affordable housing; albeit with declining revenue resources and among other
pressing choices.
Why do these rough neighborhoods exist? Perhaps Fischel’s (1990) wisdom of zoning
only being effective among political equals also holds true in rough neighborhoods, where the
dominant bad guys set the unofficial zoning (and behavior) rules on the street. Another question,
does simply being low-income sentence a household to living in those conditions? Jurisdictions
have tried to deal with the question with inclusionary housing. Believing that they are fighting the
good fight, they have required new market rate housing developments to include affordable
housing at great cost to the developer. Other jurisdictions assess affordable housing fees on new
market rate housing developments to bolster the fund used to subsidize affordable housing. The
message that jurisdictions send is clear, developers are responsible for the externalities of
additional housing (and those that purchase their products, because developers simply pass on
much of the additional expenses to buyers). However, just as officials’ definition of housing

84
affordability changed with their area of focus, the externalities change depending on some fusion
of income or housing tenure status, or more simply, depending on your interest. NIMBYs must
perceive them as additional traffic, and more crime. Another externality they must perceive are
public school classrooms where school administrators divert limited resources to the additional
education interventions usually necessary for children raised in low-income households.
Additionally, their perceived externalities include tax money diverted to other services that would
not need additional funding if not for more people (especially the poor, who often utilize a
disproportionate amount of local public services), and removal of open space. Low-income
households are burdened with the external cost of entrenched homeowners influence on
jurisdictional land use policies that make building affordable housing harder than it’s worth for
many developers. Therefore, the costs include repeated transaction costs as prices change,
increased transportation needs, as remote affordable housing often requires additional pecuniary
and temporal costs.
The complex factors leading to the housing affordability problems are a combination of
economics influencing politics/institutions. Throughout this thesis, I have explained how policy
actions (state and local) influenced housing supply and demand creating winners and losers.
Before laying out my policy ideas, I summarize how affordable housing stakeholders would
create better understanding of the impacts of my ideas.
Summary of Affordable Housing Stakeholders
While everyone in the Sacramento region is in some way a stakeholder in the area of
housing affordability, I developed a short list of key stakeholder categories with the most
significant interest in affordable housing, the solution for low-income household affordability. I
focused on affordable housing, but the greyness between the concepts of housing affordability
and affordable housing rise again when looking at stakeholder interests because the former is a

85
broad picture encompassing the latter. The following summaries will help to consider the political
implications of my policy options below or for any policymaking in housing affordability.
Local officials
Officials in the Sacramento region have a variety of interests ranging from ensuring the
health, safety, and general well-being of their residents to fiscal management. Every jurisdiction
must provide desired levels of services with the resources available. Wassmer (2005) noted that
each jurisdiction, acting exclusive of another, does so with varying levels of desire for services.
Some jurisdictions (usually suburban) incorporated with the intent to reduce the provision of
services, using zoning to produce only large, expensive houses to limit the low-income element
that typically requires public services. Other jurisdictions, usually counties with unincorporated
territory or central urban cities, have large populations of low-income households, implicitly
excluded from services-reducing jurisdictions. The level of services, and thus the composition of
the jurisdiction budget, is therefore a product of the dominant political forces within the
jurisdiction.
In the Sacramento region, like most others in California, local officials respond to
pressure that dictates their tenure in office. In the City and County of Sacramento, that pressure
may come from homeowners, but because of the large population of low-income households,
housing advocates grab enormous attention as they represent a significant proportion of voters
that directly or indirectly influence employment outcomes of local officials. Regardless of their
personal opinions about effective public administration, local officials must act on the will of the
majority in their jurisdiction (while also considering statewide guidelines such as the California
General Plan Guidelines and the CEQA Guidelines from the Office of Planning and Research if
hoping to qualify for state grant programs). Fringe jurisdictions such as Rocklin and Elk Grove
receive little pressure from housing advocates because they have much higher proportion of
86
moderate- and high-income households. On the other hand, in Sacramento, little developable land
remains, whereas Rocklin and Elk Grove have enjoyed green space, perhaps resulting in less need
for conflict with respect to locating affordable housing.
Local officials also must work with state and federal officials seeking to advance their
own goals. However, besides exclusion from funding opportunities and the occasional threat of
lawsuit3, local officials have little reason to care about state or federal programs. Although,
California jurisdictions usually take great interest in state and federal funding opportunities
because they are so intensely restricted by Proposition 13 and successive revenue limiting
legislation. This reliance on state and federal programs are much like asset bubbles because when
the funds are plentiful, life is good, when state and federal officials cut those programs, local
officials must scramble to maintain service levels and other obligations, including affordable
housing subsidy.
Overall, local elected officials want to ensure health, safety, and general welfare of their
constituency. They also want to secure their budgets, which creates political trade-off situations
where some residents win, while others lose. Officials in the regions fringe cities of Elk Grove,
Rocklin, and Davis receive less pressure from affordable housing advocates to include affordable
units in market-rate projects or to build affordable housing at all. Those fringe cities spend less in
subsidies, but they also qualify for fewer federal and state grants with lower proportions of low-
income households. Older region core jurisdictions of Sacramento the county unincorporated
territory saw most of their housing built pre-Proposition 13, when official had no need for
creative fiscal-motivating land uses. Developers built former generations versions of affordable
3 The Sacramento Housing Alliance sued the City of Folsom in 2011 when the city attempted to eliminate
its inclusionary housing program. The city claimed the ordinance restricted development resulting in failure
to build housing at all prices. The lawsuit led to a settlement where the city retained its inclusionary
housing program, but reduced the requirement from 15% to 10% units affordable to low-income in new
developments (Locke, 2014).

87
houses in these core jurisdictions (small structures on small lots), inheriting disadvantaged
communities with deteriorated houses and apartments, high-crime neighborhoods, and low
performing schools when higher-income households found nicer housing alternatives further
away. Unfortunately, the core jurisdictions receive great pressure from advocates to produce this
generation’s version of affordable housing.
Sacramento Area Council of Governments (SACOG)
SACOG is in the unenviable position of dealing with regional transportation issues in the
Sacramento region while maintaining dual primary responsibilities: the federal Metropolitan
Planning Organization and the state Regional Transportation Planning Agency. SACOG is also
the negotiation mediator of affordable housing fair-share numbers allocated to the region by HCD
based on California Department of Finance demographic projections. SACOG works with local
jurisdictions until the six counties and 22 member cities agree to their fair share to build;
however, like an army company sent to war without rifles, after SACOG negotiates to an
agreement, jurisdictions do not need to comply. Local jurisdictions must simply write their fair
share numbers into their subsequent general plan housing element revision. If jurisdictions build
market-rate housing instead of affordable housing, nothing happens most of the time. Legal
advocates such as Legal Services of Northern California might sue a city for not building
affordable units, but that probably only occurs in the urban core (or, on occasion, older fringe
communities, as in the Folsom case) where advocates apply pressure.
Other functions that SACOG perform are research for the benefit of local planners and
manage state and local allotments for state and federal transportation planning grant programs.
None of the functions gives SACOG any police or corporate power over local agencies to protect
them from themselves, similar to what local jurisdictions do for their residents. Comprised of 32
members, the SACOG Board of Directors are all supervisors, mayors, and councilmembers of six
88
counties and 22 cities, one would think that agreeing to affordable housing numbers would also
be a promise to build. The Council self-imposed the rule of supermajority voting to implement
federal or state programs requirements among its member cities and counties, including housing
planning requirements. However, the reality is that when those directors go back to their
jurisdiction, they remember those competing priorities of their constituents probably come before
any priorities among their appointed peers at SACOG.
California and federal officials
Health, safety, and general welfare are much more nebulous at the state and federal
levels. While local jurisdictions, through land use regulations, can socially engineer the
demographic composition of their population, states and the nation cannot because of mobility
enjoyed by residents of the United States. People can move freely between localities and states
for commerce, but income largely dictates residency. That mobility creates economic concerns
for state officials: (1) how to attract and retain large employers, and (2) how to maintain the
relevant workforce available to achieve (1). Concern (2) involves local jurisdictions because
people want to live in places that combine desirable level of services, amenities, and crucially, the
income to pay for it all. State officials are likely less concerned about mobility than local officials
because of spatial equilibrium (Glaeser and Gottlieb, 2009; Matlack and Vigor, 2008). Knowing
that people tend to migrate into California (versus out), spatial equilibrium meant that
jurisdictions within the state would balance the high- and low-income residential and commercial
activity through spatial segregation (Wassmer, 2005); alleviating concerns (1) and (2). The
problem is that the spatial segregation, resulting in new jurisdictions, disinvestment in low-
income areas, and disparate levels of service provision has contributed to another statewide
concern, climate deterioration through high greenhouse gas levels, resulting largely from growth
and mobility. Local officials are more concerned about growth and mobility for a few reasons.

89
First, it is much easier to move to a neighboring city. Second, it is easy to shop in the next city.
Finally, it is easy to work in one city, live in another, and shop in a third. These reasons suggest
that spatial equilibrium in California perpetuates the growth and mobility, which makes local
jurisdictions’ budgets hard to estimate. In effect, in addition to supplementing local jurisdictions’
budgets, reliance on state and federal funding sources might stabilize them. With spatial
equilibrium a moving target because of growth and mobility, equity questions remain unanswered
about the balance between and within California’s regions. For example, we might see a
jobs/housing balance at the statewide or regional scale (meaning for every poor job or housing
local or regional market in California, there is an offsetting strong job or housing market).
Nevertheless, imbalances can exist at the local level when Davis and Rancho Cordova has more
jobs than housing and Elk Grove and Rocklin has more housing than jobs.
State officials included affordable housing into the climate conversation, perhaps
recognizing that development patterns throughout the state favored low-density, large housing,
requiring car travel. When land was abundant and no one was particularly concerned about
growth management, land use efficiency was not in the lexicon of state or federal officials. The
legislature passed SB 732 in 2008 forming the California Strategic Growth Council, which they
charged with mitigating the climate impact of growth and mobility. In 2014, the legislature
passed SB 862 forming the Affordable Housing and Sustainable Communities program, which
gave the Strategic Growth Council the power to grant (AB 32) Cap and Trade auction proceeds to
projects advancing the council’s mission. That mission being the reduction of greenhouse gasses
to1990 levels by 2020, as required by AB 32, by overseeing funding programs leading local
planners to adopt sustainable communities’ strategies prescribed in SB 375. The fiscal year 2014-
15 Cap and Trade grant awards totaled $122 million, but out of the 28 projects receiving funds,
only one project (Delta Lane Affordable Housing and Grand Gateway – City of West
90
Sacramento) in the Sacramento region is slated to receive funds (Strategic Growth Council,
2015).
Federal officials are concerned about the federal budget and the national economy, which
means they are concerned with the impact that housing affordability affects the largest federal
revenue generating state in the nation. As the national economy improves, HUD gradually
increases CDBG and HOME grants and housing payment assistance programs, which helps lay
the groundwork for more housing. Possibly the biggest expense, however, remains the home
mortgage interest reduction tax deduction. If HUD and other federal officials put any credence to
reports like Reexamining the Social Benefits of Homeownership after the Housing Crisis, from
the Joint Center for Housing Studies, they might realize that continuing subsidization of
homeownership might only support continued speculation, with houses as the tradable assets
(Rohe and Lindblad, 2013). Evidence in California has shown that institutional investors have
acquired many foreclosed homes, turning them into rentals. Nevertheless, as speculation always
goes, the investor activity only lasts while it lasts. Federal officials likely support subsidizing
homeownership to support the industries thriving because of homeownership, but would those
industries still thrive if developers were building high-density affordable housing for rent instead?
Would redirection of mortgage interest tax expenditures to an Affordable Housing and
Sustainable Communities type strategy improve the national economy? Possibly, if officials find
that the majority of consumer spending comes from those low-income households that cannot
afford housing.
Housing developers and advocates
For this thesis, I categorized housing developers into two groups, market-rate and
affordable housing developers. The market-rate developers seek to profit by mastering market
essentials (pricing, placement, promotion, and product characteristics) and demographic realities

91
(willingness and ability to pay). The affordable housing developers are those that exist to serve
the housing market created and controlled through government intervention. Instead of relying on
free-market fundamentals, these developers master the processes of securing public funds
available to produce housing that the free-market cannot provide. Chamber of commerce
organizations and other commercial and construction lobbying organizations typically represent
market-rate developers in local and state policy development. While housing advocates typically
represent affordable housing developers.
Market-rate developers have been the biggest opponents against inclusionary housing
because it forces them to pass the cost of it onto to customers (reducing demand for their product)
or absorb the cost through lower profits. The only exception to this being if an outside entity
(state or federal) subsidizes the requirement for affordable housing. COMMISH explained that
some market-rate developers have tried to build affordable units within the inclusionary housing
framework, but most cannot figure it out because for-profit and non-profit ventures require
different approaches. In Sacramento County, before the Board of Supervisors decided to change
its inclusionary housing program, allowing more flexibility, builders practically built no housing
within the jurisdiction, except by those market-rate developers that were willing to navigate the
complex world of affordable housing subsidies. The unintended consequence of that old
inclusionary program was excluding all developers not willing to navigate, because no market-
rate developer could find a way to profit if required to build affordable units. Those that tried
added the loss from the affordable units onto the cost of the market-rate units, further inflating
prices.
Affordable housing developers in the Sacramento region are typically non-profit mostly
funded by federal, state, and local subsidies. Mercy Housing, Mutual Housing, and Jamboree
Housing are a few notable nonprofits active in building affordable units in the Sacramento region.
92
However, the pseudo-market created with public assistance has developed into an industry with
organizations such as Sutter Health Foundation, US Bank, and Wells Fargo delivering tax-
deductible donations to Sacramento Housing Alliance, Housing California, and Habitat for
Humanity as stewards of donated funds. Additionally, many consulting and legal organizations
serve the important role of educating developers and builders how to navigate the system of
public funding and defending them from litigation. It does not take long to start to see that a
growing industry built on public funding is a bubble waiting to pop, but how else pay for housing
that the free-market avoids?
NIMBYs, real estate agents, and housing and community associations
Since beginning this thesis, I have become quite familiar with the NIMBY label. The
label often carries a negative connotation as people standing in the way of progress. If you are in
a low- or moderate income household, you have reason to agree, because as academics,
advocates, and media firms alike find NIMBYs guilty of hindering housing development,
especially affordable housing. In fact, in April 2015, the Sacramento News & Review published
their inaugural NIMBY awards, calling out Sacramento’s most egregious scenarios where
NIMBYs used the legal system to block development (vonKaenel, 2015).
While the anecdotal and educated accusations indicting NIMBYs is plentiful, NIMBYs
have rational reasons for blocking housing development. Without ranking, the main reasons
include protecting their investment, protecting their way of life, and protecting their ideal
surroundings. Intuitively, the investment of a house is in its appreciating value, which rises as
demand has outpaced supply. The less obvious investment is the maintenance and upkeep and the
Proposition 13 lock-in effect. As the value continually rises (usually much more than the pace of
inflation) the property tax owed is based on the original assessment (the base-year), increasing by
2% (the assumed rate of inflation) each year. Therefore, the property tax savings locks the owner

93
in to enjoy in perpetuity. Even when the value declines lower than the purchase price, such as the
recent housing bubble bursting, the owner can ask for a re-assessment at the lower value and start
over with a new base-year tax assessment. It is likely that NIMBYs overly stress out about their
home value because they want to profit from their investment after they turn 55, where they can
then transfer their base-year assessment to a new house anywhere in California (Proposition 60 in
1986). They can even transfer the base-year assessment to their child or grandchild (Proposition
58 [Parent-Child] in 1986, and Proposition 193 [Grandparent-Grandchild] in 1996). While locked
in with a favorable property tax assessment or planning to transfer a house to family makes the
NIMBY very interested in the surroundings and the way of life in the house, as they are in it for
the long run. If additional housing in the area saturates demand decreasing the value, then adding
affordable housing doubly decreases the value, saturating and bringing heterogeneous lifestyles
and cultures to the community.
Nearly all respondents mentioned that they thought that NIMBYs simply do not
understand modern low-income households. They echoed advocacy publications referring to
elementary school teachers, nurses, and security guards as affordable housing patrons, not felons
or drug addicts. However, the lowest income people who might be felons or drug addicts or
people that just cannot rise up the economic ladder feel the real problem. The occupations I listed
living in affordable housing can afford market-rate housing in parts of the Sacramento region, but
maybe not where they want to live. Those people with those low-income occupations rent those
affordable units that would have otherwise gone to the lowest income people. In the NIMBYs
defense, people in low-income households likely do live differently than high-income
households. It is no coincidence that the majority of prison and jail populations are people from
low-income and disadvantaged households. They likely take more chances and probably live in
the short-term (neglecting personal and property investments because of paycheck-to-paycheck

94
means), a stark contrast from most higher-income households probably living more conservative
(saving and investing). It is important to distinguish NIMBYs from other homeowners. All
homeowners are concerned about protecting their most important investment from devaluation,
which qualify them as NIMBYs, to a degree. Some NIMBYs however, become activists to fight
the development rather than submit to progress. As William Fischel (2001) identified in his book
The Homevoter Hypothesis, most homeowners go beyond their expected role of monitoring local
governments to maintain their quality of life. They also fight to ensure local governments do not
affect the increasing value of their house investment.
Real estate agents, who are also opposed to affordable housing, encourage NIMBYs
disreputable position about affordable housing. It was not surprising to hear the story from
HPROGRAM about the real estate agent selling affordable housing as skyscrapers and
neighborhood killers. Some respondents also noted that they have altered their programs to shift
from building affordable for-sale and rental single-family houses to apartment rentals, because of
the challenges with managing units spread throughout the jurisdiction. The trend equates to lost
sales and rental commission opportunities for agents, shifting the possible private market
incentives to government agencies and property management firms.
The big question with NIMBYs is whether it is right for them to block building
affordable housing (or any housing). Recall in the opening paragraph of this thesis where I quoted
Representative Nydia Velázquez (D-NY) (2014) who said, “Fair and affordable housing is a basic
right for all New Yorkers and all Americans.” Then recall later in chapter 1 when I quoted former
President Harry Truman (1949) who declared that all American households would have a “decent
home in a suitable living environment.” In today’s society, these two statements oppose each
other. According to NIMBYs, you cannot have a decent home in a suitable living environment if
fair and affordable housing is nearby. Are they wrong? They are simply preserving their decent
95
home and their suitable environment, albeit asking to place the affordable housing elsewhere.
They prefer to avoid the equity question that suggests they tax themselves more to counteract the
negative externalities housing affordable to low-income households create: congestion, crime,
and the cost of public school education provision. Devising public policy options, I considered
this reality and acknowledged that NIMBYs should have the right to preserve their suitable
environment, as they deem appropriate. However, public policy also must consider the inherent
inequity of a child born to a low-income single mother forced into homelessness or renting in a
low-income neighborhood with poor education, high crime, and low mentor opportunities it
offers.
Public Policy Options
No one ever said the law of the land must be fair; it only need be constitutional. Laws in
California must also receive majority vote (except tax inciting laws, which usually require two-
thirds vote in the legislature or majority ballot vote), which still does not necessarily make them
fair to all, just to the majority of those voting. I mention legal fairness because one ideal starting
point to solve the complex housing affordability problem would be to make changes to the laws
enacted through Proposition 13, a good example of legal, but not fair. Tocqueville (1835) warned
us of the tyranny of the majority, a threat to democracy where the powerful majority dictate laws
and customs that favor their ideals at the expense of weaker minorities. Proposition 13 surely fits
Tocqueville’s description as the laws dramatically favor existing homeowners, imposing the cost
of growth on directly on prospective homeowners and indirectly on housing developers. The
rationale is that prospective homeowners increase the NIMBY version of externalities, and that
developers exacerbate the externalities by providing the means. The fairness question is whether
it is just for marginal increases in population to pay for those externalities. A yes answer assumes
that people that have settled into the region, purchasing a home and land, have exclusive rights to

96
the use of their land and the surrounding land. The surrounding land argument lends itself to the
notion that homeowners have the right to protect their home investment by dictating the area
around it that might influence its value. A yes answer also means that homeowners private claim
to their land is higher priority than the public desire to share the surroundings, including the
public not yet residing in the community. Favoring the private rights over society’s use seems
quite hypocritical considering that all homeowners acting in favor of exclusion once migrated
into the area (either themselves or previous generations). A no answer to the question means that
existing homeowners contribute equally to the externalities and should equally share in the cost.
However, as long as direct democracy exists in California, the majority will take charge, fair or
not. According to the Public Policy Institute of California, 72% of likely voters in the state are
homeowners, a clear and decisive majority (Baldassare, et al., 2014).
Because of a long history of mistrust of government, both constructs of direct democracy
and Proposition 13 are here to stay. The railroad barons’ of the late 19th and early 20th centuries
control of state government officials led to direct democracy. Local jurisdictions power over
property tax rates led to Proposition 13 in the 1970s. Paradoxically, greed and failure to anticipate
how actions affect all factions resulted in laws, which allowed more greed and failure to
anticipate reactions. In my opinion, in both cases, we traded tyranny of the minority to that of the
majority. Nevertheless, any public policy, whether it is state or local, will need to work within the
current legal system, because direct democracy and Proposition 13 are untouchable, as no elected
official would dare alter legal framework cherished so deeply by the majority. Any public policy
would need to garner broad acceptability by the stakeholders, but especially homeowners
(including NIMBYs), making up 72% of the political force that would be content with status quo.
The following public policy options consider what I learned by reviewing the housing
affordability literature and through my interviews with local officials. The confluence between

97
excessive local land use regulations (the academic version of the problem) and the lack of
funding to subsidize affordable housing (the local officials’ version of the problem) is tricky to
navigate because of the complexity of intermingled interests. The actual problem combines both
versions and solving the combined problem will not occur with a single solution. Like many
complex problems, solutions will likely require incremental actions. However, the risk with
incremental actions is changing political perceptions or changing economic conditions that would
change breadth of the problem. People could start moving out of California. A mass exodus
would render our affordability problem solved because demand would also depart, bringing down
the economic price equilibrium of for sale and rental housing. The likeliness of massive reduction
in population in California is not likely, despite continuing concerns about the historic drought
and questions of potable water supply. Assuming stable and trending political and economic
status, policymakers in the Sacramento region and in the state government should consider the
following policy options, in which I offer the policy idea and the pros and cons considering
stakeholders’ reactions.
Empower SACOG – Affordable housing abatement districts
In all my interviews, respondents mentioned that NIMBYs and their homeowner
associations do not oppose building affordable housing. Instead, they oppose building it in their
neighborhood. It is important to clarify NIMBYs interests because then it becomes clear that all
stakeholders agree that we need more affordable housing. If NIMBYs desire to exclude housing
affordable to low-income households from their communities, the costs negative externalities
forcing affordable housing out of their neighborhood, they should compensate those displaced by
paying a mitigation tax, similar to Mello-Roos community facilities districts (CFD), authorized
by Government Code §53313. To enable this compensation, I propose a law allowing the
formation of affordable housing mitigation districts (AHMD). Wassmer (2005) proposed a

98
similar solution by suggesting that local jurisdictions bargain for their fair share of affordable
housing obligations through a cap and trade system similar that which the California Air
Resources Board administers for carbon credits. However, through my discussions with local
officials, accepting their fair share does not usually translate to units built. From the economic
perspective, allowing homeowners to block affordable housing development is not Pareto
efficient because those homeowners do not directly compensate the households that struggle to
find housing because of the price increases that come from undersupply. The Kaldor-Hicks test
for economic optimality would find that assessing the tax on those causing the struggle would
bring the economy closer to Pareto efficiency by providing the funding needed to build more
affordable housing.
The difference being that CFDs raise revenue to build things or provide services beyond
what the current budget can provide; the AHMD would raise revenue to avoid building. Unlike
CFDs, which local jurisdictions initiate, if local policies allow them, the local Council of
Government (SACOG for the Sacramento Region) would initiate the AHMD at the request of
developers who receive organized opposition to affordable housing development plans. Typically,
the LAFCO would dictate boundaries of special districts, but AHMDs would constitute financing
special districts, and LAFCOs do not have power to decide local jurisdictions’ ability to create
financing mechanisms. The boundaries of the AHMD and the tax rate should be determined with
a nexus test similar to those that justify exaction payments on developers. The state budget would
allocate the tax revenue to SACOG providing the regional jurisdiction leverage when negotiating
with jurisdictions over their fair share of affordable housing.
The AHMD option would require a tax rate that would also fund the needed
administration of the districts. The option would provide a fair way to allow NIMBY led
communities to maintain their surroundings by avoiding construction of affordable housing near
99
them by assessing their share of the external cost imposed on developers. NIMBYs and other
homeowners would benefit from this law because it gives them a way to pay for something that,
up to this point, they would have to lobby for, with the results sometimes favoring the developer.
In addition, while Vigdor (2002) found little evidence that gentrification harms low-income
households because they could always choose their living arrangement, choosing to pay more for
better living, or less for lower standards, I say the same applies to homeowners. If displacement
(by choice or otherwise) of low-income households is harmless, then the choice of households to
stay in the AHMD because of the additional tax should be harmless. Although, recall Smith, et al.
(1988) explained the transaction cost for a homeowner is greater than that for a renter. Therefore,
the policy’s tax formula should also consider concessions for the additional relocation cost.
A potential negative of the AHMD policy would be the possibility of unintended
consequences. First, forming financing districts will be contentious because some homeowners
will disagree that their property should be included within the district. Accounting for movement
in and out of the district will also be challenging. Additionally, the nexus test establishing the
boundary and tax rate could be cost prohibitive. The state legislature has already made clear that
the availability of housing is of statewide importance, so the benefit should outweigh the cost of
designing a statewide template for the nexus test and implementing it locally. Another negative is
the potential for abuse. For example, a private investigation in 2013 revealed a CFD in San Diego
overcharging homeowners (Faryon, Price, 2013). This case illustrates the risk involved with
forming any new public functions, the risk of mismanagement or abuse.
Incentivize housing density in neighborhoods
As required by Government Code §65915, local jurisdictions with police powers grant
density bonuses to developers to encourage lower selling prices or rents through economies of
scale in construction. Why do we not offer similar incentives to neighborhood homeowners?

100
After all, if incentives silenced homeowner opposition, developers would build to meet demand
with fewer obstacles and prices would be more affordable through a lower price equilibrium
point. Administering this kind of incentive would mean that local jurisdictions would need a
mechanism to determine the correct recipients.
Almost the opposite of the last option – neighborhoods that embrace high-density
housing development (specifically affordable housing) would receive a special property tax
credit. The research informed formula to determine the size of the credit would consider the
impact to property value. Applicable homeowners would receive the credit for a limited number
of years and the value of the credit would diminish, probably at the same 2% rate of assessed
home value increases. Because the availability of housing is of statewide importance, the local
jurisdictions’ revenue losses because of the property tax break, the state would need to offset
those losses fully. The Strategic Growth Council could allocate a portion of Cap and Trade
auction proceeds for this purpose.
Ancillary policy actions and future research
The previous policy options offer ideas to deal with the lack of funding for affordable
housing, but another giant hurdle is the current system of local land use controls. At this point, I
am convinced that the current system of local control is good for affluent residents, but bad for
future prosperity of the state of California. The system of local control may have worked
harmlessly when land was abundant, but as local jurisdictions have built out to their capacity,
questions about who gets what have become more intense. In the past, bold policymakers have
created laws to protect us from ourselves, and I believe more is necessary. If we consider the use
of land, and jurisdictions’ corporate powers a market, and if the market were to adjust like free
markets, then we might begin to see similar adjustments to correct the inefficiencies. In other
words, consider the airline industry. In 2013, U.S. Airways merged with American Airlines to
101
partly to gain competitive advantage in the industry, but more so to enjoy economies of scale.
Some jurisdictions create economies of scale by collaborating or creating joint power authorities
to share the costs savings of shared services. However, jurisdictions should consider this same
path with land use planning. The recent SACOG Blueprint is a non-authoritative attempt at
regional planning, but are jurisdictions ready to abide? Can they abide? Will residents allow it?
Or will jurisdictions combat further tragedy of the commons and protect us from ourselves.
Many of my respondents said that most NIMBYs are against affordable housing near
them because of their perception of the type of people that live in affordable housing. They also
said that those NIMBYs might change their perception if they did not rely on traditional
understandings of low-income households. Reform attention must address the current reality that
allows housing advocates and developers to influence policies in housing elements, but also
allows any organized group of homeowners to reject projects. State policymakers must continue
to look closely at how CEQA and housing element laws perpetuate this activity. I believe my
thesis has revealed that the former and latter contradict the priority in Government Code
§65580(a) that reads, “Housing availability is of statewide importance, and the early attainment
of decent housing and a suitable living environment for every Californian, including
farmworkers, is a priority of the highest order.”
The professional planners I interviewed pointed to the shining example of Portland,
Oregon and the abundant development of affordable housing options. The Oregon model of
required regional governance over land uses likely made that example possible, mitigating the
tragedy of the commons. Portland has received notoriety from the national and worldwide
industries of land development and has received equivalent notoriety for its regional transit
system, TriMet. Is it a random coincidence that Portland does land use and transportation so well?
Or can the regional governance model better explain that success? The League of California

102
Cities and the California State Association of Counties have long opposed regional land use
control, perhaps leaving California regions with a disadvantage compared to places like Portland.
Perhaps future research can find ways for these organizations to maintain relevance without their
most prized power.
Final thoughts on Housing Affordability
I provided substantial information in this thesis about housing affordability in the
Sacramento region and while policy might provide a solution for now, the problem comes down
to a battle of powerful interests. The private interests of homeowners and of developers are a zero
sum game. Every inch a developer takes to build takes value, in some form, from homeowners.
Every win homeowners capture in the name of preventing growth takes earnings from the
developer, and intensifies the affordability problem. The social interest involves economic
development and providing housing options for low-, very low-, and extremely low-income
households. Economists often frame this tradeoff between interests as the balance between
private interests and market efficiency. Advocates for the low-income might call the tradeoff a
balance between the desires of the advantaged and the needs of the disadvantaged. Media and
advocates might describe NIMBYs as greedy progress-stoppers, but they are simply protecting
the wealth they might perceive an alternative to traditional savings. Developers make decisions to
build based on market indicators telling them that sufficient demand exists. Developers provide
the mechanism for growth, no matter if it is the inefficient sprawling kind or smart growth
increasing density and public transit utilization. Those NIMBYs denouncing growth clearly see
their neighborhoods as extensions of their property, requiring particular land uses that keep their
investments appreciating.
Policy makers must decide on the best balance of homeowners’ private interest of wealth
building and community fabricating and housing opportunities for the lowest-income households.

103
Favoring homeowners might mean continued treatment of the housing market as an exclusive
asset market. Favoring low-income households might change the region’s landscape adding taller,
denser apartment complexes in more transit corridor areas and smaller for-sale houses in areas
that have seen only large expensive houses. Policy favoring low-income households might look
like a dramatic shifting of resources to people those homeowners might feel do not deserve it.
Like many civil rights discussions we have had as a county, a state, and as a local
community, policy makers must consider that the reality that most low-income families are born
into their status. It is a moral dilemma that political will excludes low-income households from
housing opportunities and amenities simply because live differently. The lowest-income people
had no choice in the families into which they were born. Their choices in life were partially the
product of an upbringing they had no say in. To what degree do we banish these people from
communities with better amenities? This choice might mean the difference of a growing
population of the lowest income problem-makers and rehabilitated, reinvigorated people that
might begin to visualize the path to higher income and better living. My policy options provide
the groundwork for this balance by conceding affordable housing locations to the pleasure of
homeowners that agree that the housing type is needed. The options can also extract from them a
fair share of the external costs of limiting growth and that of excluding low-income households
from amenities enjoyed through more robust economic development in more affluent
communities. Homeowners have long enjoyed the political protection of their elected lawmakers,
assessing the cost of growth on indifferent developers that pass the cost on to new homebuyers
directly, but on to low-income renters indirectly because more moderate-income households have
filtered into the rental sector. The filtering is a consequence of restrained housing construction.

104
Appendix A – Wharton Residential Land Use Regulation Index
(Gyourko, et al., 2008, pp.719-722)
SURVEY ON RESIDENTIAL LAND-USE REGULATION
JURISDICTION
Name of Jurisdiction Zip Code 1
Type of Jurisdiction 1
(City, County, Township, Town, Village, Borough)
Size of Jurisdiction square miles
Population
Current population estimate 1
Population growth: Past 5 years % Projected next 5 years %
GENERAL CHARACTERISTICS OF LAND REGULATORY PROCESS
1. In your community, how involved are the following organizations in affecting residential
building activities and/or growth management procedures? Please rate the importance of
each on a scale of 1 to 5 by circling the appropriate number (1 = not at all involved; 5 =
very involved).
Local Council, Managers, Commissioners 1 2 3 4 5
Community pressure 1 2 3 4 5
County legislature 1 2 3 4 5
State legislature 1 2 3 4 5
Local courts 1 2 3 4 5
State courts 1 2 3 4 5
2. Which of the following are required to approve zoning changes, and by what vote?
Yes Yes, by
simple
majority
Yes, by
more
than
simple
majority
No
Local Planning Commission
Local Zoning Board
Local Council, Managers, Commissioners
County Board of Commissioners
County Zoning Board
Environmental Review Board
3. Which of the following are required to approve a new project that does not need
rezoning, and by what vote?

105
Yes
Yes, by
simple
majority
Yes, by
more
than
simple
majority No
Local Planning Commission
Local Zoning Board
Local Council, Managers, Commissioners
County Board of Commissioners
County Zoning Board
Environmental Review Board
4. On a scale of 1 to 5, please rate the importance of each of the following factors in
regulating the rate of residential development in your community (1 = not at all
important; 5 = very important). Please circle the appropriate number.
Single-family
units
Multi-family
units
Supply of land 1 2 3 4 5 1 2 3 4 5
Cost of new infrastructure 1 2 3 4 5 1 2 3 4 5
Density restrictions 1 2 3 4 5 1 2 3 4 5
Impact fees/exactions 1 2 3 4 5 1 2 3 4 5
City budget constraints 1 2 3 4 5 1 2 3 4 5
City Council opposition to growth 1 2 3 4 5 1 2 3 4 5
School crowding 1 2 3 4 5 1 2 3 4 5
Length of review for zoning 1 2 3 4 5 1 2 3 4 5
Length of process for building permits 1 2 3 4 5 1 2 3 4 5
Length of review process for land development plan 1 2 3 4 5 1 2 3 4 5
RULES OF RESIDENTIAL LAND USE REGULATION
5. Does your community place annual limits on the total allowable:
Yes No
Number of building permits – single family?
Number of building permits – multi family?
Number of residential units authorized for construction – single family?
Number of residential units authorized for construction – multi family?
Number of multi-family dwellings?
Number of units in multi-family dwellings?

106
6. To build, do developers have to meet these requirements?
Yes No
Meet the minimum lot size requirement
If yes: ½ acre or more ½ acre or less 1
1 acre or more 2 acres or more 1
Include “affordable housing” (however defined)
Supply mandatory dedication of space or open space (or fee in lieu of dedication)
Pay allocable share of costs of infrastructure improvement
SPECIFIC CHARACTERISTICS
7. How does the acreage of land zoned for the following land uses compare to demand?
Far more
than
demanded
More than
demanded About right
Less than
demanded
Far less than
demanded
Single-family
Multi-family
Commercial
Industrial
8. How much has the cost of lot development, including subdivisions, increased in the last
10 years? Please circle the appropriate category.
0-20% 21-40% 41-60% 61-80% 81-100% >100%
9. How much has the cost of a single family lot increased in the last 10 years?
0-20% 21-40% 41-60% 61-80% 81-100% >100%
10. What is the current length of time required to complete the review of residential projects
in your community?
For single-family units: months For multi-family units: months
11. Over the last 10 years, how did the length of time required to complete the review and
approval of residential projects in your community change?
No change Somewhat longer Considerably longer
Single-family units
Multi-family units
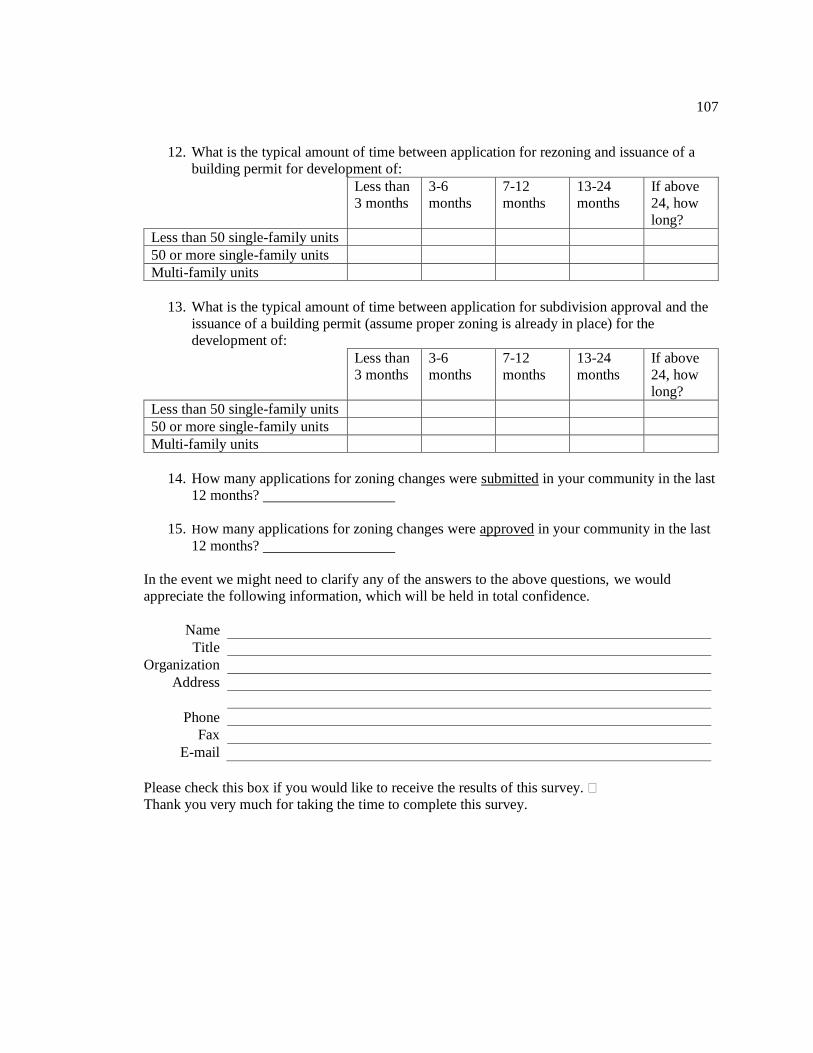
107
12. What is the typical amount of time between application for rezoning and issuance of a
building permit for development of:
Less than
3 months
3-6
months
7-12
months
13-24
months
If above
24, how
long?
Less than 50 single-family units
50 or more single-family units
Multi-family units
13. What is the typical amount of time between application for subdivision approval and the
issuance of a building permit (assume proper zoning is already in place) for the
development of:
Less than
3 months
3-6
months
7-12
months
13-24
months
If above
24, how
long?
Less than 50 single-family units
50 or more single-family units
Multi-family units
14. How many applications for zoning changes were submitted in your community in the last
12 months? 1
15. How many applications for zoning changes were approved in your community in the last
12 months? 1
In the event we might need to clarify any of the answers to the above questions, we would
appreciate the following information, which will be held in total confidence.
Name
Title
Organization
Address
Phone
Fax
Please check this box if you would like to receive the results of this survey.
Thank you very much for taking the time to complete this survey.

108
Appendix B – Interview Respondent Consent to Participate Form
You are invited to participate in a research study that will involve understanding local officials’
perspectives, in addition to previous academic research to better understand the housing
affordability problem in the region. My name is Sean Johnson and I am a Master’s student at
California State University, Sacramento, Department of Public Policy and Administration. You
were selected as a possible participant in this study because of your community
development/planning affiliation and expertise in housing supply and demand in your
jurisdiction.
The purpose of this research is to build on previous quantitative research of regions across the
nation with qualitative research specifically for the Sacramento region. If you decide to
participate, you will be asked to answer several open ended questions about housing affordability,
effectiveness of state funding, jurisdiction zoning policies, and challenges to housing
development. Your participation in this study will last approximately 30 minutes.
There are some possible risks involved for participants. The risks involve ensuring confidentiality
and privacy. Any information that is obtained in connection with this study and that can be
identified with you will remain confidential. Measures to insure your confidentiality are that I
will be the only person with access to the data and no names or titles will be used in the collection
or reporting process. The data obtained will be maintained in a safe, locked location and will be
destroyed by May 8, 2015 after the study is completed
There are some benefits to this research, particularly that it will contribute to robust
understanding of housing affordability, integrating previous national and statewide acadmic
research with perspectives from local community development and planning practitioners. This

109
research in unique in that it is Sacramento region-specific and will give local and regional policy-
makers some ideas on how to deal with the housing affordability problem.
If you have any questions about the research at any time, please call (or email) me at 714-269-
3908 ([email protected]), or my Advisor, Professor Robert Wassmer at 916-278-
6304. If you have any questions about your rights as a participant in a research project please call
the Office of Research Affairs, California State University, Sacramento, 916-278-5674, or email
Your participation is entirely voluntary and your decision whether or not to participate will
involve no penalty or loss of benefits to which you are otherwise entitled. If you decide to
participate, you are free to discontinue participation at any time with out penalty or loss of
benefits to which you are otherwise entitled.
Your signature below indicates that you have read and understand the information provided
above, that you willingly agree to participate, that you may withdraw your consent at any time
and discontinue participation at any time without penalty or loss of benefits to which you are
otherwise entitled, that you will receive a copy of this form, and that you are not waiving any
legal claims, rights or remedies.
You will be offered a copy of this signed form to keep.
Signature Date
________________________ ___________________________

110
Appendix C – Interview questions – Housing Affordability in the Sacramento Region
My name is Sean Johnson and I am studying housing affordability, particularly in the Sacramento
region. According to the California Housing Partnership Corporation, one way to look at the
problem in Sacramento County is that 70% of very low-income households pay more than 50%
of their income on rent. I reviewed literature about measuring affordability, how housing supply
shortages exacerbate affordability, and how demand characteristics influence where housing is
affordable. While much of the research I looked at provides affordability analyses at state or
regional levels, I want to get local jurisdictions’ perspectives about the problem.
1. How would you define housing affordability for the residents of your jurisdiction?
2. Based on your definition of affordable housing, do you think there is an affordable
housing problem, or shortage, in your jurisdiction?
a. Are there neighborhoods in your jurisdiction in which housing is affordable? If
so, can you provide examples and why do you think some neighborhoods are
affordable and others are not?
3. What are the major drivers of a lack of affordable housing in your jurisdiction?
4. Is there opposition within your jurisdiction toward building new affordable housing
developments? Are there challenges for developers of such housing in some
neighborhoods more than in others? If so, why?
a. Who are the proponents for affordable housing? What are their arguments?
b. Who are the opponents? What are their arguments?
5. What is the most prominent source of housing development approval delay in your
jurisdiction, if any?
a. Can the length of time vary? Why?
b. Does the time vary for single-family zoned, multi-family, or mixed-use? Why?
6. With Inclusionary Housing Program - Has the inclusionary housing program helped to
meet affordable housing goals?
a. What kind of proposals are you seeing under the program (new development,
rehabilitation projects, and infill or higher-density development)?
b. What percentage of new housing is attributed to inclusionary housing program?
Without Inclusionary Housing Program – What is the city council’s/board of directors’
opinion about inclusionary zoning?
a. What is the typical resistance regarding, or arguments against adopting,
inclusionary zoning?
111
7. Has been awarded Proposition 46 (2002) and Proposition 1C (2006) funds from the
California Department of Housing and Community Development – What are some
prominent projects created with the funds and how have the projects promoted affordable
housing?
a. Have there been barriers beyond project approval, for those seeking to receive
the bond funding?
Has not been awarded Proposition 46 (2002) and Proposition 1C (2006) funds from the
California Department of Housing and Community Development – Can you please
explain some of the barriers to using the funds?
112
References
Arnold, A., Crowley, S., Bravve, E., Brundage, S., Biddlecombe, C. (2014). Out of Reach 2014:
Twenty-Five Years Later, The Affordable Housing Crisis Continues. National Low
Income Housing Coalition. Retrieved from
http://nlihc.org/sites/default/files/oor/2014OOR.pdf
Bizjak, T. (2015). Houses to spill south of highway 50 in Folsom. The Sacramento Bee. Retrieved
from http://www.sacbee.com/news/business/real-estate-news/article12966740.html
CALegalAdvocates.com. (2006). Superior Court dismissed lawsuit challenging Sacramento
County’s affordable housing ordinance. Retrieved from
http://www.calegaladvocates.org/news/article.97683-
Superior_Court_dismissed_lawsuit_challenging_Sacramento_Countys_affordable
California Environmental Quality Act. (2014). 2014 CEQA Statutes and Guidelines. Retrieved
from http://resources.ca.gov/ceqa/docs/2014_CEQA_Statutes_and_Guidelines.pdf
California Department of Housing and Community Development. (2014). Highlights of the State
of Housing in California: Affordability Worsens, Supply Problems Remain, 2014 Update.
Business, Consumer Services and Housing Agency. Retrieved from
http://www.hcd.ca.gov/hpd/shp/web_hcd_stateofhousing_april2014.pdf
California Housing Partnership Corporation. (2014). How Sacramento County’s Housing Market
is Failing to Meet the Needs of Low-Income Families. Retrieved from
http://media.bizj.us/view/img/2824111/calif-housing-market-low-incom-sac.pdf
California Planning Roundtable. (1997). Myths and Facts About Affordable and High-Density
Housing. American Planning Association. Retrieved from
http://www.abag.ca.gov/services/finance/fan/housingmyths2.htm
Can, A. (1990). The Measurement of Neighborhood Dynamics in Urban House Prices. Economic
Geography. Vol. 66, No. 3, pp. 254-272.
Chakrabarti, R., Zhang, J. (2014). Unaffordable housing and local employment growth: Evidence
from California Municipalities. Urban Studies. May 2014, pp. 1-18.
Cho, M. (1997). Congestion Effects of Spatial Growth Restrictions: A Model and Empirical
Analysis. Real Estate Economics. Vol. 25, No. 3, pp. 409-438.
City of Elk Grove. (2015). City of Elk Grove General Plan 2013-2021 Housing Element.
Retrieved from
http://www.elkgrovecity.org/UserFiles/Servers/Server_109585/File/5.0%20Housing%20
Element_10-09.pdf

113
City of Rancho Cordova. (2013). City of Rancho Cordova General Plan Housing Element.
Retrieved from
file:///C:/Users/Sean)(Christina/Downloads/5%20V%20Housing%20Element_Final%20(
1).pdf
City of Sacramento. (2009). Report to Council: City of Sacramento. Retrieved from
http://www.records.cityofsacramento.org/ViewDoc.aspx?ID=s6tFBnt4W+I0REbNNUyj
Q5/D2hrprUKQ
City of Sacramento. (2000). Zoning Code, Title 17, Chapter 17.190 Mixed Income Housing.
Retrieved March 12, 2015 from http://www.lsnc.net/housing/Sac_city_ordinance.pdf
City of West Sacramento. (2013). City of West Sacramento General Plan 2013-2021 Housing
Element. Retrieved from
http://www.cityofwestsacramento.org/civica/filebank/blobdload.asp?BlobID=9879
Detwiler, P. (2015) California Land Use Policy: Dirt, Dollars & Duties. Sacramento State
University Department of Public Policy and Administration course lecture materials.
Federal Emergency Management Agency. (2014). Floodplain Management Information for
States. Retrieved from https://www.fema.gov/floodplain-management-0/floodplain-
management-information-states
Federal Register. (2015). Final Fair Market Rents for the Housing Choice Voucher Program and
Moderate Rehabilitation Single Room Occupancy Program. National Archives and
Records Administration. Retrieved from https://www.federalregister.gov/
Fingleton,B. (2008). Housing Supply, Housing Demand, and Affordability. Urban Studies. Vol.
45, No. 8, pp. 1545-1563.
Fischel, W. (1990). Introduction: Four Maxims for Research on Land-Use Controls. Land
Economics. Vol. 66, No 3, pp. 229-236.
Fischel, W. (2001). The Homevoter Hypothesis. Cambridge, Massachusetts. Harvard University
Press.
Fulton, W. (2003). How we Pay for Growth. Planetizen. Retrieved from
http://www.planetizen.com/node/91
Fulton, W., Shigley, P. (2012). Guide to California Planning: 4th Edition. Point Area, California.
Solano Press Books.
Gellen, M. (2014). The Housing Crisis in California. Institute of Urban and Regional
Development, U.C. Berkeley. Working Paper 340. Retrieved January 29, 2015 from
https://escholarship.org/uc/item/9mb9q0g4
Glaeser, E., Gyourko, J., Saks, R. (2005). Why Have Housing Prices Gone Up? The American
Economic Review. Vol. 95, No. 2, pp. 329-333.

114
Gorte, R., Vincent, C., Hanson, L., Rosenblum, M. (2012). Federal Land Ownership: Overview
and Data. Congressional Research Service. Retrieved from
https://fas.org/sgp/crs/misc/R42346.pdf
Governor’s Office of Planning and Research. (2003). General Plan Guidelines. State of
California. Retrieved from http://opr.ca.gov/docs/General_Plan_Guidelines_2003.pdf
Green, R., Malpezzi, S., Mayo, S. (2005). Metropolitan-Specific Estimates of the Price Elasticity
of Supply of Housing, and Their Sources. The American Economic Review. May 2005,
Vol. 95, No. 2, pp. 334-339.
Guerrieri, V., Hartley, D., Hurst, E. (2013). Endogenous gentrification and housing price
dynamics. Journal of Public Economics. Vol. 100, pp. 45-60.
Gyourko, J., Gottlieb, J. (2009). The Wealth of Cities: Agglomeration Economies and Spatial
Equilibrium in the United States. National Bureau of Economic Research. Working
Paper 14806. Retrieved January 29, 2015 from http://www.nber.org/papers/w14806
Gyourko, J., Saiz, A., Summers, A. (2008) A New Measure of the Local Regulatory Environment
for Housing Markets: The Wharton Residential Land Use Regulatory Index. Urban
Studies. Vol. 45, No. 3, pp.693-729.
Hardin, G. (1968). The Tragedy of the Commons: The population problem has no technical
solution; it requires a fundamental extension in morality. Science. Vol. 162, pp. 1,243-
1,248.
Housing and Urban Development Act of 1969. (PL. 91-152, December 24, 1969). United States
Statutes at Large, 83, 1969, Title II, Section 213(b). Retrieved February 27, 2015 from
http://www.gpo.gov/fdsys/pkg/STATUTE-83/pdf/STATUTE-83-Pg379.pdf
Housing and Urban Development Act of 1974. (PL. 93-383, August 22, 1974). United States
Statutes at Large 93rd Congress, 88, 1974, Title VIII. Retrieved March, 19, 2015 from
http://www.gpo.gov/fdsys/pkg/STATUTE-88/pdf/STATUTE-88-Pg633-2.pdf
Hosseini, R. (2015). Arden-Arcade neighbors lob more conflict-of-interest allegations against
county supervisor. Sacramento News and Review. Retrieved from
http://www.newsreview.com/sacramento/arden-area-neighbors-lob-more-conflict-of-
interest/content?oid=16091457
Hunter, B. (2014). We’ve got lots to talk about: Lot deliveries catching up with demand.
Metrostudy Report. Retrieved from
http://www.metrostudyreport.com/category/sacramento-market/
Husock, H. (2015). How Brooke Helped Destroy Public Housing. Forbes. Retrieved from
http://www.forbes.com/sites/howardhusock/2015/01/08/how-senator-brooke-helped-
destroy-public-housing/

115
Institute for Local Government. (2010). Understanding California’s Sustainable Communities and
Climate Protection Act of 2008 (SB 375): A Local Official’s Guide. Retrieved from
http://www.ca-ilg.org/sites/main/files/file-
attachments/resources__SB_375_Legal_Analysis_11-23-10.pdf
Jackson, K. (1985). Crabgrass Frontier: The Suburbanization of the United States. New York.
Oxford University Press.
Kok, N., Monkkonen, P., Quigley, J. (2013). Land Use Regulation and the Value of Land and
Housing: An Intra-Metropolitan Analysis. Berkeley Program for Housing and Urban
Policy. Retrieved January 10, 2015 from
http://nilskok.typepad.com/KMQ_Regulation/KMQ%20to%20JUE.pdf
Legislative Analyst’s Office (LAO). (1996). Understanding Proposition 218. Retrieved from
http://www.lao.ca.gov/1996/120196_prop_218/understanding_prop218_1296.html#chapt
er4
Legislative Analyst’s Office (LAO). (2015). California’s High Housing Costs: Causes and
Consequences. Retrieved from http://lao.ca.gov/reports/2015/finance/housing-
costs/housing-costs.pdf
Levine, N. (1999). The Effects of Local Growth Controls on Regional Housing Production and
Population Redistribution in California. Urban Studies. Vol. 36, No. 12, pp. 2047-2068.
Locke, C. (2014). Sacramento Area Governments Relax Affordable Housing Policies to Attract
Development. Tenants Together. Retrieved from
http://tenantstogether.org/article.php?id=3024
Matlack, J., Vigdor, J. (2006). Do Rising Tides Lift All Prices? Income Inequality and Housing
Affordability. National Bureau of Economic Research. Working Paper 12331. Retrieved
March 5, 2015 from http://www.nber.org/papers/w12331
Malpezzi, S. (1996). Housing Prices, Externalities, and Regulation in U.S. Metropolitan Areas.
Journal of Housing Research. Vol. 7, Issue 2, pp. 209-241.
Mayo, S., Sheppard, S. (2001). Housing Supply and the Effects of Stochastic Development
Controls. Journal of Housing Economics. No. 10, pp. 109-128.
McGreevy, P. (2014). Audit finds flaws in state affordable housing spending. Los Angeles Times.
Retrieved from http://www.latimes.com/local/political/la-me-pc-audit-finds-flaws-in-
state-affordable-housing-spending-20140911-story.html
Misczynski, Dean J. (1986). “The Fiscalization of Land Use,” in California Policy Choices,
edited by John J. Kirlin and Donald R. Winkler, Sacramento, CA: School of Public
Administration, University of Southern California.
116
National Association of Realtors (NAR). (n.d.). Housing Affordability Index Methodology.
Retrieved from http://www.realtor.org:8119/topics/housing-affordability-
index/methodology
Office of Congresswoman Nydia M. Velasquez. (2014). Velasquez Announces Funding for BK
Housing Advocacy Groups. Retrieved from
http://velazquez.house.gov/newsroom/2014/pr-04-25-14-BKLegalServcies.shtml
Oh, DH. (1995). Households with Rent Burdens: Impact on Other Spending and Factors Related
to the Probability of Having a Rent Burden. Association for Financial Counseling and
Planning Education. Retrieved from http://www.afcpe.org/assets/pdf/vol616.pdf
Omnibus Budget Reconciliation Act of 1981. (PL. 97-35, August 13, 1981). United States 97th
Congress. 95 Stat. 357. Title III, Part 2, Section 3(a). Retrieved February 27, 2015 from
http://history.nih.gov/research/downloads/PL97-35.pdf
O’Toole, R. (2007). Why California Home Prices are So High. CATO Institute. Retrieved from
http://www.cato.org/publications/commentary/why-california-home-prices-are-so-high
Paciorek, A. (2013). Supply constraints and housing market dynamics. Journal of Urban
Economics. Vol. 77 (2013), pp. 11-26.
Phillips, S. (2014). 30Percent of Income Isn’t a Realistic Measure of Housing Affordability.
Better Institutions. Retrieved from http://www.betterinstitutions.com/2014/05/30-percent-
of-income-isnt-realistic.html
Rohe, W., Lindblad, M. (2013). Reexamining the Social Benefits of Homeownership after the
Housing Crisis. Joint Center for Housing Studies, Harvard University. Retrieved from
http://www.jchs.harvard.edu/sites/jchs.harvard.edu/files/hbtl-04.pdf
Rosa, J. (2012). CEQA Reform Bringing Smart Growth to Life. Public CEO. Retrieved from
http://www.publicceo.com/2012/04/ceqa-reform-bringing-smart-growth-to-life/
Ryan, S., Enderle, B. (2012). Examining spatial patterns in affordable housing: the case of
California density bonus implementation. J Hous and the Built Environ. No. 27, pp. 413-
425.
Sacramento Area Council of Governments (SACOG). (nd). Sacramento Region Blueprint
Transportation and Land Use Plan. Retrieved March 22, 2015 from
http://www.sacregionblueprint.org/implementation/
Sacramento County. (2015). Compliance with the Affordable Housing Ordinance (AHO) – New
Planning Entitlements or New Building Permits. Sacramento County’s Affordable
Housing Ordinance. Retrieved March 12, 2015 from
http://www.per.saccounty.net/PlansandProjectsIn-
Progress/Documents/Affordable%20Housing%20Ordinance%20Amendment%20Project/
Affordable%20Housing%20Fact%20Sheet%202014.pdf
117
Sacramento Housing Alliance. (nd). SHA–Folsom Inclusionary Lawsuit Summary. Retrieved
from http://www.sachousingalliance.org/2013/05/sha-folsom-inclusionary-lawsuit-
summary/
Saiz, A. (2010). The Geographic Determinants of Housing Supply. The Quarterly Journal of
Economics. August 2010, pp. 1253-1296.
Sangree, H. (2013). Wall Street firm sells bonds backed by Sacramento rental homes. The
Sacramento Bee. Retrieved from http://www.sacbee.com/news/local/article2583434.html
Sangree, H., Reese, P. (2014). Average earners getting squeezed out of Sacramento region’s tight
housing market. The Sacramento Bee. Retrieved from
http://www.sacbee.com/news/business/real-estate-news/article2620614.html
Schuetz, J., Meltzer, R., Been, V. (2011). Silver Bullet or Trojan Horse? The Effects of
Inclusionary Zoning in the United States. Urban Studies. Vol. 48, No. 2, pp.297-329. Schwartz, M., Wilson, E. (2008). Who Can Afford to Live in a Home?: A look at data from the
2006 American Community Survey. U.S. Census Bureau. Retrieved from
http://www.census.gov/housing/census/publications/who-can-afford.pdf
Smith, L., Rosen, K., Fallis, G. (1988). Recent Developments in Economic Models of Housing
Markets. Journal of Economic Literature. Vol. XXVI, March 1988, pp. 29-64.
Somerville, C., Holmes, C. (2001). Dynamics of the Affordable Housing Stock: Micro Analysis
of Filtering. Journal of Housing Research. Vol. 12, No. 1, pp. 115-140.
Sowell, T. (2009). The Housing Boom and Bust, Revised Edition. New York. Revised in 2010,
Basic Books. Strategic Growth Council. (2015). List of FY2014-15 Affordable Housing and Sustainable
Communities Funded Projects. California Strategic Growth Council June 30, 2015
council meeting. Retrieved from
http://www.sgc.ca.gov/docs/Attachment_A_AHSC_Award_Recommendations_FINAL.p
df
Talbert, C., Costa, N. (2003). Inclusionary Housing Programs: Local Governments Respond to
California’s Housing Crisis. Environmental Affairs. Vol. 30, pp. 567-579.
Titman, S. (1985). Urban Land Prices under Uncertainty. The American Economic Review. Vol.
75, No. 3, pp. 505-514. Truman, H. (1949). "Statement by the President Upon Signing the Housing Act of 1949." July 15,
1949. Online by Gerhard Peters and John T. Woolley, The American Presidency Project.
Retrieved from http://www.presidency.ucsb.edu/ws/?pid=13246

118
Van der Meer, B. (2015). 2015 housing forecast is positive, but market changes could be coming.
Sacramento Business Journal. Retrieved from
http://www.bizjournals.com/sacramento/news/2015/01/06/2015-housingforecast-is-
positive-but-market.html
Weiser, M., Bizjak, T. (2015). Feds poised to lift building moratorium in Natomas. The
Sacramento Bee. Retrieved from http://www.sacbee.com/news/local/article5529417.html
White, J. (2015). Passion for affordable housing drives California Assembly speaker. The
Sacramento Bee. Retrieved from http://www.sacbee.com/news/politics-
government/capitol-alert/article14080046.html
U.S. Census Bureau. (2015). American Fact Finder: American Community Survey data (2005-
2013). Retrieved from
http://factfinder.census.gov/faces/nav/jsf/pages/searchresults.xhtml?refresh=t
U.S. Census Bureau. (2014). Housing Vacancies and Homeownership, Retrieved from
http://www.census.gov/housing/hvs/files/qtr414/rvr414.png
U.S. Housing & Urban Development. (2014) HUD Exchange. Retrieved from
https://www.hudexchange.info/grantees/?granteesaction=main.searchresults&searchText
=&stateId=CA&programId=0&orgNameFirstCharacter=W#alphaFacet
U.S. Housing & Urban Development. (n.d.) HOME Investment Partnership Program. Retrieved
from
http://portal.hud.gov/hudportal/HUD?src=/program_offices/comm_planning/affordableho
using/programs/home
United States Housing Act of 1937. (PL. 75-412, September 1 1937). 75th Congress, 1st Session.
Chapter 896, 1937, pp.888-899. Retrieved February 27, 2015 from
http://www.legisworks.org/congress/75/publaw-412.pdf
vonKaenel, J. (2015). NIMBY, no more: Environmental regulations are being misused.
Sacramento News & Review. Retrieved from
https://www.newsreview.com/sacramento/nimby-no-more/content?oid=16982504
Wassmer, R. (2005). An Economic View of the Causes as Well as the Costs and Some of the
Benefits of Urban Spatial Segregation, entry in Desegregating the City: Ghettos,
Enclaves, and Inequality, Edited by David Varady, State University of New York Press,
pp. 158-174
Whitaker, J., Perl, L. (2006). Low-Income Home Energy Assistance Program (LIHEAP)
Allocation Rates: Legislative History and Current Law. Congressional Research Service,
The Library of Congress. Retrieved from http://research.policyarchive.org/2747.pdf
Will, B. (2013). Sacramento Railyards Project Off the Tracks? HMS Law Group, LLC. Retrieved
from http://hmslawgroup.com/sacramento-railyards-project-tracks/