Embed Size (px)
Citation preview
Marine Policy 36 (2012) 235–240
Contents lists available at ScienceDirect
Marine Policy
0308-59
doi:10.1
n Corr
E-m
journal homepage: www.elsevier.com/locate/marpol
Why is the Eastern Baltic cod recovering?
Margit Eero n, Friedrich W. Koster, Morten Vinther
Technical University of Denmark, National Institute of Aquatic Resources, Charlottenlund Castle, 2920 Charlottenlund, Denmark
a r t i c l e i n f o
Article history:
Received 1 November 2010
Received in revised form
16 March 2011
Accepted 23 May 2011
Keywords:
Eastern Baltic cod
Recovery
Management
Compliance
Recruitment
7X/$ - see front matter & 2011 Elsevier Ltd. A
016/j.marpol.2011.05.010
esponding author. Tel.: þ45 3588 3318; fax:
ail address: [email protected] (M. Eero).
a b s t r a c t
The Eastern Baltic cod stock was until recently below safe biological limits and suffered from high
fishing pressure. In most recent years, fishing mortality substantially declined and spawner biomass
more than tripled. Similar developments have not been observed for any other depleted cod stock in the
North Atlantic during the last few decades. This paper investigates relative impacts of changes in
different ecological and management-related drivers, which could have contributed to the rapid
recovery of the Eastern Baltic cod. The results show that the success to reduce fishing mortality below
management target in 2008 was due to a combination of increased recruitment and improved
compliance with TAC. The reversal of the negative trend in biomass and rebuilding of the stock to
the present level were largely driven by increased recruitment. Harvest control rules of the multi-
annual management plan for setting TACs currently maintain the fishing mortality at a low level, which
allows the stock to accumulate biomass and further accelerate its recovery. Relatively strong incoming
year-classes and recently better control over removals distinguish the Eastern Baltic cod from other
depleted European cod stocks, which have not shown similar positive trends in recent years. Sound
management measures and compliance to those as well as favourable biological conditions are required
for a successful stock recovery.
& 2011 Elsevier Ltd. All rights reserved.
1. Introduction
Many of the world’s fisheries and fish stocks have declined inrecent decades, at least partly due to overfishing. Rebuildingdepleted fish populations to the levels where they can producemaximum sustainable yields is a global imperative emerging fromthe World Summit on Sustainable Development in Johannesburgin 2002, and this target has been given a deadline of 2015 [1]. TheEuropean Commission recently recognised that 88% of Europeanfish stocks are fished beyond the level corresponding to max-imum sustainable yield and 30% of these stocks are outside safebiological limits [2]. Recovery plans have been implemented for anumber of depleted stocks in different parts of the world includ-ing Europe, but with variable success [3–5]. Each example wherea stock recovery has taken place can therefore provide somevaluable insights to what is required to reverse declining trends infish populations and enable them to recover to sustainable levels.
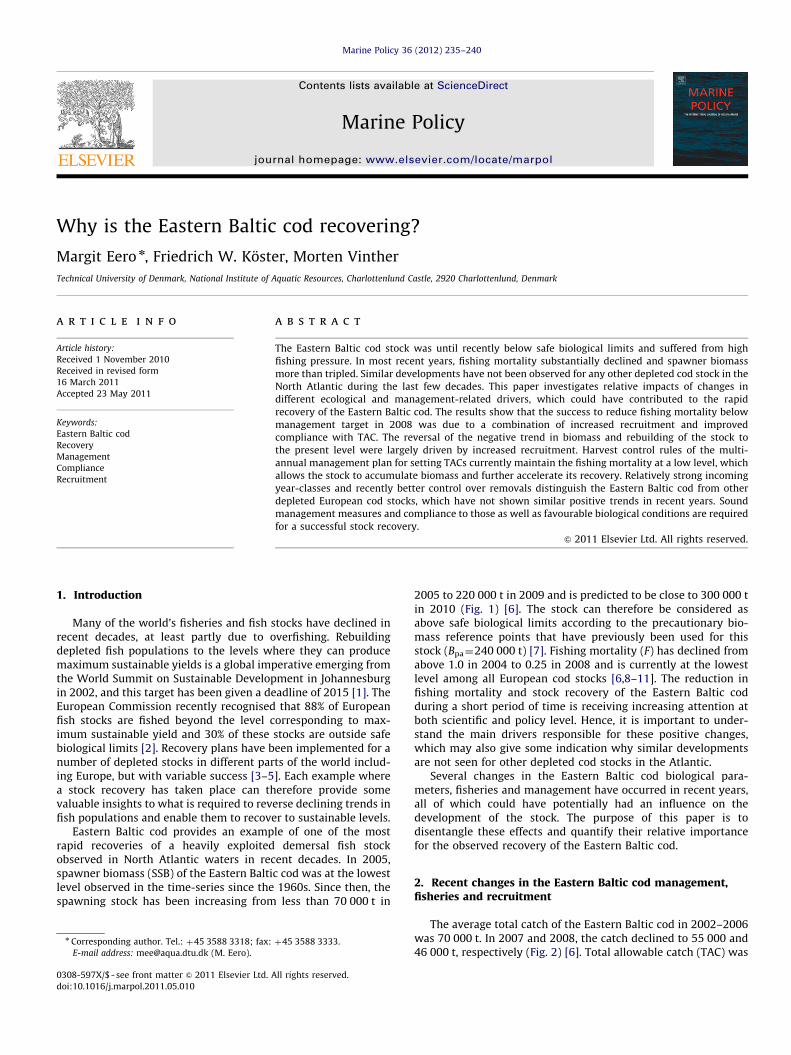
Eastern Baltic cod provides an example of one of the mostrapid recoveries of a heavily exploited demersal fish stockobserved in North Atlantic waters in recent decades. In 2005,spawner biomass (SSB) of the Eastern Baltic cod was at the lowestlevel observed in the time-series since the 1960s. Since then, thespawning stock has been increasing from less than 70 000 t in
ll rights reserved.
þ45 3588 3333.
2005 to 220 000 t in 2009 and is predicted to be close to 300 000 tin 2010 (Fig. 1) [6]. The stock can therefore be considered asabove safe biological limits according to the precautionary bio-mass reference points that have previously been used for thisstock (Bpa¼240 000 t) [7]. Fishing mortality (F) has declined fromabove 1.0 in 2004 to 0.25 in 2008 and is currently at the lowestlevel among all European cod stocks [6,8–11]. The reduction infishing mortality and stock recovery of the Eastern Baltic codduring a short period of time is receiving increasing attention atboth scientific and policy level. Hence, it is important to under-stand the main drivers responsible for these positive changes,which may also give some indication why similar developmentsare not seen for other depleted cod stocks in the Atlantic.
Several changes in the Eastern Baltic cod biological para-meters, fisheries and management have occurred in recent years,all of which could have potentially had an influence on thedevelopment of the stock. The purpose of this paper is todisentangle these effects and quantify their relative importancefor the observed recovery of the Eastern Baltic cod.
2. Recent changes in the Eastern Baltic cod management,fisheries and recruitment
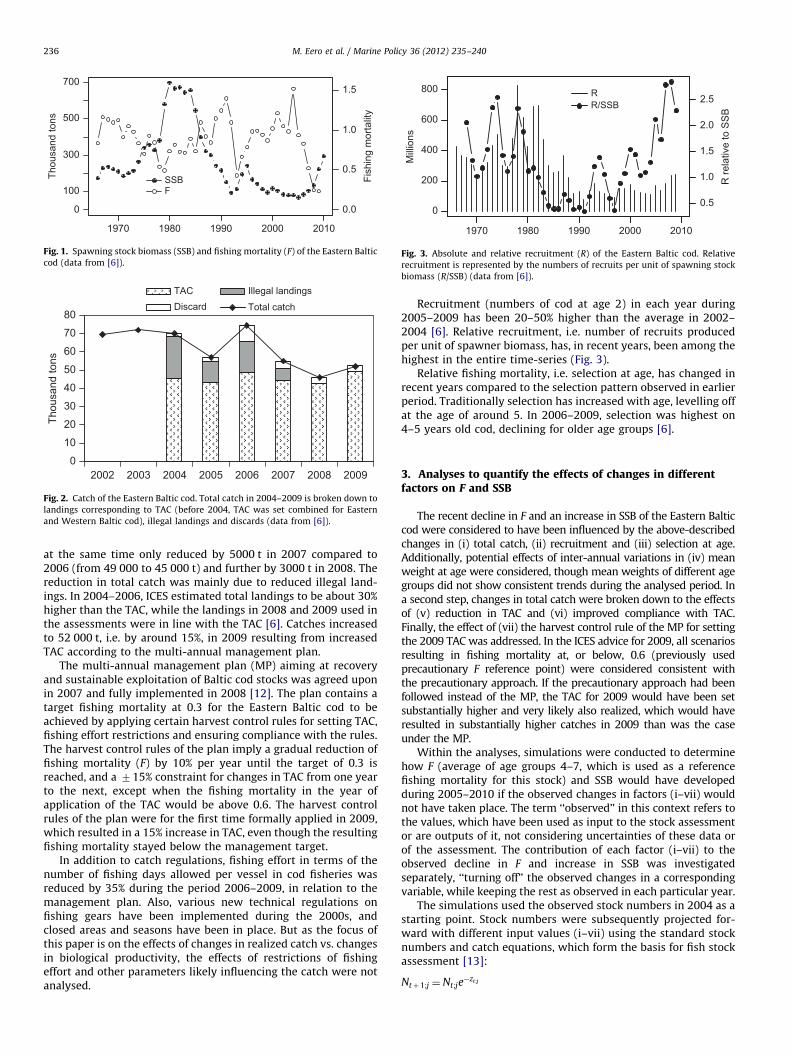
The average total catch of the Eastern Baltic cod in 2002–2006was 70 000 t. In 2007 and 2008, the catch declined to 55 000 and46 000 t, respectively (Fig. 2) [6]. Total allowable catch (TAC) was
1980
0
Thou
sand
tons
1970
Fish
ing
mor
talit
y
0.0
SSBF
1990 2000 2010
0.5
1.0
1.5
100
300
500
700
Fig. 1. Spawning stock biomass (SSB) and fishing mortality (F) of the Eastern Baltic
cod (data from [6]).
0
10
20
30
40
50
60
70
80
2002
Thou
sand
tons
TAC Illegal landingsDiscard Total catch
2003 2004 2005 2006 2007 2008 2009
Fig. 2. Catch of the Eastern Baltic cod. Total catch in 2004–2009 is broken down to
landings corresponding to TAC (before 2004, TAC was set combined for Eastern
and Western Baltic cod), illegal landings and discards (data from [6]).
1970
0
Mill
ions
R re
lativ
e to
SS
B
0.5
RR/SSB
200
400
600
800
1980 1990 2000 2010
1.0
1.5
2.0
2.5
Fig. 3. Absolute and relative recruitment (R) of the Eastern Baltic cod. Relative
recruitment is represented by the numbers of recruits per unit of spawning stock
biomass (R/SSB) (data from [6]).
M. Eero et al. / Marine Policy 36 (2012) 235–240236
at the same time only reduced by 5000 t in 2007 compared to2006 (from 49 000 to 45 000 t) and further by 3000 t in 2008. Thereduction in total catch was mainly due to reduced illegal land-ings. In 2004–2006, ICES estimated total landings to be about 30%higher than the TAC, while the landings in 2008 and 2009 used inthe assessments were in line with the TAC [6]. Catches increasedto 52 000 t, i.e. by around 15%, in 2009 resulting from increasedTAC according to the multi-annual management plan.
The multi-annual management plan (MP) aiming at recoveryand sustainable exploitation of Baltic cod stocks was agreed uponin 2007 and fully implemented in 2008 [12]. The plan contains atarget fishing mortality at 0.3 for the Eastern Baltic cod to beachieved by applying certain harvest control rules for setting TAC,fishing effort restrictions and ensuring compliance with the rules.The harvest control rules of the plan imply a gradual reduction offishing mortality (F) by 10% per year until the target of 0.3 isreached, and a 715% constraint for changes in TAC from one yearto the next, except when the fishing mortality in the year ofapplication of the TAC would be above 0.6. The harvest controlrules of the plan were for the first time formally applied in 2009,which resulted in a 15% increase in TAC, even though the resultingfishing mortality stayed below the management target.
In addition to catch regulations, fishing effort in terms of thenumber of fishing days allowed per vessel in cod fisheries wasreduced by 35% during the period 2006–2009, in relation to themanagement plan. Also, various new technical regulations onfishing gears have been implemented during the 2000s, andclosed areas and seasons have been in place. But as the focus ofthis paper is on the effects of changes in realized catch vs. changesin biological productivity, the effects of restrictions of fishingeffort and other parameters likely influencing the catch were notanalysed.
Recruitment (numbers of cod at age 2) in each year during2005–2009 has been 20–50% higher than the average in 2002–2004 [6]. Relative recruitment, i.e. number of recruits producedper unit of spawner biomass, has, in recent years, been among thehighest in the entire time-series (Fig. 3).
Relative fishing mortality, i.e. selection at age, has changed inrecent years compared to the selection pattern observed in earlierperiod. Traditionally selection has increased with age, levelling offat the age of around 5. In 2006–2009, selection was highest on4–5 years old cod, declining for older age groups [6].
3. Analyses to quantify the effects of changes in differentfactors on F and SSB
The recent decline in F and an increase in SSB of the Eastern Balticcod were considered to have been influenced by the above-describedchanges in (i) total catch, (ii) recruitment and (iii) selection at age.Additionally, potential effects of inter-annual variations in (iv) meanweight at age were considered, though mean weights of different agegroups did not show consistent trends during the analysed period. Ina second step, changes in total catch were broken down to the effectsof (v) reduction in TAC and (vi) improved compliance with TAC.Finally, the effect of (vii) the harvest control rule of the MP for settingthe 2009 TAC was addressed. In the ICES advice for 2009, all scenariosresulting in fishing mortality at, or below, 0.6 (previously usedprecautionary F reference point) were considered consistent withthe precautionary approach. If the precautionary approach had beenfollowed instead of the MP, the TAC for 2009 would have been setsubstantially higher and very likely also realized, which would haveresulted in substantially higher catches in 2009 than was the caseunder the MP.
Within the analyses, simulations were conducted to determinehow F (average of age groups 4–7, which is used as a referencefishing mortality for this stock) and SSB would have developedduring 2005–2010 if the observed changes in factors (i–vii) wouldnot have taken place. The term ‘‘observed’’ in this context refers tothe values, which have been used as input to the stock assessmentor are outputs of it, not considering uncertainties of these data orof the assessment. The contribution of each factor (i–vii) to theobserved decline in F and increase in SSB was investigatedseparately, ‘‘turning off’’ the observed changes in a correspondingvariable, while keeping the rest as observed in each particular year.
The simulations used the observed stock numbers in 2004 as astarting point. Stock numbers were subsequently projected for-ward with different input values (i–vii) using the standard stocknumbers and catch equations, which form the basis for fish stockassessment [13]:
Ntþ1;j ¼Nt;je�zt;j
M. Eero et al. / Marine Policy 36 (2012) 235–240 237
where N is the number of individuals of age j and year t and z isthe total mortality of age j (due to age-specific exploitation, Fj, andnatural mortality, Mj; z¼FþM).
The numbers of fish removed by fishing are represented by
Ct;j ¼Ft;j
Ft;jþMt;j
� �Nð1�e�zt;j tÞ
where C is the catch in numbers of fish at age j and year t [13].To simulate a situation without an observed recent change in
one of the factors (i–vii), the following values were applied forcorresponding variables:
i)
Fig. 4proje
age (
total catch (in weight) in 2007–2009 was set to the averagelevel observed in 2002–2006 (68 000 t);
ii)
recruitment (age 2) for each year in 2005–2009 was set to theaverage level observed in 2000–2004 (130 millions);iii)
selection pattern (relative F at age) in 2006–2009 was set tothe average observed in 2003–2005;iv)
weight at age, both in the catch and in the stock in 2005–2009,was set to the average observed in 2002–2004;v)
TAC of 2006 (49 000 t) was applied for 2007–2009, assumingobserved annual proportions of illegal landings and discards;vi)
the proportion of illegal landings in 2007–2009 was set to theaverage level estimated for 2004–2006 (27%); TAC andproportion of discards for each year were applied as observedandvii)
catch in 2009 was set to correspond to fishing mortality at 0.6(previously used precautionary reference point).In order to demonstrate the combined influence of changes inmainly naturally driven processes in comparison with the effectof catch regulations, an additional simulation was conductedwhere recruitment, weight at age and selection (ii–iv) weresimultaneously set to the values specified above, while keepingthe total catch as observed in each individual year.
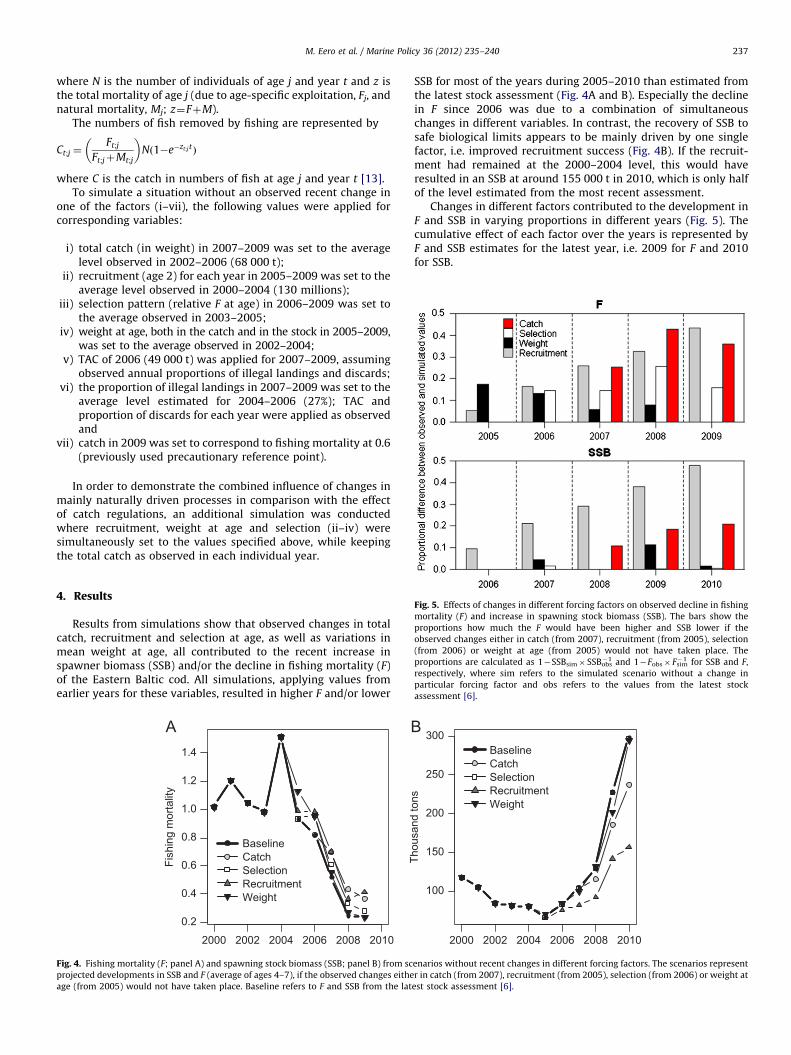
Fig. 5. Effects of changes in different forcing factors on observed decline in fishing
mortality (F) and increase in spawning stock biomass (SSB). The bars show the
proportions how much the F would have been higher and SSB lower if the
observed changes either in catch (from 2007), recruitment (from 2005), selection
(from 2006) or weight at age (from 2005) would not have taken place. The
proportions are calculated as 1�SSBsim� SSBobs�1 and 1�Fobs� Fsim
�1 for SSB and F,
respectively, where sim refers to the simulated scenario without a change in
particular forcing factor and obs refers to the values from the latest stock
assessment [6].
4. Results
Results from simulations show that observed changes in totalcatch, recruitment and selection at age, as well as variations inmean weight at age, all contributed to the recent increase inspawner biomass (SSB) and/or the decline in fishing mortality (F)of the Eastern Baltic cod. All simulations, applying values fromearlier years for these variables, resulted in higher F and/or lower
2000
0.2
Fish
ing
mor
talit
y
BaselineCatchSelectionRecruitmentWeight0.4
0.6
0.8
1.0
1.2
1.4
2002 2004 2006 2008 2010
. Fishing mortality (F; panel A) and spawning stock biomass (SSB; panel B) from sc
cted developments in SSB and F (average of ages 4–7), if the observed changes eithe
from 2005) would not have taken place. Baseline refers to F and SSB from the lat
SSB for most of the years during 2005–2010 than estimated fromthe latest stock assessment (Fig. 4A and B). Especially the declinein F since 2006 was due to a combination of simultaneouschanges in different variables. In contrast, the recovery of SSB tosafe biological limits appears to be mainly driven by one singlefactor, i.e. improved recruitment success (Fig. 4B). If the recruit-ment had remained at the 2000–2004 level, this would haveresulted in an SSB at around 155 000 t in 2010, which is only halfof the level estimated from the most recent assessment.
Changes in different factors contributed to the development inF and SSB in varying proportions in different years (Fig. 5). Thecumulative effect of each factor over the years is represented byF and SSB estimates for the latest year, i.e. 2009 for F and 2010for SSB.
2000
100
Thou
sand
tons
BaselineCatchSelectionRecruitmentWeight
150
200
250
300
2002 2004 2006 2008 2010
enarios without recent changes in different forcing factors. The scenarios represent
r in catch (from 2007), recruitment (from 2005), selection (from 2006) or weight at
est stock assessment [6].
M. Eero et al. / Marine Policy 36 (2012) 235–240238
Increased recruitment and reduced catch were the mainfactors, which equally contributed to the decline in F to thepresent low level, whereas the effect of recruitment continuouslyincreased with years. If the observed changes in either recruit-ment or catch had not taken place, F in 2009 would in either casehave been about 40% higher than estimated from the latest stockassessment (Fig. 5). If the selection pattern would not havechanged towards higher selection of younger ages, referencefishing mortality (average of ages 4–7) in 2009 would have beenabout 15% higher than that is currently estimated from theassessment. Observed variability in mean weight at age in thecatch reduced the F by around 15% in 2005–2006, but had less oralmost no influence on F in later years (Fig. 5). The increasingeffect of recruitment with years is particularly apparent withrespect to SSB. Recruitment has clearly been the main factorresponsible for a continuous increase in SSB during 2006–2010(Fig. 5). The increased recruitment had twice as much influence ofthe SSB in 2010 compared to reduced catch, while variability inweight at age and selection had only minor effects on SSB insome years.
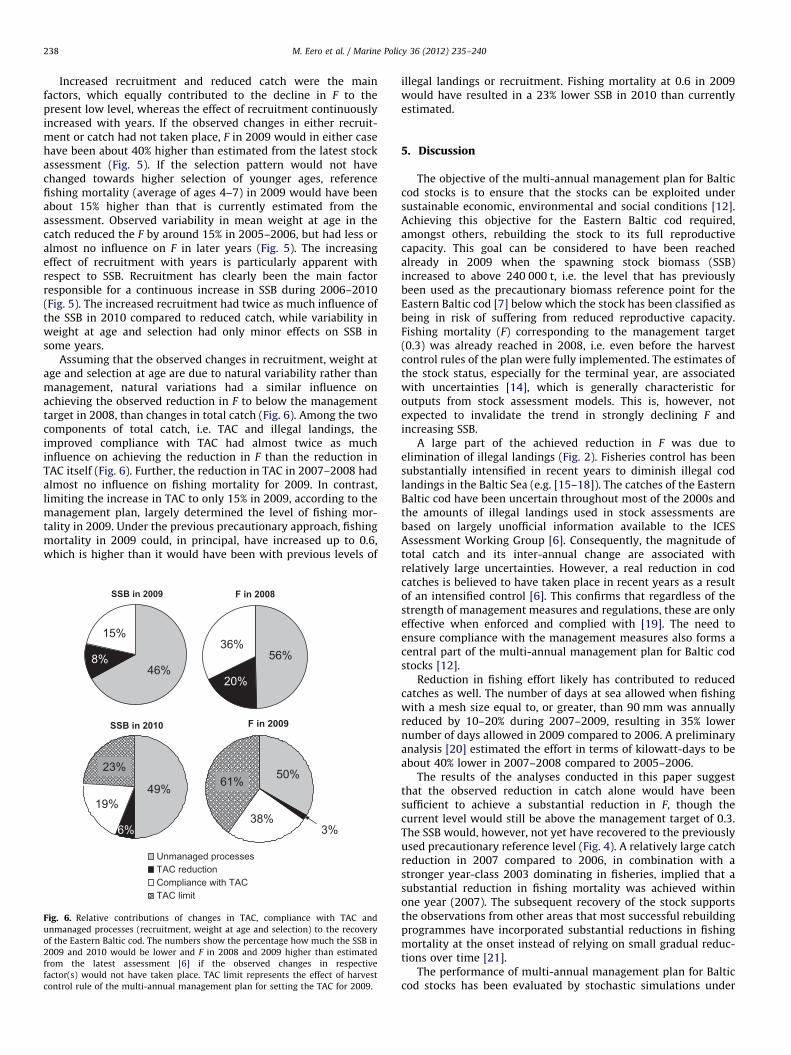
Assuming that the observed changes in recruitment, weight atage and selection at age are due to natural variability rather thanmanagement, natural variations had a similar influence onachieving the observed reduction in F to below the managementtarget in 2008, than changes in total catch (Fig. 6). Among the twocomponents of total catch, i.e. TAC and illegal landings, theimproved compliance with TAC had almost twice as muchinfluence on achieving the reduction in F than the reduction inTAC itself (Fig. 6). Further, the reduction in TAC in 2007–2008 hadalmost no influence on fishing mortality for 2009. In contrast,limiting the increase in TAC to only 15% in 2009, according to themanagement plan, largely determined the level of fishing mor-tality in 2009. Under the previous precautionary approach, fishingmortality in 2009 could, in principal, have increased up to 0.6,which is higher than it would have been with previous levels of
F in 2008SSB in 2009
46%8%
15%
56%36%
20%
F in 2009SSB in 2010
49%
6%
19%
23% 50%
38%
61%
3%
Unmanaged processesTAC reductionCompliance with TACTAC limit
Fig. 6. Relative contributions of changes in TAC, compliance with TAC and
unmanaged processes (recruitment, weight at age and selection) to the recovery
of the Eastern Baltic cod. The numbers show the percentage how much the SSB in
2009 and 2010 would be lower and F in 2008 and 2009 higher than estimated
from the latest assessment [6] if the observed changes in respective
factor(s) would not have taken place. TAC limit represents the effect of harvest
control rule of the multi-annual management plan for setting the TAC for 2009.
illegal landings or recruitment. Fishing mortality at 0.6 in 2009would have resulted in a 23% lower SSB in 2010 than currentlyestimated.
5. Discussion
The objective of the multi-annual management plan for Balticcod stocks is to ensure that the stocks can be exploited undersustainable economic, environmental and social conditions [12].Achieving this objective for the Eastern Baltic cod required,amongst others, rebuilding the stock to its full reproductivecapacity. This goal can be considered to have been reachedalready in 2009 when the spawning stock biomass (SSB)increased to above 240 000 t, i.e. the level that has previouslybeen used as the precautionary biomass reference point for theEastern Baltic cod [7] below which the stock has been classified asbeing in risk of suffering from reduced reproductive capacity.Fishing mortality (F) corresponding to the management target(0.3) was already reached in 2008, i.e. even before the harvestcontrol rules of the plan were fully implemented. The estimates ofthe stock status, especially for the terminal year, are associatedwith uncertainties [14], which is generally characteristic foroutputs from stock assessment models. This is, however, notexpected to invalidate the trend in strongly declining F andincreasing SSB.
A large part of the achieved reduction in F was due toelimination of illegal landings (Fig. 2). Fisheries control has beensubstantially intensified in recent years to diminish illegal codlandings in the Baltic Sea (e.g. [15–18]). The catches of the EasternBaltic cod have been uncertain throughout most of the 2000s andthe amounts of illegal landings used in stock assessments arebased on largely unofficial information available to the ICESAssessment Working Group [6]. Consequently, the magnitude oftotal catch and its inter-annual change are associated withrelatively large uncertainties. However, a real reduction in codcatches is believed to have taken place in recent years as a resultof an intensified control [6]. This confirms that regardless of thestrength of management measures and regulations, these are onlyeffective when enforced and complied with [19]. The need toensure compliance with the management measures also forms acentral part of the multi-annual management plan for Baltic codstocks [12].
Reduction in fishing effort likely has contributed to reducedcatches as well. The number of days at sea allowed when fishingwith a mesh size equal to, or greater, than 90 mm was annuallyreduced by 10–20% during 2007–2009, resulting in 35% lowernumber of days allowed in 2009 compared to 2006. A preliminaryanalysis [20] estimated the effort in terms of kilowatt-days to beabout 40% lower in 2007–2008 compared to 2005–2006.
The results of the analyses conducted in this paper suggestthat the observed reduction in catch alone would have beensufficient to achieve a substantial reduction in F, though thecurrent level would still be above the management target of 0.3.The SSB would, however, not yet have recovered to the previouslyused precautionary reference level (Fig. 4). A relatively large catchreduction in 2007 compared to 2006, in combination with astronger year-class 2003 dominating in fisheries, implied that asubstantial reduction in fishing mortality was achieved withinone year (2007). The subsequent recovery of the stock supportsthe observations from other areas that most successful rebuildingprogrammes have incorporated substantial reductions in fishingmortality at the onset instead of relying on small gradual reduc-tions over time [21].
The performance of multi-annual management plan for Balticcod stocks has been evaluated by stochastic simulations under
1.0
0.5
0.0
-0.5
-1.0
2.0
1.5
1.0
0.5
0.0
-0.5
-1.0
1.0Recruitment
Mortality
SSB
Pro
porti
on o
f cha
nge
Pro
porti
on o
f cha
nge
M. Eero et al. / Marine Policy 36 (2012) 235–240 239
different sources of uncertainties and stock–recruitment relation-ships [22]. This evaluation concluded that the plan is likely toreach precautionary targets for the Eastern Baltic cod by 2015even at a low average recruitment as observed in previous twodecades. However, the level of SSB projected for 2015 was lowerthan currently estimated for 2010 from the most recent stockassessment. The realized recovery of the Eastern Baltic cod hasthus been considerably faster than projected, assuming previouslow recruitment [22]. This confirms that the applied stock–recruitment relationship is the major driver of stock dynamicsand determines the probability of Eastern Baltic cod stockrecovery [7].
The relatively high recruitment in most recent years, mainlybeing responsible for the rapid recovery of the Eastern Baltic cod,is still only about a half of the average recruitment level observedin the 1960–1980s. But in relative terms, the recruitment wasoutstandingly high, especially when considering the low SSB,which originated these year-classes (Fig. 3). Thus, the exampleof the Eastern Baltic cod supports the earlier findings thatrecovery of a stock is generally more likely at positive recruitmentevents related to favourable productivity regimes [3,23,24]. Theobserved high recruitment production per unit of SSB of theEastern Baltic cod stock in most recent years is likely related to acomplex of environmental and/or ecological processes, whichaffect reproduction and survival of early and juvenile life stages[25]. Fisheries could potentially influence the survival of pre-recruit cod as well, mainly through discarding. Discarding ofyoung cod in the Eastern Baltic has indeed reduced in the mid-2000s [6] due to introduction of a more selective trawl [26,27].However, available discard data suggest the numbers of coddiscarded as age 1 being relatively low also prior to the recentdecline in discarding (around 2% of the recruitment).
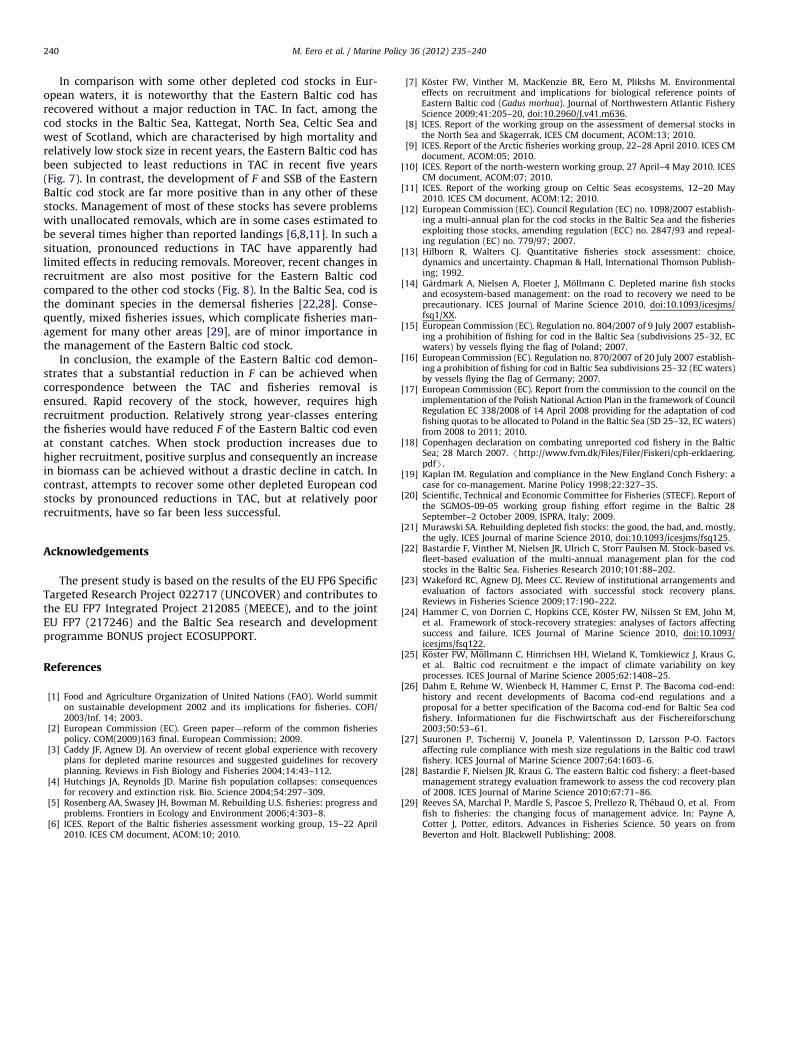
Larger incoming year-classes are likely to be responsible forthe recent change in selection pattern towards higher selection ofcod at age groups 4–5. A number of new regulations on fishinggears have been implemented in the period since 2002 [27]. Theseare, however, mostly expected to influence the selection of youngcod, and not the selection pattern of older fish. A fact that likelycontributed to a change in selection pattern was a reduction inthe proportion of cod landings taken by gill-netters, whichgenerally catch a relatively larger proportion of older cod [6]. In2005, around 40% of the Eastern Baltic cod landings were taken bygill-netters; this proportion was reduced to 30% by 2009. Despiteits effect on the average F, the change in selection pattern had nomeasurable effect on the spawning stock biomass (Figs. 4 and 5).
Year2004
Rel
ativ
e ch
ange
in T
AC
0.2
0.4
0.6
0.8
1.0
1.2
cod-2532 cod-2224 cod-kat cod-nsea cod-scow cod-iris
2005 2006 2007 2008 2009
Fig. 7. Changes in the TAC of some selected cod stocks in 2005–2009 relative to
the TAC in 2004. Acronyms denote cod in the Eastern Baltic (cod-2532), Western
Baltic (cod-2224), Kattegat (cod-kat), North Sea (cod-nsea), west of Scotland
(cod-scow) and Irish Sea (cod-iris).
Large reductions in catch at the start of the recovery processhave often played a key role in the ability of a fish population torecover [23,24]. In relation to this, the rapid recovery of theEastern Baltic cod is exceptional as catches were not drasticallyreduced in this period and only to the extent corresponding toillegal fisheries. Reducing TAC did not contribute significantly tothe reversal of the negative biomass trend and recovering thestock to above safe biological limits by 2009. However, theharvest control rules for setting TAC under the management plancontributed substantially to rebuilding of the stock from 2009onwards. The relatively low target F and the 15% constraint forinter-annual changes in TAC prevented an immediate increase infisheries removals in reaction to the increased biological produc-tion, and thereby allowed the stock to accumulate biomass, giventhat compliance with the TAC was ensured.
0.5
0.0
-0.5
-1.0
Pro
porti
on o
f cha
nge
cod-
2532
cod-
2224
cod-
Kat
cod-
nsea
cod-
scow
cod-
iris
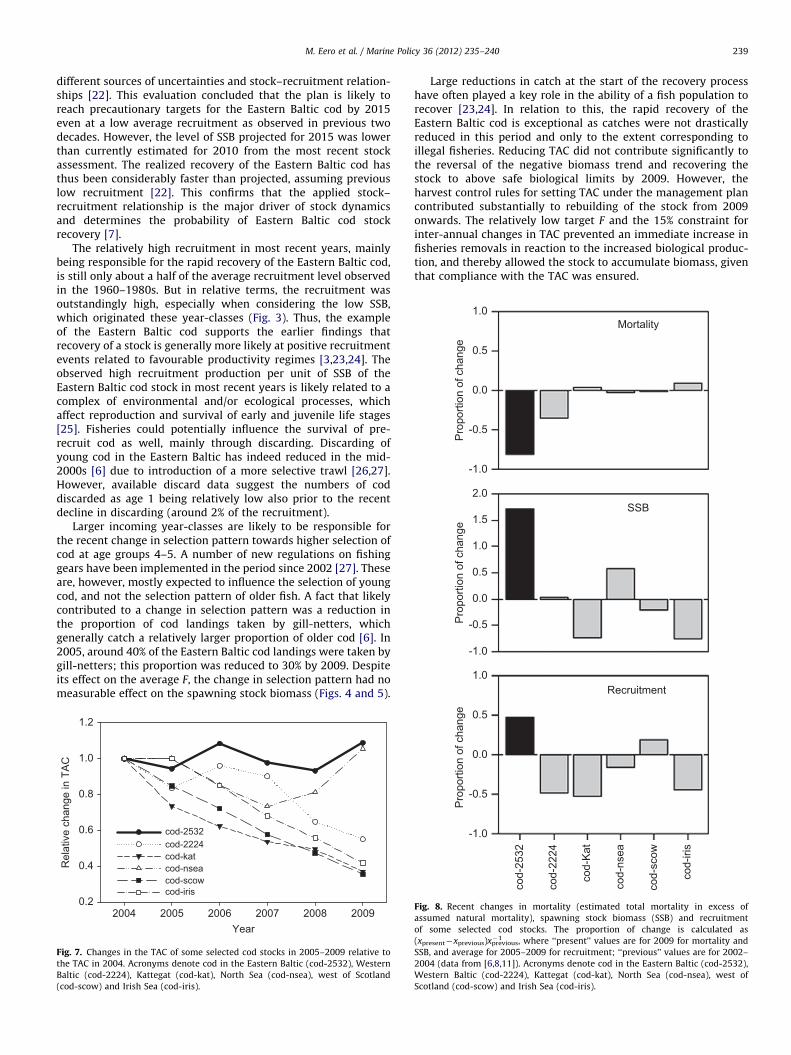
Fig. 8. Recent changes in mortality (estimated total mortality in excess of
assumed natural mortality), spawning stock biomass (SSB) and recruitment
of some selected cod stocks. The proportion of change is calculated as
(xpresent�xprevious)xprevious�1 , where ‘‘present’’ values are for 2009 for mortality and
SSB, and average for 2005–2009 for recruitment; ‘‘previous’’ values are for 2002–
2004 (data from [6,8,11]). Acronyms denote cod in the Eastern Baltic (cod-2532),
Western Baltic (cod-2224), Kattegat (cod-kat), North Sea (cod-nsea), west of
Scotland (cod-scow) and Irish Sea (cod-iris).
M. Eero et al. / Marine Policy 36 (2012) 235–240240
In comparison with some other depleted cod stocks in Eur-opean waters, it is noteworthy that the Eastern Baltic cod hasrecovered without a major reduction in TAC. In fact, among thecod stocks in the Baltic Sea, Kattegat, North Sea, Celtic Sea andwest of Scotland, which are characterised by high mortality andrelatively low stock size in recent years, the Eastern Baltic cod hasbeen subjected to least reductions in TAC in recent five years(Fig. 7). In contrast, the development of F and SSB of the EasternBaltic cod stock are far more positive than in any other of thesestocks. Management of most of these stocks has severe problemswith unallocated removals, which are in some cases estimated tobe several times higher than reported landings [6,8,11]. In such asituation, pronounced reductions in TAC have apparently hadlimited effects in reducing removals. Moreover, recent changes inrecruitment are also most positive for the Eastern Baltic codcompared to the other cod stocks (Fig. 8). In the Baltic Sea, cod isthe dominant species in the demersal fisheries [22,28]. Conse-quently, mixed fisheries issues, which complicate fisheries man-agement for many other areas [29], are of minor importance inthe management of the Eastern Baltic cod stock.
In conclusion, the example of the Eastern Baltic cod demon-strates that a substantial reduction in F can be achieved whencorrespondence between the TAC and fisheries removal isensured. Rapid recovery of the stock, however, requires highrecruitment production. Relatively strong year-classes enteringthe fisheries would have reduced F of the Eastern Baltic cod evenat constant catches. When stock production increases due tohigher recruitment, positive surplus and consequently an increasein biomass can be achieved without a drastic decline in catch. Incontrast, attempts to recover some other depleted European codstocks by pronounced reductions in TAC, but at relatively poorrecruitments, have so far been less successful.
Acknowledgements
The present study is based on the results of the EU FP6 SpecificTargeted Research Project 022717 (UNCOVER) and contributes tothe EU FP7 Integrated Project 212085 (MEECE), and to the jointEU FP7 (217246) and the Baltic Sea research and developmentprogramme BONUS project ECOSUPPORT.
References
[1] Food and Agriculture Organization of United Nations (FAO). World summiton sustainable development 2002 and its implications for fisheries. COFI/2003/Inf. 14; 2003.
[2] European Commission (EC). Green paper—reform of the common fisheriespolicy. COM(2009)163 final. European Commission; 2009.
[3] Caddy JF, Agnew DJ. An overview of recent global experience with recoveryplans for depleted marine resources and suggested guidelines for recoveryplanning. Reviews in Fish Biology and Fisheries 2004;14:43–112.
[4] Hutchings JA, Reynolds JD. Marine fish population collapses: consequencesfor recovery and extinction risk. Bio. Science 2004;54:297–309.
[5] Rosenberg AA, Swasey JH, Bowman M. Rebuilding U.S. fisheries: progress andproblems. Frontiers in Ecology and Environment 2006;4:303–8.
[6] ICES. Report of the Baltic fisheries assessment working group, 15–22 April2010. ICES CM document, ACOM:10; 2010.
[7] Koster FW, Vinther M, MacKenzie BR, Eero M, Plikshs M. Environmentaleffects on recruitment and implications for biological reference points ofEastern Baltic cod (Gadus morhua). Journal of Northwestern Atlantic FisheryScience 2009;41:205–20, doi:10.2960/J.v41.m636.
[8] ICES. Report of the working group on the assessment of demersal stocks inthe North Sea and Skagerrak, ICES CM document, ACOM:13; 2010.
[9] ICES. Report of the Arctic fisheries working group, 22–28 April 2010. ICES CMdocument, ACOM:05; 2010.
[10] ICES. Report of the north-western working group, 27 April–4 May 2010. ICESCM document, ACOM:07; 2010.
[11] ICES. Report of the working group on Celtic Seas ecosystems, 12–20 May2010. ICES CM document, ACOM:12; 2010.
[12] European Commission (EC). Council Regulation (EC) no. 1098/2007 establish-ing a multi-annual plan for the cod stocks in the Baltic Sea and the fisheriesexploiting those stocks, amending regulation (ECC) no. 2847/93 and repeal-ing regulation (EC) no. 779/97; 2007.
[13] Hilborn R, Walters CJ. Quantitative fisheries stock assessment: choice,dynamics and uncertainty. Chapman & Hall, International Thomson Publish-ing; 1992.
[14] Gardmark A, Nielsen A, Floeter J, Mollmann C. Depleted marine fish stocksand ecosystem-based management: on the road to recovery we need to beprecautionary. ICES Journal of Marine Science 2010, doi:10.1093/icesjms/fsq1/XX.
[15] European Commission (EC). Regulation no. 804/2007 of 9 July 2007 establish-ing a prohibition of fishing for cod in the Baltic Sea (subdivisions 25–32, ECwaters) by vessels flying the flag of Poland; 2007.
[16] European Commission (EC). Regulation no. 870/2007 of 20 July 2007 establish-ing a prohibition of fishing for cod in Baltic Sea subdivisions 25–32 (EC waters)by vessels flying the flag of Germany; 2007.
[17] European Commission (EC). Report from the commission to the council on theimplementation of the Polish National Action Plan in the framework of CouncilRegulation EC 338/2008 of 14 April 2008 providing for the adaptation of codfishing quotas to be allocated to Poland in the Baltic Sea (SD 25–32, EC waters)from 2008 to 2011; 2010.
[18] Copenhagen declaration on combating unreported cod fishery in the BalticSea; 28 March 2007. /http://www.fvm.dk/Files/Filer/Fiskeri/cph-erklaering.pdfS.
[19] Kaplan IM. Regulation and compliance in the New England Conch Fishery: acase for co-management. Marine Policy 1998;22:327–35.
[20] Scientific, Technical and Economic Committee for Fisheries (STECF). Report ofthe SGMOS-09-05 working group fishing effort regime in the Baltic 28September–2 October 2009, ISPRA, Italy; 2009.
[21] Murawski SA. Rebuilding depleted fish stocks: the good, the bad, and, mostly,the ugly. ICES Journal of marine Science 2010, doi:10.1093/icesjms/fsq125.
[22] Bastardie F, Vinther M, Nielsen JR, Ulrich C, Storr Paulsen M. Stock-based vs.fleet-based evaluation of the multi-annual management plan for the codstocks in the Baltic Sea. Fisheries Research 2010;101:88–202.
[23] Wakeford RC, Agnew DJ, Mees CC. Review of institutional arrangements andevaluation of factors associated with successful stock recovery plans.Reviews in Fisheries Science 2009;17:190–222.
[24] Hammer C, von Dorrien C, Hopkins CCE, Koster FW, Nilssen St EM, John M,et al. Framework of stock-recovery strategies: analyses of factors affectingsuccess and failure. ICES Journal of Marine Science 2010, doi:10.1093/icesjms/fsq122.
[25] Koster FW, Mollmann C, Hinrichsen HH, Wieland K, Tomkiewicz J, Kraus G,et al. Baltic cod recruitment e the impact of climate variability on keyprocesses. ICES Journal of Marine Science 2005;62:1408–25.
[26] Dahm E, Rehme W, Wienbeck H, Hammer C, Ernst P. The Bacoma cod-end:history and recent developments of Bacoma cod-end regulations and aproposal for a better specification of the Bacoma cod-end for Baltic Sea codfishery. Informationen fur die Fischwirtschaft aus der Fischereiforschung2003;50:53–61.
[27] Suuronen P, Tschernij V, Jounela P, Valentinsson D, Larsson P-O. Factorsaffecting rule compliance with mesh size regulations in the Baltic cod trawlfishery. ICES Journal of Marine Science 2007;64:1603–6.
[28] Bastardie F, Nielsen JR, Kraus G. The eastern Baltic cod fishery: a fleet-basedmanagement strategy evaluation framework to assess the cod recovery planof 2008. ICES Journal of Marine Science 2010;67:71–86.
[29] Reeves SA, Marchal P, Mardle S, Pascoe S, Prellezo R, Thebaud O, et al. Fromfish to fisheries: the changing focus of management advice. In: Payne A,Cotter J, Potter, editors. Advances in Fisheries Science. 50 years on fromBeverton and Holt. Blackwell Publishing; 2008.