Embed Size (px)
Citation preview

Why
Full Report 2015
Local GovernmentMatters

Acknowledgements
The research team for this report comprised
Principal researchers:
Associate Professor Roberta Ryan, Director, Australian Centre of Excellence for Local
Government (ACELG) & Centre for Local Government (CLG), University of Technology Sydney
Catherine Hastings, Research Officer, CLG, University of Technology Sydney
Ron Woods, Research Officer, CLG, University of Technology Sydney
Alex Lawrie, Research Officer, CLG, University of Technology Sydney
Dr Bligh Grant, Senior Lecturer, CLG, University of Technology Sydney
Additional researchers:
Dr Shaun Wilson, Senior Lecturer, Macquarie University
Dr Liana Wortley, Research Officer, CLG, University of Technology Sydney
Dr Éidín O’Shea, Research Officer, CLG, University of Technology Sydney
Sasindu Gamage, Research Assistant, CLG, University of Technology Sydney
Theresa Alvarez, CLG, University of Technology Sydney
The research team acknowledges the valuable contribution of the ACELG Research Advisory
Committee and ACELG as the funding body for this research and the Commonwealth Government
as the ACELG funding body.
Citing this report
Ryan, R., Hastings, C., Woods., R., Lawrie, A., Grant, B. 2015 Why Local Government Matters:
Summary Report 2015 Australian Centre of Excellence for Local Government, University of
Technology Sydney Australia
Published JUNE 2015 Document version 1.0
This work is licensed under the Creative Commons Attribution-Non-commercial 4.0 International
License. To view a copy of this license, visit http://creativecommons.org/licenses/by-nc/4.0/.

MESSAGE FROM THE MINISTER
As a councillor for 14 years before entering the Federal Parliament, I know
first-hand the great honour it is to serve the community at the level of
government closest to them. I also understand the pressures and complexity
of the issues councils seek to resolve.
Local government plays a critical role in maintaining and developing the social
and economic fabric of regions, bringing communities together and producing
local solutions to local problems.
There is now a once in a generation opportunity for us to rethink the way we
as governments do business and serve our communities. The Government is
providing the forum to discuss change through our White Papers on the
Reform of the Federation and Taxation.
Our Federation has served our nation well for over 100 years and has shown
some flexibility to deal with issues of concern over the years. But the balance
of constitutional responsibility and revenue raising capability has becoming
increasingly grotesque.
Reforming the Federation is vital if we are to deliver our publicly funded
services to the Australian people more effectively, more efficiently and more
fairly.
The Australian Government is investing a record $50 billion across Australia to
deliver vital infrastructure communities need to secure a prosperous future.
Our infrastructure commitments are not limited to big ticket items, but also
deliver for every local government in Australia.
To support Local Government deliver productive infrastructure that will drive
local growth, this Government is delivering billions of dollars through various
funding programmes including:
• $9.45 billion in Financial Assistance Grants;
• The $2.1 billion Roads to Recovery Programme;
• The $1 billion National Stronger Regions Fund;
• The $300 million Bridges Renewal Programme;
• An additional $200 million each for the Black Spot and Heavy Vehicle
and Safety & Productivity Programmes;
• $100 million for beef roads; and
• $45 million under the Stronger Communities Fund.
For these reasons I am delighted to introduce Why Local Government Matters.
Why Local Government Matters raises a range of issues and provides data
relevant to the future of local government to think about in the context of the
White Papers and more broadly.
The research produced by the Australian Centre of Excellence for Local
Government will support local government in its continued and significant
contribution to enhance the strength, diversity and prosperity of Australia.
I congratulate the Australian Centre of Excellence for Local Government for its
initiative and efforts in undertaking this valuable research.
The Hon Warren Truss MP
Deputy Prime Minister and
Minister for Infrastructure and Regional Development

MESSAGE FROM THE DIRECTOR
There is an acceptance by individuals and communities that local
government is always ‘there’ for a range of local needs, yet it is less clear
how citizens identify with this crucial level of government.
This national study addresses a significant gap in the sector and research
about how Australians value local government. This is an important
question for today’s polity. The findings will help more clearly define how,
where and to what extent local government can further respond to local
needs and influence broader political and public debate in Australia. Project
findings will also assist scholarly research into local government.
The project builds upon research undertaken by the Australian Centre of
Excellence for Local Government (ACELG) to provide practical support for
the local government sector across a number of themes, and utilises the
considerable experience in social survey research of UTS and its
investigators located in the Centre for Local Government.
Findings from Why Local Government Matters will be communicated in all
jurisdictions and key literature. Project results will be benchmarked with
comparable work of councils, local government organisations and
researchers, and will inform further Centre work on themes such as
sustainable governance, service delivery, leadership and community values.
I trust that the release of this research will substantially contribute to the
greater understanding of the attitudes towards local government and the
role of this tier of government in the federation and leadership of Australia.
Associate Professor Roberta Ryan
Director, Australian Centre of Excellence for Local Government and
Centre for Local Government, University of Technology, Sydney.

EXECUTIVE SUMMARY i
Executive summary
Why Local Government Matters is a major piece of social research on community attitudes to local
government undertaken by the Australian Centre of Excellence for Local Government (ACELG). The
research aims to better understand how and why the activities of local governments, and their roles
in society, are valued by communities.
The research investigates:
1. local government’s role as a ‘place shaper’ and its importance in meeting the needs of citizens
that drive their attachment to, and satisfaction with, the areas in which they live
2. the preferences of communities for how their services are delivered at the local level and the
ability of local governments to offer flexible and community specific service delivery
3. theories of governance, particularly community beliefs about big versus small government and
its role in the market, the appropriate role for the private sector in local service provision, the
preferred extent of public participation in government decision making, and preferences for the
realisation of public value
4. community knowledge of local government, ranked importance of services which can be
delivered by local government in different jurisdictions, and attitudes about amalgamation
5. the attributes of individuals which are theorised to interact with or influence their attitudes and
beliefs about each of the areas above, including demographic factors, levels of community
participation, person values and political leanings.
This report presents the main findings of the 2014 survey, stage one of a longitudinal social
research project which will also incorporate a qualitative phase in 2015.
What does place mean to people?
Local governments matter because of their roles as ‘place-shapers’ and their importance in meeting
the needs that most drive people’s attachment to, and satisfaction with, the areas in which they live.
To better understand what matters to Australians about the place – or local area – in which they live,
respondents were first asked their level of agreement with nine statements describing ways their
local area may contribute to personal identity, emotional attachment and connection to the
community.
• Australians feel strong emotional connections to the local areas in which they live,
providing them improved emotional wellbeing and a stronger sense of their personal
identity. These feelings of attachment are generally stronger for people living in rural and
remote areas, people who own their homes rather than rent, Liberal/National Coalition
voters, and those who are more active in the community. They are generally weaker for
people living in Western Australia.
• In their local area, the most important things for Australians are a safe environment, the
availability of health care, levels of water, air and noise pollution, and being able to afford
appropriate housing. There are significant differences in what is important for Australians
depending on where they live (rural/remote compared with metropolitan areas); political
affiliation; employment status; age; housing type; family type; and length of time living in
the local area.
• In general people are satisfied with the environment around them. However Australians are
less satisfied with the local economy and infrastructure than with the availability of local

EXECUTIVE SUMMARY ii
services. In general, residents of rural and remote local government areas are less satisfied
with the level of services and infrastructure in their local area.
Role of government
All governments make choices about the part they play in service delivery based on their
understanding of the role of government from an economic and ideological perspective. In order to
tease out how Australians think about some of the key arguments in this area, respondents were
asked a series of questions about service delivery, the role of government and how they wish to
participate with governments in decision-making.
• There is strong support for the role of government in service delivery, particularly in health
and education.
• Australians do not agree that the private sector or the market necessarily deliver the best
or most efficient services, although there is a moderate correlation between political
affiliation and the responses to these questions. Older Australians tend to be less
supportive of private sector models for the delivery of public services.
• There is enormous support for government to provide services that deliver a healthier and
fairer society, and for the view that decisions about services should not be made just on
value for money. Australians agree that governments should be actively seeking to deliver
public value.
• Australians believe it is important that local governments deliver a diversity of activities,
with planning for the future being amongst the most important considerations.
How do people want their services delivered?
Australians want more than just basic services from government.
• A majority of respondents agree that taxes should pay for more than basic services and
most say they are prepared to pay more taxes to receive a broader range of services. Older
Australians and those with more education are more likely to agree.
• There is strong agreement for governments to work with each other and with service
providers to provide local services.
• Public services don’t need to be delivered by government; instead there is support for
delivery of public services by a mixture of public, private and not-for-profit organisations.
Responses to these questions did differ on the basis of political affiliation, but to a surprisingly
small degree.
How do people want to be involved in government?
There is strong support for very participatory styles of democratic engagement by government with
its people. Australians want government involve them in making decisions about what services are
delivered in their local area.
• Australian communities want to be involved with government in making decisions about
how and what services should be delivered in their local area. This view is strongest among
people living in rural and remote council areas, and those who have lived longer in their
area. It is less strong for those on higher incomes and with more education.
• Good decisions are best made by involving communities, experts and government together
in the process.

EXECUTIVE SUMMARY iii
• Community and people using services are considered to have the best knowledge of what
services are needed and how they should be delivered, followed by service providers and
finally people who work in government. There are some differences in the ways these
questions were answered depending on gender, age, education, family type and council
type.
What do people think about local government?
• Australians think that local government is the best level of government to make decisions
about the local area. Residents of rural and remote areas are a little less likely to nominate
local government and more likely to nominate state government.
• Australians believe it is important that local governments deliver a diversity of activities,
with planning for the future being amongst the most important considerations. People’s
expectations about what is best delivered by local government seem to be influenced by
what is typically considered to be a role of local government in that jurisdiction.
Respondents living in rural and remote areas are generally more concerned about the consequences
of amalgamation on local representation, cost of rates and services and their sense of belonging to
the local area. People who have lived in an area longer than 10 years and who are active
participants in the community are also more likely to think that their feeling of belonging to the
area will be negatively impacted by amalgamation


1
Table of contents
Executive summary ............................................................................................................................. i
1 Introduction ............................................................................................................................... 9
1.1 Background ........................................................................................................................ 9
1.2 Research objectives ............................................................................................................ 9
1.3 Methodology .................................................................................................................... 10
Stage 1: National CATI survey Version 1 .................................................................................... 10
Stage 2: Qualitative data collection: national focus groups ........................................................ 10
Stage 3: National CATI Survey Version 2 .................................................................................... 10
Stage 4: A survey instrument for local jurisdictional or local government area use ..................... 10
1.4 Conceptual framework ...................................................................................................... 11
1.4.1 Place attachment ....................................................................................................... 11
1.4.2 Service delivery and governance ................................................................................ 12
1.5 This report ....................................................................................................................... 16
2 Literature review ....................................................................................................................... 18
2.1 Rationale and method ....................................................................................................... 18
2.2 Australian research ........................................................................................................... 18
2.3 Key themes from the literature .......................................................................................... 19
2.3.1 Knowledge of local government ................................................................................. 19
2.3.2 Attitudes toward local government ............................................................................ 20
2.3.3 Measuring the outcomes of public service delivery as citizens perceive them ............. 21
2.3.4 Skills and competencies in dealing with local councils and local issues....................... 21
2.3.5 Personal behaviour of respondents at the local level .................................................. 22
2.3.6 Additional frameworks for understanding local government ....................................... 23
2.4 Challenges in ascertaining citizens’ perceptions ................................................................ 23
2.5 Conclusion ....................................................................................................................... 24
3 Governance and service delivery preferences............................................................................. 25
3.1 Level of agreement with individual governance and service delivery statements ................. 25
3.1.1 Community participation in decision-making ............................................................ 25
3.1.2 The role of the market in service delivery .................................................................. 29
3.1.3 The role of the government in service delivery ........................................................... 32
3.1.4 Paying for services through taxation .......................................................................... 34

2
3.1.5 Who has the knowledge needed to make decisions about what services are needed in
the local area? .......................................................................................................................... 37
3.1.6 Public value ............................................................................................................... 42
3.2 Relative level of agreement across the 25 governance and service delivery statements ....... 55
4 Place attachment – emotional ................................................................................................... 56
4.1 Level of agreement with individual statements .................................................................. 56
4.1.1 Place attachment – personal Identity .......................................................................... 56
4.1.2 Place Attachment – emotional connection .................................................................. 68
4.2 Relative level of agreement across the nine emotional place attachment statements .......... 74
5 Place attachment – instrumental ............................................................................................... 76
5.1 Level of importance of each individual dimension of place attachment ............................... 76
5.2 Relative level of importance of each instrumental dimension of place attachment .............. 93
5.3 Level of satisfaction with each individual dimension of instrumental place attachment ....... 94
5.4 Relative level of satisfaction with each dimension of instrumental place attachment ......... 102
5.5 Importance and satisfaction ............................................................................................ 103
6 Local government ................................................................................................................... 104
6.1.1 Level of government best able to make decisions about the local area ..................... 104
6.1.2 Knowledge questions .............................................................................................. 104
6.1.3 Importance of tasks being done by local government ............................................... 106
6.1.4 Relative level of importance of each task being done by local government ............... 127
6.1.5 Amalgamation ......................................................................................................... 128
6.1.6 Relative perception of impact of amalgamation on respondents ............................... 134
7 The respondents .................................................................................................................... 135
7.1 Community participation and values ............................................................................... 135
7.1.1 Community participation ......................................................................................... 135
7.1.2 Community members .............................................................................................. 135
7.1.3 Important things in life ............................................................................................ 136
7.1.4 Political orientation ................................................................................................. 139
7.1.5 Freedom of choice and control ................................................................................ 140
8 Profile of the respondents....................................................................................................... 141
8.1 Demographics ................................................................................................................ 141
8.1.1 Gender .................................................................................................................... 141

3
8.1.2 Age ......................................................................................................................... 141
8.1.3 Non-English speaking background (NESB) ............................................................... 142
8.1.4 Educational qualifications ........................................................................................ 142
8.1.5 Income .................................................................................................................... 143
8.1.6 Employment status .................................................................................................. 144
8.1.7 Employment in government or not-for-profit areas ................................................. 144
8.1.8 Housing tenure ....................................................................................................... 145
8.1.9 Dwelling - type ....................................................................................................... 145
8.1.10 Household - type .................................................................................................... 146
8.1.11 Length of residency in local area ............................................................................. 146
8.1.12 Australian classification of local government ........................................................... 147
9 Works cited ............................................................................................................................ 148
Appendix A Survey instrument ................................................................................................... 152
Appendix B Table of evidence based on the literature review ...................................................... 159
Appendix C Methodology ........................................................................................................... 180
Appendix D Conceptual framework ............................................................................................ 181
Appendix E Australian classifications of local governments ........................................................ 183
TABLES
Table 1: ‘Paradigms’ of management ................................................................................................ 14
Table 2: Table of evidence – studies which focus on exploring citizen attitudes towards local
government ................................................................................................................................... 160
FIGURES
Figure 1: Extent of community participation in public value .............................................................. 15
Figure 2: Typology of measurable gaps in service provision .............................................................. 20
Figure 3: The CLEAR Model ............................................................................................................... 22
Figure 4: Q3_1 Communities need to work with experts and public servants to make good decisions
about what services they need (n=1983) .......................................................................................... 26
Figure 5: Q3_2 I want government to involve me in making decisions about what services are delivered
in my local area (n = 1983) .............................................................................................................. 27
Figure 6: Q3_3 Governments and communities should make decisions together about how services are
delivered (n=1994) .......................................................................................................................... 28
Figure 7: Q3_4 Government should only provide services where the private sector doesn’t (n=1940) 29

4
Figure 8: Q3_5 The market should decide what services are delivered based on levels of demand
(n=1907) ......................................................................................................................................... 30
Figure 9: Q3_6 The private sector delivers the best value services (n=1852) ..................................... 31
Figure 10: Q3_7 There is a role for government in providing any of the services the community needs
(n=1961) ......................................................................................................................................... 32
Figure 11: Q3_8 There are some things like health care and education that governments should deliver
(n=1988) ......................................................................................................................................... 33
Figure 12: Q3_9 My taxes should only pay for basic services (n=1907) ............................................. 34
Figure 13: Q3_10 I am prepared to pay more taxes to get a broader range of public services (n=1908)
........................................................................................................................................................ 36
Figure 14: Q3_11 People who work in government have enough knowledge to decide what services are
needed in my area (n=1945) ............................................................................................................ 37
Figure 15: Q3_12 Service providers have the best knowledge about how services should be delivered
(n=1938) ......................................................................................................................................... 38
Figure 16: Q3_13 People who are using a service will best know how much of any particular service is
needed (n=1926) ............................................................................................................................. 39
Figure 17: Q3_14 Communities know enough to make good decisions about what services they need
(n=1936) ......................................................................................................................................... 40
Figure 18: Q3_15 Decisions about how services are delivered in my area should be made primarily on
value for money (n=1934) ................................................................................................................ 42
Figure 19: Q3_16 I want governments to deliver services that contribute to a healthier and fairer
society (n=1989) .............................................................................................................................. 44
Figure 20: Q3_17 The government of my local area has enough ability to deliver services by itself
(n=1853) ......................................................................................................................................... 45
Figure 21: Q3_18 There are some services that governments can provide at a higher quality than the
private sector (n=1874) ................................................................................................................... 46
Figure 22: Q3_19 Government should be advocating for the needs of my local community (n=1950) 47
Figure 23: Q3_20 Government should focus on providing only basic services (n=1960) .................... 48
Figure 24: Q3_21 Governments should use a mixture of public, private and not-for-profit
organisations to deliver public services in my area (n=1960) ............................................................ 49
Figure 25: Q3_22 There are times when government exceeds my expectations (n=1940) .................. 50
Figure 26: Q3_23 Governments should to work with each other and other service providers to provide
local services (n=1993) .................................................................................................................... 52
Figure 27: Q3_24 Government delivers the best quality services (n=1869) ........................................ 53
Figure 28: Q3_25 It is acceptable for services in one area to be delivered differently to services in
another area (n=1947) ..................................................................................................................... 54
Figure 29: Relative level of agreement with service delivery questions ............................................... 55
Figure 30: Q7_1 There is something about the landscape around me that makes me feel good
(n=1993) ......................................................................................................................................... 56
Figure 31: Q7_2 It reflects the type of person I am (n=1950) ............................................................ 58
Figure 32: Q7_3 The area in which I live has the qualities I value (n=1979) ....................................... 60
Figure 33: Q7_5 I feel at home there (n=1995) ................................................................................. 62

5
Figure 34: Q7_7 I feel connected locally to friends and neighbours (n= 1992) ................................... 64
Figure 35: Q7_8 Living there makes me feel good about myself (n=1954) ......................................... 66
Figure 36: Q7_4 I feel part of the history of the place (n=1983) ........................................................ 68
Figure 37: Q7_6 The area in which I live is full of important memories and stories (n=1969) ............. 70
Figure 38: Q7_9 I feel a cultural connection to the area (n=1963) ..................................................... 72
Figure 39: Relative level of agreement across the nine emotional place attachment statements ......... 74
Figure 40: Q8_1 Recreational areas such as parks, walking tracks, open spaces (n=2004) ................. 76
Figure 41: Q8_2 Availability of appropriate public services (n=2000) ................................................ 78
Figure 42: Q8_3 Availability of good schools (n=1994) ..................................................................... 79
Figure 43: Q8_4 Availability of healthcare (n=2003).......................................................................... 80
Figure 44: Q8_5 A supportive and cohesive community (n=1995) ..................................................... 81
Figure 45: Q_6 Job opportunities (n=1993) ....................................................................................... 82
Figure 46: Q8_7 A positive economic outlook (n=1979) .................................................................... 84
Figure 47:Q8_8 Availability of good home or aged care (n=1989) ..................................................... 85
Figure 48: Q8_9 Convenient public transport (n=1998) .................................................................... 86
Figure 49: Q8_10 Good quality roads and bridges (n=2003) ............................................................. 87
Figure 50: Q8_11 Being able to afford appropriate housing (n=1995) ............................................... 88
Figure 51: Q8_12 Levels of water, air and noise pollution (n=1995) .................................................. 89
Figure 52: Q8_13 Shops located close-by that are suitable to my needs (n=2002) ............................ 90
Figure 53: Q8_14 A safe environment (n=2002) ............................................................................... 91
Figure 54: Q8_15 Being close to my family (n=1987) ........................................................................ 92
Figure 55: Relative level of importance of each instrumental dimension of place attachment ............. 93
Figure 56: Q9_1 Recreational areas such as parks, walking tracks, open spaces (n=1992) ................. 94
Figure 57: Q9_2 Availability of appropriate public services (n=1965) ................................................ 95
Figure 58: Q9_3 Availability of good schools (n=1833) ..................................................................... 95
Figure 59: Q9_4 Availability of healthcare (n=1988).......................................................................... 96
Figure 60: Q9_5 A supportive and cohesive community (n=1949) ..................................................... 96
Figure 61: Q9_6 Job opportunities (n=1793) ..................................................................................... 97
Figure 62: Q9_7 A positive economic outlook (n=1912) .................................................................... 97
Figure 63: Q9_8 Availability of good home or aged care (n=1912) .................................................... 98
Figure 64: Q9_9 Convenient public transport (n=1941) .................................................................... 98
Figure 65: Q9_10 Good quality roads and bridges (n=1995) ............................................................. 99
Figure 66: Q9_11 Being able to afford appropriate housing (n=1929) ............................................... 99
Figure 67: Q9_12 Levels of water, air and noise pollution (n=1980) ................................................ 100
Figure 68: Q9_13 Shops located close-by that are suitable to my needs (n=1993) .......................... 100
Figure 69: Q9_14 A safe environment (n=1995) ............................................................................. 101
Figure 70: Q9_15 Being close to my family (n=1909) ...................................................................... 101
Figure 71: Relative levels of satisfaction with each dimension of instrumental place attachment ...... 102

6
Figure 72: Satisfaction with dimensions of instrumental place attachment for respondents who rated
their importance as 'extremely important' ....................................................................................... 103
Figure 73: Q10 Thinking about where you live, which level of government is best able to make
decisions about your local area? (n=2006) ...................................................................................... 104
Figure 74: Q11 What is the name of your local Council/Shire? (n=2006) .......................................... 104
Figure 75: Q12 What is the name of the mayor/president of your local council/shire? (n=2006) ...... 105
Figure 76: Q13_1 Water, sewage, stormwater, drainage (n=1995) ................................................... 106
Figure 77: Q13_2 Roads and bridges (n=1993) ............................................................................... 107
Figure 78: Q13_3 Parks (n=1997) ................................................................................................... 108
Figure 79: Q13_4 Footpaths (n=2000) ............................................................................................ 109
Figure 80: Q13_5 Cycleways (n=1989) ........................................................................................... 110
Figure 81: Q13_6 Land use planning and development applications (n= 1975) ............................... 111
Figure 82: Q13_7 Street cleaning and waste management (n=2001) ............................................... 112
Figure 83: Q13_8 Health and environmental management (n=1991) ............................................... 113
Figure 84: Q13_9 Child care (n=1974) ............................................................................................ 115
Figure 85: Q13_10 Aged Care (n=1976) ......................................................................................... 116
Figure 86: Q13_11 Emergency and disaster management (n=1991) ................................................ 117
Figure 87: Q13_12 Libraries (n=1997) ............................................................................................ 118
Figure 88: Q13_13 Sporting and recreation facilities (n=1999) ........................................................ 119
Figure 89: Q13_14 Arts and culture (n=1992) ................................................................................ 121
Figure 90: Q13_15 Economic development (n=1971) ...................................................................... 122
Figure 91: Q13_16 Youth services (n=1976) ................................................................................... 123
Figure 92: Q13_17 Community development (n=1979) ................................................................... 124
Figure 93: Q13_18 Planning for the future (n=1979) ...................................................................... 125
Figure 94: Q13_19 Promoting the benefits of the local area (n=1992) ............................................. 126
Figure 95: Relative importance of each task being done by local government .................................. 127
Figure 96: Q15_1 How my interests are represented by councillors (n=2006) .................................. 128
Figure 97: Q15_2 My feeling of belonging to the local area (n=2006).............................................. 129
Figure 98: Q15_3 The way services are delivered (n=2006) ............................................................. 130
Figure 99: Q15_4 The cost to me for local services (n=2006) .......................................................... 131
Figure 100: Q15_5 The cost of council rates (n=2006) .................................................................... 132
Figure 101: Q15_6 My sense of local community (n=2006) ............................................................. 133
Figure 102: Q15 Relative perception of impact of amalgamation (excluding don’t know responses) . 134
Figure 103: Q1 Community participation (n=2006) ......................................................................... 135
Figure 104: Q2 Thinking about your local area, which of the following people are part of your
community (n=2006) ..................................................................................................................... 135
Figure 105: Q4 How important is each of the following in your life? Family (n=2002) ...................... 136
Figure 106: Q4 How important is each of the following in your life? Friends (n=2006) ..................... 136
Figure 107: Q4 How important is each of the following in your life? Leisure time (n=2005) ............. 136
Figure 108: Q4 How important is each of the following in your life? Politics (n=1991) ..................... 137

7
Figure 109: Q4 How important is each of the following in your life? Work (n=1998) ........................ 137
Figure 110: Q4 How important is each of the following in your life? Religion (n=1994) .................... 137
Figure 111: Q4 How important is each of the following in your life? Study (n=2001) ....................... 138
Figure 112: Q4 How important is each of the following in your life? Relative importance ordered from
most to least important .................................................................................................................. 138
Figure 113: Q5 What political party do you normally vote for, or most identify with? (n=2006) ........ 139
Figure 114: Q10 Freedom of choice and control (n=1991) .............................................................. 140
Figure 115: Q16 In what year were you born? Unweighted ages (n=2006) ....................................... 141
Figure 116: Q16 In what year where you born? (n=2006) NB: Coded to categories and weighted to
general population ......................................................................................................................... 141
Figure 117: Q17 Do you speak a language other than English at home? (n=2006) ........................... 142
Figure 118: Q18 What is the highest level of educational qualification you have completed? (n=2006)
...................................................................................................................................................... 142
Figure 119: Q19 What is the total combined income of everyone in your household, before tax and
other deductions? (n=2006) ........................................................................................................... 143
Figure 120: Q20 What is your employment status? (n=2006) .......................................................... 144
Figure 121: Q21 Are you currently working for the government, a public institution or a non-profit
organisation? (n=2006) .................................................................................................................. 144
Figure 122: Q22 Is the dwelling in which you live (n=2006) ............................................................ 145
Figure 123: Q23 What best describes the household in which you live? (n=2006) ............................ 145
Figure 124: Q24 What best describes the household in which you live? (n=2006) ............................ 146
Figure 125: Q25 How long have you lived in your local area? (n=2006) ........................................... 146
Figure 126: Respondents by their local government classifications.................................................. 147

8

INTRODUCTION 9
1 Introduction
1.1 Background
What do people really think about local government? What are community views about amalgamation? Would
people be happy to pay more rates for better services?
Why Local Government Matters is a major piece of social research on community attitudes to local
government undertaken by the Australian Centre of Excellence for Local Government (ACELG). The research
aims to investigate how and why the activities of local governments, and their roles in society, are valued by
communities. The research covers a range of areas including community views about what they value about
where they live, how they want to engage in decision-making, service delivery preferences, what role they
would like to see local government play and what they think about local government amalgamations.
This sector-influencing research draws on the successful examples of major research projects that have been
used to articulate the value of largely intangible outcomes across diverse policy fields such as the arts,
disability and the environment. Examples of these projects include Who Cares About the Environment? (NSW
Office of Environment and Heritage) and More than Bums on Seats (Australia Council for the Arts).
A literature review was conducted to identify key themes in Australian and international research on local
government and governance relevant to the aims of the study. The focus of the review was on research
studies and theoretical or conceptual frameworks that have been applied to citizens’ perceptions of local
government and governance. The review also considered the range and focus of existing national and
international surveys on the roles and functions of local and other levels of government.
The review identified a well-established body of surveys on citizen satisfaction with local government
function, services and outcomes. However, the review also identified a significant gap in knowledge about
how citizens’ connections with local representation, democracy, governance, place and public services affect
whether and why local government matters to them. Understanding how these connections influence
perceptions of the importance and outcomes of local government is crucial to helping policy makers across
all levels of government to deliver policy outcomes that respond to the needs of communities and the public
sector.
This research is therefore not about performance of or satisfaction with local government; instead it is about
why local government matters to people across the whole spectrum of its activities. It aims to establish
benchmarks of the community’s attitudes, values and priorities regarding quality of life and in relation to
areas influenced by local government.
1.2 Research objectives
The aims of the research are to:
1. Investigate the social context for interactions between Australian communities and their local
governments in order to:
a. build understandings and stimulate discussion amongst stakeholders of key issues for the sector
b. inform planning, implementation and review of activities research and capacity building activities
c. provide input to policy debates on the status of local government and key issues for managing
change
d. contribute to the development of research on local government and support the work of
professional networks and knowledge communities.

INTRODUCTION 10
2. Establish benchmarks of the community’s:
a. awareness, knowledge and understandings of the status, governance roles and service functions
of Australian local government
b. attitudes, values and priorities regarding quality of life and wellbeing in the area In which they
live and in relation to the aspects of their local area that are influenced by local government
c. interest, engagement and participation in the local area, and their self-reported experiences and
behaviours in relation to local activities and councils.
3. Promote awareness of the role of the ACELG in facilitating innovation and best practice and in providing
professional leadership to support effective local government in Australia.
1.3 Methodology
In April/May 2013, a literature review of predominantly survey research on ‘citizen perceptions of local
government’ was undertaken to both inform the development of the research project and ensure that it was
not replicating work already undertaken in Australia or internationally. A condensed version of this literature
review can be found at Section 2 of this report.
Consultation with the sector was facilitated by ACELG over a period of ten months from May 2013. The
discussion focussed on the value of local government; the relationship of local government to the community;
community values around governance and service delivery; place making by local government; and the
relationship of people to the places in which they live. From this process a conceptual framework for the
research was developed (discussed in detail in Section 1.4 below) and circulated to jurisdictional associations
for comment.
The research is conceived as a staged, mix methods project over two to three years.
Stage 1: National CATI survey Version 1
A survey instrument using computer-aided telephone interviews (CATI) was written by ACELG, tested in
sections through three online panel surveys and analysis of results, and then fielded to 2006 people
nationally in October/November 2014 by market research company UMR. A fuller discussion of the survey
methodology can be found in Appendix 2.
This report is a summary of the survey data from Stage 1 of the project.
Stage 2: Qualitative data collection: national focus groups
ACELG will be conducting focus groups nationally in 2015. This stage of the research project will unpack the
results of the survey and allow for greater understanding of the attitudes of the community to local
government according to different contexts and in more depth than is possible through quantitative data
alone.
Stage 3: National CATI Survey Version 2
In late 2015, ACELG will field a revised and shortened version of the Stage 1 CATI survey nationally to a
sample of at least 2000 adults. Revisions to the survey instrument will be made on the basis of an evaluation
of the 2014 question set and outcomes of the qualitative phase of the research. The survey will deliver a
national data set against which local jurisdictions can benchmark.
Stage 4: A survey instrument for local jurisdictional or local government area use
ACELG will make available the questions from the Stage 3 version of the survey and the complete national
dataset to local governments and jurisdictional bodies who would like to conduct their own local research off
the back of the national project.

INTRODUCTION 11
1.4 Conceptual framework
Developing the conceptual framework for the research project involved consultation with the sector and a
steering group of ACELG research staff and associates. Based on these discussions, five key areas of enquiry
emerged:
1. local government’s role as a place shaper and its importance in meeting the needs of citizens that drive
attachment and satisfaction with the area in which they live
2. the preferences of communities for how their services are delivered at the local level and the ability of
local governments to offer flexible and community specific service delivery
3. theories of governance, particularly community beliefs about big versus small government and its role in
the market, the appropriate role for the private sector in local service provision, the preferred extent of
public participation in government decision making, and preferences for the realisation of public value
4. community knowledge of local government, ranked importance of services which can be delivered by
local government in different jurisdictions, and attitudes about amalgamation
5. those attributes of individuals which are theorised to interact with or influence their attitudes and beliefs
about each of the areas above, including demographic factors, levels of community participation, and
personal values and political leanings.
See Appendix D for diagrammatic representation of the conceptual framework.
A literature review of key theoretical areas – place attachment; service delivery and governance – was an
important part of the development of the conceptual framework and how constructs were to be measured in
the survey instrument. Key elements of this literature review are presented below.
1.4.1 Place attachment
Place attachment has been defined in a number of different ways as it has been researched widely across a
number of disciplines. The discussion which follows is not an exhaustive review of the literature about
attachment to place; it is rather a synthesis of the literature that directly informed the development of this
study.
Place attachment is a positive emotional bond that develops between people and their environments
(Steadman 2003). Attachment to place can be conceived as a strong fusion of aesthetic, emotional and
instrumental attachment (Savage 2010). Aesthetic and emotional dimensions of attachment are the
psychological connections people make to the areas in which they live, linked to identity and to the bonds
people make between themselves and places (Stedman 2003). Culture and identity are not just about social
relationships, but are also profoundly spatial, with self-identity linked to place-identity (Stephenson 2010).
Aesthetic responses to landscape and the built environment encompass how an area looks, how it feels to be
in it, or what it looked like in the past (Stephenson 2010). Instrumental dimensions of attachment are linked
to the capacity of a place to meet our needs; it is a multidimensional judgement about the quality of a setting
which is often described as place satisfaction (Stedman 2002).
A neighbourhood or local area can serve several different functions for community members: relaxation and
re-creation of self; making connections with others; fostering attachment and belonging; and demonstrating
or reflecting one’s values (Kearns and Parkinson 2001). Attachment to place, the local area in which we live,
can act to support and develop aspects of personality and identity through the principles of distinctiveness,
continuity, self-esteem and self-efficacy. As described by Twigger-Ross and Uzzell (1996), the first principle
of identity is the desire to maintain personal distinctiveness or uniqueness, which means that a resident’s
association with a specific town, and the lifestyle that is possible there, enables them to differentiate
themselves from people from other areas or regions. Second, place is inextricably linked with the
development and maintenance of continuity of self through preservation of a continuity with either specific
places that have emotional significance or characteristics of places which are generic and transferable from

INTRODUCTION 12
one place to another. Third, self-esteem – a person’s feeling of worth or social value – can be supported by a
favourite environment, meaning that living in a certain area makes someone feel good about themselves. The
final principle of self-efficacy, which means that an individual has belief in their ability to meet situational
demands. With respect to the environment, or the local area in which someone lives, feelings of self-efficacy
are maintained if the environment facilitates, or at least does not hinder, a person’s everyday lifestyle.
In other literature, the dimensions of place that promote or inhibit self-efficacy are called instrumental
(Savage 2010; Steadman 2003). These instrumental dimensions of place attachment or satisfaction include a
range of areas that are directly impacted by local government service delivery and urban planning, or
indirectly by local governments’ advocacy on behalf of their communities. They are reflective of the types of
themes that are common in community strategic planning and other aspects of what local communities desire
from their local governments.
Savage (2010) argues that attachment based on principles of identity (aesthetic and emotional dimensions of
attachment) is essentially a middle class luxury as ‘the ability to value places is dependent on having a wide
enough set of reference points to allow comparison and evaluation’ (p.118). He also argues that how people
respond and connect to their local area will be influenced by their length of association with the
neighbourhood (how long they have been resident) and whether they have chosen to be there, or have been
‘fixed’ there by their life circumstances. Atkinson (2010) notes that “whatever people elect to do, to be and to
reside in remains deeply influenced by class dispositions, by social networks and by financial resources that
vary dramatically”. On the other hand, place satisfaction (or instrumental attachment) is less sensitive to
socio-economic indicators – as the functional aspects of the place in which someone lives impact directly
their daily lives, self-efficacy and satisfaction regardless of their life circumstances (Savage 2010).
1.4.2 Service delivery and governance
This part of the research is based on the proposition that individual local governments need to make strategic
decisions about how they manage local service delivery. They need to answer questions such as:
What types of services are needed?
What level of service delivery is required and how should they meet the community’s expectations?
What are the priorities for service delivery?
How should services be delivered and by whom?
Who should pay for services? What mixture of private and public money is appropriate?
Who should decide on the answers to these questions?
Each local government will answer these questions on the basis of prevailing political, social and public
administration ideologies, as well as the values held by staff and elected members (or those of the
jurisdictional government under which they are constituted). Their opinions about the roles and value of local
government; the appropriate role of community participation in decision-making; the role of the market in
service provision; the aspects of different public management ‘paradigms’ under which they operate; and how
they value different sources of knowledge (e.g. community opinion vs. expert or academic knowledge) will
impact on how they answer each of these questions about service delivery, and consequently how services are
delivered in the local community.
Drawing on debates about the role and value of local government that have been prominent since the early
1800s, Chandler (2010: 6) points to a widely-held view that the roles of local government jurisdictions should
be based on ‘the benefit areas of local public goods’ in order to ensure efficient delivery of services (Chandler
2010: 6). As summarised by Watt (2006: 8), the major advantage of local government is that ‘it allows the
local public goods and services it provides to be adjusted to suit the tastes and the preferences of local
residents’. Ideally, local governments are established so that local residents both pay for and vote to decide
on the local public goods they receive (Watt 2006: 9).

INTRODUCTION 13
Writing within the Australian context, Colebatch and Degeling (1986) argue the importance of tailored local
service provision as a justification for local government. At one level, local governments are agencies of state
governments and are given specified powers – and in some cases funds – to provide nominated services or
exercise particular powers. Since many government services are offered directly or indirectly by other tiers of
government, it is not the only possible agent. On the other hand, within local communities each council is
viewed as a legal entity and as a political body with elected representatives, but also crucially as a service
body. This creates a unique kind of relationship between itself and the people of its locality: as well as being
‘voters’ and ‘ratepayers’, citizens are ‘customers’ of the council’s services (Colebatch and Degeling 1986).
The view that local governments are the best placed organisations to tailor local services to meet the
preferences of local communities questioned, largely on the grounds that in a globalising world it is not
possible to constitute a spatial community. As noted by Chandler (2010: 10), many commentators have
pointed to vast differences between a sedentary rural life on the one hand, and the industrialised mass
communication age of the 20th and 21st centuries on the other. They have argued that ‘advances in modern
communications made community governments based on the village or suburb an outmoded entity’.
In the past few decades this has led to debates on local government needing to be engaged in networks and
partnerships; with discussions of ‘governance’ than ‘government’. Networked community governance has the
goal of meeting community needs as defined by the community and as set out in the context of the demands
of ‘a complex system of multi-level governance’ (Stoker 2011: 17). This governance is always an interactive
process and involves various forms of partnership. According to Stoker (2011: 20-23), the move towards
networked community governance has also encouraged a vision of the role of local government as ‘place-
shaping’.
Place-shaping refers to the creative use of power and influence to promote the general wellbeing of a
community and its citizens, and may include building and shaping local identity, regulating harmful and
disruptive behaviours and helping to resolve disagreements (Lyons 2007: 3). Place-shaping helps to identify
the special characteristics of local places, including neighbourhoods or defined parts of a local government
area, so that action can be taken on economic, social and environmental fronts to enhance the quality of the
place and the quality of life of its people (McKinlay et al 2011: 4; Rablen 2012: 303-305).
Discussion of ‘public value’ has been widespread in public policy debates since a conceptual framework was
put forward for it by Mark Moore in 1995 (Williams and Shearer 2011; Alford and O’Flynn 2009). Moore’s
work, Creating Public Value: Strategic Management in Government describes ‘a philosophy of public
management – an idea of what we citizens should expect of public managers, the ethical responsibilities they
assume in taking office, and what constitutes virtue in the execution of their offices’ (1995: 1). There is
strong support in the literature for suggesting that adopting public value as a guiding theme or principle for
local government practice enhances democratic and service provision outcomes for local communities (see
Benington 2009). Politics is central in a public value paradigm. While private sector firms may focus on
efficiency, quality, security and reliability, public managers must combine these concerns with a striving for
accountability, as well as attention to public preferences (Benington 2009).

INTRODUCTION 14
Stoker’s (2006: 44; after Kelly and Muers 2002) summary contrasting the key features of traditional public
administration, new public management and the public value management paradigms illustrates the way that
different perspectives on public management impact on the role that local governments will play in their
communities.
Table 1: ‘Paradigms’ of management
Traditional Public
Administration
New Public
Management (NPM)
Public Value
Key objectives Politically provided
inputs; service
monitored through
bureaucratic oversight
Managing inputs and
outputs in a way that
ensures economy and
responsiveness to
consumers
The overarching goal is
achieving public value that in
turn involves greater
effectiveness in tackling the
problems the public most cares
about; stretches from service
delivery to system maintenance
Role of
managers
To ensure rules and
procedures are
followed
To help define and
meet performance
targets
To play an active role in
steering networks of
deliberation and delivery and
maintain overall capacity of the
system
Definition of
public interest
By politicians or
experts; little in the
way of public input
Aggregation of
individual preferences,
in practice captured by
senior politicians or
managers supported
by evidence about
customer choice
Individual and public
preferences captured through
a complex process of
interaction that involves
deliberative reflection over
inputs of opportunity costs
Approach to
public service
ethos
Public sector has a
monopoly on service
ethos and all public
bodies have it
Sceptical of public
sector ethos (leads to
inefficiency and empire
building); favours
customer service
No one sector has a monopoly
on public sector ethos;
maintaining relationships
through shared values is seen
as essential
Preferred
system for
service
delivery
Hierarchical
department or self-
regulating profession
Private sector or tightly
defined arms-length
public agency
Menu of alternatives selected
pragmatically and a reflexive
approach to intervention
mechanisms to achieve outputs
Contribution
of the
democratic
process
Delivers accountability;
Competition between
elevated leaders
provides an
overarching
accountability
Delivers objectives:
Limited to setting
objectives and
checking performance,
leaving managers to
determine the means
Delivers dialogue: Integral to
all that is undertaken, a rolling
and continuous process of
democratic exchange is
essential
Source: Stocker (2006)

INTRODUCTION 15
Within these paradigms, local governments can take different approaches to how they interact with the
community with regards to the community’s role in decision-making about service delivery. Governments can
consult with the community by seeking the views of stakeholders in order to improve outcomes, with the
mode of consultation sitting within a continuum of possible approaches to community participation, as
illustrated in Figure 1.
Figure 1: Extent of community participation in public value
A key trend since the late 1980s has been the ‘marketising’ of public services, driven by the forces of
‘privatisation’ and ‘liberalisation’ (Warner and Clifton 2013: 48). Three common responses by local
governments to these trends have been:
Hollowing out – Declines in property tax revenues and reductions in inter-governmental transfers
have forced local governments to ‘hollow out’ their services through service cutbacks, restructuring
local government away from traditional public service obligations, and increasing user fees.
Riding the wave – Some municipalities use privatisation as a two-edged sword by harnessing the
market toward more public ends. Services may be contracted out, but councils at the same time pay
attention to the need to create markets for public services. They allow competitive bidding from in-
house teams, and carefully monitor all processes to ensure service quality and cost savings for rate
payers.
Pushing back – Often encouraged by social action undertaken by citizens, many local governments
have pushed back against market encroachment and state pressure to cut back and privatise. This
has led to initiatives such as establishing multi-sectoral coalitions of citizens, non-profit
organisations and government, for example as regards housing and economic development
strategies (Warner and Clifton 2013: 52-57).
There are several examples of councils successfully taking advantage of economies of scale through shared
service provision (Aulich et al. 2011). The threshold population sizes for particular services are different, and
this is a key factor in determining whether shared service arrangements can lead to improvements. Avenues
for delivering shared services include: two or more councils co-ordinating production activities; two adjacent
councils organising a single production unit; and one council contracting services from another council or
another government agency.
The case for shared services rests on two main propositions, namely the valuing of the continued existence of
small autonomous councils based on the principle of ‘subsidiarity’ i.e. that government powers should be
exercised at the lowest level of government possible; and that the optimal number of production units
depends on the trade-off between scale economies and coordination economies (Dollery, Akimov and Byrnes
2009).

INTRODUCTION 16
1.5 This report
This report presents the main findings of the 2014 Survey.
Section 2 contains a short version of the literature review on community research on local government which
was undertaken at the commencement of the project. Sections 3 to 8 present the distribution of responses to
each question in the survey.
Associations between demographic, values and community participation responses and the answers to
questions in Sections 3 to 7 are presented throughout the report. These differences have been reported when
they reach a significance of p ≤ 0.05 on the two-tail Chi-squared test of association; and when there is a
magnitude of difference between categories or between a category and the national average of 5% or more.
The demographic, community participation and values questions response categories are defined as follows
and the distributions of responses can be found in Section 8.
Gender Male Female
Community Participation Have been actively involved in any service club or sporting,
social, welfare, emergency services or recreation group in the
community in the past 12 months
Age 18-29
30-39
40-49
50-59
60-69
70 and over
Politics Normally vote for, or most identify with:
Liberal
National
Labor
Greens
Other (please specify)
None - change from election to election
Knowledge of Mayor’s name Able to give Mayor’s name:
Correctly Not completely wrongly Wrongly Don’t know Abusive answer
Non-English speaking background Speak a language other than English at home
Educational attainment Highest level of educational qualification completed:
School education level Certificate level Diploma and Advanced Diploma level Bachelor degree level Graduate Certificate and Graduate Diploma level Postgraduate Degree level

INTRODUCTION 17
Income Total combined household income before tax:
Less than $10,000 $10,000 to $19,999 $20,000 to $29,999 $30,000 to $39,999 $40,000 to $49,999 $50,000 to $59,999 $60,000 to $69,999 $70,000 to $79,999 $80,000 to $89,999 $90,000 to $99,999 $100,000 to $149,999 $150,000 to $199,000 $200,000 to $299,000 $300,000 or more
Employment status Employed for wages Self-employed Out of work and looking for work Out of work but not currently looking for work A homemaker A student Retired Unable to work
Housing tenure Mortgaged or owned outright Being rented Other
Dwelling type Separate house Semi-detached, row or terrace house, townhouse etc Flat, unit or apartment (3 stories or less) Flat, unit or apartment (4 stories or more) Other dwelling
Family Type Couple with no children Couple with children One parent family Other type of family household Lone person household Group household (non-family)
Length of time living in the local area Less than 2 years More than 2 and less than 5 years More than 5 and less than 10 years More than 10 years
Council type Urban Capital City Urban Development Small/Medium Urban Development Large/Very Large Urban Regional Urban Fringe Rural (Please refer to Appendix E for definitions of these Australian Classification of Local Government types)

LITERATURE REVIEW 18
2 Literature review
2.1 Rationale and method
Literature published from 1995 to 2013 was reviewed to identify key themes in Australian and international
research on local government that are relevant to the aims of the study. The focus was on research studies
and theoretical or conceptual frameworks that have been applied to citizens’ perceptions of local
government, as well as on survey models and approaches. These were used to inform the design of the
study’s research questions and to provide a literature-based framework for discussing its findings.
Using a wide range of search terms and databases, literature was included that met the following criteria:
academic literature, reports and papers published in English
literature available in the public sphere
studies that focused on community or citizen perceptions of local government
the presence of conceptual frameworks that have been applied to citizen perceptions of local
government.
A table of evidence (see Appendix B) summarises those studies accessed in the literature review that
empirically explored citizen attitudes towards local government.
2.2 Australian research
Drawing on the evidence obtained through the literature review, the following are key insights into the state
of research – particularly survey research – that focuses on citizens’ perceptions of Australian local
government, and possible reasons for why their local councils might matter to them.
An observation that can be made with a degree of confidence is that the citizens of Australia are periodically
surveyed to express their views on public services and governments, including local governments. In state
and territory jurisdictions throughout the country, the focus of surveys is for the most part on ascertaining
levels of community satisfaction with the services and facilities provided by their local governments.
Statewide surveys on services, facilities and other issues relating to councils are carried out on a regular basis
by state governments or local government associations in jurisdictions including Queensland, Tasmania and
Victoria (Elton Consulting 2010). In jurisdictions including New South Wales, local governments conduct
citizen satisfaction surveys on a council-by-council basis, often contracting out the research to independent
providers.
Data from the longitudinal Public Attitudes Survey (Crime and Misconduct Commission, Queensland 2011)
suggests that Australians generally expect that encounters with government employees will be accessible,
efficient and effective. Most respondents (86%) believed there will always be some corruption in local
government, and half the respondents (49%) believed that not enough is being done about corruption in local
government (Crime and Misconduct Commission, Queensland 2011).
In a nationwide survey, Gray and Brown (2008) found that, although respondents’ perceptions of their sense
of belonging to their local areas was high (83.6%), it was less than their sense of belonging to their
state/territory (89.1%), and even less than their sense of belonging to Australia as a nation (94.6%).
Based on research carried out by McGregor Tan Research (2006) in South Australia, findings show that more
than half of surveyed respondents believed that their local councils were the best placed tier of government
to provide a range of services such as libraries, home care services for the elderly, the monitoring and
policing of pollution, crime prevention or neighbourhood watch and childcare services.
LITERATURE REVIEW 19
In Tasmania, Myriad Research (2011) longitudinally measures citizen satisfaction with a range of core local
government services, activities and programs, but the 2011 study also aimed to assess community views in
relation to local government in the Australian Constitution and direct federal funding. The data showed that
two in three respondents felt it was important for local government to be recognised in the Australian
Constitution, and that close to 80% of respondents considered it important that the federal government
should be able to directly fund the local government sector.
Taking into consideration a range of these studies and their longitudinal application, there are gaps in the
available data relating to:
community views on the importance of development assessment and planning
views on the ability of local governments to support the future needs of communities
perceived ability of local councils to deliver services and infrastructure efficiently and timeously
perceived ability of councils to deliver more locally specific services and infrastructure, such as
economic development
willingness of communities to pay more for higher levels of service
importance of local representation to communities
clearer understanding of views relating to local government boundary changes (Elton Consulting
2012).
The literature review provides no evidence that any nationwide study has been carried out which addresses
the objectives of the present study in the decades preceding 2013.
2.3 Key themes from the literature
The focus in this section is on considering what can be drawn out from extant studies carried out in Australia
and internationally in terms of themes and areas of interest adopted by researchers, conceptual frameworks
used to frame research designs and methodologies, and key findings. These findings informed the research
design and methodology for the ‘Why Local Government Matters’ study.
2.3.1 Knowledge of local government
Research suggests that key to exploring citizens’ knowledge of local government is to explore their
understandings of local government function, and this literature provides examples for classifying the roles
and responsibilities of local government (Myriad Research 2011; McGregor Tan Research 2006; Elton
Consulting 2010; Ipsos Social Research Institute 2010).
According to Donnelly et al. (1995), research has been used to explore people’s perceptions of gaps in
services provision, as illustrated in the figure below:

LITERATURE REVIEW 20
Figure 2: Typology of measurable gaps in service provision
Source: Donnelly et al. (1995)
2.3.2 Attitudes toward local government
Researchers such as Glaser and Denhardt (2000) point out that many of the conditions that help to explain
attitudes toward local government and perceptions of local government performance are not under the direct
control of, and cannot be easily manipulated by, the local governments themselves. This suggests that
citizens are prepared to hold local government agencies responsible for general quality of life issues, even
when such issues are not under the direct control of their local authorities. In order to deal with this
methodologically, Glaser and Denhardt (2000) distinguish between ‘controllable’ variables that can be
affected by local government itself (such as information flow); and ‘non-controllable’ variables, which are the
trends and events beyond the control of local government, including broad social and economic trends. It is
important for research in this area to be able to distinguish between the differing effects of these two types
of variables.
Evidence from studies carried out in the US (Piotrowski and van Ryzin 2008; James 2010; Glaser and Denhardt
2000) suggests that citizens’ priorities, values and attitudes could be linked to their perceptions of
transparency at the local government level, which is measurable. Piotrowski and van Ryzin (2008), for
example, carried out research which suggests that citizens’ desire for transparency at the local level can
usefully be measured and analysed on the basis of the following dimensions:
demand for fiscal transparency
health and safety information
principled transparency (disclosing information and operating in the open)
transparency around governance.
International research (Ipsos Social Research Institute 2010) finds that drivers of satisfaction with local
government can be categorised into six dimensions, namely overall service quality; direct communication and
engagement; perceived value for money and/or absence of corruption; clean, safe and strong communities,
which crate a sense of ‘liveability’; media coverage; and background factors such as affluence and diversity.
•Customer expectations of the service and perceptions of the delivered service
Service quality gap
•Management’s understanding of customer expectations and the design and specification of service quality
Design gap
•Customer expectations and management’s perceptions of what those customer expectations are
Understanding gap
•Specification of service quality and actual quality of service delivered
Delivery gap
•Actual delivery compared to what ispromised in terms of external communications such as media and customer contracts
Communications gap

LITERATURE REVIEW 21
2.3.3 Measuring the outcomes of public service delivery as citizens perceive them
It is widely recognised that the outcomes of many government services are difficult to measure objectively
and are often ‘elusive’ (Van Ryzin 2013: 597). Public performance has always tended to be measured by
means of ‘hard’ indicators such as resources and outputs. However the increased attention being paid to
public sector accountability, and the problems that have emerged in relating inputs, activities and outputs to
their impacts and outcomes, have encouraged the use of ‘soft’ indicators such as ‘satisfaction’, ‘trust’ and
‘quality of life’ (Bouckaert and van de Walle 2003: 229).
The citizen satisfaction survey is a method of measuring the outcomes of public service delivery as citizens
perceive them (Kelly and Swindell 2002: 273). Citizen satisfaction with service quality can be described as an
‘external measure of value creation’ or a ‘proxy measure’, and can be compared with internal performance
measures upon which managers focus in order to achieve performance goals (Kelly 2005: 77). A direct causal
relationship is presupposed between the quality of delivery of a given service or range of services, and user
satisfaction with that delivery. The underlying premise is that increasing the quality of local government
governance and service provision will increase public satisfaction and that satisfaction indicators can
therefore be used as proxies for good governance.
Approaches to citizen satisfaction surveys include models which make explicit links between:
individuals’ satisfaction with services in relation to the amount of importance that they give to each
service (van Ryzin and Immerwahr 2007)
citizen expectations of a service and their levels of satisfaction with the service (Van Ryzin 2004;
James 2009)
citizen evaluations of service quality compared with indicators of internal service performance (Im
and Lee (2012).
There is a growing body of research on the use of citizen satisfaction surveys in local government. In
Queensland, for example, researchers make use of a model that allows both for the measuring of community
perceptions of the importance of a local government function and for ratings of citizen satisfaction which
measure community members perceptions of how well a council is performing each function. This allows for
the ‘gap’ between perceptions of importance and satisfaction ratings to be calculated in respect of a range of
services and categories of services. Since surveys occur periodically, comparisons are possible over time
(Local Government Association of Queensland (LGAQ) (2011).
2.3.4 Skills and competencies in dealing with local councils and local issues
There is evidence from studies in several Australian jurisdictions that many people do have direct contact
with their local councils. For example, Victorian research (JWS Research 2012) found that across all Victorian
councils, 61% of residents had contact with their council in 2011-2012. The Crime and Misconduct
Commission, Queensland (2011) notes on the basis of a survey (see table of evidence in Appendix B) that 41%
of respondents reported some contact with a local government employee at some stage in their life.
Studies suggest that citizens allow their personal experiences to affect their views of government, especially
in regard to local issues that are concrete and direct for community residents. For example, drawing on
findings from research conducted in the USA, Orr and West (2007) conclude that local government is the level
of the public sector closest to the people, and that individuals surveyed at the local level are more likely than
those surveyed in connection with higher tiers of government to let their personal experiences affect their
views of government. Research which seeks to identify citizens’ skills and competencies in dealing with local
government could benefit from also focusing on citizens’ perceptions of procedural fairness and the ways in
which people manage ‘uncertainty’ (Herian, Hamm, Tomkins and Pytlik Zillig 2012).

LITERATURE REVIEW 22
2.3.5 Personal behaviour of respondents at the local level
The reviewed studies do not provide accessible models for gathering data on the personal behaviour of
respondents in their contact with local council or their use of local facilities. While some of the studies
included in this review point to the value citizens place on resident involvement in local decision-making (see
e.g. Myriad Research 2011), there is a gap in exploring people’s perceptions of their actual participation in
local governance, local events and various forms of activism.
At the same time, there is a large body of academic literature focusing on facilitating citizen participation in
local governance and enhancing social capital (Berner, Amos and Morse 2011; Cuthill and Fien 2005). A
diagnostic tool – the CLEAR model – has been developed in the UK on the basis of ‘the theoretical and
empirical insights of a large body of research into participation’ (Lowndes, Pratchett & Stoker 2006: 286). The
CLEAR model argues that participation is most effective when citizens:
Figure 3: The CLEAR Model
Source: Lowndes, Pratchett & Stoker (2006: 286-289)
This is a potentially useful comparative model, which the authors describe as a diagnostic tool that ‘enables
policy makers to look at citizens and ask questions about their capacities, their sense of community and their
civic organisations’ (Lowndes, Pratchett & Stoker 2006: 289).
In terms of a willingness to pay more for services, research carried out by JWS Research in Victoria (2012)
indicates that ratepayers expect councils to live within their current means and that service improvements
should be moderate rather than substantial. In a review of recent Australian community surveys on the role of
local government also referred to above, Elton Consulting (2010) note that there is a lack of research on the
perceived ability of local councils to deliver services and infrastructure efficiently and in a timely manner, and
the perceived ability of councils to deliver more locally specific services and infrastructure, such as economic
development.
•have the resources and knowledge to participate
Can do
•have a sense of attachment to the locality/community that reinforces participation
Like to
•provided with participation opportunities
are Enabled to
• through being mobilised by official bodies or voluntary groups
are Asked to
•see evidence that their views have been considered
are Responded to

LITERATURE REVIEW 23
2.3.6 Additional frameworks for understanding local government
The review of the literature also considered several concepts and frameworks that may be useful for the
study. In the literature these frameworks were found to focus on:
• elements of an effective system of local government in the Australian context (Independent Local
Government Review Panel 2012)
• aspects of public goods and services that contribute to local communities being good places in
which to live (Local Government Association of Queensland 2011; Ipsos Social Research Institute
2010)
• the value of local governments engaging in ongoing communication with their constituents
(James 2010), including reporting performance information that is service-specific and developed
in response to the concerns of local residents (Darlow, Hawtin and Jassi 2008)
• making use of concepts from marketing research – see Gardiner (2009) for a discussion of the
themes that may be needed in order to develop a model for the marketing of local government1;
and the use of marketing research methods to analyse data on citizens’ perceptions of the
importance they attach to, and their satisfaction with, local government services (Social
Dimensions 2010).
2.4 Challenges in ascertaining citizens’ perceptions
As regards citizen satisfaction surveys, several limitations have been identified in the literature, and a range
of issues need to be considered in respect of further development of survey design and methodology.
Although they draw on market research models derived from the private sector, researchers draw attention to
the differences between the private and the public sectors when adopting this approach in the public sector
(Herian and Tomkins 2012: 66; Kelly and Swindell 2002: 273; Kelly 2005: 79).
Glaser and Denhardt (2000) write that the ‘nature of public products’ makes citizen assessments of them
difficult, and that government performance is value-laden. For example, citizens who have negative views of
federal or state government may characterise local government similarly. According to Roefs and Atkinson
(2010: 44), there are several analytical difficulties in unpacking citizens’ attitudes towards government. For
local government this may be particularly difficult to achieve, due to uncertainties such as the following:
• To what extent do citizens shape their views about local government according to the actual
performance of local councils?
• Can citizens differentiate the performance of councils from that of other levels of government?
• Do people know what councils actually do, and what their problems and constraints are?
• How involved are people with their local government, and do they feel they can influence it?
• How does satisfaction with service delivery relate to less tangible and instrumental aspects of
government, such as trust in government?
Moving beyond local government to focus on democratic governance generally, Ariely (2013) calls for more
research on the associations between citizens’ perceptions of public administration (bureaucracy), the actual
quality of bureaucratic performance, and citizen satisfaction with democracy. In a pioneering cross-national
study, he finds evidence for the central importance of public administration is sustaining citizen support of
democracy.
There is much debate as to whether citizen satisfaction surveys are adequate in achieving their primary
intended purpose, namely assessing and gathering data for improving public sector performance. Many
researchers (see Stipak 1979; Bouckaert and van de Walle 2003) have suggested, for example, that the results
1 These themes include goal congruence, product type, recognition that there were elements of citizen and customer
markets being served by local government, and acknowledgement of the complex ‘marketing exchange that takes place
involving the elected members, the administration and the ratepayers’ (Gardiner 2009).
LITERATURE REVIEW 24
of citizen surveys more closely reflect the characteristics and attitudes of respondents, rather than the actual
quality of government services.
There is a call for greater methodological rigour (van Ryzin 2013) that takes into account the socio-economic
characteristics of respondents and local characteristics, such as the size of local government areas. Other
methodological issues include the location of questions in often quite lengthy survey instruments (Van de
Walle and Van Ryzin 2011), statistical complications that result from the non-experimental nature of the
research (Stipak 1979: 48-49), and questions of sample size and make-up (Swindell and Kelly 2005: 709-
710).
More research is needed on how citizens’ personal experiences with services may affect their evaluations of
them; what effect the aggregation of citizen evaluations and performance benchmarks has on the accuracy
and usefulness of data; and the relationships between citizen expectations of local government, user
satisfaction with local government services and internal measures of local government performance. Wider
issues of ‘trust in government’ and citizen satisfaction with democracy may also need to be considered in the
design of citizen surveys.
2.5 Conclusion
There is an established and growing body of literature that focuses on citizens’ perceptions of local
government, but the majority of the research designs and data generated focus on citizen satisfaction with
local government services, to a lesser degree on perceptions of local representation and democracy, and to
an even less degree on whether local government matters to them and if so, why it matters. The conduct of
the literature review gives grounds for suggesting that the study described below fills a gap, not only in the in
the Australian, but also the international literature.

GOVERNANCE AND SERVICE DELIVERY PREFERENCES 25
3 Governance and service delivery preferences
All governments make choices about the part they play with respect to service delivery, based on their
understanding of the role of government from an economic and ideological perspective. In order to tease out
how Australians think about some of the key theories in this area, respondents were asked a series of
questions about service delivery, the role of government and how they wish to participate with governments in
decision-making. The questions were designed to provide a better understanding of both community attitudes
about service delivery and underlying governance preferences.
The questions do not specify which level of government is being asked about, although they often refer
explicitly to the ‘local area’ or ‘local community’. Questions were not framed to be about local government
specifically, but Australians’ views on these issues are of direct relevance to local governments as they are well
placed to be responsive to the views of their own communities.
Respondents were asked to indicate their level of agreement to 25 statements about the role of government
in providing services to the community. Although the questions in the section were randomised in the
administration of the survey, they have been grouped in this report to highlight how they are linked
conceptually.
3.1 Level of agreement with individual governance and service
delivery statements
Question 3 of the survey asked:
Thinking about the role of government in the provision of services to the community, do you agree or
disagree with the following statements?
3.1.1 Community participation in decision-making
Australian communities want to be involved with government in making decisions about how and what
services should be delivered in their local area. They think good decisions are made by involving
communities, experts and government together in the process. Communities and people using services are
considered to have the best knowledge of what services are needed and how they should be delivered,
followed by service providers and finally people who work in government.

GOVERNANCE AND SERVICE DELIVERY PREFERENCES 26
Communities need to work with experts and public servants to make good decisions about what
services they need
Overwhelmingly, people think that communities need to work with experts and public servants for good
decisions to be made about what services are needed. Overall agreement is very high, with 58 per cent of
respondents strongly agreeing and a further 28 per cent moderately agreeing that communities, experts and
governments should be working together.
Figure 4: Q3_1 Communities need to work with experts and public servants to make good decisions about
what services they need (n=1983)
Association highlights
Communities need to work with experts and public servants to make good decisions about what
services they need
58.0
28.3
7.9
1.8
1.9
2.1
0 10 20 30 40 50 60 70
Strongly agree
Moderately agree
Slightly agree
Slightly disagree
Moderately disagree
Strongly disagree
Percent
Politics
People who would normally vote for Labor (62%) are more likely than people who vote for the
Liberal/National Coalition (55%) to strongly agree.
Employment status
When compared with the general community (58%), students (66%) are more likely to strongly agree.
Age, however, is not a significant factor.
Length of time living in the local area
Strong agreement is less likely among people who have lived in the area for less than 2 years (43%) than
those who have lived in their community for more than 10 years (59%).
Council type
Respondents living in urban capital cities (51%) and rural and remote councils (53%) are less likely to
strongly agree when compared nationwide (58%).
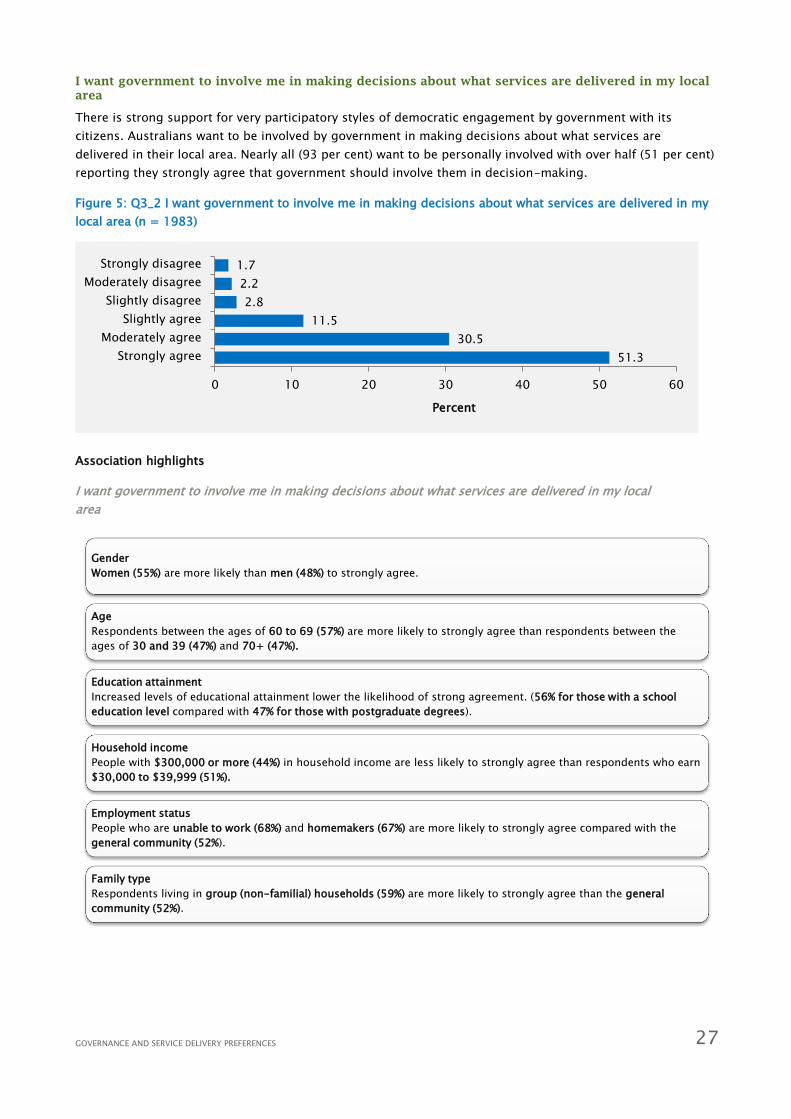
GOVERNANCE AND SERVICE DELIVERY PREFERENCES 27
I want government to involve me in making decisions about what services are delivered in my local
area
There is strong support for very participatory styles of democratic engagement by government with its
citizens. Australians want to be involved by government in making decisions about what services are
delivered in their local area. Nearly all (93 per cent) want to be personally involved with over half (51 per cent)
reporting they strongly agree that government should involve them in decision-making.
Figure 5: Q3_2 I want government to involve me in making decisions about what services are delivered in my
local area (n = 1983)
Association highlights
I want government to involve me in making decisions about what services are delivered in my local
area
51.3
30.5
11.5
2.8
2.2
1.7
0 10 20 30 40 50 60
Strongly agree
Moderately agree
Slightly agree
Slightly disagree
Moderately disagree
Strongly disagree
Percent
Gender
Women (55%) are more likely than men (48%) to strongly agree.
Age
Respondents between the ages of 60 to 69 (57%) are more likely to strongly agree than respondents between the
ages of 30 and 39 (47%) and 70+ (47%).
Education attainment
Increased levels of educational attainment lower the likelihood of strong agreement. (56% for those with a school
education level compared with 47% for those with postgraduate degrees).
Household income
People with $300,000 or more (44%) in household income are less likely to strongly agree than respondents who earn
$30,000 to $39,999 (51%).
Employment status
People who are unable to work (68%) and homemakers (67%) are more likely to strongly agree compared with the
general community (52%).
Family type
Respondents living in group (non-familial) households (59%) are more likely to strongly agree than the general
community (52%).

GOVERNANCE AND SERVICE DELIVERY PREFERENCES 28
Governments and communities should make decisions together about how services are delivered
A majority of respondents (68%) strongly agree that governments and communities should make decisions
together about how services are delivered, while a further 24% moderately agree.
Figure 6: Q3_3 Governments and communities should make decisions together about how services are
delivered (n=1994)
Association highlights
Governments and communities should make decisions together about how services are delivered
68.0
23.9
5.8
.9
.7
.6
0 10 20 30 40 50 60 70 80
Strongly agree
Moderately agree
Slightly agree
Slightly disagree
Moderately disagree
Strongly disagree
Percent
Gender
Women (72%) are more likely than men (64%) to strongly agree.
Age
Respondents aged 18-29 (62%) and 70 over (62%) are less likely to strongly agree than respondents aged 50-59
(75%).
Education attainment
Respondents with a school education level (74%) are more likely to strongly agree than respondents with a bachelor
degree level qualification (63%), graduate certificate or graduate diploma level qualification (65%) or postgraduate
degree (65%).
Employment status
Homemakers (79%) are more likely to strongly agree than people out of work but not currently looking for work
(54%). Compared with the general community (68%), homemakers (79%) also have the strongest level of agreement.

GOVERNANCE AND SERVICE DELIVERY PREFERENCES 29
3.1.2 The role of the market in service delivery
Respondents do not agree that the private sector or the market are best placed to deliver services in their
local area.
Government should only provide services where the private sector doesn’t
It is argued by some that government’s role in the delivery of services should be limited, for example, to
areas of ‘market failure’, where the private sector is not able to supply goods or services to meet levels of
demand. Nearly three-quarters (73%) of Australians disagree that government should only provide services
where the private sector doesn’t.
Figure 7: Q3_4 Government should only provide services where the private sector doesn’t (n=1940)
Association highlights
Government should only provide services where the private sector doesn’t
9.1
11.4
6.6
12.7
26.3
33.9
0 5 10 15 20 25 30 35 40
Strongly agree
Moderately agree
Slightly agree
Slightly disagree
Moderately disagree
Strongly disagree
Percent
Community participation
People are more likely to strongly disagree when they have been actively involved in their community in the past 12
months (38% compared with 31% not actively involved).
Politics
Voters for the Greens (45%) and the Labor Party (42%) are more likely to strongly disagree. Liberal/National Coalition
(23%) voters are less likely to strongly disagree.
Age
Respondents aged 40-49 (40%) and 60-69 (41%) have the highest levels of strong disagreement, while respondents
aged 18-29 (28%) and 70+ (25%) show the lowest levels of strong disagreement.
Education attainment
As education attainment rises, strong disagreement increases. Respondents with postgraduate degrees (42%)
disagree more strongly than those with school education levels (28%).
Employment status
Those who are out of work but not currently looking for work (21%) have the lowest levels of strong disagreement
compared with those who are out of work and looking for work (43%) and those who are unable to work (41%).
Working in government or non-profit
People who work in government, a public institution or a non-profit organisation (40%) are more likely to strongly
disagree than people who do not work in those areas (31%).
Family type
Lone person households (26%) are less likely to strongly disagree than couples with children (36%) and the general
community (34%).
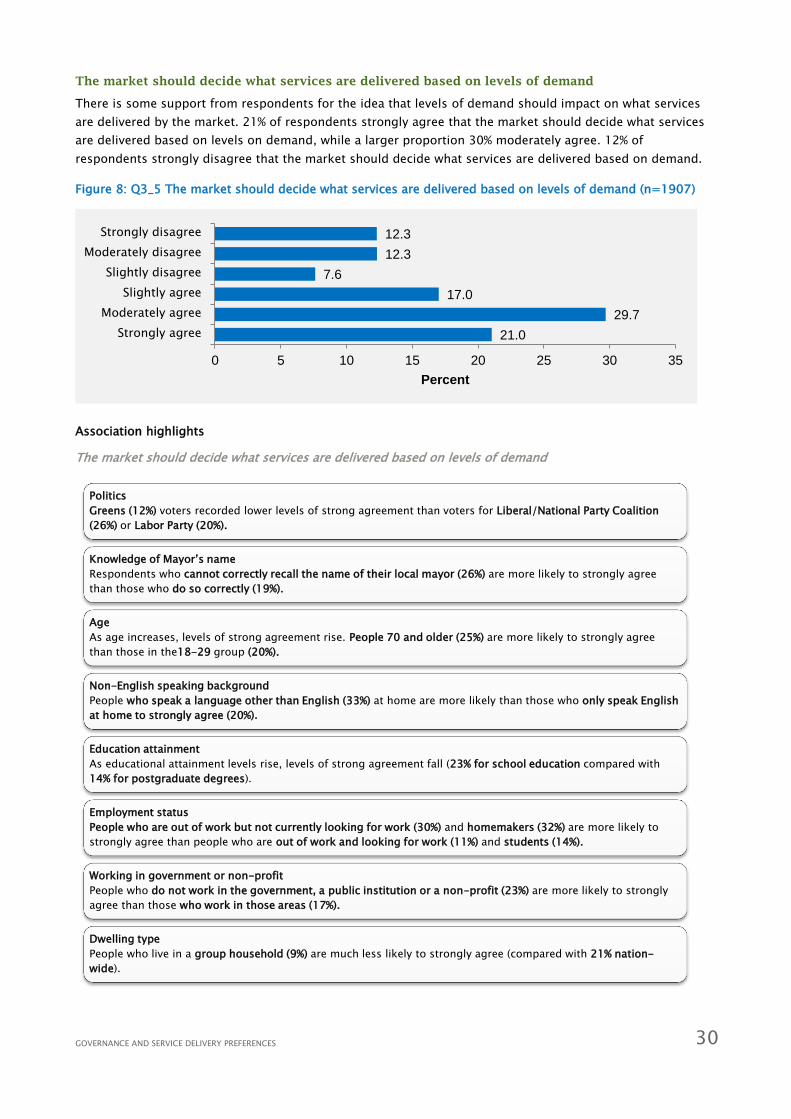
GOVERNANCE AND SERVICE DELIVERY PREFERENCES 30
The market should decide what services are delivered based on levels of demand
There is some support from respondents for the idea that levels of demand should impact on what services
are delivered by the market. 21% of respondents strongly agree that the market should decide what services
are delivered based on levels on demand, while a larger proportion 30% moderately agree. 12% of
respondents strongly disagree that the market should decide what services are delivered based on demand.
Figure 8: Q3_5 The market should decide what services are delivered based on levels of demand (n=1907)
Association highlights
The market should decide what services are delivered based on levels of demand
21.0
29.7
17.0
7.6
12.3
12.3
0 5 10 15 20 25 30 35
Strongly agree
Moderately agree
Slightly agree
Slightly disagree
Moderately disagree
Strongly disagree
Percent
Politics
Greens (12%) voters recorded lower levels of strong agreement than voters for Liberal/National Party Coalition
(26%) or Labor Party (20%).
Knowledge of Mayor’s name
Respondents who cannot correctly recall the name of their local mayor (26%) are more likely to strongly agree
than those who do so correctly (19%).
Age
As age increases, levels of strong agreement rise. People 70 and older (25%) are more likely to strongly agree
than those in the18-29 group (20%).
Non-English speaking background
People who speak a language other than English (33%) at home are more likely than those who only speak English
at home to strongly agree (20%).
Education attainment
As educational attainment levels rise, levels of strong agreement fall (23% for school education compared with
14% for postgraduate degrees).
Employment status
People who are out of work but not currently looking for work (30%) and homemakers (32%) are more likely to
strongly agree than people who are out of work and looking for work (11%) and students (14%).
Working in government or non-profit
People who do not work in the government, a public institution or a non-profit (23%) are more likely to strongly
agree than those who work in those areas (17%).
Dwelling type
People who live in a group household (9%) are much less likely to strongly agree (compared with 21% nation-
wide).

GOVERNANCE AND SERVICE DELIVERY PREFERENCES 31
The private sector delivers the best value services
Although there is some agreement by Australians that the private sector delivers the best value services, a
large majority (63%) disagree with this statement.
Figure 9: Q3_6 The private sector delivers the best value services (n=1852)
Association highlights
The private sector delivers the best value services
8.8
16.5
12.1
17.4
23.4
21.8
0 5 10 15 20 25
Strongly agree
Moderately agree
Slightly agree
Slightly disagree
Moderately disagree
Strongly disagree
Percent
Politics
Labor Party (30%) voters have higher levels of strong disagreement than Liberal/National Coalition voters (11%).
Age
Respondents in the 60-69 age group (29%) are more likely to strongly disagree than respondents in the 18-29 age
group (13%).
Education attainment
As education attainment rises, levels of strong disagreement also rise (16% for school education level compared with
25% for postgraduate degree holders).
Household income
Respondents who earn a household income of $300,000 or more (9%) are less likely to strongly disagree (compared
with 22% nationwide).
Employment status
People unable to work (29%) and out of work and looking for work (28%) are more likely to strongly disagree than
people out of work but not looking for work (10%).
Working for the government or non-profit
People who work for the government, public institutions or non-profit organisations (26%) are more likely to strongly
disagree than those who do not (17%).
Length of time living in local area
Respondents who have lived in their local area for more than 10 years (23%) are more likely to strongly disagree than
respondents who have lived in their local area for less than 2 years (16%) or those who have lived in their local area
for more than 2 but less than 5 years (16%).

GOVERNANCE AND SERVICE DELIVERY PREFERENCES 32
3.1.3 The role of the government in service delivery
There is strong support for government playing a role in service delivery, particularly in health and education.
There is a role for government in providing any of the services the community needs
Australians overwhelmingly want their governments to play a role in providing many of the services the
community needs, with 93% of respondents agreeing to this statement.
Figure 10: Q3_7 There is a role for government in providing any of the services the community needs
(n=1961)
Association highlights
There is a role for government in providing any of the services the community needs
45.9
35.2
11.5
3.2
3.0
1.2
0 10 20 30 40 50
Strongly agree
Moderately agree
Slightly agree
Slightly disagree
Moderately disagree
Strongly disagree
Percent
Community participation
People who have been active in their community over the past year (49%) are more likely to strongly agree than those
who have not been active (43%).
Politics
Labor Party (52%) voters are more likely to strongly agree than Liberal/National Coalition voters (43%).
Age
As age increases, levels of agreement rise. People aged 18 to 29 (36%) are less likely to strongly agree than those who
are 70 and over (50%).
Employment status
People out of work but not currently looking for work (28%) and those who are out of work and looking for work (35%)
are less likely to strongly agree than the general community (46%).
Dwelling type
People who live in a flat, unit or apartment with 4 stories or more (38%) are less likely to strongly agree (compared with
46% community-wide).
Family type
One parent households (52%) are more likely to strongly agree than couples with no children (44%) and lone person
households (43%).
Length of time living in local area
People who have lived in their local area for less than 2 years (38%) are less likely to strongly agree (46% community-
wide).

GOVERNANCE AND SERVICE DELIVERY PREFERENCES 33
There are some things like health care and education that governments should deliver
A very high proportion of Australians support the idea that health care and education should be delivered by
government, with 83% strongly agreeing and almost all (98%) agreeing to some extent.
Figure 11: Q3_8 There are some things like health care and education that governments should deliver
(n=1988)
Association highlights
There are some things like health care and education that governments should deliver
82.8
11.1
3.9
.6
.6
1.0
0 10 20 30 40 50 60 70 80 90
Strongly agree
Moderately agree
Slightly agree
Slightly disagree
Moderately disagree
Strongly disagree
Percent
Politics
People who normally vote for the Labor Party (86%) and the Greens (89%) are more likely to strongly agree than
people who normally vote for the Liberal/National Party (78%).
Age
Respondents who are 70 and over are less likely to strongly agree (76% compared with 83% nationwide).

GOVERNANCE AND SERVICE DELIVERY PREFERENCES 34
3.1.4 Paying for services through taxation
A majority of respondents agree that taxes should pay for more than basic services and many are prepared to
pay more taxes to receive a broader range of services.
My taxes should only pay for basic services
The level of support for the idea that taxes should only pay for basic services is relatively low, with just 25% of
Australians either moderately or strongly in agreement. In contrast, 51% of respondents strongly or
moderately disagree.
Figure 12: Q3_9 My taxes should only pay for basic services (n=1907)
10.7
14.2
9.2
15.1
24.6
26.1
0 5 10 15 20 25 30
Strongly agree
Moderately agree
Slightly agree
Slightly disagree
Moderately disagree
Strongly disagree
Percent

GOVERNANCE AND SERVICE DELIVERY PREFERENCES 35
Association highlights
My taxes should only pay for basic services
Community participation
People who have participated in community services in the past year (29%) are more likely to strongly disagree than people who
have not participated (23%).
Politics
Labor Party (33%) or Greens (44%) voters are more likely to strongly disagree than Liberal/National Coalition (15%) voters.
Age
There is a trend for disagreement to rise between the ages 18-69 (23%) and 60-69 (30%). Levels of strong disagreement fall for
people 70 and older (22%).
Non-English speaking background
People who speak a language other than English at home (20%) are more likely to strongly agree than people who speak English
only (10%).
Educational attainment
Respondents with a university degree level qualification such as Bachelor’s degree (26%) and Postgraduate degree (31%) are more
likely to strongly disagree than people who have completed school level education (21%).
Employment status
Homemakers (21%), people who are self-employed (16%) or retired (14%) are much more likely to strongly agree than students
(3%).
Family type
People who are part of a non-family group household (2%) are less likely to strongly agree than the general community (11%).
Length of time living in the local area
Respondents who have lived in their local area for less than 2 years (21%) are more likely to strongly agree (compared with 11%
nationwide).
Council type
People from capital cities (32%), large/very large urban developments (29%) and rural/remote areas (28%) are more likely to
strongly disagree than people who live in urban regional (24%) areas or the urban fringe (22%).

GOVERNANCE AND SERVICE DELIVERY PREFERENCES 36
I am prepared to pay more taxes to get a broader range of public services
27% of respondents moderately agree that they are prepared to pay more taxes to receive a broader range of
public services, while a further 16% percent of respondents strongly agree. However, a quarter of respondents
(23%) strongly disagree that they are prepared to pay more services for a broader range of public services.
Figure 13: Q3_10 I am prepared to pay more taxes to get a broader range of public services (n=1908)
Association highlights
I am prepared to pay more taxes to get a broader range of public services
16.4
26.7
16.5
9.0
8.4
23.0
0 5 10 15 20 25 30
Strongly agree
Moderately agree
Slightly agree
Slightly disagree
Moderately disagree
Strongly disagree
Percent
Community participation
People who have been active in the community in the past year (19%) are more likely to strongly agree than those
who have not been active (14%).
Politics
Greens (28%) voters are more likely to strongly agree than people who vote for the Labor Party (21%) or the
Liberal/National Coalition (13%).
Age
People aged 60-69 (21%) are more likely to strongly agree (compared with 16% nationwide).
Education attainment
There is a positive relationship between level of agreement and education attainment: people with a postgraduate
degree (22%) are more likely to strongly agree than people with a school educational level (12%).
Household income
The data shows no clear association between income levels and willingness to pay more taxes. Likelihood to strongly
agree ranged from 10% to 33% with no clear trend in direction.
Employment status
Homemakers (34%) are more likely to strongly disagree than students (6%).
Dwelling type
People who live in a separate house (16%) are less likely to strongly agree than those who live in a semi-detached or
similar house (23%) or a flat, unit or apartment (21%).
Council type
Respondents who live in a large/very large urban development (24%) are more likely to strongly agree than those who
live in the urban fringe (10%).

GOVERNANCE AND SERVICE DELIVERY PREFERENCES 37
3.1.5 Who has the knowledge needed to make decisions about what services are needed in the
local area?
Communities and people using services have enough or the best knowledge about what services are needed
and how they should be delivered. Service providers are considered to have not as much knowledge and
people who work in government even less.
People who work in government have enough knowledge to decide what services are needed in my
area
Only 23% of respondents strongly or moderately agree that people who work in government have enough
knowledge to decide what services are needed in their area.
Figure 14: Q3_11 People who work in government have enough knowledge to decide what services are
needed in my area (n=1945)
Association highlights
People who work in government have enough knowledge to decide what services are needed in my
area
6.8
15.9
13.6
14.5
21.8
27.4
0 5 10 15 20 25 30
Strongly agree
Moderately agree
Slightly agree
Slightly disagree
Moderately disagree
Strongly disagree
Percent
Council type
Urban regional (32%) and rural and remote (32%) council areas show the highest levels of strong disagreement.
Age
Levels of agreement change with age. It rises for 18-29 year olds (17%) to 50-59 (36%) and decreases again (31% for
people 70+).
Education attainment
As education attainment increases, levels of strong agreement decrease. People with school education (11%) are more
likely to strongly agree than people with postgraduate degrees (3%).
Employment status
People who are unable to work (50%) have the strongest level of strong disagreement (compared with 27%
nationwide).
Housing tenure
People who mortgage or outright own their dwelling (29%) are more likely to strongly disagree than renters (20%).
Family type
Couples with no children (31%) and one parent families (30%) have similar levels of strong disagreement, while
couples with children (25%), lone person households (26%) and group households (23%) are less likely to strongly
disagree.
Gender
Women (31%) are more likely to strongly disagree thanmen (24%).

GOVERNANCE AND SERVICE DELIVERY PREFERENCES 38
Service providers have the best knowledge about how services should be delivered
Service providers are considered by respondents to have more knowledge than government employees about
how services should be delivered. 30% of respondents moderately agree and 17% of respondents strongly
agree that service providers have the best knowledge about how services should be delivered
Figure 15: Q3_12 Service providers have the best knowledge about how services should be delivered
(n=1938)
Association highlights
Service providers have the best knowledge about how services should be delivered
17.3
30.1
18.3
12.1
14.1
8.0
0 5 10 15 20 25 30 35
Strongly agree
Moderately agree
Slightly agree
Slightly disagree
Moderately disagree
Strongly disagree
Percent
Politics
Greens (13%) voters are less likely to strongly agree than those who vote for Labor (18%) or the Liberal/National
Coalition (23%).
Knowledge of Mayor’s name
People who can correctly identify their mayor’s name (19%) are less likely to strongly agree than those who are
incorrect (26%).
Gender
Women (20%) are more likely to strongly agree than men (15%).
Age
As age increase, levels of strong agreement also rise (17% for people aged 18-29 compared with 24% for people 70
and over).
Non-English speaking background
People who speak a language other than English at home (23%) are more likely to strongly agree than those who only
speak English (17%).
Employment status
People employed for wages (16%) and homemakers (16%) share similar levels of strong agreement; students (8%)
agree least; and people unable to work (30%) agree most.
Dwelling type
People who live in a flat unit or apartment of 4 stories or more (9%) are less likely to strongly agree (compared with
17% community-wide).
Length of time living in local area
Respondents who have lived in their local area for less than 2 years (23%) are more likely to strongly agree (compared
with 17% community-wide).
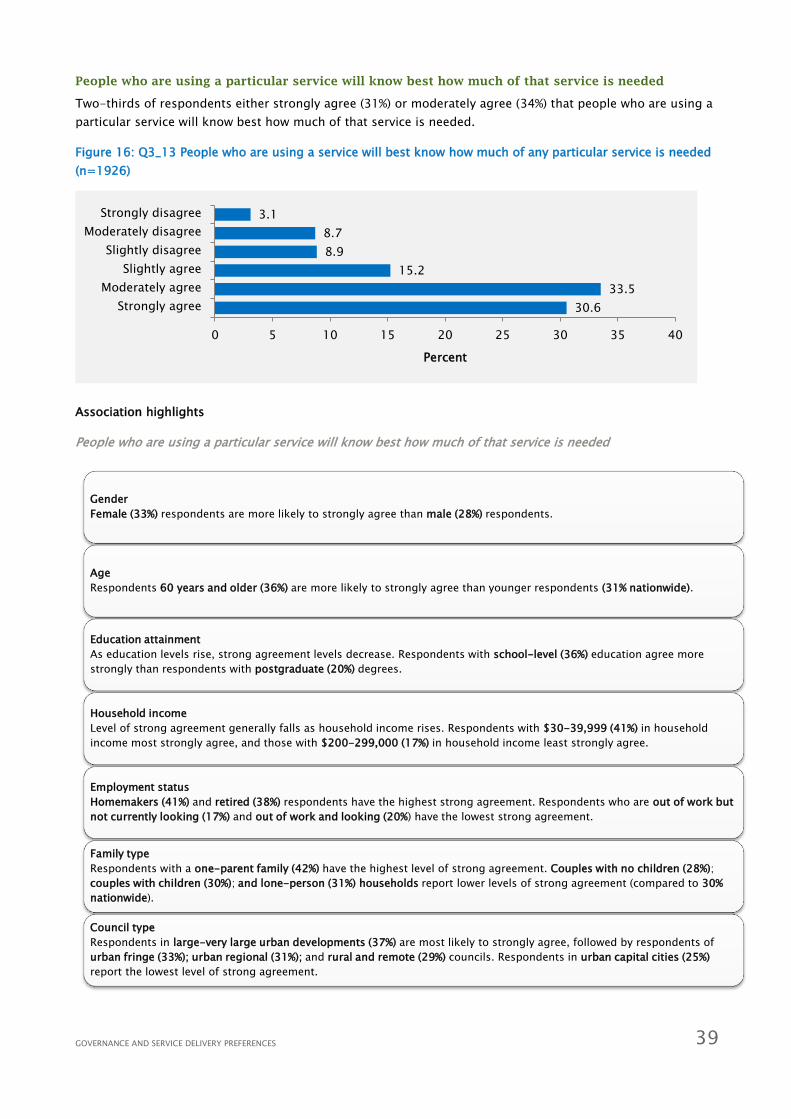
GOVERNANCE AND SERVICE DELIVERY PREFERENCES 39
People who are using a particular service will know best how much of that service is needed
Two-thirds of respondents either strongly agree (31%) or moderately agree (34%) that people who are using a
particular service will know best how much of that service is needed.
Figure 16: Q3_13 People who are using a service will best know how much of any particular service is needed
(n=1926)
Association highlights
People who are using a particular service will know best how much of that service is needed
30.6
33.5
15.2
8.9
8.7
3.1
0 5 10 15 20 25 30 35 40
Strongly agree
Moderately agree
Slightly agree
Slightly disagree
Moderately disagree
Strongly disagree
Percent
Gender
Female (33%) respondents are more likely to strongly agree than male (28%) respondents.
Age
Respondents 60 years and older (36%) are more likely to strongly agree than younger respondents (31% nationwide).
Education attainment
As education levels rise, strong agreement levels decrease. Respondents with school-level (36%) education agree more
strongly than respondents with postgraduate (20%) degrees.
Household income
Level of strong agreement generally falls as household income rises. Respondents with $30-39,999 (41%) in household
income most strongly agree, and those with $200-299,000 (17%) in household income least strongly agree.
Employment status
Homemakers (41%) and retired (38%) respondents have the highest strong agreement. Respondents who are out of work but
not currently looking (17%) and out of work and looking (20%) have the lowest strong agreement.
Family type
Respondents with a one-parent family (42%) have the highest level of strong agreement. Couples with no children (28%);
couples with children (30%); and lone-person (31%) households report lower levels of strong agreement (compared to 30%
nationwide).
Council type
Respondents in large-very large urban developments (37%) are most likely to strongly agree, followed by respondents of
urban fringe (33%); urban regional (31%); and rural and remote (29%) councils. Respondents in urban capital cities (25%)
report the lowest level of strong agreement.

GOVERNANCE AND SERVICE DELIVERY PREFERENCES 40
Communities know enough to make good decisions about what services they need
Close to two-thirds of respondents either strongly agree (30%) or moderately agree (32%) that communities
know enough to make good decisions about what services they need.
Figure 17: Q3_14 Communities know enough to make good decisions about what services they need
(n=1936)
30.4
31.8
16.7
8.7
8.6
3.8
0 5 10 15 20 25 30 35
Strongly agree
Moderately agree
Slightly agree
Slightly disagree
Moderately disagree
Strongly disagree
Percent

GOVERNANCE AND SERVICE DELIVERY PREFERENCES 41
Association highlights
Communities know enough to make good decisions about what services they need
Community participation
Respondents who have actively participated (34%) are more likely to strongly agree than respondents who had not
participated (27%) in local clubs or groups.
Politics
Liberal/National Coalition (35%) voters are more likely to strongly agree than Labor (28%) voters; respondents whose
votes change from election to election (27%); and Greens (27%) voters.
Knowledge of mayor’s name
Respondents who correctly (32%) name their mayor are less likely to strongly agree compared with those who do so
incorrectly (39%).
Gender
Male (25%) respondents are less likely to report strong agreement than female (35%) respondents.
Age
Strong agreement increases with age. Respondents aged 70 and over (40%) most strongly agree, and 18-29 (22%)
year old respondents least strongly agree.
Education attainment
As education levels rise, strong agreement falls. School education (38%) level holders have the highest strong
agreement, and postgraduate (20%) and bachelor (23%) degree-holders have the lowest.
Household income
In general, strong agreement decreases as household income increases. Respondents with household incomes of
$10-$19,000 (40%); $20-$29,000 (47%); and $30-$39,000 (48%) have the highest strong agreement. Those with
household incomes of $150-$199,000 (17%); $200-$299,000 (17%); and $300,000 or more (22%) have the lowest.
Employment status
Respondents who are retired (41%); unable to work (41%); and homemakers (39%) report the highest levels of strong
agreement. Respondents who are students (22%); employed for wages (26%); and out of work but not currently
looking (33%) report the lowest levels of strong agreement.
Family type
Respondents of one-parent families (38%) are most likely to strongly agree. Couples with children (28%) and couples
with no children (31%) have lower levels of strong agreement, while non-family group households have the lowest
(17%).
Council type
Strong agreement is lowest in urban capital cities (22%) and small/medium urban development (24%) councils. It is
highest at urban regional (36%), followed by rural and remote (35%) councils.

GOVERNANCE AND SERVICE DELIVERY PREFERENCES 42
3.1.6 Public value
The following questions relate to different aspects of the role of government, in part as theorised by the
concept of ‘public value’, that is, positive social and economic outcomes valued by the community.
Decisions about how services are delivered in my area should be made primarily on value for
money
20% of respondents moderately agree that decisions about how services are delivered in their area should be
made primarily on value for money, while 16% of respondents strongly agree. A slightly larger proportion
(39%) either strongly disagree (19%) or moderately disagree (20%).
Figure 18: Q3_15 Decisions about how services are delivered in my area should be made primarily on value
for money (n=1934)
15.8
19.7
11.7
13.7
19.8
19.3
0 5 10 15 20 25
Strongly agree
Moderately agree
Slightly agree
Slightly disagree
Moderately disagree
Strongly disagree
Percent

GOVERNANCE AND SERVICE DELIVERY PREFERENCES 43
Association highlights
Decisions about how services are delivered in my area should be made primarily on value for money
Politics
Liberal/National Coalition (21%) voters are most likely to strongly agree, followed by respondents whose votes
change from election to election (19%) and Labor (14%) voters. Greens (3%) voters have the lowest level of strong
agreement.
Knowledge of mayor’s name
Those who name their mayor incorrectly (21%) have the highest strong agreement compared with all other
respondents (16% nationwide).
Age
Strong agreement rises with age. Respondents aged 18 to 49 (range of 11% to 13%) have the lowest levels of strong
agreement. Respondents aged 70 and over (27%) have the highest strong agreement.
Non-English Speaking Background
Respondents of non-English speaking backgrounds (28%) are more likely to strongly agree than English-only (15%)
speakers.
Family type
Lone-person (18%) households and couples with no children (18%) report higher levels of strong agreement
compared with one-parent families (8%) and couples with children (13%).
Employment status
Respondents who are retired (24%) are most likely to strongly agree, followed by those who are self-employed (19%)
and unable to work (19%). Students (4%) are least likely to strongly agree, followed by respondents who are out of
work and looking (8%).
Household income
Overall, as household income rises, strong agreement falls. Strong agreement is highest amongst respondents with
household incomes between $10,000 and $49,999 (range of 21% to 23%). Strong agreement is lower amongst
respondents with household incomes between $150-$199,000 (12%) and $300,000 or more (8%).

GOVERNANCE AND SERVICE DELIVERY PREFERENCES 44
I want governments to deliver services that contribute to a healthier and fairer society
The majority of respondents (80%) strongly agree that they want governments to deliver services that
contribute to a healthier and fairer society, while 15% of respondents moderately agree.
Figure 19: Q3_16 I want governments to deliver services that contribute to a healthier and fairer society
(n=1989)
Association highlights
I want governments to deliver services that contribute to a healthier and fairer society
79.7
15.4
3.3
.5
.4
.6
0 20 40 60 80 100
Strongly agree
Moderately agree
Slightly agree
Slightly disagree
Moderately disagree
Strongly disagree
Percent
Politics
Greens (95%) voters are most likely to strongly agree, followed by Labor (85%) voters and respondents whose voting
preferences change from election to election (81%). Liberal/National Coalition (72%) voters express lower strong
agreement.
Gender
Female (83%) respondents report higher strong agreement compared with male (77%) respondents.
Employment status
Respondents who are out of work and looking for work (87%); students (83%); and employed for wages (82%) most
strongly agree. Respondents who are out of work but not currently looking (60%) least strongly agree.
Working in government and Not-for-Profit
Respondents who work for the government and/or not-for-profit organisations (84%) are more likely to report strong
agreement compared with respondents who work for other organisations (79%).
Housing tenure
Renters (85%) are more likely to express strong agreement compared with respondents whose homes are on a
mortgage or owned outright (79%).
Family type
Respondents of one-parent family (86%) households have the highest strong agreement (compared with 80%
nationwide).
Council type
Urban development small/medium (82%); urban regional (82%); and urban development large/very large (81%)
councils report higher levels of strong agreement. Respondents of urban capital cities (75%) report the lowest levels
of strong agreement.

GOVERNANCE AND SERVICE DELIVERY PREFERENCES 45
The government of my local area has enough ability to deliver services by itself
Just under a third of respondents either strongly (10%) or moderately (21%) agree that the government of their
local area has enough ability to deliver services by itself. A larger proportion (42%), strongly or moderately
disagree.
Figure 20: Q3_17 The government of my local area has enough ability to deliver services by itself (n=1853)
Association highlights
The government of my local area has enough ability to deliver services by itself
9.6
21.4
14.3
13.2
20.2
21.3
0 5 10 15 20 25
Strongly agree
Moderately agree
Slightly agree
Slightly disagree
Moderately disagree
Strongly disagree
Percent
Community participation
Respondents who have actively participated (24%) in the community are more likely to strongly disagree compared
with respondents who have not actively participated (19%) in community clubs, services or groups.
Politics
Greens (23%) and Liberal/National Coalition (22%) voters are most likely to strongly disagree. Labor Party voters (18%)
are least likely to strongly disagree.
Age
Levels of strong disagreement generally rise with age. Strong disagreement is highest amongst 60-69 (29%) year
olds and lowest amongst 18-29 (12%) year olds.
Household income
Levels of strong disagreement rise from household incomes of less than $10,000 (15%) to peak at household
incomes of $40-$49,000 (33%). Then strong disagreement falls overall for respondents with household incomes
between $50-$59,999 (22%) and $300,000 or more (13%).
Family type
Respondents from couples with no children (24%) and couples with children (22%) are more likely to strongly
disagree than respondents of one-parent families (17%).
Council type
Respondents of urban regional (27%) and rural and remote (26%) councils most strongly disagree most. Those of
urban capital city (15%) and urban development small/medium (16%) councils strongly disagree least often.
Employment status
The self-employed (29%) have the highest levels of strong disagreement, followed by those who are out of work but
not currently looking (26%); retired (25%); and homemakers (25%). Students (11%) have the lowest level of strong
disagreement, followed by those who are employed for wages (19%); out of work and looking (20%); and unable to
work (21%).

GOVERNANCE AND SERVICE DELIVERY PREFERENCES 46
There are some services that governments can provide at a higher quality than the private sector
A majority of respondents agree that there are some services that governments can provide at a higher
quality than the private sector. 36% of respondents strongly agree and a further 31% of respondents
moderately agree.
Figure 21: Q3_18 There are some services that governments can provide at a higher quality than the private
sector (n=1874)
Association highlights
There are some services that governments can provide at a higher quality than the private sector
36.1
30.7
15.8
6.2
7.0
4.2
0 5 10 15 20 25 30 35 40
Strongly agree
Moderately agree
Slightly agree
Slightly disagree
Moderately disagree
Strongly disagree
Percent
Politics
Greens (49%) and Labor Party (40%) voters are more likely to strongly agree. Liberal/National voters (27%) are least
likely to strongly agree.
Knowledge of mayor’s name
Respondents who incorrectly name their local mayor (42%) are most likely to strongly agree (36% state wide).
Age
Respondents between 18-29 (36%) and 60-69 (39%) years of age report similar levels of strong agreement. Level of
strong agreement drops amongst respondents older than 70 years (30%).
Employment status
The level of strong agreement is highest amongst homemakers (48%). It is lowest amongst respondents who are
unable to work (27%).
Length of time living in the local area
Respondents who have lived in their local area for a period of less than two years are less likely to strongly agree
(31% compared with 36% nationwide).

GOVERNANCE AND SERVICE DELIVERY PREFERENCES 47
Government should be advocating for the needs of my local community
There is also strong support for the idea that government should be advocating for the needs of the local
community (96% agreement).
Figure 22: Q3_19 Government should be advocating for the needs of my local community (n=1950)
Association highlights
Government should be advocating for the needs of my local community
57.3
29.5
8.8
1.5
1.7
1.3
0 10 20 30 40 50 60 70
Strongly agree
Moderately agree
Slightly agree
Slightly disagree
Moderately disagree
Strongly disagree
Percent
Community participation
Respondents who have actively participated (62%) in clubs, services or groups in their local community are more
likely to strongly agree than those who have not actively participated (53%).
Gender
Female (61%) respondents are more likely to strongly agree compared with male (54%) respondents.
Age
50-59 (64%) year old respondents have the highest level of strong agreement compared with those aged 70 years
and over (48%) or 18-29 (54%).
Employment status
Homemakers (67%) report the highest level of agreement, followed by those who are unable to work (62%) and out
of work and looking (61%). Students (47%) report the lowest level with those who are out of work but not currently
looking for work (52%).
Length of time living in the local area
Respondents who have lived in their local area for a period of less than 2 years (46%) have lower levels of strong
agreement compared with all other respondents (57% nationwide).

GOVERNANCE AND SERVICE DELIVERY PREFERENCES 48
Government should focus on providing only basic services
35% of respondents strongly disagree that government should focus on providing only basic services, while
26% moderately disagree.
Figure 23: Q3_20 Government should focus on providing only basic services (n=1960)
Association highlights
Government should focus on providing only basic services
7.6
11.0
6.6
14.0
25.6
35.2
0 5 10 15 20 25 30 35 40
Strongly agree
Moderately agree
Slightly agree
Slightly disagree
Moderately disagree
Strongly disagree
Percent
Politics
Labor (45%) voters are more likely to strongly disagree (compared with 35% state wide). Respondents who prefer
Liberal/National Coalition (24%) are less likely to strongly disagree.
Knowledge of mayor’s name
Respondents who name their mayor correctly (37%) are more likely to strongly disagree than those who do so
incorrectly (24%).
Gender
Female (40%) respondents are more likely to strongly disagree than male (31%) respondents.
Age
50-59 (41%) and 40-49 (40%) year old respondents have the highest levels of strong disagreement. Respondents
aged 18-29 (28%) and 70 and over (33%) have the lowest.
Employment status
The highest level of strong disagreement is reported by homemakers (47%), followed by those who are unable to
work (42%) and out of work but not currently looking (40%). Students (24%) are least likely to strongly disagree along
with those who are self-employed (30%).
Family type
Respondents who belong to a one-parent family (43%) have the highest level of strong disagreement. Respondents
living in households of a couple with children (36%); couple with no children (35%); and lone-person households
(33%) report lower levels of strong disagreement.

GOVERNANCE AND SERVICE DELIVERY PREFERENCES 49
Governments should use a mixture of public, private and not-for-profit organisations to deliver
public services in my area
50% of respondents strongly agree that governments should use a mixture of public, private and not-for-
profit organisations to deliver public services in their area, while 33% of respondents moderately agree.
Figure 24: Q3_21 Governments should use a mixture of public, private and not-for-profit organisations to
deliver public services in my area (n=1960)
Association highlights
Governments should use a mixture of public, private and not-for-profit organisations to deliver public
services in my area
50.0
33.2
9.4
2.1
2.7
2.7
0 10 20 30 40 50 60
Strongly agree
Moderately agree
Slightly agree
Slightly disagree
Moderately disagree
Strongly disagree
Percent
Politics
Respondents whose voting preferences change from election to election (56%) are most likely to strongly agree.
Liberal/National Coalition (52%) and Labor Party (51%) voters are more likely to strongly agree than Greens (39%)
voters.
Knowledge of mayor’s name
Respondents who correctly (52%) name their mayor are more likely to strongly agree than those who name their
mayor incorrectly (46%).
Employment status
Homemakers (54%) and respondents who are retired (52%) are more likely to strongly agree. Respondents who are
out of work but not currently looking (44%); students (46%); and those who are out of work and looking (48%) are
less likely to strongly agree.
Family type
Couples with no children (56%); non-family group households (56%); and one-parent families (53%) are more likely
to strongly agree. Respondents of lone-person households (44%) are less likely to strongly agree.

GOVERNANCE AND SERVICE DELIVERY PREFERENCES 50
There are times when government exceeds my expectations
A higher proportion of respondents disagree with this statement than agree. 27% of respondents strongly
disagree that there are times when government exceeds their expectations and 20% of respondents
moderately disagree.
Figure 25: Q3_22 There are times when government exceeds my expectations (n=1940)
5.8
16.5
16.8
14.5
19.8
26.6
0 5 10 15 20 25 30
Strongly agree
Moderately agree
Slightly agree
Slightly disagree
Moderately disagree
Strongly disagree
Percent

GOVERNANCE AND SERVICE DELIVERY PREFERENCES 51
Association highlights
There are times when government exceeds my expectations
Politics
Labor Party (27%) voters are more likely to strongly disagree than Greens (21%) and Liberal/National Coalition (22%)
voters. Respondents whose party preferences change from election to election (33%) have the highest level of strong
disagreement.
Age
Levels of strong agreement rise from 18-29 (13%) year olds to 60-69 (38%) year olds, then fall for respondents 70 and
over (32%).
Education attainment
Overall, as the level of education rises, strong disagreement decreases. Respondents with certificate (31%) level
qualifications are most likely to strongly disagree, and postgraduate (20%) and bachelor (21%) degree holders are least
likely to strongly disagree.
Household income
As incomes rise, levels of disagreement fall. Respondents with a household income of $20-$29,999 (40%) are most
likely to strongly disagree, while those who earn $300,000 or more (12%) are least likely to do so.
Employment status
Respondents who are unable to work (48%) and retired (36%) are most likely to strongly disagree. Students (15%) and
individuals who are out of work and looking (18%) are least likely to strongly disagree.
Housing tenure
Compared with renters (22%), respondents with a mortgage or a dwelling owned outright (27%) are more likely to
strongly disagree.
Family type
Compared with one-parent families (32%); couples with no children (30%); and lone-person households (29%),
respondents whose family consists of a couple with children (23%) are likely to have lower levels of strong
disagreement.
Council type
Respondents of urban regional (36%) councils have the highest level of strong disagreement, followed by rural and
remote (29%) and urban fringe (29%) councils. Respondents in urban development small/medium (19%); urban capital
city (21%); and urban development large/very large (22%) councils have lower levels of strong disagreement.

GOVERNANCE AND SERVICE DELIVERY PREFERENCES 52
Governments should work with each other and other service providers to provide local services
The majority of respondents, 70% strongly agree that governments should work with each other and other
service providers to provide local services, while 22% moderately agree.
Figure 26: Q3_23 Governments should to work with each other and other service providers to provide local
services (n=1993)
Association highlights
Governments should to work with each other and other service providers to provide local services
70.2
22.2
5.6
.9
.4
.7
0 10 20 30 40 50 60 70 80
Strongly agree
Moderately agree
Slightly agree
Slightly disagree
Moderately disagree
Strongly disagree
Percent
Age
Levels of strong agreement rise between 18-29 year olds (64%) and 50-59 year olds (75%), then fall for those aged
over 70 (68%).
Employment status
Individuals who are unable to work (75%); homemakers (73%); employed for wages (72%); and retired (71%) are more
likely to have higher levels of strong agreement. Those who are out of work but not currently looking (57%); students
(59%); and out of work and looking (59%) have lower levels of strong agreement.
Dwelling type
Dwellers of flats, units or apartments of 4 stories or more (85%) are more likely to strongly agree compared with
respondents living in a separate house (71%) and dwellers of flats, units or apartments of 3 stories or less (65%).
Family type
Non-group family households (75%) have the highest strong agreement, followed by couples with no children (74%)
and couples with children (72%). Individuals of lone-person households (66%) and one-parent families (68%) voice
lower levels of strong agreement.
Length of time living in the local area
Individuals who have lived in their local area for less than 2 years (62%) have low levels of strong agreement in
comparison with all other respondents (70% community-wide).

GOVERNANCE AND SERVICE DELIVERY PREFERENCES 53
Government delivers the best quality services
A high proportion of respondents disagreed that government delivers the best quality services with 24% of
respondents moderately disagreeing and a further 15% of respondents strongly disagreeing. Only 6% of
respondents strongly agree and 19% of respondents moderately agree that government delivers the best
quality services.
Figure 27: Q3_24 Government delivers the best quality services (n=1869)
Association highlights
Government delivers the best quality services
6.0
19.3
17.1
19.1
23.6
14.8
0 5 10 15 20 25
Strongly agree
Moderately agree
Slightly agree
Slightly disagree
Moderately disagree
Strongly disagree
Percent
Age
Levels of strong disagreement increase between 18-29 year olds (6%) and 60-69 year olds (26%). Strong
disagreement then decreases amongst respondents aged 70 and over (18%).
Employment status
Students (2%) have the lowest level of strong disagreement (compared with 15% nationwide).
Family type
Respondents of non-family group households (24%) have the highest strong agreement, followed by those of lone-
person (18%) households. Families of couples with children (13%) have the lowest level.
Length of time living in the local area
Strong disagreement increases with length of residency in local area. Respondents with residencies more than 10
years (16%) have the highest level of strong disagreement, while those with residencies less than 2 years (11%) have
the lowest.

GOVERNANCE AND SERVICE DELIVERY PREFERENCES 54
It is acceptable for services in one area to be delivered differently to services in another area
32% of respondents moderately agree that it is acceptable for services in one area to be delivered differently
to services in another area, while 31% of respondents strongly agree.
Figure 28: Q3_25 It is acceptable for services in one area to be delivered differently to services in another
area (n=1947)
Association highlights
It is acceptable for services in one area to be delivered differently to services in another area
31.0
32.3
12.3
4.5
7.0
13.0
0 5 10 15 20 25 30 35
Strongly agree
Moderately agree
Slightly agree
Slightly disagree
Moderately disagree
Strongly disagree
Percent
Community participation
People who have been actively involved in the community in the past year (33%) are more likely to strongly agree
than those who have not been active (28%).
Politics
Liberal/National Colation (34%) voters are more likely to strongly agree than people who vote for the Greens (28%).
Education attainment
People with university degrees are more likely to strongly agree compared with those who have school level edcation
(27% for school level qualifications compared with 42% for postgraduate degree level qualifications).
Employment status
People employed (33%), self-employed (35%), homemakers (33%) or retired (30%) are more likely to strongly agree
than those who are out of work but not currently looking for work (13%) and unable to work (13%).
Dwelling type
People who live in a separate house (32%) or semi-detached, row or terrace house (32%) are more likely to strongly
agree than apartment dwellers (27%).
Family type
Group households (38%) are more likely to strongly agree than the general community (31%).
Length of time living in local area
People who have lived in their local area for less than 2 years (25%) show the lowest levels of strong agreement (31%
nationwide).

GOVERNANCE AND SERVICE DELIVERY PREFERENCES 55
3.2 Relative level of agreement across the 25 governance and service delivery statements
Figure 29: Relative level of agreement with service delivery questions
0% 10% 20% 30% 40% 50% 60% 70% 80% 90% 100%
Communities need to work with experts and public servants to make good decisions about what services they need (n=1983)
I want government to involve me in making decisions about what services are delivered in my local area (n=1983)
Governments and communities should make decisions together about how services are delivered (n=1994)
Government should only provide services where the private sector doesn't (n=1940)
The market should decide what services are delivered based on levels of demand (n=1907)
The private sector delivers the best value services (n=1852)
There is a role for government in providing any of the services the community needs (n=1961)
There are some things like health care and education that governments should deliver (n=1998)
My taxes should only pay for basic services (n=1907)
I am prepared to pay more taxes to get a broader range of public services (n=1908)
The people who work in government have enough knowledge to decide what services are needed in my area (n=1945)
Service providers have the best knowledge about how services should be delivered (n=1938)
People who are using a service will best know how much of any particular service is needed (n=1926)
Communities know enough to make good decisions about what services they need (n=1936)
Decisions about how services are delivered in my area should be made primarily on value for money (n=1934)
I want governments to deliver services that contribute to a healthier and fairer society (n=1989)
The government of my local area has enough ability to deliver services by itself (n=1853)
There are some services that governments can provide at a higher quality than the private sector (n=1874)
Government should be advocating for the needs of my local community (n=1950)
Government should focus on providing only basic services (n=1960)
Governments should use a mixture of public, private and not-for-profit organisations to deliver public services in my area…
There are times when government exceeds my expectations (n=1940)
Governments should to work with each other and other service providers to provide local services (n=1993)
Government delivers the best quality services (n=1869)
It is acceptable for services in one area to be delivered differently to services in another area (n=1947)
Strongly agree Moderately agree Slightly agree Slightly disagree Moderately disagree Strongly disagree
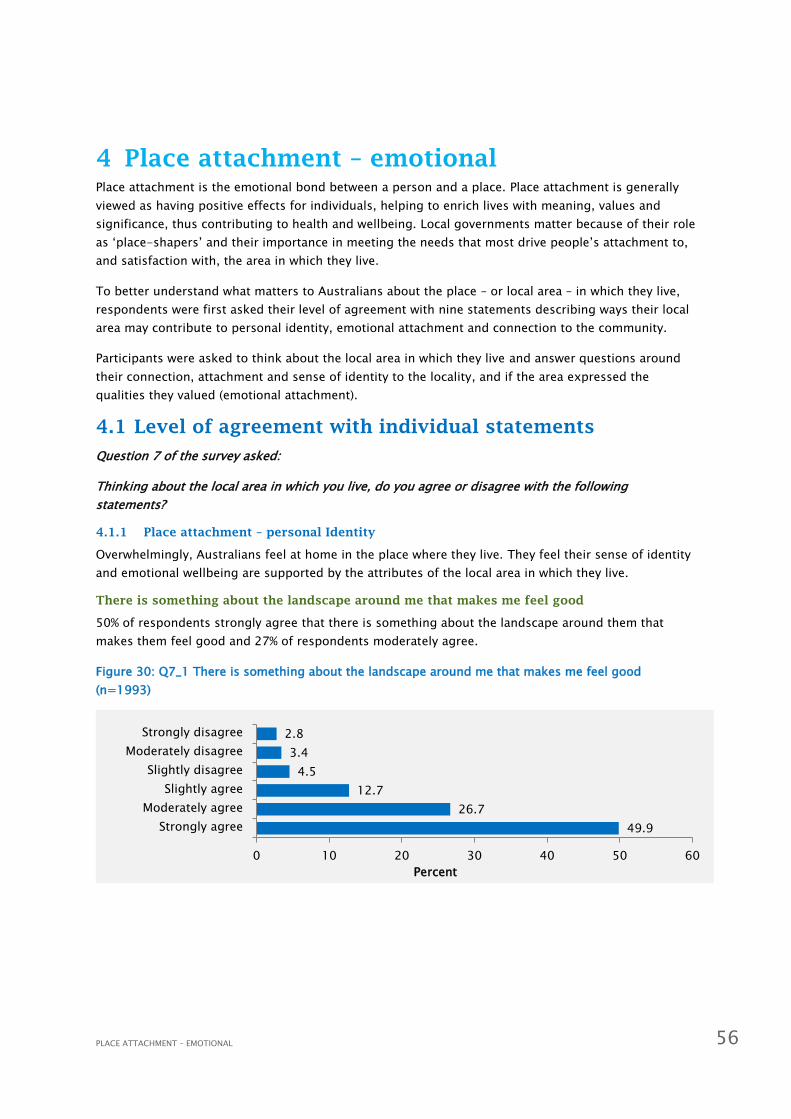
PLACE ATTACHMENT – EMOTIONAL 56
4 Place attachment – emotional
Place attachment is the emotional bond between a person and a place. Place attachment is generally
viewed as having positive effects for individuals, helping to enrich lives with meaning, values and
significance, thus contributing to health and wellbeing. Local governments matter because of their role
as ‘place-shapers’ and their importance in meeting the needs that most drive people’s attachment to,
and satisfaction with, the area in which they live.
To better understand what matters to Australians about the place – or local area – in which they live,
respondents were first asked their level of agreement with nine statements describing ways their local
area may contribute to personal identity, emotional attachment and connection to the community.
Participants were asked to think about the local area in which they live and answer questions around
their connection, attachment and sense of identity to the locality, and if the area expressed the
qualities they valued (emotional attachment).
4.1 Level of agreement with individual statements
Question 7 of the survey asked:
Thinking about the local area in which you live, do you agree or disagree with the following
statements?
4.1.1 Place attachment – personal Identity
Overwhelmingly, Australians feel at home in the place where they live. They feel their sense of identity
and emotional wellbeing are supported by the attributes of the local area in which they live.
There is something about the landscape around me that makes me feel good
50% of respondents strongly agree that there is something about the landscape around them that
makes them feel good and 27% of respondents moderately agree.
Figure 30: Q7_1 There is something about the landscape around me that makes me feel good
(n=1993)
49.9
26.7
12.7
4.5
3.4
2.8
0 10 20 30 40 50 60
Strongly agree
Moderately agree
Slightly agree
Slightly disagree
Moderately disagree
Strongly disagree
Percent

PLACE ATTACHMENT – EMOTIONAL 57
Association highlights
There is something about the landscape around me that makes me feel good
Community participation
People who have been active in their community in the past year (54%) are more likely to strongly agree than those
who have not (46%).
Politics
Labor (53%) voters are more likely to strongly agree when compared with Greens (47%) voters or those who change
from election to election (46%).
Knowledge of mayor’s name
Those that can correctly identify the name of their local mayor (55%) are more likely to strongly agree than those who
are incorrect (47%).
Age
Levels of strong agreement increase with age. (36% for people aged 18-29 compared with 64% for people 70 and
older).
Education attainment
Bachelor degree level holders (43%) have lower levels of strong agreement compared with the general community
(50%).
Employment status
People self-employed (56%), unable to work (58%) or retired (65%) have higher levels of strong agreement compared
with those out of work and looking for work (36%) and students (34%).
Housing tenure
Levels of strong agreement are higher for people who mortgage or own their home outright (52%) than renters (40%).
Dwelling type
Levels of strong agreement are lower for those living in a separate house (52%) and in a semi-detached or similar
house(41%), than those in a flat, unit, or apartment with 4 stories or more (66%).
Family type
Couples with no children (56%) are more likely to strongly agree than one parent families (45%) and group households
(38%).
Length of time living in local area
Levels of strong agreement increase with length of residency. People who have been living in the local area for less
than 2 years (23%) have lower levels of strong agreement than those living in the area for more than 10 years (54%).
Council type
People living in rural and remote areas (58%) and urban regional areas (58%) are more likely to strongly agree than
those living in urban capital cities (41%) or large/very large urban developments (41%).

PLACE ATTACHMENT – EMOTIONAL 58
It reflects the type of person I am
30% of respondents strongly agree their local area reflects the type of person they are and 29% of
respondents moderately agree.
Figure 31: Q7_2 It reflects the type of person I am (n=1950)
29.9
29.4
17.8
9.3
7.6
6.0
0 5 10 15 20 25 30 35
Strongly agree
Moderately agree
Slightly agree
Slightly disagree
Moderately disagree
Strongly disagree
Percent

PLACE ATTACHMENT – EMOTIONAL 59
Association highlights
It reflects the type of person I am
Community participation
Those who have been actively involved in their community in the past year (34%) are more likely to strongly agree
than those who have not been active in their community (27%).
Politics
Liberal/National (33%) Party voters are more likely to strongly agree than those who vote for the Greens (25%).
Knowledge of mayor’s name
People who can correctly (35%) name their mayor have higher levels of strong agreement than those are incorrect
(32%) or didn’t know (26%).
Gender
Women (33%) are more likely than men (27%) to strongly agree.
Age
Strong agreement increases with age, with those aged 18-29 (21%) less likely to strongly agree than those who are
70 years and older (41%).
Education attainment
People with vocational qualifications are more likely to strongly agree than those who have university level
qualifications (34% for school level education compared with 24% for postgraduate degrees).
Employment status
Students (12%) have the lowest levels of strong agreement, and those who are out of work and looking for work (21%)
are also less likely to strongly agree. People who are retired (40%) show the highest levels of strong agreement with
the statement.
Housing tenure
People who mortgage or own their home are more likely to strongly agree than renters (31% compared with 25%).
Family type
Couples with no children (34%) and lone person households (33%) are more likely to strongly agree than non-family
group households (15%).
Length of time living in local area
People who have lived in their local area for less than 2 years (21%) are less likely to strongly agree than people who
have lived in their local areas for more than 10 years (34%).
Council type
Respondents from urban regional (35%) and rural and remote areas (33%) are more likely to strongly agree than
those from urban capital cities (27%) and small to large urban developments (26%-27%).
State
Respondents living in Western Australia (23%) are less likely to strongly agree (compared with 30% nationwide).

PLACE ATTACHMENT – EMOTIONAL 60
The area in which I live has the qualities I value
46% of respondents strongly agree that the area in which they live has the qualities they value and 32%
of respondents moderately agree.
Figure 32: Q7_3 The area in which I live has the qualities I value (n=1979)
45.6
32.2
13.4
3.6
3.2
2.0
0 10 20 30 40 50
Strongly agree
Moderately agree
Slightly agree
Slightly disagree
Moderately disagree
Strongly disagree
Percent

PLACE ATTACHMENT – EMOTIONAL 61
Association highlights
The area in which I live has the qualities I value
Community participation
People who have participated in community activities (50%) are more likely than those who have not (42%) to strongly
agree.
Politics
Liberal/National coalition voters (55%) are more likely to strongly agree than Labor (44%) voters.
Age
As age increases, levels of strong agreement also rise (29% for people aged 18-29 compared with 44% for people
aged 40-49 and 65% for people 70 and over).
Housing tenure
People who mortgage or own their home outright (49%) are more likely to strongly agree than people who are renting
(33%).
Dwelling type
People who live in a flat, unit or apartment of 4 stories or more (76%) are more likely to strongly agree (45%
community-wide).
Family type
Couples with no children (52%) and lone person households (51%) have higher levels of strong agreement, compared
with non-family group households (16%).
Length of time living in local area
As length of residency increases, levels of strong agreement also rise (23% for those living in their local area for less
than 2 years compared with 35% for those who have lived in their local area for 2-5 years and 50% for those living in
their local area for more than 10 years).
Council type
Respondents living in rural and remote areas (54%) have higher levels of strong agreement than those who live in
small/medium urban developments (42%) and the urban fringe (41%).
State
People living in Western Australia (33%) have the lowest level of agreement (compared with 45% nationwide).

PLACE ATTACHMENT – EMOTIONAL 62
I feel at home there
67% of respondents strongly agree that they feel at home in their local area and 22% of respondents
moderately agree.
Figure 33: Q7_5 I feel at home there (n=1995)
66.5
21.5
7.0
1.6
1.8
1.7
0 10 20 30 40 50 60 70
Strongly agree
Moderately agree
Slightly agree
Slightly disagree
Moderately disagree
Strongly disagree

PLACE ATTACHMENT – EMOTIONAL 63
Association highlights
I feel at home there
Community participation
People who have participated in their community in the past 12 months (71%) are more likely to strongly agree than
those who have not participated (63%).
Politics
Greens voters (62%) and those who change from election to election (58%) are less likely to strongly agree (compared
with 67% nationwide).
Knowledge of mayor’s name
People who correctly name their local mayor (73%) are more likely to strongly agree compared with people who do
not know (60%) the name of their local mayor.
Age
Strong agreement increases with age with younger respondents less likely to strongly agree than older respondents
(56% for 18-29 year olds compared with 78% for people 70 and older).
Employment status
People out of work but not currently looking for work (46%) and students (48%) are less likely to strongly agree than
people who are retired (78%) or self-employed (74%).
Housing tenure
People with mortgaged or owned outright homes (70%) are more likely than renters (52%) to strongly agree.
Family type
People who live in group households (non-family) are less likely to strongly agree (17% compared with 67%
nationwide).
Length of time living in local area
Strong agreement increases as residency increases (36% for people who have lived in their local area for less than 2
years compared with 73% for people who have lived in their local area for more than 10 years).
State
People living in Western Australia are less likely to strongly agree (60% compared with 66% nationwide).

PLACE ATTACHMENT – EMOTIONAL 64
I feel connected locally to friends and neighbours
44% of respondents strongly agree that they feel connected locally to friends and neighbours and 31%
of respondents moderately agree.
Figure 34: Q7_7 I feel connected locally to friends and neighbours (n= 1992)
43.6
31.4
14.8
4.1
3.3
2.8
0 10 20 30 40 50
Strongly agree
Moderately agree
Slightly agree
Slightly disagree
Moderately disagree
Strongly disagree
Percent

PLACE ATTACHMENT – EMOTIONAL 65
Association highlights
I feel connected locally to friends and neighbours
Community participation
People who have participated in their community in the past 12 months (51%) are more likely to strongly agree than those
who have not participated (37%).
Politics
Greens (39%) voters are less likely to strongly agree than people who vote Liberal/National Coalition (47%) or Labor (48%).
Knowledge of mayor’s name
People who correctly name their local mayor (50%) are more likely to strongly agree compared with people who do not
know (38%) or incorrectly (41%) named their mayor.
Gender
Women (47%) are more likely than
men (40%) to strongly agree.
Age
Strong agreement increases with age. Younger respondents less likely to strongly agree than older respondents (30% for
18-29 year olds compared with 60% for people 70 and older).
Employment status
Students (24%), people out of work and looking for work (33%) or employed for wages (40%) are less likely to strongly
agree than the self-employed (55%), retired (54%) or people unable to work (53%).
Housing tenure
People with mortgaged or owned outright homes (47%) are more likely than renters (29%) to strongly agree.
Dwelling type
Respondents who live in apartments with 4 stories or more (54%) are more likely to strongly agree (compared with 44%
community-wide).
Family type
Lowest levels of strong agreement come from group households (20%) followed by one parent families (37% compared
with 44% nationwide).
Length of time living in local area
As length of residency increases, agreement levels rise (21% for people who have lived in their local area for less than 2
years compared with 50% for people who have lived in their local area for more than 10 years).
Council type
People who live in rural and remote areas (50%) are more likely to strongly agree than people who live in urban capital
cities (38%).
State
People living in New South Wales (50%) are more likely to strongly agree than people living in Western Australia (33%).
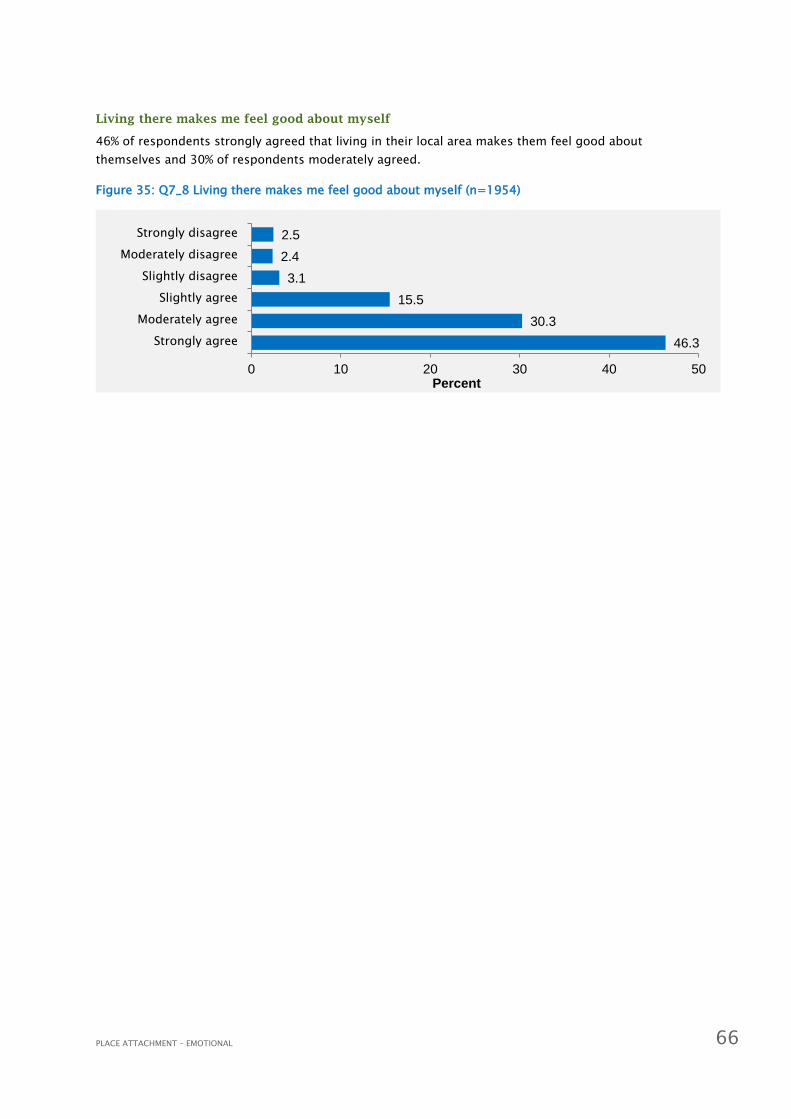
PLACE ATTACHMENT – EMOTIONAL 66
Living there makes me feel good about myself
46% of respondents strongly agreed that living in their local area makes them feel good about
themselves and 30% of respondents moderately agreed.
Figure 35: Q7_8 Living there makes me feel good about myself (n=1954)
46.3
30.3
15.5
3.1
2.4
2.5
0 10 20 30 40 50
Strongly agree
Moderately agree
Slightly agree
Slightly disagree
Moderately disagree
Strongly disagree
Percent

PLACE ATTACHMENT – EMOTIONAL 67
Association highlights
Living there makes me feel good about myself
Community participation
People who have actively participated in their community in the past year (51%) are more likely to strongly agree than
those who have not participated (42%).
Politics
Liberal/National Coalition (53%) voters are more likely to strongly agree than people who identify with Labor (48%) or
the Greens (37%).
Knowledge of mayor’s name
People who can correctly identify (51%) the name of their local mayor are more likely to strongly agree than people are
incorrect (40%) or don’t know (43%).
Age
As age increases levels of strong agreement also rise (28% for 18-29 year olds compared with 64% for people 70 and
older).
Education attainment
As education attainment rise levels of strong agreement fall (48% for school education qualifications compared with
43% for postgraduate degree holders).
Employment status
Respondents who are retired (64%) are more likely to strongly agree compared with students (23%) and those who are
out of work and looking for work (22%).
Housing tenure
People who mortgage or own their home (49%) are more likely to strongly agree compared with renters (34%).
Dwelling type
Respondents who live in apartments of 4 stories or more are more likely to strongly agree (60% compared with 46%
nationwide).
Family type
Group households (23%) are less likely to strongly agree compared with the general community (47%).
Length of time living in local area
As respondents’ residency increases, levels of strong agreement also rise (27% for less than 2 years compared with 51%
for more than 10 years).
State
People living in Western Australia are less likely to strongly agree (40% compared with 46% nationwide).

PLACE ATTACHMENT – EMOTIONAL 68
4.1.2 Place Attachment – emotional connection
I feel a part of the history of the place
20% of respondents strongly agree that they feel part of the history of the place in which they live and
22% of respondents moderately agree.
Figure 36: Q7_4 I feel part of the history of the place (n=1983)
19.9
22.2
15.6
14.5
12.8
15.1
0 5 10 15 20 25
Strongly agree
Moderately agree
Slightly agree
Slightly disagree
Moderately disagree
Strongly disagree
Percent

PLACE ATTACHMENT – EMOTIONAL 69
Association highlights
I feel a part of the history of the place
Community participation
People who have participated in their community in the past 12 months (24%) are more likely to strongly agree than
those who have not participated (16%).
Politics
Liberal/National Coalition voters (25%) are more likely than Labor (20%) or Greens (11%) voters to strongly agree.
Knowledge of mayor’s name
People who did not know (14%) the name of their local mayor are much less likely to strongly agree than those who
are correct (26%).
Age
Strong agreement increases with age with younger respondents less likely to strongly agree than older respondents
(12% for 18-29 year olds compared with 37% for people 70 and older).
Household Income
As household income rises there is a general decline in strong agreement (35% for incomes of $10,000-$19,999
compared with 19% for incomes of $300,000 or more).
Employment Status
Students (4%) have the lowest level of strong agreement while people who are retired (32%) have the highest level of
strong agreement.
Housing tenure
People with mortgaged or owned outright (22%) houses are more likely than renters (12%) to strongly agree.
Family type
Couples with children (16%) are less likely to strongly agree when compared with couples with no children (24%), lone
person households (23%), non-family group households (22%) and one parent families (22%).
Length of time living in local area
People living in an area for more than 10 years (26%) are more likely to strongly agree than people living in an area
for less than 2 years (6%).
Council type
Rural and remote areas (25%) are more likely to strongly agree (20% for the general community).
State
People living in Western Australia (12%) are less likely to strongly agree (compared with 20% nationwide).

PLACE ATTACHMENT – EMOTIONAL 70
The area in which I live is full of important memories and stories
36% of respondents strongly agree that the area in which they live is full of important memories and
stories and 26% of respondents moderately agree.
Figure 37: Q7_6 The area in which I live is full of important memories and stories (n=1969)
36.2
25.6
15.4
8.1
7.6
7.1
0 10 20 30 40
Strongly agree
Moderately agree
Slightly agree
Slightly disagree
Moderately disagree
Strongly disagree
Percent

PLACE ATTACHMENT – EMOTIONAL 71
Association highlights
The area in which I live is full of important memories and stories
Community participation
People who have participated in their community in the past 12 months (40%) are more likely to strongly agree than
those who have not participated (32%).
Politics
Greens (32%) voters or voters who change from election to election (28%) are less likely to strongly agree than
Liberal/National Coalition (42%) voters.
Knowledge of mayor’s name
People who correctly name their local mayor (42%) are more likely to strongly agree compared with those who do not
know (31%) or incorrectly reported (35%) who their local mayor is.
Gender
Women (40%) are more likely to strongly agree than men (33%).
Age
Generally, as age increases, levels of strong agreement also increase, (28-34% for 18-39 year olds compared with
46% for people 70 and older).
Education attainment
Generally, strong agreement decreases as education attainment increases (40% for school education compared with
35% for bachelor degrees and 24% postgraduate degrees).
Employment status
Respondents out of work but not looking for work (44%), retired (43%) or self-employed (42%) are more likely to
strongly agree than people out of work and looking for work (28%) and students (25%).
Housing tenure
People who mortgage or own their home (39%) are more likely to strongly agree than renters (26%).
Family type
Group households (16%) are less likely to strongly agree compared with the general community (36%).
Length of time living in local area
Strong agreement increases as length of residency increases (8% for people who have lived in their local area for less
than 2 years compared with 46% for people who have lived in their local area for more than 10 years).
Council type
People who live in rural and remote areas (44%) are more likely to strongly agree than people who live in urban capital
cities (28%).
State
People living in Western Australia are less likely to strongly agree (27% compared with 36% nationwide).

PLACE ATTACHMENT – EMOTIONAL 72
I feel a cultural connection to the area
25% of respondents strongly agree that they feel a cultural connection to the area in which they live
and 24% of respondents moderately agree.
Figure 38: Q7_9 I feel a cultural connection to the area (n=1963)
24.6
24.0
17.4
12.6
11.7
9.6
0 5 10 15 20 25 30
Strongly agree
Moderately agree
Slightly agree
Slightly disagree
Moderately disagree
Strongly disagree
Percent

PLACE ATTACHMENT – EMOTIONAL 73
Association highlights
I feel a cultural connection to the area
Community participation
People who have actively participated in their community in the past year (30%) are more likely to strongly agree than
those who have not participated (20%).
Politics
Liberal/National Coalition (31%) voters are more likely to strongly agree than people who identify with Labor (24%) or
the Greens (21%).
Knowledge of mayor’s name
People who correctly identify (30%) the name of their local mayor are more likely to strongly agree than people are
incorrect (26%) or don’t know (20%).
Gender
Women (28%) are more likely than men (21%) to strongly agree.
Age
As age increases levels of strong agreement increase (13% for 18-29 year olds compared with 39% for people 70 and
older).
Education attainment
Strong agreement is more likely among people with school education (27%) and certificate (26%) level qualifications
compared with bachelor (21%) or postgraduate (21%) degree holders.
Employment status
Respondents who are retired (35%), self-employed (34%) or unable to work (32%) are more likely to strongly agree
compared with students (14%).
Housing tenure
People who mortgage or own their home (27%) are more likely to strongly agree compared with renters (15%).
Dwelling type
Respondents who live in apartments of 4 stories or more are more likely to strongly agree (30% compared with 25%
community-wide).
Family type
Group households (11%) are less likely to strongly agree compared with the general community (25%).
Length of time living in local area
Generally, as respondents’ length of residency increases, levels of strong agreement rise (13% for less than 2 years
compared with 30% for more than 10 years).
State
People living in Western Australia are less likely to strongly agree (16% compared with 25% nationwide).

PLACE ATTACHMENT – EMOTIONAL 74
4.2 Relative level of agreement across the nine emotional place attachment statements
Figure 39: Relative level of agreement across the nine emotional place attachment statements
49.9
29.9
45.6
43.6
46.3
66.5
19.9
24.6
36.2
26.7
29.4
32.2
31.4
30.3
21.5
22.2
24.0
25.6
12.7
17.8
13.4
14.8
15.5
7.0
15.6
17.4
15.4
4.5
9.3
3.6
4.1
3.1
1.6
14.5
12.6
8.1
3.4
7.6
3.2
3.3
2.4
1.8
12.8
11.7
7.6
2.8
6.0
2.0
2.8
2.5
1.7
15.1
9.6
7.1
0% 20% 40% 60% 80% 100%
There is something about the landscape that makes me feel good
(n=1993)
It reflects the type of person I am (n=1950)
The area in which I live has the qualities I value (n=1979)
I feel connected locally to friends and neighbours (n=1992)
Living there makes me feel good about myself (n=1954)
I feel at home there (n=1995)
I feel part of the history of the place (n=1983)
I feel a cultural connection to the area (n=1963)
The area in which I live is full of important memories and stories
(n=1969)
Strongly agree Moderately agree Slightly agree Slightly disagree Moderately disagree Strongly disagree

PLACE ATTACHMENT – EMOTIONAL 75
This page is intentionally blank

PLACE ATTACHMENT – INSTRUMENTAL 76
5 Place attachment – instrumental
Respondents were asked to rate the importance of, and their satisfaction with, 15 different areas of
service delivery, infrastructure and community services that are typically provided by local
government, or over which local government exerts an influence through planning, policy, and
advocacy. These are a ll aspects of the ‘instrumental’ features of place that drive our satisfaction with
the area in which we live, and have been shown to be the most important triggers for people moving
to, or aspiring to move to, another area.
5.1 Level of importance of each individual dimension of
place attachment
Question 8 of the survey asked:
Thinking about the local area in which you live, how important are each of the following to you?
Recreational areas such as parks, walking tracks, open spaces
36% of respondents feel the presence of recreational areas in their local area is extremely important,
and 40% feel it to be very important.
Figure 40: Q8_1 Recreational areas such as parks, walking tracks, open spaces (n=2004)
1.7
4.6
18.6
39.6
35.5
0 10 20 30 40 50
Not at all important
Slightly important
Moderately important
Very important
Extremely important
Percent

PLACE ATTACHMENT – INSTRUMENTAL 77
Association highlights
Recreational areas such as parks, walking tracks, open spaces
Politics
Greens (40%) and Labor (39%) voters are more likely think it is extremely important compared with Liberal/National
(34%) voters. Respondents whose votes change from election to election (31%) are least likely.
Age
Ratings of extremely important are lower amongst 18-29 (31%) year olds and respondents aged 70 and over (29%
vs. 36% nationwide).
Education attainment
Bachelor (31%) degree holders are less likely to rate these facilities as being extremely important compared with all
other respondents (36% nationwide).
Employment status
Respondents who are unable to work (42%) and self-employed (40%) have the highest ‘extremely important’ ratings.
Those who are out of work but not currently looking (25%) and out of work and currently looking (29%) report the
lowest.
Family type
Couples with no children (36%); couples with children (39%); and one parent families (41%) are more likely to report
extreme importance than lone-person households (26%).
Council type
Respondents in urban development small/medium (39%) councils report the highest extreme importance, while
those in urban capital cities (33%) and urban development large/very large (33%) councils report the lowest.

PLACE ATTACHMENT – INSTRUMENTAL 78
Availability of appropriate public services
29% of respondents feel the availability of appropriate public services in their local area is extremely
important, a further 40% felt it to be very important.
Figure 41: Q8_2 Availability of appropriate public services (n=2000)
Association highlights
Availability of appropriate public services
1.7
5.9
23.0
40.2
29.3
0 10 20 30 40 50
Not at all important
Slightly important
Moderately…
Very important
Extremely important
Percent
Politics
Labor (34%) and Greens (31%) voters are more likely to report these services being extremely important compared
with Liberal/National (26%) voters and individuals whose votes change from election to election (27%).
Gender
Female (34%) respondents are more likely to rate these services as being extremely important compared with male
(24%) respondents.
Education attainment
School-level (30%); certificate (36%); and diploma/advanced diploma (32%) qualification holders are more likely to
report extreme importance than bachelor (23%) and postgraduate (26%) degree holders.
Employment status
Ratings of extreme importance are highest amongst respondents who are unable to work (44%) and homemakers
(43%). It is lowest amongst students (22% vs. 29% nationwide).
Housing tenure
Renters (33%) report higher levels extreme importance than respondents whose homes are mortgaged or owned
outright (28%).
Dwelling type
Ratings of ‘extremely important’ are higher for respondents living in flats, units or apartments of 3 stories or less
(35%) and 4 stories or more (33%) compared with those who live in semi-detached, townhouse etc. (25%) and separate
houses (29%).
Council type
The highest ‘extremely important’ level is reported by respondents of urban regional (34%) councils and the lowest by
respondents of urban development small/medium (24% vs. 29% nationwide).

PLACE ATTACHMENT – INSTRUMENTAL 79
Availability of good schools
36% of respondents feel the availability of good schools in their local area is extremely important,
while 33% feel it to be very important.
Figure 42: Q8_3 Availability of good schools (n=1994)
Association highlights
Availability of good schools
12.6
6.8
12.1
32.7
35.7
0 10 20 30 40
Not at all important
Slightly important
Moderately important
Very important
Extremely important
Percent
Politics
Labor (41%) and Greens (38%) voters are most likely to report extreme importance compared with Liberal/National (32%) voters and
respondents whose votes change from election to election (33%).
Gender
Female (40%) respondents report higher of extreme importance than male (32%) respondents.
Age
Ratings of extreme importance generally decrease with age. 30–39 (48%) year old respondents are most likely to report extreme
importance compared with respondents aged 70 and over (20%).
Non-English speaking background
Respondents who speak a language other than English (44%) have higher ratings of extreme importance compared with English-only
(35%) speakers.
Education attainment
Respondents with bachelor (31%) degree qualifications are less likely to have ‘extremely important’ ratings compared with all other
respondents (36% nationwide).
Household income
Overall, ratings of extreme importance increase with income levels. Ratings of ‘extremely important’ are lower for respondents with
household incomes of $10-$19,000 (26%); $20-$29,000 (30%) and higher for those with household incomes of $200-$299,000 (40%);
and $300,000 or more (53%).
Employment status
‘Extremely important’ ratings are highest for homemakers (57%); respondents who are out of work but not currently looking (50%); and
unable to work (49%). They are lowest for respondents who are out of work and looking (24%); retired (24%); and students (31%).
Family type
Respondents whose families consist of one parent (48%) and couples with children (47%) report higher extreme importance compared
with lone person households (18%); non-family group households (21%); and couples with no children (28%).
Council type
Respondents of urban capital cities (28%) and urban development small/medium (29%) councils have the lowest ‘extremely important’
ratings. Those in urban regional (41%) and rural and remote councils (39%) have the highest.

PLACE ATTACHMENT – INSTRUMENTAL 80
Availability of healthcare
48% of respondents feel the availability of healthcare in their local area is extremely important, while
38% feel it to be very important.
Figure 43: Q8_4 Availability of healthcare (n=2003)
Association highlights
Availability of healthcare
.5
2.5
11.1
37.8
48.2
0 10 20 30 40 50 60
Not at all important
Slightly important
Moderately important
Very important
Extremely important
Percent
Politics
Labor (52%) voters and respondents whose voting preferences change from election to election (50%) are more likely
than Liberal/National (45%) and Greens (45%) voters to believe this is extremely important.
Gender
Female (51%) respondents report higher extreme importance compared with male (45%) respondents.
Education attainment
Respondents with diploma/advanced diploma (54%); school (52%); and certificate (50%) level qualifications have
higher levels of extreme importance compared with bachelor (39%) and postgraduate (46%) degree holders.
Employment status
The highest level of extreme importance is reported by respondents who are unable to work (63%), followed by
homemakers (52%) and retired (52%). The lowest is reported by respondents who are out of work but not currently
looking (36%), followed by those who are out of work and looking (43%).
Housing type
Respondents who live in flats, units or apartments of 3 stories or less (53%) and 4 stories and more (53%) are more
likely to report higher extreme importance than those who live in semi-detached or similar (43%) and separate
houses (48%).
Council
Individuals living in urban regional (53%); rural and remote (52%); and urban fringe (49%) councils are more likely to
have higher ‘extremely important’ ratings than those in urban capital cities (35%)

PLACE ATTACHMENT – INSTRUMENTAL 81
A supportive and cohesive community
25% of respondents feel the presence of a supportive and cohesive community in their local area is
extremely important, while 39% feel it to be very important.
Figure 44: Q8_5 A supportive and cohesive community (n=1995)
Association highlights
A supportive and cohesive community
2.1
7.8
26.4
39.2
24.5
0 5 10 15 20 25 30 35 40 45
Not at all important
Slightly important
Moderately important
Very important
Extremely important
Percent
Community participation
Ratings of ‘extremely important’ are likely to be higher amongst respondents who have actively participated (29%) than those
who have not actively participated (21%) in clubs, services or groups in the community.
Knowledge of mayor’s name
Respondents who name their major incorrectly (33%) are more likely to report extreme importance compared with those who
do not know (22%) or correctly (26%) do so.
Gender
Female (27%) respondents have higher extreme importance than male (22%) respondents.
Education attainment
Extreme importance is higher amongst certificate (30%); diploma/advanced diploma (30%); and school-level (26%) qualification
holders compare with respondents who have postgraduate (20%) and bachelor degrees (20%).
Employment status
Individuals who are unable to work (50%) report the highest extreme importance. Students (17%) report the lowest (25%
community wide).
Housing type
Extreme importance is highest for respondents who live in flats, units or apartments of 4 stories or more (29%) compared with
those living in semi-detached and similar houses (20%), flats, units or apartments of 3 stories or less (24%), and separate
houses (25%).
Family type
Respondents of one-parent families (32%) are most likely to report extreme importance, followed by couples with children
(26%) and couples with no children (25%). Respondents from lone-person households (18%) are least likely to report extreme
importance, followed by those of non-family group households (21%).
Council type
Ratings of extreme importance are highest amongst respondents in urban regional (29%) councils and lowest for those in
urban development small/medium (18%) and urban capital city (22%) councils.

PLACE ATTACHMENT – INSTRUMENTAL 82
Job opportunities
29% of respondents feel the availability of job opportunities in their local area is extremely important,
while 30% feel it to be very important. Nearly a quarter of respondents feel the availability of jobs is
either only slightly important (9%) or not at all important (14%).
Figure 45: Q_6 Job opportunities (n=1993)
13.8
8.9
18.8
29.8
28.8
0 5 10 15 20 25 30 35
Not at all important
Slightly important
Moderately important
Very important
Extremely important
Percent

PLACE ATTACHMENT – INSTRUMENTAL 83
Association highlights
Job opportunities
Politics
Labor (34%) voters and respondents whose votes changed from election to election (32%) are most likely to report
high extreme importance. Liberal/National (24%) and Greens (24%) voters are least likely to report high extreme
importance.
Gender
Extreme importance is higher amongst female (33%) respondents compared with male (24%) respondents.
Age
Overall, ‘extremely important’ ratings decline with age. 18-29 (35%) year olds report higher ratings, and respondents
aged 70 and over (13%) report the lowest.
Non-English speaking background
Ratings of ‘extremely important’ are higher amongst respondents who speak a language other than English (38%)
compared with English-only (28%) speakers.
Education attainment
Respondents with certificate (37%) and diploma/advanced diploma (31%) level qualifications report the highest
extreme importance. Those with bachelor (24%) and postgraduate (24%) degrees report the lowest.
Employment status
The highest levels of extreme importance are reported by respondents who are homemakers (42%); out of work but
not currently looking (40%); and unable to work (39%). Retired (14%) respondents report the lowest, followed by
respondents who are self-employed (25%) and students (26%).
Housing type
Individuals who reside in flats, units or apartments of 4 stories or more (36%) are more likely to have higher
‘extremely important’ levels than those who live in semi-detached and related houses (22%); flats, units or
apartments of 3 stories or less (24%); and separate houses (30%).
Family type
Extreme importance is higher amongst one-parent families (44%); non-family group households (33%); and couples
with children (31%). They are lower amongst lone-person households (20%) and couples with no children (24%).
Council type
Respondents of urban regional (33%) and urban fringe (33%) councils have the highest ‘extremely important’ ratings.
Those living in urban development small/medium (24%) councils and urban capital cities (24%) have the lowest.

PLACE ATTACHMENT – INSTRUMENTAL 84
A positive economic outlook
30% of respondents feel the presence of a positive economic outlook in their local area is extremely
important, while 38% feel it to be very important.
Figure 46: Q8_7 A positive economic outlook (n=1979)
Association highlights
A positive economic outlook
1.8
6.4
24.3
37.9
29.5
0 5 10 15 20 25 30 35 40
Not at all important
Slightly important
Moderately important
Very important
Extremely important
Percent
Politics
Liberal/National (34%) voters are most likely to have higher ‘extremely important’ ratings. Greens (24%) voters have
the lowest, followed by respondents whose votes change from election to election (28%) and Labor (29%) voters.
Age
Extreme importance rises from 18-29 (26%) years of age, peaks at 50-59 (35%) years, then falls again for
respondents aged 70 and over (25%).
Education attainment
Diploma/advanced diploma (34%); certificate (33%); and school-education (31%) level holders report higher extreme
importance compared with postgraduate (24%) and bachelor (24%) degree holders.
Employment status
Respondents who are out of work but not currently looking (44%) have the highest ratings of extreme importance,
followed by those who are unable to work (39%) and self-employed (36%). Students (17%) and retired (26%)
respondents have the lowest.
Family type
Families of couples with children (32%); couples with no children (31%); and one-parent only (29%) report higher
extreme importance compared with respondents of lone-person households (23%).
Council type
Urban regional (34%); rural and remote (32%); and urban fringe (31%) council respondents are more likely to report
extreme importance compared with those of urban capital cities (25%); urban development small/medium (26%); and
urban development large/very large (27%) councils.

PLACE ATTACHMENT – INSTRUMENTAL 85
Availability of good home care or aged care
27% of respondents feel the availability of good home care or aged care in their local area is extremely
important, while 30% feel it to be very important.
Figure 47:Q8_8 Availability of good home or aged care (n=1989)
Association highlights
Availability of good home or aged care
8.8
13.2
20.5
30.2
27.3
0 5 10 15 20 25 30 35
Not at all important
Slightly important
Moderately important
Very important
Extremely important
Percent
Politics
Labor (31%) voters and respondents whose votes change from election to election (28%) are most likely to report
higher extreme importance, compared with Greens (19%) and Liberal/National (25%) voters.
Gender
Female (31%) respondents report higher extreme importance compared with male (23%) respondents.
Age
Overall, ratings of extreme importance rise with age. The highest ratings are amongst respondents aged 70 and over
(36%) and the lowest amongst 30-39 (20%) year-old respondents.
Education attainment
Respondents who have certificate (35%); school (33%); and diploma/advanced diploma (30%) level qualifications
report higher levels of extreme importance than those with postgraduate (16%) and bachelor (19%) degrees.
Income
Levels of extreme importance fall with rising household income: for example, $10-$19,999 (35%) and $300,000 or
more (17%).
Employment status
The highest rating of extreme importance is reported by respondents who are unable to work (50%), followed by
those who are retired (36%) and homemakers (34%). Students (16%) have the lowest rating, followed by respondents
who are out of work but not currently looking (20%) and self-employed (23%).
Family type
Respondents of group households (36%); one-parent families (35%); and couples with no children (32%) are more
likely to report extreme importance, compared with couples with children (23%) and lone-person households (28%).
Length of time living in the local area
‘Extremely important’ ratings are lower for respondents resident for less than 2 years (26%) than longer than 10 years
(31%).
Council type
Respondents of urban regional (32%) and rural and remote (30%) councils are more likely to report higher extreme
importance than those of urban capital cities (21%) and urban development small/medium (22%) councils.

PLACE ATTACHMENT – INSTRUMENTAL 86
Convenient public transport
31% of respondents feel the availability of convenient public transport in their local area is extremely
important, while 33% feel it to be very important.
Figure 48: Q8_9 Convenient public transport (n=1998)
Association highlights
Convenient public transport
8.0
9.5
18.9
32.6
31.1
0 5 10 15 20 25 30 35
Not at all important
Slightly important
Moderately important
Very important
Extremely important
Percent
Politics
Ratings of ‘extremely important’ are higher amongst Labor (37%) and Greens (36%) voters. They are lower amongst
Liberal/National (28%) voters and respondents whose votes change from election to election (30%).
Non-English speaking background
Respondents who speak a language other than English (37%) are more likely to report higher extreme importance than
English-only (31%) speakers.
Education attainment
‘Extremely important’ ratings are higher amongst school-education (35%); diploma/advanced diploma (35%); and certificate
(31%) level qualifications. Ratings are lower amongst bachelor (24%) and postgraduate (29%) degree holders.
Employment status
Extreme importance is highest for respondents who are students (41%); homemakers (38%); and out of work and looking for
work (36%). It is lowest for respondents who are out of work but not currently looking (17% compared with 31% nationally).
Dwelling type
Respondents who live in flats, units or apartments of 4 stories or more (41%) are more likely to report higher extreme
importance than those who live in separate houses (30%).
Family type
Group households (46%) and one-parent families (44%) have higher ratings of extreme importance than couples with
children (29%); lone-person households (30%) and couples with no children (31%).
Council type
Extreme importance is lower amongst respondents of urban regional (24%) and rural and remote (27%) councils compared
with all other council types (31% community wide).
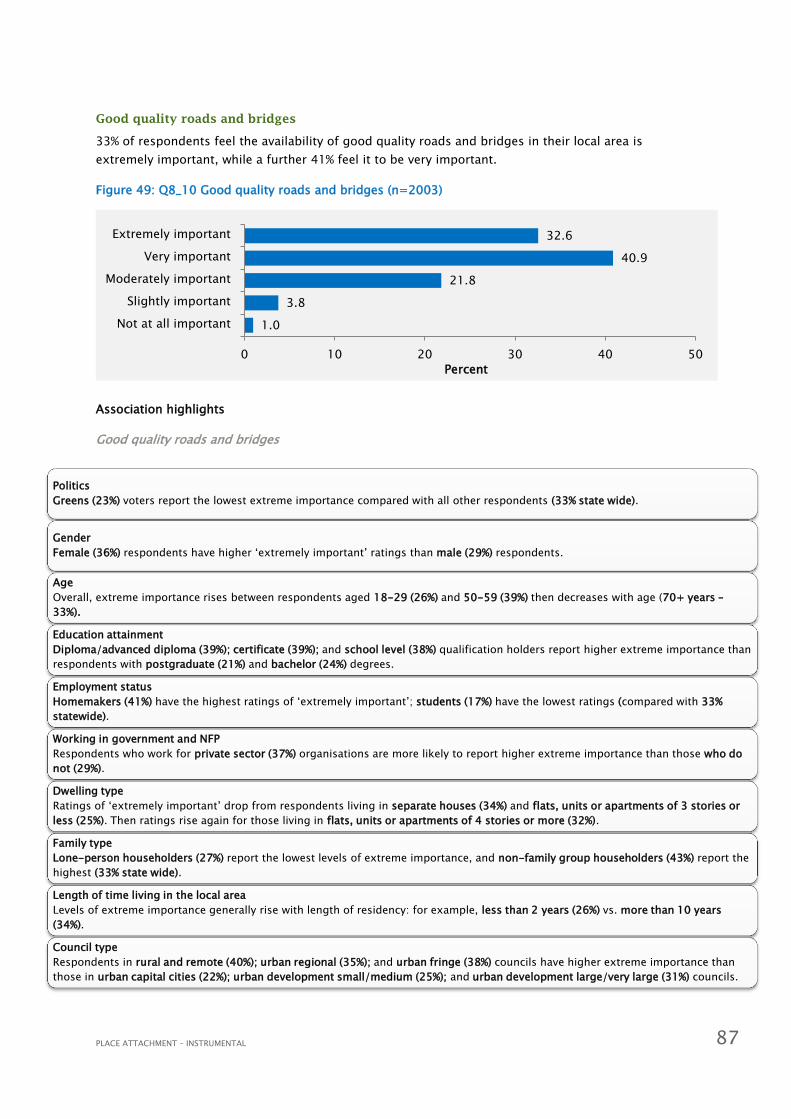
PLACE ATTACHMENT – INSTRUMENTAL 87
Good quality roads and bridges
33% of respondents feel the availability of good quality roads and bridges in their local area is
extremely important, while a further 41% feel it to be very important.
Figure 49: Q8_10 Good quality roads and bridges (n=2003)
Association highlights
Good quality roads and bridges
1.0
3.8
21.8
40.9
32.6
0 10 20 30 40 50
Not at all important
Slightly important
Moderately important
Very important
Extremely important
Percent
Politics
Greens (23%) voters report the lowest extreme importance compared with all other respondents (33% state wide).
Gender
Female (36%) respondents have higher ‘extremely important’ ratings than male (29%) respondents.
Age
Overall, extreme importance rises between respondents aged 18-29 (26%) and 50-59 (39%) then decreases with age (70+ years –
33%).
Education attainment
Diploma/advanced diploma (39%); certificate (39%); and school level (38%) qualification holders report higher extreme importance than
respondents with postgraduate (21%) and bachelor (24%) degrees.
Employment status
Homemakers (41%) have the highest ratings of ‘extremely important’; students (17%) have the lowest ratings (compared with 33%
statewide).
Working in government and NFP
Respondents who work for private sector (37%) organisations are more likely to report higher extreme importance than those who do
not (29%).
Dwelling type
Ratings of ‘extremely important’ drop from respondents living in separate houses (34%) and flats, units or apartments of 3 stories or
less (25%). Then ratings rise again for those living in flats, units or apartments of 4 stories or more (32%).
Family type
Lone-person householders (27%) report the lowest levels of extreme importance, and non-family group householders (43%) report the
highest (33% state wide).
Length of time living in the local area
Levels of extreme importance generally rise with length of residency: for example, less than 2 years (26%) vs. more than 10 years
(34%).
Council type
Respondents in rural and remote (40%); urban regional (35%); and urban fringe (38%) councils have higher extreme importance than
those in urban capital cities (22%); urban development small/medium (25%); and urban development large/very large (31%) councils.

PLACE ATTACHMENT – INSTRUMENTAL 88
Being able to afford appropriate housing
40% of respondents feel that being able to afford appropriate housing in their local area is extremely
important, while 38% feel it to be very important.
Figure 50: Q8_11 Being able to afford appropriate housing (n=1995)
Association highlights
Being able to afford appropriate housing
3.4
3.7
14.8
38.3
39.8
0 10 20 30 40 50
Not at all important
Slightly important
Moderately important
Very important
Extremely important
Percent
Gender
Female (45%) respondents are more likely to report extreme importance than male (35%) respondents.
Age
‘Extremely important’ ratings fall between 18-29 (43%) year olds and respondents who are 70 years and over (28%).
Education attainment
Ratings of extreme importance are higher for those who have certificate (48%) and diploma/advanced diploma (45%)
qualifications, compared with those who have bachelor (32%) and postgraduate (38%) degrees.
Employment status
Homemakers (56%) report the highest extreme importance, followed by respondents who are unable to work (47%)
and out of work and currently looking (47%). Respondents who are retired (33%); self-employed (34%); and out of
work but not currently looking (36%) report the lowest.
Housing tenure
Renters (51%) are more likely to report extreme importance compared with respondents who have a mortgage/own
their homes outright (37%).
Dwelling type
Ratings of ‘extremely important’ are highest for respondents living in flats, units or apartments of 3 stories or less
(51%), and lowest for those living in flats, units or apartments of 4 stories or more (27%).
Length of time living in local area
Extreme importance drops between respondents whose residencies are more than 2 and less than 5 (50%); more than
5 and less than 10 (40%); and more than 10 years (38%) in length.

PLACE ATTACHMENT – INSTRUMENTAL 89
Levels of water, air and noise pollution
42% of respondents feel that seeing to the levels of water, air and noise pollution in their local area
was extremely important, while 36% feel it to be very important.
Figure 51: Q8_12 Levels of water, air and noise pollution (n=1995)
Association highlights
Levels of water, air and noise pollution
1.3
4.6
15.8
36.3
41.9
0 10 20 30 40 50
Not at all important
Slightly important
Moderately important
Very important
Extremely important
Percent
Politics
Greens (52%) voters report the highest ‘extremely important’ levels, compared with Labor (44%) and Liberal/National
(38%) voters.
Gender
Female (45%) respondents are more likely than male (39%) to report extreme importance.
Age
50-59 (49%) year old respondents report the highest extreme importance, and respondents who are 70 years and
over (30%) are least likely to report extreme importance compared with all other respondents (42%).
Employment status
Homemakers (53%) are most likely to report extreme importance, followed by respondents who are self-employed
(45%) and employed for wages (43%). Respondents who are out of work but not currently looking (24%) are least
likely to report extreme importance, followed by students (33%) and those who are unable to work (34%).
Council type
‘Extremely important’ ratings are highest amongst respondents of urban development large/very large (46%) and
urban regional (45%) councils. They are lowest amongst those of urban capital cities (32%).

PLACE ATTACHMENT – INSTRUMENTAL 90
Shops located close by that are suitable to my needs
24% of respondents feel that having shops located close by that are suitable to their needs in their
local area is extremely important, while 37% feel it to be very important.
Figure 52: Q8_13 Shops located close-by that are suitable to my needs (n=2002)
Association highlights
Shops located close-by that are suitable to my needs
2.0
8.3
29.3
36.5
23.9
0 5 10 15 20 25 30 35 40
Not at all important
Slightly important
Moderately important
Very important
Extremely important
Percent
Politics
Liberal/National (26%) and Labor (26%) voters have the highest ratings of ‘extremely important.’ Greens (14%) voters
have the lowest.
Gender
Female (27%) respondents are more likely to report extreme importance than male (21%) respondents.
Age
Respondents between the ages of 18 (22%) and 49 (20%) years of age report lower levels of extreme importance,
whilst those between 50 (27%) and 70 years and over (31%) report the highest.
Education attainment
In general, extreme importance falls with rising qualifications: school education (30%) compared with postgraduate
degree (21%).
Household income
Overall, ratings of ‘extremely important’ fall as household income increases: $10-$19,000 (30%); $20-$29,000
(29%); and $30-$39,000 (30%) compared with $150-$199,000 (18%); $200-$299,000 (23%); and $300,000 or more
(17%).
Employment status
The highest ratings of ‘extremely important’ are reported by respondents who are unable to work (41%) and out of
work and looking (38%). The lowest ratings are from those who are students (17%); self-employed (20%); and
employed for wages (21%).
Council type
Respondents of urban development large/very large (27%) and urban fringe (26%) councils have the highest
‘extremely important’ ratings. Respondents of rural and remote (21%) and urban regional (22%) councils have the
lowest ‘extremely important’ ratings.

PLACE ATTACHMENT – INSTRUMENTAL 91
A safe environment
58% of respondents feel that having a safe environment is extremely important, while 34% feel it to be
very important.
Figure 53: Q8_14 A safe environment (n=2002)
Association highlights
A safe environment
.4
1.7
6.7
33.8
57.5
0 10 20 30 40 50 60 70
Not at all important
Slightly important
Moderately important
Very important
Extremely important
Percent
Politics
Liberal/National (59%) and Labor (59%) voters are more likely to report higher extreme importance than Greens (54%)
voters.
Knowledge of mayor’s name
Respondents who correctly (60%) name their mayor are more likely to have higher ‘extremely important’ ratings than
those who do so incorrectly (53%).
Gender
Female (61%) respondents are more likely than male (54%) respondents to report higher extreme importance.
Age
Ratings of extreme importance generally fall with rising age: the highest is reported by 30-39 (64%) year olds, and
the lowest by respondents aged 70 and over (47%).
Employment status
Homemakers (78%) and those who are unable to work (72%) report the highest extreme importance, compared with
respondents who are out of work and looking (47%) and students (49%).
Working in government and NFP
Respondents working for the private sector (61%) are more likely than those working for the government/NFP sector
(56%) to report higher extreme importance.
Family type
Couples with children (62%) and one-parent families (62%) are more likely than couples with no children (57%) to
report extreme importance. Respondents of lone-person households (45%) are least likely to report extreme
importance.
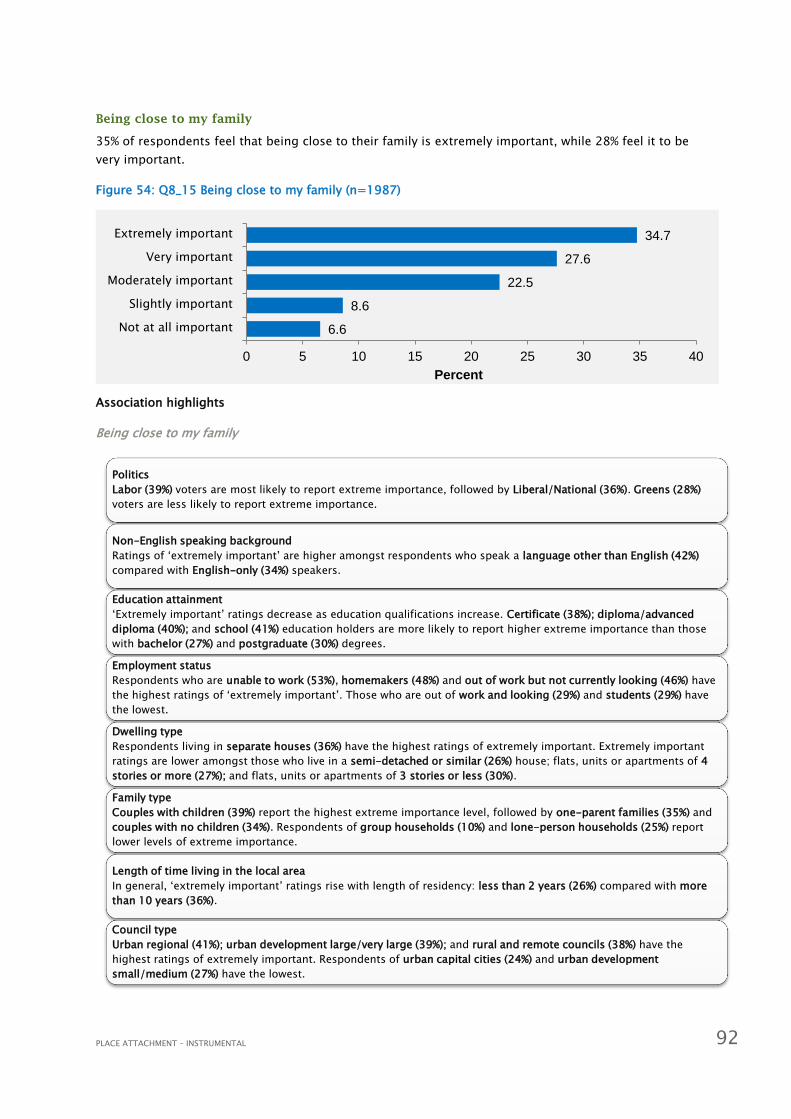
PLACE ATTACHMENT – INSTRUMENTAL 92
Being close to my family
35% of respondents feel that being close to their family is extremely important, while 28% feel it to be
very important.
Figure 54: Q8_15 Being close to my family (n=1987)
Association highlights
Being close to my family
6.6
8.6
22.5
27.6
34.7
0 5 10 15 20 25 30 35 40
Not at all important
Slightly important
Moderately important
Very important
Extremely important
Percent
Politics
Labor (39%) voters are most likely to report extreme importance, followed by Liberal/National (36%). Greens (28%)
voters are less likely to report extreme importance.
Non-English speaking background
Ratings of ‘extremely important’ are higher amongst respondents who speak a language other than English (42%)
compared with English-only (34%) speakers.
Education attainment
‘Extremely important’ ratings decrease as education qualifications increase. Certificate (38%); diploma/advanced
diploma (40%); and school (41%) education holders are more likely to report higher extreme importance than those
with bachelor (27%) and postgraduate (30%) degrees.
Employment status
Respondents who are unable to work (53%), homemakers (48%) and out of work but not currently looking (46%) have
the highest ratings of ‘extremely important’. Those who are out of work and looking (29%) and students (29%) have
the lowest.
Dwelling type
Respondents living in separate houses (36%) have the highest ratings of extremely important. Extremely important
ratings are lower amongst those who live in a semi-detached or similar (26%) house; flats, units or apartments of 4
stories or more (27%); and flats, units or apartments of 3 stories or less (30%).
Family type
Couples with children (39%) report the highest extreme importance level, followed by one-parent families (35%) and
couples with no children (34%). Respondents of group households (10%) and lone-person households (25%) report
lower levels of extreme importance.
Length of time living in the local area
In general, ‘extremely important’ ratings rise with length of residency: less than 2 years (26%) compared with more
than 10 years (36%).
Council type
Urban regional (41%); urban development large/very large (39%); and rural and remote councils (38%) have the
highest ratings of extremely important. Respondents of urban capital cities (24%) and urban development
small/medium (27%) have the lowest.

PLACE ATTACHMENT – INSTRUMENTAL 93
5.2 Relative level of importance of each instrumental dimension of place attachment
Figure 55: Relative level of importance of each instrumental dimension of place attachment
1.7
1.7
12.6
2.1
13.8
1.8
8.8
8.0
1.0
3.4
1.3
2.0
6.6
4.6
5.9
6.8
2.5
7.8
8.9
6.4
13.2
9.5
3.8
3.7
4.6
8.3
1.7
8.6
18.6
23.0
12.1
11.1
26.4
18.8
24.3
20.5
18.9
21.8
14.8
15.8
29.3
6.7
22.5
39.6
40.2
32.7
37.8
39.2
29.8
37.9
30.2
32.6
40.9
38.3
36.3
36.5
33.8
27.6
35.5
29.3
35.7
48.2
24.5
28.8
29.5
27.3
31.1
32.6
39.8
41.9
23.9
57.5
34.7
0% 10% 20% 30% 40% 50% 60% 70% 80% 90% 100%
Recreational areas such as parks, walking tracks, open spaces (n=2004)
Availability of appropriate public services (n=2000)
Availability of good schools (n=1994)
Availability of healthcare (n=2003)
A supportive and cohesive community (n=1995)
Job opportunities (n=1993)
A positive economic outlook (n=1979)
Availability of good home or aged care (n=1989)
Convenient public transport (n=1998)
Good quality roads and bridges (n=2003)
Being able to afford appropriate housing (n=1995)
Levels of water, air and noise pollution (n=1995)
Shops located close-by that are suitable to my needs (n=2002)
A safe environment (n=2002)
Being close to my family (n=1987)
Not at all important Slightly important Moderately important Very important Extremely important

PLACE ATTACHMENT – INSTRUMENTAL 94
5.3 Level of satisfaction with each individual dimension of
instrumental place attachment
Associations between the questions relating to level of satisfaction with each dimension of
instrumental place attachment and council type (according to the Australian local government
classification system) are reported.
Question 9 of the survey asked:
Thinking about the local area in which you are currently living, are you satisfied or dissatisfied with the
provision of each of the following?
Recreational areas such as parks, walking tracks, open spaces
57% of respondents are very satisfied with the existing recreational areas in their local area, while 30%
are moderately satisfied.
Figure 56: Q9_1 Recreational areas such as parks, walking tracks, open spaces (n=1992)
Council type
Respondents of urban development small/medium (65%) and large/very large (63%) have the highest
‘very satisfied’ levels. ‘Very satisfied’ levels are lowest amongst rural and remote (51%) and urban
capital city (51%) councils.
56.7
30.2
7.6
2.2
1.9
1.4
0 10 20 30 40 50 60
Very satisfied
Moderately satisfied
Slightly satisfied
Slightly dissatisfied
Moderately dissastified
Very dissatisfied

PLACE ATTACHMENT – INSTRUMENTAL 95
Availability of appropriate public services
27% of respondents are very satisfied with the availability of appropriate public services in their local
area, while 46% are moderately satisfied.
Figure 57: Q9_2 Availability of appropriate public services (n=1965)
Council type
Respondents from urban development small/medium (35%) and large/very large (33%) local
government areas have the highest levels of being ‘very satisfied.’ Respondents of rural and remote
(18%) and urban regional (20%) councils have the lowest.
Availability of good schools
46% of respondents are very satisfied with the availability of good schools in their local area, while 35%
are moderately satisfied. A large number of respondents (173 or 8.6%) chose not answer this question
(n=1833), suggesting that they thought this item not applicable to their circumstances.
Figure 58: Q9_3 Availability of good schools (n=1833)
26.5
46.2
15.7
4.4
3.9
3.3
0 10 20 30 40 50
Very satisfied
Moderately satisfied
Slightly satisfied
Slightly dissatisfied
Moderately dissastified
Very dissatisfied
Percent
46.0
35.1
10.4
3.1
3.3
2.1
0 10 20 30 40 50
Very satisfied
Moderately satisfied
Slightly satisfied
Slightly dissatisfied
Moderately dissastified
Very dissatisfied
Percent

PLACE ATTACHMENT – INSTRUMENTAL 96
Availability of healthcare
42% of respondents are very satisfied with the availability of healthcare in their local area, while 37%
are moderately satisfied.
Figure 59: Q9_4 Availability of healthcare (n=1988)
Council type
Reports of being ‘very satisfied’ are highest for respondents in urban development small/medium
(51%) and large/very large (46%) councils. They are lowest for those in rural and remote (36%) and
urban regional (39%) councils.
A supportive and cohesive community
34% of respondents are very satisfied with the existing level of community support and cohesion in
their local area, while 42% are moderately satisfied.
Figure 60: Q9_5 A supportive and cohesive community (n=1949)
Council type
Respondents from urban development large/very large (39%) and small/medium (37%) are most likely
to be very satisfied, while those in rural and remote (32%) and urban regional (33%) are least likely to
be so.
42.2
37.3
10.3
3.6
3.1
3.4
0 10 20 30 40 50
Very satisfied
Moderately satisfied
Slightly satisfied
Slightly dissatisfied
Moderately dissastified
Very dissatisfied
Percent
34.4
42.3
15.4
3.3
2.6
2.0
0 10 20 30 40 50
Very satisfied
Moderately satisfied
Slightly satisfied
Slightly dissatisfied
Moderately dissastified
Very dissatisfied
Percent

PLACE ATTACHMENT – INSTRUMENTAL 97
Job opportunities
15% of respondents are very satisfied with the availability of job opportunities in their local area, while
32% are moderately satisfied. A large proportion of respondents (273 or 13.6%) did not answer this
question, suggesting that this topic is not relevant to their personal circumstance or they do not have
enough information to answer.
Figure 61: Q9_6 Job opportunities (n=1793)
Council type
The highest ratings of ‘very satisfied’ are reported by respondents of urban capital city (21%) and
urban development small/medium (21%) councils. Respondents in urban regional (9%) and urban
fringe (11%) report the lowest.
A positive economic outlook
21% of respondents are very satisfied with the positive economic outlook in their local area, while 43%
are moderately satisfied.
Figure 62: Q9_7 A positive economic outlook (n=1912)
Council type
Reports of being ‘very satisfied’ are highest for respondents of urban development large/very large
(30%) and small/medium (27%) councils, and lowest for those of rural and remote (16%) and urban
fringe (17%) councils.
14.5
31.9
20.1
10.4
10.4
12.6
0 5 10 15 20 25 30 35
Very satisfied
Moderately satisfied
Slightly satisfied
Slightly dissatisfied
Moderately dissastified
Very dissatisfied
Percent
21.3
43.2
18.7
6.7
5.1
4.9
0 10 20 30 40 50
Very satisfied
Moderately satisfied
Slightly satisfied
Slightly dissatisfied
Moderately dissastified
Very dissatisfied
Percent

PLACE ATTACHMENT – INSTRUMENTAL 98
Availability of good home care or aged care
26% of respondents are very satisfied with the availability of good home care or aged care in their local
area, while 42% are moderately satisfied.
Figure 63: Q9_8 Availability of good home or aged care (n=1912)
Convenient public transport
33% of respondents are very satisfied with the availability of convenient public transport in their local
area, while 30% are moderately satisfied. However, 12% of respondents are very dissatisfied with the
availability of convenient public transport in their local area.
Figure 64: Q9_9 Convenient public transport (n=1941)
Council type
Respondents living in urban capital cities (49%) and small/medium urban developments (51%) are more
likely to report being ‘very satisfied’ compared with people living in urban regional (19%) areas or rural
and remote areas (17%).
26.4
42.4
18.1
4.8
4.6
3.7
0 10 20 30 40 50
Very satisfied
Moderately satisfied
Slightly satisfied
Slightly dissatisfied
Moderately dissastified
Very dissatisfied
Percent
33.1
30.1
12.4
6.8
5.9
11.7
0 5 10 15 20 25 30 35
Very satisfied
Moderately satisfied
Slightly satisfied
Slightly dissatisfied
Moderately dissastified
Very dissatisfied
Percent

PLACE ATTACHMENT – INSTRUMENTAL 99
Good quality roads and bridges
32% of respondents are very satisfied with the availability of good quality roads and bridges in their
local area, and 39% are moderately satisfied.
Figure 65: Q9_10 Good quality roads and bridges (n=1995)
Council type
Respondents living in urban capital cities (32%) and small/medium urban developments (46%) are more
likely to report being ‘very satisfied’ compared with people living in rural and remote areas (21%).
Being able to afford appropriate housing
28% of respondents are very satisfied with being able to afford appropriate housing in their local area,
while 35% are moderately satisfied. 9% of respondents are very dissatisfied with being able to afford
appropriate housing in their local area. A relatively large proportion of respondents (78 or 3.9%) did
not answer this question suggesting that availability of affordable housing is not a concern of theirs or
something about which they do not have enough knowledge to answer.
Figure 66: Q9_11 Being able to afford appropriate housing (n=1929)
Council type
Respondents living in rural and remote areas (32%), the urban fringe (30%) and urban regional areas
(29%) are more likely to report being ‘very satisfied’ compared with people living in urban capital cities
(24%) or small/medium urban developments (24%).
31.7
38.5
11.8
5.2
5.1
7.6
0 10 20 30 40 50
Very satisfied
Moderately satisfied
Slightly satisfied
Slightly dissatisfied
Moderately dissastified
Very dissatisfied
Percent
27.9
35.1
14.2
7.1
7.3
8.5
0 10 20 30 40
Very satisfied
Slightly satisfied
Moderately dissastified
Percent

PLACE ATTACHMENT – INSTRUMENTAL 100
Levels of water, air and noise pollution
44% of respondents are very satisfied with the levels of water, air and noise pollution in their local
area, while 37% are moderately satisfied.
Figure 67: Q9_12 Levels of water, air and noise pollution (n=1980)
Council type
Respondents living in rural and remote areas (47%) and large/very large urban developments (49%) are
more likely to report being ‘very satisfied’ compared with people living in urban capital cities (33%).
Shops located close-by that are suitable to my needs
54% of respondents are very satisfied with having shops located close by that are suitable to their
needs in their local area, while 32% are moderately satisfied.
Figure 68: Q9_13 Shops located close-by that are suitable to my needs (n=1993)
Council type
Respondents living in urban capital cities (61%), small/medium urban developments (62%) and
large/very large urban developments (63%) are more likely to report being ‘very satisfied’ compared
with people living in urban regional (48%), urban fringe (56%) and rural and remote areas (40%).
44.4
37.2
8.5
4.1
3.1
2.7
0 10 20 30 40 50
Very satisfied
Moderately satisfied
Slightly satisfied
Slightly dissatisfied
Moderately dissastified
Very dissatisfied
Percent
54.0
32.3
7.3
2.2
1.9
2.2
0 10 20 30 40 50 60
Very satisfied
Moderately satisfied
Slightly satisfied
Slightly dissatisfied
Moderately dissastified
Very dissatisfied
Percent

PLACE ATTACHMENT – INSTRUMENTAL 101
A safe environment
50% of respondents are very satisfied with the safety of their local area, while 35% are moderately
satisfied.
Figure 69: Q9_14 A safe environment (n=1995)
Being close to my family
53% of respondents are very satisfied with the closeness of their family, while 27% are moderately
satisfied. A relatively large proportion of respondents (97 or 4.8%) did not answer this question, which
suggests that being close to family is not a relevant concern for them.
Figure 70: Q9_15 Being close to my family (n=1909)
49.6
35.3
8.2
2.3
2.8
1.6
0 10 20 30 40 50 60
Very satisfied
Moderately satisfied
Slightly satisfied
Slightly dissatisfied
Moderately dissastified
Very dissatisfied
Percent
53.2
27.0
10.1
3.9
2.7
3.2
0 10 20 30 40 50 60
Very satisfied
Moderately satisfied
Slightly satisfied
Slightly dissatisfied
Moderately dissastified
Very dissatisfied
Percent

PLACE ATTACHMENT – INSTRUMENTAL 102
5.4 Relative level of satisfaction with each dimension of instrumental place attachment
Figure 71: Relative levels of satisfaction with each dimension of instrumental place attachment
56.7
26.5
46.0
42.2
34.4
14.5
21.3
26.4
33.1
31.7
27.9
44.4
54.0
49.6
53.2
30.2
46.2
35.1
37.3
42.3
31.9
43.2
42.4
30.1
38.5
35.1
37.2
32.3
35.3
27.0
7.6
15.7
10.4
10.3
15.4
20.1
18.7
18.1
12.4
11.8
14.2
8.5
7.3
8.2
10.1
2.2
4.4
3.1
3.6
3.3
10.4
6.7
4.8
6.8
5.2
7.1
4.1
2.2
2.3
3.9
1.9
3.9
3.3
3.1
2.6
10.4
5.1
4.6
5.9
5.1
7.3
3.1
1.9
2.8
2.7
1.4
3.3
2.1
3.4
2.0
12.6
4.9
3.7
11.7
7.6
8.5
2.7
2.2
1.6
3.2
0% 10% 20% 30% 40% 50% 60% 70% 80% 90% 100%
Recreational areas such as parks, walking tracks, open spaces (n=1992)
Availability of appropriate public services (n= 1965)
Availability of good schools (n=1833)
Availability of healthcare (n=1988)
A supportive and cohesive community (n=1949)
Job opportunities (n=1733)
A positive economic outlook (n=1912)
Availability of good home or aged care (n=1676)
Convenient public transport (n=1941)
Good quality roads and bridges (n=1995)
Being able to afford appropriate housing (n=1929)
Levels of water, air and noise pollution (n=1980)
Shops located close-by that are suitable to my needs (n=1993)
A safe environment (n=1995)
Being close to my family (n=1909)
Very satisfied Moderately satisfied Slightly satisfied Slightly dissatisfied Moderately dissastified Very dissatisfied

PLACE ATTACHMENT – INSTRUMENTAL 103
5.5 Importance and satisfaction
In order to provide context and meaning to the satisfaction ratings given by respondents, only the answers given by people who valued each factor as extremely important are
given in
Figure 72: Satisfaction with dimensions of instrumental place attachment for respondents who rated their importance as 'extremely important'
15.1
27.7
28.5
40.3
24.1
30.6
33.5
44.3
47.8
53.0
47.8
49.2
64.8
64.8
74.1
28.5
29.2
35.4
23.7
41.8
39.1
36.8
33.6
31.6
27.7
33.2
34.1
23.1
23.3
17.5
13.6
13.7
10.6
8.6
12.8
14.8
14.3
9.9
6.4
8.1
7.2
8.5
3.1
5.9
4.1
8.9
7.6
5.1
5.8
8.4
4.5
4.2
3.8
5.4
3.7
4.1
2.6
2.9
1.8
1.0
12.9
9.0
7.7
5.8
5.6
5.0
5.5
3.1
4.1
4.3
3.9
3.5
1.9
2.2
1.2
20.9
12.8
12.7
15.7
7.3
6.0
5.7
5.3
4.8
3.3
3.7
2.0
4.2
2.0
2.2
0% 10% 20% 30% 40% 50% 60% 70% 80% 90% 100%
Job opportunities (n=550)
Being able to afford appropriate housing (n=775)
Good quality roads and bridges (n=652)
Convenient public transport (n=616)
A positive economic outlook (n=572)
Availability of appropriate public services (n=581)
Availability of good home or aged care (n=505)
Availability of healthcare (n=960)
Levels of water, air and noise pollution (n=833)
Availability of good schools (n=705)
A supportive and cohesive community (n=485)
A safe environment (n=1148)
Shops located close-by that are suitable to my needs (n=477)
Recreational areas such as parks, walking tracks, open spaces (n=713)
Being close to family (n=686)
Very satisfied Moderately satisfied Slightly satisfied Slightly dissatisfied Moderately dissastified Very dissatisfied

LOCAL GOVERNMENT 104
6 Local government
6.1.1 Level of government best able to make decisions about the local area
Question 10: Thinking about where you live, which level of government is best able to make decisions
about your local area?
Figure 73: Q10 Thinking about where you live, which level of government is best able to make
decisions about your local area? (n=2006)
6.1.2 Knowledge questions
Question 11: What is the name of your local council/shire?
Figure 74: Q11 What is the name of your local Council/Shire? (n=2006)
74.7
15.8
2.0
7.5
0 20 40 60 80
Local government
State government
Federal government
Don't know
Percent
84.8
1.2
8.0
6.0
0 20 40 60 80 100
Correct
Not completely wrong; good attempt;
recognisable but not actually correct
Wrong
Don't know
Percent

LOCAL GOVERNMENT 105
Question 12: What is the name of the mayor/president of your local council/shire?
Figure 75: Q12 What is the name of the mayor/president of your local council/shire? (n=2006)
41.7
6.0
5.7
46.6
.1
0 5 10 15 20 25 30 35 40 45 50
Correct
Not completely wrong; good attempt; recognisable but
not actually correct
Wrong
Don't know
Abusive or obscene comment

LOCAL GOVERNMENT 106
6.1.3 Importance of tasks being done by local government
Question 13: How important it is to you that local government does each of these things
Water, sewage, stormwater, drainage
Figure 76: Q13_1 Water, sewage, stormwater, drainage (n=1995)
Association highlights
Water, sewage, stormwater, drainage
2.3
3.6
12.1
39.0
42.9
0 10 20 30 40 50
Not at all important
Slightly important
Moderately important
Very important
Extremely important
Percent
Politics
‘Extremely important’ ratings are more likely in Liberal/National Party (46%) voters or the Greens Party (45%) voters
compared with Labor ( 39%) voters.
Age
‘Extremely important’ ratings rise between the ages of 18-59 (37%-49%) and then decrease for people between the
ages of 60-70 and older (41%-44%).
Employment status
People who are out of work but not currently looking (67%) have the highest rating of extreme importance while
students (28%) have the lowest.
Council type
People living in rural and remote (50%) councils are more likely to rate extreme importance compared with those
living in urban capital cities (43%) or small/medium (37%) to large/very large (36%) urban developments.
State
‘Extremely important’ ratings are more likely in respondents living in New South Wales (50%) compared with
Queensland (42%), Victoria (41%) or Western Australia (37%)

LOCAL GOVERNMENT 107
Roads and bridges
Figure 77: Q13_2 Roads and bridges (n=1993)
Association highlights
Roads and bridges
3.1
6.1
20.1
42.1
28.6
0 10 20 30 40 50
Not at all important
Slightly important
Moderately important
Very important
Extremely important
Percent
Politics
‘Extremely important’ ratings are less likely in people who vote for the Greens Party (20%) compared with 29%
community-wide.
Gender
Women (31%) are more likely than men (26%) to rate roads and bridges as ‘extremely important’.
Age
Ratings of ‘extremly important’ rise between the ages of 18-59 (20%-36%) and then decrease for people aged 60-
70 and older (32%-29%).
Employment status
Students (14%) are less likely to rate roads and bridges as being ‘extremely important’ compared with the general
community (29%).
Council type
People living in rural and remote (33%) and urban regional (35%) councils are more likely to rate extremely
importance compared with urban capital cities (23%) or small/medium (19%) urban developments.
State
‘Extremely important’ ratings are more likely in respondents living in New South Wales (33%) compared Western
Australia (19%)

LOCAL GOVERNMENT 108
Parks
Figure 78: Q13_3 Parks (n=1997)
Association highlights
Parks
1.1
4.3
20.6
45.4
28.6
0 10 20 30 40 50
Not at all important
Slightly important
Moderately important
Very important
Extremely important
Percent
Politics
Ratings of extreme importance are higher among Greens Party (37%) voters compared with Labor (30%) or the
Liberal/National (28%) voters.
Age
Ratings of extreme importance are more likely among people aged 30-39 (35%) when compared with the general
community (29%).
Non-English speaking background
Ratings of extreme importance are more likely among English only speakers (30%) compared with those who speak
another language other than English (20%).
Education attainment
As education levels rise, ratings of extreme importance also increase (26% for school level education compared with
36% for postgraduate degree holders).
Household income
Ratings of extreme importance are more likely in the income brackets of $50,000-$59,999 (37%) and $80,000-
$89,999 (40%).
Dwelling type
People who live in separate houses (30%) are more likely to rate extreme importance compared with apartment
dwellers (21%-24%).
Family type
Non-family group households (20%) are less likely to report extreme importance when compared with the general
community (28%).

LOCAL GOVERNMENT 109
Footpaths
Figure 79: Q13_4 Footpaths (n=2000)
Association highlights
Footpaths
1.8
5.8
21.1
41.3
30.1
0 10 20 30 40 50
Not at all important
Slightly important
Moderately important
Very important
Extremely important
Percent
Politics
Ratings of extreme importance are higher among people who identify with the Liberal/National Party (33%) compared
with the Greens Party (27%).
Gender
Women (34%) are more likely than men (27%) to rate footpaths as ‘extremely important’.
Age
In general, ratings of extreme importance increase with respondents’ age (24% for 18-29 year olds compared with 34%
for people 70 and older).
Education attainment
Respondents with bachelor degree qualifications (23%) are less likely to report extreme importance compared with the
general community (30%).
Employment status
People who are retired (36%), homemakers (36%) and self-employed (35%) are more likely to rate extreme importance
compared with students (15%).
Housing tenure
Ratings of extreme importance are higher among people who mortgage or own (31%) their home compared with
renters (25%).
Length of time living in local area
People who have lived in their local area for less than 2 years (33%) are more likely than people who have lived in their
local area for more than 2 and less than 5 years (27%) to rate footpaths as being extremely important.
Council type
People living in the urban fringe (34%) are more likely to have rate extreme importance compared with people in urban
capital cities (26%) and rural and remote areas (27%).

LOCAL GOVERNMENT 110
Cycleways
Figure 80: Q13_5 Cycleways (n=1989)
Association highlights
Cycleways
9.1
12.8
28.2
30.8
19.1
0 5 10 15 20 25 30 35
Not at all important
Slightly important
Moderately…
Very important
Extremely important
Percent
Community participation
Ratings of extreme importance are higher among people who have actively participated in their community in the
past year (22%) compared with those who have not (17%).
Politics
Ratings of extremely importance are less likely among Liberal/National Party (15%) voters compared with voters for
the Labor (21%) or Greens (28%) Party.
Knowledge of mayor’s name
Respondents who correctly name their local mayor (22%) are more likely to report extreme importance than those
who did not know (16%) the local mayor’s name.
Age
Ratings of extreme importance are less likely for those aged 70 and older (15%) compared with the general
community (19%).
Employment status
Homemakers (25%) and people who are out of work and looking (24%) are more likely to report extreme importance
compared with students (11%) and people out of work but not currently looking (13%).
Dwelling type
People living in a separate house (20%) are more likely to report extreme importance compared with people living in
an apartment with 3 stories or less (14%).
Family type
Ratings of extreme importance are more likely among group households (36%) compared with the general community
(19%).
Council type
People living in an urban capital city (26%) are more likely to rate extreme importance compared with people in rural
or remote areas (15%).
State
Ratings of extreme importance are more likely among people living in Western Australia (24%) compared with people
living in New South Wales (16%) or Victoria (18%).
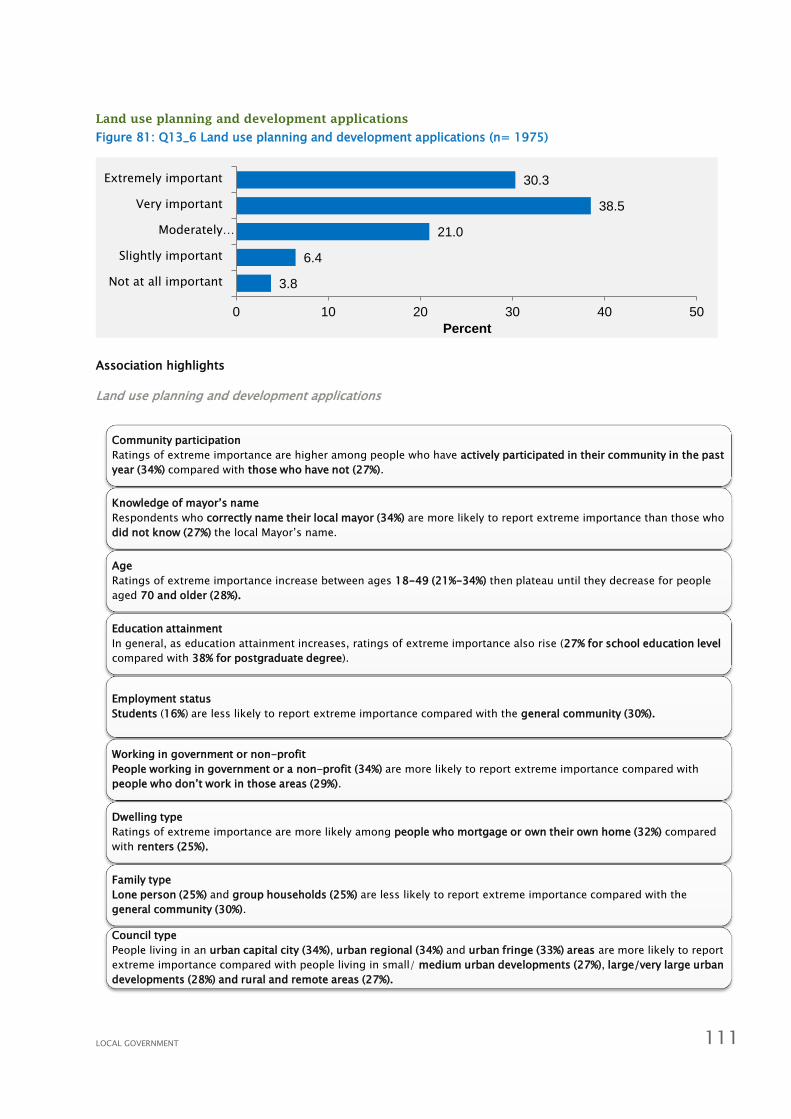
LOCAL GOVERNMENT 111
Land use planning and development applications
Figure 81: Q13_6 Land use planning and development applications (n= 1975)
Association highlights
Land use planning and development applications
3.8
6.4
21.0
38.5
30.3
0 10 20 30 40 50
Not at all important
Slightly important
Moderately…
Very important
Extremely important
Percent
Community participation
Ratings of extreme importance are higher among people who have actively participated in their community in the past
year (34%) compared with those who have not (27%).
Knowledge of mayor’s name
Respondents who correctly name their local mayor (34%) are more likely to report extreme importance than those who
did not know (27%) the local Mayor’s name.
Age
Ratings of extreme importance increase between ages 18-49 (21%-34%) then plateau until they decrease for people
aged 70 and older (28%).
Education attainment
In general, as education attainment increases, ratings of extreme importance also rise (27% for school education level
compared with 38% for postgraduate degree).
Employment status
Students (16%) are less likely to report extreme importance compared with the general community (30%).
Working in government or non-profit
People working in government or a non-profit (34%) are more likely to report extreme importance compared with
people who don’t work in those areas (29%).
Dwelling type
Ratings of extreme importance are more likely among people who mortgage or own their own home (32%) compared
with renters (25%).
Family type
Lone person (25%) and group households (25%) are less likely to report extreme importance compared with the
general community (30%).
Council type
People living in an urban capital city (34%), urban regional (34%) and urban fringe (33%) areas are more likely to report
extreme importance compared with people living in small/ medium urban developments (27%), large/very large urban
developments (28%) and rural and remote areas (27%).

LOCAL GOVERNMENT 112
Street cleaning and waste management
Figure 82: Q13_7 Street cleaning and waste management (n=2001)
Association highlights
Street cleaning and waste management
.8
3.9
14.5
42.0
38.8
0 10 20 30 40 50
Not at all important
Slightly important
Moderately important
Very important
Extremely important
Percent
Politics
Ratings of extreme importance are higher among Greens Party (44%) voters compared with voters who identify with
the Liberal/National (39%) or Labor (39%) party.
Knowledge of mayor’s name
Respondents who correctly name their local mayor (42%) are more likely to report extreme importance than those
who did not know (36%) the local mayor’s name.
Age
Ratings of extreme importance are more likely for people ages 50-59 (45%) and 60-69 (45%) compared with younger
people 18-29 (31%).
Non-English speaking background
People who speak only English at home (40%) are more likely than those who also speak another language (30%) to
report extreme importance.
Employment status
Students (30%) are less likely to report extreme importance compared with people who are out of work but not
currently looking for work (48%) and people who are unable to work (58%).
State
People living in Victoria (36%) and Queensland (34%) are less likely to report extreme importance compared with
people living in New South Wales (43%) and Western Australia (40%).

LOCAL GOVERNMENT 113
Health and environmental management
Figure 83: Q13_8 Health and environmental management (n=1991)
Please see the following page for association highlights
2.8
4.6
18.1
39.1
35.3
0 10 20 30 40 50
Not at all important
Slightly important
Moderately important
Very important
Extremely important
Percent

LOCAL GOVERNMENT 114
Association highlights
Health and environmental management
Politics
Ratings of extreme importance are higher among Greens Party (45%) voters compared with voters who identify with
the Liberal/National (31%) or Labor (36%) party.
Gender
Women (39%) are more likely than men (32%) to report extreme importance.
Age
People aged 70 and older (29%) are less likely to rate extreme importance when compared with the general
population (35%).
Education attainment
Ratings of extreme importance are more likely for those with school education (38%) and vocational qualifications
(41% for diploma/advanced diploma level) compared with people with University qualifications (29% for bachelor
degree; 34% for postgraduate degree).
Household income
Ratings of extreme importance rise as income rises; peak for earners between $90,000-$99,999 (51%); then fall (22%
for $150,000-$199,000 and 31% for $300,000 or more).
Employment status
People who are out of work but not currently looking (52%); out of work and looking for work (49%); homemakers
(45%); and unable to work (45%) are more likely to report extreme importance when compared with students (28%).
Working in government or non-profit
Ratings of extreme importance are higher in people who work for government or a non-profit organisation (38%)
compared with people who do not work in those areas (31%).
Dwelling type
Renters (41%) are more likely than people with mortgage homes (34%) to report extreme importance.
Family type
Non-family group households (44%) and one parent families (43%) are more likely to report extreme importance
when compared with the community (35%).
Council type
People living in urban capital cities (32%) or small/medium urban developments (30%) are less likely to report
extreme importance compared with people living in urban regional (39%) or rural and remote areas (39%).
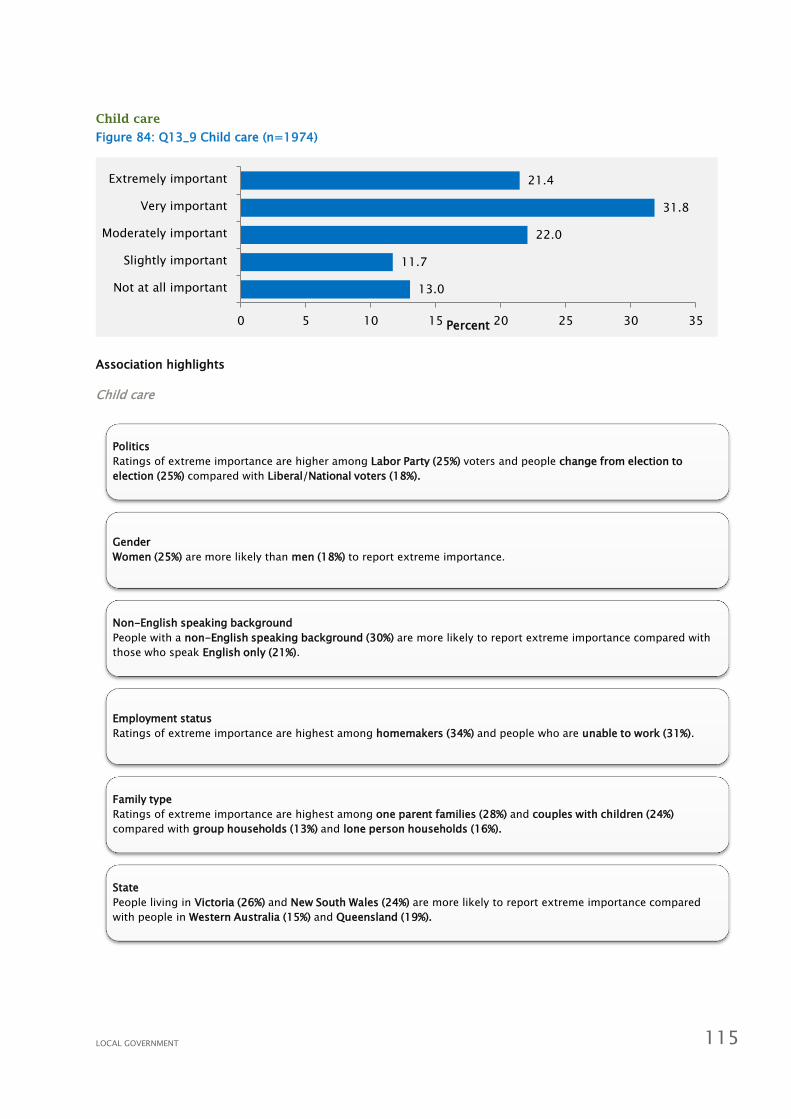
LOCAL GOVERNMENT 115
Child care
Figure 84: Q13_9 Child care (n=1974)
Association highlights
Child care
13.0
11.7
22.0
31.8
21.4
0 5 10 15 20 25 30 35
Not at all important
Slightly important
Moderately important
Very important
Extremely important
Percent
Politics
Ratings of extreme importance are higher among Labor Party (25%) voters and people change from election to
election (25%) compared with Liberal/National voters (18%).
Gender
Women (25%) are more likely than men (18%) to report extreme importance.
Non-English speaking background
People with a non-English speaking background (30%) are more likely to report extreme importance compared with
those who speak English only (21%).
Employment status
Ratings of extreme importance are highest among homemakers (34%) and people who are unable to work (31%).
Family type
Ratings of extreme importance are highest among one parent families (28%) and couples with children (24%)
compared with group households (13%) and lone person households (16%).
State
People living in Victoria (26%) and New South Wales (24%) are more likely to report extreme importance compared
with people in Western Australia (15%) and Queensland (19%).
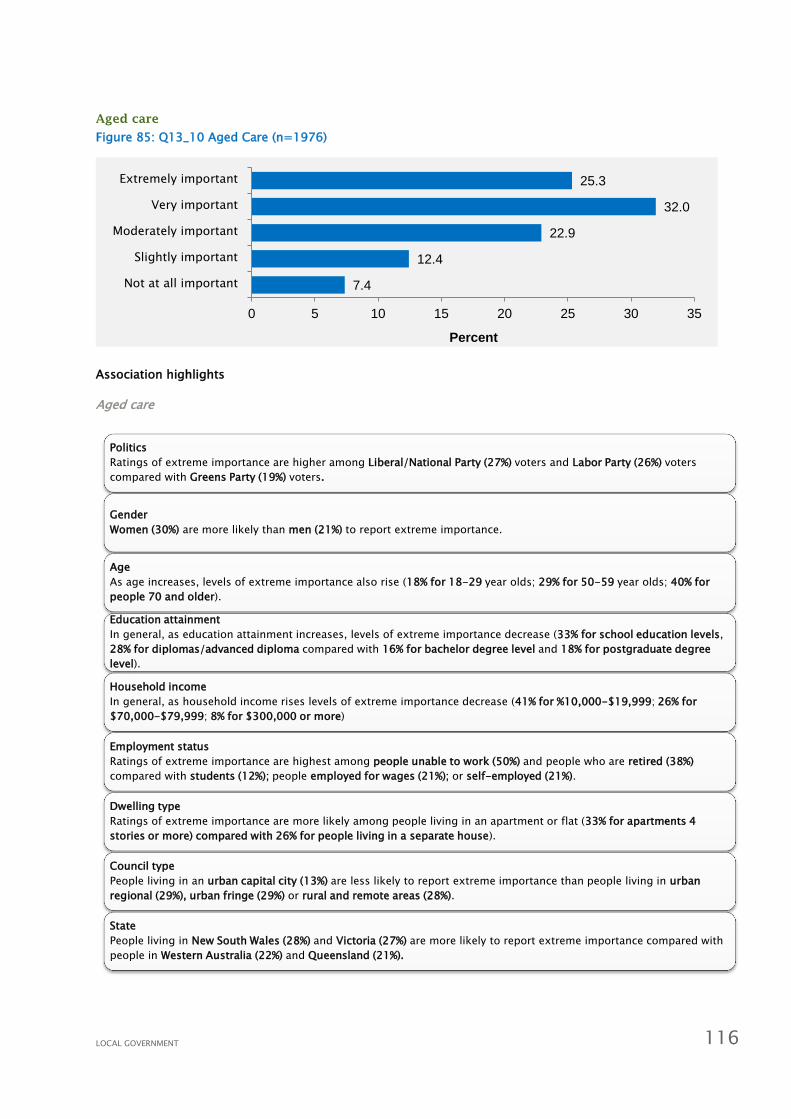
LOCAL GOVERNMENT 116
Aged care
Figure 85: Q13_10 Aged Care (n=1976)
Association highlights
Aged care
7.4
12.4
22.9
32.0
25.3
0 5 10 15 20 25 30 35
Not at all important
Slightly important
Moderately important
Very important
Extremely important
Percent
Politics
Ratings of extreme importance are higher among Liberal/National Party (27%) voters and Labor Party (26%) voters
compared with Greens Party (19%) voters.
Gender
Women (30%) are more likely than men (21%) to report extreme importance.
Age
As age increases, levels of extreme importance also rise (18% for 18-29 year olds; 29% for 50-59 year olds; 40% for
people 70 and older).
Education attainment
In general, as education attainment increases, levels of extreme importance decrease (33% for school education levels,
28% for diplomas/advanced diploma compared with 16% for bachelor degree level and 18% for postgraduate degree
level).
Household income
In general, as household income rises levels of extreme importance decrease (41% for %10,000-$19,999; 26% for
$70,000-$79,999; 8% for $300,000 or more)
Employment status
Ratings of extreme importance are highest among people unable to work (50%) and people who are retired (38%)
compared with students (12%); people employed for wages (21%); or self-employed (21%).
Dwelling type
Ratings of extreme importance are more likely among people living in an apartment or flat (33% for apartments 4
stories or more) compared with 26% for people living in a separate house).
Council type
People living in an urban capital city (13%) are less likely to report extreme importance than people living in urban
regional (29%), urban fringe (29%) or rural and remote areas (28%).
State
People living in New South Wales (28%) and Victoria (27%) are more likely to report extreme importance compared with
people in Western Australia (22%) and Queensland (21%).

LOCAL GOVERNMENT 117
Emergency and disaster management
Figure 86: Q13_11 Emergency and disaster management (n=1991)
Association highlights
Emergency and disaster management
3.3
6.5
14.3
34.9
40.9
0 10 20 30 40 50
Not at all important
Slightly important
Moderately important
Very important
Extremely important
Percent
Gender
Women (47%) are more likely than men (35%) to report extreme importance.
Education attainment
In general, as education attainment increases, extreme importance decreases (44% for school education levels and 41%
for diplomas/advanced diploma compared with 35% for bachelor degree level and 36% for postgraduate degree level).
Employment status
Ratings of extreme importance are highest among respondents who are unable to work (55%) and homemakers (54%)
compared with students (28%).
Family type
Ratings of extreme importance are highest among group households (47%) compared with the general community (41%).
Council type
People living in urban capital cities (36%) are less likely to report extreme importance compared to people living in the
urban fringe (48%), urban regional (44%) and rural and remote areas (44%).

LOCAL GOVERNMENT 118
Libraries
Figure 87: Q13_12 Libraries (n=1997)
Association highlights
Libraries
2.7
6.9
24.1
39.2
27.2
0 10 20 30 40 50
Not at all important
Slightly important
Moderately important
Very important
Extremely important
Percent
Politics
Greens (37%) voters report the highest levels of extremely important, followed by respondents whose votes
change from election to election (30%). Liberal/National (24%). Labor (26%) voters report lowest levels.
Knowledge of mayor’s name
Respondents who name their mayor correctly (31%) are more likely to report extreme importance than those who
do not know (23%) or do so incorrectly (24%).
Gender
‘Extremely important’ ratings are higher amongst female (31%) respondents compared with male (23%)
respondents.
Age
Extreme importance increase with age: 18-29 (22%) year olds vs. respondents aged 70 and over (30%).
Employment status
Respondents who are unable to work (34%); homemakers (34%); and self-employed (32%) have the highest ratings
of extreme importance. Those who are students (19%) and out of work and not currently looking (21%) have the
lowest.
Dwelling type
Overall, ‘extremely important’ ratings increase between respondents living in separate houses (28%); flats, units or
apartments of 3 stories and less (30%); and flats, units or apartments of 4 stories or more (38%). Ratings are
lowest for respondents living in semi-detached and similar houses (18%).
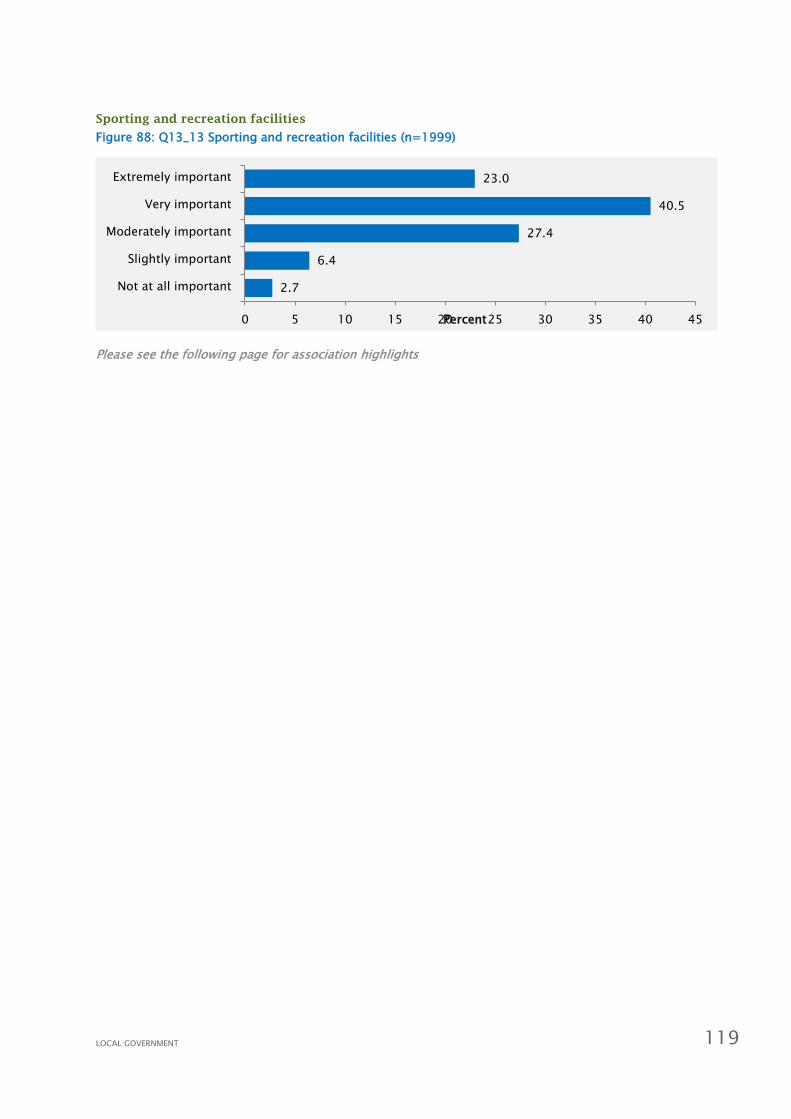
LOCAL GOVERNMENT 119
Sporting and recreation facilities
Figure 88: Q13_13 Sporting and recreation facilities (n=1999)
Please see the following page for association highlights
2.7
6.4
27.4
40.5
23.0
0 5 10 15 20 25 30 35 40 45
Not at all important
Slightly important
Moderately important
Very important
Extremely important
Percent

LOCAL GOVERNMENT 120
Association highlights
Sporting and recreation facilities
Community participation
Respondents who have actively participated (27%) in community clubs, services and groups are more likely to report
extreme importance than those who had not participated (19%).
Politics
Ratings of ‘extremely important’ are higher amongst Labor (26%) voters; respondents whose votes change from election
to election (24%); and Liberal/National (23%) voters. Greens (19%) voters have the lowest ratings.
Knowledge of mayor’s name
Respondents who incorrectly (29%) name their mayor are more likely to report extreme importance (compared with 23%
state wide).
Age
‘Extremely important’ ratings rise from 18-29 (16%); peak at 50-59 (27%) years of age; and then fall once more
between 60 and 70 years and over (21%).
Employment status
‘Extremely important’ ratings are highest amongst respondents who are unable to work (31%) and homemakers (29%).
They are lowest amongst students (14%) and respondents who are out of work and looking (17%).
Housing tenure
Respondents whose homes are mortgaged or owned outright (25%) are more likely to report extreme importance than
respondents who are renting (16%).
Dwelling type
Respondents who live in separate houses (24%) are more likely to have higher ‘extremely important’ ratings than those
who live in semi-detached or similar houses (13%); flats, units or apartments of 3 stories or less (16%); and flats, units
or apartments of 4 stories or more (18%).
Family type
Couples with children (26%); one-parent families (24%); and couples with no children (22%) are more likely to report
extreme importance than respondents of non-family group (15%) and lone-person households (18%)
Length of time living in the local area
‘Extremely important’ ratings rise with length of residency. Respondents whose residencies are more than 10 years
(24%) report higher levels than those whose residencies are less than 2 years (18%) in length.
Council type
Respondents of urban regional (26%) councils are most likely to report extreme importance while those in urban capital
cities (19%) are least likely to do so.

LOCAL GOVERNMENT 121
Arts and culture
Figure 89: Q13_14 Arts and culture (n=1992)
Association highlights
Arts and culture
7.7
17.7
36.1
25.4
13.2
0 10 20 30 40
Not at all important
Slightly important
Moderately important
Very important
Extremely important
Percent
Politics
Greens (23%) voters have the highest ‘extremely important’ ratings. Labor (13%) and Liberal/National (10%) voters
have the lowest.
Employment status
Respondents who are unable to work (29%); out of work but not currently looking (24%); and out of work and looking
(23%) report higher ‘extremely important’ ratings than respondents who are students (10%); employed for wages;
(11%) and self-employed (12%).
Working in government and NFP
Respondents who work for government and/or the not-for-profit sector (14%) are more likely to report extreme
importance than those who work for the private sector (9%).
Family type
Respondents of one-parent families (24%) have the highest ‘extremely important’ ratings, compared with families of
couples with children (11%); couples with no children (12%); and lone-person households (15%).
Length of time living in the local area
Repondents whose residency is less than 2 years (23%) in length are more likely to report extreme importance
compared with all other respondents (13% nationwide).

LOCAL GOVERNMENT 122
Economic development
Figure 90: Q13_15 Economic development (n=1971)
Association highlights
Economic development
4.2
8.8
27.3
37.4
22.2
0 10 20 30 40
Not at all important
Slightly important
Moderately important
Very important
Extremely important
Percent
Politics
Respondents whose votes change from election to election (28%) are most likely to have higher ‘extremely important’
ratings, followed by Liberal/National (24%) and Labor (22%) voters. Greens (13%) voters have the lowest ‘extremely
important’ ratings.
Age
Ratings of ‘extremely important’ are higher amongst respondents of 50-59 (29%) years than all other respondents
(22% community wide).
Non-English speaking background
Respondents who speak a language other than English (29%) are more likely than those who are English-only (22%)
speakers to report extreme importance.
Education attainment
Extreme importance is higher amongst school (25%); diploma/advanced diploma (25%); and certificate (24%) level
holders compared with bachelor (18%) and postgraduate (19%) degree holders.
Employment status
Respondents who are unable to work (24%); self-employed (24%); and homemakers (24%) have the highest ratings of
‘extremely important’ compared with those who are students (14%) and out of work but not currently looking (17%).
Family type
Households of non-family groups (29%) and couples with no children (23%) have the highest ‘extremely important’
ratings, followed by couples with children (23%) and one-parent families (20%). Respondents of lone-person
households (16%) have the lowest ratings.
Council type
Respondents of urban regional (27%); rural and remote (24%); and urban fringe (23%) councils are more likely to
report extreme importance than those of urban capital cities (16%); urban development small/medium (19%); and
urban development large/very large (20%) councils.

LOCAL GOVERNMENT 123
Youth services
Figure 91: Q13_16 Youth services (n=1976)
Association highlights
Youth services
4.8
8.8
24.1
37.2
25.1
0 5 10 15 20 25 30 35 40
Not at all important
Slightly important
Moderately important
Very important
Extremely important
Percent
Age
Extreme importance is highest amongst respondents aged 40-49 (29%), and lowest amongst respondents aged 70 and
over (19%) and 18-29 (21%).
Education attainment
Diploma/advanced diploma (31%); certificate (27%); and school education (27%) level holders are more likely to report
extreme importance than postgraduate (20%) and bachelor (20%) degree holders.
Employment status
Respondents who are unable to work (47%) report the highest rating of extreme importance, followed by those who are
out of work but not currently looking (42%) and homemakers (36%). Students (13%), followed by retired (21%)
respondents, report the lowest ratings.
Family type
Respondents of one-parent families (33%) have the highest ‘extremely important’ level, followed by non-family group
households (29%); couples with children (27%); and couples with no children (24%). Respondents of lone-person
households (19%) have the lowest level.
Council type
Respondents of urban fringe (30%); rural and remote (27%); and urban regional (27%) councils have higher ratings of
extreme importance, compared with those of and urban capital city (21%); urban development small/medium (21%); and
urban development large/very large (23%) councils.

LOCAL GOVERNMENT 124
Community development
Figure 92: Q13_17 Community development (n=1979)
Association highlights
Community development
2.3
5.7
26.3
39.9
25.7
0 10 20 30 40 50
Not at all important
Slightly important
Moderately important
Very important
Extremely important
Percent
Politics
Greens (34%) voters report the highest extreme importance compared with Labor (25%) and Liberal/National (26%) voters.
Age
Extreme importance increases from 18-29 (25%) to peak at 40-49 (29%) years of age. Then ratings decrease, with the
lowest rating reported by respondents aged 70 and over (19%).
Employment status
Respondents who are out of work and looking (39%); out of work but not currently looking (33%); and homemakers (29%)
report the highest levels of extreme importance. Respondents who are students (20%); retired (22%); and self-employed
(24%) report the lowest levels of extreme importance.
Family type
Households of non-family groups (33%); couples with children (28%); and one-parent families (28%) are more likely to
have higher ‘extremely important’ ratings compared with lone-person households (21%) and couples with no children
(24%).
Council type
Respondents of urban fringe (29%) councils report the highest extreme importance, followed by respondents in rural and
remote (28%) and urban regional (27%) councils. Those in urban development large/very large (22%) councils report the
lowest, followed by urban development small/medium (22%) and urban capital city (23%) councils.

LOCAL GOVERNMENT 125
Planning for the future
Figure 93: Q13_18 Planning for the future (n=1979)
Association Highlights
Planning for the future
1.3
3.9
14.6
40.6
39.6
0 5 10 15 20 25 30 35 40 45
Not at all important
Slightly important
Moderately important
Very important
Extremely important
Percent
Community participation
Respondents who had actively participated (44%) are more likely to report extreme importance than those who had
not participated (36%) in community services, clubs or groups.
Knowledge of mayor’s name
Respondents who name their mayor correctly (43%) are more likely to have ‘extremely important’ ratings than those
who name their mayor incorrectly (35%).
Age
Extreme importance generally increases from respondents aged 18-29 (38%) to 50-59 (44%) years. Levels then
decrease again, with the lowest reported by respondents aged 70 and over (35%).
Employment status
Ratings of ‘extremely important’ are highest for respondents who are out of work and looking (57%), followed by
those who are unable to work (48%) and homemakers (44%). Respondents who are students (31%); out of work but
not currently looking (38%); and retired (38%) have the lowest ratings.
Family type
Respondents whose families consist of one parent (46%) report the highest extreme importance, followed by families
of couples with no children (41%) and couples with children (40%). Respondents of lone-person households (36%)
report lower levels.
Council type
‘Extremely important’ ratings are highest amongst respondents of urban regional (46%) and rural and remote (40%)
councils, and lowest amongst those of urban development large/very large (35%) councils.

LOCAL GOVERNMENT 126
Promoting the benefits of the local area
Figure 94: Q13_19 Promoting the benefits of the local area (n=1992)
Association highlights
Promoting the benefits of the local area
3.4
12.4
27.0
33.7
23.5
0 5 10 15 20 25 30 35 40
Not at all important
Slightly important
Moderately important
Very important
Extremely important
Percent
Politics
Respondents whose votes change from election to election (28%) report the highest ‘extremely important’ ratings,
followed by Liberal/National (25%) and Labor (23%) voters. Greens (15%) voters have the lowest ‘extremely important’
ratings.
Age
Extreme importance increases between 18-29 (19%) and 50-59 (31%) year old respondents. It then decreases again
for respondents who are 70 years and over (18%).
Education attainment
Extreme importance is higher for respondents with diploma/advanced diploma (31%); certificate (28%); and school-
level (23%) qualifications. It is lowest for bachelor (18%) and postgraduate (18%) degree holders.
Employment status
Respondents who are out of work and looking (36%); unable to work (33%); and homemakers (31%) have the highest
‘extremely important’ ratings. Those who are out of work but not currently looking (16%) and students (16%) have
the lowest.
Family type
Respondents whose families consist of one parent (32%) report the highest extreme importance. Families of couples
with no children (25%) and couples with children (23%) have lower levels, with respondents of lone-person
households reporting the lowest (20%).
Council type
Extreme importance is highest amongst respondents of rural and remote (29%) and urban regional (29%) councils. It
is lowest amongst respondents of urban capital city (16%) councils.

LOCAL GOVERNMENT 127
6.1.4 Relative level of importance of each task being done by local government
Figure 95: Relative importance of each task being done by local government
7.7
9.1
13.0
3.4
7.4
4.2
4.8
2.7
2.3
2.7
3.8
3.1
1.8
1.1
2.8
3.3
1.3
0.8
2.3
17.7
12.8
11.7
12.4
12.4
8.8
8.8
6.4
5.7
6.9
6.4
6.1
5.8
4.3
4.6
6.5
3.9
3.9
3.6
36.1
28.2
22.0
27.0
22.9
27.3
24.1
27.4
26.3
24.1
21.0
20.1
21.1
20.6
18.1
14.3
14.6
14.5
12.1
25.4
30.8
31.8
33.7
32.0
37.4
37.2
40.5
39.9
39.2
38.5
42.1
41.3
45.4
39.1
34.9
40.6
42.0
39.0
13.2
19.1
21.4
23.5
25.3
22.2
25.1
23.0
25.7
27.2
30.3
28.6
30.1
28.6
35.3
40.9
39.6
38.8
42.9
0% 10% 20% 30% 40% 50% 60% 70% 80% 90% 100%
Arts and culture (n=1992)
Cycleways (n=1989)
Child Care (n=1974)
Promoting the benefits of the local area (n=1992)
Aged Care (n=1976)
Economic development (n=1971)
Youth services (n=1976)
Sporting and recreation facilities (n=1999)
Community development (n=1979)
Libraries (n=1997)
Land use planning and development applications (n=1975)
Roads and bridges (n=1993)
Footpaths (n=2000)
Parks (n=1997)
Health and environmental management (n=1991)
Emergency and disaster management (n=1991)
Planning for the future (n=1997)
Street cleaning and waste management (n=2001)
Water, sewage, stormwater, drainage (n=1995)
Not at all important Slightly important Moderately important Very important Extremely important

LOCAL GOVERNMENT 128
6.1.5 Amalgamation
Question 15: Imagine that your local government is to be merged or amalgamated with another to
form a new local government area. For each of the questions below, tell me if the amalgamation
would make each of the following things much better, better, no different, worse or much worse?
How my interests are represented by councillors
Figure 96: Q15_1 How my interests are represented by councillors (n=2006)
Association highlights
How my interests are represented by councillors
1.3
7.9
34.6
34.0
13.7
8.5
0 5 10 15 20 25 30 35 40
Much better
Better
No different
Worse
Much worse
Don't know
Percent
Politics
People who would normally vote for or most identify with the Greens are more likely to think representation will get
worse or much worse (58% compared to 52% community-wide).
Non-English speaking background
People who speak a language other than English at home are more likely than those who speak only English to think that
representation will get better or much better (20% compared with 9% of English speakers).
Council type
Respondents living in rural and remote councils are more likely to believe representation will be much worse after
amalgamation (21% compared to 15% nationwide). However residents of large/very large urban councils are less likely to
do so (9%)
Employment status
Homemakers (9%) and students (6%) are less likely to think that representation will get much worse compared to self-
employed (22%) or the general community (15%).
Dwelling type
People living in a separate house are more likely that those who live in a flat, unit or apartment (4 stories or more) to
think representation will get much worse (16% compared to 3%).
State
People living in Western Australia (7%) and Queensland (8%) are less likely to think representation will get better or much
better compared to those living in New South Wales (13%) and Victoria (10%)

LOCAL GOVERNMENT 129
My feeling of belonging to the local area
Figure 97: Q15_2 My feeling of belonging to the local area (n=2006)
Association highlights
My feeling of belonging to the local area
1.4
5.2
59.3
22.7
7.6
3.7
0 10 20 30 40 50 60 70
Much better
Better
No different
Worse
Much worse
Don't know
Percent
Community participation
People who have participated in their local community in the last 12 months are more likely, compared to those who
haven’t, to think that amalgamation will make their feeling of belonging to the local area worse or much worse (33%
compared to 30%).
Politics
People who would normally vote for or most identify with the political party the Greens are more likely to think their
feeling of belonging to the local area will get much worse (11% compared with 8% community-wide).
Knowledge of mayor’s name
Respondents who could correctly answer the name of their local mayor are more likely than those who didn’t know the
name to think their feeling of belonging will get worse or much worse (34% compared with 28%).
Non-English speaking background
People who speak a language other than English at home are more likely than those who don’t to think that their
feeling of belonging will get better or much better (20% compared with 6% of English speakers).
Educational attainment
People with a post-graduate degree level qualification more likely to think their feeling of belonging to the local area
will get worse or much worse after amalgamation (37% compared with 32% nationwide)
Council type
Respondents living in rural and remote councils are more likely to think their feeling of belonging will be much worse
after amalgamation (12% compared to 8% nation-wide).
Employment status
People out of work and looking for work (19%) and students (19%) are less likely to think feelings of belong to the local
area will get much worse compared with the general community (32%).
Length of time living in the local area
Concerns that feelings of belonging will get worse or much worse are higher among people who have lived in the area
10 years or more compared with those who have lived in the area for less than two years (35% compared with 16%)
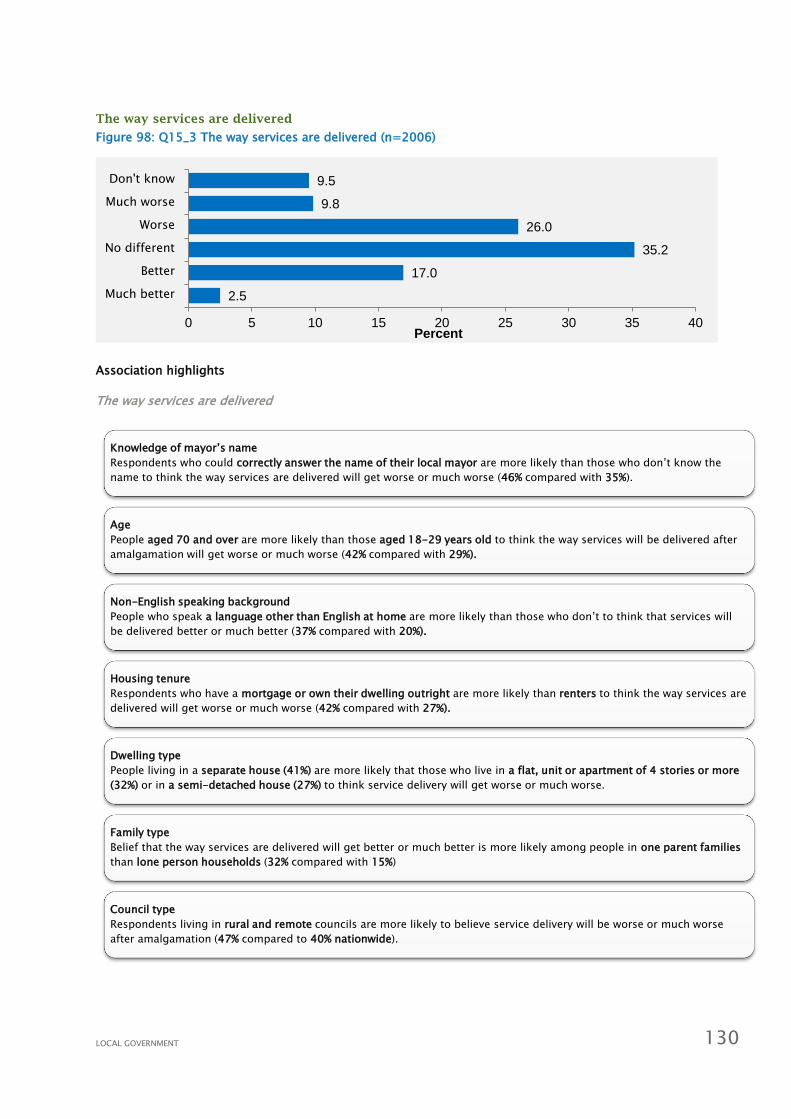
LOCAL GOVERNMENT 130
The way services are delivered
Figure 98: Q15_3 The way services are delivered (n=2006)
Association highlights
The way services are delivered
2.5
17.0
35.2
26.0
9.8
9.5
0 5 10 15 20 25 30 35 40
Much better
Better
No different
Worse
Much worse
Don't know
Percent
Knowledge of mayor’s name
Respondents who could correctly answer the name of their local mayor are more likely than those who don’t know the
name to think the way services are delivered will get worse or much worse (46% compared with 35%).
Age
People aged 70 and over are more likely than those aged 18-29 years old to think the way services will be delivered after
amalgamation will get worse or much worse (42% compared with 29%).
Non-English speaking background
People who speak a language other than English at home are more likely than those who don’t to think that services will
be delivered better or much better (37% compared with 20%).
Housing tenure
Respondents who have a mortgage or own their dwelling outright are more likely than renters to think the way services are
delivered will get worse or much worse (42% compared with 27%).
Dwelling type
People living in a separate house (41%) are more likely that those who live in a flat, unit or apartment of 4 stories or more
(32%) or in a semi-detached house (27%) to think service delivery will get worse or much worse.
Family type
Belief that the way services are delivered will get better or much better is more likely among people in one parent families
than lone person households (32% compared with 15%)
Council type
Respondents living in rural and remote councils are more likely to believe service delivery will be worse or much worse
after amalgamation (47% compared to 40% nationwide).

LOCAL GOVERNMENT 131
The cost to me for local services
Figure 99: Q15_4 The cost to me for local services (n=2006)
Association highlights
The cost to me of local services
1.8
17.5
33.7
25.2
9.9
12.0
0 5 10 15 20 25 30 35 40
Much better
Better
No different
Worse
Much worse
Don't know
Percent
Knowledge of mayor’s name
Respondents who can name their mayor are more likely to think the cost of services would be worse or much worse (46%)
compared with those who don’t know the mayor's name(34%).
Gender
Men are more likely than women to think that the cost to them of local services will get better or much better (25% compared
with 18%).
Age
There is an inverse relationship between age and how respondents think amalgamation will impact on the cost of local
services to them. Those aged 70 and over are more likely than those aged 18-29 to think things will get worse or much
worse (49% compared with 25%).
Non-English speaking background
Respondents from a non-English speaking background are more likely to think the cost to them of services will get better or
much better (30% compared with 21% of those from an English speaking background)
Family type
People living as part of a couple with children (26%) are more likely than a lone parent (13%) or person living alone (14%) think
the cost of local services will be better or much better after amalgamation.
Length of time living in the local area
People who have lived less than two years in the local area are more likely to think the cost of local services to them will get
better or much better (29% compared to 22% community-wide).
Council type
People living in urban regional (17%) and rural and remote local government areas (19%) are less likely to think that the cost
of local services will get better or much better compared with those in urban development local government areas (26%).

LOCAL GOVERNMENT 132
The cost of council rates
Figure 100: Q15_5 The cost of council rates (n=2006)
Association highlights
The cost of council rates
2.2
15.4
24.9
30.6
12.4
14.5
0 5 10 15 20 25 30 35
Much better
Better
No different
Worse
Much worse
Don't know
Percent
Gender
Male respondents are more likely than females to think the cost of council rates will get better or much better (25% compared to
16%).
Age
As people get older they are less likely to think that the cost of council rates will improve with amalgamation, with 12% of
respondents aged 70 and over thinking the cost of council rates will get better or much better compared to 33% of those aged
18-29.
Non-English speaking background
People who speak a language other than English at home are more likely that those who don’t to think that the cost of council
rates will get better or much better (29% compared with 20% of English only speakers).
Education
People with a higher level of education are less likely to think that the cost of council rates will get worse or much worse (52% of
those with school education compared with 41% of those with a post-graduate degree).
Employment status
Students are more likely to think that the cost of council rates will get better or much better after amalgamation (38% compared
to 20% of the overall population)
Dwelling type
People who live in a flat, unit or apartment (4 stories or more) are much more likely to think the cost of council rates will be
worse or much worse (70% compared with 50% community-wide)
Council type
People in urban regional (56%) and rural and remote (57%) councils are more likely to think the cost of council rates will get
worse or much worse compared with those in urban development small/medium (49%) and large/very large (46%) councils.

LOCAL GOVERNMENT 133
My sense of local community
Figure 101: Q15_6 My sense of local community (n=2006)
Association highlights
My sense of local community
.7
6.3
54.3
25.9
8.1
4.7
0 10 20 30 40 50 60
Much better
Better
No different
Worse
Much worse
Don't know
Percent
Community participation
People actively involved in the community are more likely than those who are not to think their sense of local
community will get worse or much worse after amalgamation (38% compared with 34% of those not actively involved).
Age
As people get older they are more likely to think their sense of local community will get worse, with 42% of those aged
over 70 compared to 26% of those aged 18-28 thinking it will get worse or much worse.
Non-English speaking background
People who speak a language other than English at home are more likely to think that their sense of local community
will get better or much better (19% compared with 6% of those who speak English at home).
Employment status
People who are unemployed are less likely to think their sense of local community will get worse or much worse (21%
compared to 36% community-wide) and more likely to believe amalgamation will make no difference (67% compared
to 57% community-wide).
Housing tenure
Those living in a dwelling that is mortgaged or owned outright are more likely than those who are renting to think
their sense of local community will get worse or much worse (37% compared with 29%).
Length of time living in the local area
People who have lived for more than 10 years in the area are more likely to think their sense of community will get
worse or much worse compared to those who have lived in the area for less than 2 years (39% compared with 31%).

LOCAL GOVERNMENT 134
6.1.6 Relative perception of impact of amalgamation on respondents
The impact of amalgamation that respondents are most concerned about is on how their interests are represented by councillors. Over half (52%) think that
representation of their interests will get worse or much worse. A similar proportion (50%) is concerned that the cost of council rates will be worse or much
worse. By contrast, between a half and two-thirds of respondents believe that their sense of local community (57%) and their feeling of belonging to the
local area (62%) will be no different after amalgamation. Respondents were most positive about the impact of amalgamation on the cost of council rates, the
cost to them of local services and the way services are delivered, with approximately 20% thinking that these things will get better or much better.
Figure 102: Q15 Relative perception of impact of amalgamation (excluding don’t know responses)
Please note that the numbers in this figure will not match those in Section 6.1.5, as ‘don’t know’ responses have been excluded from this comparative
figure.
1.5
0.7
2.8
2.0
2.6
1.4
5.4
6.6
18.7
19.8
18.0
8.6
61.6
57.0
38.9
38.3
29.1
37.8
23.6
27.2
28.7
28.6
35.8
37.2
7.9
8.5
10.9
11.3
14.5
15.0
0% 10% 20% 30% 40% 50% 60% 70% 80% 90% 100%
My feeling of belonging to the local area (n=1931)
My sense of local community (n=1913)
The way services are delivered (n=1815
The cost to me of local services (n=1766)
The cost of council rates (n=1714)
How my interests are represented by councillors (n=1836)
Much beter Better No different Worse Much worse

THE RESPONDENTS 135
7 The respondents
7.1 Community participation and values
7.1.1 Community participation
Question 1: In the past 12 months, have you been actively involved in any service club or sporting,
social, welfare, emergency services or recreation group in your community? Yes/No
Figure 103: Q1 Community participation (n=2006)
7.1.2 Community members
Question 2: Thinking about your local area, which of the following people are part of your community?
Figure 104: Q2 Thinking about your local area, which of the following people are part of your
community (n=2006)
48.0
51.3
.7
0 10 20 30 40 50 60
Yes (n=963)
No (n=1030)
Don't know (n=14)
Percent
95.6
89.3
86.5
83.8
2.1
8.4
10.5
13.5
2.3
2.2
3.0
2.7
0% 20% 40% 60% 80% 100%
Ratepayers
People who work in the…
Renters
Students
Yes (%) No (%) DK (%)

THE RESPONDENTS 136
7.1.3 Important things in life
Question 4: How important is each of the following in your life?
Family
Figure 105: Q4 How important is each of the following in your life? Family (n=2002)
Friends
Figure 106: Q4 How important is each of the following in your life? Friends (n=2006)
Leisure time
Figure 107: Q4 How important is each of the following in your life? Leisure time (n=2005)
.6
.9
5.1
23.2
70.1
0 10 20 30 40 50 60 70 80
Not at all important
Slightly important
Moderately important
Very important
Extremely important
Percent
.7
2.9
15.8
40.4
40.2
0 10 20 30 40 50
Not at all important
Slightly important
Moderately important
Very important
Extremely important
Percent
1.1
4.4
27.4
39.6
27.4
0 10 20 30 40 50
Not at all important
Slightly important
Moderately important
Very important
Extremely important
Percent

THE RESPONDENTS 137
Politics
Figure 108: Q4 How important is each of the following in your life? Politics (n=1991)
Work
Figure 109: Q4 How important is each of the following in your life? Work (n=1998)
Religion
Figure 110: Q4 How important is each of the following in your life? Religion (n=1994)
10.6
19.9
40.7
19.4
9.4
0 10 20 30 40 50
Not at all important
Slightly important
Moderately important
Very important
Extremely important
Percent
13.1
5.6
23.8
34.8
22.7
0 10 20 30 40
Not at all important
Slightly important
Moderately important
Very important
Extremely important
Percent
45.1
17.3
18.0
10.8
8.7
0 10 20 30 40 50
Not at all important
Slightly important
Moderately important
Very important
Extremely important
Percent

THE RESPONDENTS 138
Study
Figure 111: Q4 How important is each of the following in your life? Study (n=2001)
Relative Importance of each thing in life
Figure 112: Q4 How important is each of the following in your life? Relative importance ordered from
most to least important
19.4
13.0
25.3
26.1
16.2
0 5 10 15 20 25 30
Not at all important
Slightly important
Moderately important
Very important
Extremely important
Percent
45.1
10.6
19.4
13.1
1.1
0.7
0.6
17.3
19.9
13.0
5.6
4.4
2.9
0.9
18.0
40.7
25.3
23.8
27.4
15.8
5.1
10.8
19.4
26.1
34.8
39.6
40.4
23.2
8.7
9.4
16.2
22.7
27.4
40.2
70.1
0% 10% 20% 30% 40% 50% 60% 70% 80% 90% 100%
Religion
Politics
Study
Work
Leisure time
Friends
Family

THE RESPONDENTS 139
7.1.4 Political orientation
Question 5: What political party do you normally vote for, or most identify with?
Figure 113: Q5 What political party do you normally vote for, or most identify with? (n=2006)
2.8
3.5
4.0
4.1
9.6
18.4
26.8
30.9
0 5 10 15 20 25 30 35
National
Refused
Don't know
Other - specify
Greens
None - change from election to election
Liberal
Labor
Percentage
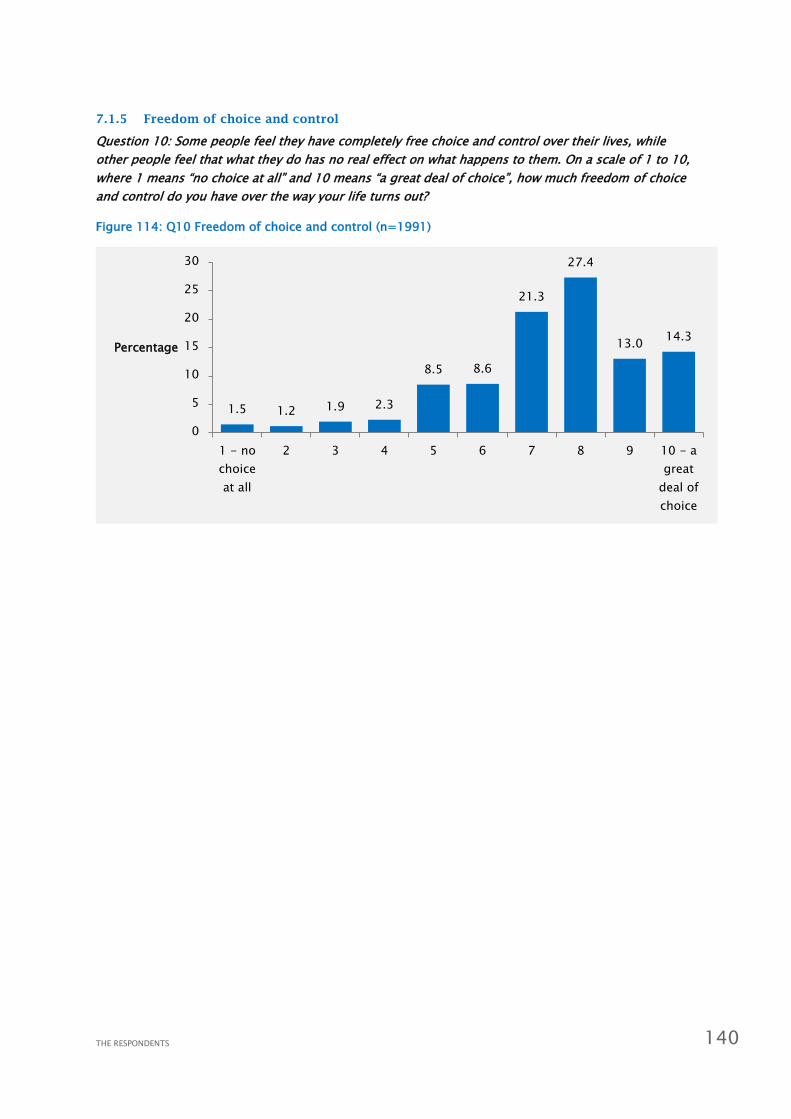
THE RESPONDENTS 140
7.1.5 Freedom of choice and control
Question 10: Some people feel they have completely free choice and control over their lives, while
other people feel that what they do has no real effect on what happens to them. On a scale of 1 to 10,
where 1 means “no choice at all” and 10 means “a great deal of choice”, how much freedom of choice
and control do you have over the way your life turns out?
Figure 114: Q10 Freedom of choice and control (n=1991)
1.5 1.2 1.9 2.3
8.5 8.6
21.3
27.4
13.0 14.3
0
5
10
15
20
25
30
1 - no
choice
at all
2 3 4 5 6 7 8 9 10 - a
great
deal of
choice
Percentage

PROFILE OF THE RESPONDENTS 141
8 Profile of the respondents
8.1 Demographics
8.1.1 Gender
51% of respondents (n=1026) were female
49% of respondents (n=981) were male
8.1.2 Age
Question 16: In what year where you born
Responses to the question on age were coded to 5 categories. A discussion of the post-stratification
weighting applied to the data can be found in Appendix C.
Unweighted ages
Figure 115: Q16 In what year were you born? Unweighted ages (n=2006)
Post-stratification weighted ages (used in univariate and bivariate analysis)
Figure 116: Q16 In what year where you born? (n=2006) NB: Coded to categories and weighted to
general population
7.8
14.2
18.1
22.8
18.9
18.2
0 5 10 15 20 25
18-29
30-39
40-49
50-59
60-69
70 and over
Percent
21.4
18.0
18.5
16.6
12.9
12.7
0 5 10 15 20 25
18-29
30-39
40-49
50-59
60-69
70 and over
Percent

PROFILE OF THE RESPONDENTS 142
8.1.3 Non-English speaking background (NESB)
Question 17: Do you speak a language other than English at home?
Figure 117: Q17 Do you speak a language other than English at home? (n=2006)
8.1.4 Educational qualifications
Question 18: What is the highest level of educational qualification you have completed?
Figure 118: Q18 What is the highest level of educational qualification you have completed? (n=2006)
91.3
8.7
0 20 40 60 80 100
No, English only
Yes - specify
Percent
26.4
18.9
12.9
22.7
4.8
13.6
.3
.4
0 5 10 15 20 25 30
School education level
Certificate level
Diploma and Advanced Diploma level
Bachelor degree level
Graduate Certificate and Graduate Diploma level
Postgraduate Degree level
Don't know
Refused
Percent

PROFILE OF THE RESPONDENTS 143
8.1.5 Income
Question 19: What is the total combined income of everyone in your household, before tax and other
deductions? Please include income from all sources including wages, investments and government
pensions and benefits.
Figure 119: Q19 What is the total combined income of everyone in your household, before tax and
other deductions? (n=2006)
.8
3.9
6.0
4.5
3.8
5.6
4.4
5.5
5.4
5.2
16.8
7.9
5.0
2.6
11.8
10.7
0 5 10 15 20
Less than $10,000
$10,000 to $19,999
$20,000 to $29,999
$30,000 to $39,999
$40,000 to $49,999
$50,000 to $59,999
$60,000 to $69,999
$70,000 to $79,999
$80,000 to $89,999
$90,000 to $99,999
$100,000 to $149,999
$150,000 to $199,000
$200,000 to $299,000
$300,000 or more
Don't know
Refused
Percent

PROFILE OF THE RESPONDENTS 144
8.1.6 Employment status
Question 20: What is your employment status; are you currently …
Figure 120: Q20 What is your employment status? (n=2006)
8.1.7 Employment in government or not-for-profit areas
Question 21: Are you currently working for the government, a public institution or a non-profit
organisation?
Figure 121: Q21 Are you currently working for the government, a public institution or a non-profit
organisation? (n=2006)
51.7
9.4
3.8
1.2
5.1
5.5
20.7
1.6
.2
.7
0 20 40 60
Employed for wages
Self-employed
Out of work and looking for work
Out of work but not currently looking for work
A homemaker
A student
Retired
Unable to work
Don't know
Refused
Percent
44.0
54.9
.9
.2
0 10 20 30 40 50 60
Yes
No
Don't know
Refused
Percent
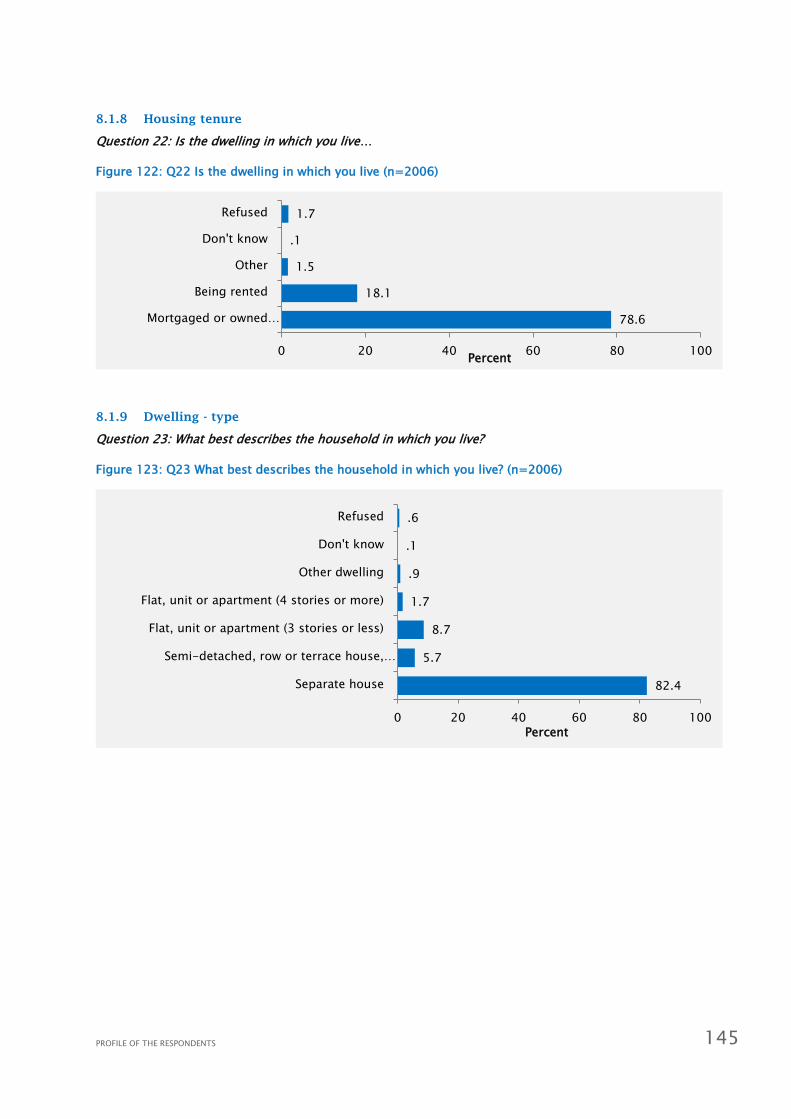
PROFILE OF THE RESPONDENTS 145
8.1.8 Housing tenure
Question 22: Is the dwelling in which you live…
Figure 122: Q22 Is the dwelling in which you live (n=2006)
8.1.9 Dwelling - type
Question 23: What best describes the household in which you live?
Figure 123: Q23 What best describes the household in which you live? (n=2006)
78.6
18.1
1.5
.1
1.7
0 20 40 60 80 100
Mortgaged or owned…
Being rented
Other
Don't know
Refused
Percent
82.4
5.7
8.7
1.7
.9
.1
.6
0 20 40 60 80 100
Separate house
Semi-detached, row or terrace house,…
Flat, unit or apartment (3 stories or less)
Flat, unit or apartment (4 stories or more)
Other dwelling
Don't know
Refused
Percent

PROFILE OF THE RESPONDENTS 146
8.1.10 Household - type
Question 24: What best describes the household in which you live?
Figure 124: Q24 What best describes the household in which you live? (n=2006)
8.1.11 Length of residency in local area
Question 25: How long have you lived in your local area?
Figure 125: Q25 How long have you lived in your local area? (n=2006)
27.4
42.3
5.8
5.9
15.2
2.4
.1
.8
0 5 10 15 20 25 30 35 40 45
Couple with no children
Couple with children
One parent family
Other type of family household
Lone person household
Group household (non-family)
Don't know
Refused
Percent
4.0
12.4
20.0
63.2
.1
.3
0 10 20 30 40 50 60 70
Less than 2 years
More than 2 and less than 5 years
More than 5 and less than 10 years
More than 10 years
Don't know
Refused

PROFILE OF THE RESPONDENTS 147
8.1.12 Australian classification of local government
Quotas were established so that six different types of local government classifications would be
represented in the respondent sample in adequate numbers to enable comparisons between their
responses to questions in the survey. The local government categories are based on the Australian
Classifications of Local Government. A guide to this classification system can be found in Appendix E.
Figure 126: Respondents by their local government classifications
11.1
19.5
11.9
18.5
20.0
19.0
0 5 10 15 20 25
Urban Capital City
Urban Development Small/Medium
Urban Development Large/Very Large
Urban Regional
Urban Fringe
Rural and Remote
Percent

WORKS CITED 148
9 Works cited
Alford, J. and O’Flynn, J. 2009. Making sense of public value: Concepts, critiques and emergent
meanings. International Journal of Public Administration, 32: 171-191.
Ariely, G. 2013. Public administration and citizen satisfaction with democracy: Cross-national
evidence. International Review of Administrative Sciences, 79(4): 747-766.
Atkinson, R. 2010. Community within Inequality. Housing Theory and Society, 27(2): 143-145
Aulich, C., Gibbs, M., Gooding, A., McKinlay, P., Pillora, S. and Sansom, G. 2011. Consolidation in local
government: A fresh look – Volume 1: Report. Australian Centre of Excellence for Local
Government (ACELG), Sydney.
Benington, J. 2009. Creating the public in order to create public value? International Journal of Public
Administration, 32(3-4): 232-249.
Berner, M.M., Amos, J.M. and Morse, R.S. 2011. What constitutes effective citizen participation in local
government: Views from city stakeholders. Public Administration Quarterly, Spring 2011: 128-
163.
Bouckaert, G. and van de Walle, S. 2003. Comparing measures of citizen trust and user satisfaction as
indicators of ‘good governance’: Difficulties in linking trust and satisfaction indicators.
International Review of Administrative Sciences, 69: 329-343.
Chandler, J. 2010. A rationale for local government. Local Government Studies, 36 (1): 5-20.
Colebatch, H.K. and Degeling, P.J. 1986. Understanding local government: Action, linkage, outcome.
Canberra College of Advanced Education, Canberra.
Crime and Misconduct Commission (Queensland). 2011. Public perceptions of local government:
findings from the 2010 Public Attitudes Survey. Crime and Misconduct Commission, Brisbane.
Cuthill, M. & Fien, J. 2005. Capacity building: Facilitating citizen participation in local governance.
Australian Journal of Public Administration, 4(4): 63-80.
Darlow, A., Hawtin, M. and Jassi, S. 2008. Reporting performance information to citizens. Report
commissioned by the Neighbourhood Renewal Analysis Unit at Communities and Local
Government. Policy Research Institute, Leeds.
Dollery, B., Akimov, A. and Byrnes, J. 2009. Shared services in Australian local government: Rationale,
alternative models and empirical evidence. The Australian Journal of Public Administration,
68(2): 208-219.
Donnelly, M., Wisniewski, M., Dalrymple, J.F. and Curry, A.C. 1995. Measuring service quality in local
government: The SERVQUAL approach. The International Journal of Public Sector Management,
8(7): 15-20.
Elton Consulting. 2012. Review of community surveys/polling on local government. Report prepared
for the Local Government Review Panel. Elton Consulting, Sydney.
WORKS CITED 149
Gardiner, M. 2009. Developing a local government marketing model, Paper presented at the ANZMAC
Conference 2009, http://www.duplication.net.au/ANZMAC09/papers/ANZMAC2009-707.pdf,
accessed April 2013.
Glaser, M.A. and Denhardt, R.B. 2000. Local government performance through the eyes of citizens.
Journal of Public Budgeting, Accounting and Financial Management, 12(1): 49-73.
Gray, I. and Brown, A.J. 2008. People’s perceptions of governance and the implications for regional
Australia, http://www.segra.com.au/PDF/GrayandBrown.pdf, accessed December 2013.
Herian, M.N., Hamm, J.A., Tomkins, A.J. and Pytlik Zillig, L.M. 2012. Public participation, procedural
fairness, and evaluations of local governance: The moderating role of uncertainty. Journal of
Public Administration Research, 22: 815-840.
Herian, M.N. and Tomkins, A.J. 2012. Citizen satisfaction survey data: A mode comparison of the
derived importance-performance approach. The American Review of Public Administration,
42(1): 66-86.
Im, T. and Lee, S.J. 2012. Does management performance impact citizen satisfaction? The American
Review of Public Administration, 42(4): 419-436.
Independent Local Government Review Panel. 2012. Better, stronger local government: The case for
sustainable change. NSW Government, Sydney.
Ipsos Social Research Institute. 2010. One world, many places: Citizens’ views of municipal
government and local areas across the world. Ipsos Social Research Institute, London.
James, O. 2011. Managing citizens’ expectations of public service performance: Evidence from
observation and experimentations in local government. Public Administration, 89(4): 1419-
1435.
James, O. 2010. Performance measures and democracy: Information effects on citizens in field and
laboratory experiments. Journal of Public Administration Research and Theory, 21: 399-418.
James, O. 2007. Evaluating the expectations disconfirmation and expectations anchoring approaches
to citizen satisfaction with local public services. Journal of Public Administration Research and
Theory, 19: 107-123.
JWS Research. 2012. State-wide local government services report 2012. Coordinated by the
Department of Planning and Community Development on behalf of Victorian Councils,
http://www.dpcd.vic.gov.au/localgovernment/publications-and-research/data,-directories-
and-surveys, accessed April 2013.
Kearns, A. and Parkinson, M. 2001. The significance of neighbourhood. Urban Studies, 38: 2103-2110
Kelly, J.M. 2005. The dilemma of the unsatisfied customer in a market model of public administration.
Public Administration Review, 65(1): 76-84.
Kelly, J.M. and Swindell, D. 2002. Service quality variation across urban space: First step toward a
model of citizen satisfaction. Journal of Urban Affairs, 24(3): 271-288.
Local Government Association of Queensland (LGAQ). 2011. 2011 Community satisfaction tracking
study. LGAQ, Brisbane.

WORKS CITED 150
Lowndes, V., Pratchett, L. and Stoker, G. 2006. Diagnosing and remedying the failings of official
participation schemes: The CLEAR Framework. Social Policy and Society, 5(2): 281-291.
Lyons, M. 2007. Place-shaping: A shared ambition for the future of local government – Executive
Summary. Report produced for the Lyons Inquiry into Local Government, Office of Public Sector
Information, London.
Maclennan, B., Kypri, K., Langley, J. and Room, R. 2012. Public sentiment towards alcohol and local
government alcohol policies in New Zealand. International Journal of Drug Policy, 23: 45-53.
McGregor Tan Research. 2006. Local councils and local services at a glance. Drawn from the McGregor
Tan Household Omnibus Survey, 2006, T:\! YEAR 2006 PROJECTS\! Omnibus\Reports\2
February 2006 Reports\7781 LGA - Services Final report.doc, accessed April 2013.
McKinlay, P., Pillora, S., Tan, S. and von Tunzelmann, A. 2011. Evolution in community governance:
Building on what works. ACELG, Sydney.
Metropolitan Local Government Review Panel. 2012. Metropolitan Local Government Review:
Community perceptions, http://metroreview.dlg.wa.gov.au/Publications.aspx , accessed
November 2013.
Myriad Research. 2011. Local Government Association of Tasmania Community Survey 2011: Final
Research Report. Myriad Research, Hobart.
Orr, M. and West, D.M. 2007. Citizen evaluations of local police: Personal experience or symbolic
attitudes? Administration and Society, 38(6): 649-668.
Piotrowski, S.A. and van Ryzin, G.G. 2007. Citizen attitudes toward transparency in local government.
The American Review of Public Administration, 37(3): 306-323.
Rablen, M.D. 2012. The promotion of local wellbeing: A primer for policymakers. Local Economy,
27(3): 297-314.
Roefs, M. and Atkinson, D. 2010. Public perceptions of local government. In: B Roberts, M WaKivulu &
YD Davids (Eds.) South African Social Attitudes 2nd Report: Reflections on the Age of Hope.
Human Sciences Research Council, Cape Town, pp 433-67.
Savage, M. 2010. The politics of elective belonging. Housing, Theory and Society 27(2): 115-161
Social Dimensions. 2010. 2010 community satisfaction survey for the City of Geraldton-Greenough:
final report, http://www.socialdimensions.com.au/wordpress/wp-content/uploads/11106-
Final-Community-satisfaction.pdf, accessed April 2013.
Steadman, R.C. 2002. Toward a social psychology of place: Predicting behaviour from place-based
cognitions, attitude and identity. Environment and Behaviour, 34: 561-581
Steadman, R.C. 2003. Is it really just a social construction? The contribution of the physical
environment to sense of place? Society & Natural Resources: An International Journal, 16(8):
671-685
Stephenson, J. 2010. People and place. Planning Theory and Practice, 11(1): 9-21
Stipak, B. 1979. Citizen satisfaction with urban services: Potential misuse as a performance indicator.
Public Administration Review, 39(1): 46-52.

WORKS CITED 151
Stoker, G. 2006. Public value management: A new narrative for networked governance? The American
Review of Public Administration, 36(1): 41-57.
Stoker, G. 2011. Was local governance such a good idea? A global comparative perspective. Public
Administration, 89 (1): 15-31.
Swindell, D. and Kelly, J. 2005. Performance measurement versus city service satisfaction: Intra-city
variation in quality? Social Science Quarterly, 86(3): 704-723.
Twigger-Ross, C.L. and Uzzell, D.L. 1996. Place and identity processes. Journal of Environmental
Psychology, 16: 205-220
Van de Walle, S. and van Ryzin, G.G. 2011. The order of questions in a survey on citizen satisfaction
with public services: Lessons from a split-ballot experiment. Public Administration, 89(4):
1436-1450.
Van Ryzin, GG 2013. An experimental test of the expectancy-disconfirmation theory of citizen
satisfaction. Journal of Policy Analysis and Management, 32(3): 597-614.
Van Ryzin, G.G. 2004. Expectation, performance, and citizen satisfaction with urban services. Journal
of Policy Analysis and Management, 23(3): 433-448.
Van Ryzin, G.G. and Immerwahr, S. 2007. Importance-performance analysis of citizen satisfaction
surveys. Public Administration, 85(1): 215-226.
Watt, P.A. 2006. Principles and theories of local government. Economic Affairs (Journal of the Institute
of Economic Affairs), March 2006: 4-10.
Warner, M.E. and Clifton, J. 2014. Marketization, public services and the city: The potential for
Polanyian counter movements. Cambridge Journal of Regions, Economy and Society, 7: 45-61.
Williams, I. and Shearer, H. 2011. Appraising public value: Past, present and futures. Public
Administration, 89 (4): 1367–1384.

WORKS CITED 152
Appendix A Survey instrument

WORKS CITED 153
Q.1 In the past 12 months, have you been actively involved in any service club or sporting, social, welfare, emergency services or recreation group in your community? Yes/No Q.2 Thinking about your local area, which of the following people are part of your community? Multiple answers possible
a) Ratepayers b) Renters c) Students d) People who work in the area
Q.3 Thinking about the role of government in the provision of services to the community, do you
agree or disagree with the following statements?
Strongly agree
Moderately agree
Slightly agree
Slightly disagree
Moderately disagree
Strongly disagree
1. Communities need to work with experts and public servants to make good decisions about
what services they need
2. I want government to involve me in making decisions about what services are delivered in my
local area
3. Governments and communities should make decisions together about how services are
delivered
4. Government should only provide services where the private sector doesn’t
5. The market should decide what services are delivered based on levels of demand
6. The private sector delivers the best value services
7. There is a role for government in providing any of the services the community needs
8. There are some things like health care and education that governments should deliver
9. My taxes should only pay for basic services
10. I am prepared to pay more taxes to get a broader range of public services
11. The people who work in government have enough knowledge to decide what services are
needed in my area
12. Service providers have the best knowledge about how services should be delivered
13. People who are using a particular service will know best how much of that service is needed
14. Communities know enough to make good decisions about what services they need
15. Decisions about how services are delivered in my area should be made primarily on value for
money
16. I want governments to deliver services that contribute to a healthier and fairer society
17. The government of my local area has enough ability to deliver services by itself
18. There are some services that governments can provide at a higher quality than the private
sector
19. Government should be advocating for the needs of my local community

WORKS CITED 154
20. Government should focus on providing only basic services
21. Governments should use a mixture of public, private and not-for-profit organisations to
deliver public services in my area
22. There are times when government exceeds my expectations
23. Governments should to work with each other and other service providers to provide local
services
24. Government delivers the best quality services
25. It is acceptable for services in one area to be delivered differently to services in another area
Q.4 How important is each of the following in your life Not at all important; slightly important; moderately important; very important, extremely important
a. Family b. Friends c. Leisure time d. Politics e. Work f. Religion g. Study
Q.5 What political party do you normally vote for, or most identify with? [don’t read out list?]
a) Liberal
b) National
c) Labor
d) Greens
e) Other (please specify)
f) None - change from election to election
Q.6 Some people feel they have completely free choice and control over their lives, while other people
feel that what they do has no real effect on what happens to them. On a scale of 1 to 10, where 1
means “no choice at all” and 10 means “a great deal of choice”, how much freedom of choice and
control do you have over the way your life turns out?
Q.7. Thinking about the local area in which you live, do you agree or disagree with the following
statements?
Strongly agree
Moderately agree
Slightly agree
Slightly disagree
Moderately disagree
Strongly disagree
1. There is something about the landscape around me that makes me feel good
2. It reflects the type of person I am
3. The area in which I live has the qualities I value
4. I feel part of the history of the place
5. I feel at home there
6. The area in which I live is full of important memories and stories

WORKS CITED 155
7. I feel connected locally to friends and neighbours
8. Living there makes me feel good about myself
9. I feel a cultural connection to the area
Q.8 Thinking about the local area in which you live, how important are each of the following to you?
Not at all important; slightly important; moderately important; very important, extremely important
1. Recreational areas such as parks, walking tracks, open spaces
2. Availability of appropriate public services
3. Availability of good schools
4. Availability of healthcare
5. A supportive and cohesive community
6. Job opportunities
7. A positive economic outlook
8. Availability of good home or aged care
9. Convenient public transport
10. Good quality roads and bridges
11. Being able to afford appropriate housing
12. Levels of water, air and noise pollution
13. Shops located close-by that are suitable to my needs
14. A safe environment
15. Being close to my family
Q.9 Thinking about the local area in which you are currently living, are you satisfied or dissatisfied
with the provision of each of the following?
Strongly satisfied
Moderately satisfied
Slightly satisfied
Slightly dissatisfied
Moderately dissatisfied
Strongly dissatisfied
1. Recreational areas such as parks, walking tracks, open spaces
2. Availability of appropriate public services
3. Availability of good schools
4. Availability of healthcare
5. A supportive and cohesive community
6. Job opportunities
7. A positive economic outlook
8. Availability of good home or aged care
9. Convenient public transport
10. Good quality roads and bridges

WORKS CITED 156
11. Being able to afford appropriate housing
12. Levels of water, air and noise pollution
13. Shops located close-by that are suitable to my needs
14. A safe environment
15. Being close to family
Q.10 Thinking about where you live, which level of government is best able to make decisions about your local area
a. Local government b. State government c. Federal government
Q.11 What is the name of your local council/shire?
a. Correct b. Not completely wrong c. Wrong d. DK
Q.12 What is the name of the Mayor/President of your local Council/Shire? Open
a) Correct b) Not completely wrong – good attempt, recognisable but not actually correct c) Wrong d) DK e) Abuse?
Q13. I’m going to read out a list of different things that local governments can do. How important it is to you that local government does each of these things.
Not at all important; slightly important; moderately important; very important, extremely important
a. Water, sewage, stormwater, drainage b. Roads and bridges c. Parks d. Footpaths e. Cycleways f. Land use planning and development applications g. Street cleaning and waste management h. Health and environmental management i. Child Care j. Aged Care k. Emergency and disaster management l. Libraries m. Sporting and recreation facilities n. Arts and culture o. Economic development p. Youth services q. Community development r. Planning for the future s. Promoting the benefits of the local area
Q14. Thinking about the previous question, are there any things that your local area doesn’t currently have, that you would like? Open
Q15. Imagine that your local government is to be merged or amalgamated with another to form a new local government area. For each of the following, tell me if the amalgamation would make each of the following things much better, better, no different, worse or much worse?
a) How my interests are represented by councillors b) My feeling of belonging to the local area c) The way services are delivered d) The cost to me for local services

WORKS CITED 157
e) The cost of council rates f) My sense of local community
Q7a. Are you male or female?
a. Male b. Female
Q16. In what year were you born? Open
Q17. Do you speak a language other than English at home?
a. No, English only b. Yes, Which? (Specify)
Q18. What is the highest level of educational qualification you have completed?
a. School education level b. Certificate level c. Diploma and Advanced Diploma level d. Bachelor degree level e. Graduate Certificate and Graduate Diploma level f. Postgraduate Degree level
Q19. What is the total combined income of everyone in your household, before tax and other deductions? Please include income from all sources including wages, investments and government pensions and benefits.
a. Less than $10,000 b. $10,000 to $19,999 c. $20,000 to $29,999 d. $30,000 to $39,999 e. $40,000 to $49,999 f. $50,000 to $59,999 g. $60,000 to $69,999 h. $70,000 to $79,999 i. $80,000 to $89,999 j. $90,000 to $99,999 k. $100,000 to $149,999 l. $150,000 to $199,000 m. $200,000 to $299,000 n. $300,000 or more o. Refuse
Q20. Are you currently...?
a. Employed for wages b. Self-employed c. Out of work and looking for work d. Out of work but not currently looking for work e. A homemaker f. A student g. Retired h. Unable to work
If answered a,b,c above (working)
Q21. Are you currently working for the government, a public institution or a non-profit organisation?
a. Yes
b. No Q22. Is the dwelling in which you live
a. Mortgaged or owned outright b. Being rented c. Other
Q23. Is the dwelling in which you live a
a. Separate house b. Semi-detached, row or terrace house, townhouse etc c. Flat, unit or apartment (3 stories or less)

WORKS CITED 158
d. Flat, unit or apartment (4 stories or more) e. Other dwelling
Q24. What best describes the household in which you live
a. Couple with no children b. Couple with children c. One parent family d. Other type of family household e. Lone person household f. Group household (non-family)
Q25. How long have you lived in your local area
a. Less than 2 years b. More than 2 and less than 5 years c. More than 5 and less than 10 years d. More than 10 years
The respondent’s LGA was noted (from list meta-data) and coded to the following council classifications
1. Urban Capital City 2. Urban Development Small/Medium 3. Urban Development Large/Very Large 4. Urban Regional 5. Urban Fringe 6. Rural

WORKS CITED 159
Appendix B Table of evidence based on the
literature review

WORKS CITED 160
Research literature summarised in the table below is categorised according to whether it reports on
Australian studies (7 studies), international studies (5 studies), or studies focusing on specific aspects
of local council activity, rather than local governments themselves (2 studies).
Table 2: Table of evidence – studies which focus on exploring citizen attitudes towards local
government
Author(s) and
location
Objective(s) Methodology Key Findings Implications
Australian studies
Elton Consulting
(2010)
Australia
To review recent
community
surveys and
polling on the
role, expectations
and performance
of local
government in
Australia.
The study was
undertaken in
order to provide
advice to the
Independent Local
Government
Review Panel in
NSW.
Review of recent
surveys and
polling conducted
on local
government in
Australia. The key
questions in the
Panel’s terms of
reference are:
- What are the
community’s
views on local
councils’ abilities
to support current
and future needs
of the local
community?
- Do local
councils deliver
services and
infrastructure
efficiently and
effectively and in
a timely manner?
- In what
circumstances
would the
community be
prepared to pay
more for a higher
level of service?
- How important
is local
representation
Many local
governments in
NSW conduct
surveys of
residents. These
focus for the most
part on
community
satisfaction with
the services and
facilities provided
by the local
government.
In Queensland,
Tasmania and
Victoria, statewide
surveys on
services, facilities
and other issues
relating to
councils are
carried out on a
regular basis by
state governments
or local
government
associations.
In addition to
regular surveys,
specific polls
relating to council
services and other
issues have been
carried out,
particularly in
Drawing on all the
surveys and polls
reviewed for the
study, the
researchers put
forward the
following common
themes that are
investigated in
local government
surveys:
- service and
infrastructure
delivery e.g.
waste, roads,
libraries
- perceptions of
financial
sustainability
- local
representation
and decision
making
- boundary
changes.
There are gaps in
the available data
relating to: the
importance of
development
assessment and
planning;
councils’ abilities

WORKS CITED 161
Author(s) and
location
Objective(s) Methodology Key Findings Implications
and community
input into
decision making
by local councils
for the services
they provide?
- What are the
community’s
views of local
council boundary
changes?
South Australia. to support the
future needs of
communities;
perceived ability
of local councils
to deliver services
and infrastructure
efficiently and
timeously;
perceived ability
of councils to
deliver more
locally specific
services and
infrastructure;
willingness of
communities to
pay more for
higher levels of
service; the
importance of
local
representation to
communities; and
gaining a clearer
understanding of
views relating to
boundary
changes.
JWS Research
(2012)
Victoria
The study,
conducted every
year, is auspiced
by the Victorian
Department of
Community
Planning and
Development.
To assess the
performance of
Victorian local
councils across a
range of measures
and to seek
insight into ways
to provide
improved or more
effective service
delivery.
For the 2012
study, significant
changes were
Survey using
computer assisted
telephone
interviewing
(CATI) of a
random
probability sample
of residents aged
18 and over.
N=29,384
An Index Score
(out of 100) is
calculated.
Across Victoria,
61% of residents
have had contact
with their local
government in the
last 12 months.
The Overall
Performance
Index Score was
calculated as
60/100. The Inner
Metropolitan
group achieved
the highest rating
The majority of
residents state
that there is room
for improvement
for their council.
Rate rises versus
service cuts
results indicate
that ratepayers
expect councils to
live within their
current means.
Since local
governments

WORKS CITED 162
Author(s) and
location
Objective(s) Methodology Key Findings Implications
made to the
methodology and
content of the
survey, making
comparisons with
prior studies
difficult. The 2012
study can thus be
considered a
benchmark.
Councils were
categorised as:
- inner
metropolitan
- outer
metropolitan
- rural cities and
regional centres
- large rural
shires
- small rural
shires
of 66, while the
Large Rural Shires
group rated the
lowest, at 56. On
Overall
Performance, 18-
34 year olds
(rating 65),
women aged 18-
49 (62), women
generally (61) and
65+ year olds all
rated above
average.
Other core
performance
measures were:
- 71/100 for
Customer Service
- 57/100 for
Community
Consultation and
Engagement
- 55/100 for
Advocacy
- 52/100 for
Overall Council
Direction.
Council Direction
was a particular
issue of concern
for many
respondents. The
Large and Small
Rural Shires
groups rated the
lowest (48 and 50
respectively),while
the Outer and
Inner Metropolitan
groups rated
score lower on
their Overall
Performance
ratings on
measures relating
to Community
Consultation and
Engagement,
Advocacy and
Council Direction,
these are
indicative areas
for improvement.

WORKS CITED 163
Author(s) and
location
Objective(s) Methodology Key Findings Implications
above average (55
and 54
respectively).
Local Government
Association of
Queensland
(LGAQ) (2011)
Queensland
To explore
community
satisfaction with
local government
services in
Queensland.
The LGAQ has
been conducting
this study
periodically since
1997.
Telephone surveys
of a random
cross-section of
700 households.
The methodology
looks at the
importance of a
function or service
to the community
(on a 5-point
scale) and the
perception of how
well council is
performing in
each (also on a 5-
point scale). This
enables scores
between 1 and 5
to be calculated
for participants’
ratings of the
importance of,
and council’s
performance in,
each parameter. It
also enables a
calculation to be
made of the ‘gap’
between the two.
The parameters
evaluated were:
- basic services
and infrastructure
- community
lifestyle services
- managing the
shire/city
The results for
2011 reveal that
there has been a
marginal increase
in the perceived
importance of
each theme or
parameter since
2009.
Performance
scores show a
drop in
satisfaction since
2005, 2007 and
2009.
Basic services – no
services rated
below the
‘important’ score
of 4 (mean of
4.49). Overall
performance was
rated as ‘fair’
(mean of 3.28)
and no element
achieved a rating
above 4. The gap
between
importance and
performance for
Road Maintenance
is 1.77 (1.29 in
2009), the highest
recorded for any
element across all
themes and
surveys.
Community
lifestyle – the
mean score was
The methodology
provides a model
for measuring
community
perceptions of the
importance of a
local government
function and how
well a council is
performing each
function. Since
surveys occur
periodically,
comparisons are
possible over
time.
Infrastructure
services are seen
by citizens as
extremely
important, but the
perceived
performance of
these services
declined in the
2011 survey.
The manner in
which local
governments
engage with their
communities
continues to
receive a relatively
low score, but the
gap between
perceived
importance and
perceived
performance has
increased in

WORKS CITED 164
Author(s) and
location
Objective(s) Methodology Key Findings Implications
- customer
service and
communication
- qualities of
council
(councillors,
managers,
outdoor workers,
indoor staff)
4.14, with
Community Safety
highest in
importance (4.41).
Performance was
rated as ‘fair’
(mean of 3.44).
Managing the
Shire/City – the
mean score for
the items was
4.37, with
Financial
Management
(4.63) and Town
Planning (4.53)
the highest.
Overall
performance was
‘fair’ (mean of
3.10). Financial
Management had
a gap of 1.57.
Customer service
– ranked as
important (mean
of 4.37). Overall
performance was
ranked at a mean
of 3.19, down
from 3.55 in
2005. The gap
was highest for
Responding to the
Community (1.66)
and Consulting
the Community
(1.64).
Qualities of
council – the
Quality of Elected
Council was
highest in
successive
surveys.
A significant drop
has been
measured in
public satisfaction
with Financial
Management and
Revenue-raising,
which is an issue
of concern.
With 35% of
respondents from
amalgamated
councils saying
their council is
performing worse
than before, there
is a need to build
bridges with
people in affected
communities who
opposed the
changes.

WORKS CITED 165
Author(s) and
location
Objective(s) Methodology Key Findings Implications
importance (4.57),
and this
parameter also
received the
lowest
performance
rating (3.15),
producing a gap
of 1.43, higher
than 1.16 in
2009.
Crime and
Misconduct
Commission,
Queensland
(2011)
Queensland
This is a periodic
survey (the Public
Attitudes Survey)
which has been
conducted by the
Crime and
Misconduct
Commission since
1991
To draw on the
Public Attitudes
Survey to
summarise
community
responses to local
governments and
to identify trends
over time.
The focus of the
analysis was:
- experiences
with local
government
employees
- general
perceptions of
local government
employees,
including
behaviour,
integrity and
misconduct
- public opinion
on, and
confidence in,
complaints
processes.
Survey based on a
representative
sample of the
Queensland
public.
N=1,529 (29%
response rate,
lower than in
previous years).
For the purposes
of the study,
Queensland was
divided into five
regions, with the
breakdown of
respondents as
follows:
Brisbane – 33%
South-east – 17%
South-west – 17%
Central – 17%
North – 17%
41% of
respondents
reported some
contact with a
local government
employee at some
stage in their life.
Perceptions of
local government
employees are
generally positive,
and this is
consistent with
previous surveys.
87% of
respondents
believe that
employees
‘behave well’ and
84% believe that
employees are
honest.
Almost two-thirds
of respondents
who made a
complaint (62%)
were dissatisfied
with how it was
handled, which is
an increase from
the 2008 survey.
Respondents are
Australians
generally expect
that encounters
with government
employees will be
accessible,
efficient and
effective. The
nature of an
employee’s
interactions with
the public is
clearly important
in shaping public
perceptions of
local government
employees.
Public perceptions
of complaints-
processing
systems could be
improved by
informing the
public about the
internal
mechanisms that
local governments
have in place to
prevent, detect
and investigate
misconduct; and
by amending their

WORKS CITED 166
Author(s) and
location
Objective(s) Methodology Key Findings Implications
more likely to
report
dissatisfaction
with a local
government
employee as a
result of
unfriendly, rude
or arrogant
manner, or
employee’s lack of
concern, care or
interest.
Most respondents
(86%) believed
there will always
be some
corruption in local
government, and
half the
respondents (49%)
believed that not
enough is being
done about
corruption in local
government.
Consistent with
previous surveys,
two-thirds of
respondents (64%)
disagreed with the
statement ‘There
is no point
reporting
corruption in local
government
because nothing
useful will be
done about it.’
complaints-
processing
systems and
protocols.
Myriad Research
(2011)
To obtain a valid
measure of citizen
satisfaction for a
range of core
Telephone survey
with a
representative
sample of
Satisfaction with
councils’ overall
performance (49%)
is markedly lower
Based on the
responses to this
survey,
Tasmanians
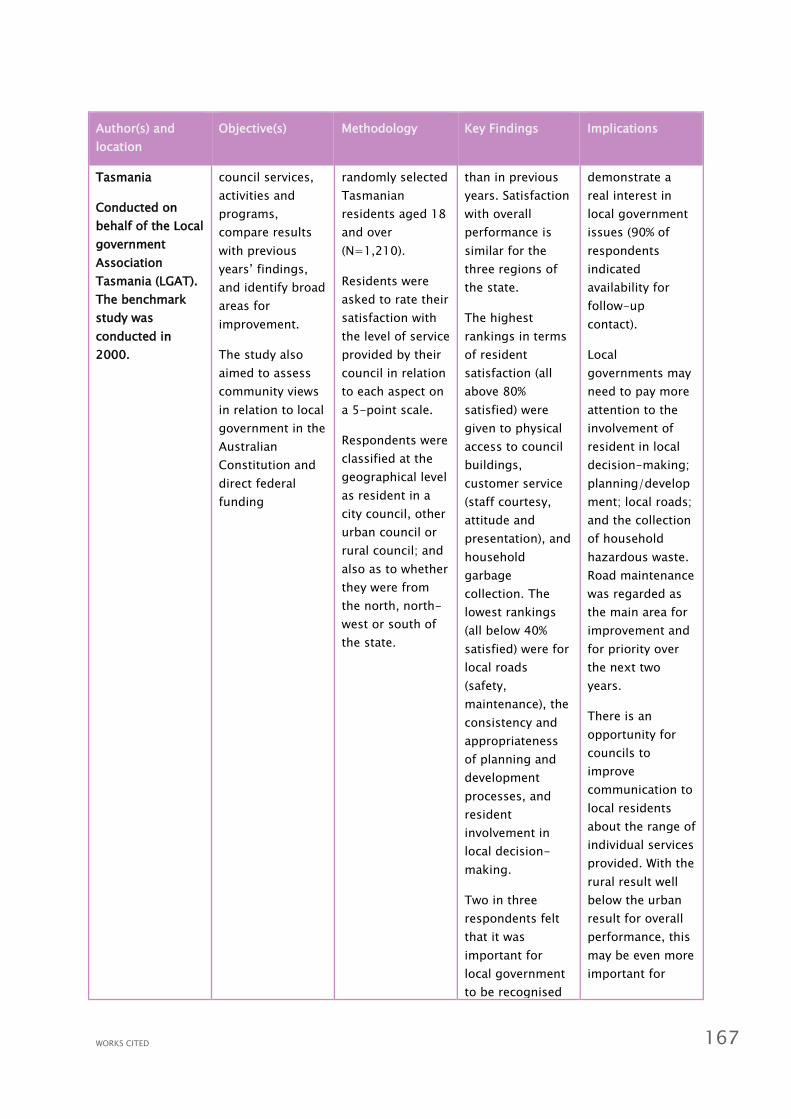
WORKS CITED 167
Author(s) and
location
Objective(s) Methodology Key Findings Implications
Tasmania
Conducted on
behalf of the Local
government
Association
Tasmania (LGAT).
The benchmark
study was
conducted in
2000.
council services,
activities and
programs,
compare results
with previous
years’ findings,
and identify broad
areas for
improvement.
The study also
aimed to assess
community views
in relation to local
government in the
Australian
Constitution and
direct federal
funding
randomly selected
Tasmanian
residents aged 18
and over
(N=1,210).
Residents were
asked to rate their
satisfaction with
the level of service
provided by their
council in relation
to each aspect on
a 5-point scale.
Respondents were
classified at the
geographical level
as resident in a
city council, other
urban council or
rural council; and
also as to whether
they were from
the north, north-
west or south of
the state.
than in previous
years. Satisfaction
with overall
performance is
similar for the
three regions of
the state.
The highest
rankings in terms
of resident
satisfaction (all
above 80%
satisfied) were
given to physical
access to council
buildings,
customer service
(staff courtesy,
attitude and
presentation), and
household
garbage
collection. The
lowest rankings
(all below 40%
satisfied) were for
local roads
(safety,
maintenance), the
consistency and
appropriateness
of planning and
development
processes, and
resident
involvement in
local decision-
making.
Two in three
respondents felt
that it was
important for
local government
to be recognised
demonstrate a
real interest in
local government
issues (90% of
respondents
indicated
availability for
follow-up
contact).
Local
governments may
need to pay more
attention to the
involvement of
resident in local
decision-making;
planning/develop
ment; local roads;
and the collection
of household
hazardous waste.
Road maintenance
was regarded as
the main area for
improvement and
for priority over
the next two
years.
There is an
opportunity for
councils to
improve
communication to
local residents
about the range of
individual services
provided. With the
rural result well
below the urban
result for overall
performance, this
may be even more
important for

WORKS CITED 168
Author(s) and
location
Objective(s) Methodology Key Findings Implications
in the Australian
Constitution.
Close to 80% of
respondents
thought that it
was important
that the federal
government
should be able to
directly fund local
government.
rural councils.
Gray and Brown
(2008)
Australia
To explore the
relationship
between public
perceptions of
regions,
governance and
the federal system
in Australia
A national
telephone survey
was carried out
(N=1,201) based
on a stratified
random sample
process which
involved a quota
being set for each
capital city and
non-capital city
area.
The survey was
carried out by
Newspoll during
May 2008.
The interview
schedule was
designed
following focus
groups held in
three locations in
NSW.
Respondents’
‘sense of
belonging’ to their
local areas was
83.6%, less than
that toward their
state/territory
(89.1%) or to
Australia as a
nation (94.6%).
The majority of
respondents
believed that
democracy works
very well (27.7%)
or quite well
(53.1%) in
Australia. There
was less support
for the
proposition that
the federal system
of government
works well in
Australia, with
23.7% saying it
did not work very
well and 6.5%
saying it did not
work well at all.
Satisfaction with
Although focused
in large part of
respondents’
views on regional
governance, this
study some
provides evidence
that perceptions
of Australians
towards local
government are
less favourable
then either the
state/territory or
national tiers of
the federation.
Over half of the
respondents
perceive
themselves as
living in a region
and a sense of
belonging to a
region is just as
strong as their
sense of
belonging to
locality.

WORKS CITED 169
Author(s) and
location
Objective(s) Methodology Key Findings Implications
each level of
government was
measured – more
respondents
(35.3%) rated the
local level as
being the least
effective in doing
its job.
Almost half of the
respondent would
like to keep a
three-tier system
of government,
and 12% would
like a four-tiered
system, with
regional
governments as
well as state and
local
governments.
McGregor Tan
Research (2006)
South Australia
To investigate
beliefs regarding
the role of local
services and local
governments
The study was
undertaken as
part of the
McGregor Tan
Omnibus Survey
Five questions
were asked of
residents aged 18
and over in South
Australia
N=403
Participants rated
on a 5-point scale
(5 is strongly
agree and 1 is
strongly disagree)
their level of
agreement with a
number of
67% of survey
respondents
believed that their
local councils
should have a
greater say in how
state and federal
governments’
public services
and activities,
such as public
transport, health,
community
services and
education are
planned and
coordinated. This
result was in line
with the 2003
survey (66%).
There was a very
The findings show
that more than
half of the
respondents
believed that their
local councils
were the best
placed tier of
government to
provide a number
of services,
including libraries,
home care
services for the
elderly, the
monitoring and
policing of
pollution, crime
prevention or
neighbourhood
watch and

WORKS CITED 170
Author(s) and
location
Objective(s) Methodology Key Findings Implications
statements
relating to
revenue and the
provision of
services.
high level of
agreement
(average rating of
4.2 out of 5) that
state and federal
governments
should share
more of their
revenue with local
councils.
Two thirds (65%)
of respondents
were unable to
name any council
services that
would be better
provided by state
or federal
governments.
childcare services.
International studies
Ipsos Social
Research Institute
(2010)
International
To provide a
snapshot of the
relationship
between attitudes
towards local
(municipal)
government and
key social
outcomes across
the world.
The study,
drawing upon
data from the
Ipsos Global
Advisor Survey,
looked at how
satisfied people
are with their local
area and their
local government,
what drives this
satisfaction, and
The methodology
is described as
‘municipal
research’, which is
a way of
understanding
citizens’ attitudes
towards their local
area, and
ultimately a
contribution
towards
improving their
quality of life.
The survey was
conducted online
in 22 countries,
including
Australia.
Satisfaction with
‘local areas as a
place to live’ and
with local
government are
closely related i.e.
countries whose
people have high
satisfaction with
their area tend to
also have higher
satisfaction with
their local
government.
Establishing cause
and effect is not
possible.
Together with the
Netherlands and
Canada,
Australian
respondents
The overall
message from the
research is that
local authorities
need to ask
citizens what they
want, and then tell
them what they
are doing to
achieve it. Core
aspects of public
services, such as
crime reduction,
affordable
housing, health
care, clean streets
and public
transport are all
important in
making
somewhere a
good place to live.

WORKS CITED 171
Author(s) and
location
Objective(s) Methodology Key Findings Implications
what local
services can do
about it.
N= 22,000
Questions
included:
- Overall, how
satisfied are you
with your local
area as a place in
which to live?
- Taking
everything into
account, how
satisfied are you
with the way your
local council runs
things?
- What are the
things that are
important in
making a place a
good place to live?
- What are the
things that most
need improving in
your community?
showed the
highest level of
satisfaction with
both their local
areas and their
local
governments.
Perceptions of
quality of life are
related to
contextual factors
that are not
always in the
direct control of
local government
and services.
These include:
- Within the total
sample, there is
little correlation
between feeling
able to influence
decisions and
satisfaction with
local government,
although Australia
shows a
correlation in this
respect.
- Satisfaction with
local government
rises as
perceptions of
corruption fall.
- Residents in
countries where
there is a high
level of perceived
community
cohesion,
including
On the basis of
the study, the
researchers put
forward a ‘model
of municipal
government
reputation’. The
model draws
together drivers
that service
leaders can
control, such as
the value for
money that a local
authority offers,
and those that
they cannot, such
as levels of
deprivation or
diversity within
the area they
serve.
Understanding
what drives
satisfaction with
local government
can be
categorised into
six dimensions:
- overall service
quality
- direct
communication
and engagement
- perceived value
for money and/or
absence of
corruption
- clean, safe and
strong
communities,
which crate a

WORKS CITED 172
Author(s) and
location
Objective(s) Methodology Key Findings Implications
Australia, are
more likely to be
satisfied with their
local area.
The top priorities
for local
improvement for
the Australian
respondents were
level of crime
(36%); road and
pavement repairs
(35%); and job
prospects (33%).
sense of
‘liveability’
- media coverage
- background
factors such as
affluence and
diversity.
James (2010)
United Kingdom
(UK)
To evaluate the
effects of
information cues
about local
government
performance on
citizens’
perceptions and
attitudes towards
local government
A field experiment
and two
laboratory
experiments
(which could be
classified as
randomised
controlled trials)
were conducted in
Exeter, UK.
Citizens were
randomly
allocated to
groups that were
given different
cues about local
government
performance i.e.
information cues
about the overall
relatively good or
bad performance
of an English local
government unit
relative to other
local governments
in England.
Participants were
An information
cue about
relatively good
performance
raises citizens’
assessment of
performance.
Information about
relatively bad
performance
lowers perceived
performance.
Information about
relatively good
performance
raises satisfaction
and information
about relatively
bad performance
lowers
satisfaction.
There was
insufficient
evidence for the
effects of
information cues
on citizens’
intentions to vote
for the local
Information about
the relative
performance of
local government
matters to
citizens. If
contributes to
them shifting their
views about
performance and
influencing their
satisfaction with
local government
services.
Giving citizens a
simple summary
information cue is
a low cost way of
improving their
knowledge and
helping to inform
their attitudes.
Future research
could assess the
effects of different
forms of
performance
information in

WORKS CITED 173
Author(s) and
location
Objective(s) Methodology Key Findings Implications
then asked how
they judged the
performance of
the local
government
compared with
other local
governments of
the same type.
incumbent, and
thus direct effects
on citizens’
intention to vote
for the local
incumbent were
not evident.
Instead, the
results suggested
that the cue about
‘good
performance’ is
more influential
on the
perceptions and
satisfaction of
citizens who
already supported
the incumbent.
different service
contexts coming
from different
information
sources.
Piotrowski & van
Ryzin (2008)
United States of
America (USA)
To investigate
citizens’ demands
for transparency
at the local level.
The study
questions were:
- How can we
measure citizens’
desire for
transparency and
what are the
dimensions to
such a demand?
- What personal
and contextual
factors are
correlated with
variation in the
level of demand
for governmental
transparency?
Online survey
conducted in
2005; participants
were members of
an online research
resource created
to provide a
general
population of
volunteers to
participate in
surveys about
local community
issues and
government
performance (thus
not a random
population
sample)
N = 1,819
Transparency was
analysed
Fiscal
transparency – the
more confidence
individuals have in
their local
officials, the lower
their demand for
fiscal
transparency.
Health and safety
– being female
was the strongest
determinant of
the desire for
health and safety
information.
Demand for
transparency
based on principle
is motivated
largely by general
concerns or
Citizens’ desires
for transparency
at the local level
can be measured
and analysed on
the basis of the
following
dimensions:
- demand for
fiscal
transparency
- health and
safety information
- principled
transparency
(disclosing
information and
operating in the
open)
- transparency
around

WORKS CITED 174
Author(s) and
location
Objective(s) Methodology Key Findings Implications
according to four
levels:
- demand for
fiscal
transparency
- health and
safety information
- principled
transparency
- good
governance.
suspicions about
the current
practices of
government with
respect to
disclosing
information and
operating in the
open, and none of
the demographic
variables proved
to be statistically
significant.
Good governance
- age, a college
education, and
political
engagement are
all positively
related to demand
for good
government
transparency.
governance.
A range of
personal and
contextual factors
are correlated
with measured
variations in
demands for
transparency,
including age,
gender, level of
education, access
to government,
confidence in
local officials,
political ideology
and political
engagement.
Glaser & Denhardt
(2000)
USA
To assess local
government
performance
through the eyes
of citizens.
The key aim was
to better
understand what
drives citizen
perceptions of
local government
performance.
Mailed survey to
registered voters
of a county in
Florida.
N= 1,800 (25%
response rate)
The analysis used
a stepwise
multiple
regression model
to produce a
series of
prioritised list of
predictors of local
government
performance. This
technique loads
independent
variables into the
The survey made
a distinction
between
‘controllables’,
described as the
variables that can
be affected by
local government
itself (such as
information flow)
and ‘non-
controllables’,
that is the trends
and events which
are beyond the
control of local
government (such
as broad social
and economic
concerns).
In general, the
nature of public
products makes
citizen
assessments
difficult, and
government
performance is
value-laden.
Citizens who have
negative views of
federal or state
government may
characterise local
government
similarly.
The most
important element
in defining citizen
perception of local

WORKS CITED 175
Author(s) and
location
Objective(s) Methodology Key Findings Implications
model based on
the magnitude of
their contributions
to explaining
variation in the
dependent
variable (how
citizens feel about
the performance
of local
government).
Responsiveness
(interest in what
citizens have to
say and honouring
citizen values) was
found to be the
most important
contributor to
citizen
perceptions. This
is a ‘controllable’
variable i.e.
subject to the
control of local
government.
With the
exception of
responsiveness,
the most
important drivers
of citizen
perceptions of
local government
are not easily
controlled by
government,
namely quality of
life, economic
conditions, race
relations and
expected
economic
improvement of
the area.
Other
‘controllable’
items, such as the
extent to which
citizens believe
media accurately
present issues
involving council
and the frequency
of contacting
government
performance is
responsiveness,
classified as a
‘controllable’
item. This
suggests that in
order to
effectively
improve the
relationship with
citizens, local
government must
honour citizen
values by
demonstrating
that it listens to
them and acts on
what it hears.
Many of the
conditions that
help to explain
citizen
perceptions of
local government
performance
cannot be easily
manipulated by
local government,
yet citizens may
be prepared to
hold local
government
responsible for
quality of life
issues, including
economic and
social concerns.
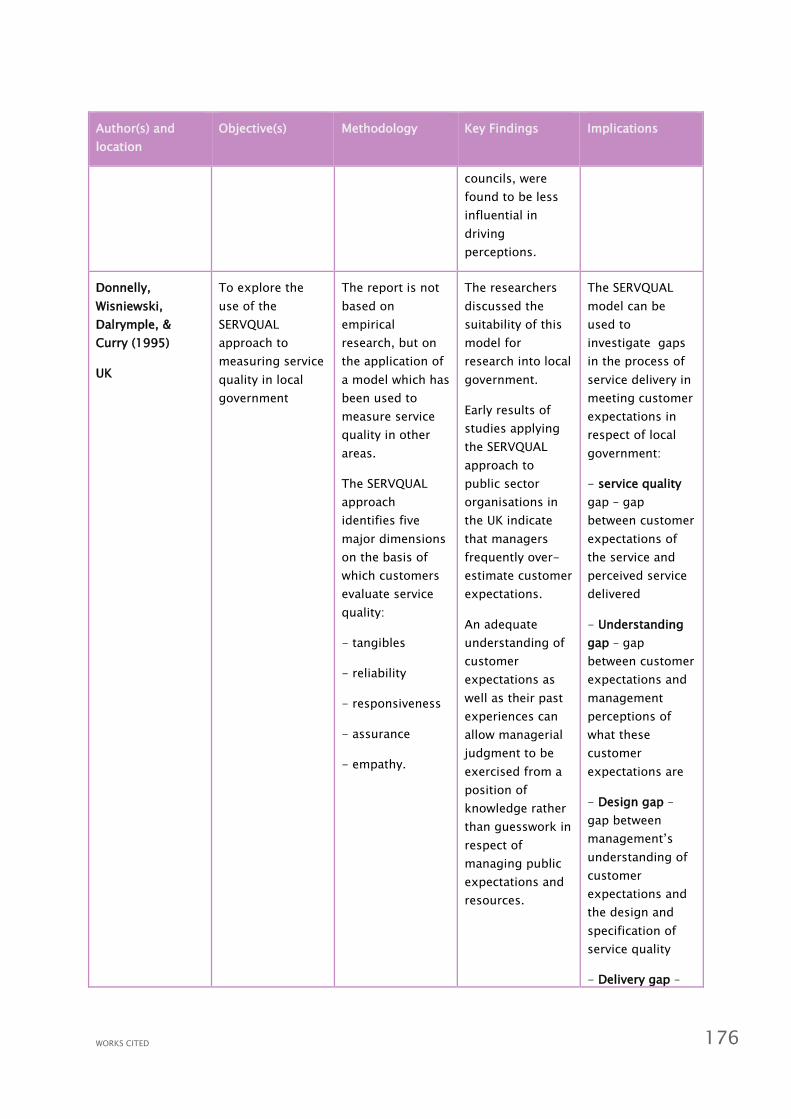
WORKS CITED 176
Author(s) and
location
Objective(s) Methodology Key Findings Implications
councils, were
found to be less
influential in
driving
perceptions.
Donnelly,
Wisniewski,
Dalrymple, &
Curry (1995)
UK
To explore the
use of the
SERVQUAL
approach to
measuring service
quality in local
government
The report is not
based on
empirical
research, but on
the application of
a model which has
been used to
measure service
quality in other
areas.
The SERVQUAL
approach
identifies five
major dimensions
on the basis of
which customers
evaluate service
quality:
- tangibles
- reliability
- responsiveness
- assurance
- empathy.
The researchers
discussed the
suitability of this
model for
research into local
government.
Early results of
studies applying
the SERVQUAL
approach to
public sector
organisations in
the UK indicate
that managers
frequently over-
estimate customer
expectations.
An adequate
understanding of
customer
expectations as
well as their past
experiences can
allow managerial
judgment to be
exercised from a
position of
knowledge rather
than guesswork in
respect of
managing public
expectations and
resources.
The SERVQUAL
model can be
used to
investigate gaps
in the process of
service delivery in
meeting customer
expectations in
respect of local
government:
- service quality
gap – gap
between customer
expectations of
the service and
perceived service
delivered
- Understanding
gap – gap
between customer
expectations and
management
perceptions of
what these
customer
expectations are
- Design gap –
gap between
management’s
understanding of
customer
expectations and
the design and
specification of
service quality
- Delivery gap –

WORKS CITED 177
Author(s) and
location
Objective(s) Methodology Key Findings Implications
gap between
specification of
service quality and
actual quality of
service delivered
-
Communications
gap – gap
between what is
actually delivered
and what has
been promised in
terms of external
communications
such as media and
customer
contracts.
Studies focusing on specific aspects of local government functions
Maclennan, Kypri,
Langley & Room
(2012)
New Zealand
Within the context
of New Zealand’s
Local Government
Act 2002, which
states the purpose
of local
government as
facilitating public
decision-making
and promoting
community
wellbeing, the
study aimed to
describe public
sentiment towards
alcohol and local
government
alcohol policies
Cross-sectional
survey of
residents aged 18
years and over in
a diverse set of
New Zealand
communities (3
rural towns, 3
provincial centres
and 2 major
metropolitan
areas).
N=1,372 (59%
response rate)
Use was made of a
self-administered
written
questionnaire.
In six of the seven
communities, the
alcohol-related
issue considered
to be the biggest
problem was
youth drinking,
followed by
vandalism,
dangerous driving
and family
violence. The
majority of
respondents in
each area agreed
that their local
government had a
major role to play
in ensuring the
health and
wellbeing of the
community and in
promoting healthy
lifestyles amongst
Many residents in
the areas
surveyed believe
that alcohol plays
a major role in a
range of problems
in their
communities and
are not supportive
of the prevailing
liberal alcohol
policies in New
Zealand.
Local
governments
would be acting in
accordance with
public opinion if
they adopted
strategies shown
to be effective in
reducing alcohol-
related harm,
such as

WORKS CITED 178
Author(s) and
location
Objective(s) Methodology Key Findings Implications
citizens.
Support for local
governments to
restrict the
number of alcohol
outlets in the
community was
moderate (range:
27–49%). Controls
receiving the most
support were
limiting the
operating hours of
on-licence
premises, the use
of liquor bans to
control drinking in
public places, and
stricter
enforcement of
liquor laws by
licencing staff and
police.
controlling outlet
numbers and
density. This
would be aided by
more enabling
central
government
legislation,
because currently
by-laws are open
to judicial
challenge and
could be enforced
only by
prosecution or
seeking an
injunction.
Orr & West (2007)
USA
To examine
whether public
assessments
about local police
are linked more to
people’s direct
experience with
crime and the
police or whether
such impressions
are associated
with more
abstract attitudes
about politics and
law enforcement
Telephone survey
of residents of
Providence, Rhode
Island aged 18
and older
N=509
Statistical tests
were carried out
to test the
relationship
amongst
variables.
Symbolic attitudes
were measured by
indicators
designed to
measure broad
and abstract
Three factors were
significantly
linked to police
performance
ratings – age
(older people
more positive);
victims were more
likely than non-
victims to rate
performance
negatively; and
individuals who
held that the job
of police was
conflict resolution
as opposed to law
enforcement
(more negative
ratings).
Policing is not a
local government
function in
Australia, but this
study provides
evidence that
personal
experience
matters when it
comes to
concrete, salient
and personal
issues at the local
level. Local
government is the
level of the public
sector closest to
the people and
individuals at that
level are the ones

WORKS CITED 179
Author(s) and
location
Objective(s) Methodology Key Findings Implications
conceptions of
belief systems:
- political party
identification
- political
ideology
- views on the
strictness of
police
- preferred role
orientation for
police officers
(law enforcement
or conflict
resolution).
Personal
experience
mattered more
than symbolic
attitudes when it
came to views
about police
courtesy and
fairness. The
more personal
experience
individuals had
with crime, the
more likely they
were to say the
police were not
courteous or fair,
and none of the
symbolic attitudes
affected their
assessments of
fairness and
courtesy.
Both personal
experience and
symbolic attitudes
were important in
regard to opinions
about the
seriousness of
crime and
assessments of
overall police
performance.
most likely to let
their personal
experiences affect
their view of
government.
At the local level,
there is less room
for ideological
game playing or
public relations
strategies
involving general
feelings about
government.
Officials will be
held accountable
based on how
they deliver
services to
residents. This
should be a
pleasing result for
democratic
governance –
public officials
control the fate of
the public opinion
held towards
them on the basis
of the manner in
which they
provide citizens
with good
services.

WORKS CITED 180
Appendix C Methodology
The survey involved 2,006 computer aided telephone interviews with people aged 18 years and over
from all states and territories of Australia (with the exception of the Australian Capital Territory which
does not have a local government structure).
A gender quota was established in proportion to the Australian population. Age quotas were set to
match the Australian population within six groups 18-29; 30-39; 40-49; 50-59; 60-69; and 70 and
over). Additionally, quotas for the type of local government in which each respondent resides were set
in order to allow for meaningful comparisons to be made, particularly between those living in regional
and remote areas; regional urban areas; and the capital city/urban development areas. It is important
to note that these quotas were based on local government type, not the proportion of the population
resident in each local government category.
The survey results have been post-weighted by age and gender. Figures for the Australian population
based on the 2011 Census were used.
Gender Unweighted
n
Weighted
n
Weighted % NSW
population
2011 %
Male 919 979 48.8 48.9
Female 1087 1026 51.2 51.1
Age Unweighted
n
Weighted
n
Weighted % NSW
population
2011 %
18-29 156 429 21.4 21.4
30-39 284 361 18.0 18.0
40-49 363 370 18.5 18.5
50-59 457 333 16.6 16.6
60-69 380 258 12.9 12.9
70 + 366 254 12.7 12.7
The average interview length was 26.4 minutes (median length 24.2 minutes).

WORKS CITED 181
Appendix D Conceptual framework
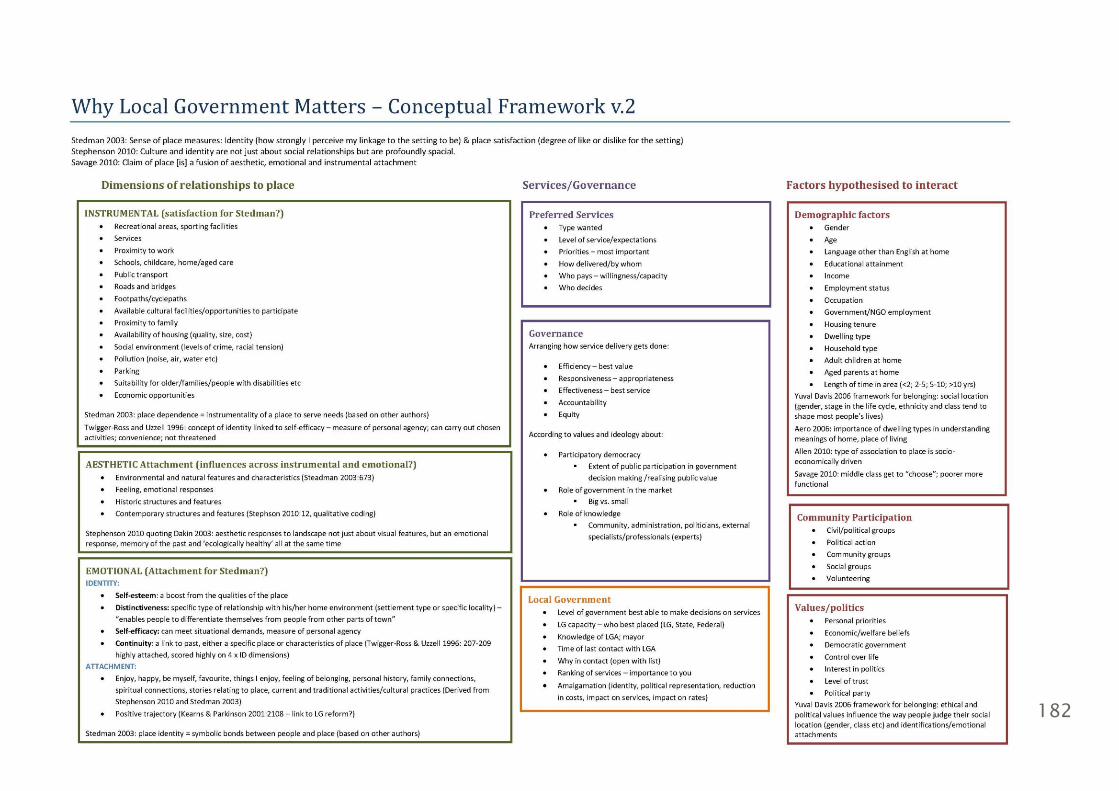
WORKS CITED 182

WORKS CITED 183
Appendix E Australian classifications of local
governments

WORKS CITED 184
Step 1 Step 2 Step 3 Identifiers Category
URBAN (U) Capital City (CC)
UCC
Population more
than 20 000 Metropolitan Developed (D)
Part of an urban centre of more
than 1 000 000 or population
density more than 600/sq km
Small (S)
Medium (M)
Large (L)
Very Large (V)
up to 30 000
30 001-70 000
70 001-120 000
more than 120 000
UDS
UDM
UDL
UDV
OR
Population density
more than 30 persons
per sq km
Regional Towns/City (R)
Part of an urban centre with population
less than 1 000 000 and predominantly
urban in nature
Small (S)
Medium (M)
Large (L)
Very Large (V)
up to 30 000
30 001-70 000
70 001-120 000
more than 120 000
URS
URM
URL
URV
OR
90 per cent or more of
LGA population is
urban
Fringe (F)
A developing LGA on the margin of a
developed or regional urban centre
Small (S)
Medium (M)
Large (L)
Very Large (V)
up to 30 000
30 001-70 000
70 001-120 000
more than 120 000
UFS
UFM
UFL
UFV
RURAL (R)
An LGA with
population less than
20 000
Significant Growth (SG)
Average annual population growth more
than 3 per cent, population more than 5
000 and not remote
Not applicable
RSG
AND
Population density less
than 30 persons per sq
km
Agricultural (A) Small (S)
Medium (M)
Large (L)
Very Large (V)
up to 2 000
2 001-5 000
5 001-10 000
10 001-20 000
RAS
RAM
RAL
RAV
AND
Less than 90 per cent
of LGA population is
urban
Remote (T) Extra Small (X)
Small (S)
Medium (M)
Large (L)
up to 400
401-1 000
1 001-3 000
3 001-20 000
RTX
RTS
RTM
RTL


#WLGM
acelg.org.au
clg.uts.edu.au
@acelg@clgatuts
Join the conversation: