Embed Size (px)
Citation preview
WIC PARTICIPANT
AND
PROGRAM CHARACTERISTICS
2008
Non-Discrimination Policy The U.S. Department of Agriculture (USDA) prohibits discrimination in all its programs and activities on the basis of race, color, national origin, age, disability, and where applicable, sex, marital status, familial status, parental status, religion, sexual orientation, genetic information, political beliefs, reprisal, or because all or part of an indi-vidual’s income is derived from any public assistance program. (Not all prohibited bases apply to all programs.) Persons with disabilities who require alternative means for communication of program information (Braille, large print, audiotape, etc.) should contact USDA’s TARGET Center at (202) 720-2600 (voice and TDD). To file a complaint of discrimination, write USDA, Director, Office of Civil Rights, 1400 and Independence Ave-nue, SW, Washington, DC 20250-9410 or call (800) 795-3272 (voice) or (202) 720-6382 (TDD). USDA is an equal employment opportunity provider and employer.
WIC Participant and Program Characteristics 2008
Authors: From Abt Associates, Inc.: Patty Connor, Susan Bartlett, Michele Mendelson, Katherine Condon, James Sutcliffe, et al. Submitted by: Submitted to: Abt Associates, Inc. Office of Research and Analysis 55 Wheeler Street USDA, Food and Nutrition Service Cambridge, MA 02138 3101 Park Center Drive, Room 1014 Alexandria, VA 22302-1500 Project Director: Project Officer: Patty Connor Fred Lesnett This study was conducted under Contract number GS-10F-0086K with the Food and Nutrition Service. This report is available on the Food and Nutrition Service website: http://www.fns.usda.gov/ora. Suggested Citation: U.S. Department of Agriculture, Food and Nutrition Service, Office of Research and Analysis, WIC Participant and Program Characteristics 2008, WIC-08-PC, by Patty Connor, Susan Bartlett, Michele Mendelson, Katherine Condon, James Sutcliffe, et al. Project Officer, Fred Lesnett Alexandria, VA: January 2010.
United States Food and Department of Nutrition Agriculture Service
January 2010Special Nutrition Programs
Report No. WIC-08-PC
Acknowledgments i
ACKNOWLEDGMENTS WIC Participant and Program Characteristics 2008 must be dedicated to our friends and colleagues in State WIC agencies. They provide all of the data presented in these tabulations. We gratefully and humbly acknowledge their cooperation and commend the diligence of the WIC Program in creating and maintaining viable, practical client information systems. FNS staff have provided support, good advice, and have given special encouragement to both Abt and WIC State Agencies in developing these tabulations. At Abt Associates two additional members of our study team, Natasha Zotov and Kelly Lawrence, carefully reviewed numerous State data submissions. Nancy Burstein, our Project Quality Advisor, provided technical guidance and insightful commentary.

Acknowledgments ii
Executive Summary iii
EXECUTIVE SUMMARY The Special Supplemental Nutrition Program for Women, Infants, and Children (WIC) is administered by the Food and Nutrition Service (FNS) of the US Department of Agriculture (USDA). The WIC Program provides a combination of direct nutritional supplementation, nutrition education and counseling, and increased access to health care and social service providers for pregnant, breastfeeding, and postpartum women; infants; and children up to the age of five years. WIC seeks to improve fetal development and reduce the incidence of low birthweight, short gestation, and anemia through intervention during the prenatal period. Infants and children who are at nutritional or health risk receive food supplements, nutrition education, and access to health care services to maintain and improve their health and development. To receive WIC benefits, an individual must be categorically eligible; that is, the person must be a pregnant, breastfeeding, or postpartum woman; an infant up to the age of one year; or a child aged one through four years. In addition, each applicant must be found to be income eligible and at nutritional risk. Eligible applicants receive supplemental food usually in the form of vouchers or checks that allow them to obtain specific types of food (milk, juice, cereal, for example) from participating retail grocers. The WIC Program was established in 1972 by an amendment to the Child Nutrition Act of 1966. WIC has greatly expanded since its inception, and, in April 2008, WIC enrolled 9.5 million participants at an annual cost of $6.2 billion. Since 1988, FNS has produced biennial reports on participant and program characteristics in the WIC Program. This information is used for general program monitoring as well as for managing the information needs of the program. FNS uses this regularly updated WIC Program information to estimate budgets, submit civil rights reporting, identify needs for research, and review current and proposed WIC policies and procedures. The biennial reports include:
Information on the income and nutritional risk characteristics of WIC participants.
Breastfeeding initiation rates and durations by State.
Data on WIC Program participation for migrant farm worker families.
Other information on WIC participation that is deemed appropriate by the Secretary of Agriculture.
This publication is the twelfth report in the series of studies on WIC Participant and Program Characteristics.
The 2008 Report The 2008 report of WIC Participant and Program Characteristics (PC2008), like all biennial reports beginning with PC92, employs the prototype reporting system developed by FNS that routinizes compilation of participant information from State WIC agencies. The PC reports, including PC2008, contain information on a near-census of WIC participants in April of the reporting year.1 In this report, the term “participants” is defined as persons on WIC master lists or persons listed in WIC operating files who are certified to receive WIC benefits in April
1 Reports prior to 1992 were based on nationally representative samples of WIC participants and programs and collected data through interviews and case record abstractions.
Executive Summary iv
20082 This definition is slightly different from WIC’s regulatory definition of participants, which is based on an individual physically picking up WIC benefits at the WIC office. This definitional difference results in a count of PC2008 WIC participants that is approximately 9 percent higher than the number of participants described in regular program accounting reports for April 2008. This percentage difference is similar to previously reported differences in these biennial statistics. Participant Records. The current system for reporting participant data is based on the automated transfer of an agreed-upon set of data elements. State WIC agencies download routinely collected information from their existing automated client and management information systems. State and local WIC staff use these data to certify applicant eligibility for WIC benefits and to issue food vouchers and checks. This Minimum Data Set (MDS), which consists of twenty items, was developed by FNS working with the Information Committee of the National WIC Association (formerly the National Association of WIC Directors) and the Centers for Disease Control (CDC). For this report, ninety State WIC agencies submitted MDS data on a census of WIC participants. The State-maintained automated information systems from which PC2008 data are drawn do not always contain complete information on every variable for every individual enrolled in the WIC Program, though overall reporting has improved substantially over time.3 Unreported PC2008 data may be unavailable for a variety of reasons and participants with unreported data may be different from those individuals with data reported. Assumptions regarding missing data vary by the nature of the variable and by category of WIC participant. To account for these anomalies, a uniform strategy has been adopted for preparing all tables in this report. Data not reported are included in the calculation of percentage distributions for each characteristic. While including missing data in the denominators for all calculations tends to place estimates for each characteristic at a lower bound, this approach has allowed consistent presentation of tabulations throughout the report. Further, it assures that all information needed to calculate upper-bound estimates is readily available in every table. Caution should be used in comparing results across groups; missing data must always be considered in gauging differences between, among, or across groups or categories of WIC participants. Similar caution should be used comparing results over time. For PC2008, reporting approached 100 percent on most variables; unreported data were more prevalent in earlier reports.
The 2008 WIC Program In 2008, WIC services were delivered in each of the fifty States, American Samoa, the District of Columbia, Guam, the Northern Mariana Islands, Puerto Rico, and the American Virgin Islands as well as by thirty-four Indian Tribal Organizations. The ninety State WIC agencies reporting PC2008 data operated 1,870 local WIC agencies where staff delivered WIC services.4 The eight States with the largest WIC populations—California, Florida, Georgia, Illinois, New York, Ohio, Pennsylvania, and Texas—served just over half (51.5 percent) of all WIC participants. In fact, 33.1 percent of WIC participants can be found in three states—California, New York, and Texas.
2 Due to management information system constraints, five State agencies provided data for a month other than April 2008. These State agencies and the reference months are: American Samoa (August 2008), Citizen-Potawatomi (September 2008), Colorado (May 2008), Guam (September 2008), and Rhode Island (May 2008). 3 Data from Delaware, Guam and Oklahoma were weighted to deal with underreporting or overreporting (relative to WIC administrative data) of WIC participants in some or all certification categories. 4 Since PC2004 FNS and State WIC agencies have matched their definitions and databases of local agencies. This updating has led to a decrease in the reported number of local agencies. There has not been a decrease in participants served or services provided at local levels.
Executive Summary v
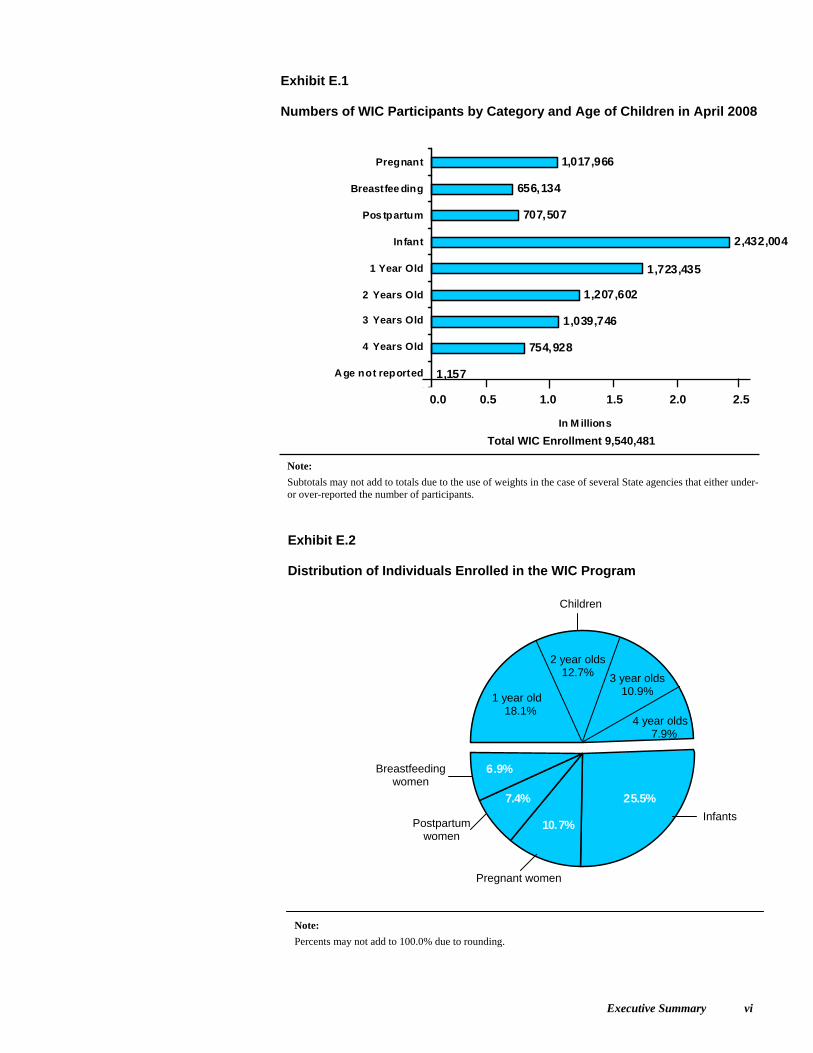
Participant Characteristics In April 2008, 9,540,481 women, infants, and children were enrolled in the WIC in 2008 Program (Exhibit E.1). This number is an increase of 9 percent over WIC enrollment
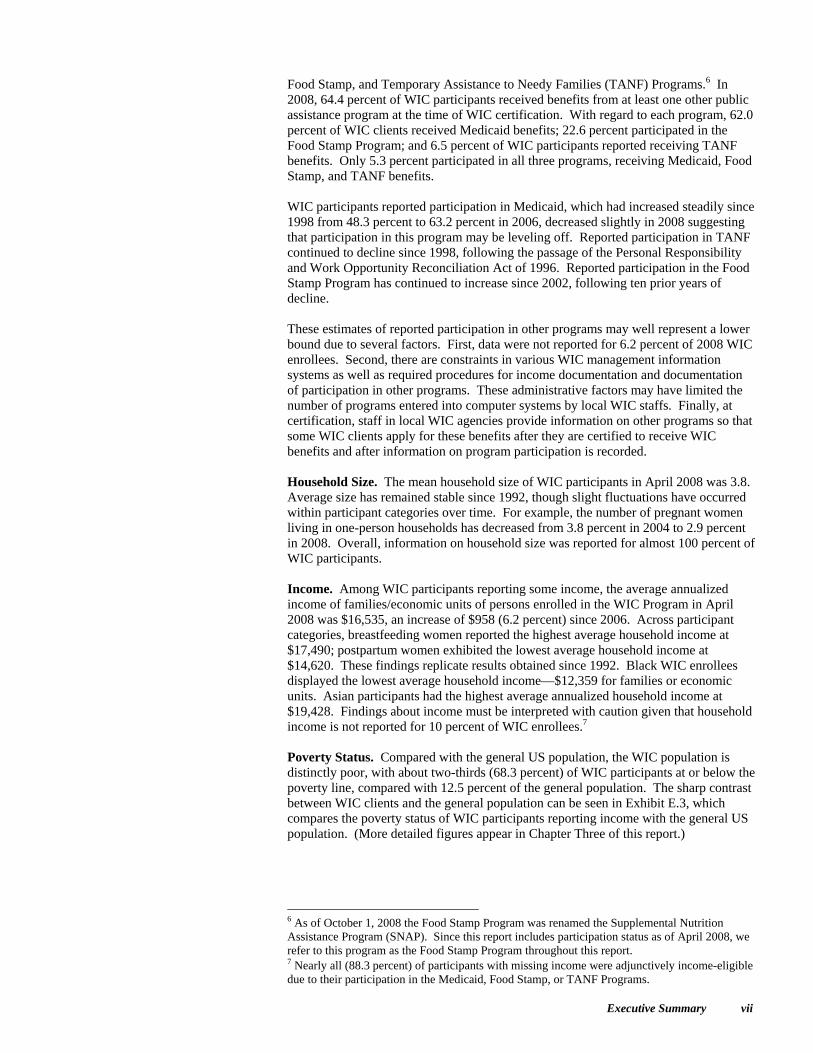
reported in 2006, continuing the upward trend observed since PC2000, but representing a sharper increase between 2006 and 2008. Approximately half (49.5 percent) of WIC participants are children (Exhibit E.2). Infants account for 25.5 percent and women 25.0 percent. The PC2008 and PC2006 distributions are similar and have remained essentially unchanged since 2000. Women were further divided into pregnant (10.7 percent of all participants), breastfeeding (6.9 percent of all participants), and postpartum (7.4 percent of all participants). The share (or proportion) of breastfeeding women has risen steadily from 3.6 percent in 1992 to 6.9 percent in 2008 while the proportion of infants in the program has fallen from 30.1 percent. Most (85.1 percent) of the pregnant women participating in WIC are between the ages of 18 and 34, as are 85.1 percent of breastfeeding and 86.5 percent of postpartum women. Only 6.1 percent of women WIC clients are aged seventeen or younger, continuing a trend of a steady decline from 10.6 percent in 1992. Most (91.7 percent) infant WIC participants are certified for WIC benefits during their first three months of life. Child participation decreases as age increases—36.5 percent of child participants are one year of age and only 16.0 percent are four years of age at time of most recent certification. In 2008, half (50.6) percent of pregnant WIC participants enrolled in the program during their first trimester, and most of the remainder (37.4 percent) in the second trimester. Only 10.2 percent enrolled in the third trimester, down from approximately 12 percent in 1998. The percentage of pregnant women enrolled in WIC during their first trimester increased steadily from 1992 to 2006, but has shown a slight decline (by 0.6 percentage points) in 2008 to stabilize this trend.5 Race and Ethnicity. The PC2006 report was the first to contain data on race and ethnicity applying the revised reporting procedures required by OMB and used by the US Bureau of the Census. The Census uses two variables: one records whether or not the individual is Hispanic/Latino; the second records racial category(ies). Multiple racial identifications are permitted. Prior PC studies used a five-category classification that combined racial and ethnic information. Because of this change, it is not possible to compare PC2008 data with information from PC reports prior to PC2006. In 2008, 60.3 percent of all WIC participants reported their race as White Only, 19.6 percent reported as Black/African American Only, 11.4 percent reported as American Indian/Alaska Native Only, and 3.5 percent of participants reported as either Asian Only or Native Hawaiian/Pacific Islander Only. Two or more races were reported for 3.6 percent of WIC participants. There was a 5.0 percentage point increase in White Only participants and a 3.9 percentage point decrease in American Indian/Alaska Native Only participants since 2006. Although there was a slight increase (0.7 percent) in those reporting more than one race from 2006 to 2008, no significant changes were noted in other racial categories or WIC participants. For ethnicity, 42.1 percent of participants reported as Hispanic/Latino, representing a slight increase (by almost 1 percentage point) reporting Hispanic/Latino ethnicity since 2006. Participation in Other Programs. WIC legislation allows income eligibility requirements to be met by participation in means-tested programs such as the Medicaid,
5 Due to changes over time in the percent of participants with missing data on trimester of enrollment, calculations in this paragraph exclude all such participants from the denominator.
Executive Summary vi
Exhibit E.1 Numbers of WIC Participants by Category and Age of Children in April 2008
1,157
754,928
1,039,746
1,207,602
707,507
656,134
1,017,966
2,432,004
1,723,435
0 50 0000 100000 0 15 00000 200000 0 2 500000
Age not reported
4 Years Old
3 Years Old
2 Years Old
1 Year Old
Infant
Pos tpartum
Breastfee ding
Pregnant
In M illions
Note:
Subtotals may not add to totals due to the use of weights in the case of several State agencies that either under- or over-reported the number of participants.
Exhibit E.2 Distribution of Individuals Enrolled in the WIC Program
25.5%
10.7%
7.4%
6.9%
Note:
Percents may not add to 100.0% due to rounding.
Total WIC Enrollment 9,540,481
0.0 0.5 1.0 1.5 2.0 2.5
Children
Infants
Pregnant women
4 year olds 7.9%
3 year olds 10.9%
2 year olds 12.7%
1 year old 18.1%
Breastfeeding women
Postpartum women
Executive Summary vii
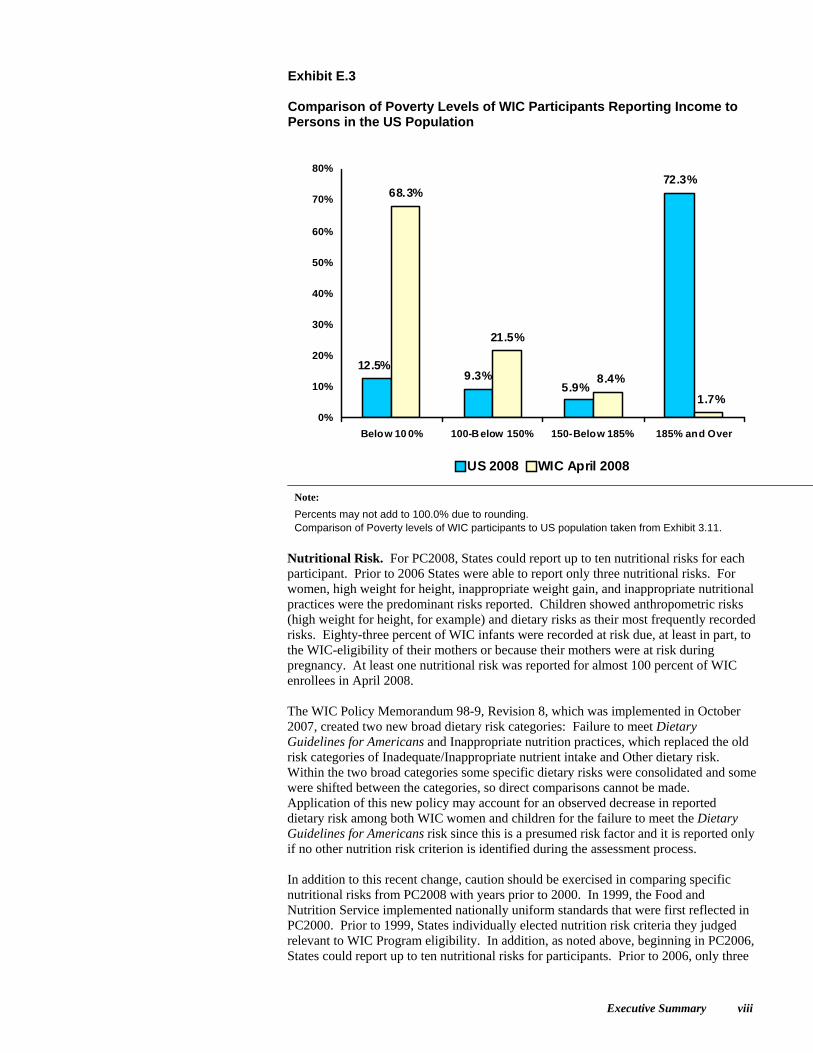
Food Stamp, and Temporary Assistance to Needy Families (TANF) Programs.6 In 2008, 64.4 percent of WIC participants received benefits from at least one other public assistance program at the time of WIC certification. With regard to each program, 62.0 percent of WIC clients received Medicaid benefits; 22.6 percent participated in the Food Stamp Program; and 6.5 percent of WIC participants reported receiving TANF benefits. Only 5.3 percent participated in all three programs, receiving Medicaid, Food Stamp, and TANF benefits. WIC participants reported participation in Medicaid, which had increased steadily since 1998 from 48.3 percent to 63.2 percent in 2006, decreased slightly in 2008 suggesting that participation in this program may be leveling off. Reported participation in TANF continued to decline since 1998, following the passage of the Personal Responsibility and Work Opportunity Reconciliation Act of 1996. Reported participation in the Food Stamp Program has continued to increase since 2002, following ten prior years of decline. These estimates of reported participation in other programs may well represent a lower bound due to several factors. First, data were not reported for 6.2 percent of 2008 WIC enrollees. Second, there are constraints in various WIC management information systems as well as required procedures for income documentation and documentation of participation in other programs. These administrative factors may have limited the number of programs entered into computer systems by local WIC staffs. Finally, at certification, staff in local WIC agencies provide information on other programs so that some WIC clients apply for these benefits after they are certified to receive WIC benefits and after information on program participation is recorded. Household Size. The mean household size of WIC participants in April 2008 was 3.8. Average size has remained stable since 1992, though slight fluctuations have occurred within participant categories over time. For example, the number of pregnant women living in one-person households has decreased from 3.8 percent in 2004 to 2.9 percent in 2008. Overall, information on household size was reported for almost 100 percent of WIC participants. Income. Among WIC participants reporting some income, the average annualized income of families/economic units of persons enrolled in the WIC Program in April 2008 was $16,535, an increase of $958 (6.2 percent) since 2006. Across participant categories, breastfeeding women reported the highest average household income at $17,490; postpartum women exhibited the lowest average household income at $14,620. These findings replicate results obtained since 1992. Black WIC enrollees displayed the lowest average household income—$12,359 for families or economic units. Asian participants had the highest average annualized household income at $19,428. Findings about income must be interpreted with caution given that household income is not reported for 10 percent of WIC enrollees.7 Poverty Status. Compared with the general US population, the WIC population is distinctly poor, with about two-thirds (68.3 percent) of WIC participants at or below the poverty line, compared with 12.5 percent of the general population. The sharp contrast between WIC clients and the general population can be seen in Exhibit E.3, which compares the poverty status of WIC participants reporting income with the general US population. (More detailed figures appear in Chapter Three of this report.)
6 As of October 1, 2008 the Food Stamp Program was renamed the Supplemental Nutrition Assistance Program (SNAP). Since this report includes participation status as of April 2008, we refer to this program as the Food Stamp Program throughout this report. 7 Nearly all (88.3 percent) of participants with missing income were adjunctively income-eligible due to their participation in the Medicaid, Food Stamp, or TANF Programs.
Executive Summary viii
Exhibit E.3 Comparison of Poverty Levels of WIC Participants Reporting Income to Persons in the US Population
9.3%
72.3%68.3%
21.5%
5.9%
12.5%
1.7%
8.4%
0%
10%
20%
30%
40%
50%
60%
70%
80%
Below 10 0% 100-Below 150% 150-Below 185% 185% and Over
US 2008 WIC April 2008
Note:
Percents may not add to 100.0% due to rounding. Comparison of Poverty levels of WIC participants to US population taken from Exhibit 3.11.
Nutritional Risk. For PC2008, States could report up to ten nutritional risks for each participant. Prior to 2006 States were able to report only three nutritional risks. For women, high weight for height, inappropriate weight gain, and inappropriate nutritional practices were the predominant risks reported. Children showed anthropometric risks (high weight for height, for example) and dietary risks as their most frequently recorded risks. Eighty-three percent of WIC infants were recorded at risk due, at least in part, to the WIC-eligibility of their mothers or because their mothers were at risk during pregnancy. At least one nutritional risk was reported for almost 100 percent of WIC enrollees in April 2008. The WIC Policy Memorandum 98-9, Revision 8, which was implemented in October 2007, created two new broad dietary risk categories: Failure to meet Dietary Guidelines for Americans and Inappropriate nutrition practices, which replaced the old risk categories of Inadequate/Inappropriate nutrient intake and Other dietary risk. Within the two broad categories some specific dietary risks were consolidated and some were shifted between the categories, so direct comparisons cannot be made. Application of this new policy may account for an observed decrease in reported dietary risk among both WIC women and children for the failure to meet the Dietary Guidelines for Americans risk since this is a presumed risk factor and it is reported only if no other nutrition risk criterion is identified during the assessment process. In addition to this recent change, caution should be exercised in comparing specific nutritional risks from PC2008 with years prior to 2000. In 1999, the Food and Nutrition Service implemented nationally uniform standards that were first reflected in PC2000. Prior to 1999, States individually elected nutrition risk criteria they judged relevant to WIC Program eligibility. In addition, as noted above, beginning in PC2006, States could report up to ten nutritional risks for participants. Prior to 2006, only three
Executive Summary ix
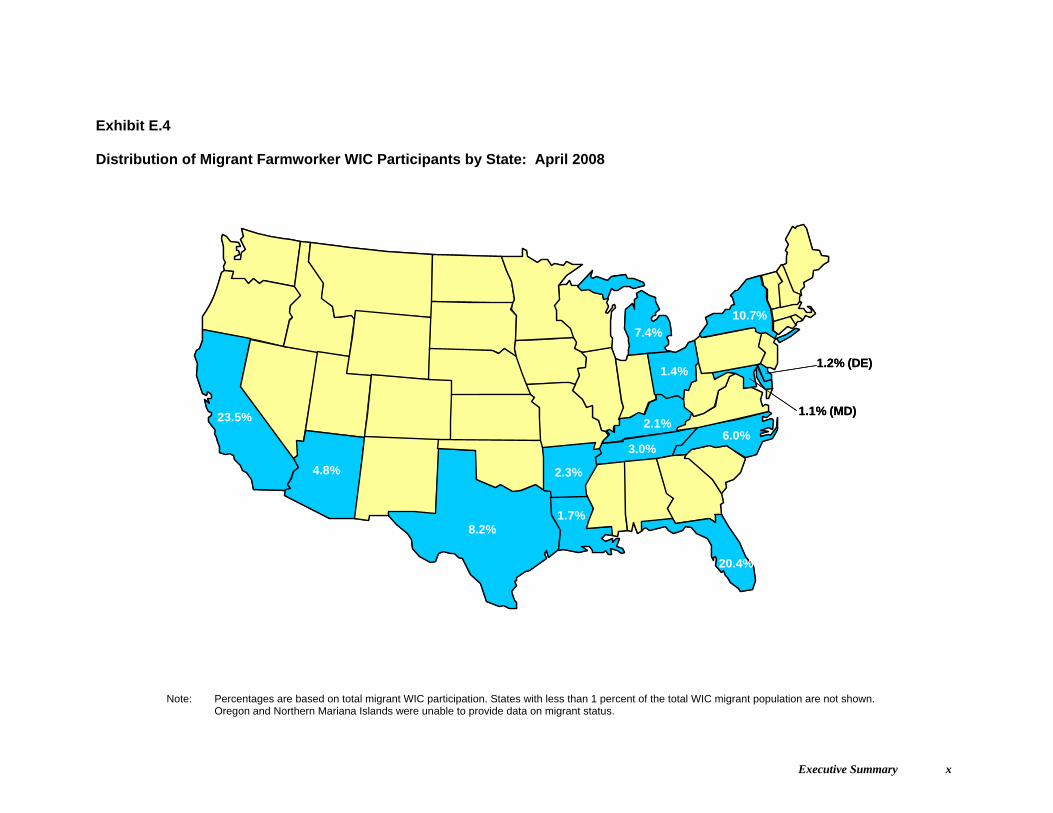
nutritional risks could be reported. These changes affect any comparisons between PC2008 and years prior to PC2006. Breastfeeding Rates. Beginning with PC98, States were required to submit data on breastfeeding initiation and duration. Reporting has improved substantially over time. The PC2008 estimate is based on data from 87 State WIC agencies, which represent 99.5 percent of all six-to-thirteen-month old infant and child WIC participants. In the States reporting breastfeeding data, 59.0 percent of infants aged six to thirteen months are currently breastfed or were breastfed at some time. These reported rates represent an increase in the breastfeeding initiation rate of 17.5 percentage points since 1998. This increase must be considered with caution. Over time, breastfeeding data have been inconsistently reported, and the same States have not reported breastfeeding data for every PC report. Food Package Data. Beginning in April 1998, States were required to provide food prescription data as part of the WIC Minimum Data Set (MDS). Migrant Status. The final chapter of PC2008 addresses migrant farmworker participation in the WIC Program. Exhibit E.4 shows migrant participation across the States. In April 2008, there were 42,477 migrant WIC participants identified on State WIC enrollment files. Migrant WIC participants make up less than half of 1 percent of the population receiving WIC services. Slightly more than half of these participants were enrolled in the WIC Program in California, Florida, and Texas. The distribution of migrant WIC participant categories is consistent with the overall WIC population for 2008 except that there is a slightly higher percentage of three and four year old children among migrant than among non-migrant WIC children. Average income in the non-migrant WIC population is higher than income reported by migrant farmworker WIC enrollees. The gap has decreased fairly steadily since 1994 when non-migrant income was 20 percent higher than migrant income. In PC2008 non-migrant income was only 2.1 percent higher than migrant income. For PC2008, State WIC agencies reported information on migrant status for almost 100 percent of US WIC participants.
Executive Summary x
Exhibit E.4 Distribution of Migrant Farmworker WIC Participants by State: April 2008
23.5%
8.2%
2.3%
20.4%
6.0%
10.7%
7.4%
4.8%
2.1%
3.0%
1.4%
1.7%
1.1% (MD)
1.2% (DE)
23.5%
8.2%
2.3%
20.4%
6.0%
10.7%
7.4%
4.8%
2.1%
3.0%
1.4%
1.7%
1.1% (MD)
1.2% (DE)
Note: Percentages are based on total migrant WIC participation. States with less than 1 percent of the total WIC migrant population are not shown. Oregon and Northern Mariana Islands were unable to provide data on migrant status.
Contents
Contents xi
Acknowledgments............................................................................................................................ i Executive Summary ........................................................................................................................ iii Contents............................................................................................................................................ xi List of Exhibits................................................................................................................................. xiii Chapter One Introduction ........................................................................................................ 1 Program Operations.............................................................................................. 1 Participant Benefits............................................................................................... 4 Eligibility for WIC Benefits ................................................................................. 5 Program Participation ........................................................................................... 6 Previous Reports on WIC Participant and Program Characteristics..................... 6 Report on WIC Participant and Program Characteristics 2008 ............................ 7 Organization of This Report ................................................................................. 14 Chapter Two Overview of WIC Participation and Demographics of WIC Participants ......................................................................................................... 15 Demographics....................................................................................................... 15 Chapter Three Income of WIC Participants .............................................................................. 29 Household Size and Income ................................................................................. 31 Poverty Status ....................................................................................................... 37 Chapter Four Nutritional Risk Characteristics ....................................................................... 49 Nutritional Risk Criteria ....................................................................................... 49 Nutritional Risks in PC2008................................................................................. 52 Nutrition and Poverty Status................................................................................. 86 Anthropometric Values......................................................................................... 86 Blood Measures .................................................................................................... 111 Chapter Five Priority Levels..................................................................................................... 121 Chapter Six Breastfeeding of WIC Infants............................................................................ 127 Chapter Seven Characteristics of Migrant WIC Participants ................................................. 139
Contents
Contents xii
Appendix A Chapter Two Supplemental Tables WIC Participants by Participant Category by State................................................. A-1 Supplemental Racial and Ethnic Tabulations .......................................................... A-6 Appendix B Chapter Three Supplemental Tables Distribution of Poverty, 2002, 2004, 2006, 2008 .................................................... B-1 Appendix C Chapter Six Supplemental Tables Breastfeeding Initiation and Duration Rates for WIC Infants Aged Seven to Eleven Months in April 2008 by State ................................................................ C-1 Appendix D Chapter Seven Supplemental Table Distribution of Migrant WIC Participants by State ................................................. D-1 Appendix E Supplemental Data Set State-by-State Tables............................................................................................... E-1
List of Exhibits
Contents xiii
Executive Summary
Exhibit E.1: Numbers of WIC Participants by Category and Age of Children in April 2008...................................................................................................... vi
Exhibit E.2: Distribution of Individuals Enrolled in the WIC Program............................. vi
Exhibit E.3: Comparison of Poverty Levels of WIC Participants Reporting Income to Persons in the US Population .................................................................... viii
Exhibit E.4: Distribution of Migrant Farmworker WIC Participants by State: April 2008...................................................................................................... x
Chapter One: Introduction
Exhibit 1.1: Distribution of Local WIC Agencies and WIC Participants by State WIC Agency .................................................................................................. 2
Exhibit 1.2: Minimum Data Set Variables and Definitions: Guidance to State WIC Agencies................................................................................................ 8
Exhibit 1.3: Supplemental Data Set Variables and Definitions: Guidance to State WIC Agencies................................................................................................ 11
Exhibit 1.4: WIC Enrollment, April 2008 ......................................................................... 13
Chapter Two: Overview of WIC Participation and Demographics of WIC Participants
Exhibit 2.1: Distribution of WIC Participants by Participant Category in 2006 and 2008......................................................................................................... 16
Exhibit 2.2: Distribution of WIC Participants by Participant Category 1992 – 2008 ....... 17
Exhibit 2.3: Distribution of Age of WIC Participants at Certification by WIC Participant Category 2004, 2006, 2008.......................................................... 18
Exhibit 2.4: Distribution of Pregnant Women WIC Participants by Trimester of Enrollment 2004, 2006, 2008 ........................................................................ 20
Exhibit 2.5: Distribution of WIC Participants by Region 2004, 2006, 2008..................... 21
Exhibit 2.6: Distribution of Race and Ethnicity of WIC Participants................................ 22
Exhibit 2.7: Distribution of Race and Ethnicity of WIC Women, Infants, and Children 2006, 2008 ...................................................................................... 23
Exhibit 2.8: Distribution of Ethnicity by Race of WIC Participants ................................. 25
Exhibit 2.9: Distribution of Race and Ethnicity of WIC Participants by Participant Category......................................................................................................... 27
Exhibit 2.10: Distribution of Race and Ethnicity of WIC Participants by Region .............. 28
Chapter Three: Income of WIC Participants
Exhibit 3.1: Number and Percent of WIC Participants with Reported Participation in Other Programs at Certification................................................................. 30
List of Exhibits
Contents xiv
Exhibit 3.2: Distribution of the Size of Families or Economic Units of WIC Participants by Participant Category.............................................................. 32
Exhibit 3.3: Mean and Median Annualized Family or Economic Unit Income of WIC Participants by Participant Category..................................................... 33
Exhibit 3.4: Average Annualized Family or Economic Unit Income of WIC Participants by Participant Category and Race.............................................. 34
Exhibit 3.5: Average Annualized Family or Economic Unit Income of WIC Participants by Participant Category and Ethnicity ....................................... 36
Exhibit 3.6: Poverty Status of WIC Participants in 2004, 2006, 2008 .............................. 38
Exhibit 3.7: Distribution of Percent of Federal Poverty Level of WIC Participants by Participant Category ................................................................................. 39
Exhibit 3.8: Distribution of Percent of Federal Poverty Level of WIC Participants by Participant Category and Race.................................................................. 40
Exhibit 3.9: Distribution of Percent of Federal Poverty Level of WIC Participants by Participant Category and Ethnicity .......................................................... 44
Exhibit 3.10: Distribution of Percent of Federal Poverty Level at Certification for WIC Participants Reporting No Other Benefit Receipt ................................. 47
Exhibit 3.11: Comparison of Poverty Levels of WIC Participants to Persons in the US Population in 2008................................................................................... 48
Chapter Four: Nutritional Risk Characteristics
Exhibit 4.1: Broad Categories of FNS-Mandated Nutritional Risk Criteria...................... 50
Exhibit 4.2: Distribution of Number of Nutritional Risk Factors for WIC Participants Reported at Certification: 2004, 2006, 2008.............................. 51
Exhibit 4.3: Number and Percent of WIC Participants with Specific Nutritional Risks Reported at Certification...................................................................... 53
Exhibit 4.4: Number and Percent of Women WIC Participants by Participant Category, Age at Certification, and Broad Category of Nutritional Risk Reported....... 54
Exhibit 4.5: Number and Percent of Infant and Child WIC Participants by Age at Certification and Broad Category of Nutritional Risk Reported ................... 55
Exhibit 4.6: Number and Percent of Women WIC Participants by Participant Category with Specific Nutritional Risks Reported....................................... 56
Exhibit 4.7: Number and Percent of Infant WIC Participants with Specific Nutritional Risks Reported by Age at Certification....................................... 58
Exhibit 4.8: Number and Percent of Child WIC Participants with Specific Nutritional Risks Reported by Age at Certification....................................... 59
Exhibit 4.9: Nutritional Risks Reported in at Least 15 Percent of WIC Participants: 2004, 2006, 2008 ...................................................................... 60
Exhibit 4.10: Nutritional Risks Reported in at Least 15 Percent of Pregnant WIC Participants by Age at Certification............................................................... 61
List of Exhibits
Contents xv
Exhibit 4.11: Number and Percent of American Indian/Alaska Native Only WIC Participants with Specific Nutritional Risks Reported by Participant Category......................................................................................................... 62
Exhibit 4.12: Number and Percent of Asian Only WIC Participants with Specific Nutritional Risks Reported by Participant Category ..................................... 64
Exhibit 4.13: Number and Percent of Black/African American Only WIC Participants with Specific Nutritional Risks Reported by Participant Category ............... 66
Exhibit 4.14: Number and Percent of Native Hawaiian/Pacific Islander Only WIC Participants with Specific Nutritional Risks Reported by Participant Category......................................................................................................... 68
Exhibit 4.15: Number and Percent of White Only WIC Participants with Specific Nutritional Risks Reported by Participant Category ..................................... 70
Exhibit 4.16: Number and Percent of WIC Participants Reporting Two or More Races with Specific Nutritional Risks Reported by Participant Category ............... 72
Exhibit 4.17: Number and Percent of Hispanic/Latino WIC Participants with Specific Nutritional Risks Reported by Participant Category ....................... 74
Exhibit 4.18: Number and Percent of Not Hispanic/Latino WIC Participants with Specific Nutritional Risks Reported by Participant Category ....................... 76
Exhibit 4.19: Nutritional Risks Reported in at Least 15 Percent of American Indian/ Alaska Native Only WIC Participants by Participant Category .................... 78
Exhibit 4.20: Nutritional Risks Reported in at Least 15 Percent of Asian Only WIC Participants by Participant Category.............................................................. 79
Exhibit 4.21: Nutritional Risks Reported in at Least 15 Percent of Black/African American Only WIC Participants by Participant Category ........................... 80
Exhibit 4.22: Nutritional Risks Reported in at Least 15 Percent of Native Hawaiian/ Pacific Islander Only WIC Participants by Participant Category .................. 81
Exhibit 4.23: Nutritional Risks Reported in at Least 15 Percent of White Only WIC Participants by Participant Category.............................................................. 82
Exhibit 4.24: Nutritional Risks Reported in at Least 15 Percent of WIC Participants Reporting Two or More Races by Participant Category................................ 83
Exhibit 4.25: Nutritional Risks Reported in at Least 15 Percent of Hispanic/Latino WIC Participants by Participant Category..................................................... 84
Exhibit 4.26: Nutritional Risks Reported in at Least 15 Percent of Not Hispanic/ Latino WIC Participants by Participant Category ......................................... 85
Exhibit 4.27: Number and Percent of Women WIC Participants with Specific Nutritional Risks Reported at Certification by Percent of Poverty................ 87
Exhibit 4.28: Number and Percent of Infant WIC Participants with Specific Nutritional Risks Reported at Certification by Percent of Poverty................ 89
Exhibit 4.29: Number and Percent of Child WIC Participants with Specific Nutritional Risks Reported at Certification by Percent of Poverty................ 91
List of Exhibits
Contents xvi
Exhibit 4.30: Number and Percent of One-Year-Old Child WIC Participants with Specific Nutritional Risks Reported at Certification by Percent of Poverty ........................................................................................................... 93
Exhibit 4.31: Number and Percent of Two-Year-Old Child WIC Participants with Specific Nutritional Risks Reported at Certification by Percent of Poverty ........................................................................................................... 95
Exhibit 4.32: Number and Percent of Three-Year-Old Child WIC Participants with Specific Nutritional Risks Reported at Certification by Percent of Poverty ........................................................................................................... 97
Exhibit 4.33: Number and Percent of Four-Year-Old Child WIC Participants with Specific Nutritional Risks Reported at Certification by Percent of Poverty ........................................................................................................... 99
Exhibit 4.34: Distribution of Infant WIC Participants According to Selected Anthropometric Measures: 2004, 2006, 2008............................................... 102
Exhibit 4.35: Distribution of Infant WIC Participants by Race According to Selected Anthropometric Measures ............................................................... 103
Exhibit 4.36: Distribution of Infant WIC Participants by Ethnicity According to Selected Anthropometric Measures ............................................................... 104
Exhibit 4.37: Number and Percent of Infant and One Year Old Child WIC Participants at Risk According to FNS Mandated Nutrition Risk Criteria for Anthropometric Measures........................................................... 105
Exhibit 4.38: Distribution of Child WIC Participants by Age According to Selected Anthropometric Measures: 2004, 2006, 2008................................................ 106
Exhibit 4.39: Distribution of Child WIC Participants by Age and Race According to Selected Anthropometric Measures ........................................................... 107
Exhibit 4.40: Distribution of Child WIC Participants by Age and Ethnicity According to Selected Anthropometric Measures ......................................... 108
Exhibit 4.41: Number and Percent of Child WIC Participants Age 2 or More at Risk According to FNS-Mandated Nutrition Risk Criteria for Anthropometric Measures.............................................................................. 109
Exhibit 4.42: Number and Percent of Breastfeeding and Postpartum Women WIC Participants at Risk According to FNS-Mandated Nutrition Risk Criteria for Anthropometric Measures ........................................................................ 110
Exhibit 4.43: FNS-Mandated Nutrition Risk Eligibility for Hemoglobin and Hematocrit Levels.......................................................................................... 112
Exhibit 4.44: Availability of Hematological Data for WIC Participants: Percent of WIC Participants by Participant Category with Specific Types of Hematological Measures................................................................................ 113
Exhibit 4.45: Number and Percent of Women WIC Participants Falling Below FNS-Mandated Nutrition Risk Criteria for Hematologic Standards ...................... 114
Exhibit 4.46: Number and Percent of Child WIC Participants Falling Below FNS-Mandated Nutrition Risk Criteria for Hematologic Standards.............. 115
List of Exhibits
Contents xvii
Exhibit 4.47: Number and Percent of Anemic Women WIC Participants by Participant Category and Race....................................................................... 117
Exhibit 4.48 Number and Percent of Anemic Women WIC Participants by Participant Category and Ethnicity ................................................................ 118
Exhibit 4.49: Number and Percent of Anemic Child WIC Participants by Age at Time of Blood Measurement and Race ......................................................... 119
Exhibit 4.50: Number and Percent of Anemic Child WIC Participants by Age at Time of Blood Measurement and Ethnicity................................................... 120
Chapter Five: Priority Levels
Exhibit 5.1: WIC Priorities ................................................................................................ 122
Exhibit 5.2: Priority of All WIC Participants by Participant Category ............................. 123
Exhibit 5.3: Priority of Infant WIC Participants by Age at Certification .......................... 124
Exhibit 5.4: Priority of Child WIC Participants by Age at Certification........................... 125
Chapter Six Breastfeeding of WIC Infants
Exhibit 6.1: Breastfeeding Initiation Rates for WIC Infants and Children Aged Six to Thirteen Months in April 2008 by State .................................................... 128
Exhibit 6.2: Changes in Breastfeeding Initiation Rates for WIC Infants in April: 1998-2008............................................................................................ 132
Exhibit 6.3: Breastfeeding Duration for WIC Infants and Children Aged Six to Thirteen Months in April 2008 by State ........................................................ 133
Exhibit 6.4: Estimated Breastfeeding Duration by State: Number and Percent of WIC Infants and Children Aged Six to Thirteen Months in April 2008 Breastfeeding for Six Months or More........................................ 135
Chapter Seven: Characteristics of Migrant WIC Participants
Exhibit 7.1: Distribution of Migrant Farmworker WIC Participants by State: April 2008...................................................................................................... 140
Exhibit 7.2: Distribution of Migrant Farmworker WIC Participants by WIC Participant Category and Age at Certification ............................................... 141
Exhibit 7.3: Distribution of Migrant Pregnant Women WIC Participants by Trimester of Enrollment................................................................................. 142
Exhibit 7.4: Number and Percent of Migrant WIC Participants with Reported Participation in Other Programs at Certification ........................................... 143
Exhibit 7.5: Mean and Median Annualized Family or Economic Unit Income of WIC Participants by Participant Category and Migrant Status...................... 145
Exhibit 7.6: Distribution of Percent of Poverty Level of WIC Participants by Participant Category and Migrant Status ....................................................... 146

List of Exhibits
Contents xviii
Exhibit 7.7: Nutritional Risks Reported in at Least 15 Percent of Migrant Farmworker WIC Participants by Participant Category ................................ 148
Exhibit 7.8: Number and Percent of Migrant Farmworker WIC Participants with Specific Nutritional Risks Reported by Participant Category ....................... 149
Exhibit 7.9: Number and Percent of Anemic Migrant Farmworker WIC Participants by Participant Category ................................................................................. 152
Exhibit 7.10: Distribution of Infant and Child Migrant Farmworker WIC Participants According to Selected Anthropometric Measures ......................................... 153
Exhibit 7.11: Priority of Migrant Farmworker WIC Participants by Participant Category......................................................................................................... 154
Appendix A: Chapter Two Supplemental Tables
Exhibit A2.1 Number and Percent of WIC Participants by Participant Category by State ............................................................................................................... A-1
Exhibit A2.6a: Distribution of Race for WIC Participants Reporting Two or More Races.............................................................................................................. A-6
Exhibit A2.7a: Distribution of Racial and Ethnic Characteristics of WIC Participants, 1992 – 2008 ................................................................................................... A-7
Exhibit A2.7b: Distribution of Racial and Ethnic Characteristics of WIC Women, Infants, and Children 2004, 2006, 2008......................................................... A-8
Exhibit A2.8: Distribution of Race and Ethnicity of WIC Participants................................ A-9
Exhibit A2.9: Distribution of Race and Ethnicity of WIC Participants by Participant Category......................................................................................................... A-10
Appendix B: Chapter Three Supplemental Table
Exhibit B3.6 Distribution of Percent of Federal Poverty Level of WIC Participants by Participant Category 2002, 2004, 2006, 2008........................................... B-1
Appendix C: Chapter Six Supplemental Tables
Exhibit C6.1: Breastfeeding Initiation Rates for WIC Infants Aged Seven to Eleven Months in April 2008 by State....................................................................... C-1
Exhibit C6.2: Changes in Breastfeeding Initiation Rates for WIC Infants in April: 1998-2008........................................................................................... C-4
Exhibit C6.3: Breastfeeding Duration for WIC Infants Aged Seven to Eleven Months in April 2008 by State....................................................................... C-5
Exhibit C6.4: Estimated Breastfeeding Duration by State: Number and Percent of WIC Infants Aged Seven to Eleven Months in April 2008 Breastfeeding for Six Months or More .......................................................... C-8
List of Exhibits
Contents xix
Appendix D: Chapter Seven Supplemental Table
Exhibit D7.1: Distribution of Migrant WIC Participants by State ....................................... D-1
Appendix E: Supplemental Data Set
Exhibit E1: States Reporting Supplemental Data Set Items ............................................. E-1
Exhibit E2: Distribution of Birthweights for Infant and Child WIC Participants by State .......................................................................................................... E-2
Exhibit E3: Distribution of Birthweights for Infant and Child Migrant WIC Participants by State....................................................................................... E-4
Exhibit E4: Mean Birthweight in Grams of WIC Infants by Race by State ..................... E-6
Exhibit E5: Mean Birthweight in Grams of WIC Infants by Ethnicity by State............... E-12
Exhibit E6: Mean Birthweight in Grams of WIC Children by Race by State................... E-17
Exhibit E7: Mean Birthweight in Grams of WIC Children by Ethnicity by State ............ E-23
Exhibit E8: Length of Enrollment in WIC for Women WIC Participants for Most Recent Pregnancy from First WIC Certification to April 30, 2008 by Participant Category by State ........................................................................ E-28
Exhibit E9: Length of Enrollment in WIC for Infant and Child WIC Participants from First WIC Certification to April 30, 2008 by Age and by State............ E-40
Exhibit E10: Years of Education Reported by Women WIC Participants by Participant Category by State ........................................................................ E-50
Exhibit E11: Distribution of Total Number of Pregnancies for Pregnant Women WIC Participants by State.............................................................................. E-57
Exhibit E12: Distribution of Total Number of Live Births for Pregnant Women WIC Participants by State.............................................................................. E-59
Exhibit E13: Short Stature at Birth Among WIC Infants and Children by State Number and Percent at or Below 5th Percentile for Birth Length................. E-61
Exhibit E14: Number of Household Members Receiving WIC Benefits by Participant Category by State ........................................................................ E-63
Exhibit E15: Prepregnant Body Mass Index (BMI) for Pregnant WIC Women by State .......................................................................................................... E-71
Exhibit E16: Mean Weight Gain During Pregnancy for WIC Mothers by Race by State .......................................................................................................... E-73
Exhibit E17: Mean Weight Gain During Pregnancy for WIC Mothers by Ethnicity by State .......................................................................................................... E-79
Exhibit E18: Lapsed Time in Months Between Last and Current Pregnancies for Pregnant Women WIC Participants by State ................................................. E-85

Contents xx
Chapter One: Introduction 1
1. INTRODUCTION The Special Supplemental Nutrition Program for Women, Infants, and Children (WIC) is administered by the Food and Nutrition Service (FNS) of the US Department of Agriculture (USDA). WIC was established to counteract the negative effects of poverty on prenatal and pediatric health and provides a combination of direct nutritional supplementation, nutrition education and counseling, and increased access to health care and social service providers for pregnant, breastfeeding, and postpartum women; infants; and children up to the age of five years. By intervening during the prenatal period, WIC seeks to improve fetal development and reduce the incidence of low birthweight, short gestation, and maternal anemia. Infants and children who are at nutritional or health risk can receive supplemental foods, nutrition education, and access to health care to maintain and improve their health and development. The WIC Program was established in 1972 by an amendment to the Child Nutrition Act of 1966. WIC has vastly expanded since its inception, and, in April 2008, WIC enrolled 9.5 million participants at an annual cost of $6.2 billion.
Since 1988, FNS has produced biennial reports on WIC Program participant and program characteristics. FNS uses this regularly updated information for general program monitoring as well as for managing WIC’s information needs such as estimating budgets, submitting civil rights reports, identifying needs for research, and reviewing current and proposed WIC policies and procedures. The biennial reports include: Information on the income and nutritional risk characteristics of WIC participants. Breastfeeding initiation and duration by State. Data on WIC Program participation for migrant farm worker families. Other information on WIC participation that is deemed appropriate by the
Secretary of Agriculture. For purposes of the biennial reports, a WIC participant is defined as a person who is certified to receive WIC benefits in April including individuals who do not claim or use the food instruments issued during the time period.
Program Operations WIC services are delivered in each of the fifty States, American Samoa, the District of Columbia, Guam, the Northern Mariana Islands, Puerto Rico, and the American Virgin Islands. Additionally, in April 2008, thirty-four Indian tribal organizations (ITOs) served as State WIC agencies. Almost 1,900 local agencies (defined as the organizations one level below State WIC agencies) provide services to participants.1 Exhibit 1.1 presents information on the number of local service delivery agencies operated by the ninety State WIC agencies. Eight States serve just over half (51.5 percent) of all WIC participants.2 Two of these States—California and Texas—provide services to 27.3 percent of WIC participants.
1 Since PC2004 FNS and State WIC agencies have matched their definitions and databases of local agencies. This updating has led to a decrease in the reported number of local agencies. There has not been a decrease in participants served or services provided at local levels. 2 The eight States are: California, Florida, Georgia, Illinois, New York, Ohio, Pennsylvania, and Texas.
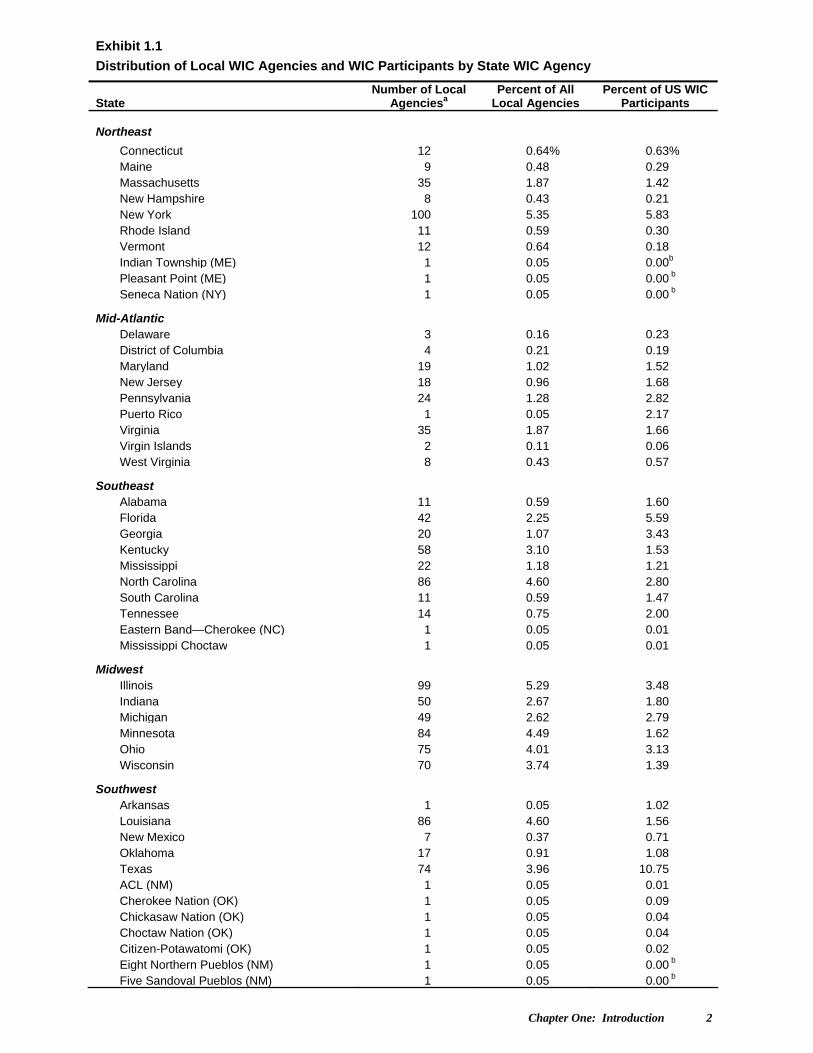
Chapter One: Introduction 2
Exhibit 1.1
Distribution of Local WIC Agencies and WIC Participants by State WIC Agency
State Number of Local
Agenciesa Percent of All
Local Agencies Percent of US WIC
Participants
Northeast
Connecticut 12 0.64% 0.63% Maine 9 0.48 0.29 Massachusetts 35 1.87 1.42 New Hampshire 8 0.43 0.21 New York 100 5.35 5.83 Rhode Island 11 0.59 0.30 Vermont 12 0.64 0.18 Indian Township (ME) 1 0.05 0.00b
Pleasant Point (ME) 1 0.05 0.00 b
Seneca Nation (NY) 1 0.05 0.00 b
Mid-Atlantic Delaware 3 0.16 0.23 District of Columbia 4 0.21 0.19 Maryland 19 1.02 1.52 New Jersey 18 0.96 1.68 Pennsylvania 24 1.28 2.82 Puerto Rico 1 0.05 2.17 Virginia 35 1.87 1.66 Virgin Islands 2 0.11 0.06 West Virginia 8 0.43 0.57
Southeast Alabama 11 0.59 1.60 Florida 42 2.25 5.59 Georgia 20 1.07 3.43 Kentucky 58 3.10 1.53 Mississippi 22 1.18 1.21 North Carolina 86 4.60 2.80 South Carolina 11 0.59 1.47 Tennessee 14 0.75 2.00 Eastern Band—Cherokee (NC) 1 0.05 0.01 Mississippi Choctaw 1 0.05 0.01
Midwest Illinois 99 5.29 3.48 Indiana 50 2.67 1.80 Michigan 49 2.62 2.79 Minnesota 84 4.49 1.62 Ohio 75 4.01 3.13 Wisconsin 70 3.74 1.39
Southwest Arkansas 1 0.05 1.02 Louisiana 86 4.60 1.56 New Mexico 7 0.37 0.71 Oklahoma 17 0.91 1.08 Texas 74 3.96 10.75 ACL (NM) 1 0.05 0.01 Cherokee Nation (OK) 1 0.05 0.09 Chickasaw Nation (OK) 1 0.05 0.04 Choctaw Nation (OK) 1 0.05 0.04 Citizen-Potawatomi (OK) 1 0.05 0.02 Eight Northern Pueblos (NM) 1 0.05 0.00 b
Five Sandoval Pueblos (NM) 1 0.05 0.00 b
Chapter One: Introduction 3
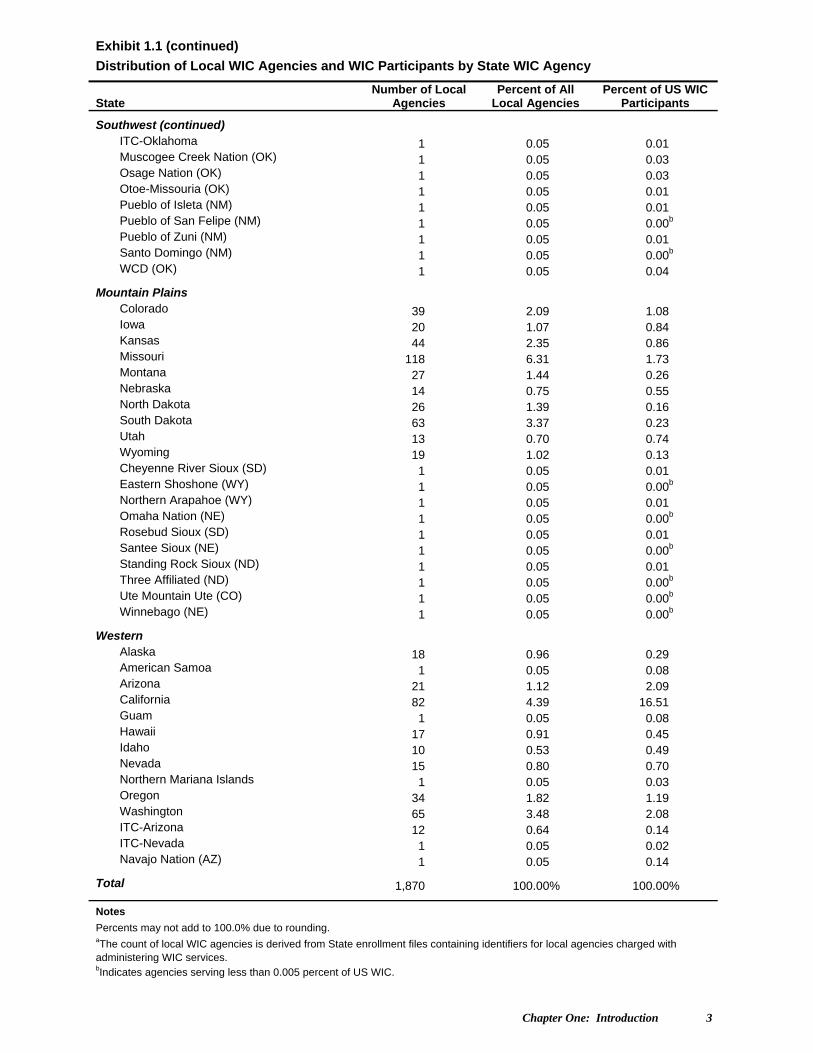
Exhibit 1.1 (continued)
Distribution of Local WIC Agencies and WIC Participants by State WIC Agency
State Number of Local
Agencies Percent of All
Local Agencies Percent of US WIC
Participants
Southwest (continued) ITC-Oklahoma 1 0.05 0.01 Muscogee Creek Nation (OK) 1 0.05 0.03 Osage Nation (OK) 1 0.05 0.03 Otoe-Missouria (OK) 1 0.05 0.01 Pueblo of Isleta (NM) 1 0.05 0.01 Pueblo of San Felipe (NM) 1 0.05 0.00b
Pueblo of Zuni (NM) 1 0.05 0.01 Santo Domingo (NM) 1 0.05 0.00b
WCD (OK) 1 0.05 0.04
Mountain Plains Colorado 39 2.09 1.08 Iowa 20 1.07 0.84 Kansas 44 2.35 0.86 Missouri 118 6.31 1.73 Montana 27 1.44 0.26 Nebraska 14 0.75 0.55 North Dakota 26 1.39 0.16 South Dakota 63 3.37 0.23 Utah 13 0.70 0.74 Wyoming 19 1.02 0.13 Cheyenne River Sioux (SD) 1 0.05 0.01 Eastern Shoshone (WY) 1 0.05 0.00b
Northern Arapahoe (WY) 1 0.05 0.01 Omaha Nation (NE) 1 0.05 0.00b
Rosebud Sioux (SD) 1 0.05 0.01 Santee Sioux (NE) 1 0.05 0.00b
Standing Rock Sioux (ND) 1 0.05 0.01 Three Affiliated (ND) 1 0.05 0.00b
Ute Mountain Ute (CO) 1 0.05 0.00b
Winnebago (NE) 1 0.05 0.00b
Western Alaska 18 0.96 0.29 American Samoa 1 0.05 0.08 Arizona 21 1.12 2.09 California 82 4.39 16.51 Guam 1 0.05 0.08 Hawaii 17 0.91 0.45 Idaho 10 0.53 0.49 Nevada 15 0.80 0.70 Northern Mariana Islands 1 0.05 0.03 Oregon 34 1.82 1.19 Washington 65 3.48 2.08 ITC-Arizona 12 0.64 0.14 ITC-Nevada 1 0.05 0.02 Navajo Nation (AZ) 1 0.05 0.14
Total 1,870 100.00% 100.00%
Notes
Percents may not add to 100.0% due to rounding. aThe count of local WIC agencies is derived from State enrollment files containing identifiers for local agencies charged with administering WIC services. bIndicates agencies serving less than 0.005 percent of US WIC.
Chapter One: Introduction 4
At the federal level, FNS and its seven administrative regional offices provide cash grants to State WIC agencies for nutrition services and program administration, set nutritional risk eligibility standards, issue regulations and monitor compliance with these regulations, offer technical assistance to States, and conduct studies of program operation and performance. State WIC agencies allocate funds to local WIC sponsoring agencies, monitor compliance with federal and State regulations, and supply technical assistance to local WIC agency staff. Within the national nutritional risk standards, States may use more restrictive criteria to define specific risks. Since 1987, State agencies have negotiated rebates provided by manufacturers of infant formula and juice that reduce food costs. These rebates are used by State and local WIC agencies to provide WIC services to larger numbers of eligible individuals.
Participant Benefits WIC seeks to improve the health of program participants by providing nutritious food
and nutrition education as adjuncts to good health care. The benefits provided by WIC are described below. Food Packages. Food or food instruments (vouchers, checks) are distributed to
participants to provide specific nutrients known to be lacking in the diets of target populations. FNS regulations specify WIC food packages that are designed for different categories of participants. These packages contain foods that are good sources of specific nutrients—protein, iron, calcium, and vitamins A and C. Infant food packages reflect the developmental needs of infants as well as pediatric recommendations on infant feeding. Other food packages incorporate into their contents the recommended eating patterns for preschool children and the special additional nutritional requirements of pregnant and breastfeeding women. In April 2005, the Institute of Medicine of the National Academies (IOM) released its report that reviewed WIC food packages in relation to most recent knowledge of human nutritional needs and recommended changes in the packages. FNS developed changes to the food packages based on the IOM recommendations but these were not implemented at the time data was collected for this report.
Most States operate food delivery systems through which WIC clients receive food instruments to purchase their supplemental foods at authorized local grocery stores. These checks or vouchers can be used only for food prescribed by health or nutrition professionals at local WIC agencies. These food items are specified on each WIC food instrument. In a few geographic areas, food is delivered to participant homes, or participants pick up food at specified distribution points. A small number of States operate both types of delivery systems. Over the past ten years, FNS has worked with volunteer WIC State Agencies in designing and testing electronic benefit transfer (EBT) for WIC benefits by using smartcards and on-line real time telecommunications. As of April 2008, five State agencies have implemented EBT statewide, one State agency is currently in the pilot phase and several others have plans to implement EBT in the near future.
Nutrition Education and Counseling. Nutrition education plays a crucial role in the WIC Program and is viewed as an essential benefit directed toward achieving positive changes in participant knowledge, attitudes, and behaviors about food consumption. FNS regulations require WIC service agencies to offer to participants (or their mothers or other care providers) at least two nutrition education sessions during each certification period. Participants may be counseled in one-on-one settings or attend group classes on a variety of health and nutrition-related topics. As part of nutrition education and counseling, breastfeeding is being promoted as the optimal source of infant nutrition.
Access to Health Care and Social Services. Each WIC agency refers WIC
participants to appropriate health care and social services. Through either
Chapter One: Introduction 5
the provision of on-site health services or referral to other agencies, the WIC Program serves as a link between the participant and an appropriate health-care provider or system. Since 1978, most local WIC agencies have referred clients to a variety of social services, including income support, child support and child care services, and substance abuse counseling. Coordination between WIC and social service programs was increased after 1989 when Federal law created adjunctive eligibility for WIC benefits based on eligibility for other programs.
Eligibility for WIC Eligibility for receipt of WIC benefits is based on three factors: categorical eligibility, Benefits income eligibility, and nutritional risk. First, a participant must be a member of certain
categorically eligible groups: women during pregnancy and up to the first six weeks after delivery; women up to one year postpartum if breastfeeding or up to six months postpartum if not breastfeeding; infants up to one year old; and children aged one through four years. Second, a participant must be income-eligible according to the income limit for eligibility set by the State of residency. This income limit may not exceed 185 percent or be less than 100 percent of the Department of Health and Human Services (HHS) poverty income guidelines, which are based on household size. As of July 2007, a person from a family of four, living within the forty-eight contiguous States, with an annual household income of $38,203 or less would be income-eligible for WIC benefits at the 185-percent threshold.3 All State WIC agencies set WIC income eligibility at 185 percent of poverty in April 2008. FNS regulations allow a WIC service provider to conclude that a participant is adjunctively income-eligible for WIC benefits through documentation of his/her or certain family members’ participation in Medicaid, TANF, or the Food Stamp Programs. Applicants may be similarly deemed automatically income-eligible for WIC based on participation in other means-tested programs whose income guidelines are at or below WIC guidelines. Beginning in October 1998, with passage of the William F. Goodling Child Nutrition Reauthorization Act of 1998 (Public Law 105-336), applicants not certified under adjunctive or automatic eligibility provisions were required to provide written proof of family income. Examples of documentation include current pay or unemployment stubs, earnings statements, and W-2 forms. Finally, each WIC participant must be determined to be at nutritional risk based on a medical and/or nutritional assessment by a competent professional authority such as a physician, nutritionist, nurse, or other health professional or paraprofessional. At a minimum, height (or length) and weight are recorded, and, with the exception of infants under nine months, a hematological test is administered to assess blood iron status. In response to recommendations made by the Institute of Medicine of the National Academy of Sciences, the WIC Program has adopted uniform nutrition risk criteria across the nation. Beginning in April 1999, FNS, in conjunction with the National WIC Association (formerly the National Association of WIC Directors), established approximately one hundred detailed risk criteria with applicable cut-off values for determining WIC nutritional risk eligibility. States have the option of implementing more stringent criteria; they cannot implement more lenient criteria. State and local agencies develop, within the national standards, appropriate screening systems to assess nutritional risk. Risk can be indicated by such factors as abnormal weight gain during pregnancy, a history of high-risk pregnancies, low birthweight, underweight, overweight, anemia, or an inadequate dietary pattern. Individuals who are adjunctively income-eligible for WIC because of participation in other qualifying means-tested programs must also be determined to be at nutritional risk in order to receive benefits.
3 The 2007 guidelines, in effect from July 1, 2007 until June 30, 2008, were used to determine income eligibility for most WIC participants enrolled in April 2008.
Chapter One: Introduction 6
Program Participation The WIC Program must operate within annual funding levels established by appropriation law. The number of participants served each year depends on total funds available as well as on FNS allocation of these funds to individual States. For each local agency, a maximum caseload is determined based on the agency's funding level and predicted caseload turnover. When a local WIC agency reaches this maximum participation level within available funding, a system of priorities is followed in allocating caseload “slots” to eligible applicants. Historically, some agencies maintained waiting lists of eligible applicants and, as WIC openings became available, filled them from their waiting lists. To assist State and local WIC providers, FNS has defined seven priority levels, based on applicant categorical status and type of nutritional risk. In general, the purpose of the existing priority system is to give precedence to medically based nutritional risks over risks based only on inadequate diet. Detailed information on priorities is presented in Chapter Five.
Previous Reports on FNS has published eleven previous reports on WIC participant and program WIC Participant and characteristics. In 1984 (PC84), 1988 (PC88), and 1990 (PC90), FNS and its Program Characteristics contractors conducted studies using nationally representative samples of WIC
participants. Data were obtained through mail surveys of State and local WIC agencies; record abstractions at local WIC service sites; and, in PC88, interviews with participants and follow-up data collection on food instrument pickup. PC84, conducted for FNS by Ebon Research Systems, collected data from twenty-eight State agencies, 204 local agencies, 356 service sites, and 6,444 participant records. Major findings addressed: The distribution of participants by participant category, by priority, and by income. The nutritional risks of WIC participants. State and local WIC agency coordination with health and social service programs. The methods, frequency, and types of nutrition education provided to WIC
participants. PC88, the second report on WIC Participant and Program Characteristics, was conducted by Research Triangle Institute. For this report, staff in State and local WIC agencies collected data and interviewed a nationally representative sample of approximately 7,000 WIC clients. A six-month followup data collection effort determined the rate of actual pickup of WIC food instruments. State and local WIC agencies were surveyed to gather information on WIC Program operations. PC88 reported on: The distribution of participants by participant category, by priority, by participation
in other programs, and by family income. The nutritional risks of WIC participants. State and local policies and agency coordination with health and social service
programs. Food package prescriptions. PC90 served as a transitional study that built on the PC84 and PC88 research designs while minimizing sample size to conserve research expenditures. A goal for PC90, and all future studies of WIC participant characteristics, was limiting burden on State WIC agencies to encourage continuing biennial participation in the WIC reporting system.
Chapter One: Introduction 7
For PC90, field researchers from Abt Associates abstracted data from a nationally representative sample of 2,343 participant records. All State WIC agencies were surveyed to obtain information on WIC Program operations. The methodology used for PC2008 was first developed for the 1992 report. The 1992 report on WIC Participant and Program Characteristics (PC92) was substantially different from earlier reports with regard to collecting data on WIC participation. FNS developed a prototype reporting system that allows acquisition of all participation data through the automated transfer of an agreed-upon set of data elements. State WIC agencies download routinely collected information from their existing automated client and management information systems. State and local WIC staff members obtain these data to certify applicant eligibility for WIC benefits, to guide nutrition education, and to issue food instruments. This Minimum Data Set (MDS) was developed by FNS working with the Information Committee of the National WIC Association and the Centers for Disease Control and Prevention (CDC). The MDS, which consists of twenty items, appears in Exhibit 1.2. The specifications also include an eleven-item Supplemental Data Set (SDS), shown in Exhibit 1.3. State agencies provide these data if they are available.
Report on WIC For the reference month of April 2008, each State WIC agency was asked to submit Participant and Program MDS data on a census of individuals enrolled in WIC. For the purposes of this report, a Characteristics 2008 WIC participant is defined as a person who is certified to receive WIC benefits in April,
including individuals who did not claim or use the food instruments prescribed during the time period. In contrast, FNS administrative data on WIC participation are based on food instruments picked up. Comparing April 2008 voucher issuance data (8,705,976) with April 2008 enrollment data (9,540,481 enrollees) suggests that 91 percent of WIC enrollees pick up their monthly benefits. Since 1984, these findings on actual use of WIC benefits have remained consistent. In April 2008, there were ninety State WIC agencies: the fifty States, American Samoa, the District of Columbia, Guam, the Northern Mariana Islands, Puerto Rico, and the American Virgin Islands, along with thirty-four Indian Tribal Organizations (ITOs). PC2008 data were submitted by 90 State WIC agencies, and all reporting agencies reported on a census of their WIC participants.4 PC2008 describes the 9.5 million individuals certified as eligible for WIC benefits in April 2008. Actual WIC enrollment by State is mapped in Exhibit 1.4. The State-maintained automated information systems that are the sources of data for PC2008 do not always contain complete information on every individual enrolled in the WIC Program. To account for this anomaly, all of the tables in this publication, with the exception of breastfeeding tables, include columns or rows labeled “not reported.” These figures indicate the numbers and percentages of WIC participants for whom States could not provide information on specific items.
4 Data from Delaware, Guam, and Oklahoma were weighted to deal with underreporting or overreporting of WIC participants in some or all certification categories; decisions based on comparisons to administrative data and input from State WIC agencies. Due to management information system constraints, five State agencies provided data for a month other than April 2008. These State agencies and the reference months are: American Samoa (August 2008), Citizen-Potawatomi (September 2008), Colorado (May 2008), Guam (September 2008), and Rhode Island (May 2008).
Chapter One: Introduction 8
Exhibit 1.2 Minimum Data Set Variables and Definitions: Guidance to State WIC Agencies For biennial reports on WIC Participant and Program Characteristics, the term participant means a person on WIC master lists or a person listed in WIC operating files who is certified to receive WIC benefits in April 2008. The data items should reflect the participant's status on each item at the time of the most recent WIC Program certification as of April 2008. However, as a convenience to State agencies that do not maintain historical files and that update the information in their automated systems during certification periods, current information that is on the file for each participant in April 2008 will be accepted. 1. State Agency ID A unique number that permits linkage to the WIC State agency where the
participant was certified. It is the first seven digits of the ten-digit Local Agency code maintained by FNS in the WIC Local Agency Directory (WIC LAD).
2a. Local Agency ID A unique number that permits linkage to the local agency where the
participants were certified as eligible for WIC benefits. It is the last three digits of the ten-digit Local Agency Code maintained by FNS in WIC LAD.
2b. Service Site ID A unique number that permits linkage to the service site where the participant
was certified. For States that submitted service site or clinic-level data for WIC LAD, service site IDs appear in WIC LAD as the three-digit codes under Administering Agency.
Special Note: For PC2008, Service Site ID is not a substitute for Local Agency ID (item 2a.
above). 3. Case ID A unique record number for each participant which maintains individual privacy at the
national level. This should not be the case number of the participant as listed in State-held files. 4. Date of Birth Month, day, and year of participant's birth reported in MMDDYYYY format. 5. Race/Ethnicity This categorization requires classification of participants based on ethnicity as
well as race. The two ethnic categories are Hispanic/Latino or Not Hispanic/Latino. The five racial categories, as required by OMB, are: American Indian or Alaskan Native; Asian; Black or African American; Native Hawaiian or Other Pacific Islander; or White. One or more racial categories may be selected.
States may report race/ethnicity using one of two formats:
yes/no for each of the categories resulting in a six (6) digit code (1=yes; 2=no), or three (3) digits to represent key combinations of racial selections with the first digit
representing ethnicity and the last two representing race combinations. 6a. Certification Category The category—one of five (5) possible categories—under which a
person is certified as eligible for WIC benefits: pregnant woman; breastfeeding woman; postpartum woman (not breastfeeding); infant (under 12 months); or child (12-59 months).
6b-c. Expected Date of Delivery or Weeks Gestation For pregnant women, the projected date of
delivery (MMDDYYYY format) or the number of weeks since the last menstrual period as determined at WIC Program certification.

Chapter One: Introduction 9
Exhibit 1.2 (continued) Minimum Data Set Variables and Definitions: Guidance to State WIC Agencies 7. Date of Certification The date the person was declared eligible for the most current WIC
Program certification as of April 2008. Month, day, and year should be reported in MMDDYYYY format.
8. Sex For infants and children, male or female. 9. Risk Priority Code Participant priority level for WIC Program certification at the time of the
most recent WIC Program certification as of April 2008. 10a-c. Participation in TANF, Food Stamps, Medicaid The participant's reported participation in each
of these programs at the time of the most recent WIC Program certification as of April 2008. 11. Migrant Status Participant migrant status according to the federal WIC Program definition of a
migrant farmworker (currently counted in the FNS 498 report). 12. Number in Family or Economic Unit The number of persons in the family or economic unit
upon which WIC income eligibility was based. A self-declared number in the family or economic unit may be reported for participants whose
income was not required to be determined as part of the WIC certification process. These participants include adjunctively income-eligible participants (due to TANF, Food Stamp Program, or Medicaid participation) and those participants deemed income eligible under optional procedures available to the State Agency in Federal WIC Regulations, Section 246.7(d)(2)(vi-viii) (means tested programs identified by the State for automatic WIC Program income eligibility, income eligibility of pregnant women, and income eligibility of Indian and instream migrant farmworker applicants).
13a-c. Family or Economic Unit Income 1. For persons for whom income is determined during the certification process, the income
amount that was determined to qualify them for the WIC Program during the most recent certification as of April 2008.
FNS will convert income expressed in different measures (weekly, monthly, yearly, etc.) to
annual amounts. 2. For descriptive purposes only, for participants whose income was not required to be
determined as part of the WIC Program certification process, the self-reported income at time of certification. These participants include adjunctively income-eligible participants and those persons deemed eligible under optional procedures available to the State Agency in Federal WIC Regulations, Section 246.7(d)(2)(vi-viii).
Zero should not be used to indicate income values that are missing or not available. Zero
should indicate only an actual value of zero. Special Note: Due to the large proportion of WIC participants who are adjunctively income
eligible, their income information is essential to describe income among the overall WIC population. States are required to provide income information on those adjunctively eligible for WIC according to Federal WIC Regulation, section 246.7.
Chapter One: Introduction 10
Exhibit 1.2 (continued) Minimum Data Set Variables and Definitions: Guidance to State WIC Agencies 14a-j. Nutritional Risks Present at Certification The ten highest priority nutritional risks present at
the WIC Program certification current in April 2008. Uniform coding is required in submissions from all States, according to WIC Policy Memorandum 98-9.
15a-b. Hemoglobin or Hematocrit That value for the measure of iron status that applies to the WIC
Program certification current in April 2008. 15c. Date of Blood Test Month, day and year blood measure was collected and reported in
MMDDYYYY format. This is required for all participants reporting a blood measure. 16a-b. Weight The participant's weight measured according to the CDC nutrition surveillance program
standards [nearest one-quarter (¼) pound]. If weight is not collected in pounds and quarter pounds, weight may be reported in grams.
17a-b. Height The participant's height (or length) measured according to the CDC nutrition surveillance
program standards [nearest one-eighth (1/8) inch]. If height is not collected in inches and eighth inches, height may be reported in centimeters.
18. Date of Height and Weight Measure The date of the height and weight measures that were used
during the most recent WIC Program certification period as of April 2008 in MMDDYYYY format.
19a. Currently Breastfed For infants and children ages six through thirteen months in April 2008,
whether or not the participant is currently receiving breastmilk. 19b. Ever Breastfed For infants and children ages six through thirteen months in April 2008, whether
or not the participant ever received breastmilk. 19c. Length of Time Breastfed For infants and children ages six through thirteen months in April
2008, the number of weeks the participant received breastmilk. 19d. Date Breastfeeding Data Collected For infants and children ages six through thirteen months in
April 2008, the date on which breastfeeding status was reported in MMDDYYYY format. 20a-n. Food Codes States have the option of providing food data in a food package format or in an
item-quantity format. The food package codes or item codes and quantities for all food prescribed for the participant during the month of April 2008.
Chapter One: Introduction 11
Exhibit 1.3 Supplemental Data Set Variables and Definitions: Guidance to State WIC Agencies The data items listed below are included in the Supplemental Data Set. States that are currently collecting these items should include them in April data submissions. For biennial reports on WIC Participant and Program Characteristics, the term participant means a person on WIC master lists or a person listed in WIC operating files who is certified to receive WIC benefits in April 2008. The data items should reflect the participant's status on each item at the time of the most recent WIC Program certification as of April 2008. However, as a convenience to State agencies that do not maintain historical files and that update the information in their automated systems during certification periods, current information that is on the file for each participant in April 2008 was accepted. 21. Date of First WIC Certification Date the participant was first certified for the WIC Program in
MMDDYYYY format. For pregnant, breastfeeding and postpartum women this applies to the current/most recent pregnancy and not to prior pregnancies.
22. Education Level For pregnant, breastfeeding and postpartum women, the highest grade or year
of school completed. For infants and children, the highest grade or year of school completed by mother or primary caretaker.
23. Number in Household in WIC The number of people in the participant's household receiving
WIC benefits. 24. Date Previous Pregnancy Ended For pregnant women, the date that the previous pregnancy
ended in MMDDYYYY format. 25. Total Number of Pregnancies For pregnant women, the total number of times the woman has
been pregnant, including this pregnancy, all live births and any pregnancies resulting in miscarriage, abortion or stillbirth.
26. Total Number of Live Births For pregnant women, the total number of babies born alive to this
woman, including babies who may have died shortly after birth. 27a-b. Prepregnancy Weight For pregnant women only, the participant's weight immediately prior to
pregnancy. Prepregnancy weight may be reported either in pounds and ounces, or in grams. 28a-b. Weight Gain During Pregnancy For breastfeeding and postpartum women, the participant's
weight gain during pregnancy as taken immediately at or prior to delivery. Weight gain during pregnancy may be reported in either pounds and ounces, or in grams.
29a-b. Birth Weight For infants and children, the participant's weight at birth measured according to
CDC nutrition surveillance program standards (lbs/ounces). Birth weight may be reported in either pounds and ounces, or in grams.
Chapter One: Introduction 12
Exhibit 1.3 (continued) Supplemental Data Set Variables and Definitions: Guidance to State WIC Agencies 30a-b. Birth Length For infants and children, the participant's length measured according to CDC
nutrition surveillance program standards (nearest 1/8 inches). Birth length may be reported in either inches and eighth inches, or in centimeters.
31. Participation in the Food Distribution on Indian Reservations program The participant's
reported participation in this program at the time of the most recent WIC Program certification as of April 2008.

Chapter One: Introduction 13
United StatesWIC Enrollment by State
220,000 – 1,600,000 (11)120,000 – 220,000 (16)70,000 – 120,000 (8)30,000 – 70,000 (6)10,000 – 30,000 (11)
For this exhibit, ITO participation counts are included in total State participation counts. Also, four State WIC agencies with fewer than 10,000 participants, American Samoa (7,362), the American Virgin Islands (5,681), Guam (7,560), and the Northern Mariana Islands (2,598) are omitted from this map.
Exhibit 1.4WIC Enrollment, April 2008
Alaska
Hawaii
Puerto Rico
United StatesWIC Enrollment by State
220,000 – 1,600,000 (11)120,000 – 220,000 (16)70,000 – 120,000 (8)30,000 – 70,000 (6)10,000 – 30,000 (11)
For this exhibit, ITO participation counts are included in total State participation counts. Also, four State WIC agencies with fewer than 10,000 participants, American Samoa (7,362), the American Virgin Islands (5,681), Guam (7,560), and the Northern Mariana Islands (2,598) are omitted from this map.
Exhibit 1.4WIC Enrollment, April 2008
Alaska
Hawaii
Puerto RicoPuerto Rico
Chapter One: Introduction 14
For PC2008, most State agencies provided information on each MDS item for each participant, and overall reporting has improved substantially over time. Nonetheless, rates of unreported data remain high for two items. Data on income were submitted for 90 percent of the 9.5 million WIC participants. Fifteen State WIC agencies—Alabama, Connecticut, District of Columbia, Kentucky, Minnesota, the Northern Mariana Islands, Rhode Island, Tennessee, and seven Indian Tribe Organizations (ITOs)—provided income data for fewer than 70 percent of their WIC participants. Similarly, PC2008 contains blood measurement data for only 86 percent of WIC women participants. In addition, information on blood measurements for infants and children may be absent from a State database. WIC regulations permit clinics to dispense with blood tests for infants under nine months of age, as well as for children over two years of age who were within normal ranges at their most recent prior certifications. PC2008 data may be unreported for a variety of reasons, some of which may indicate that participants in the not-reported category may be different from those individuals with data reported. To account for these anomalies, a uniform strategy has been adopted for preparing all tables in this report. Data not reported are included in the calculation of percentage distributions for each characteristic. While including missing data in the denominators for all calculations tends to place estimates for each characteristic at a lower bound, this approach has allowed consistent presentation of tabulations throughout the report. Further, it assures that all information needed to calculate upper-bound estimates is readily available in every table. Caution should be used in comparing results across groups or over time. Missing data must always be considered in gauging differences among groups or categories of WIC participants or in analyzing trends across years. The SDS includes such items as birthweight, birth length, and pre-pregnancy weight. Seventy-six State WIC agencies (84 percent) provided some SDS data for PC2008. The three largest States, California, New York, and Texas (accounting for 33.1 percent of WIC participants), did not report any SDS data, which limits the completeness of SDS reporting. The most frequently reported SDS items were: pre-pregnancy weight, submitted by 68 agencies, representing 53.3 percent of pregnant WIC participants; date of first WIC certification, submitted by 68 agencies, covering 50.1 percent of WIC participants; and birthweight, submitted by 53 State agencies, representing 43.6 percent of WIC infants and children. The limited amount and incompleteness of SDS data preclude computation of national estimates. Appendix E of this report presents a series of tables reporting State-level data for those States submitting SDS information. A list of State agencies supplying any SDS data is also included in the appendix.
Organization of This Chapters Two through Seven contain tabular presentations which display PC2008 data Report on WIC participants and programs. Tables are accompanied by limited text, which is
provided only to explain WIC procedures or to distinguish changes in the characteristics of WIC programs and participants that have occurred over time. Chapter Two presents information on overall participation in the WIC Program as well as demographic data on WIC participants. Chapter Three offers information on receipt of benefits from programs other than WIC, household size, average annual income, and income relative to poverty of WIC households. Chapter Four provides information on nutritional risk, and Chapter Five describes WIC priority groups. Chapter Six provides information on breastfeeding initiation and duration. Finally, Chapter Seven contains information on migrant WIC participants.
Chapter Two: Overview of WIC Participation and Demographics of WIC Participants 15
2. OVERVIEW OF WIC PARTICIPATION AND DEMOGRAPHICS OF WIC PARTICIPANTS
During April 2008, there were 9,540,481 individuals enrolled in the WIC Program (Exhibit 2.1). For purposes of participant characteristics reporting, WIC participants are defined as persons certified to receive WIC benefits in April 2008, including individuals who did not claim or use the food instruments issued. This definition differs from the participation measure used in FNS administrative data, which is based on numbers of participants who pick up their food instruments. Following a decade of relatively slow growth, WIC enrollment has grown rapidly over the past two years, increasing by 8.7 percent between 2006 and 2008 (Exhibit 2.1). For the entire 10 year span between 1996 and 2006, in contrast, the increase in enrollment was only 13.2 percent (Exhibit 2.2). The last major expansion in WIC occurred between 1992 and 1996 when enrollment increased by 34.6 percent over a four year period.1 About half (49.5%) of all WIC participants are children, about a quarter (25.5%) are infants, and a quarter (25.0%) are pregnant, breastfeeding, and other postpartum women. The rapid growth in the WIC program over the past two years was concentrated in three certification categories: breastfeeding women (12.2 percent increase), other postpartum women (11.5 percent increase) and children (10.0 percent increase. Growth in the other two categories, pregnant women and infants, was only 3.2 and 7.0 percent, respectively. Over time, the proportion of breastfeeding women in the WIC population has increased steadily, from 3.6 percent in 1992 to 6.9 percent in 2008 (Exhibit 2.2). The proportion of pregnant women declined from 13.6 percent in 1992 to 11.3 percent in 1996 but has remained fairly consistent since then. The percentage of infants also declined between 1992 and 1996, from 30.1 percent to 25.7 percent as the rest of the program grew; infant participation has remained essentially stable since 1996.
Demographics Demographic items in the Minimum Data Set are age, trimester of enrollment during pregnancy, and race/ethnicity of WIC participants. Data for April 2008, along with the distribution of WIC participants by region, are displayed in Exhibits 2.3 through 2.10. For PC2008, States reported age data on almost all women, infants, and children enrolled in the WIC Program (Exhibit 2.3). Most WIC women (85.5 percent) are between the ages of eighteen and thirty-four. While the age distributions for pregnant and postpartum women are similar, breastfeeding women tend to be older, with 11.5 percent over thirty-four years of age. Since 1992, there has been a steady decline in the proportion of total WIC women participants under age 18from 10.6 percent in 1992 to 6.1 percent in 2008. The proportion of WIC women aged 18-34 and aged 35 and older rose steadily between 1992 and 2002, but those proportions have shown little or no changes during the past six years. Most WIC infants (91.7 percent) are aged zero to three months at time of certification. This proportion has shown only slight increase since 1998. The clustering of infants in the zero-to-three-month-old category increased steadily between 1992, when 76.2 percent of infants were less than three months old at certification, and 1998. The age distribution of children has also remained fairly stable since 1998. Between 1992 and 1996, the age distribution of children showed slight shifts to the older ages. During that period, as the WIC Program expanded, enrollment of children three years or older increased by eight percentage points from 30.0 percent to 38.1 percent.
1 PC2008 enrollment data by State are presented in Exhibit A2.1 in Appendix A. Comparable data for 2006 appear in the PC2006 report.
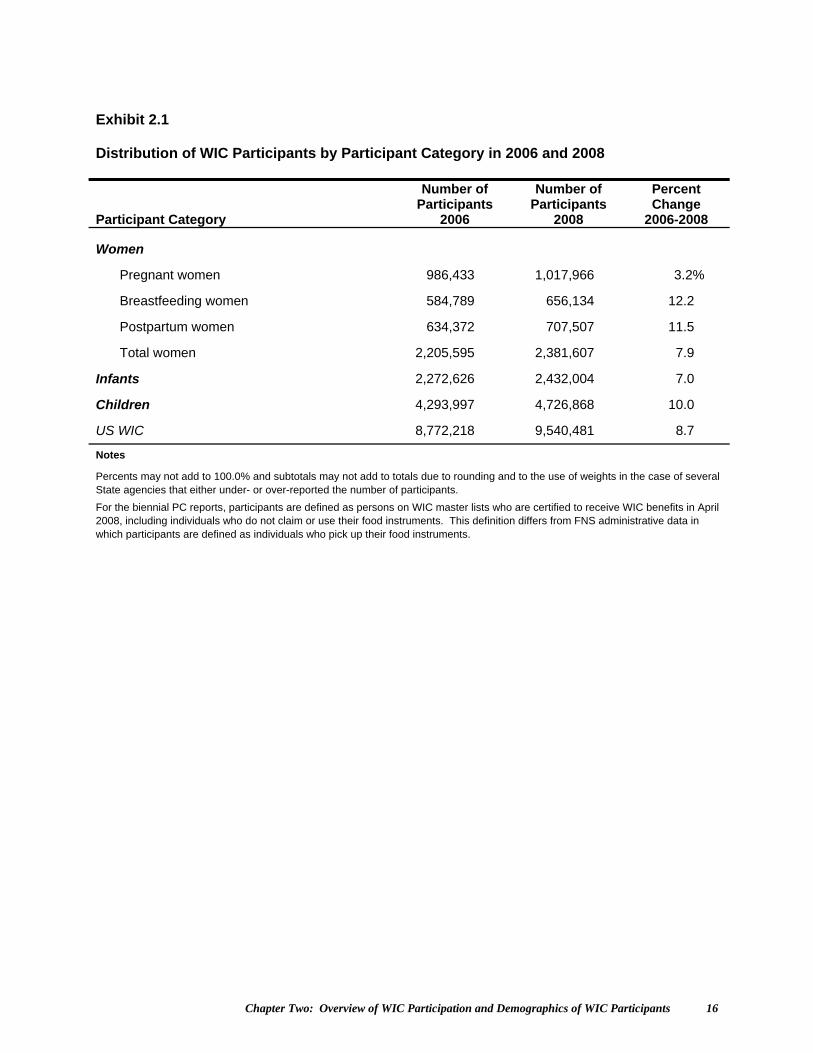
Chapter Two: Overview of WIC Participation and Demographics of WIC Participants 16
Exhibit 2.1 Distribution of WIC Participants by Participant Category in 2006 and 2008
Participant Category
Number of Participants
2006
Number of Participants
2008
Percent Change
2006-2008
Women
Pregnant women 986,433 1,017,966 3.2%
Breastfeeding women 584,789 656,134 12.2
Postpartum women 634,372 707,507 11.5
Total women 2,205,595 2,381,607 7.9
Infants 2,272,626 2,432,004 7.0
Children 4,293,997 4,726,868 10.0
US WIC 8,772,218 9,540,481 8.7
Notes
Percents may not add to 100.0% and subtotals may not add to totals due to rounding and to the use of weights in the case of several State agencies that either under- or over-reported the number of participants.
For the biennial PC reports, participants are defined as persons on WIC master lists who are certified to receive WIC benefits in April 2008, including individuals who do not claim or use their food instruments. This definition differs from FNS administrative data in which participants are defined as individuals who pick up their food instruments.
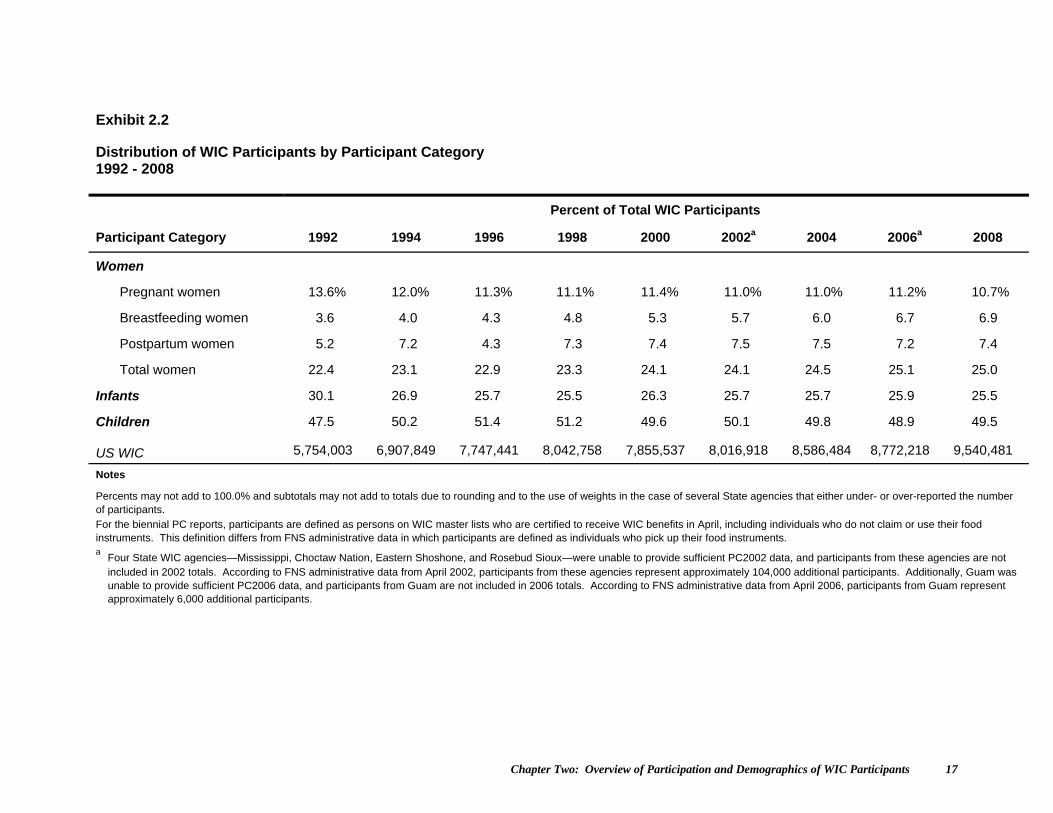
Chapter Two: Overview of Participation and Demographics of WIC Participants 17
Exhibit 2.2 Distribution of WIC Participants by Participant Category 1992 - 2008
Percent of Total WIC Participants
Participant Category 1992 1994 1996 1998 2000 2002a 2004 2006a 2008
Women
Pregnant women 13.6% 12.0% 11.3% 11.1% 11.4% 11.0% 11.0% 11.2% 10.7%
Breastfeeding women 3.6 4.0 4.3 4.8 5.3 5.7 6.0 6.7 6.9
Postpartum women 5.2 7.2 4.3 7.3 7.4 7.5 7.5 7.2 7.4
Total women 22.4 23.1 22.9 23.3 24.1 24.1 24.5 25.1 25.0
Infants 30.1 26.9 25.7 25.5 26.3 25.7 25.7 25.9 25.5
Children 47.5 50.2 51.4 51.2 49.6 50.1 49.8 48.9 49.5
US WIC 5,754,003 6,907,849 7,747,441 8,042,758 7,855,537 8,016,918 8,586,484 8,772,218 9,540,481
Notes
Percents may not add to 100.0% and subtotals may not add to totals due to rounding and to the use of weights in the case of several State agencies that either under- or over-reported the number of participants. For the biennial PC reports, participants are defined as persons on WIC master lists who are certified to receive WIC benefits in April, including individuals who do not claim or use their food instruments. This definition differs from FNS administrative data in which participants are defined as individuals who pick up their food instruments. a Four State WIC agencies—Mississippi, Choctaw Nation, Eastern Shoshone, and Rosebud Sioux—were unable to provide sufficient PC2002 data, and participants from these agencies are not
included in 2002 totals. According to FNS administrative data from April 2002, participants from these agencies represent approximately 104,000 additional participants. Additionally, Guam was unable to provide sufficient PC2006 data, and participants from Guam are not included in 2006 totals. According to FNS administrative data from April 2006, participants from Guam represent approximately 6,000 additional participants.
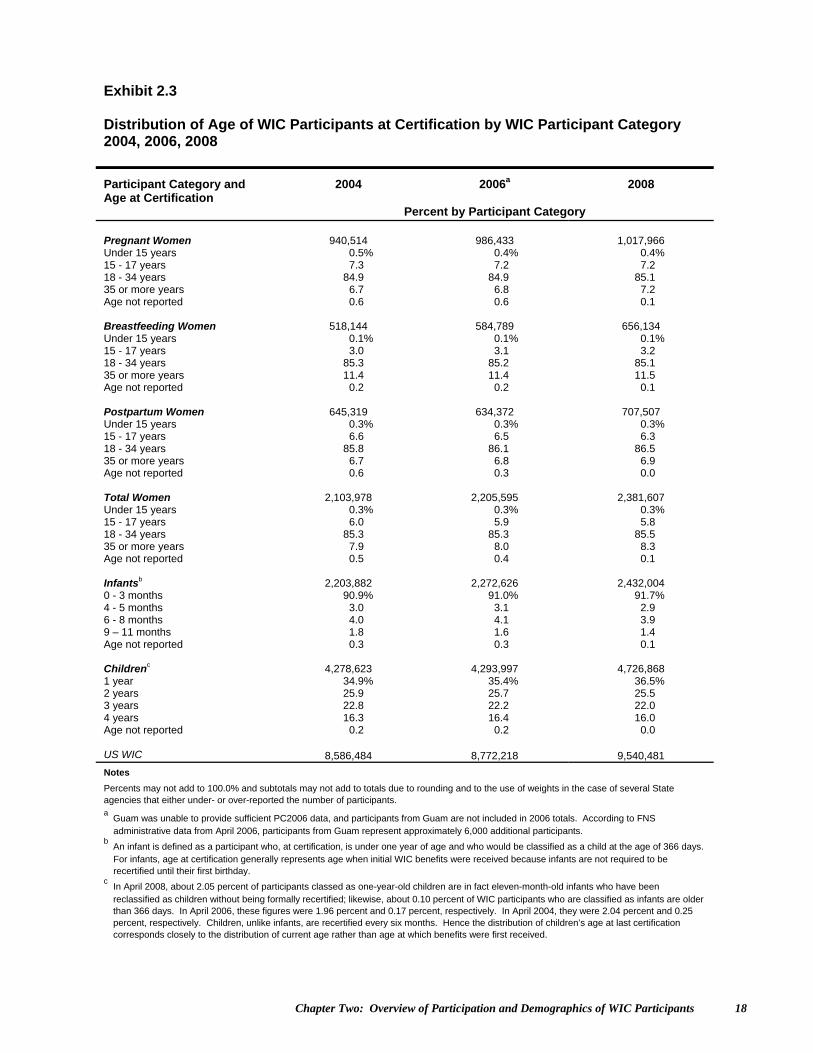
Chapter Two: Overview of Participation and Demographics of WIC Participants 18
Exhibit 2.3 Distribution of Age of WIC Participants at Certification by WIC Participant Category 2004, 2006, 2008
Participant Category and Age at Certification
2004 2006a 2008
Percent by Participant Category Pregnant Women 940,514 986,433 1,017,966 Under 15 years 0.5% 0.4% 0.4% 15 - 17 years 7.3 7.2 7.2 18 - 34 years 84.9 84.9 85.1 35 or more years 6.7 6.8 7.2 Age not reported 0.6 0.6 0.1 Breastfeeding Women 518,144 584,789 656,134 Under 15 years 0.1% 0.1% 0.1% 15 - 17 years 3.0 3.1 3.2 18 - 34 years 85.3 85.2 85.1 35 or more years 11.4 11.4 11.5 Age not reported 0.2 0.2 0.1 Postpartum Women 645,319 634,372 707,507 Under 15 years 0.3% 0.3% 0.3% 15 - 17 years 6.6 6.5 6.3 18 - 34 years 85.8 86.1 86.5 35 or more years 6.7 6.8 6.9 Age not reported 0.6 0.3 0.0 Total Women 2,103,978 2,205,595 2,381,607 Under 15 years 0.3% 0.3% 0.3% 15 - 17 years 6.0 5.9 5.8 18 - 34 years 85.3 85.3 85.5 35 or more years 7.9 8.0 8.3 Age not reported 0.5 0.4 0.1 Infantsb 2,203,882 2,272,626 2,432,004 0 - 3 months 90.9% 91.0% 91.7% 4 - 5 months 3.0 3.1 2.9 6 - 8 months 4.0 4.1 3.9 9 – 11 months 1.8 1.6 1.4 Age not reported 0.3 0.3 0.1 Childrenc 4,278,623 4,293,997 4,726,868 1 year 34.9% 35.4% 36.5% 2 years 25.9 25.7 25.5 3 years 22.8 22.2 22.0 4 years 16.3 16.4 16.0 Age not reported 0.2 0.2 0.0 US WIC 8,586,484 8,772,218 9,540,481
Notes
Percents may not add to 100.0% and subtotals may not add to totals due to rounding and to the use of weights in the case of several State agencies that either under- or over-reported the number of participants. a Guam was unable to provide sufficient PC2006 data, and participants from Guam are not included in 2006 totals. According to FNS administrative data from April 2006, participants from Guam represent approximately 6,000 additional participants.
b An infant is defined as a participant who, at certification, is under one year of age and who would be classified as a child at the age of 366 days. For infants, age at certification generally represents age when initial WIC benefits were received because infants are not required to be recertified until their first birthday.
c In April 2008, about 2.05 percent of participants classed as one-year-old children are in fact eleven-month-old infants who have been
reclassified as children without being formally recertified; likewise, about 0.10 percent of WIC participants who are classified as infants are older than 366 days. In April 2006, these figures were 1.96 percent and 0.17 percent, respectively. In April 2004, they were 2.04 percent and 0.25 percent, respectively. Children, unlike infants, are recertified every six months. Hence the distribution of children’s age at last certification corresponds closely to the distribution of current age rather than age at which benefits were first received.
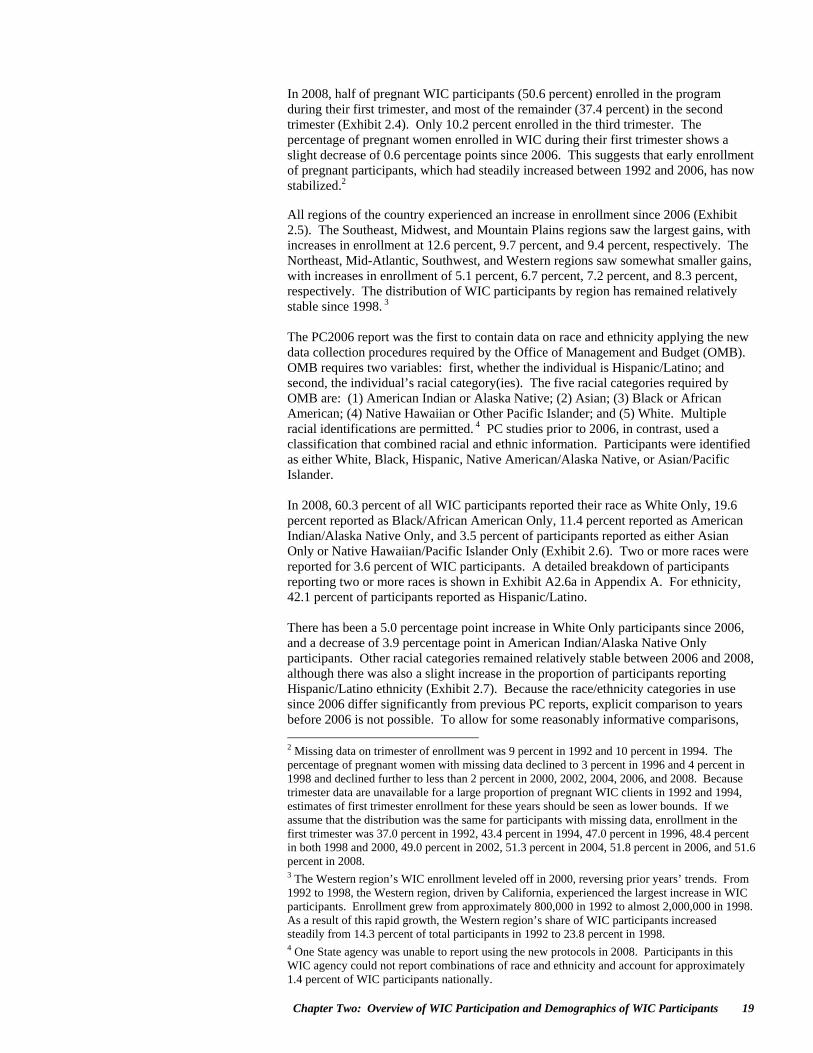
Chapter Two: Overview of WIC Participation and Demographics of WIC Participants 19
In 2008, half of pregnant WIC participants (50.6 percent) enrolled in the program during their first trimester, and most of the remainder (37.4 percent) in the second trimester (Exhibit 2.4). Only 10.2 percent enrolled in the third trimester. The percentage of pregnant women enrolled in WIC during their first trimester shows a slight decrease of 0.6 percentage points since 2006. This suggests that early enrollment of pregnant participants, which had steadily increased between 1992 and 2006, has now stabilized.2 All regions of the country experienced an increase in enrollment since 2006 (Exhibit 2.5). The Southeast, Midwest, and Mountain Plains regions saw the largest gains, with increases in enrollment at 12.6 percent, 9.7 percent, and 9.4 percent, respectively. The Northeast, Mid-Atlantic, Southwest, and Western regions saw somewhat smaller gains, with increases in enrollment of 5.1 percent, 6.7 percent, 7.2 percent, and 8.3 percent, respectively. The distribution of WIC participants by region has remained relatively stable since 1998. 3 The PC2006 report was the first to contain data on race and ethnicity applying the new data collection procedures required by the Office of Management and Budget (OMB). OMB requires two variables: first, whether the individual is Hispanic/Latino; and second, the individual’s racial category(ies). The five racial categories required by OMB are: (1) American Indian or Alaska Native; (2) Asian; (3) Black or African American; (4) Native Hawaiian or Other Pacific Islander; and (5) White. Multiple racial identifications are permitted. 4 PC studies prior to 2006, in contrast, used a classification that combined racial and ethnic information. Participants were identified as either White, Black, Hispanic, Native American/Alaska Native, or Asian/Pacific Islander. In 2008, 60.3 percent of all WIC participants reported their race as White Only, 19.6 percent reported as Black/African American Only, 11.4 percent reported as American Indian/Alaska Native Only, and 3.5 percent of participants reported as either Asian Only or Native Hawaiian/Pacific Islander Only (Exhibit 2.6). Two or more races were reported for 3.6 percent of WIC participants. A detailed breakdown of participants reporting two or more races is shown in Exhibit A2.6a in Appendix A. For ethnicity, 42.1 percent of participants reported as Hispanic/Latino. There has been a 5.0 percentage point increase in White Only participants since 2006, and a decrease of 3.9 percentage point in American Indian/Alaska Native Only participants. Other racial categories remained relatively stable between 2006 and 2008, although there was also a slight increase in the proportion of participants reporting Hispanic/Latino ethnicity (Exhibit 2.7). Because the race/ethnicity categories in use since 2006 differ significantly from previous PC reports, explicit comparison to years before 2006 is not possible. To allow for some reasonably informative comparisons, 2 Missing data on trimester of enrollment was 9 percent in 1992 and 10 percent in 1994. The percentage of pregnant women with missing data declined to 3 percent in 1996 and 4 percent in 1998 and declined further to less than 2 percent in 2000, 2002, 2004, 2006, and 2008. Because trimester data are unavailable for a large proportion of pregnant WIC clients in 1992 and 1994, estimates of first trimester enrollment for these years should be seen as lower bounds. If we assume that the distribution was the same for participants with missing data, enrollment in the first trimester was 37.0 percent in 1992, 43.4 percent in 1994, 47.0 percent in 1996, 48.4 percent in both 1998 and 2000, 49.0 percent in 2002, 51.3 percent in 2004, 51.8 percent in 2006, and 51.6 percent in 2008. 3 The Western region’s WIC enrollment leveled off in 2000, reversing prior years’ trends. From 1992 to 1998, the Western region, driven by California, experienced the largest increase in WIC participants. Enrollment grew from approximately 800,000 in 1992 to almost 2,000,000 in 1998. As a result of this rapid growth, the Western region’s share of WIC participants increased steadily from 14.3 percent of total participants in 1992 to 23.8 percent in 1998. 4 One State agency was unable to report using the new protocols in 2008. Participants in this WIC agency could not report combinations of race and ethnicity and account for approximately 1.4 percent of WIC participants nationally.
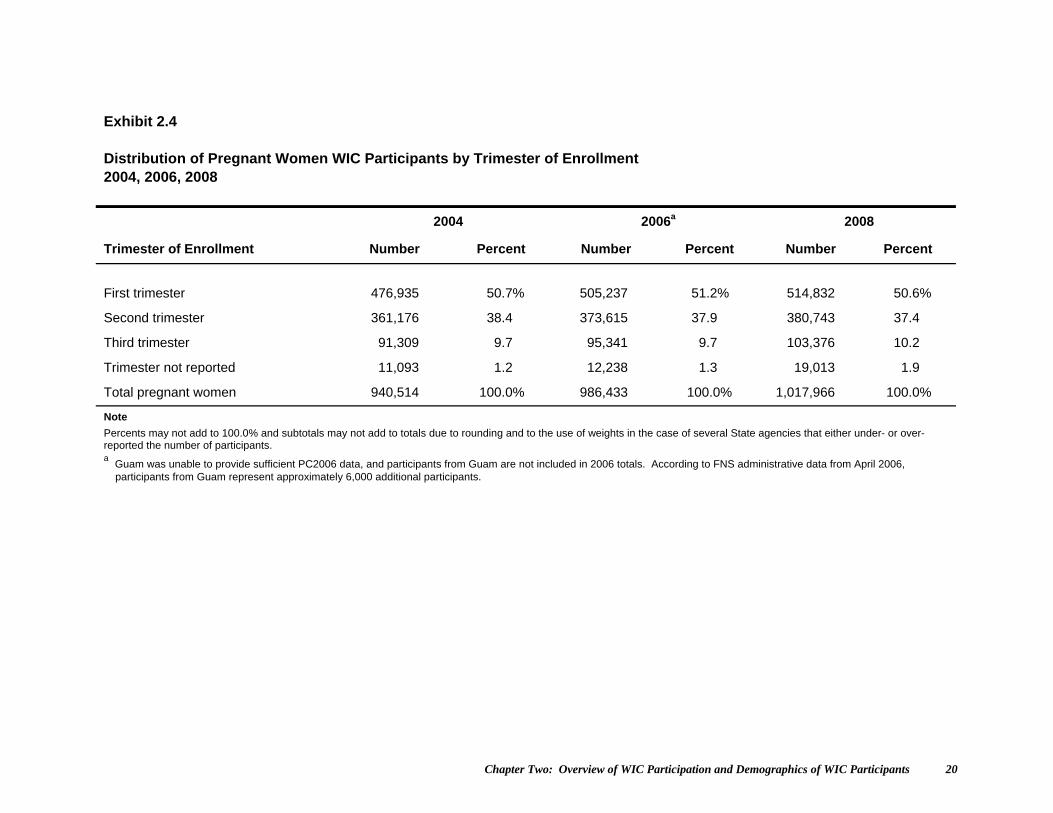
Chapter Two: Overview of WIC Participation and Demographics of WIC Participants 20
Exhibit 2.4 Distribution of Pregnant Women WIC Participants by Trimester of Enrollment 2004, 2006, 2008
2004 2006a 2008
Trimester of Enrollment Number Percent Number Percent Number Percent
First trimester 476,935 50.7% 505,237 51.2% 514,832 50.6%
Second trimester 361,176 38.4 373,615 37.9 380,743 37.4
Third trimester 91,309 9.7 95,341 9.7 103,376 10.2
Trimester not reported 11,093 1.2 12,238 1.3 19,013 1.9
Total pregnant women 940,514 100.0% 986,433 100.0% 1,017,966 100.0%
Note
Percents may not add to 100.0% and subtotals may not add to totals due to rounding and to the use of weights in the case of several State agencies that either under- or over-reported the number of participants. a Guam was unable to provide sufficient PC2006 data, and participants from Guam are not included in 2006 totals. According to FNS administrative data from April 2006,
participants from Guam represent approximately 6,000 additional participants.

Chapter Two: Overview of WIC Participation and Demographics of WIC Participants 21
Exhibit 2.5 Distribution of WIC Participants by Region 2004, 2006, 2008
2004 2006a 2008
Region Number Percent Number Percent Number Percent
Northeast 789,928 9.2% 804,715 9.2% 845,504 8.9%
Mid-Atlantic 969,124 11.3 973,729 11.1 1,039,312 10.9
Southeast 1,585,079 18.5 1,664,967 19.0 1,875,363 19.7
Midwest 1,204,393 14.0 1,235,179 14.1 1,355,543 14.2
Southwest 1,370,097 16.0 1,376,174 15.7 1,475,280 15.5
Mountain Plains 576,700 6.7 577,641 6.6 632,097 6.6
Western 2,091,163 24.4 2,139,812 24.4 2,317,382 24.3
US WIC 8,586,484 100.0% 8,772,218 100.0% 9,540,481 100.0%
Note
Percents may not add to 100.0% and subtotals may not add to totals due to rounding and to the use of weights in the case of several State agencies that either under- or over-reported the number of participants. a Guam was unable to provide sufficient PC2006 data, and participants from Guam are not included in 2006 totals. According to FNS administrative data from April 2006, participants from Guam represent approximately 6,000 additional participants.

Chapter Two: Overview of WIC Participation and Demographics of WIC Participants 22
Exhibit 2.6
Distribution of Race and Ethnicity of WIC Participants
Two or More Races (3.6%)
White Only
(60.3%)
Native Hawaiian/Pacific
Islander Only (0.8%)
Black/African
American Only (19.6%)
Asian Only (2.7%)
American Indian/Alaska
Native Only
(11.4%)
Race not Reported (1.5%)
Not
Hispanic/Latino (57.1%)
Hispanic/Latino
(42.1%)
Ethnicity Not
Reported (0.8%)
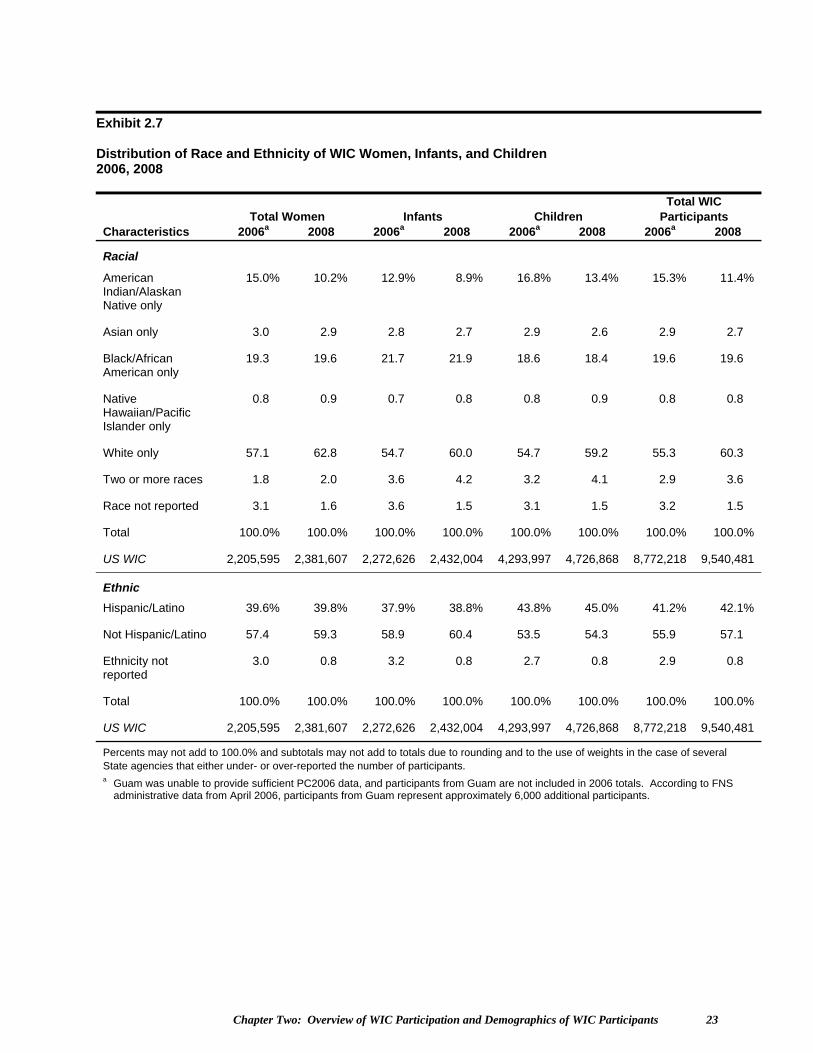
Chapter Two: Overview of WIC Participation and Demographics of WIC Participants 23
Exhibit 2.7 Distribution of Race and Ethnicity of WIC Women, Infants, and Children 2006, 2008
Total Women Infants Children Total WIC
Participants Characteristics 2006a 2008 2006a 2008 2006a 2008 2006a 2008
Racial
American Indian/Alaskan Native only
15.0% 10.2% 12.9% 8.9% 16.8% 13.4% 15.3% 11.4%
Asian only 3.0 2.9 2.8 2.7 2.9 2.6 2.9 2.7
Black/African American only
19.3 19.6 21.7 21.9 18.6 18.4 19.6 19.6
Native Hawaiian/Pacific Islander only
0.8 0.9 0.7 0.8 0.8 0.9 0.8 0.8
White only 57.1 62.8 54.7 60.0 54.7 59.2 55.3 60.3
Two or more races 1.8 2.0 3.6 4.2 3.2 4.1 2.9 3.6
Race not reported 3.1 1.6 3.6 1.5 3.1 1.5 3.2 1.5
Total 100.0% 100.0% 100.0% 100.0% 100.0% 100.0% 100.0% 100.0%
US WIC 2,205,595 2,381,607 2,272,626 2,432,004 4,293,997 4,726,868 8,772,218 9,540,481
Ethnic
Hispanic/Latino 39.6% 39.8% 37.9% 38.8% 43.8% 45.0% 41.2% 42.1%
Not Hispanic/Latino 57.4 59.3 58.9 60.4 53.5 54.3 55.9 57.1
Ethnicity not reported
3.0 0.8 3.2 0.8 2.7 0.8 2.9 0.8
Total 100.0% 100.0% 100.0% 100.0% 100.0% 100.0% 100.0% 100.0%
US WIC 2,205,595 2,381,607 2,272,626 2,432,004 4,293,997 4,726,868 8,772,218 9,540,481
Percents may not add to 100.0% and subtotals may not add to totals due to rounding and to the use of weights in the case of several State agencies that either under- or over-reported the number of participants. a Guam was unable to provide sufficient PC2006 data, and participants from Guam are not included in 2006 totals. According to FNS
administrative data from April 2006, participants from Guam represent approximately 6,000 additional participants.
Chapter Two: Overview of WIC Participation and Demographics of WIC Participants 24
PC2006 and PC2008 race/ethnicity data were translated into the PC2004 categories. These trends in WIC race/ethnicity distributions are shown in Exhibits A2.7a and A2.7b in the appendix. Changes in the four broad racial/ethnic categories between PC2004 and PC2008 include a 3.0 percentage point drop for non-Hispanic Whites and a 2.8 percentage point increase for Hispanics. In 2006, there was a sharp increase in the proportion of participants reporting a race of American Indian/Alaska Native, as compared to PC2004 and prior years. In 2004, just 2 percent of WIC participants reported race as American Indian/Alaska Native. For PC2006, the percentage for American Indian/Alaska Native Only jumped to 15.3 percent of all WIC participants. PC2008 now shows a decrease in the percentage of American Indian/Alaska Native only, to 11.4 percent of WIC participants, but this is still well above 2004 levels. These elevated percentages appear to be the result of using the new OMB race categories. Beginning in PC2006, a WIC participant that indicates that he/she is Hispanic must also designate a race, choosing from the five racial categories. Hispanic participants, and WIC staff when race must be designated based on observation, may view American Indian/Alaska Native as the closest racial group for Hispanics. OMB defines an American Indian or Alaska Native as a person having origins in any of the original peoples of North and South America (including Central America) and who maintains tribal affiliation or community attachment. In PC2008, large percentages of Hispanic WIC participants in California, Colorado, Connecticut, Delaware, New York, Oregon, Puerto Rico, and Washington reported they were American Indian/Alaska Native. Although the percentage in this racial category has decreased for some of these States since 2006 (notably California and Washington), it is still significantly higher than 2004 levels. For instance, in 2006, the high national proportion of American Indian/Alaska Native reporting was driven chiefly by 70 percent of Hispanic participants in California reporting their race as American Indian/Alaska Native. In 2008, that percentage decreased to 34 percent of California’s Hispanic participants. In 2004, when race and ethnicity were not distinguished, Native American/Alaska Natives comprised just 0.5 percent of California’s caseload. 5 Nationally, Hispanic participants were 67.7 percent White Only and 24.2 percent American Indian/Alaska Native Only (Exhibit 2.8). Only 3.2 percent of Hispanic participants reported a race of Black Only, Asian Only, or Hawaiian/Pacific Islander Only. Non-Hispanic participants were 55.6 percent White Only, 32.7 percent Black/African American Only, and 4.4 percent Asian Only. Of non-Hispanic participants, 3.1 percent reported a race of American Indian/Alaska Native Only or Hawaiian/Pacific Islander Only. Nationally, 1.4 percent of Hispanic participants did not report any race whereas only 0.2 percent of non-Hispanic participants failed to report race. Exhibit A2.8 in Appendix A shows a more detailed breakdown of race by ethnicity that includes actual counts rather than percentages.
5 California’s Hispanic participants who reported their race as American Indian/Alaska Native account for 48.7 percent of American Indian/Alaska Natives nationally.
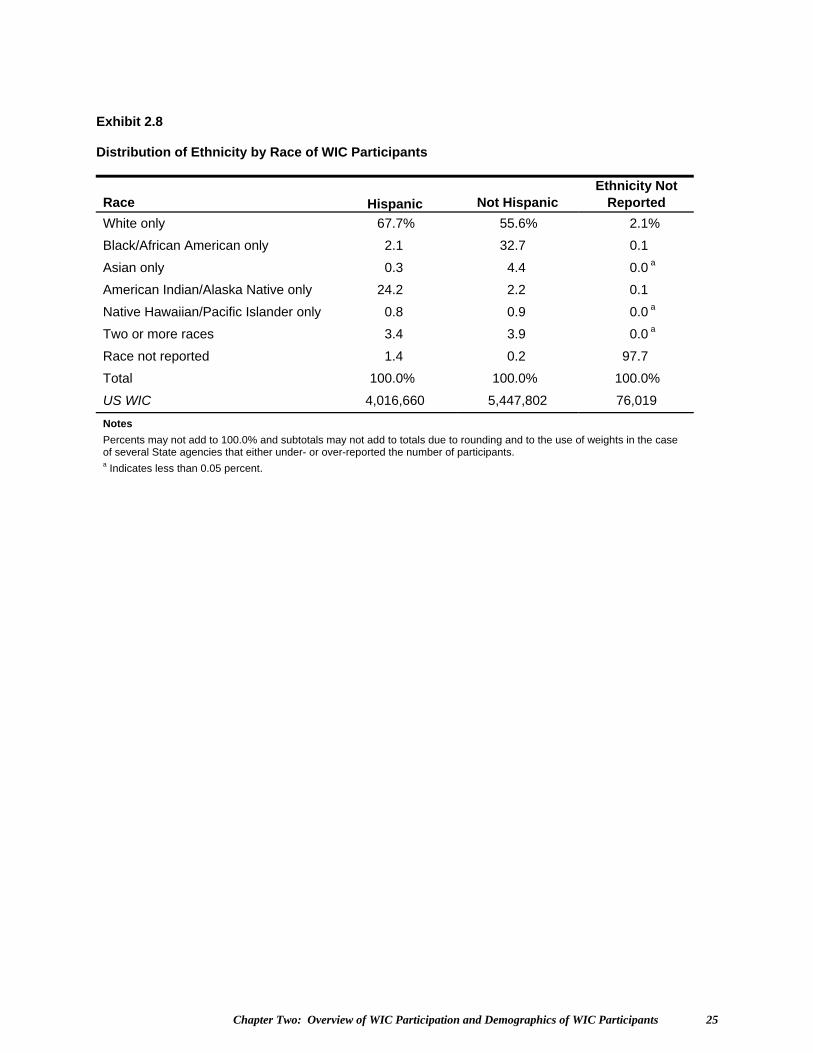
Chapter Two: Overview of WIC Participation and Demographics of WIC Participants 25
Exhibit 2.8 Distribution of Ethnicity by Race of WIC Participants
Race Hispanic Not Hispanic Ethnicity Not
Reported
White only 67.7% 55.6% 2.1%
Black/African American only 2.1 32.7 0.1
Asian only 0.3 4.4 0.0 a
American Indian/Alaska Native only 24.2 2.2 0.1
Native Hawaiian/Pacific Islander only 0.8 0.9 0.0 a
Two or more races 3.4 3.9 0.0 a
Race not reported 1.4 0.2 97.7
Total 100.0% 100.0% 100.0%
US WIC 4,016,660 5,447,802 76,019
Notes
Percents may not add to 100.0% and subtotals may not add to totals due to rounding and to the use of weights in the case of several State agencies that either under- or over-reported the number of participants. a Indicates less than 0.05 percent.
Chapter Two: Overview of WIC Participation and Demographics of WIC Participants 26
In general, the racial and ethnic composition for WIC’s certification categories is similar to the overall racial/ethnic distribution of WIC participants (Exhibit 2.9). The one notable exception is that breastfeeding women are disproportionately Hispanic—50.8 percent of breastfeeding women are Hispanic versus 39.8 percent of all WIC women. Similar findings have been reported since 1992. Conversely, Black/African American Only WIC women represent a rather low proportion (15.9 percent) of all breastfeeding women, relative to their share of other certification categories. Exhibit A2.9 in Appendix A shows a more detailed breakdown of race and ethnicity by certification category providing actual counts rather than percentages. In 2008, the percents of participants reporting their race as White Only in the Northeast, Mid-Atlantic, and Western regions were lower than in other regions whereas the proportions reporting their race as American Indian/Alaska Native were much higher in the Northeast, Mid-Atlantic, Mountain Plains, and Western regions (Exhibit 2.10). Again, as noted above, the differences in reporting of the American Indian/Alaska Native racial category should probably be attributed to the new OMB reporting protocols. For example, in the Southwest region, 59.1 percent of participants reported an ethnicity of Hispanic while only 2.5 percent reported a race of American Indian/Alaska Native. This information is markedly different from the Western region where a similarly high percentage of participants reported an ethnicity of Hispanic, but 27.7 percent reported a race of American Indian/Alaska Native. Comparisons among regions probably do not reflect true differences in the racial distribution of WIC participants, given these differences in reporting.
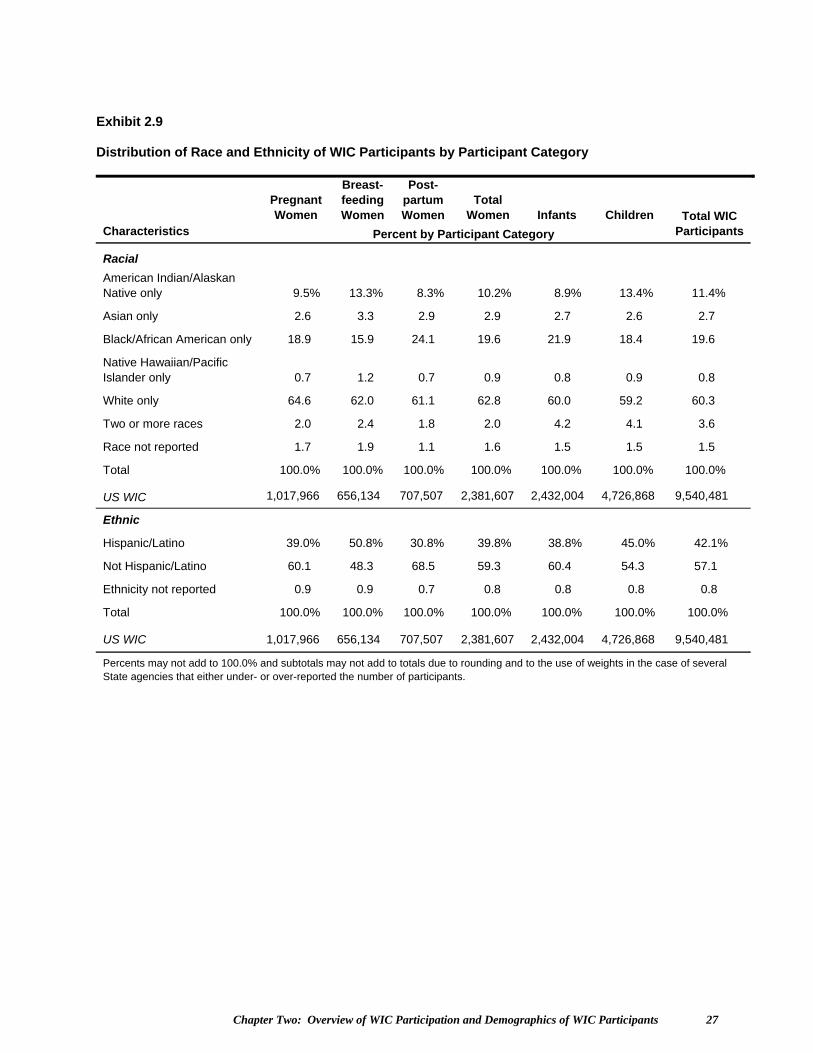
Chapter Two: Overview of WIC Participation and Demographics of WIC Participants 27
Exhibit 2.9 Distribution of Race and Ethnicity of WIC Participants by Participant Category
Pregnant Women
Breast-feeding Women
Post-partum Women
Total Women Infants Children
Characteristics Percent by Participant Category
Total WIC Participants
Racial
American Indian/Alaskan Native only 9.5% 13.3% 8.3% 10.2% 8.9% 13.4% 11.4%
Asian only 2.6 3.3 2.9 2.9 2.7 2.6 2.7
Black/African American only 18.9 15.9 24.1 19.6 21.9 18.4 19.6
Native Hawaiian/Pacific Islander only 0.7 1.2 0.7 0.9 0.8 0.9 0.8
White only 64.6 62.0 61.1 62.8 60.0 59.2 60.3
Two or more races 2.0 2.4 1.8 2.0 4.2 4.1 3.6
Race not reported 1.7 1.9 1.1 1.6 1.5 1.5 1.5
Total 100.0% 100.0% 100.0% 100.0% 100.0% 100.0% 100.0%
US WIC 1,017,966 656,134 707,507 2,381,607 2,432,004 4,726,868 9,540,481
Ethnic
Hispanic/Latino 39.0% 50.8% 30.8% 39.8% 38.8% 45.0% 42.1%
Not Hispanic/Latino 60.1 48.3 68.5 59.3 60.4 54.3 57.1
Ethnicity not reported 0.9 0.9 0.7 0.8 0.8 0.8 0.8
Total 100.0% 100.0% 100.0% 100.0% 100.0% 100.0% 100.0%
US WIC 1,017,966 656,134 707,507 2,381,607 2,432,004 4,726,868 9,540,481
Percents may not add to 100.0% and subtotals may not add to totals due to rounding and to the use of weights in the case of several State agencies that either under- or over-reported the number of participants.
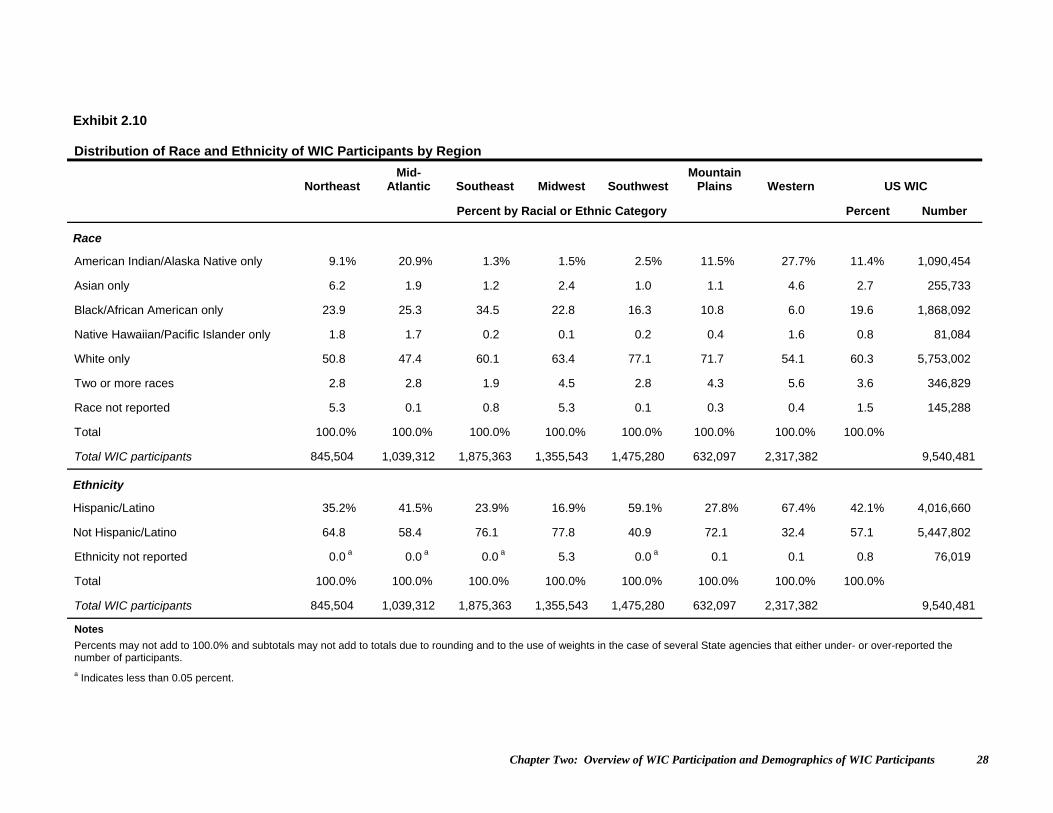
Chapter Two: Overview of WIC Participation and Demographics of WIC Participants 28
Exhibit 2.10 Distribution of Race and Ethnicity of WIC Participants by Region
Northeast Mid-
Atlantic Southeast Midwest Southwest Mountain
Plains Western US WIC
Percent by Racial or Ethnic Category Percent Number
Race
American Indian/Alaska Native only 9.1% 20.9% 1.3% 1.5% 2.5% 11.5% 27.7% 11.4% 1,090,454
Asian only 6.2 1.9 1.2 2.4 1.0 1.1 4.6 2.7 255,733
Black/African American only 23.9 25.3 34.5 22.8 16.3 10.8 6.0 19.6 1,868,092
Native Hawaiian/Pacific Islander only 1.8 1.7 0.2 0.1 0.2 0.4 1.6 0.8 81,084
White only 50.8 47.4 60.1 63.4 77.1 71.7 54.1 60.3 5,753,002
Two or more races 2.8 2.8 1.9 4.5 2.8 4.3 5.6 3.6 346,829
Race not reported 5.3 0.1 0.8 5.3 0.1 0.3 0.4 1.5 145,288
Total 100.0% 100.0% 100.0% 100.0% 100.0% 100.0% 100.0% 100.0%
Total WIC participants 845,504 1,039,312 1,875,363 1,355,543 1,475,280 632,097 2,317,382 9,540,481
Ethnicity
Hispanic/Latino 35.2% 41.5% 23.9% 16.9% 59.1% 27.8% 67.4% 42.1% 4,016,660
Not Hispanic/Latino 64.8 58.4 76.1 77.8 40.9 72.1 32.4 57.1 5,447,802
Ethnicity not reported 0.0 a 0.0 a 0.0 a 5.3 0.0 a 0.1 0.1 0.8 76,019
Total 100.0% 100.0% 100.0% 100.0% 100.0% 100.0% 100.0% 100.0%
Total WIC participants 845,504 1,039,312 1,875,363 1,355,543 1,475,280 632,097 2,317,382 9,540,481
Notes
Percents may not add to 100.0% and subtotals may not add to totals due to rounding and to the use of weights in the case of several State agencies that either under- or over-reported the number of participants.
a Indicates less than 0.05 percent.
Chapter Three: Income of WIC Participants 29
3. INCOME OF WIC PARTICIPANTS Federal regulations require categorically eligible WIC applicants to meet income eligibility standards set by State WIC agencies. Income limits must be between 185 percent and 100 percent of the Department of Health and Human Services (HHS) poverty income guidelines, which are based on household size. As of July 2007, at the 185-percent threshold, a person from a family of four with an annual household income of $38,203 or less is income-eligible for the WIC Program.1 In April 2008, all State WIC agencies set WIC income eligibility at 185 percent of poverty. In 1990, State WIC agencies were required to establish procedures for determining an applicant adjunctively income eligible for WIC benefits, if the individual could document participation in such means-tested programs as the Temporary Assistance to Needy Families (TANF), Food Stamp, or Medicaid Programs.2 WIC regulations also allow States to extend automatic WIC income eligibility to individuals participating in other means-tested programs applying income eligibility guidelines that are in congruence with State regulations on WIC income.3 All State agencies except American Samoa, Puerto Rico, and the Northern Mariana Islands apply TANF, Food Stamp, and Medicaid participation to determine WIC income eligibility.4 The reported 2008 participation of WIC clients in the TANF, Food Stamp, and Medicaid Programs appears in Exhibit 3.1. For several reasons, these findings may underestimate participation in these programs. First, the information was recorded at certification. Staff at local WIC service sites refer WIC enrollees to other programs, and any enrollment subsequent to certification was not captured in the estimates presented here. In addition, data on participation in other programs were not reported for 6.2 percent of WIC enrollees. Finally, constraints in various WIC management information systems, as well as required procedures for documenting income and participation in other programs, may have limited the number of programs entered into computer systems by local WIC staff. Between 1998 and 2002, reported participation in TANF and the Food Stamp Program by WIC participants decreased from 17.0 percent to 9.6 percent, and from 26.6 percent to 17.5 percent, respectively. In contrast, participation in Medicaid increased from 48.3 percent to 54.3 percent during the same time period. From 2002 to 2006, participation in TANF remained relatively constant at 9.3 percent; in 2008 it dropped to 6.5 percent. The percentage of WIC enrollees receiving Food Stamp benefits has shown a gradual increase from 17.5 percent in 2002 to 22.6 percent in 2008. Participation in Medicaid grew from 54.3 percent in 2002 to 63.2 percent in
1 Poverty guidelines established in July 2007 were in effect through June 2008 so that these guidelines cover most of the period for which WIC participants active in April 2008 were certified. 2 Because the Medicaid Program permits recipients to have higher incomes, it is possible that some WIC participant household incomes are above 185 percent of poverty. As of October 1, 2008 the Food Stamp Program was renamed the Supplemental Nutrition Assistance Program (SNAP). Since this report includes participation status as of April 2008, we refer to this program as the Food Stamp Program throughout this report. 3 Although WIC regulations distinguish means-tested programs used for adjunctive income eligibility from programs used to establish automatic income eligibility, the two mechanisms work similarly with respect to income eligibility. 4American Samoa does not participate in these other means-tested programs. Puerto Rico and the Northern Mariana Islands do not participate in the Food Stamp Program, but participants in their Nutrition Assistance Programs are automatically eligible for WIC. Medicaid participants in the Northern Mariana Islands, and TANF and Medicaid recipients in Puerto Rico, are also adjunctively eligible for WIC.
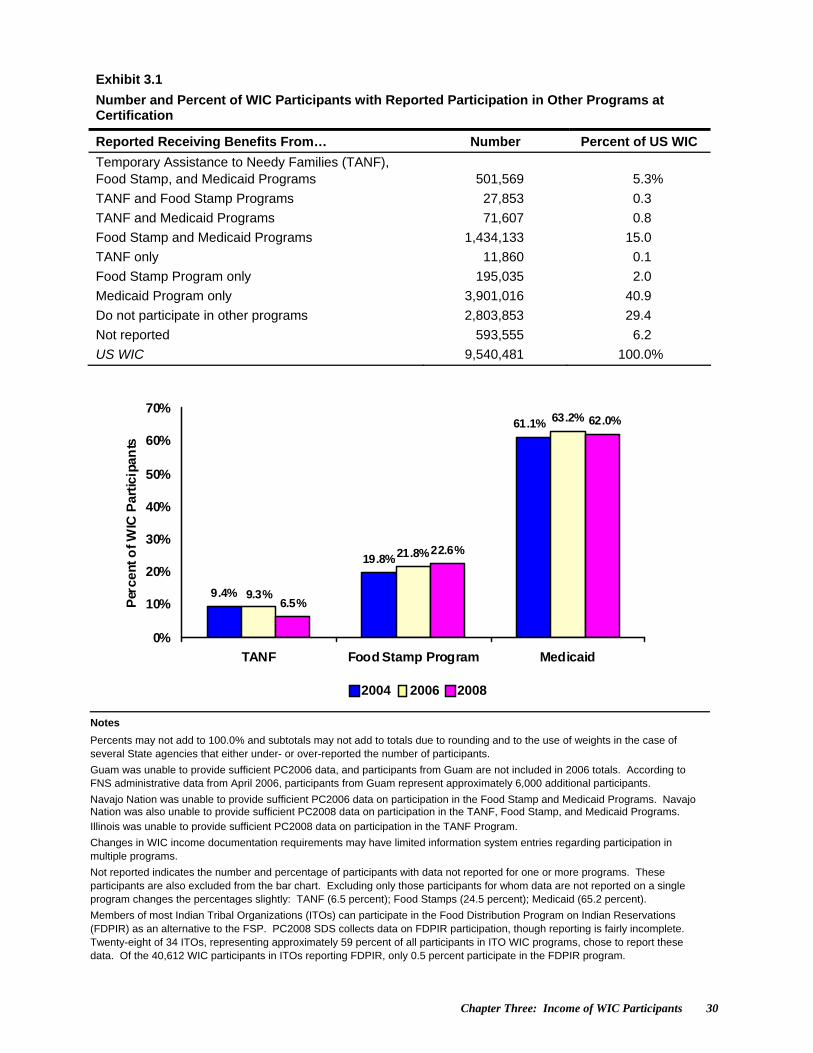
Chapter Three: Income of WIC Participants 30
Exhibit 3.1
Number and Percent of WIC Participants with Reported Participation in Other Programs at Certification
Reported Receiving Benefits From… Number Percent of US WIC
Temporary Assistance to Needy Families (TANF), Food Stamp, and Medicaid Programs 501,569 5.3%
TANF and Food Stamp Programs 27,853 0.3
TANF and Medicaid Programs 71,607 0.8
Food Stamp and Medicaid Programs 1,434,133 15.0
TANF only 11,860 0.1
Food Stamp Program only 195,035 2.0
Medicaid Program only 3,901,016 40.9
Do not participate in other programs 2,803,853 29.4
Not reported 593,555 6.2
US WIC 9,540,481 100.0%
9.4%
19.8%
9.3%
21.8%
63.2%
6.5%
22.6%
61.1% 62.0%
0%
10%
20%
30%
40%
50%
60%
70%
TANF Food Stamp Program Medicaid
Per
cent
of W
IC P
artic
ipan
ts
2004 2006 2008
Notes
Percents may not add to 100.0% and subtotals may not add to totals due to rounding and to the use of weights in the case of several State agencies that either under- or over-reported the number of participants.
Guam was unable to provide sufficient PC2006 data, and participants from Guam are not included in 2006 totals. According to FNS administrative data from April 2006, participants from Guam represent approximately 6,000 additional participants.
Navajo Nation was unable to provide sufficient PC2006 data on participation in the Food Stamp and Medicaid Programs. Navajo Nation was also unable to provide sufficient PC2008 data on participation in the TANF, Food Stamp, and Medicaid Programs.
Illinois was unable to provide sufficient PC2008 data on participation in the TANF Program.
Changes in WIC income documentation requirements may have limited information system entries regarding participation in multiple programs.
Not reported indicates the number and percentage of participants with data not reported for one or more programs. These participants are also excluded from the bar chart. Excluding only those participants for whom data are not reported on a single program changes the percentages slightly: TANF (6.5 percent); Food Stamps (24.5 percent); Medicaid (65.2 percent).
Members of most Indian Tribal Organizations (ITOs) can participate in the Food Distribution Program on Indian Reservations (FDPIR) as an alternative to the FSP. PC2008 SDS collects data on FDPIR participation, though reporting is fairly incomplete. Twenty-eight of 34 ITOs, representing approximately 59 percent of all participants in ITO WIC programs, chose to report these data. Of the 40,612 WIC participants in ITOs reporting FDPIR, only 0.5 percent participate in the FDPIR program.
Chapter Three: Income of WIC Participants 31
2006; in 2008, the percentage showed a small decrease to 62.0 percent, suggesting that Medicaid participation may be leveling off. It should be noted that the changes between 2006 and 2008 were minimal for both the Food Stamp and Medicaid Programs at about 1 percentage point. Overall, in April 2008, 64.4 percent—down from 66.2 percent in 2006—of WIC enrollees received benefits from at least one public assistance program that made them adjunctively income eligible for WIC.
Household Size and For the WIC Participant and Program Characteristics report, State agencies were Income asked to provide information on family or economic unit size for each person enrolled
in WIC during April 2008. Household size was reported for almost 100 percent of participants. Income was reported for only 90.1 percent of WIC households, a percentage which shows no change since 2006.5 Income reporting in previous years steadily increased, from 84.1 percent of all households in 2002, to 90.1 percent in 2006. States with missing income data for over 30 percent of their WIC participants in 2008 include Alabama, Connecticut, District of Columbia, Kentucky, Minnesota, the Northern Mariana Islands, Tennessee, and seven ITOs. For some applicants, States reported “actual” income—that is, the dollar amounts provided by WIC applicants. For applicants who are adjunctively income eligible, States reported income ranges and midpoints of the ranges were assigned as household income.6 Both types of data have been combined to compute average annualized income and to calculate percent of poverty. Some States also reported zero incomes. As the exhibit footnotes explain, although available income data from all States are included in this analysis, zero incomes have been tabulated separately given the difficulty in differentiating between zero representing missing data and zero indicating adjunctive eligibility. Exhibit 3.2 shows that the average family or economic unit size for WIC participants has remained about 4 persons since 2002, with some minor fluctuations over time within participant categories. One exception is the decrease in the number of pregnant women living in one-person households, a proportion that has been decreasing since 1996 and is now at 2.9 percent. This downward trend should probably be attributed to the revised WIC policy allowing States to count pregnant women as two persons. Consistent with data from 2004 and 2006, 1.2 percent of infants, children, and postpartum women are classified as residing in one-person households for WIC income eligibility determination in 2008. These categories include infants and children placed in foster care and women who miscarry or whose infants are placed in foster care. Exhibits 3.3, 3.4, and 3.5 present mean and median incomes by participant category, by race, and by ethnicity, respectively. Data to calculate mean and median income were not reported for 9.9 percent of WIC enrollees and were reported as zero for an additional 0.9 percent.7 Exhibit 3.3 shows on average, family/economic unit income across all categories was $16,535 in April 2008. This represents a 6.2 percent (or $958) increase since 2006 (calculated from PC2006 Report, Exhibit 3.3). Average income levels also increased in each of the participant categories. Similarly, median income in 2008 showed a 5.8 percent growth. As discussed below, these higher incomes do not indicate that WIC participants in 2008 were financially better off as a group than WIC participants in 2006.
5 88.3 percent of participants with missing income were adjunctively income-eligible due to their participation in Medicaid, Food Stamp, or TANF Programs in 2008.
6 Income ranges were reported in $100 per month increments up to a top category of $6,200 and over per month. 7 This calculation excludes from the denominator the 1.9 percent of participants missing data on trimester of enrollment.
Chapter Three: Income of WIC Participants 32
Exhibit 3.2
Distribution of the Size of Families or Economic Units of WIC Participants by Participant Category
Pregnant Women Breastfeeding Women Postpartum Women Total Women
Percent by Category Size of Family or Economic Unit 2004 2006 a 2008 2004 2006 a 2008 2004 2006 a 2008 2004 2006 a 2008
1 personb 3.8% 3.3% 2.9% 0.0% 0.0% 0.0% 0.6% 0.7% 0.6% 1.9% 1.7% 1.4%
2 persons 20.8 20.1 19.6 9.7 10.8 10.8 15.1 16.1 16.1 16.3 16.5 16.1
3 persons 28.8 28.6 28.2 28.7 29.1 28.6 29.9 30.2 30.0 29.1 29.2 28.8
4 persons 23.1 23.2 23.4 27.5 26.9 26.8 25.7 25.4 25.2 25.0 24.8 24.9
5 persons 12.9 13.4 13.8 18.0 17.6 17.7 15.2 15.0 15.0 14.8 15.0 15.3
6 or more persons 10.1 10.9 11.4 15.5 15.0 15.2 12.2 12.0 12.1 12.1 12.3 12.7
Size not reported 0.2 0.3 0.4 0.4 0.4 0.5 0.8 0.4 0.7 0.5 0.3 0.5
Total 100.0% 100.0% 100.0% 100.0% 100.0% 100.0% 100.0% 100.0% 100.0% 100.0% 100.0% 100.0%
US WIC 940,514 986,433 1,017,966 518,144 584,789 656,134 645,319 634,372 707,507 2,103,978 2,205,595 2,381,607
Mean 3.6 3.6 3.7 4.1 4.1 4.1 3.9 3.8 3.8 3.8 3.8 3.8
Infants Children Total WIC
Percent by Category Size of Family or Economic Unit 2004 2006 a 2008 2004 2006 a 2008 2004 2006 a 2008
1 personb 1.0% 1.1% 1.0% 1.1% 1.2% 1.2% 1.3% 1.3% 1.2%
2 persons 12.9 13.4 13.6 9.6 10.2 9.1 12.1 12.6 12.0
3 persons 29.2 29.0 29.0 22.8 22.0 21.8 26.0 25.6 25.4
4 persons 26.5 26.0 25.8 29.9 29.5 29.3 27.8 27.4 27.3
5 persons 16.2 16.2 16.2 19.9 20.1 20.3 17.7 17.8 18.0
6 or more persons 13.4 13.4 13.5 16.2 16.5 16.8 14.5 14.6 14.9
Size not reported 0.5 0.6 0.6 0.2 0.2 1.3 0.3 0.3 0.9
Total 100.0% 100.0% 100.0% 100.0% 100.0% 100.0% 100.0% 100.0% 100.0%
US WIC 2,203,882 2,272,626 2,432,004 4,278,623 4,293,997 4,726,868 8,586,484 8,772,218 9,540,481
Mean 4.0 3.9 3.9 4.2 4.2 4.2 4.0 4.0 4.1
Notes
Percents may not add to 100.0% and subtotals may not add to totals due to rounding and to the use of weights in the case of several State agencies that either under- or over-reported the number of participants. Calculations in this table are based on all families or economic units reporting size. Units reporting zero members are included in the size-not-reported category. a Guam was unable to provide sufficient PC2006 data, and participants from Guam are not included in 2006 totals. According to FNS administrative data from April 2006, participants from Guam represent approximately 6,000 participants. b Mothers who miscarry, mothers of infants assigned to foster care, and infants and children assigned to foster care may be reported as one-person economic units.
Chapter Three: Income of WIC Participants 33
Exhibit 3.3
Mean and Median Annualized Family or Economic Unit Income of WIC Participants by Participant Category
Pregnant Women
Breastfeeding Women
Postpartum Women Total Women Infants Children Total WIC
Average (mean) income $15,750 $17,490 $14,620 $15,916 $15,665 $17,278 $16,535
Median income $14,436 $16,200 $12,996 $14,560 $14,400 $15,600 $15,240
Percent with income reported 89.6% 91.8% 86.9% 89.4% 87.2% 90.1% 89.2%
Percent with income reported as zeroa 1.2 0.9 0.9 1.0 1.3 0.6 0.9
Percent with income not reportedb 9.2 7.2 12.1 9.5 11.5 9.3 9.9
US WIC 1,017,966 656,134 707,507 2,381,607 2,432,004 4,726,868 9,540,481
Notes
Percents may not add to 100.0% and subtotals may not add to totals due to rounding and to the use of weights in the case of several State agencies that either under- or over-reported the number of participants.
State and local WIC agencies may collect data on weekly, monthly, or annual incomes. For reporting and analysis, annualized incomes have been computed.
Also note that income calculations include only those participants for whom State agencies reported data on income, income period, and size of economic unit.
In 2008, a State WIC agency could report actual income or an income range. Both types of data are included in the calculations of mean and median incomes. a Zero incomes are reported separately and excluded from these mean and median calculations. In some reporting agencies, zero may be used to indicate missing information or adjunctive eligibility. PC2008 cannot distinguish between households with missing income information and households reporting zero income.
b Not reported indicates the percentage of participants by participant category for whom no data on income, income period, or size of economic unit are reported.
Chapter Three: Income of WIC Participants 34
Exhibit 3.4
Average Annualized Family or Economic Unit Income of WIC Participants by Participant Category and Race
Race Pregnant Women
Breastfeeding Women
Postpartum Women Total Women Infants Children Total WIC
American Indian/Alaska Native Only Average (mean) income $15,838 $17,254 $15,149 $16,194 $15,706 $17,154 $16,660 Median income $15,084 $15,780 $14,400 $15,600 $14,794 $15,600 $15,600 Percent with income reported 91.6% 95.1% 91.5% 92.8% 91.7% 94.1% 93.4% Percent with income reported as zeroa 1.8 0.8 1.5 1.4 1.7 1.0 1.3 Percent with income not reportedb 6.6 4.1 7.0 5.8 6.5 4.8 5.4 Number of WIC Participants 96,727 87,167 58,937 242,831 215,450 632,172 1,090,454
Asian Only Average (mean) income $18,102 $19,764 $17,909 $18,578 $18,504 $20,370 $19,428 Median income $16,536 $18,200 $16,120 $17,056 $16,900 $18,679 $18,000 Percent with income reported 90.4% 93.0% 90.4% 91.2% 90.1% 92.5% 91.5% Percent with income reported as zeroa 1.0 1.1 0.9 1.0 1.3 0.7 0.9 Percent with income not reportedb 8.6 5.8 8.8 7.8 8.7 6.8 7.6 Number of WIC Participants 26,267 21,416 20,387 68,070 65,006 122,658 255,733
Black/African American Only Average (mean) income $11,851 $13,894 $10,395 $11,810 $11,404 $13,234 $12,359 Median income $9,600 $12,000 $7,476 $9,121 $8,208 $10,800 $9,660 Percent with income reported 85.9% 88.0% 82.6% 85.2% 82.9% 84.3% 84.1% Percent with income reported as zeroa 1.0 1.0 0.8 1.0 1.3 0.5 0.8 Percent with income not reportedb 13.1 11.0 16.6 13.9 15.8 15.2 15.1 Number of WIC Participants 192,772 104,589 170,173 467,534 532,638 867,919 1,868,092
Native Hawaiian/Pacific Islander Only Average (mean) income $17,060 $17,661 $16,022 $17,036 $16,608 $17,259 $17,046 Median income $15,600 $15,600 $14,400 $15,600 $15,000 $15,600 $15,552 Percent with income reported 89.6% 90.3% 90.5% 90.1% 87.3% 90.2% 89.5% Percent with income reported as zeroa 1.1 0.9 1.7 1.2 2.0 0.7 1.2 Percent with income not reportedb 9.3 8.8 7.8 8.7 10.7 9.0 9.3 Number of WIC Participants 7,161 8,165 5,208 20,534 19,872 40,679 81,084
Chapter Three: Income of WIC Participants 35
Exhibit 3.4 (continued)
Average Annualized Family or Economic Unit Income of WIC Participants by Participant Category and Race
Race Pregnant Women
Breastfeeding Women
Postpartum Women Total Women Infants Children Total WIC
White Only
Average (mean) income $16,713 $18,333 $15,921 $16,941 $17,006 $18,371 $17,659 Median income $15,600 $17,136 $14,400 $15,600 $15,600 $16,800 $16,200 Percent with income reported 90.4% 92.1% 87.7% 90.1% 88.0% 90.8% 89.9% Percent with income reported as zeroa 1.1 0.8 0.9 1.0 1.2 0.5 0.8 Percent with income not reportedb 8.5 7.0 11.4 8.9 10.8 8.7 9.3 Number of WIC Participants 657,674 407,022 432,017 1,496,713 1,459,019 2,797,269 5,753,002
Two or More Races Average (mean) income $16,165 $17,891 $15,200 $16,472 $15,567 $17,423 $16,756 Median income $14,400 $16,536 $13,000 $14,820 $13,498 $15,528 $14,820 Percent with income reported 89.4% 90.5% 87.4% 89.2% 85.9% 90.0% 88.7% Percent with income reported as zeroa 1.3 0.9 1.2 1.1 1.5 0.7 1.0 Percent with income not reportedb 9.3 8.6 11.4 9.6 12.6 9.3 10.3 Number of WIC Participants 20,500 15,479 12,813 48,793 102,586 195,450 346,829
Race Not Reported Average (mean) income $15,277 $15,918 $14,422 $15,307 $14,979 $15,532 $15,339 Median income $15,000 $15,600 $13,780 $15,080 $14,560 $15,600 $15,028 Percent with income reported 87.8% 91.3% 91.1% 89.7% 88.9% 95.1% 92.1% Percent with income reported as zeroa 3.0 4.0 1.1 2.9 3.2 0.6 1.8 Percent with income not reportedb 9.1 4.7 7.9 7.4 8.0 4.3 6.0 Number of WIC Participants 16,864 12,297 7,972 37,133 37,433 70,722 145,288
Notes
Percents may not add to 100.0% and subtotals may not add to totals due to rounding and to the use of weights in the case of several State agencies that either under- or over-reported the number of participants.
State and local WIC agencies may collect data on weekly, monthly, or annual incomes. For reporting and analysis, annualized incomes have been computed.
Also note that income calculations include only those participants for whom State agencies reported data on income, income period, and size of economic unit.
In 2008, a State WIC agency could report actual income or an income range. Both types of data are included in the calculations of mean and median incomes. a Zero incomes are reported separately and excluded from these mean and median calculations. In some reporting agencies, zero may be used to indicate missing information or adjunctive
eligibility. PC2008 cannot distinguish between households with missing income information and households reporting zero income. b Not reported indicates the percentage of participants by participant category for whom no data on income, income period, or size of economic unit are reported.
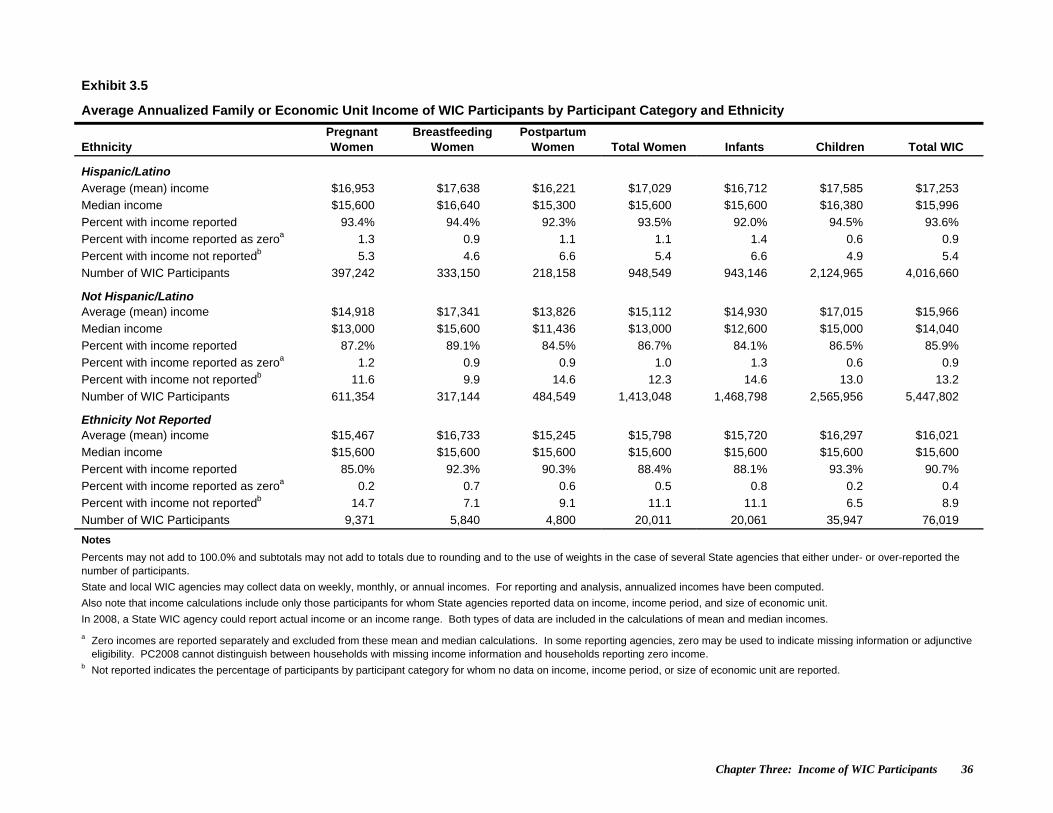
Chapter Three: Income of WIC Participants 36
Exhibit 3.5
Average Annualized Family or Economic Unit Income of WIC Participants by Participant Category and Ethnicity
Ethnicity Pregnant Women
Breastfeeding Women
Postpartum Women Total Women Infants Children Total WIC
Hispanic/Latino Average (mean) income $16,953 $17,638 $16,221 $17,029 $16,712 $17,585 $17,253
Median income $15,600 $16,640 $15,300 $15,600 $15,600 $16,380 $15,996
Percent with income reported 93.4% 94.4% 92.3% 93.5% 92.0% 94.5% 93.6%
Percent with income reported as zeroa 1.3 0.9 1.1 1.1 1.4 0.6 0.9
Percent with income not reportedb 5.3 4.6 6.6 5.4 6.6 4.9 5.4
Number of WIC Participants 397,242 333,150 218,158 948,549 943,146 2,124,965 4,016,660
Not Hispanic/Latino
Average (mean) income $14,918 $17,341 $13,826 $15,112 $14,930 $17,015 $15,966
Median income $13,000 $15,600 $11,436 $13,000 $12,600 $15,000 $14,040
Percent with income reported 87.2% 89.1% 84.5% 86.7% 84.1% 86.5% 85.9%
Percent with income reported as zeroa 1.2 0.9 0.9 1.0 1.3 0.6 0.9
Percent with income not reportedb 11.6 9.9 14.6 12.3 14.6 13.0 13.2
Number of WIC Participants 611,354 317,144 484,549 1,413,048 1,468,798 2,565,956 5,447,802
Ethnicity Not Reported
Average (mean) income $15,467 $16,733 $15,245 $15,798 $15,720 $16,297 $16,021
Median income $15,600 $15,600 $15,600 $15,600 $15,600 $15,600 $15,600
Percent with income reported 85.0% 92.3% 90.3% 88.4% 88.1% 93.3% 90.7%
Percent with income reported as zeroa 0.2 0.7 0.6 0.5 0.8 0.2 0.4
Percent with income not reportedb 14.7 7.1 9.1 11.1 11.1 6.5 8.9
Number of WIC Participants 9,371 5,840 4,800 20,011 20,061 35,947 76,019
Notes
Percents may not add to 100.0% and subtotals may not add to totals due to rounding and to the use of weights in the case of several State agencies that either under- or over-reported the number of participants.
State and local WIC agencies may collect data on weekly, monthly, or annual incomes. For reporting and analysis, annualized incomes have been computed.
Also note that income calculations include only those participants for whom State agencies reported data on income, income period, and size of economic unit.
In 2008, a State WIC agency could report actual income or an income range. Both types of data are included in the calculations of mean and median incomes.
a Zero incomes are reported separately and excluded from these mean and median calculations. In some reporting agencies, zero may be used to indicate missing information or adjunctive eligibility. PC2008 cannot distinguish between households with missing income information and households reporting zero income.
b Not reported indicates the percentage of participants by participant category for whom no data on income, income period, or size of economic unit are reported.
Chapter Three: Income of WIC Participants 37
Since 2006, the average annualized income has increased for all racial and ethnic groups, and for all participant categories. Examining income differences by race, Asians continued to report the highest average incomes, while Blacks/African Americans continued to report the lowest incomes. In addition, higher average incomes were reported for Hispanic/Latino than non-Hispanic/non-Latino WIC enrollees in both 2006 and 2008. There were few changes in the relative positions of different racial and ethnic groups since 2006. We are unable to compare the 2008 incomes by race or by ethnicity with PC data prior to 2006. Beginning in 2006, States were required to submit data using the revised WIC Program racial and ethnic categories. (See Chapter Two for details.) Looking at income differences by participant category, breastfeeding women continue to report the highest average annualized income. There have been no changes in the relative positions of different categories since 2006.
Poverty Status WIC participants are drawn from the country’s poorest households. In Exhibits 3.6, 3.7, 3.8, and 3.9, poverty status information is presented, examining changes over time, and differences by participant category, by race, and by ethnicity.8 Nearly 61 percent of all WIC participants reported incomes at or below the poverty level, and 29.6 percent reported incomes at or below 50 percent of poverty (Exhibit 3.6, US WIC columns).9 Both of these measures of poverty have increased steadily since 2002. Prior to this, the percentage of WIC participants with incomes at or below 50 percent of poverty had shown a steady decline, from 36.3 percent in 1994 to a low of 26.5 percent in 2002. Similarly, the percentage of participants reporting incomes at or below poverty reached its lowest level of 53.9 percent in 2002 before starting to increase again. In 2008, income reporting, which had been increasing in previous years, stabilized at approximately 90 percent. Caution should be exercised in interpreting these data given that there is still a rather substantial percentage of unreported income. Note that the general trends discussed here remain in evidence when unreported data are excluded from the denominators (Exhibit 3.6, US WIC Reporting Income columns). Overall, the percentage of WIC participants below the poverty line increased slightly since 2006, from 59.8 percent to 60.8 percent. All participant categories have shown an increase since 2006 in the percentage of participants below the poverty line. The highest percentage of participants below the poverty line is seen in the postpartum women category, and the lowest in the pregnant women category. Consistent with the average income data, the racial groups with the lowest and highest percentages of participants at or below poverty level were Asians (54.8 percent) and Blacks/African Americans (65.5 percent), respectively. In contrast to the average income findings, a larger percentage of the Hispanic/Latino group (64.7 percent) than the non-Hispanic/non-Latino group (58.0 percent) were at or below poverty level. These rankings are consistent with poverty level data from 2006. The percentage of Asian participants below the poverty level has not changed since 2006, while the percentage of Black/African American participants below the poverty level has decreased slightly since 2006. All other racial and ethnic groups have shown increases in the percentage of participants below the poverty level. As mentioned earlier, given the changes in reporting race and ethnicity that took place in PC2006, we are unable to compare the poverty status of WIC participants by race and by ethnicity with data from PC reports prior to 2006.
8 Exhibit B3.6 in Appendix B presents data on poverty level by participant category for 2000, 2002, 2004, 2006, and 2008. 9 Households not reporting income are included in the denominator of the US WIC columns. US WIC Reporting Income columns exclude households not reporting income and households reporting zero income.

Chapter Three: Income of WIC Participants 38
Exhibit 3.6
Poverty Status of WIC Participants in 2004, 2006, 2008
US WICa US WIC Reportinga Income Percent of Federal Poverty Level 2004 2006b 2008 2004 2006b 2008
0 – 50 28.6% 29.3% 29.6% 33.4% 33.0% 33.2%
51 – 100 28.6 30.5 31.2 33.5 34.3 35.0
101 – 130 13.1 13.4 13.4 15.3 15.1 15.0
131 – 150 6.2 6.4 6.1 7.2 7.1 6.8
151 – 185 7.7 7.6 7.4 9.0 8.5 8.3
186 – 200 0.5 0.7 0.5 0.6 0.7 0.6
Over 200 0.9 1.2 0.9 1.1 1.3 1.2
Income reported as zeroc 0.9 1.1 0.9 N/A N/A N/A
Not reportedd 13.6 9.9 9.9 N/A N/A N/A
Total Population 8,586,484 8,772,218 9,540,481 7,345,511 7,808,312 8,510,022
Notes
Percents may not add to 100.0% and subtotals may not add to totals due to rounding and to the use of weights in the case of several State agencies that either under- or over-reported the number of participants. N/A indicates not applicable. a WIC participant poverty level calculations are based on income, income period, and household size as reported by State WIC agencies. Figures in this table represent a count of
individual WIC participants. b Guam was unable to provide sufficient PC2006 data, and participants from Guam are not included in 2006 totals. According to FNS administrative data from April 2006, participants
from Guam represent approximately 6,000 additional participants. c Zero incomes are reported separately and excluded from these income calculations. In some reporting agencies, zero may be used to indicate missing information or adjunctive
eligibility. PC reports cannot, therefore, distinguish between households with missing income information and households reporting zero income. d Not reported indicates the percentage of participants for whom no data on income, income period, or size of economic unit are reported.
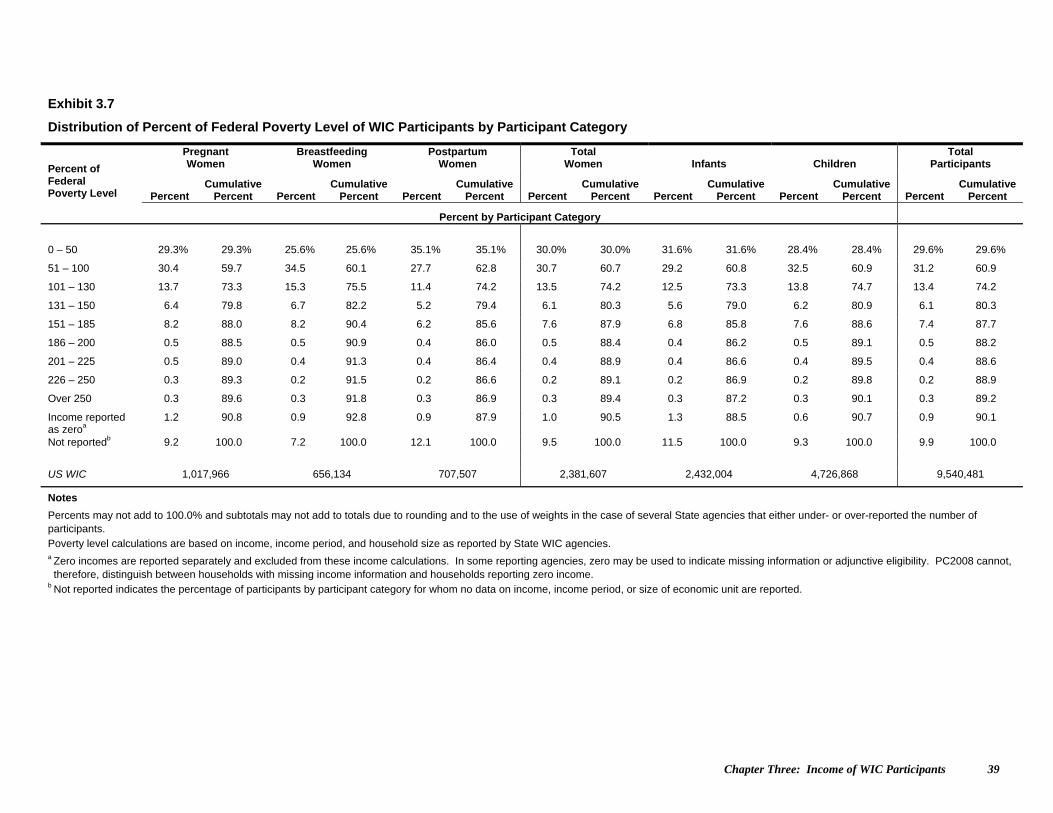
Chapter Three: Income of WIC Participants 39
Exhibit 3.7
Distribution of Percent of Federal Poverty Level of WIC Participants by Participant Category
Pregnant Women
Breastfeeding Women
Postpartum Women
Total Women Infants Children
Total Participants Percent of
Federal Poverty Level Percent
Cumulative Percent Percent
Cumulative Percent Percent
Cumulative Percent Percent
Cumulative Percent Percent
Cumulative Percent Percent
Cumulative Percent Percent
Cumulative Percent
Percent by Participant Category
0 – 50 29.3% 29.3% 25.6% 25.6% 35.1% 35.1% 30.0% 30.0% 31.6% 31.6% 28.4% 28.4% 29.6% 29.6%
51 – 100 30.4 59.7 34.5 60.1 27.7 62.8 30.7 60.7 29.2 60.8 32.5 60.9 31.2 60.9
101 – 130 13.7 73.3 15.3 75.5 11.4 74.2 13.5 74.2 12.5 73.3 13.8 74.7 13.4 74.2
131 – 150 6.4 79.8 6.7 82.2 5.2 79.4 6.1 80.3 5.6 79.0 6.2 80.9 6.1 80.3
151 – 185 8.2 88.0 8.2 90.4 6.2 85.6 7.6 87.9 6.8 85.8 7.6 88.6 7.4 87.7
186 – 200 0.5 88.5 0.5 90.9 0.4 86.0 0.5 88.4 0.4 86.2 0.5 89.1 0.5 88.2
201 – 225 0.5 89.0 0.4 91.3 0.4 86.4 0.4 88.9 0.4 86.6 0.4 89.5 0.4 88.6
226 – 250 0.3 89.3 0.2 91.5 0.2 86.6 0.2 89.1 0.2 86.9 0.2 89.8 0.2 88.9
Over 250 0.3 89.6 0.3 91.8 0.3 86.9 0.3 89.4 0.3 87.2 0.3 90.1 0.3 89.2
Income reported as zeroa
1.2 90.8 0.9 92.8 0.9 87.9 1.0 90.5 1.3 88.5 0.6 90.7 0.9 90.1
Not reportedb 9.2 100.0 7.2 100.0 12.1 100.0 9.5 100.0 11.5 100.0 9.3 100.0 9.9 100.0
US WIC 1,017,966 656,134 707,507 2,381,607 2,432,004 4,726,868 9,540,481
Notes
Percents may not add to 100.0% and subtotals may not add to totals due to rounding and to the use of weights in the case of several State agencies that either under- or over-reported the number of participants. Poverty level calculations are based on income, income period, and household size as reported by State WIC agencies. a Zero incomes are reported separately and excluded from these income calculations. In some reporting agencies, zero may be used to indicate missing information or adjunctive eligibility. PC2008 cannot, therefore, distinguish between households with missing income information and households reporting zero income.
b Not reported indicates the percentage of participants by participant category for whom no data on income, income period, or size of economic unit are reported.
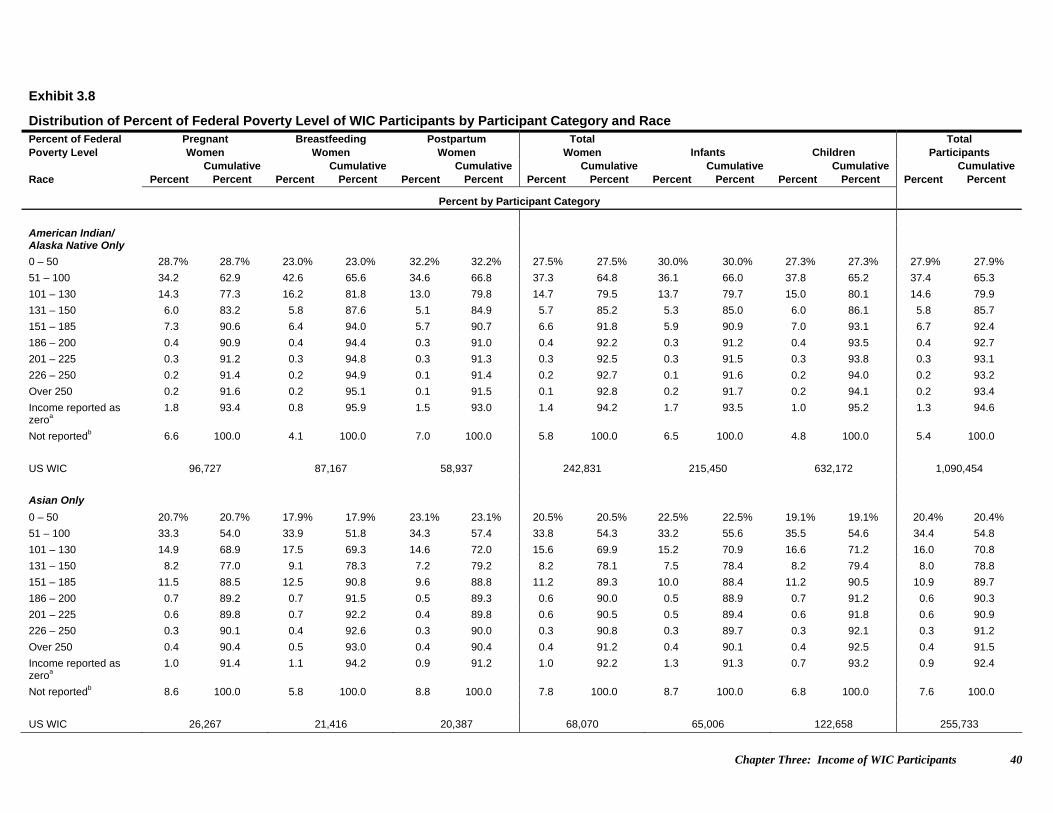
Chapter Three: Income of WIC Participants 40
Exhibit 3.8
Distribution of Percent of Federal Poverty Level of WIC Participants by Participant Category and Race Percent of Federal Poverty Level
Pregnant Women
Breastfeeding Women
Postpartum Women
Total Women Infants Children
Total Participants
Race Percent Cumulative
Percent Percent Cumulative
Percent Percent Cumulative
Percent Percent Cumulative
Percent Percent Cumulative
Percent Percent Cumulative
Percent Percent Cumulative
Percent
Percent by Participant Category
American Indian/ Alaska Native Only
0 – 50 28.7% 28.7% 23.0% 23.0% 32.2% 32.2% 27.5% 27.5% 30.0% 30.0% 27.3% 27.3% 27.9% 27.9%
51 – 100 34.2 62.9 42.6 65.6 34.6 66.8 37.3 64.8 36.1 66.0 37.8 65.2 37.4 65.3
101 – 130 14.3 77.3 16.2 81.8 13.0 79.8 14.7 79.5 13.7 79.7 15.0 80.1 14.6 79.9
131 – 150 6.0 83.2 5.8 87.6 5.1 84.9 5.7 85.2 5.3 85.0 6.0 86.1 5.8 85.7
151 – 185 7.3 90.6 6.4 94.0 5.7 90.7 6.6 91.8 5.9 90.9 7.0 93.1 6.7 92.4
186 – 200 0.4 90.9 0.4 94.4 0.3 91.0 0.4 92.2 0.3 91.2 0.4 93.5 0.4 92.7
201 – 225 0.3 91.2 0.3 94.8 0.3 91.3 0.3 92.5 0.3 91.5 0.3 93.8 0.3 93.1
226 – 250 0.2 91.4 0.2 94.9 0.1 91.4 0.2 92.7 0.1 91.6 0.2 94.0 0.2 93.2
Over 250 0.2 91.6 0.2 95.1 0.1 91.5 0.1 92.8 0.2 91.7 0.2 94.1 0.2 93.4
Income reported as zeroa
1.8 93.4 0.8 95.9 1.5 93.0 1.4 94.2 1.7 93.5 1.0 95.2 1.3 94.6
Not reportedb 6.6 100.0 4.1 100.0 7.0 100.0 5.8 100.0 6.5 100.0 4.8 100.0 5.4 100.0
US WIC 96,727 87,167 58,937 242,831 215,450 632,172 1,090,454
Asian Only
0 – 50 20.7% 20.7% 17.9% 17.9% 23.1% 23.1% 20.5% 20.5% 22.5% 22.5% 19.1% 19.1% 20.4% 20.4%
51 – 100 33.3 54.0 33.9 51.8 34.3 57.4 33.8 54.3 33.2 55.6 35.5 54.6 34.4 54.8
101 – 130 14.9 68.9 17.5 69.3 14.6 72.0 15.6 69.9 15.2 70.9 16.6 71.2 16.0 70.8
131 – 150 8.2 77.0 9.1 78.3 7.2 79.2 8.2 78.1 7.5 78.4 8.2 79.4 8.0 78.8
151 – 185 11.5 88.5 12.5 90.8 9.6 88.8 11.2 89.3 10.0 88.4 11.2 90.5 10.9 89.7
186 – 200 0.7 89.2 0.7 91.5 0.5 89.3 0.6 90.0 0.5 88.9 0.7 91.2 0.6 90.3
201 – 225 0.6 89.8 0.7 92.2 0.4 89.8 0.6 90.5 0.5 89.4 0.6 91.8 0.6 90.9
226 – 250 0.3 90.1 0.4 92.6 0.3 90.0 0.3 90.8 0.3 89.7 0.3 92.1 0.3 91.2
Over 250 0.4 90.4 0.5 93.0 0.4 90.4 0.4 91.2 0.4 90.1 0.4 92.5 0.4 91.5
Income reported as zeroa
1.0 91.4 1.1 94.2 0.9 91.2 1.0 92.2 1.3 91.3 0.7 93.2 0.9 92.4
Not reportedb 8.6 100.0 5.8 100.0 8.8 100.0 7.8 100.0 8.7 100.0 6.8 100.0 7.6 100.0
US WIC 26,267 21,416 20,387 68,070 65,006 122,658 255,733
Chapter Three: Income of WIC Participants 41
Exhibit 3.8 (continued)
Distribution of Percent of Federal Poverty Level of WIC Participants by Participant Category and Race Percent of Federal Poverty Level
Pregnant Women
Breastfeeding Women
Postpartum Women
Total Women Infants Children
Total Participants
Race Percent Cumulative
Percent Percent Cumulative
Percent Percent Cumulative
Percent Percent Cumulative
Percent Percent Cumulative
Percent Percent Cumulative
Percent Percent Cumulative
Percent
Percent by Participant Category
Black/African American Only
0 – 50 41.9% 41.9% 39.0% 39.0% 49.2% 49.2% 43.9% 43.9% 45.9% 45.9% 39.9% 39.9% 42.6% 42.6% 51 – 100 23.1 65.0 25.2 64.2 19.5 68.7 22.3 66.2 20.6 66.5 24.7 64.6 22.9 65.5 101 – 130 9.4 74.5 10.9 75.1 6.7 75.4 8.8 74.9 7.8 74.3 9.4 73.9 8.7 74.3 131 – 150 4.6 79.0 5.3 80.4 3.0 78.4 4.2 79.1 3.6 77.8 4.4 78.3 4.1 78.4 151 – 185 5.9 84.9 6.7 87.0 3.6 82.0 5.2 84.3 4.3 82.2 5.0 83.3 4.9 83.3 186 – 200 0.3 85.2 0.3 87.4 0.2 82.2 0.3 84.6 0.2 82.4 0.3 83.7 0.3 83.5 201 – 225 0.3 85.5 0.3 87.6 0.2 82.4 0.2 84.8 0.2 82.6 0.3 83.9 0.2 83.8 226 – 250 0.2 85.7 0.2 87.8 0.1 82.4 0.1 85.0 0.1 82.7 0.1 84.0 0.1 83.9 Over 250 0.2 85.9 0.2 88.0 0.1 82.6 0.2 85.2 0.2 82.9 0.2 84.3 0.2 84.1 Income reported as zeroa
1.0 86.9 1.0 89.0 0.8 83.4 1.0 86.1 1.3 84.2 0.5 84.8 0.8 84.9
Not reportedb 13.1 100.0 11.0 100.0 16.6 100.0 13.9 100.0 15.8 100.0 15.2 100.0 15.1 100.0 US WIC 192,772 104,589 170,173 467,534 532,638 867,919 1,868,092 Native Hawaiian/Pacific Islander Only
0 – 50 27.7% 27.7% 27.3% 27.3% 34.7% 34.7% 29.3% 29.3% 31.9% 31.9% 32.6% 32.6% 31.6% 31.6% 51 – 100 31.9 59.6 35.7 63.0 30.3 65.0 33.0 62.3 30.2 62.1 32.6 65.2 32.1 63.7 101 – 130 13.6 73.1 13.0 76.0 12.1 77.1 13.0 75.3 12.2 74.3 12.3 77.5 12.4 76.1 131 – 150 6.8 80.0 5.8 81.8 5.6 82.7 6.1 81.4 5.4 79.7 5.4 82.9 5.6 81.7 151 – 185 8.3 88.3 7.0 88.8 6.5 89.3 7.3 88.7 6.4 86.1 6.1 89.0 6.5 88.2 186 – 200 0.5 88.8 0.6 89.3 0.4 89.6 0.5 89.2 0.4 86.5 0.4 89.4 0.4 88.7 201 – 225 0.4 89.1 0.3 89.7 0.3 90.0 0.3 89.6 0.3 86.9 0.4 89.8 0.4 89.0 226 – 250 0.2 89.3 0.3 89.9 0.2 90.2 0.2 89.8 0.2 87.1 0.2 90.0 0.2 89.2 Over 250 0.3 89.6 0.4 90.3 0.2 90.5 0.3 90.1 0.3 87.3 0.3 90.2 0.3 89.5 Income reported as zeroa
1.1 90.7 0.9 91.2 1.7 92.2 1.2 91.3 2.0 89.3 0.7 91.0 1.2 90.7
Not reportedb 9.3 100.0 8.8 100.0 7.8 100.0 8.7 100.0 10.7 100.0 9.0 100.0 9.3 100.0 US WIC 7,161 8,165 5,208 20,534 19,872 40,679 81,084
Chapter Three: Income of WIC Participants 42
Exhibit 3.8 (continued)
Distribution of Percent of Federal Poverty Level of WIC Participants by Participant Category and Race
Percent of Federal Poverty Level
Pregnant Women
Breastfeeding Women
Postpartum Women
Total Women Infants Children
Total Participants
Race Percent Cumulative
Percent Percent Cumulative
Percent Percent Cumulative
Percent Percent Cumulative
Percent Percent Cumulative
Percent Percent Cumulative
Percent Percent Cumulative
Percent
Percent by Participant Category
White Only
0 – 50 26.1% 26.1% 23.1% 23.1% 30.6% 30.6% 26.6% 26.6% 27.0% 27.0% 25.3% 25.3% 26.1% 26.1%
51 – 100 31.7 57.8 35.2 58.2 29.5 60.1 32.0 58.6 31.2 58.2 33.6 58.9 32.6 58.7
101 – 130 14.8 72.6 16.2 74.4 12.9 73.0 14.6 73.2 14.0 72.1 14.7 73.7 14.5 73.2
131 – 150 7.0 79.6 7.2 81.7 6.0 78.9 6.7 80.0 6.4 78.5 6.8 80.5 6.7 79.9
151 – 185 9.0 88.5 8.8 90.5 7.1 86.1 8.4 88.4 7.8 86.3 8.5 89.0 8.3 88.1
186 – 200 0.6 89.1 0.6 91.1 0.5 86.6 0.6 88.9 0.5 86.8 0.6 89.6 0.6 88.7
201 – 225 0.6 89.7 0.5 91.6 0.5 87.1 0.5 89.5 0.5 87.3 0.5 90.1 0.5 89.2
226 – 250 0.3 90.0 0.3 91.8 0.3 87.3 0.3 89.7 0.3 87.6 0.3 90.4 0.3 89.5
Over 250 0.4 90.4 0.3 92.1 0.4 87.7 0.4 90.1 0.4 88.0 0.4 90.8 0.4 89.9
Income reported as zeroa
1.1 91.5 0.8 93.0 0.9 88.6 1.0 91.1 1.2 89.2 0.5 91.3 0.8 90.7
Not reportedb 8.5 100.0 7.0 100.0 11.4 100.0 8.9 100.0 10.8 100.0 8.7 100.0 9.3 100.0
US WIC 657,674 407,022 432,017 1,496,713 1,459,019 2,797,269 5,753,002
Two or More Races
0 – 50 29.2% 29.2% 25.5% 25.5% 34.4% 34.4% 29.4% 29.4% 32.6% 32.6% 28.9% 28.9% 30.1% 30.1%
51 – 100 30.4 59.6 33.0 58.5 28.2 62.6 30.6 60.0 26.7 59.3 30.9 59.8 29.6 59.7
101 – 130 13.6 73.3 15.0 73.5 11.5 74.1 13.5 73.5 11.8 71.1 13.5 73.3 13.0 72.7
131 – 150 6.6 79.9 6.9 80.3 5.3 79.4 6.3 79.9 5.8 77.0 6.5 79.8 6.3 79.0
151 – 185 7.9 87.7 8.3 88.6 6.6 86.0 7.7 87.6 7.2 84.1 8.2 87.9 7.8 86.8
186 – 200 0.5 88.2 0.6 89.2 0.4 86.4 0.5 88.1 0.5 84.7 0.7 88.6 0.6 87.4
201 – 225 0.5 88.8 0.6 89.8 0.5 86.9 0.5 88.6 0.5 85.2 0.6 89.2 0.6 87.9
226 – 250 0.3 89.0 0.3 90.1 0.2 87.1 0.3 88.9 0.3 85.5 0.3 89.5 0.3 88.2
Over 250 0.4 89.4 0.4 90.5 0.3 87.4 0.4 89.2 0.4 85.9 0.5 90.0 0.4 88.7
Income reported as zeroa
1.3 90.7 0.9 91.4 1.2 88.6 1.1 90.4 1.5 87.4 0.7 90.7 1.0 89.7
Not reportedb 9.3 100.0 8.6 100.0 11.4 100.0 9.6 100.0 12.6 100.0 9.3 100.0 10.3 100.0
US WIC 20,500 15,479 12,813 48,793 102,586 195,450 346,829
Chapter Three: Income of WIC Participants 43
Exhibit 3.8 (continued)
Distribution of Percent of Federal Poverty Level of WIC Participants by Participant Category and Race Percent of Federal Poverty Level
Pregnant Women
Breastfeeding Women
Postpartum Women
Total Women Infants Children
Total Participants
Race Percent Cumulative
Percent Percent Cumulative
Percent Percent Cumulative
Percent Percent Cumulative
Percent Percent Cumulative
Percent Percent Cumulative
Percent Percent Cumulative
Percent
Percent by Participant Category
Race Not Reported
0 – 50 26.2% 26.2% 27.0% 27.0% 36.1% 36.1% 28.6% 28.6% 31.8% 31.8% 32.1% 32.1% 31.1% 31.1%
51 – 100 34.6 60.7 38.8 65.9 32.9 69.0 35.6 64.2 34.2 65.9 37.6 69.7 36.2 67.3
101 – 130 14.1 74.8 14.8 80.6 12.3 81.2 13.9 78.1 12.9 78.8 14.6 84.3 14.0 81.3
131 – 150 5.0 79.8 4.6 85.3 4.7 85.9 4.8 82.9 4.2 83.0 4.8 89.2 4.7 86.0
151 – 185 6.8 86.7 5.2 90.5 4.5 90.4 5.8 88.7 5.0 88.0 5.0 94.1 5.2 91.2
186 – 200 0.4 87.0 0.3 90.9 0.2 90.6 0.3 89.1 0.3 88.3 0.4 94.5 0.3 91.5
201 – 225 0.4 87.4 0.2 91.1 0.0 90.8 0.3 89.4 0.3 88.6 0.3 94.8 0.3 91.8
226 – 250 0.2 87.6 0.1 91.2 0.0 90.9 0.2 89.5 0.2 88.7 0.2 95.0 0.2 92.0
Over 250 0.2 87.8 0.1 91.3 0.0 91.1 0.1 89.7 0.1 88.9 0.2 95.1 0.2 92.1
Income reported as zeroa
3.0 90.9 4.0 95.3 1.1 92.1 2.9 92.6 3.2 92.0 0.6 95.7 1.8 94.0
Not reportedb 9.1 100.0 4.7 100.0 7.9 100.0 7.4 100.0 8.0 100.0 4.3 100.0 6.0 100.0
US WIC 16,864 12,297 7,972 37,133 37,433 70,722 145,288
Notes
Percents may not add to 100.0% and subtotals may not add to totals due to rounding and to the use of weights in the case of several State agencies that either under- or over-reported the number of participants. Poverty level calculations are based on income, income period, and household size as reported by State WIC agencies.
a Zero incomes are reported separately and excluded from these income calculations. In some reporting agencies, zero may be used to indicate missing information or adjunctive eligibility. PC2008 cannot, therefore, distinguish between households with missing income information and households reporting zero income.
b Not reported indicates the percentage of participants by participant category for whom no data on income, income period, or size of economic unit are reported.
Chapter Three: Income of WIC Participants 44
Exhibit 3.9
Distribution of Percent of Federal Poverty Level of WIC Participants by Participant Category and Ethnicity Percent of Federal Poverty Level
Pregnant Women
Breastfeeding Women
Postpartum Women
Total Women Infants Children
Total Participants
Ethnicity Percent Cumulative
Percent Percent Cumulative
Percent Percent Cumulative
Percent Percent Cumulative
Percent Percent Cumulative
Percent Percent Cumulative
Percent Percent Cumulative
Percent
Percent by Participant Category
Hispanic/Latino
0 – 50 24.3% 24.3% 22.1% 22.1% 29.1% 29.1% 24.6% 24.6% 26.7% 26.7% 25.9% 25.9% 25.8% 25.8%
51 – 100 37.4 61.7 42.2 64.3 36.6 65.7 38.9 63.5 37.7 64.4 39.3 65.3 38.9 64.7
101 – 130 16.0 77.7 16.5 80.8 14.0 79.6 15.7 79.2 14.6 79.0 15.1 80.4 15.1 79.8
131 – 150 6.6 84.3 5.9 86.7 5.5 85.1 6.1 85.3 5.6 84.6 6.0 86.4 5.9 85.7
151 – 185 8.0 92.3 6.7 93.4 6.2 91.4 7.2 92.5 6.4 91.0 6.9 93.3 6.8 92.6
186 – 200 0.4 92.7 0.4 93.8 0.3 91.7 0.4 92.9 0.4 91.3 0.4 93.8 0.4 93.0
201 – 225 0.3 93.0 0.3 94.1 0.3 92.0 0.3 93.2 0.3 91.6 0.3 94.1 0.3 93.3
226 – 250 0.2 93.2 0.1 94.2 0.1 92.2 0.2 93.3 0.1 91.8 0.2 94.3 0.2 93.5
Over 250 0.2 93.4 0.2 94.4 0.2 92.3 0.2 93.5 0.2 92.0 0.2 94.5 0.2 93.6
Income reported as zeroa
1.3 94.7 0.9 95.4 1.1 93.4 1.1 94.6 1.4 93.4 0.6 95.1 0.9 94.6
Not reportedb 5.3 100.0 4.6 100.0 6.6 100.0 5.4 100.0 6.6 100.0 4.9 100.0 5.4 100.0
US WIC 397,242 333,150 218,158 948,549 943,146 2,124,965 4,016,660
Not Hispanic/Latino
0 – 50 32.6% 32.6% 29.3% 29.3% 37.9% 37.9% 33.7% 33.7% 34.8% 34.8% 30.5% 30.5% 32.5% 32.5%
51 – 100 25.7 58.3 26.3 55.7 23.6 61.5 25.1 58.8 23.7 58.5 26.8 57.2 25.5 58.0
101 – 130 12.2 70.5 14.1 69.7 10.3 71.8 11.9 70.8 11.2 69.7 12.6 69.8 12.0 70.0
131 – 150 6.3 76.8 7.6 77.3 5.0 76.8 6.2 76.9 5.7 75.3 6.5 76.3 6.2 76.2
151 – 185 8.4 85.2 9.8 87.1 6.2 83.0 8.0 84.9 7.2 82.5 8.2 84.6 7.9 84.1
186 – 200 0.6 85.9 0.6 87.8 0.4 83.4 0.6 85.5 0.5 83.0 0.6 85.2 0.6 84.7
201 – 225 0.6 86.4 0.6 88.3 0.4 83.9 0.5 86.0 0.5 83.4 0.5 85.7 0.5 85.2
226 – 250 0.3 86.8 0.3 88.7 0.2 84.1 0.3 86.3 0.3 83.7 0.3 86.0 0.3 85.5
Over 250 0.4 87.2 0.5 89.1 0.4 84.5 0.4 86.7 0.4 84.1 0.5 86.5 0.4 85.9
Income reported as zeroa
1.2 88.4 0.9 90.1 0.9 85.4 1.0 87.7 1.3 85.4 0.6 87.0 0.9 86.8
Not reportedb 11.6 100.0 9.9 100.0 14.6 100.0 12.3 100.0 14.6 100.0 13.0 100.0 13.2 100.0
US WIC 611,354 317,144 484,549 1,413,048 1,468,798 2,565,956 5,447,802
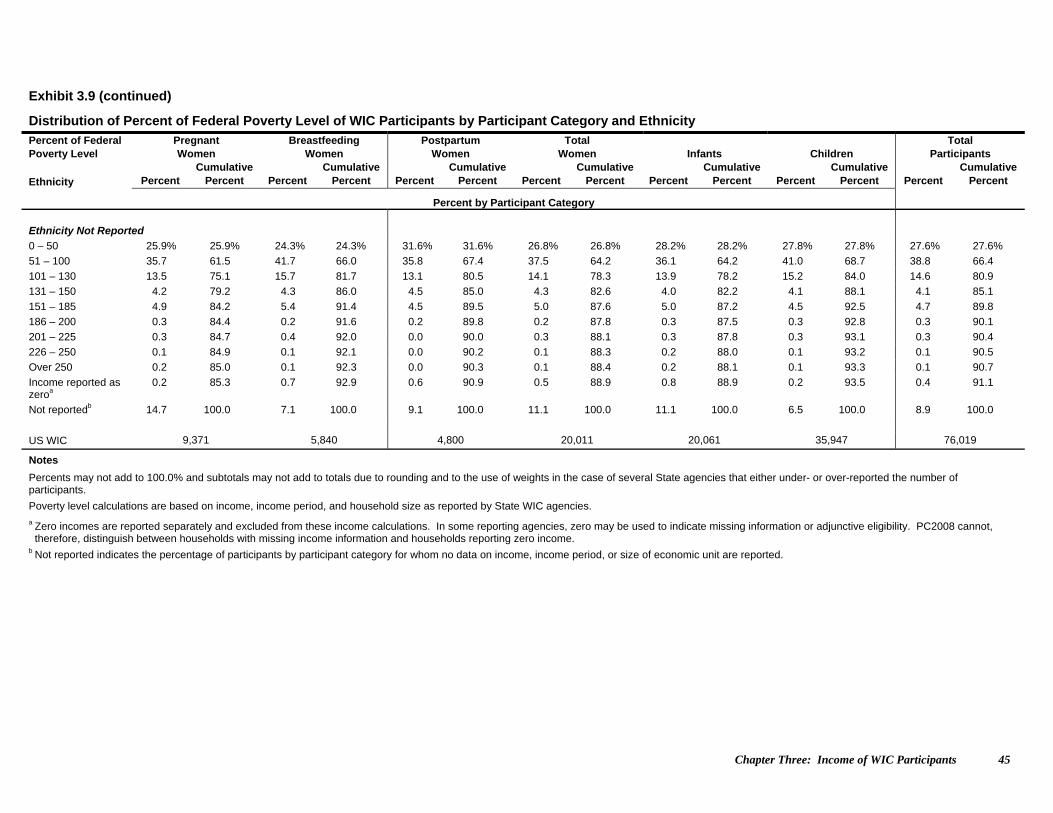
Chapter Three: Income of WIC Participants 45
Exhibit 3.9 (continued)
Distribution of Percent of Federal Poverty Level of WIC Participants by Participant Category and Ethnicity
Percent of Federal Poverty Level
Pregnant Women
Breastfeeding Women
Postpartum Women
Total Women Infants Children
Total Participants
Ethnicity Percent Cumulative
Percent Percent Cumulative
Percent Percent Cumulative
Percent Percent Cumulative
Percent Percent Cumulative
Percent Percent Cumulative
Percent Percent Cumulative
Percent
Percent by Participant Category Ethnicity Not Reported
0 – 50 25.9% 25.9% 24.3% 24.3% 31.6% 31.6% 26.8% 26.8% 28.2% 28.2% 27.8% 27.8% 27.6% 27.6%
51 – 100 35.7 61.5 41.7 66.0 35.8 67.4 37.5 64.2 36.1 64.2 41.0 68.7 38.8 66.4
101 – 130 13.5 75.1 15.7 81.7 13.1 80.5 14.1 78.3 13.9 78.2 15.2 84.0 14.6 80.9
131 – 150 4.2 79.2 4.3 86.0 4.5 85.0 4.3 82.6 4.0 82.2 4.1 88.1 4.1 85.1
151 – 185 4.9 84.2 5.4 91.4 4.5 89.5 5.0 87.6 5.0 87.2 4.5 92.5 4.7 89.8
186 – 200 0.3 84.4 0.2 91.6 0.2 89.8 0.2 87.8 0.3 87.5 0.3 92.8 0.3 90.1
201 – 225 0.3 84.7 0.4 92.0 0.0 90.0 0.3 88.1 0.3 87.8 0.3 93.1 0.3 90.4
226 – 250 0.1 84.9 0.1 92.1 0.0 90.2 0.1 88.3 0.2 88.0 0.1 93.2 0.1 90.5
Over 250 0.2 85.0 0.1 92.3 0.0 90.3 0.1 88.4 0.2 88.1 0.1 93.3 0.1 90.7
Income reported as zeroa
0.2 85.3 0.7 92.9 0.6 90.9 0.5 88.9 0.8 88.9 0.2 93.5 0.4 91.1
Not reportedb 14.7 100.0 7.1 100.0 9.1 100.0 11.1 100.0 11.1 100.0 6.5 100.0 8.9 100.0
US WIC 9,371 5,840 4,800 20,011 20,061 35,947 76,019
Notes
Percents may not add to 100.0% and subtotals may not add to totals due to rounding and to the use of weights in the case of several State agencies that either under- or over-reported the number of participants.
Poverty level calculations are based on income, income period, and household size as reported by State WIC agencies.
a Zero incomes are reported separately and excluded from these income calculations. In some reporting agencies, zero may be used to indicate missing information or adjunctive eligibility. PC2008 cannot, therefore, distinguish between households with missing income information and households reporting zero income.
b Not reported indicates the percentage of participants by participant category for whom no data on income, income period, or size of economic unit are reported.
Chapter Three: Income of WIC Participants 46
Exhibit 3.10 presents the distribution of percent of poverty for WIC recipients who reported no participation in the TANF, Food Stamp, and Medicaid Programs. This group, which accounts for 29.4 percent of the WIC population, is less needy than the WIC population receiving other means-tested benefits. As might be expected, only 47.5 percent of WIC enrollees reporting no participation in other programs were at or below the poverty line as compared with 66.5 percent of the WIC population reporting participation in public aid programs.10 The relative poverty of WIC participants can be seen in the information displayed in Exhibit 3.11. This table contains data on percent of poverty level for the general US population, for American families, and for families with children under six years of age. National data are drawn from the US Census Bureau's Current Population Survey.11 In general, in this country, 12.5 percent of the population are below the poverty line. The rate increases to 18.7 percent for families with children under six years of age. In 2008, 68.3 percent of all WIC participants reported incomes falling below poverty, with one third of participants at or below 50 percent of poverty. WIC participants are clearly concentrated at the lower end of the income distribution across the United States.
10 Poverty status of WIC population reporting participation in public aid programs calculated from data in Exhibits 3.7 and 3.10. 11 The poverty level cutoffs in Exhibit 3.11 are slightly different than the cutoffs in Exhibits 3.5 through 3.10. The Exhibit 3.11 cutoffs match data available on the Current Population Survey website. See http://pubdb3.census.gov/macro/032008/pov/toc.htm (March 2008).
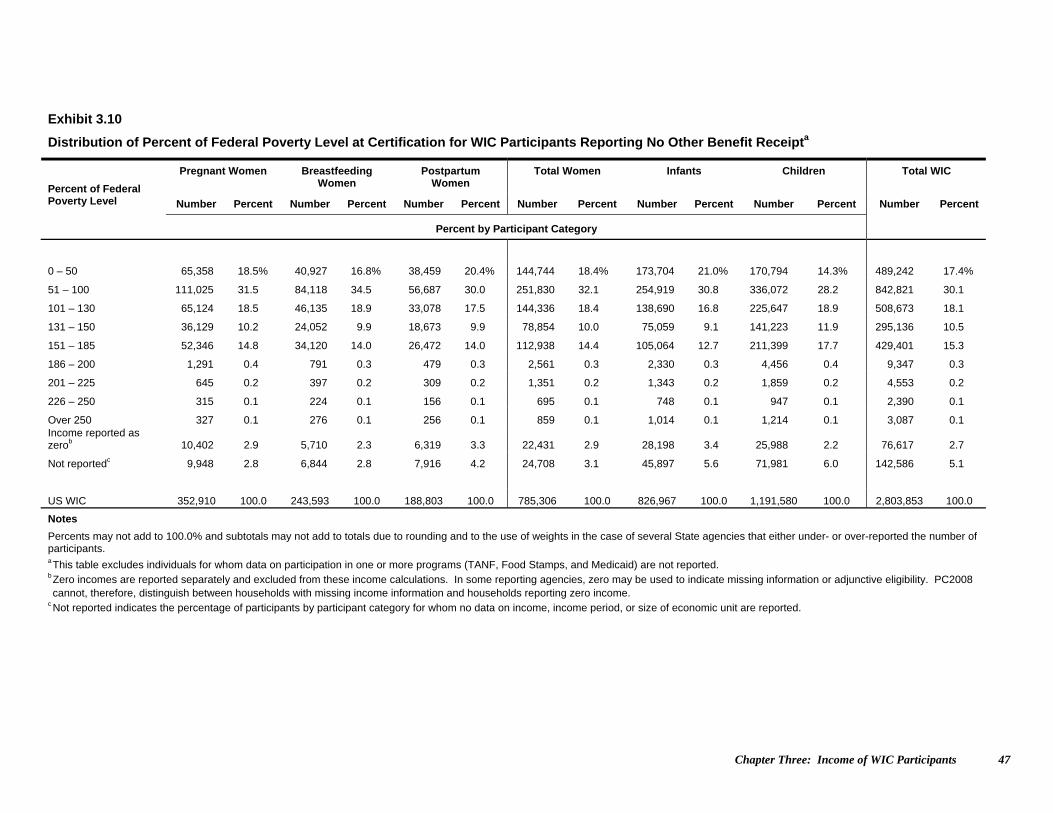
Chapter Three: Income of WIC Participants 47
Exhibit 3.10
Distribution of Percent of Federal Poverty Level at Certification for WIC Participants Reporting No Other Benefit Receipta
Pregnant Women Breastfeeding Women
Postpartum Women
Total Women Infants Children Total WIC
Percent of Federal Poverty Level Number Percent Number Percent Number Percent Number Percent Number Percent Number Percent Number Percent
Percent by Participant Category
0 – 50 65,358 18.5% 40,927 16.8% 38,459 20.4% 144,744 18.4% 173,704 21.0% 170,794 14.3% 489,242 17.4%
51 – 100 111,025 31.5 84,118 34.5 56,687 30.0 251,830 32.1 254,919 30.8 336,072 28.2 842,821 30.1
101 – 130 65,124 18.5 46,135 18.9 33,078 17.5 144,336 18.4 138,690 16.8 225,647 18.9 508,673 18.1
131 – 150 36,129 10.2 24,052 9.9 18,673 9.9 78,854 10.0 75,059 9.1 141,223 11.9 295,136 10.5
151 – 185 52,346 14.8 34,120 14.0 26,472 14.0 112,938 14.4 105,064 12.7 211,399 17.7 429,401 15.3
186 – 200 1,291 0.4 791 0.3 479 0.3 2,561 0.3 2,330 0.3 4,456 0.4 9,347 0.3
201 – 225 645 0.2 397 0.2 309 0.2 1,351 0.2 1,343 0.2 1,859 0.2 4,553 0.2
226 – 250 315 0.1 224 0.1 156 0.1 695 0.1 748 0.1 947 0.1 2,390 0.1
Over 250 327 0.1 276 0.1 256 0.1 859 0.1 1,014 0.1 1,214 0.1 3,087 0.1 Income reported as zerob 10,402 2.9 5,710 2.3 6,319 3.3 22,431 2.9 28,198 3.4 25,988 2.2 76,617 2.7
Not reportedc 9,948 2.8 6,844 2.8 7,916 4.2 24,708 3.1 45,897 5.6 71,981 6.0 142,586 5.1
US WIC 352,910 100.0 243,593 100.0 188,803 100.0 785,306 100.0 826,967 100.0 1,191,580 100.0 2,803,853 100.0
Notes
Percents may not add to 100.0% and subtotals may not add to totals due to rounding and to the use of weights in the case of several State agencies that either under- or over-reported the number of participants. a This table excludes individuals for whom data on participation in one or more programs (TANF, Food Stamps, and Medicaid) are not reported. b Zero incomes are reported separately and excluded from these income calculations. In some reporting agencies, zero may be used to indicate missing information or adjunctive eligibility. PC2008 cannot, therefore, distinguish between households with missing income information and households reporting zero income.
c Not reported indicates the percentage of participants by participant category for whom no data on income, income period, or size of economic unit are reported.
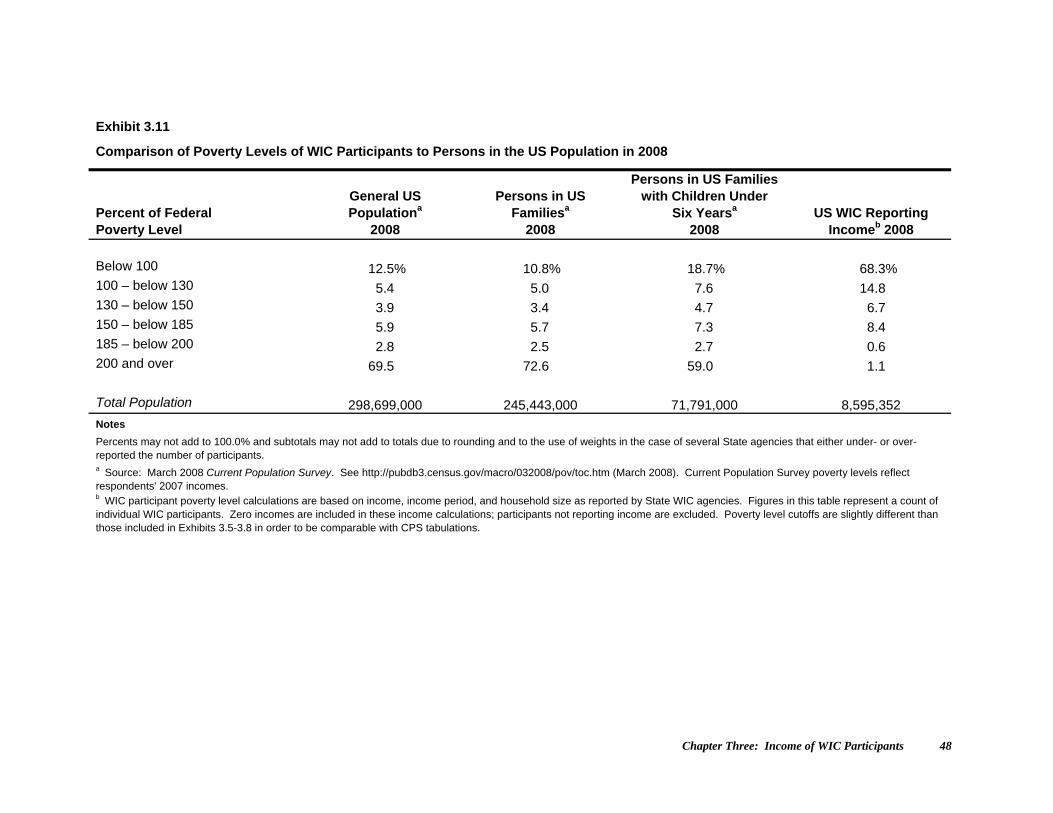
Chapter Three: Income of WIC Participants 48
Exhibit 3.11
Comparison of Poverty Levels of WIC Participants to Persons in the US Population in 2008
Percent of Federal Poverty Level
General US Populationa
2008
Persons in US Familiesa
2008
Persons in US Families with Children Under
Six Yearsa 2008
US WIC Reporting Incomeb 2008
Below 100 12.5% 10.8% 18.7% 68.3% 100 – below 130 5.4 5.0 7.6 14.8 130 – below 150 3.9 3.4 4.7 6.7 150 – below 185 5.9 5.7 7.3 8.4 185 – below 200 2.8 2.5 2.7 0.6 200 and over 69.5 72.6 59.0 1.1 Total Population 298,699,000 245,443,000 71,791,000 8,595,352 Notes
Percents may not add to 100.0% and subtotals may not add to totals due to rounding and to the use of weights in the case of several State agencies that either under- or over-reported the number of participants. a Source: March 2008 Current Population Survey. See http://pubdb3.census.gov/macro/032008/pov/toc.htm (March 2008). Current Population Survey poverty levels reflect respondents' 2007 incomes. b WIC participant poverty level calculations are based on income, income period, and household size as reported by State WIC agencies. Figures in this table represent a count of individual WIC participants. Zero incomes are included in these income calculations; participants not reporting income are excluded. Poverty level cutoffs are slightly different than those included in Exhibits 3.5-3.8 in order to be comparable with CPS tabulations.
Chapter Four: Nutritional Risk Characteristics 49
4. NUTRITIONAL RISK CHARACTERISTICS Applicants must be determined to be at nutritional risk to meet eligibility requirements for the WIC Program. To qualify for WIC benefits, applicants must be determined to be at risk based on anthropometric, biochemical, clinical, or dietary factors. During the determination process, height and weight must be measured, and a blood test for anemia (usually hemoglobin or hematocrit) administered to all participants except infants under nine months of age.1 Medical history and dietary patterns are also considered during this process. A competent professional authority, such as a physician, nutritionist, nurse, or other health professional or paraprofessional, determines nutritional risk. Federal policy prior to 1999 permitted State agencies to develop nutrition risk criteria within broad Federal parameters spelled out in the Child Nutrition Act of 1966, as amended. Accordingly, the nutrition risk criteria used to determine eligibility varied from State to State. WIC Participant and Program Characteristics reports from 1988 through 1998 reflect these differences among States. In 1992, FNS asked the Institute of Medicine at the National Academy of Sciences (NAS) to review the scientific basis for WIC risk criteria and to recommend definitions and cutoffs. The NAS issued a report with recommendations in 1996. This report was the basis for a policy change that took effect April 1, 1999. States are now required to use only criteria and definitions that have been reviewed by the Risk Identification and Selection Collaborative (a joint National WIC Association/FNS working group) and approved by FNS. Definitions of the broad FNS-mandated nutritional risk criteria appear in Exhibit 4.1. Caution should be exercised when comparing PC2006 nutrition risk data with findings from years prior to 2000, as that year was the first time nutrition risk data were reported using uniform criteria and definitions. FNS made revisions to the nutritional risk criteria several times since 1999. Between PC2006 and PC2008, WIC implemented Revision 8 to WIC Policy Memorandum 98-9. This revision consolidated dietary risks and shifted some risks between specific risk categories. The following three sections examine the nutritional risks of WIC participants as determined and reported by local agencies. The fourth section presents information on the height and weight of participants, as measured at certification, and compares the measurements with national norms. Blood values of WIC participants are examined in the final section.
Nutritional Risk Criteria During the eligibility determination (and redetermination) process, WIC staff collect anthropometric, biochemical, medical history, and dietary information from applicants and participants. In order to capture additional information on nutritional risks of WIC participants, starting with 2006, States may report the ten highest priority nutritional risks present at the current certification. Prior to 2006, States were able to report the three highest priority nutritional risks. The percentage of WIC participants for whom more than one nutritional risk was reported decreased from 50.6 in 2006 to 48.9 in 2008. (See Exhibit 4.2.) An infant or child is more likely to have a single nutritional risk reported,
1 Children over two years old with normal blood test results at last certification are also not tested.
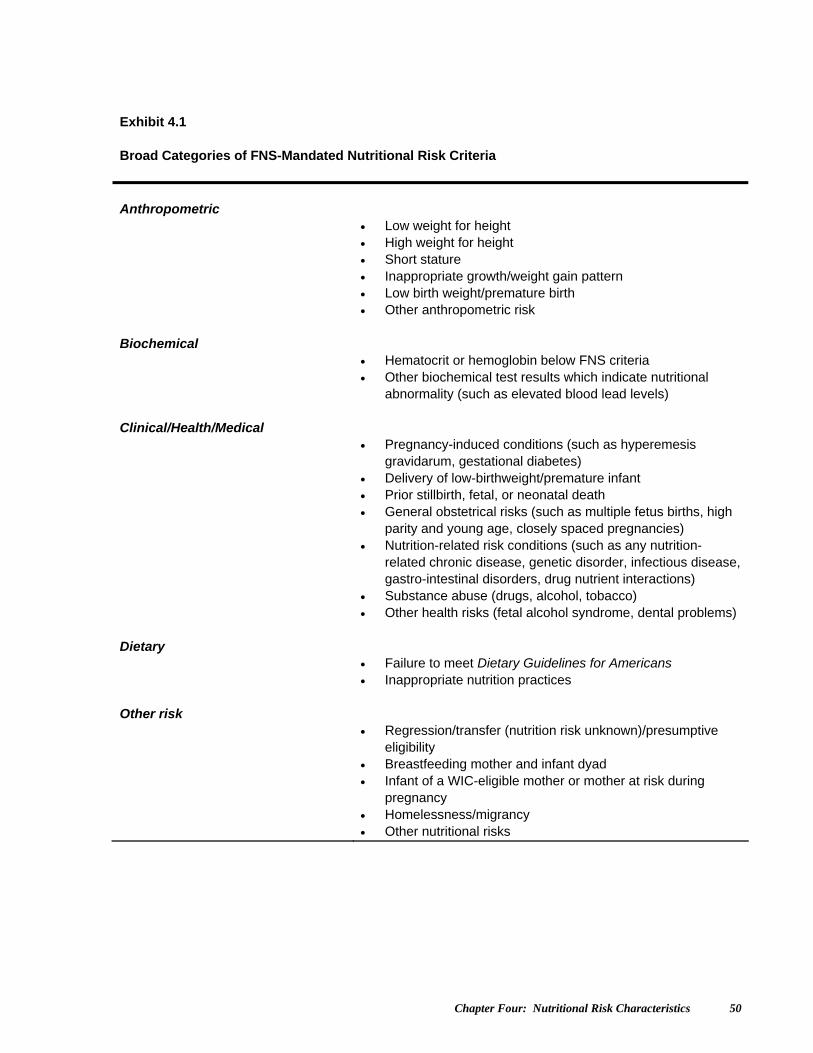
Chapter Four: Nutritional Risk Characteristics 50
Exhibit 4.1 Broad Categories of FNS-Mandated Nutritional Risk Criteria
Anthropometric Low weight for height High weight for height Short stature Inappropriate growth/weight gain pattern Low birth weight/premature birth Other anthropometric risk Biochemical Hematocrit or hemoglobin below FNS criteria Other biochemical test results which indicate nutritional
abnormality (such as elevated blood lead levels) Clinical/Health/Medical Pregnancy-induced conditions (such as hyperemesis
gravidarum, gestational diabetes) Delivery of low-birthweight/premature infant Prior stillbirth, fetal, or neonatal death General obstetrical risks (such as multiple fetus births, high
parity and young age, closely spaced pregnancies) Nutrition-related risk conditions (such as any nutrition-
related chronic disease, genetic disorder, infectious disease, gastro-intestinal disorders, drug nutrient interactions)
Substance abuse (drugs, alcohol, tobacco) Other health risks (fetal alcohol syndrome, dental problems) Dietary Failure to meet Dietary Guidelines for Americans Inappropriate nutrition practices Other risk Regression/transfer (nutrition risk unknown)/presumptive
eligibility Breastfeeding mother and infant dyad Infant of a WIC-eligible mother or mother at risk during
pregnancy Homelessness/migrancy Other nutritional risks
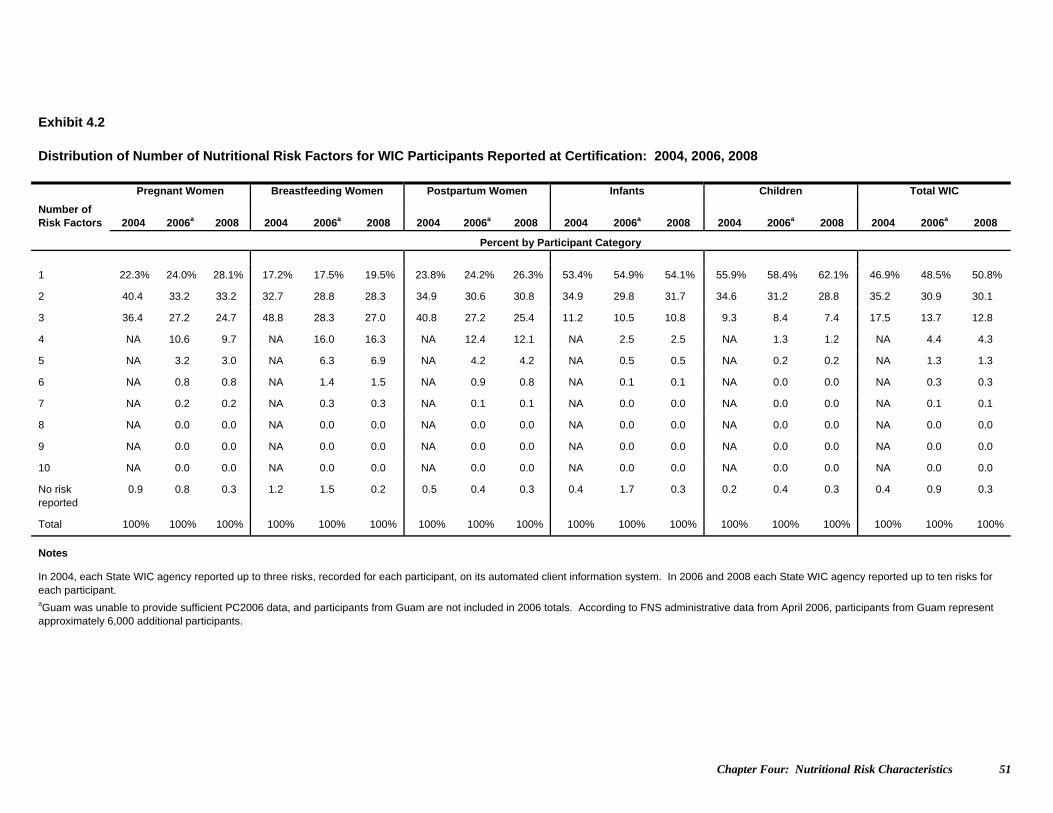
Chapter Four: Nutritional Risk Characteristics 51
Exhibit 4.2 Distribution of Number of Nutritional Risk Factors for WIC Participants Reported at Certification: 2004, 2006, 2008
Pregnant Women Breastfeeding Women Postpartum Women Infants Children Total WIC
Number of Risk Factors 2004 2006a 2008 2004 2006a 2008 2004 2006a 2008 2004 2006a 2008 2004 2006a 2008 2004 2006a 2008
Percent by Participant Category
1 22.3% 24.0% 28.1% 17.2% 17.5% 19.5% 23.8% 24.2% 26.3% 53.4% 54.9% 54.1% 55.9% 58.4% 62.1% 46.9% 48.5% 50.8%
2 40.4 33.2 33.2 32.7 28.8 28.3 34.9 30.6 30.8 34.9 29.8 31.7 34.6 31.2 28.8 35.2 30.9 30.1
3 36.4 27.2 24.7 48.8 28.3 27.0 40.8 27.2 25.4 11.2 10.5 10.8 9.3 8.4 7.4 17.5 13.7 12.8
4 NA 10.6 9.7 NA 16.0 16.3 NA 12.4 12.1 NA 2.5 2.5 NA 1.3 1.2 NA 4.4 4.3
5 NA 3.2 3.0 NA 6.3 6.9 NA 4.2 4.2 NA 0.5 0.5 NA 0.2 0.2 NA 1.3 1.3
6 NA 0.8 0.8 NA 1.4 1.5 NA 0.9 0.8 NA 0.1 0.1 NA 0.0 0.0 NA 0.3 0.3
7 NA 0.2 0.2 NA 0.3 0.3 NA 0.1 0.1 NA 0.0 0.0 NA 0.0 0.0 NA 0.1 0.1
8 NA 0.0 0.0 NA 0.0 0.0 NA 0.0 0.0 NA 0.0 0.0 NA 0.0 0.0 NA 0.0 0.0
9 NA 0.0 0.0 NA 0.0 0.0 NA 0.0 0.0 NA 0.0 0.0 NA 0.0 0.0 NA 0.0 0.0
10 NA 0.0 0.0 NA 0.0 0.0 NA 0.0 0.0 NA 0.0 0.0 NA 0.0 0.0 NA 0.0 0.0
No risk reported
0.9 0.8 0.3 1.2 1.5 0.2 0.5 0.4 0.3 0.4 1.7 0.3 0.2 0.4 0.3 0.4 0.9 0.3
Total 100% 100% 100% 100% 100% 100% 100% 100% 100% 100% 100% 100% 100% 100% 100% 100% 100% 100%
Notes
In 2004, each State WIC agency reported up to three risks, recorded for each participant, on its automated client information system. In 2006 and 2008 each State WIC agency reported up to ten risks for each participant. aGuam was unable to provide sufficient PC2006 data, and participants from Guam are not included in 2006 totals. According to FNS administrative data from April 2006, participants from Guam represent approximately 6,000 additional participants.
Chapter Four: Nutritional Risk Characteristics 52
while breastfeeding women account for the highest percentage of participants reporting three or more nutritional risks. At least one nutritional risk was reported for 99.7 percent of all individuals enrolled in the WIC Program in April 2008.
Nutritional Risks in PC2008 One notable strength of PC2008's census dataset is that it allows examination of nutritional risks for specific participant subgroups, including participant category, age, and race/ethnicity. (Migrant WIC enrollment is described in Chapter Seven.) Consistent with earlier PCs, the most commonly reported broad categories of nutritional risk reported for the entire WIC population are dietary and anthropometric risks (Exhibit 4.3). Distributions vary across participant categories, age, race, and poverty status. A comparison of 2008 and 2006 data in Exhibit 4.3 shows the effect of States’ implementation in 2007 of WIC Policy Memorandum 98-9, Revision 8. This policy revision created two new broad categories of dietary nutritional risks: Failure to meet Dietary Guidelines for Americans and Inappropriate nutrition practices, which replaced the old risk categories of Inadequate / inappropriate nutrient intake and Other dietary risk. (A direct comparison cannot be made between individual risk categories, as there were shifts in specific risks between the broader risk categories.) The revision also established the failure to meet Dietary Guidelines for Americans as a presumed dietary risk criterion for women and children, restricting this assignment to those for whom no other risks were identified, and also requiring a complete nutrition assessment. Application of this policy may account for the decrease in reported dietary risks among WIC women and children. The 2008 results indicate a more than 5 percentage point decrease in the reporting of dietary nutritional risks from 62.2 percent in PC2006 to 56.8 percent in PC2008. This change is most notable among women WIC participants, who saw an approximately 13 percentage point drop in reporting of dietary nutritional risks, from 63.5 percent in PC2006 to 50.6 percent in PC2008 (Exhibit 4.4). Reporting of dietary risks among child WIC participants similarly decreased by 6 percentage points, from 82.6 percent in 2006 to 76.6 percent in 2008 (Exhibit 4.5). Exhibits 4.4 and 4.6 provide information on nutritional risks for women WIC participants. The specific nutritional risks reported most frequently for WIC women in PC2008 are high weight for height (47.1 percent), inappropriate growth or weight gain pattern (30.9 percent), and inappropriate nutritional practices (29.5 percent). Other relatively common risks among WIC women include general obstetrical risks (28.9 percent), blood measurements below FNS mandated criteria (22.6 percent), and failure to meet Dietary Guidelines for Americans (22.2 percent). The broad category of clinical, health, and medical risks was reported for approximately 92 percent of women under 18 years of age compared with approximately 48 percent of women 18 years of age and older. Anthropometric risks, as a broad category, are higher for women 18 years of age and over than for younger women. Broad categories of nutritional risk by age are reported in Exhibit 4.4. The relative prevalence of these nutritional risks vary, however, among pregnant, breastfeeding, and postpartum women (Exhibit 4.6). Similar to previous years, breastfeeding women are more likely to be assigned a risk in the broad category of other risk because it includes the breastfeeding mother/infant dyad. Half (50.0 percent) of breastfeeding women are assigned
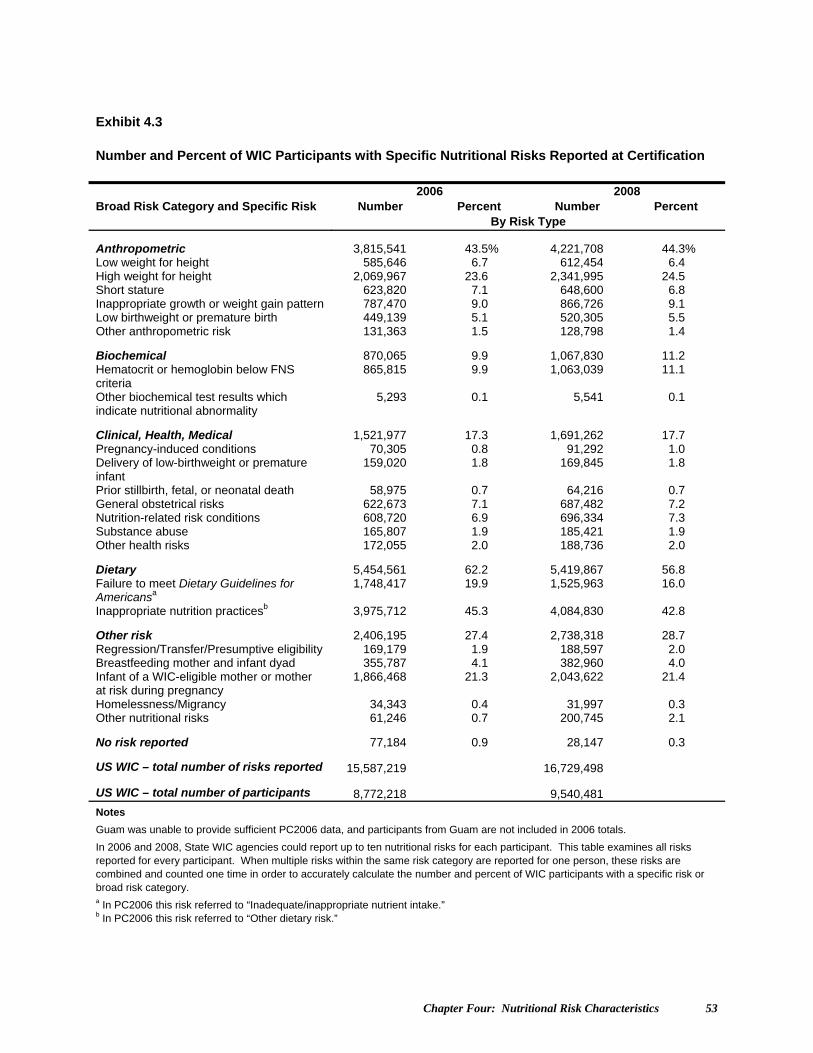
Chapter Four: Nutritional Risk Characteristics 53
Exhibit 4.3 Number and Percent of WIC Participants with Specific Nutritional Risks Reported at Certification
2006 2008 Broad Risk Category and Specific Risk Number Percent Number Percent
By Risk Type
Anthropometric 3,815,541 43.5% 4,221,708 44.3% Low weight for height 585,646 6.7 612,454 6.4 High weight for height 2,069,967 23.6 2,341,995 24.5 Short stature 623,820 7.1 648,600 6.8 Inappropriate growth or weight gain pattern 787,470 9.0 866,726 9.1 Low birthweight or premature birth 449,139 5.1 520,305 5.5 Other anthropometric risk 131,363 1.5 128,798 1.4
Biochemical 870,065 9.9 1,067,830 11.2 Hematocrit or hemoglobin below FNS criteria
865,815 9.9 1,063,039 11.1
Other biochemical test results which indicate nutritional abnormality
5,293 0.1 5,541 0.1
Clinical, Health, Medical 1,521,977 17.3 1,691,262 17.7 Pregnancy-induced conditions 70,305 0.8 91,292 1.0 Delivery of low-birthweight or premature infant
159,020 1.8 169,845 1.8
Prior stillbirth, fetal, or neonatal death 58,975 0.7 64,216 0.7 General obstetrical risks 622,673 7.1 687,482 7.2 Nutrition-related risk conditions 608,720 6.9 696,334 7.3 Substance abuse 165,807 1.9 185,421 1.9 Other health risks 172,055 2.0 188,736 2.0
Dietary 5,454,561 62.2 5,419,867 56.8 Failure to meet Dietary Guidelines for Americansa
1,748,417 19.9 1,525,963 16.0
Inappropriate nutrition practicesb 3,975,712 45.3 4,084,830 42.8
Other risk 2,406,195 27.4 2,738,318 28.7 Regression/Transfer/Presumptive eligibility 169,179 1.9 188,597 2.0 Breastfeeding mother and infant dyad 355,787 4.1 382,960 4.0 Infant of a WIC-eligible mother or mother at risk during pregnancy
1,866,468 21.3 2,043,622 21.4
Homelessness/Migrancy 34,343 0.4 31,997 0.3 Other nutritional risks 61,246 0.7 200,745 2.1
No risk reported 77,184 0.9 28,147 0.3
US WIC – total number of risks reported 15,587,219 16,729,498
US WIC – total number of participants 8,772,218 9,540,481
Notes
Guam was unable to provide sufficient PC2006 data, and participants from Guam are not included in 2006 totals.
In 2006 and 2008, State WIC agencies could report up to ten nutritional risks for each participant. This table examines all risks reported for every participant. When multiple risks within the same risk category are reported for one person, these risks are combined and counted one time in order to accurately calculate the number and percent of WIC participants with a specific risk or broad risk category. a In PC2006 this risk referred to “Inadequate/inappropriate nutrient intake.” b In PC2006 this risk referred to “Other dietary risk.”
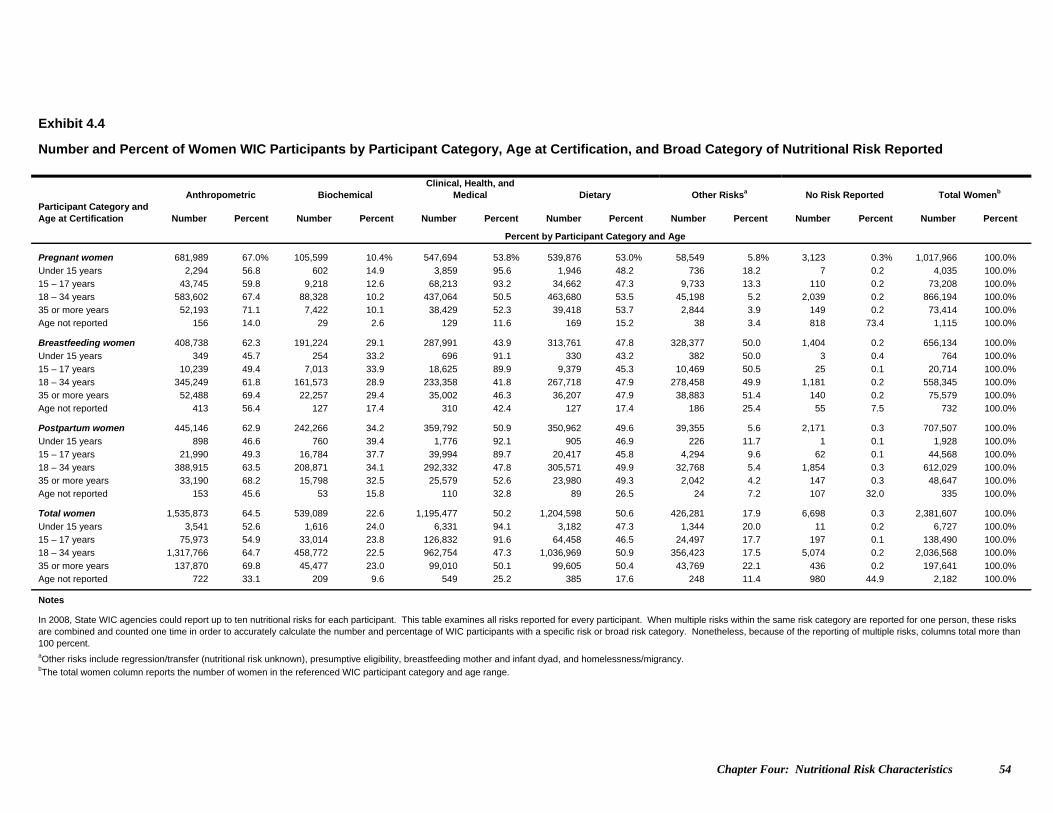
Chapter Four: Nutritional Risk Characteristics 54
Exhibit 4.4
Number and Percent of Women WIC Participants by Participant Category, Age at Certification, and Broad Category of Nutritional Risk Reported
Anthropometric Biochemical Clinical, Health, and
Medical Dietary Other Risksa No Risk Reported Total Womenb Participant Category and Age at Certification Number Percent Number Percent Number Percent Number Percent Number Percent Number Percent Number Percent
Percent by Participant Category and Age
Pregnant women 681,989 67.0% 105,599 10.4% 547,694 53.8% 539,876 53.0% 58,549 5.8% 3,123 0.3% 1,017,966 100.0%
Under 15 years 2,294 56.8 602 14.9 3,859 95.6 1,946 48.2 736 18.2 7 0.2 4,035 100.0%
15 – 17 years 43,745 59.8 9,218 12.6 68,213 93.2 34,662 47.3 9,733 13.3 110 0.2 73,208 100.0%
18 – 34 years 583,602 67.4 88,328 10.2 437,064 50.5 463,680 53.5 45,198 5.2 2,039 0.2 866,194 100.0%
35 or more years 52,193 71.1 7,422 10.1 38,429 52.3 39,418 53.7 2,844 3.9 149 0.2 73,414 100.0%
Age not reported 156 14.0 29 2.6 129 11.6 169 15.2 38 3.4 818 73.4 1,115 100.0%
Breastfeeding women 408,738 62.3 191,224 29.1 287,991 43.9 313,761 47.8 328,377 50.0 1,404 0.2 656,134 100.0%
Under 15 years 349 45.7 254 33.2 696 91.1 330 43.2 382 50.0 3 0.4 764 100.0%
15 – 17 years 10,239 49.4 7,013 33.9 18,625 89.9 9,379 45.3 10,469 50.5 25 0.1 20,714 100.0%
18 – 34 years 345,249 61.8 161,573 28.9 233,358 41.8 267,718 47.9 278,458 49.9 1,181 0.2 558,345 100.0%
35 or more years 52,488 69.4 22,257 29.4 35,002 46.3 36,207 47.9 38,883 51.4 140 0.2 75,579 100.0%
Age not reported 413 56.4 127 17.4 310 42.4 127 17.4 186 25.4 55 7.5 732 100.0%
Postpartum women 445,146 62.9 242,266 34.2 359,792 50.9 350,962 49.6 39,355 5.6 2,171 0.3 707,507 100.0%
Under 15 years 898 46.6 760 39.4 1,776 92.1 905 46.9 226 11.7 1 0.1 1,928 100.0%
15 – 17 years 21,990 49.3 16,784 37.7 39,994 89.7 20,417 45.8 4,294 9.6 62 0.1 44,568 100.0%
18 – 34 years 388,915 63.5 208,871 34.1 292,332 47.8 305,571 49.9 32,768 5.4 1,854 0.3 612,029 100.0%
35 or more years 33,190 68.2 15,798 32.5 25,579 52.6 23,980 49.3 2,042 4.2 147 0.3 48,647 100.0%
Age not reported 153 45.6 53 15.8 110 32.8 89 26.5 24 7.2 107 32.0 335 100.0%
Total women 1,535,873 64.5 539,089 22.6 1,195,477 50.2 1,204,598 50.6 426,281 17.9 6,698 0.3 2,381,607 100.0%
Under 15 years 3,541 52.6 1,616 24.0 6,331 94.1 3,182 47.3 1,344 20.0 11 0.2 6,727 100.0%
15 – 17 years 75,973 54.9 33,014 23.8 126,832 91.6 64,458 46.5 24,497 17.7 197 0.1 138,490 100.0%
18 – 34 years 1,317,766 64.7 458,772 22.5 962,754 47.3 1,036,969 50.9 356,423 17.5 5,074 0.2 2,036,568 100.0%
35 or more years 137,870 69.8 45,477 23.0 99,010 50.1 99,605 50.4 43,769 22.1 436 0.2 197,641 100.0%
Age not reported 722 33.1 209 9.6 549 25.2 385 17.6 248 11.4 980 44.9 2,182 100.0%
Notes
In 2008, State WIC agencies could report up to ten nutritional risks for each participant. This table examines all risks reported for every participant. When multiple risks within the same risk category are reported for one person, these risks are combined and counted one time in order to accurately calculate the number and percentage of WIC participants with a specific risk or broad risk category. Nonetheless, because of the reporting of multiple risks, columns total more than 100 percent. aOther risks include regression/transfer (nutritional risk unknown), presumptive eligibility, breastfeeding mother and infant dyad, and homelessness/migrancy. bThe total women column reports the number of women in the referenced WIC participant category and age range.
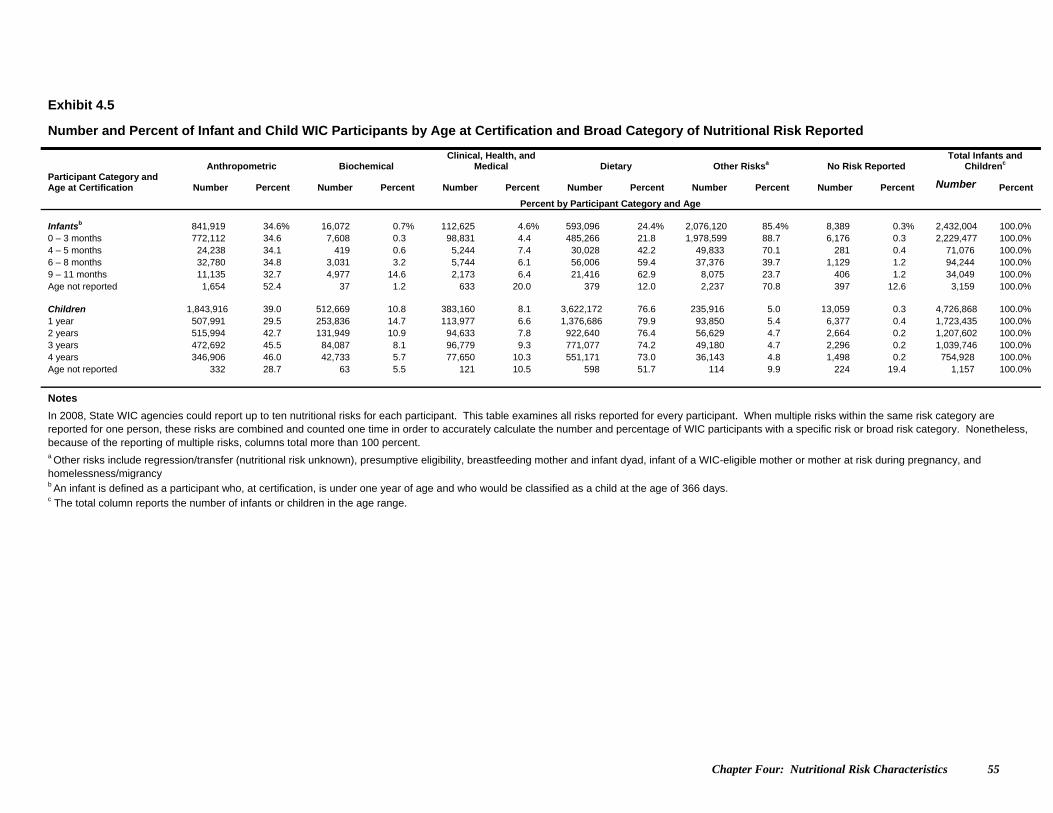
Chapter Four: Nutritional Risk Characteristics 55
Exhibit 4.5
Number and Percent of Infant and Child WIC Participants by Age at Certification and Broad Category of Nutritional Risk Reported
Anthropometric Biochemical
Clinical, Health, and Medical Dietary Other Risksa No Risk Reported
Total Infants and Childrenc
Participant Category and Age at Certification Number Percent Number Percent Number Percent Number Percent Number Percent Number Percent Number Percent
Percent by Participant Category and Age
Infantsb 841,919 34.6% 16,072 0.7% 112,625 4.6% 593,096 24.4% 2,076,120 85.4% 8,389 0.3% 2,432,004 100.0% 0 – 3 months 772,112 34.6 7,608 0.3 98,831 4.4 485,266 21.8 1,978,599 88.7 6,176 0.3 2,229,477 100.0% 4 – 5 months 24,238 34.1 419 0.6 5,244 7.4 30,028 42.2 49,833 70.1 281 0.4 71,076 100.0% 6 – 8 months 32,780 34.8 3,031 3.2 5,744 6.1 56,006 59.4 37,376 39.7 1,129 1.2 94,244 100.0% 9 – 11 months 11,135 32.7 4,977 14.6 2,173 6.4 21,416 62.9 8,075 23.7 406 1.2 34,049 100.0% Age not reported 1,654 52.4 37 1.2 633 20.0 379 12.0 2,237 70.8 397 12.6 3,159 100.0%
Children 1,843,916 39.0 512,669 10.8 383,160 8.1 3,622,172 76.6 235,916 5.0 13,059 0.3 4,726,868 100.0% 1 year 507,991 29.5 253,836 14.7 113,977 6.6 1,376,686 79.9 93,850 5.4 6,377 0.4 1,723,435 100.0% 2 years 515,994 42.7 131,949 10.9 94,633 7.8 922,640 76.4 56,629 4.7 2,664 0.2 1,207,602 100.0% 3 years 472,692 45.5 84,087 8.1 96,779 9.3 771,077 74.2 49,180 4.7 2,296 0.2 1,039,746 100.0% 4 years 346,906 46.0 42,733 5.7 77,650 10.3 551,171 73.0 36,143 4.8 1,498 0.2 754,928 100.0% Age not reported 332 28.7 63 5.5 121 10.5 598 51.7 114 9.9 224 19.4 1,157 100.0%
Notes
In 2008, State WIC agencies could report up to ten nutritional risks for each participant. This table examines all risks reported for every participant. When multiple risks within the same risk category are reported for one person, these risks are combined and counted one time in order to accurately calculate the number and percentage of WIC participants with a specific risk or broad risk category. Nonetheless, because of the reporting of multiple risks, columns total more than 100 percent. a Other risks include regression/transfer (nutritional risk unknown), presumptive eligibility, breastfeeding mother and infant dyad, infant of a WIC-eligible mother or mother at risk during pregnancy, and homelessness/migrancy b An infant is defined as a participant who, at certification, is under one year of age and who would be classified as a child at the age of 366 days. c The total column reports the number of infants or children in the age range.
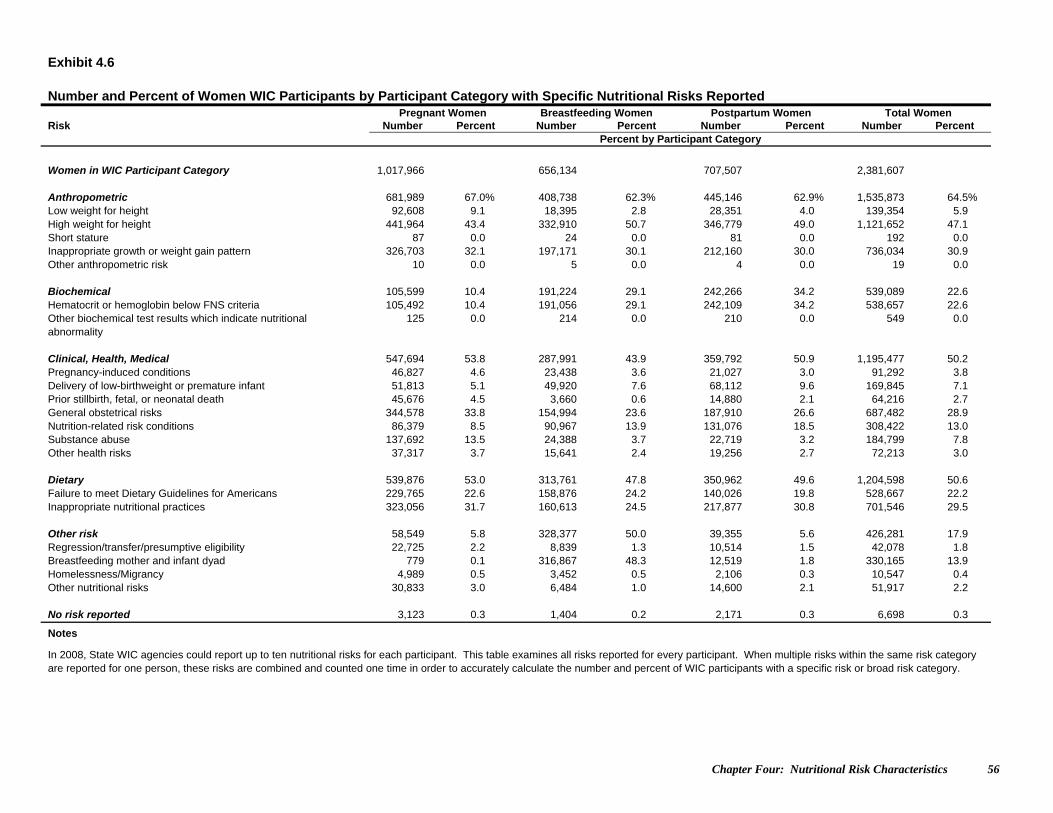
Chapter Four: Nutritional Risk Characteristics 56
Exhibit 4.6 Number and Percent of Women WIC Participants by Participant Category with Specific Nutritional Risks Reported Pregnant Women Breastfeeding Women Postpartum Women Total Women Risk Number Percent Number Percent Number Percent Number Percent Percent by Participant Category
Women in WIC Participant Category 1,017,966 656,134 707,507 2,381,607 Anthropometric 681,989 67.0% 408,738 62.3% 445,146 62.9% 1,535,873 64.5% Low weight for height 92,608 9.1 18,395 2.8 28,351 4.0 139,354 5.9 High weight for height 441,964 43.4 332,910 50.7 346,779 49.0 1,121,652 47.1 Short stature 87 0.0 24 0.0 81 0.0 192 0.0 Inappropriate growth or weight gain pattern 326,703 32.1 197,171 30.1 212,160 30.0 736,034 30.9 Other anthropometric risk 10 0.0 5 0.0 4 0.0 19 0.0 Biochemical 105,599 10.4 191,224 29.1 242,266 34.2 539,089 22.6 Hematocrit or hemoglobin below FNS criteria 105,492 10.4 191,056 29.1 242,109 34.2 538,657 22.6 Other biochemical test results which indicate nutritional abnormality
125 0.0 214 0.0 210 0.0 549 0.0
Clinical, Health, Medical 547,694 53.8 287,991 43.9 359,792 50.9 1,195,477 50.2 Pregnancy-induced conditions 46,827 4.6 23,438 3.6 21,027 3.0 91,292 3.8 Delivery of low-birthweight or premature infant 51,813 5.1 49,920 7.6 68,112 9.6 169,845 7.1 Prior stillbirth, fetal, or neonatal death 45,676 4.5 3,660 0.6 14,880 2.1 64,216 2.7 General obstetrical risks 344,578 33.8 154,994 23.6 187,910 26.6 687,482 28.9 Nutrition-related risk conditions 86,379 8.5 90,967 13.9 131,076 18.5 308,422 13.0 Substance abuse 137,692 13.5 24,388 3.7 22,719 3.2 184,799 7.8 Other health risks 37,317 3.7 15,641 2.4 19,256 2.7 72,213 3.0 Dietary 539,876 53.0 313,761 47.8 350,962 49.6 1,204,598 50.6 Failure to meet Dietary Guidelines for Americans 229,765 22.6 158,876 24.2 140,026 19.8 528,667 22.2 Inappropriate nutritional practices 323,056 31.7 160,613 24.5 217,877 30.8 701,546 29.5 Other risk 58,549 5.8 328,377 50.0 39,355 5.6 426,281 17.9 Regression/transfer/presumptive eligibility 22,725 2.2 8,839 1.3 10,514 1.5 42,078 1.8 Breastfeeding mother and infant dyad 779 0.1 316,867 48.3 12,519 1.8 330,165 13.9 Homelessness/Migrancy 4,989 0.5 3,452 0.5 2,106 0.3 10,547 0.4 Other nutritional risks 30,833 3.0 6,484 1.0 14,600 2.1 51,917 2.2 No risk reported 3,123 0.3 1,404 0.2 2,171 0.3 6,698 0.3
Notes
In 2008, State WIC agencies could report up to ten nutritional risks for each participant. This table examines all risks reported for every participant. When multiple risks within the same risk category are reported for one person, these risks are combined and counted one time in order to accurately calculate the number and percent of WIC participants with a specific risk or broad risk category.
Chapter Four: Nutritional Risk Characteristics 57
to the other risk category compared with only 5.8 percent of pregnant and 5.6 percent of postpartum women. Pregnant women are more likely to be assigned to general obstetrical risks and less likely to be assigned to hematocrit/hemoglobin below FNS criteria than other WIC women. General obstetrical risks were assigned to 33.8 percent of pregnant women compared with 23.6 percent and 26.6 percent of breastfeeding and postpartum women, respectively. Hematocrit or hemoglobin below FNS criteria was assigned to only 10.4 percent of pregnant women compared with 29.1 percent of breastfeeding women and 34.2 percent of postpartum women. The percentage of women in all categories assigned the risk of hematocrit or hemoglobin below FNS criteria, has been increasing slowly, but steadily since PC2002. In PC2008, 22.6 percent of women were assigned this risk compared to 16.1 percent in PC2002. However, the current prevalence levels, especially for pregnant women, are still below levels observed in PC98. 2 Nutritional risks for infants vary by age at certification (Exhibits 4.5 and 4.7). At certification, more than four-fifths (87.1 percent) of infants aged zero to three months and almost two-thirds (62.5 percent) of infants aged four and five months are at risk because their mothers are WIC-eligible or were at risk during pregnancy. The broad category of dietary risks is more likely to be reported for older infants—59.4 percent of infants certified between six and eight months were assigned this risk, and 62.9 percent of nine-to-eleven-month-old infants had this designation. One-third (34.6 percent) of all infants are certified in the broad anthropometric risk category, most commonly low birthweight, short stature, or low weight for length/height. The most common broad categories of nutritional risks reported for children are dietary risks (76.6 percent) and anthropometric risks (39.0 percent). (See Exhibits 4.5 and 4.8.) Exhibit 4.9 presents the most frequently reported risks, by participant category, in 2004, 2006, and 2008. While there are slight variations in frequencies and patterns of frequencies, the direction and occurrence of nutritional risks is similar across the years. The information in Exhibit 4.10 refines such information, presenting the most frequently reported risks for pregnant women by age at certification. Exhibits 4.11 through 4.26 show specific and broad categories of nutrition risks by race and ethnicity. The general patterns of reported nutritional risks by race/ethnicity are similar to the PC2006 results. Blood measurements below FNS criteria occur most frequently among pregnant Black/African American Only women WIC enrollees. Asian Only pregnant women are more likely to report low weight for height while Black/African American Only women and American Indian/Alaska Native Only women are more likely to
2 Prior PC reports suggested that the decline observed between PC98 and PC2002 may have been affected by three policy changes. First, the observed decrease may be related to a 2000 policy change that allows WIC enrollees 90 days in which to complete blood tests. As a consequence, hematocrit or hemoglobin below FNS criteria was less likely than before 2000 to be assigned to pregnant women at certification. Second, a decrease in the percent of pregnant women assigned this risk may also be associated with WIC’s efforts to increase the number and percent of pregnant women certified by WIC during the first trimester when rates of anemia are generally lower. Finally, the observed decrease may also be related to conversion to the FNS uniform nutrition risk criteria, which raised the cutoff point for anemia in some States.
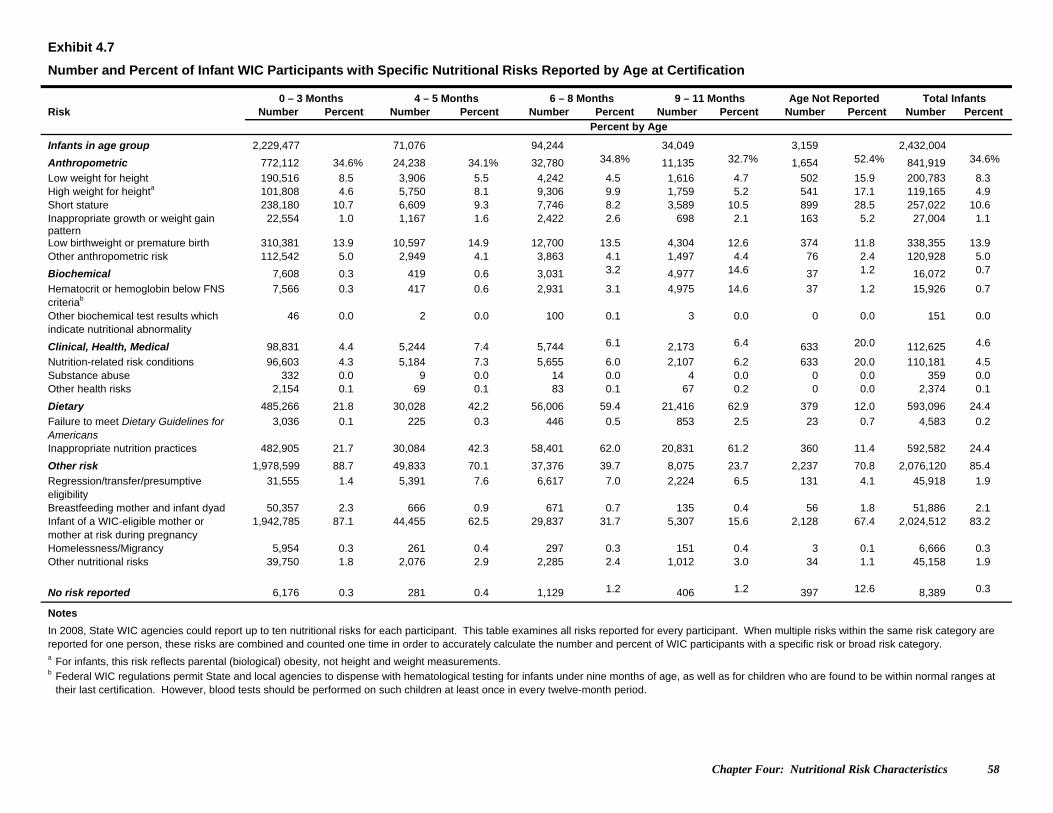
Chapter Four: Nutritional Risk Characteristics 58
Exhibit 4.7
Number and Percent of Infant WIC Participants with Specific Nutritional Risks Reported by Age at Certification
0 – 3 Months 4 – 5 Months 6 – 8 Months 9 – 11 Months Age Not Reported Total Infants Risk Number Percent Number Percent Number Percent Number Percent Number Percent Number Percent Percent by Age
Infants in age group 2,229,477 71,076 94,244 34,049 3,159 2,432,004
Anthropometric 772,112 34.6% 24,238 34.1% 32,780 34.8% 11,135 32.7% 1,654 52.4% 841,919 34.6%
Low weight for height 190,516 8.5 3,906 5.5 4,242 4.5 1,616 4.7 502 15.9 200,783 8.3 High weight for heighta 101,808 4.6 5,750 8.1 9,306 9.9 1,759 5.2 541 17.1 119,165 4.9 Short stature 238,180 10.7 6,609 9.3 7,746 8.2 3,589 10.5 899 28.5 257,022 10.6 Inappropriate growth or weight gain pattern
22,554 1.0 1,167 1.6 2,422 2.6 698 2.1 163 5.2 27,004 1.1
Low birthweight or premature birth 310,381 13.9 10,597 14.9 12,700 13.5 4,304 12.6 374 11.8 338,355 13.9 Other anthropometric risk 112,542 5.0 2,949 4.1 3,863 4.1 1,497 4.4 76 2.4 120,928 5.0
Biochemical 7,608 0.3 419 0.6 3,031 3.2 4,977 14.6 37 1.2 16,072 0.7
Hematocrit or hemoglobin below FNS criteriab
7,566 0.3 417 0.6 2,931 3.1 4,975 14.6 37 1.2 15,926 0.7
Other biochemical test results which indicate nutritional abnormality
46 0.0 2 0.0 100 0.1 3 0.0 0 0.0 151 0.0
Clinical, Health, Medical 98,831 4.4 5,244 7.4 5,744 6.1 2,173 6.4 633 20.0 112,625 4.6
Nutrition-related risk conditions 96,603 4.3 5,184 7.3 5,655 6.0 2,107 6.2 633 20.0 110,181 4.5 Substance abuse 332 0.0 9 0.0 14 0.0 4 0.0 0 0.0 359 0.0 Other health risks 2,154 0.1 69 0.1 83 0.1 67 0.2 0 0.0 2,374 0.1
Dietary 485,266 21.8 30,028 42.2 56,006 59.4 21,416 62.9 379 12.0 593,096 24.4
Failure to meet Dietary Guidelines for Americans
3,036 0.1 225 0.3 446 0.5 853 2.5 23 0.7 4,583 0.2
Inappropriate nutrition practices 482,905 21.7 30,084 42.3 58,401 62.0 20,831 61.2 360 11.4 592,582 24.4
Other risk 1,978,599 88.7 49,833 70.1 37,376 39.7 8,075 23.7 2,237 70.8 2,076,120 85.4
Regression/transfer/presumptive eligibility
31,555 1.4 5,391 7.6 6,617 7.0 2,224 6.5 131 4.1 45,918 1.9
Breastfeeding mother and infant dyad 50,357 2.3 666 0.9 671 0.7 135 0.4 56 1.8 51,886 2.1 Infant of a WIC-eligible mother or mother at risk during pregnancy
1,942,785 87.1 44,455 62.5 29,837 31.7 5,307 15.6 2,128 67.4 2,024,512 83.2
Homelessness/Migrancy 5,954 0.3 261 0.4 297 0.3 151 0.4 3 0.1 6,666 0.3 Other nutritional risks 39,750 1.8 2,076 2.9 2,285 2.4 1,012 3.0 34 1.1 45,158 1.9
No risk reported 6,176 0.3 281 0.4 1,129 1.2 406 1.2 397 12.6 8,389 0.3
Notes
In 2008, State WIC agencies could report up to ten nutritional risks for each participant. This table examines all risks reported for every participant. When multiple risks within the same risk category are reported for one person, these risks are combined and counted one time in order to accurately calculate the number and percent of WIC participants with a specific risk or broad risk category. a For infants, this risk reflects parental (biological) obesity, not height and weight measurements. b Federal WIC regulations permit State and local agencies to dispense with hematological testing for infants under nine months of age, as well as for children who are found to be within normal ranges at
their last certification. However, blood tests should be performed on such children at least once in every twelve-month period.
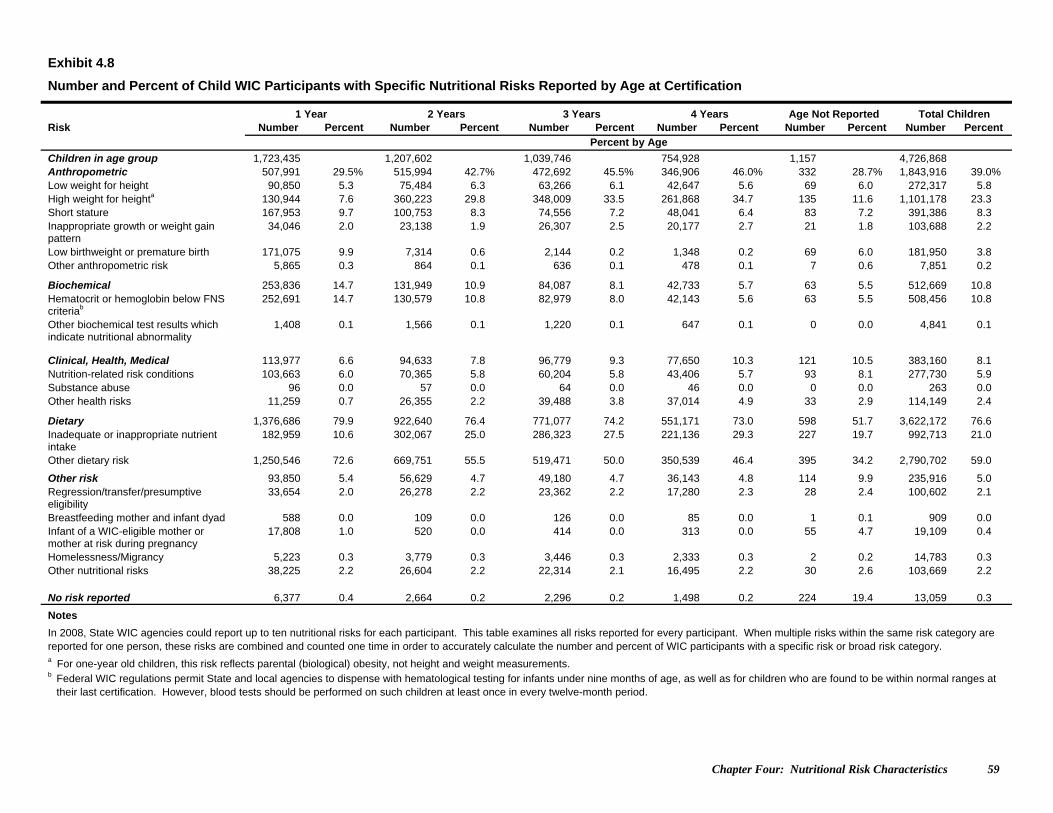
Chapter Four: Nutritional Risk Characteristics 59
Exhibit 4.8
Number and Percent of Child WIC Participants with Specific Nutritional Risks Reported by Age at Certification
1 Year 2 Years 3 Years 4 Years Age Not Reported Total Children Risk Number Percent Number Percent Number Percent Number Percent Number Percent Number Percent Percent by Age
Children in age group 1,723,435 1,207,602 1,039,746 754,928 1,157 4,726,868 Anthropometric 507,991 29.5% 515,994 42.7% 472,692 45.5% 346,906 46.0% 332 28.7% 1,843,916 39.0% Low weight for height 90,850 5.3 75,484 6.3 63,266 6.1 42,647 5.6 69 6.0 272,317 5.8 High weight for heighta 130,944 7.6 360,223 29.8 348,009 33.5 261,868 34.7 135 11.6 1,101,178 23.3 Short stature 167,953 9.7 100,753 8.3 74,556 7.2 48,041 6.4 83 7.2 391,386 8.3 Inappropriate growth or weight gain pattern
34,046 2.0 23,138 1.9 26,307 2.5 20,177 2.7 21 1.8 103,688 2.2
Low birthweight or premature birth 171,075 9.9 7,314 0.6 2,144 0.2 1,348 0.2 69 6.0 181,950 3.8 Other anthropometric risk 5,865 0.3 864 0.1 636 0.1 478 0.1 7 0.6 7,851 0.2
Biochemical 253,836 14.7 131,949 10.9 84,087 8.1 42,733 5.7 63 5.5 512,669 10.8 Hematocrit or hemoglobin below FNS criteriab
252,691 14.7 130,579 10.8 82,979 8.0 42,143 5.6 63 5.5 508,456 10.8
Other biochemical test results which indicate nutritional abnormality
1,408 0.1 1,566 0.1 1,220 0.1 647 0.1 0 0.0 4,841 0.1
Clinical, Health, Medical 113,977 6.6 94,633 7.8 96,779 9.3 77,650 10.3 121 10.5 383,160 8.1 Nutrition-related risk conditions 103,663 6.0 70,365 5.8 60,204 5.8 43,406 5.7 93 8.1 277,730 5.9 Substance abuse 96 0.0 57 0.0 64 0.0 46 0.0 0 0.0 263 0.0 Other health risks 11,259 0.7 26,355 2.2 39,488 3.8 37,014 4.9 33 2.9 114,149 2.4
Dietary 1,376,686 79.9 922,640 76.4 771,077 74.2 551,171 73.0 598 51.7 3,622,172 76.6 Inadequate or inappropriate nutrient intake
182,959 10.6 302,067 25.0 286,323 27.5 221,136 29.3 227 19.7 992,713 21.0
Other dietary risk 1,250,546 72.6 669,751 55.5 519,471 50.0 350,539 46.4 395 34.2 2,790,702 59.0
Other risk 93,850 5.4 56,629 4.7 49,180 4.7 36,143 4.8 114 9.9 235,916 5.0 Regression/transfer/presumptive eligibility
33,654 2.0 26,278 2.2 23,362 2.2 17,280 2.3 28 2.4 100,602 2.1
Breastfeeding mother and infant dyad 588 0.0 109 0.0 126 0.0 85 0.0 1 0.1 909 0.0 Infant of a WIC-eligible mother or mother at risk during pregnancy
17,808 1.0 520 0.0 414 0.0 313 0.0 55 4.7 19,109 0.4
Homelessness/Migrancy 5,223 0.3 3,779 0.3 3,446 0.3 2,333 0.3 2 0.2 14,783 0.3 Other nutritional risks 38,225 2.2 26,604 2.2 22,314 2.1 16,495 2.2 30 2.6 103,669 2.2 No risk reported 6,377 0.4 2,664 0.2 2,296 0.2 1,498 0.2 224 19.4 13,059 0.3
Notes
In 2008, State WIC agencies could report up to ten nutritional risks for each participant. This table examines all risks reported for every participant. When multiple risks within the same risk category are reported for one person, these risks are combined and counted one time in order to accurately calculate the number and percent of WIC participants with a specific risk or broad risk category. a For one-year old children, this risk reflects parental (biological) obesity, not height and weight measurements. b Federal WIC regulations permit State and local agencies to dispense with hematological testing for infants under nine months of age, as well as for children who are found to be within normal ranges at
their last certification. However, blood tests should be performed on such children at least once in every twelve-month period.
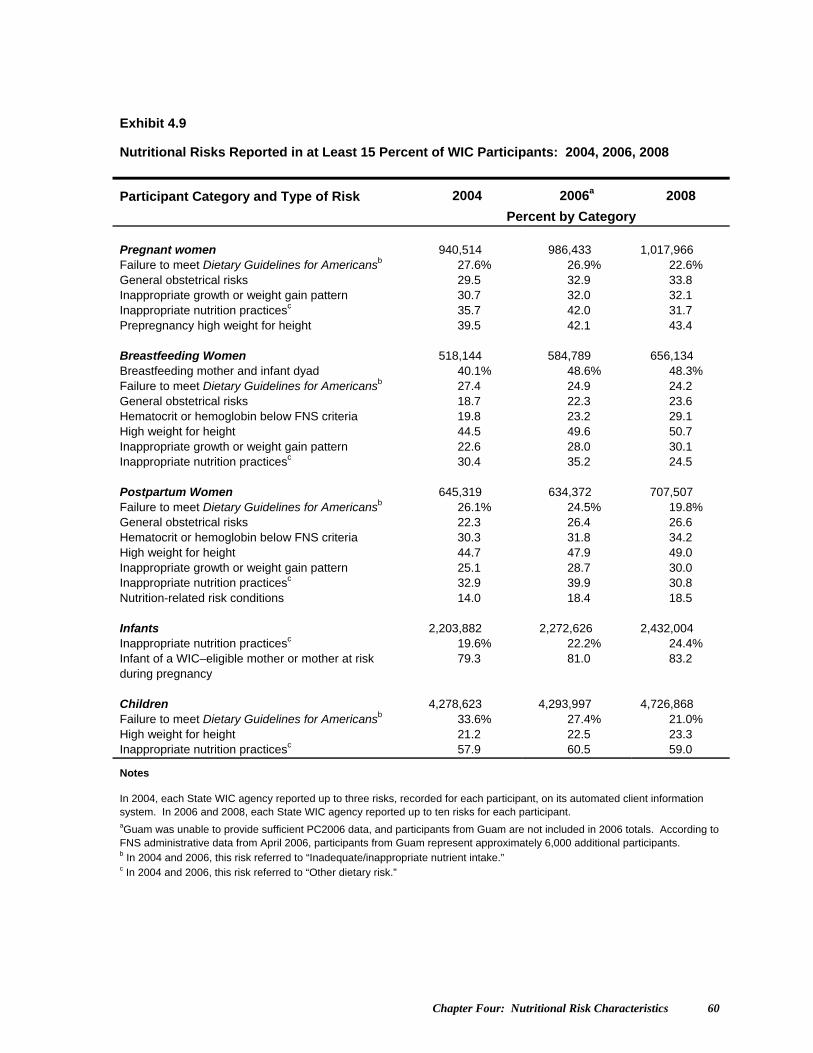
Chapter Four: Nutritional Risk Characteristics 60
Exhibit 4.9
Nutritional Risks Reported in at Least 15 Percent of WIC Participants: 2004, 2006, 2008
Participant Category and Type of Risk 2004 2006a 2008
Percent by Category
Pregnant women 940,514 986,433 1,017,966 Failure to meet Dietary Guidelines for Americansb 27.6% 26.9% 22.6% General obstetrical risks 29.5 32.9 33.8 Inappropriate growth or weight gain pattern 30.7 32.0 32.1 Inappropriate nutrition practicesc 35.7 42.0 31.7 Prepregnancy high weight for height 39.5 42.1 43.4 Breastfeeding Women 518,144 584,789 656,134 Breastfeeding mother and infant dyad 40.1% 48.6% 48.3% Failure to meet Dietary Guidelines for Americansb 27.4 24.9 24.2 General obstetrical risks 18.7 22.3 23.6 Hematocrit or hemoglobin below FNS criteria 19.8 23.2 29.1 High weight for height 44.5 49.6 50.7 Inappropriate growth or weight gain pattern 22.6 28.0 30.1 Inappropriate nutrition practicesc 30.4 35.2 24.5 Postpartum Women 645,319 634,372 707,507 Failure to meet Dietary Guidelines for Americansb 26.1% 24.5% 19.8% General obstetrical risks 22.3 26.4 26.6 Hematocrit or hemoglobin below FNS criteria 30.3 31.8 34.2 High weight for height 44.7 47.9 49.0 Inappropriate growth or weight gain pattern 25.1 28.7 30.0 Inappropriate nutrition practicesc 32.9 39.9 30.8 Nutrition-related risk conditions 14.0 18.4 18.5 Infants 2,203,882 2,272,626 2,432,004 Inappropriate nutrition practicesc 19.6% 22.2% 24.4% Infant of a WIC–eligible mother or mother at risk during pregnancy
79.3 81.0 83.2
Children 4,278,623 4,293,997 4,726,868 Failure to meet Dietary Guidelines for Americansb 33.6% 27.4% 21.0% High weight for height 21.2 22.5 23.3 Inappropriate nutrition practicesc 57.9 60.5 59.0
Notes
In 2004, each State WIC agency reported up to three risks, recorded for each participant, on its automated client information system. In 2006 and 2008, each State WIC agency reported up to ten risks for each participant. aGuam was unable to provide sufficient PC2006 data, and participants from Guam are not included in 2006 totals. According to FNS administrative data from April 2006, participants from Guam represent approximately 6,000 additional participants. b In 2004 and 2006, this risk referred to “Inadequate/inappropriate nutrient intake.” c In 2004 and 2006, this risk referred to “Other dietary risk.”
Chapter Four: Nutritional Risk Characteristics 61
Exhibit 4.10 Nutritional Risks Reported in at Least 15 Percent of Pregnant WIC Participants by Age at Certification
Age at Certification and Type of Risk Percent
Under 15 years 4,035 Failure to meet Dietary Guidelines for Americans 16.5% General obstetrical risks 95.1 Inappropriate growth or weight gain pattern 33.6 Inappropriate nutrition practices 32.9 Other nutritional risks 15.2 Prepregnancy high weight for height 18.8 Prepregnancy low weight for height 17.9 15 - 17 years 73,208 Failure to meet Dietary Guidelines for Americans 15.8% General obstetrical risks 91.3 Inappropriate growth or weight gain pattern 33.4 Inappropriate nutrition practices 32.8 Prepregnancy high weight for height 24.1 Prepregnancy low weight for height 16.2 18 - 34 years 866,194 Failure to meet Dietary Guidelines for Americans 22.8% General obstetrical risks 29.3 Inappropriate growth or weight gain pattern 32.1 Inappropriate nutrition practices 32.0 Prepregnancy high weight for height 44.1 35 or more years 73,414 Failure to meet Dietary Guidelines for Americans 26.8% General obstetrical risks 27.3 Inappropriate growth or weight gain pattern 30.6 Inappropriate nutrition practices 28.0 Prepregnancy high weight for height 56.4 Not reported 1,115 Pregnant Women 1,017,966
Notes
These figures represent 15 percent or more of all pregnant WIC participants in each age group.
Chapter Four: Nutritional Risk Characteristics 62
Exhibit 4.11 Number and Percent of American Indian/Alaska Native Only WIC Participants with Specific Nutritional Risks Reported by Participant Category
Pregnant Women Breastfeeding
Women Postpartum
Women Total Women Infants Children Total WIC
Number Percent Number Percent Number Percent Number Percent Number Percent Number Percent Number Percent
Percent by Participant Category
Participants in category 96,727 87,167 58,937 242,831 215,450 632,172 1,090,454
Anthropometric 67,946 70.2% 52,882 60.7% 37,048 62.9% 157,877 65.0% 78,780 36.6% 279,057 44.1% 515,713 47.3%
Low weight for height 7,324 7.6 1,383 1.6 1,836 3.1 10,543 4.3 21,365 9.9 38,801 6.1 70,709 6.5
High weight for heighta 41,962 43.4 45,956 52.7 29,912 50.8 117,831 48.5 13,842 6.4 178,344 28.2 310,017 28.4
Short stature 0 0.0 0 0.0 0 0.0 0 0.0 35,275 16.4 56,343 8.9 91,619 8.4
Inappropriate growth or weight gain pattern
39,806 41.2 22,474 25.8 17,620 29.9 79,900 32.9 5,660 2.6 26,757 4.2 112,317 10.3
Low birthweight or premature birth 0 0.0 0 0.0 0 0.0 0 0.0 23,526 10.9 11,622 1.8 35,148 3.2
Other anthropometric risk 2.0 0.0 0 0.0 0 0.0 2 0.0 11,594 5.4 225 0.0 11,821 1.1
Biochemical 8,113 8.4 27,235 31.2 17,828 30.2 53,175 21.9 3,295 1.5 42,543 6.7 99,013 9.1
Hematocrit or hemoglobin below FNS criteria
8,104 8.4 27,226 31.2 17,825 30.2 53,154 21.9 3,288 1.5 42,405 6.7 98,847 9.1
Other biochemical test results which indicate nutritional abnormality
9 0.0 11 0.0 3 0.0 23 0.0 7 0.0 167 0.0 197 0.0
Clinical, Health, Medical 42,581 44.0 31,520 36.2 25,608 43.4 99,709 41.1 16,384 7.6 51,599 8.2 167,691 15.4
Pregnancy-induced conditions 5,011 5.2 4,055 4.7 2,034 3.5 11,099 4.6 0 0.0 0 0.0 11,099 1.0
Delivery of low-birthweight or premature infant
1,867 1.9 2,970 3.4 2,420 4.1 7,257 3.0 0 0.0 0 0.0 7,257 0.7
Prior stillbirth, fetal, or neonatal death
3,057 3.2 365 0.4 1,226 2.1 4,648 1.9 0 0.0 0 0.0 4,648 0.4
General obstetrical risks 30,716 31.8 19,958 22.9 15,533 26.4 66,208 27.3 0 0.0 0 0.0 66,208 6.1
Nutrition-related risk conditions 5,887 6.1 7,435 8.5 7,766 13.2 21,088 8.7 16,188 7.5 29,122 4.6 66,398 6.1
Substance abuse 5,263 5.4 999 1.1 811 1.4 7,072 2.9 2 0.0 1 0.0 7,075 0.6
Other health risks 1,419 1.5 721 0.8 485 0.8 2,625 1.1 213 0.1 23,641 3.7 26,479 2.4
Dietary 56,331 58.2 46,713 53.6 29,334 49.8 132,378 54.5 46,751 21.7 452,276 71.5 631,405 57.9
Failure to meet Dietary Guidelines for Americans
36,925 38.2 31,720 36.4 18,649 31.6 87,295 35.9 144 0.1 155,358 24.6 242,797 22.3
Inappropriate nutrition practices 22,026 22.8 15,672 18.0 11,211 19.0 48,909 20.1 46,743 21.7 315,860 50.0 411,512 37.7

Chapter Four: Nutritional Risk Characteristics 63
Exhibit 4.11 (continued) Number and Percent of American Indian/Alaska Native Only WIC Participants with Specific Nutritional Risks Reported by Participant Category
Pregnant Women Breastfeeding
Women Postpartum
Women Total Women Infants Children Total WIC
Number Percent Number Percent Number Percent Number Percent Number Percent Number Percent Number Percent
Percent by Participant Category
Other risk 6,678 6.9% 62,816 72.1% 2,377 4.0% 71,871 29.6% 190,031 88.2% 22,970 3.6% 284,872 26.1%
Regression/transfer/presumptive eligibility
4,667 4.8 870 1.0 774 1.3 6,310 2.6 3,296 1.5 15,747 2.5 25,353 2.3
Breastfeeding mother and infant dyad
30 0.0 61,918 71.0 792 1.3 62,741 25.8 3,104 1.4 8 0.0 65,853 6.0
Infant of a WIC-eligible mother or mother at risk during pregnancy
0 0.0 0 0.0 0 0.0 0 0.0 186,535 86.6 453 0.1 186,988 17.1
Homelessness/Migrancy 524 0.5 513 0.6 214 0.4 1,251 0.5 697 0.3 1,755 0.3 3,703 0.3
Other nutritional risks 1,514 1.6 549 0.6 623 1.1 2,686 1.1 2,080 1.0 5,313 0.8 10,078 0.9
No risk reported 169 0.2 45 0.1 79 0.1 294 0.1 293 0.1 380 0.1 967 0.1
Notes
An infant is defined as a participant who, at certification, is under one year of age and who would be classified as a child at the age of 366 days.
In 2008, State WIC agencies could report up to ten nutritional risks for each participant. This table examines all risks reported for every participant. When multiple risks within the same risk category are reported for one person, these risks are combined and counted one time in order to accurately calculate the number and percent of WIC participants with a specific risk or broad risk category.
This table reports information on persons having origins in any of the original peoples of North America, who maintain cultural identification through tribal affiliation or community recognition (includes Aleuts and Eskimos).
a For infants and one-year old children, this risk reflects parental (biological) obesity, not height and weight measurements.
Chapter Four: Nutritional Risk Characteristics 64
Exhibit 4.12 Number and Percent of Asian Only WIC Participants with Specific Nutritional Risks Reported by Participant Category
Pregnant Women Breastfeeding
Women Postpartum
Women Total Women Infants Children Total WIC
Number Percent Number Percent Number Percent Number Percent Number Percent Number Percent Number Percent
Percent by Participant Category
Participants in category 26,267 21,416 20,387 68,070 65,006 122,658 255,733
Anthropometric 15,134 57.6% 9,052 42.3% 8,144 39.9% 32,330 47.5% 19,670 30.3% 45,774 37.3% 97,774 38.2%
Low weight for height 5,733 21.8 1,307 6.1 1,476 7.2 8,515 12.5 6,658 10.2 10,653 8.7 25,826 10.1
High weight for heighta 4,588 17.5 5,626 26.3 4,439 21.8 14,652 21.5 708 1.1 21,041 17.2 36,402 14.2
Short stature 2 0.0 1 0.0 0 0.0 3 0.0 6,776 10.4 13,682 11.2 20,461 8.0
Inappropriate growth or weight gain pattern
8,351 31.8 4,372 20.4 4,114 20.2 16,838 24.7 716 1.1 3,231 2.6 20,785 8.1
Low birthweight or premature birth 0 0.0 0 0.0 0 0.0 0 0.0 7,261 11.2 3,448 2.8 10,709 4.2
Other anthropometric risk 0 0.0 0 0.0 0 0.0 0 0.0 2,253 3.5 138 0.1 2,391 0.9
Biochemical 2,422 9.2 7,024 32.8 7,384 36.2 16,830 24.7 341 0.5 10,154 8.3 27,325 10.7
Hematocrit or hemoglobin below FNS criteria
2,422 9.2 7,023 32.8 7,381 36.2 16,826 24.7 334 0.5 10,090 8.2 27,250 10.7
Other biochemical test results which indicate nutritional abnormality
1 0.0 4 0.0 4 0.0 9 0.0 7 0.0 78 0.1 94 0.0
Clinical, Health, Medical 11,164 42.5 7,694 35.9 8,124 39.9 26,983 39.6 1,396 2.1 7,643 6.2 36,022 14.1
Pregnancy-induced conditions 1,432 5.5 1,031 4.8 870 4.3 3,334 4.9 0 0.0 0 0.0 3,334 1.3
Delivery of low-birthweight or premature infant
796 3.0 1,433 6.7 1,389 6.8 3,618 5.3 0 0.0 0 0.0 3,618 1.4
Prior stillbirth, fetal, or neonatal death
742 2.8 70 0.3 245 1.2 1,057 1.6 0 0.0 0 0.0 1,057 0.4
General obstetrical risks 8,169 31.1 3,929 18.3 4,602 22.6 16,699 24.5 0 0.0 0 0.0 16,699 6.5
Nutrition-related risk conditions 1,247 4.7 2,294 10.7 2,279 11.2 5,821 8.6 1,354 2.1 4,669 3.8 11,843 4.6
Substance abuse 760 2.9 152 0.7 97 0.5 1,009 1.5 0 0.0 1 0.0 1,010 0.4
Other health risks 627 2.4 288 1.3 284 1.4 1,200 1.8 43 0.1 3,157 2.6 4,400 1.7
Dietary 17,492 66.6 12,256 57.2 13,882 68.1 43,630 64.1 13,234 20.4 102,881 83.9 159,745 62.5
Failure to meet Dietary Guidelines for Americans
11,388 43.4 8,179 38.2 8,806 43.2 28,373 41.7 59 0.1 40,933 33.4 69,365 27.1
Inappropriate nutrition practices 6,487 24.7 4,373 20.4 5,392 26.4 16,252 23.9 13,284 20.4 70,255 57.3 99,791 39.0
Chapter Four: Nutritional Risk Characteristics 65
Exhibit 4.12 (continued) Number and Percent of Asian Only WIC Participants with Specific Nutritional Risks Reported by Participant Category
Pregnant Women Breastfeeding
Women Postpartum
Women Total Women Infants Children Total WIC
Number Percent Number Percent Number Percent Number Percent Number Percent Number Percent Number Percent
Percent by Participant Category
Other risk 896 3.4% 12,139 56.7% 743 3.6% 13,778 20.2% 53,783 82.7% 3,103 2.5% 70,665 27.6%
Regression/transfer/presumptive eligibility
275 1.0 204 1.0 205 1.0 684 1.0 790 1.2 1,636 1.3 3,110 1.2
Breastfeeding mother and infant dyad
13 0.0 11,965 55.9 236 1.2 12,214 17.9 897 1.4 13 0.0 13,124 5.1
Infant of a WIC-eligible mother or mother at risk during pregnancy
0 0.0 0 0.0 0 0.0 0 0.0 52,796 81.2 354 0.3 53,150 20.8
Homelessness/Migrancy 71 0.3 54 0.3 31 0.2 156 0.2 107 0.2 163 0.1 426 0.2
Other nutritional risks 549 2.1 165 0.8 274 1.3 988 1.5 462 0.7 966 0.8 2,417 0.9
No risk reported 64 0.2 112 0.5 132 0.6 308 0.5 407 0.6 937 0.8 1,652 0.6
Notes
An infant is defined as a participant who, at certification, is under one year of age and who would be classified as a child at the age of 366 days.
In 2008, State WIC agencies could report up to ten nutritional risks for each participant. This table examines all risks reported for every participant. When multiple risks within the same risk category are reported for one person, these risks are combined and counted one time in order to accurately calculate the number and percent of WIC participants with a specific risk or broad risk category.
This table reports information on persons having origins in any of the original peoples of the Far East, Southeast Asia, or the Indian subcontinent. This area includes, for example, Cambodia, China, India, Japan, Korea, Malaysia, Pakistan, the Philippine Islands, Thailand, and Vietnam. a For infants and one-year old children, this risk reflects parental (biological) obesity, not height and weight measurements.
Chapter Four: Nutritional Risk Characteristics 66
Exhibit 4.13 Number and Percent of Black/African American Only WIC Participants with Specific Nutritional Risks Reported by Participant Category
Pregnant Women Breastfeeding
Women Postpartum
Women Total Women Infants Children Total WIC
Number Percent Number Percent Number Percent Number Percent Number Percent Number Percent Number Percent
Percent by Participant Category
Participants in category 192,772 104,589 170,173 467,534 532,638 867,919 1,868,092
Anthropometric 133,907 69.5% 70,674 67.6% 110,993 65.2% 315,574 67.5% 208,847 39.2% 333,625 38.4% 858,045 45.9%
Low weight for height 15,993 8.3 3,151 3.0 6,303 3.7 25,446 5.4 51,852 9.7 65,819 7.6 143,117 7.7
High weight for heighta 93,874 48.7 58,259 55.7 90,054 52.9 242,187 51.8 31,269 5.9 183,504 21.1 456,960 24.5
Short stature 30 0.0 9 0.0 36 0.0 75 0.0 61,634 11.6 57,617 6.6 119,326 6.4
Inappropriate growth or weight gain pattern
57,014 29.6 35,789 34.2 48,876 28.7 141,679 30.3 4,221 0.8 16,549 1.9 162,449 8.7
Low birthweight or premature birth 0 0.0 0 0.0 0 0.0 0 0.0 94,952 17.8 50,461 5.8 145,413 7.8
Other anthropometric risk 2 0.0 0 0.0 1 0.0 3 0.0 23,854 4.5 1,942 0.2 25,798 1.4
Biochemical 38,498 20.0 43,430 41.5 79,751 46.9 161,679 34.6 3,109 0.6 154,640 17.8 319,428 17.1
Hematocrit or hemoglobin below FNS criteria
38,474 20.0 43,399 41.5 79,694 46.8 161,567 34.6 3,093 0.6 153,309 17.7 317,969 17.0
Other biochemical test results which indicate nutritional abnormality
32 0.0 55 0.1 82 0.0 169 0.0 16 0.0 1,634 0.2 1,819 0.1
Clinical, Health, Medical 99,337 51.5 48,480 46.4 86,890 51.1 234,708 50.2 21,560 4.0 69,739 8.0 326,006 17.5
Pregnancy-induced conditions 7,715 4.0 2,383 2.3 3,604 2.1 13,703 2.9 0 0.0 0 0.0 13,703 0.7
Delivery of low-birthweight or premature infant
12,720 6.6 13,047 12.5 22,366 13.1 48,132 10.3 0 0.0 0 0.0 48,132 2.6
Prior stillbirth, fetal, or neonatal death
9,634 5.0 720 0.7 2,953 1.7 13,307 2.8 0 0.0 0 0.0 13,307 0.7
General obstetrical risks 63,663 33.0 24,358 23.3 43,981 25.8 132,002 28.2 0 0.0 0 0.0 132,002 7.1
Nutrition-related risk conditions 16,840 8.7 16,837 16.1 32,617 19.2 66,294 14.2 21,063 4.0 59,619 6.9 146,976 7.9
Substance abuse 16,212 8.4 2,421 2.3 2,947 1.7 21,580 4.6 136 0.0 80 0.0 21,796 1.2
Other health risks 5,796 3.0 2,096 2.0 3,699 2.2 11,591 2.5 412 0.1 11,485 1.3 23,488 1.3
Dietary 105,927 54.9 53,119 50.8 83,356 49.0 242,402 51.8 121,256 22.8 671,883 77.4 1,035,541 55.4
Failure to meet Dietary Guidelines for Americans
33,228 17.2 26,071 24.9 25,797 15.2 85,097 18.2 812 0.2 162,978 18.8 248,886 13.3
Inappropriate nutrition practices 74,699 38.7 28,116 26.9 59,384 34.9 162,198 34.7 121,722 22.9 540,789 62.3 824,709 44.1
Chapter Four: Nutritional Risk Characteristics 67
Exhibit 4.13 (continued) Number and Percent of Black/African American Only WIC Participants with Specific Nutritional Risks Reported by Participant Category
Pregnant Women Breastfeeding
Women Postpartum
Women Total Women Infants Children Total WIC
Number Percent Number Percent Number Percent Number Percent Number Percent Number Percent Number Percent
Percent by Participant Category
Other risk 9,288 4.8% 43,335 41.4% 7,895 4.6% 60,517 12.9% 445,396 83.6% 43,191 5.0% 549,104 29.4%
Regression/transfer/presumptive eligibility
4,065 2.1 1,404 1.3 2,307 1.4 7,777 1.7 9,029 1.7 18,654 2.1 35,460 1.9
Breastfeeding mother and infant dyad
221 0.1 41,633 39.8 2,584 1.5 44,438 9.5 8,093 1.5 245 0.0 52,776 2.8
Infant of a WIC-eligible mother or mother at risk during pregnancy
0 0.0 0 0.0 1 0.0 1 0.0 436,380 81.9 5,237 0.6 441,618 23.6
Homelessness/Migrancy 508 0.3 308 0.3 292 0.2 1,108 0.2 836 0.2 1,428 0.2 3,372 0.2
Other nutritional risks 4,600 2.4 707 0.7 2,768 1.6 8,074 1.7 8,708 1.6 18,039 2.1 34,821 1.9
No risk reported 306 0.2 226 0.2 327 0.2 859 0.2 686 0.1 1,905 0.2 3,451 0.2
Notes
An infant is defined as a participant who, at certification, is under one year of age and who would be classified as a child at the age of 366 days.
In 2008, State WIC agencies could report up to ten nutritional risks for each participant. This table examines all risks reported for every participant. When multiple risks within the same risk category are reported for one person, these risks are combined and counted one time in order to accurately calculate the number and percent of WIC participants with a specific risk or broad risk category.
This table reports information on persons having origins in any of the black racial groups of Africa. a For infants and one-year old children, this risk reflects parental (biological) obesity, not height and weight measurements.
Chapter Four: Nutritional Risk Characteristics 68
Exhibit 4.14 Number and Percent of Native Hawaiian/Pacific Islander Only WIC Participants with Specific Nutritional Risks Reported by Participant Category
Pregnant Women Breastfeeding
Women Postpartum
Women Total Women Infants Children Total WIC
Number Percent Number Percent Number Percent Number Percent Number Percent Number Percent Number Percent
Percent by Participant Category
Participants in category 7,161 8,165 5,208 20,534 19,872 40,679 81,084
Anthropometric 4,682 65.4% 4,813 59.0% 2,929 56.2% 12,424 60.5% 5,903 29.7% 13,775 33.9% 32,103 39.6%
Low weight for height 506 7.1 187 2.3 120 2.3 814 4.0 1,569 7.9 2,062 5.1 4,445 5.5
High weight for heighta 3,141 43.9 3,948 48.4 2,300 44.2 9,389 45.7 576 2.9 8,094 19.9 18,059 22.3
Short stature 1 0.0 0 0.0 0 0.0 1 0.0 1,603 8.1 2,770 6.8 4,374 5.4
Inappropriate growth or weight gain pattern
2,379 33.2 2,601 31.9 1,581 30.4 6,561 32.0 411 2.1 1,347 3.3 8,319 10.3
Low birthweight or premature birth 0 0.0 0 0.0 0 0.0 0 0.0 2,002 10.1 1,029 2.5 3,032 3.7
Other anthropometric risk 1 0.0 0 0.0 0 0.0 1 0.0 1,116 5.6 39 0.1 1,156 1.4
Biochemical 779 10.9 3,093 37.9 1,966 37.7 5,838 28.4 153 0.8 4,171 10.3 10,162 12.5
Hematocrit or hemoglobin below FNS criteria
779 10.9 3,090 37.9 1,965 37.7 5,834 28.4 145 0.7 4,145 10.2 10,124 12.5
Other biochemical test results which indicate nutritional abnormality
0 0.0 4 0.0 2 0.0 6 0.0 8 0.0 29 0.1 43 0.1
Clinical, Health, Medical 3,392 47.4 2,672 32.7 2,032 39.0 8,096 39.4 391 2.0 2,281 5.6 10,769 13.3
Pregnancy-induced conditions 388 5.4 181 2.2 118 2.3 687 3.3 0 0.0 0 0.0 687 0.8
Delivery of low-birthweight or premature infant
217 3.0 575 7.0 345 6.6 1,137 5.5 0 0.0 0 0.0 1,137 1.4
Prior stillbirth, fetal, or neonatal death
331 4.6 29 0.4 94 1.8 454 2.2 0 0.0 0 0.0 454 0.6
General obstetrical risks 2,426 33.9 1,457 17.8 1,087 20.9 4,970 24.2 0 0.0 0 0.0 4,970 6.1
Nutrition-related risk conditions 485 6.8 737 9.0 688 13.2 1,910 9.3 377 1.9 1,567 3.9 3,854 4.8
Substance abuse 394 5.5 147 1.8 89 1.7 630 3.1 2 0.0 1 0.0 633 0.8
Other health risks 193 2.7 114 1.4 74 1.4 381 1.9 12 0.1 757 1.9 1,150 1.4
Dietary 3,710 51.8 3,971 48.6 2,324 44.6 10,005 48.7 3,972 20.0 29,668 72.9 43,645 53.8
Failure to meet Dietary Guidelines for Americans
2,104 29.4 2,639 32.3 1,214 23.3 5,958 29.0 57 0.3 10,149 24.9 16,163 19.9
Inappropriate nutrition practices 1,668 23.3 1,405 17.2 1,143 22.0 4,216 20.5 3,964 19.9 21,410 52.6 29,591 36.5
Chapter Four: Nutritional Risk Characteristics 69
Exhibit 4.14 (continued) Number and Percent of Native Hawaiian/Pacific Islander Only WIC Participants with Specific Nutritional Risks Reported by Participant Category
Pregnant Women Breastfeeding
Women Postpartum
Women Total Women Infants Children Total WIC
Number Percent Number Percent Number Percent Number Percent Number Percent Number Percent Number Percent
Percent by Participant Category
Other risk 562 7.8% 3,376 41.3% 230 4.4% 4,168 20.3% 14,672 73.8% 3,975 9.8% 22,815 28.1%
Regression/transfer/presumptive eligibility
232 3.2 512 6.3 84 1.6 828 4.0 1,089 5.5 2,323 5.7 4,240 5.2
Breastfeeding mother and infant dyad
4 0.1 2,756 33.8 34 0.7 2,794 13.6 369 1.9 1 0.0 3,164 3.9
Infant of a WIC-eligible mother or mother at risk during pregnancy
0 0.0 0 0.0 0 0.0 0 0.0 13,458 67.7 81 0.2 13,539 16.7
Homelessness/Migrancy 48 0.7 48 0.6 21 0.4 117 0.6 88 0.4 213 0.5 418 0.5
Other nutritional risks 289 4.0 186 2.3 97 1.9 572 2.8 351 1.8 1,394 3.4 2,318 2.9
No risk reported 40 0.6 290 3.6 434 8.3 764 3.7 1,589 8.0 3,288 8.1 5,640 7.0
Notes
An infant is defined as a participant who, at certification, is under one year of age and who would be classified as a child at the age of 366 days.
In 2008, State WIC agencies could report up to ten nutritional risks for each participant. This table examines all risks reported for every participant. When multiple risks within the same risk category are reported for one person, these risks are combined and counted one time in order to accurately calculate the number and percent of WIC participants with a specific risk or broad risk category.
This table reports information on persons having origins in any of the original peoples of Hawaii, Guam, Samoa, or other Pacific Islands. a For infants and one-year old children, this risk reflects parental (biological) obesity, not height and weight measurements.
Chapter Four: Nutritional Risk Characteristics 70
Exhibit 4.15 Number and Percent of White Only WIC Participants with Specific Nutritional Risks Reported by Participant Category
Pregnant Women Breastfeeding
Women Postpartum
Women Total Women Infants Children Total WIC
Number Percent Number Percent Number Percent Number Percent Number Percent Number Percent Number Percent
Percent by Participant Category
Participants in category 657,674 407,022 432,017 1,496,713 1,459,019 2,797,269 5,753,002
Anthropometric 436,259 66.3% 254,739 62.6% 273,464 63.3% 964,462 64.4% 481,776 33.0% 1,069,375 38.2% 2,515,613 43.7%
Low weight for height 60,206 9.2 11,748 2.9 17,926 4.1 89,881 6.0 109,095 7.5 140,948 5.0 339,923 5.9
High weight for heighta 282,481 43.0 205,319 50.4 210,079 48.6 697,880 46.6 66,233 4.5 647,664 23.2 1,411,776 24.5
Short stature 49 0.0 13 0.0 44 0.0 106 0.0 136,585 9.4 240,698 8.6 377,389 6.6
Inappropriate growth or weight gain pattern
207,347 31.5 124,701 30.6 134,330 31.1 466,378 31.2 14,037 1.0 49,383 1.8 529,798 9.2
Low birthweight or premature birth 0 0.0 0 0.0 0 0.0 0 0.0 192,547 13.2 105,002 3.8 297,549 5.2
Other anthropometric risk 5 0.0 5 0.0 3 0.0 13 0.0 74,605 5.1 5,098 0.2 79,716 1.4
Biochemical 52,768 8.0 101,228 24.9 127,599 29.5 281,595 18.8 8,235 0.6 275,373 9.8 565,204 9.8
Hematocrit or hemoglobin below FNS criteria
52,698 8.0 101,165 24.9 127,509 29.5 281,372 18.8 8,197 0.6 273,173 9.8 562,743 9.8
Other biochemical test results which indicate nutritional abnormality
79 0.0 79 0.0 114 0.0 272 0.0 42 0.0 2,433 0.1 2,747 0.0
Clinical, Health, Medical 372,064 56.6 185,951 45.7 226,919 52.5 784,933 52.4 66,606 4.6 230,084 8.2 1,081,623 18.8
Pregnancy-induced conditions 29,737 4.5 14,405 3.5 13,602 3.1 57,744 3.9 0 0.0 0 0.0 57,744 1.0
Delivery of low-birthweight or premature infant
34,373 5.2 30,278 7.4 40,205 9.3 104,857 7.0 0 0.0 0 0.0 104,857 1.8
Prior stillbirth, fetal, or neonatal death
30,359 4.6 2,334 0.6 9,966 2.3 42,659 2.9 0 0.0 0 0.0 42,659 0.7
General obstetrical risks 227,067 34.5 99,001 24.3 116,599 27.0 442,667 29.6 0 0.0 0 0.0 442,667 7.7
Nutrition-related risk conditions 58,750 8.9 59,983 14.7 84,450 19.5 203,183 13.6 65,112 4.5 165,923 5.9 434,218 7.5
Substance abuse 111,490 17.0 19,843 4.9 18,191 4.2 149,524 10.0 185 0.0 168 0.0 149,877 2.6
Other health risks 28,064 4.3 11,889 2.9 14,363 3.3 54,316 3.6 1,499 0.1 69,641 2.5 125,456 2.2
Dietary 335,927 51.1 184,561 45.3 210,824 48.8 731,312 48.9 375,081 25.7 2,153,064 77.0 3,259,456 56.7
Failure to meet Dietary Guidelines for Americans
135,988 20.7 83,382 20.5 80,557 18.6 299,927 20.0 3,291 0.2 560,360 20.0 863,578 15.0
Inappropriate nutrition practices 207,011 31.5 104,484 25.7 134,246 31.1 445,741 29.8 374,147 25.6 1,678,319 60.0 2,498,207 43.4
Chapter Four: Nutritional Risk Characteristics 71
Exhibit 4.15 (continued) Number and Percent of White Only WIC Participants with Specific Nutritional Risks Reported by Participant Category
Pregnant Women Breastfeeding
Women Postpartum
Women Total Women Infants Children Total WIC
Number Percent Number Percent Number Percent Number Percent Number Percent Number Percent Number Percent
Percent by Participant Category
Other Risk 38,169 5.8% 191,215 47.0% 25,739 6.0% 255,123 17.0% 1,249,228 85.6% 149,717 5.4% 1,654,068 28.8% Regression/Transfer/Presumptive eligibility
11,677 1.8 5,285 1.3 6,560 1.5 23,523 1.6 28,044 1.9 56,607 2.0 108,174 1.9
Breastfeeding mother and infant dyad
493 0.1 183,666 45.1 7,568 1.8 191,726 12.8 36,868 2.5 612 0.0 229,207 4.0
Infant of a WIC-eligible mother or mother at risk during pregnancy
0 0.0 0 0.0 0 0.0 0 0.0 1,216,737 83.4 12,183 0.4 1,228,921 21.4
Homelessness/Migrancy 3,596 0.5 2,406 0.6 1,431 0.3 7,432 0.5 4,441 0.3 10,323 0.4 22,196 0.4 Other nutritional risks 22,938 3.5 4,629 1.1 10,455 2.4 38,022 2.5 30,122 2.1 72,120 2.6 140,265 2.4 No risk reported 1,659 0.3 627 0.2 1,102 0.3 3,389 0.2 4,752 0.3 5,922 0.2 14,064 0.2
Notes
An infant is defined as a participant who, at certification, is under one year of age and who would be classified as a child at the age of 366 days.
In 2008 State WIC agencies could report up to ten nutritional risks for each participant. This table examines all risks reported for every participant. When multiple risks within the same risk category are reported for one person, these risks are combined and counted one time in order to accurately calculate the number and percent of WIC participants with a specific risk or broad risk category.
This table reports information on persons having origins in any of the original peoples of Europe, North Africa, or the Middle East.
a For infants and one-year old children, this risk reflects parental (biological) obesity, not height and weight measurements.

Chapter Four: Nutritional Risk Characteristics 72
Exhibit 4.16 Number and Percent of WIC Participants Reporting Two or More Races with Specific Nutritional Risks Reported by Participant Category
Pregnant Women Breastfeeding
Women Postpartum
Women Total Women Infants Children Total WIC
Number Percent Number Percent Number Percent Number Percent Number Percent Number Percent Number Percent
Percent by Participant Category
Participants in category 20,500 15,479 12,813 48,793 102,586 195,450 346,829
Anthropometric 14,096 68.8% 9,801 63.3% 8,118 63.4% 32,015 65.6% 35,650 34.8% 74,538 38.1% 142,204 41.0%
Low weight for height 1,787 8.7 406 2.6 475 3.7 2,668 5.5 7,625 7.4 10,925 5.6 21,218 6.1
High weight for heighta 8,950 43.7 7,659 49.5 6,003 46.9 22,613 46.3 3,907 3.8 42,787 21.9 69,306 20.0
Short stature 2 0.0 1 0.0 0 0.0 3 0.0 12,157 11.9 15,709 8.0 27,869 8.0
Inappropriate growth or weight gain pattern
7,668 37.4 5,449 35.2 4,614 36.0 17,732 36.3 1,855 1.8 5,475 2.8 25,062 7.2
Low birthweight or premature birth 0 0.0 0 0.0 0 0.0 0 0.0 14,151 13.8 8,273 4.2 22,424 6.5
Other anthropometric risk 0 0.0 0 0.0 0 0.0 0 0.0 5,279 5.1 359 0.2 5,638 1.6
Biochemical 2,080 10.1 4,779 30.9 4,427 34.6 11,287 23.1 900 0.9 20,342 10.4 32,529 9.4
Hematocrit or hemoglobin below FNS criteria
2,078 10.1 4,718 30.5 4,424 34.5 11,221 23.0 830 0.8 20,069 10.3 32,120 9.3
Other biochemical test results which indicate nutritional abnormality
2 0.0 61 0.4 5 0.0 68 0.1 71 0.1 302 0.2 441 0.1
Clinical, Health, Medical 12,254 59.8 7,043 45.5 6,900 53.9 26,197 53.7 5,481 5.3 17,910 9.2 49,589 14.3
Pregnancy-induced conditions 1,302 6.4 457 3.0 364 2.8 2,123 4.4 0 0.0 0 0.0 2,123 0.6
Delivery of low-birthweight or premature infant
957 4.7 1,131 7.3 1,123 8.8 3,211 6.6 0 0.0 0 0.0 3,211 0.9
Prior stillbirth, fetal, or neonatal death
1,231 6.0 94 0.6 314 2.5 1,639 3.4 0 0.0 0 0.0 1,639 0.5
General obstetrical risks 8,046 39.3 3,852 24.9 3,958 30.9 15,856 32.5 0 0.0 0 0.0 15,856 4.6
Nutrition-related risk conditions 2,242 10.9 2,248 14.5 2,434 19.0 6,925 14.2 5,313 5.2 13,540 6.9 25,779 7.4
Substance abuse 3,088 15.1 745 4.8 539 4.2 4,372 9.0 20 0.0 7 0.0 4,399 1.3
Other health risks 898 4.4 395 2.6 304 2.4 1,598 3.3 171 0.2 4,818 2.5 6,588 1.9
Dietary 10,683 52.1 7,630 49.3 6,479 50.6 24,793 50.8 26,968 26.3 153,607 78.6 205,368 59.2
Failure to meet Dietary Guidelines for Americans
5,313 25.9 4,038 26.1 3,146 24.6 12,497 25.6 219 0.2 41,781 21.4 54,497 15.7
Inappropriate nutrition practices 5,704 27.8 3,752 24.2 3,494 27.3 12,949 26.5 26,888 26.2 120,657 61.7 160,494 46.3
Chapter Four: Nutritional Risk Characteristics 73
Exhibit 4.16 (continued) Number and Percent of WIC Participants Reporting Two or More Races with Specific Nutritional Risks Reported by Participant Category
Pregnant Women Breastfeeding
Women Postpartum
Women Total Women Infants Children Total WIC
Number Percent Number Percent Number Percent Number Percent Number Percent Number Percent Number Percent
Percent by Participant Category
Other risk 1,312 6.4% 8,798 56.8% 866 6.8% 10,977 22.5% 87,903 85.7% 11,545 5.9% 110,424 31.8% Regression/Transfer/Presumptive eligibility
310 1.5 244 1.6 222 1.7 776 1.6 2,045 2.0 4,727 2.4 7,548 2.2
Breastfeeding mother and infant dyad
6 0.0 8,589 55.5 224 1.7 8,819 18.1 2,193 2.1 26 0.0 11,039 3.2
Infant of a WIC-eligible mother or mother at risk during pregnancy
0 0.0 0 0.0 0 0.0 0 0.0 85,183 83.0 780 0.4 85,963 24.8
Homelessness/Migrancy 195 1.0 97 0.6 82 0.6 374 0.8 436 0.4 789 0.4 1,599 0.5 Other nutritional risks 844 4.1 202 1.3 351 2.7 1,397 2.9 2,811 2.7 5,457 2.8 9,665 2.8 No risk reported 83 0.4 23 0.1 28 0.2 134 0.3 442 0.4 495 0.3 1,071 0.3
Notes
An infant is defined as a participant who, at certification, is under one year of age and who would be classified as a child at the age of 366 days.
In 2008, State WIC agencies could report up to ten nutritional risks for each participant. This table examines all risks reported for every participant. When multiple risks within the same risk category are reported for one person, these risks are combined and counted one time in order to accurately calculate the number and percent of WIC participants with a specific risk or broad risk category.
This table reports information on persons reporting two or more races. a For infants and one-year old children, this risk reflects parental (biological) obesity, not height and weight measurements.
Chapter Four: Nutritional Risk Characteristics 74
Exhibit 4.17 Number and Percent of Hispanic/Latino WIC Participants with Specific Nutritional Risks Reported by Participant Category
Pregnant Women Breastfeeding
Women Postpartum
Women Total Women Infants Children Total WIC
Number Percent Number Percent Number Percent Number Percent Number Percent Number Percent Number Percent
Percent by Participant Category
Participants in category 397,242 333,150 218,158 948,549 943,146 2,124,965 4,016,660
Anthropometric 272,631 68.6% 207,204 62.2% 134,729 61.8% 614,564 64.8% 294,730 31.2% 855,255 40.2% 1,764,549 43.9%
Low weight for height 26,696 6.7 6,478 1.9 5,858 2.7 39,033 4.1 65,986 7.0 103,158 4.9 208,177 5.2
High weight for heighta 174,459 43.9 176,616 53.0 109,579 50.2 460,654 48.6 35,166 3.7 543,097 25.6 1,038,917 25.9
Short stature 6 0.0 7 0.0 8 0.0 21 0.0 102,596 10.9 191,170 9.0 293,787 7.3
Inappropriate growth or weight gain pattern
151,870 38.2 95,785 28.8 67,440 30.9 315,096 33.2 10,221 1.1 50,703 2.4 376,020 9.4
Low birthweight or premature birth 0 0.0 0 0.0 0 0.0 0 0.0 108,864 11.5 54,172 2.5 163,037 4.1
Other anthropometric risk 0 0.0 0 0.0 0 0.0 0 0.0 47,959 5.1 1,863 0.1 49,823 1.2
Biochemical 34,704 8.7 97,380 29.2 69,380 31.8 201,464 21.2 6,937 0.7 206,079 9.7 414,480 10.3
Hematocrit or hemoglobin below FNS criteria
34,670 8.7 97,339 29.2 69,358 31.8 201,367 21.2 6,904 0.7 205,115 9.7 413,386 10.3
Other biochemical test results which indicate nutritional abnormality
38 0.0 57 0.0 38 0.0 133 0.0 33 0.0 1,092 0.1 1,258 0.0
Clinical, Health, Medical 180,625 45.5 133,205 40.0 103,059 47.2 416,889 44.0 39,188 4.2 149,474 7.0 605,551 15.1
Pregnancy-induced conditions 17,905 4.5 13,268 4.0 7,483 3.4 38,656 4.1 0 0.0 0 0.0 38,656 1.0
Delivery of low-birthweight or premature infant
12,740 3.2 21,106 6.3 15,251 7.0 49,097 5.2 0 0.0 0 0.0 49,097 1.2
Prior stillbirth, fetal, or neonatal death
11,712 2.9 1,019 0.3 4,706 2.2 17,438 1.8 0 0.0 0 0.0 17,438 0.4
General obstetrical risks 133,634 33.6 78,392 23.5 62,573 28.7 274,599 28.9 0 0.0 0 0.0 274,599 6.8
Nutrition-related risk conditions 21,029 5.3 37,893 11.4 32,192 14.8 91,113 9.6 38,423 4.1 88,974 4.2 218,511 5.4
Substance abuse 14,816 3.7 1,996 0.6 1,249 0.6 18,060 1.9 28 0.0 26 0.0 18,114 0.5
Other health risks 10,018 2.5 7,064 2.1 3,612 1.7 20,693 2.2 820 0.1 63,696 3.0 85,209 2.1
Dietary 218,982 55.1 164,594 49.4 113,716 52.1 497,292 52.4 260,531 27.6 1,588,976 74.8 2,346,800 58.4
Failure to meet Dietary Guidelines for Americans
117,937 29.7 87,068 26.1 58,511 26.8 263,516 27.8 819 0.1 481,874 22.7 746,208 18.6
Inappropriate nutrition practices 107,430 27.0 80,145 24.1 56,948 26.1 244,522 25.8 261,536 27.7 1,170,987 55.1 1,677,046 41.8

Chapter Four: Nutritional Risk Characteristics 75
Exhibit 4.17 (continued) Number and Percent of Hispanic/Latino Only WIC Participants with Specific Nutritional Risks Reported by Participant Category
Pregnant Women Breastfeeding
Women Postpartum
Women Total Women Infants Children Total WIC
Number Percent Number Percent Number Percent Number Percent Number Percent Number Percent Number Percent
Percent by Participant Category
Other risk 19,363 4.9% 175,990 52.8% 9,692 4.4% 205,045 21.6% 825,247 87.5% 73,088 3.4% 1,103,379 27.5% Regression/Transfer/Presumptive eligibility
9,102 2.3 3,935 1.2 2,756 1.3 15,793 1.7 15,125 1.6 43,622 2.1 74,540 1.9
Breastfeeding mother and infant dyad
97 0.0 170,613 51.2 3,473 1.6 174,183 18.4 23,808 2.5 154 0.0 198,145 4.9
Infant of a WIC-eligible mother or mother at risk during pregnancy
0 0.0 0 0.0 0 0.0 0 0.0 807,909 85.7 3,798 0.2 811,707 20.2
Homelessness/Migrancy 2,636 0.7 2,631 0.8 1,039 0.5 6,306 0.7 3,969 0.4 10,127 0.5 20,402 0.5 Other nutritional risks 7,723 1.9 2,235 0.7 2,518 1.2 12,476 1.3 9,689 1.0 16,361 0.8 38,525 1.0 No risk reported 530 0.1 292 0.1 383 0.2 1,205 0.1 1,532 0.2 2,277 0.1 5,014 0.1
Notes
An infant is defined as a participant who, at certification, is under one year of age and who would be classified as a child at the age of 366 days.
In 2008, State WIC agencies could report up to ten nutritional risks for each participant. This table examines all risks reported for every participant. When multiple risks within the same risk category are reported for one person, these risks are combined and counted one time in order to accurately calculate the number and percent of WIC participants with a specific risk or broad risk category.
This table reports information on persons of Mexican, Puerto Rican, Cuban, Central or South American, or other Spanish culture or origin regardless of race.
a For infants and one-year old children, this risk reflects parental (biological) obesity, not height and weight measurements.
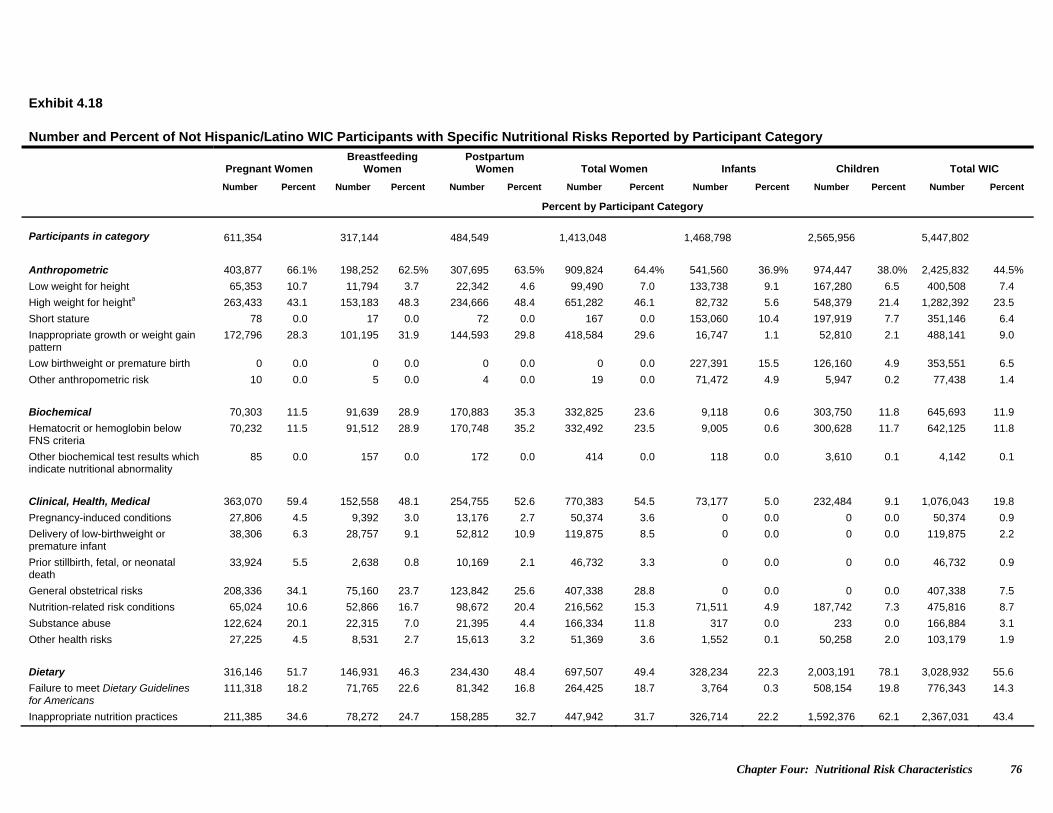
Chapter Four: Nutritional Risk Characteristics 76
Exhibit 4.18 Number and Percent of Not Hispanic/Latino WIC Participants with Specific Nutritional Risks Reported by Participant Category
Pregnant Women Breastfeeding
Women Postpartum
Women Total Women Infants Children Total WIC
Number Percent Number Percent Number Percent Number Percent Number Percent Number Percent Number Percent
Percent by Participant Category
Participants in category 611,354 317,144 484,549 1,413,048 1,468,798 2,565,956 5,447,802
Anthropometric 403,877 66.1% 198,252 62.5% 307,695 63.5% 909,824 64.4% 541,560 36.9% 974,447 38.0% 2,425,832 44.5%
Low weight for height 65,353 10.7 11,794 3.7 22,342 4.6 99,490 7.0 133,738 9.1 167,280 6.5 400,508 7.4
High weight for heighta 263,433 43.1 153,183 48.3 234,666 48.4 651,282 46.1 82,732 5.6 548,379 21.4 1,282,392 23.5
Short stature 78 0.0 17 0.0 72 0.0 167 0.0 153,060 10.4 197,919 7.7 351,146 6.4
Inappropriate growth or weight gain pattern
172,796 28.3 101,195 31.9 144,593 29.8 418,584 29.6 16,747 1.1 52,810 2.1 488,141 9.0
Low birthweight or premature birth 0 0.0 0 0.0 0 0.0 0 0.0 227,391 15.5 126,160 4.9 353,551 6.5
Other anthropometric risk 10 0.0 5 0.0 4 0.0 19 0.0 71,472 4.9 5,947 0.2 77,438 1.4
Biochemical 70,303 11.5 91,639 28.9 170,883 35.3 332,825 23.6 9,118 0.6 303,750 11.8 645,693 11.9
Hematocrit or hemoglobin below FNS criteria
70,232 11.5 91,512 28.9 170,748 35.2 332,492 23.5 9,005 0.6 300,628 11.7 642,125 11.8
Other biochemical test results which indicate nutritional abnormality
85 0.0 157 0.0 172 0.0 414 0.0 118 0.0 3,610 0.1 4,142 0.1
Clinical, Health, Medical 363,070 59.4 152,558 48.1 254,755 52.6 770,383 54.5 73,177 5.0 232,484 9.1 1,076,043 19.8
Pregnancy-induced conditions 27,806 4.5 9,392 3.0 13,176 2.7 50,374 3.6 0 0.0 0 0.0 50,374 0.9
Delivery of low-birthweight or premature infant
38,306 6.3 28,757 9.1 52,812 10.9 119,875 8.5 0 0.0 0 0.0 119,875 2.2
Prior stillbirth, fetal, or neonatal death
33,924 5.5 2,638 0.8 10,169 2.1 46,732 3.3 0 0.0 0 0.0 46,732 0.9
General obstetrical risks 208,336 34.1 75,160 23.7 123,842 25.6 407,338 28.8 0 0.0 0 0.0 407,338 7.5
Nutrition-related risk conditions 65,024 10.6 52,866 16.7 98,672 20.4 216,562 15.3 71,511 4.9 187,742 7.3 475,816 8.7
Substance abuse 122,624 20.1 22,315 7.0 21,395 4.4 166,334 11.8 317 0.0 233 0.0 166,884 3.1
Other health risks 27,225 4.5 8,531 2.7 15,613 3.2 51,369 3.6 1,552 0.1 50,258 2.0 103,179 1.9
Dietary 316,146 51.7 146,931 46.3 234,430 48.4 697,507 49.4 328,234 22.3 2,003,191 78.1 3,028,932 55.6
Failure to meet Dietary Guidelines for Americans
111,318 18.2 71,765 22.6 81,342 16.8 264,425 18.7 3,764 0.3 508,154 19.8 776,343 14.3
Inappropriate nutrition practices 211,385 34.6 78,272 24.7 158,285 32.7 447,942 31.7 326,714 22.2 1,592,376 62.1 2,367,031 43.4
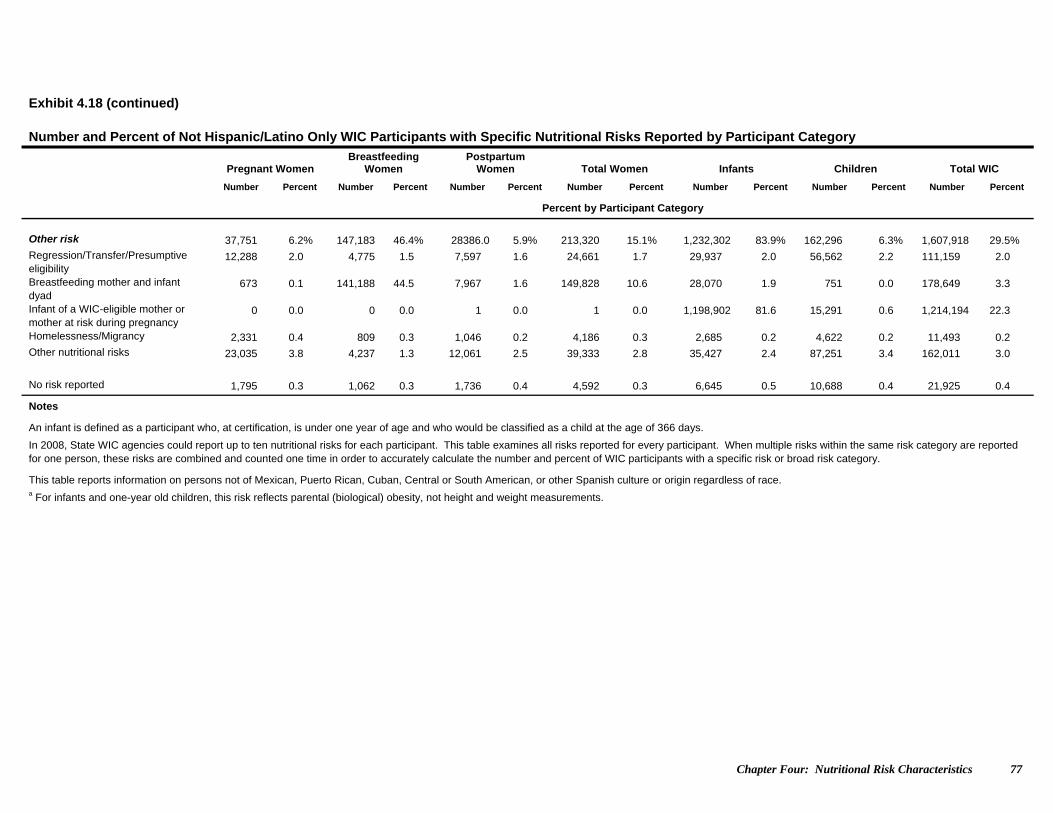
Chapter Four: Nutritional Risk Characteristics 77
Exhibit 4.18 (continued) Number and Percent of Not Hispanic/Latino Only WIC Participants with Specific Nutritional Risks Reported by Participant Category
Pregnant Women Breastfeeding
Women Postpartum
Women Total Women Infants Children Total WIC
Number Percent Number Percent Number Percent Number Percent Number Percent Number Percent Number Percent
Percent by Participant Category
Other risk 37,751 6.2% 147,183 46.4% 28386.0 5.9% 213,320 15.1% 1,232,302 83.9% 162,296 6.3% 1,607,918 29.5%
Regression/Transfer/Presumptive eligibility
12,288 2.0 4,775 1.5 7,597 1.6 24,661 1.7 29,937 2.0 56,562 2.2 111,159 2.0
Breastfeeding mother and infant dyad
673 0.1 141,188 44.5 7,967 1.6 149,828 10.6 28,070 1.9 751 0.0 178,649 3.3
Infant of a WIC-eligible mother or mother at risk during pregnancy
0 0.0 0 0.0 1 0.0 1 0.0 1,198,902 81.6 15,291 0.6 1,214,194 22.3
Homelessness/Migrancy 2,331 0.4 809 0.3 1,046 0.2 4,186 0.3 2,685 0.2 4,622 0.2 11,493 0.2
Other nutritional risks 23,035 3.8 4,237 1.3 12,061 2.5 39,333 2.8 35,427 2.4 87,251 3.4 162,011 3.0
No risk reported 1,795 0.3 1,062 0.3 1,736 0.4 4,592 0.3 6,645 0.5 10,688 0.4 21,925 0.4
Notes
An infant is defined as a participant who, at certification, is under one year of age and who would be classified as a child at the age of 366 days.
In 2008, State WIC agencies could report up to ten nutritional risks for each participant. This table examines all risks reported for every participant. When multiple risks within the same risk category are reported for one person, these risks are combined and counted one time in order to accurately calculate the number and percent of WIC participants with a specific risk or broad risk category.
This table reports information on persons not of Mexican, Puerto Rican, Cuban, Central or South American, or other Spanish culture or origin regardless of race. a For infants and one-year old children, this risk reflects parental (biological) obesity, not height and weight measurements.
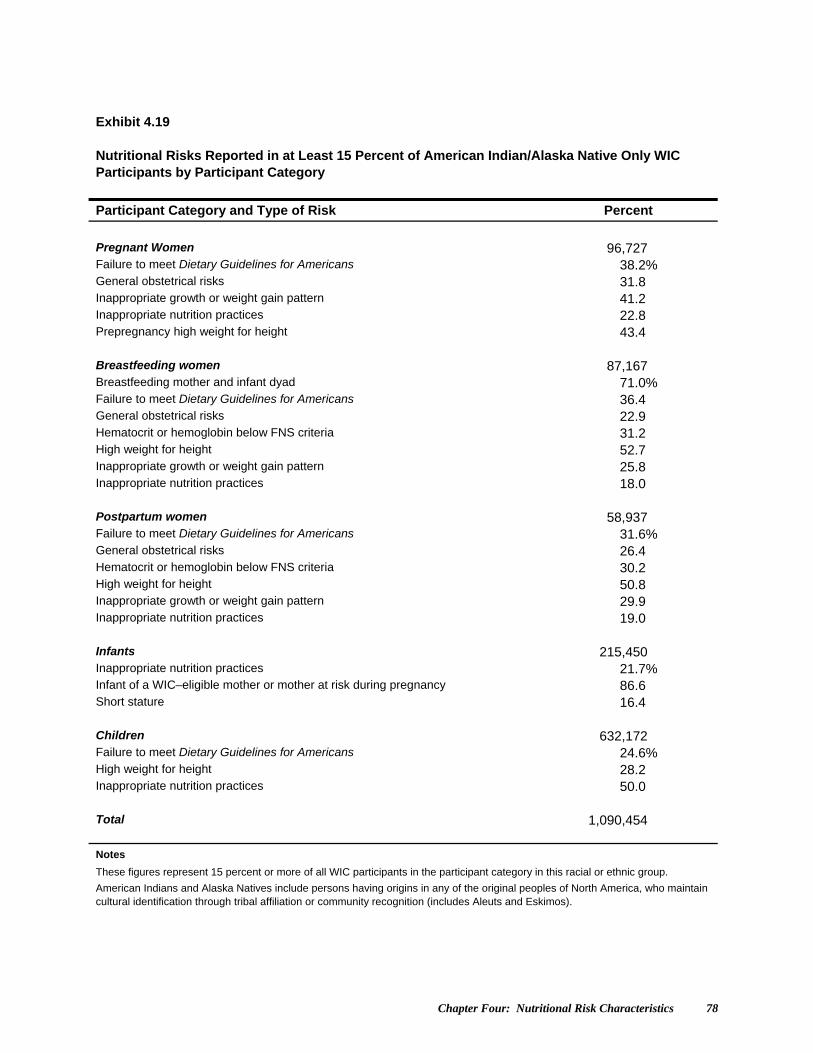
Chapter Four: Nutritional Risk Characteristics 78
Exhibit 4.19 Nutritional Risks Reported in at Least 15 Percent of American Indian/Alaska Native Only WIC Participants by Participant Category
Participant Category and Type of Risk Percent Pregnant Women 96,727 Failure to meet Dietary Guidelines for Americans 38.2% General obstetrical risks 31.8 Inappropriate growth or weight gain pattern 41.2 Inappropriate nutrition practices 22.8 Prepregnancy high weight for height 43.4 Breastfeeding women 87,167 Breastfeeding mother and infant dyad 71.0% Failure to meet Dietary Guidelines for Americans 36.4 General obstetrical risks 22.9 Hematocrit or hemoglobin below FNS criteria 31.2 High weight for height 52.7 Inappropriate growth or weight gain pattern 25.8 Inappropriate nutrition practices 18.0 Postpartum women 58,937 Failure to meet Dietary Guidelines for Americans 31.6% General obstetrical risks 26.4 Hematocrit or hemoglobin below FNS criteria 30.2 High weight for height 50.8 Inappropriate growth or weight gain pattern 29.9 Inappropriate nutrition practices 19.0 Infants 215,450 Inappropriate nutrition practices 21.7% Infant of a WIC–eligible mother or mother at risk during pregnancy 86.6 Short stature 16.4 Children 632,172 Failure to meet Dietary Guidelines for Americans 24.6% High weight for height 28.2 Inappropriate nutrition practices 50.0 Total 1,090,454
Notes
These figures represent 15 percent or more of all WIC participants in the participant category in this racial or ethnic group.
American Indians and Alaska Natives include persons having origins in any of the original peoples of North America, who maintain cultural identification through tribal affiliation or community recognition (includes Aleuts and Eskimos).

Chapter Four: Nutritional Risk Characteristics 79
Exhibit 4.20 Nutritional Risks Reported in at Least 15 Percent of Asian Only WIC Participants by Participant Category
Participant Category and Type of Risk Percent Pregnant women 26,267 Failure to meet Dietary Guidelines for Americans 43.4% General obstetrical risks 31.1 Inappropriate growth or weight gain pattern 31.8 Inappropriate nutrition practices 24.7 Prepregnancy high weight for height 17.5 Prepregnancy low weight for height 21.8 Breastfeeding women 21,416 Breastfeeding mother and infant dyad 55.9% Failure to meet Dietary Guidelines for Americans 38.2 General obstetrical risks 18.3 Hematocrit or hemoglobin below FNS criteria 32.8 High weight for height 26.3 Inappropriate growth or weight gain pattern 20.4 Inappropriate nutrition practices 20.4 Postpartum women 20,387 Failure to meet Dietary Guidelines for Americans 43.2% General obstetrical risks 22.6 Hematocrit or hemoglobin below FNS criteria 36.2 High weight for height 21.8 Inappropriate growth or weight gain pattern 20.2 Inappropriate nutrition practices 26.4 Infants 65,006 Inappropriate nutrition practices 20.4% Infant of a WIC–eligible mother or mother at risk during pregnancy 81.2 Children 122,658 Failure to meet Dietary Guidelines for Americans 33.4% High weight for height 17.2 Inappropriate nutrition practices 57.3 Total 255,733
Notes
These figures represent 15 percent or more of all WIC participants in the participant category in this racial or ethnic group.
This table reports information on persons having origins in any of the original peoples of the Far East, Southeast Asia, or the Indian subcontinent. This area includes, for example, Cambodia, China, India, Japan, Korea, Malaysia, Pakistan, the Philippine Islands, Thailand, and Vietnam.
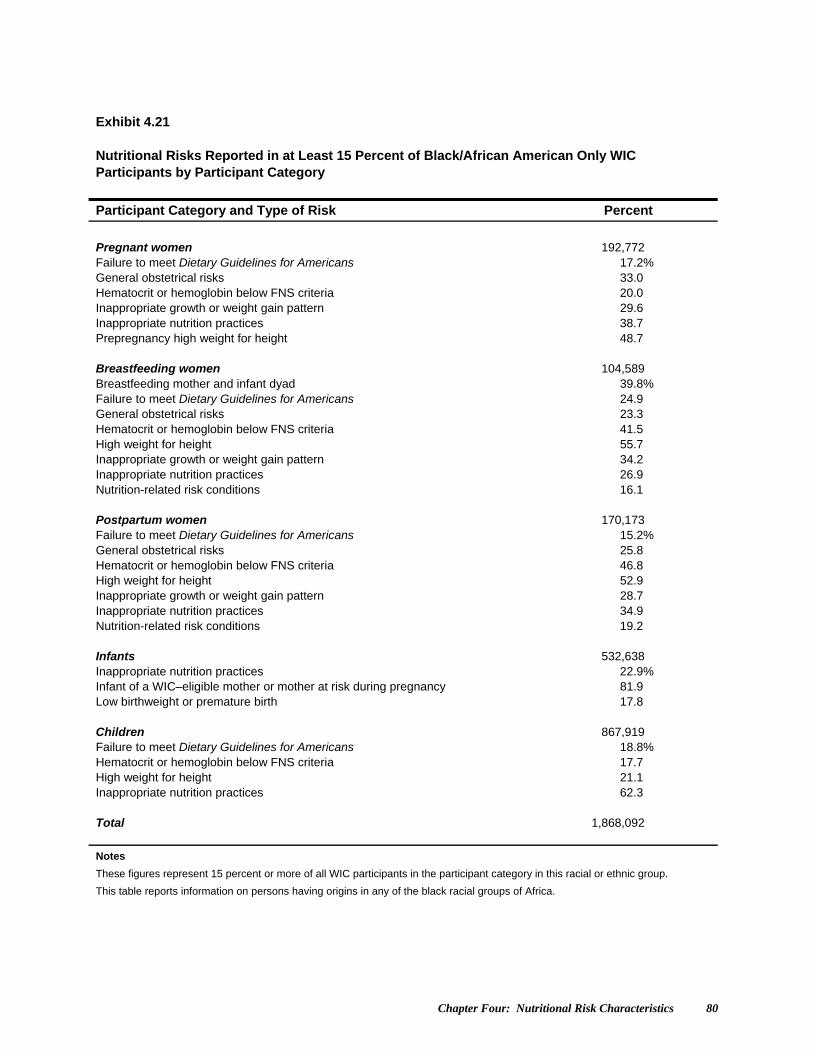
Chapter Four: Nutritional Risk Characteristics 80
Exhibit 4.21 Nutritional Risks Reported in at Least 15 Percent of Black/African American Only WIC Participants by Participant Category
Participant Category and Type of Risk Percent Pregnant women 192,772 Failure to meet Dietary Guidelines for Americans 17.2% General obstetrical risks 33.0 Hematocrit or hemoglobin below FNS criteria 20.0 Inappropriate growth or weight gain pattern 29.6 Inappropriate nutrition practices 38.7 Prepregnancy high weight for height 48.7 Breastfeeding women 104,589 Breastfeeding mother and infant dyad 39.8% Failure to meet Dietary Guidelines for Americans 24.9 General obstetrical risks 23.3 Hematocrit or hemoglobin below FNS criteria 41.5 High weight for height 55.7 Inappropriate growth or weight gain pattern 34.2 Inappropriate nutrition practices 26.9 Nutrition-related risk conditions 16.1 Postpartum women 170,173 Failure to meet Dietary Guidelines for Americans 15.2% General obstetrical risks 25.8 Hematocrit or hemoglobin below FNS criteria 46.8 High weight for height 52.9 Inappropriate growth or weight gain pattern 28.7 Inappropriate nutrition practices 34.9 Nutrition-related risk conditions 19.2 Infants 532,638 Inappropriate nutrition practices 22.9% Infant of a WIC–eligible mother or mother at risk during pregnancy 81.9 Low birthweight or premature birth 17.8 Children 867,919 Failure to meet Dietary Guidelines for Americans 18.8% Hematocrit or hemoglobin below FNS criteria 17.7 High weight for height 21.1 Inappropriate nutrition practices 62.3 Total 1,868,092
Notes
These figures represent 15 percent or more of all WIC participants in the participant category in this racial or ethnic group.
This table reports information on persons having origins in any of the black racial groups of Africa.
Chapter Four: Nutritional Risk Characteristics 81
Exhibit 4.22 Nutritional Risks Reported in at Least 15 Percent of Native Hawaiian/Pacific Islander Only WIC Participants by Participant Category
Participant Category and Type of Risk Percent Pregnant women 7,161 Failure to meet Dietary Guidelines for Americans 29.4% General obstetrical risks 33.9 Inappropriate growth or weight gain pattern 33.2 Inappropriate nutrition practices 23.3 Prepregnancy high weight for height 43.9 Breastfeeding women 8,165 Breastfeeding mother and infant dyad 33.8% Failure to meet Dietary Guidelines for Americans 32.3 General obstetrical risks 17.8 Hematocrit or hemoglobin below FNS criteria 37.9 High weight for height 48.4 Inappropriate growth or weight gain pattern 31.9 Inappropriate nutrition practices 17.2 Postpartum women 5,208 Failure to meet Dietary Guidelines for Americans 23.3% General obstetrical risks 20.9 Hematocrit or hemoglobin below FNS criteria 37.7 High weight for height 44.2 Inappropriate growth or weight gain pattern 30.4 Inappropriate nutrition practices 22.0 Infants 19,872 Inappropriate nutrition practices 19.9% Infant of a WIC–eligible mother or mother at risk during pregnancy 67.7 Children 40,679 Failure to meet Dietary Guidelines for Americans 24.9% High weight for height 19.9 Inappropriate nutrition practices 52.6 Total 81,084
Notes
These figures represent 15 percent or more of all WIC participants in the participant category in this racial or ethnic group.
This table reports information on persons having origins in any of the original peoples of Hawaii, Guam, Samoa, or other Pacific Islands.
Chapter Four: Nutritional Risk Characteristics 82
Exhibit 4.23 Nutritional Risks Reported in at Least 15 Percent of White Only WIC Participants by Participant Category
Participant Category and Type of Risk Percent Pregnant women 657,674 Failure to meet Dietary Guidelines for Americans 20.7% General obstetrical risks 34.5 Inappropriate growth or weight gain pattern 31.5 Inappropriate nutrition practices 31.5 Prepregnancy high weight for height 43.0 Substance abuse 17.0 Breastfeeding women 407,022 Breastfeeding mother and infant dyad 45.1% Failure to meet Dietary Guidelines for Americans 20.5 General obstetrical risks 24.3 Hematocrit or hemoglobin below FNS criteria 24.9 High weight for height 50.4 Inappropriate growth or weight gain pattern 30.6 Inappropriate nutrition practices 25.7 Postpartum women 432,017 Failure to meet Dietary Guidelines for Americans 18.6% General obstetrical risks 27.0 Hematocrit or hemoglobin below FNS criteria 29.5 High weight for height 48.6 Inappropriate growth or weight gain pattern 31.1 Inappropriate nutrition practices 31.1 Nutrition-related risk conditions 19.5 Infants 1,459,019 Inappropriate nutrition practices 25.6% Infant of a WIC–eligible mother or mother at risk during pregnancy 83.4 Children 2,797,269 Failure to meet Dietary Guidelines for Americans 20.0% High weight for height 23.2 Inappropriate nutrition practices 60.0 Total 5,753,002
Notes
These figures represent 15 percent or more of all WIC participants in the participant category in this racial or ethnic group.
This table reports information on persons having origins in any of the original peoples of Europe, North Africa, or the Middle East.
Chapter Four: Nutritional Risk Characteristics 83
Exhibit 4.24 Nutritional Risks Reported in at Least 15 Percent of WIC Participants Reporting Two or More Races by Participant Category
Participant Category and Type of Risk Percent Pregnant women 20,500 Failure to meet Dietary Guidelines for Americans 25.9% General obstetrical risks 39.3 Inappropriate growth or weight gain pattern 37.4 Inappropriate nutrition practices 27.8 Prepregnancy high weight for height 43.7 Substance abuse 15.1 Breastfeeding women 15,479 Breastfeeding mother and infant dyad 55.5% Failure to meet Dietary Guidelines for Americans 26.1 General obstetrical risks 24.9 Hematocrit or hemoglobin below FNS criteria 30.5 High weight for height 49.5 Inappropriate growth or weight gain pattern 35.2 Inappropriate nutrition practices 24.2 Postpartum women 12,813 Failure to meet Dietary Guidelines for Americans 24.6% General obstetrical risks 30.9 Hematocrit or hemoglobin below FNS criteria 34.5 High weight for height 46.9 Inappropriate growth or weight gain pattern 36.0 Inappropriate nutrition practices 27.3 Nutrition-related risk conditions 19.0 Infants 102,586 Inappropriate nutrition practices 26.2% Infant of a WIC–eligible mother or mother at risk during pregnancy 83.0 Children 195,450 Failure to meet Dietary Guidelines for Americans 21.4% High weight for height 21.9 Inappropriate nutrition practices 61.7 Total 346,829
Notes
These figures represent 15 percent or more of all WIC participants in the participant category in this racial or ethnic group.
This table reports information on persons reporting two or more races.
Chapter Four: Nutritional Risk Characteristics 84
Exhibit 4.25 Nutritional Risks Reported in at Least 15 Percent of Hispanic/Latino WIC Participants by Participant Category
Participant Category and Type of Risk Percent Pregnant women 397,242 Failure to meet Dietary Guidelines for Americans 29.7% General obstetrical risks 33.6 Inappropriate growth or weight gain pattern 38.2 Inappropriate nutrition practices 27.0 Prepregnancy high weight for height 43.9 Breastfeeding women 333,150 Breastfeeding mother and infant dyad 51.2% Failure to meet Dietary Guidelines for Americans 26.1 General obstetrical risks 23.5 Hematocrit or hemoglobin below FNS criteria 29.2 High weight for height 53.0 Inappropriate growth or weight gain pattern 28.8 Inappropriate nutrition practices 24.1 Postpartum women 218,158 Failure to meet Dietary Guidelines for Americans 26.8% General obstetrical risks 28.7 Hematocrit or hemoglobin below FNS criteria 31.8 High weight for height 50.2 Inappropriate growth or weight gain pattern 30.9 Inappropriate nutrition practices 26.1 Infants 943,146 Inappropriate nutrition practices 27.7% Infant of a WIC–eligible mother or mother at risk during pregnancy 85.7 Children 2,124,965 Failure to meet Dietary Guidelines for Americans 22.7% High weight for height 25.6 Inappropriate nutrition practices 55.1 Total 4,016,660
Notes
These figures represent 15 percent or more of all WIC participants in the participant category in this racial or ethnic group.
This table reports information on persons of Mexican, Puerto Rican, Cuban, Central or South American, or other Spanish culture or origin regardless of race.
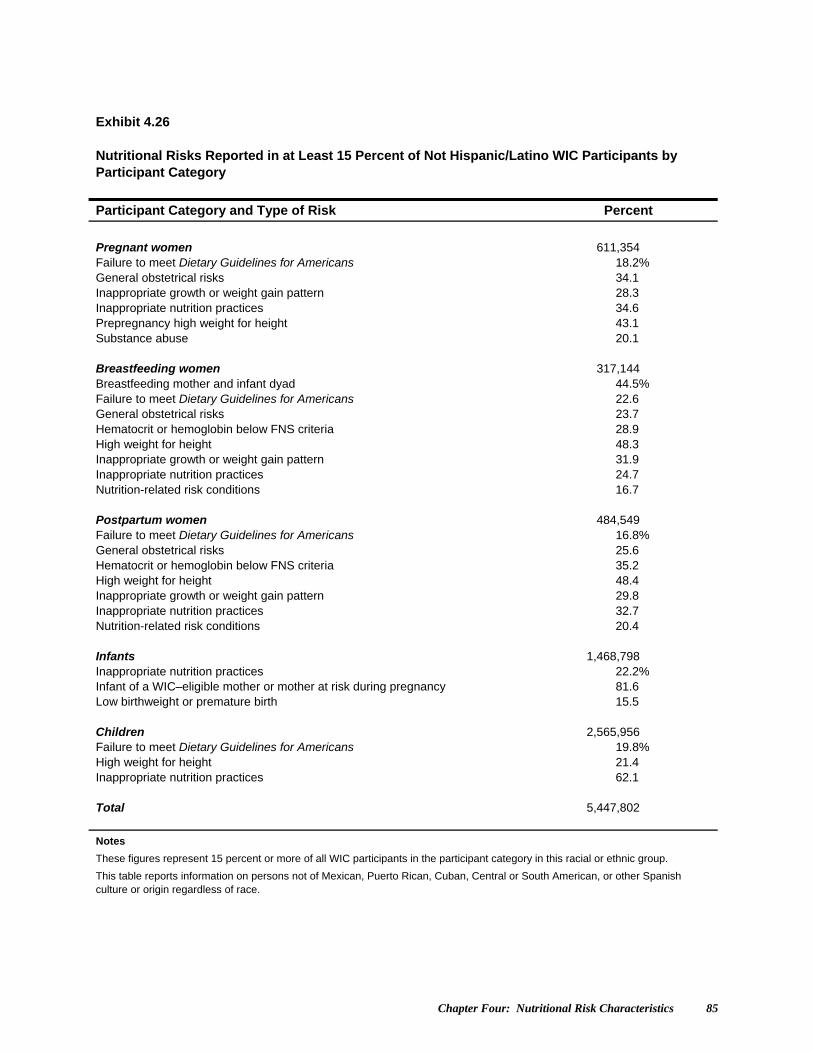
Chapter Four: Nutritional Risk Characteristics 85
Exhibit 4.26 Nutritional Risks Reported in at Least 15 Percent of Not Hispanic/Latino WIC Participants by Participant Category
Participant Category and Type of Risk Percent Pregnant women 611,354 Failure to meet Dietary Guidelines for Americans 18.2% General obstetrical risks 34.1 Inappropriate growth or weight gain pattern 28.3 Inappropriate nutrition practices 34.6 Prepregnancy high weight for height 43.1 Substance abuse 20.1 Breastfeeding women 317,144 Breastfeeding mother and infant dyad 44.5% Failure to meet Dietary Guidelines for Americans 22.6 General obstetrical risks 23.7 Hematocrit or hemoglobin below FNS criteria 28.9 High weight for height 48.3 Inappropriate growth or weight gain pattern 31.9 Inappropriate nutrition practices 24.7 Nutrition-related risk conditions 16.7 Postpartum women 484,549 Failure to meet Dietary Guidelines for Americans 16.8% General obstetrical risks 25.6 Hematocrit or hemoglobin below FNS criteria 35.2 High weight for height 48.4 Inappropriate growth or weight gain pattern 29.8 Inappropriate nutrition practices 32.7 Nutrition-related risk conditions 20.4 Infants 1,468,798 Inappropriate nutrition practices 22.2% Infant of a WIC–eligible mother or mother at risk during pregnancy 81.6 Low birthweight or premature birth 15.5 Children 2,565,956 Failure to meet Dietary Guidelines for Americans 19.8% High weight for height 21.4 Inappropriate nutrition practices 62.1 Total 5,447,802
Notes
These figures represent 15 percent or more of all WIC participants in the participant category in this racial or ethnic group.
This table reports information on persons not of Mexican, Puerto Rican, Cuban, Central or South American, or other Spanish culture or origin regardless of race.
Chapter Four: Nutritional Risk Characteristics 86
report high weight for height. Substance abuse (drugs, alcohol, and/or tobacco) among pregnant WIC women was most prevalent for White Only women (reported at 17.0 percent).3 American Indian/Alaska Native Only and Asian Only pregnant women were more likely to report the failure to meet Dietary Guidelines for Americans risk (38.2 percent and 43.4 percent respectively) than women of other races. Hispanic pregnant women report inappropriate growth or weight gain pattern more often than non-Hispanics, while non-Hispanic pregnant women report inappropriate nutrition practices risk more often than Hispanics. American Indian/Alaska Native Only and Hispanic breastfeeding women report the breastfeeding mother and infant dyad more often than other participants. The most common risk for infants across all racial and ethnic categories is WIC-eligible mother or mother at risk during pregnancy. Black/African American Only infants are more likely to be assigned low birthweight or premature birth risks than infants in other racial/ethnic groups. The broad dietary risk category is most commonly assigned to children regardless of race or ethnicity. Notable differences by race and ethnicity include American Indian/Alaska Native Only children who are somewhat more likely to have been assigned a risk based on high weight for height, and Asian Only children who are more likely to report the failure to meet Dietary Guidelines for Americans risk. In addition, Non-Hispanic children report the inappropriate nutrition practices risk more often than Hispanic children.
Nutritional and Poverty Status Exhibits 4.27 through 4.33 present distributions of specific and broad
categories of nutritional risks by percent of poverty. The differences seen across poverty levels in PC2008 are similar to, though not quite as strong as, findings in previous years. Women at lower income levels generally report higher levels of obstetrical risk and of blood measures below FNS criteria. Among infants, there are few fluctuations across percent of poverty. Children experience a general decrease in reporting in the broad category of anthropometric risks as income rises. The frequency of blood measurements below FNS criteria decreases with increased income for both women and children.
Anthropometric Values Weight and height are measured and recorded during the eligibility
determination process. Although States have routinely collected these data for years, reporting has improved over time. Prior to the changes in nutrition risk standards implemented in 1999, each State set the criteria for determining overweight and underweight participants. Beginning in April 1999, States were required to use, at a minimum, the FNS mandated definitions. States could elect to implement stricter standards.
Measurements for WIC infants and children were compared with the statistical norms in the general population using National Center for Health Statistics-Centers for Disease Control and Prevention (NCHS-CDC) standardized distributions. The NCHS-CDC standardized distributions were updated in
3 In PC2004, 16.9 percent of American Indian/Alaska Native pregnant women reported substance abuse. That percentage had fallen to 4.5 for 2006 and 5.4 for 2008. This decrease is most probably an artifact of the large (tenfold) increase in the number of WIC participants reporting as American Indian/Alaska Native. In turn, the increase among White Only women reflects reporting using the revised racial and ethnic categories. In previous years, most of these women would have been categorized as Hispanic instead.

Chapter Four: Nutritional Risk Characteristics 87
Exhibit 4.27 Number and Percent of Women WIC Participants with Specific Nutritional Risks Reported at Certification by Percent of Poverty
Level of Poverty
Type of Risk and Specific Risk Up to 100% 101% to 130% 131% to 185% 186% and over Income Reported as Zeroa
Not Reportedb Total Women
Number Percent Number Percent Number Percent Number Percent Number Percent Number Percent Number Percent
Participants in category 1,446,473 320,537 327,353 35,365 24,973 226,908 2,381,607
Anthropometric 940,987 65.1% 206,892 64.5% 210,652 64.4% 22,460 63.5% 13,938 55.8% 140,943 62.1% 1,535,873 64.5%
Low weight for height 85,423 5.9 16,583 5.2 17,103 5.2 2,244 6.3 1,681 6.7 16,319 7.2 139,354 5.9
High weight for height 689,540 47.7 152,529 47.6 154,201 47.1 15,583 44.1 9,279 37.2 100,520 44.3 1,121,652 47.1
Short stature 71 0.0 18 0.0 18 0.0 0 0.0 0 0.0 85 0.0 192 0.0
Inappropriate growth or weight gain pattern
451,423 31.2 100,797 31.4 103,509 31.6 11,448 32.4 6,865 27.5 61,992 27.3 736,034 30.9
Other anthropometric risk 9 0.0 0 0.0 3 0.0 0 0.0 0 0.0 7 0.0 19 0.0
Biochemical 344,213 23.8 64,360 20.1 60,852 18.6 6,665 18.8 4,474 17.9 58,526 25.8 539,089 22.6
Hematocrit or hemoglobin below FNS criteria
343,911 23.8 64,323 20.1 60,816 18.6 6,663 18.8 4,470 17.9 58,475 25.8 538,657 22.6
Other biochemical test results which indicate nutritional abnormality
377 0.0 50 0.0 49 0.0 3 0.0 5 0.0 65 0.0 549 0.0
Clinical, Health, Medical 744,142 51.4 149,126 46.5 149,275 45.6 17,537 49.6 11,750 47.1 123,647 54.5 1,195,477 50.2
Pregnancy-induced conditions 55,276 3.8 13,467 4.2 14,035 4.3 1,370 3.9 705 2.8 6,438 2.8 91,292 3.8
Delivery of low-birthweight or premature infant
105,869 7.3 19,699 6.1 19,885 6.1 2,208 6.2 1,309 5.2 20,877 9.2 169,845 7.1
Prior stillbirth, fetal, or neonatal death
37,561 2.6 8,302 2.6 9,100 2.8 1,235 3.5 560 2.2 7,457 3.3 64,216 2.7
General obstetrical risks 441,572 30.5 84,418 26.3 78,805 24.1 8,872 25.1 6,794 27.2 67,020 29.5 687,482 28.9
Nutrition-related risk conditions 185,521 12.8 39,032 12.2 43,458 13.3 5,361 15.2 2,833 11.3 32,217 14.2 308,422 13.0
Substance abuse 112,787 7.8 19,372 6.0 20,050 6.1 3,265 9.2 2,369 9.5 26,955 11.9 184,799 7.8
Other health risks 45,615 3.2 8,751 2.7 8,053 2.5 1,083 3.1 750 3.0 7,961 3.5 72,213 3.0
Dietary 741,154 51.2 161,050 50.2 163,823 50.0 17,620 49.8 10,159 40.7 110,793 48.8 1,204,598 50.6
Failure to meet Dietary Guidelines for Americans
312,674 21.6 76,350 23.8 78,376 23.9 8,074 22.8 5,271 21.1 47,922 21.1 528,667 22.2
Inappropriate nutrition practices 443,204 30.6 88,074 27.5 88,944 27.2 9,934 28.1 5,125 20.5 66,264 29.2 701,546 29.5
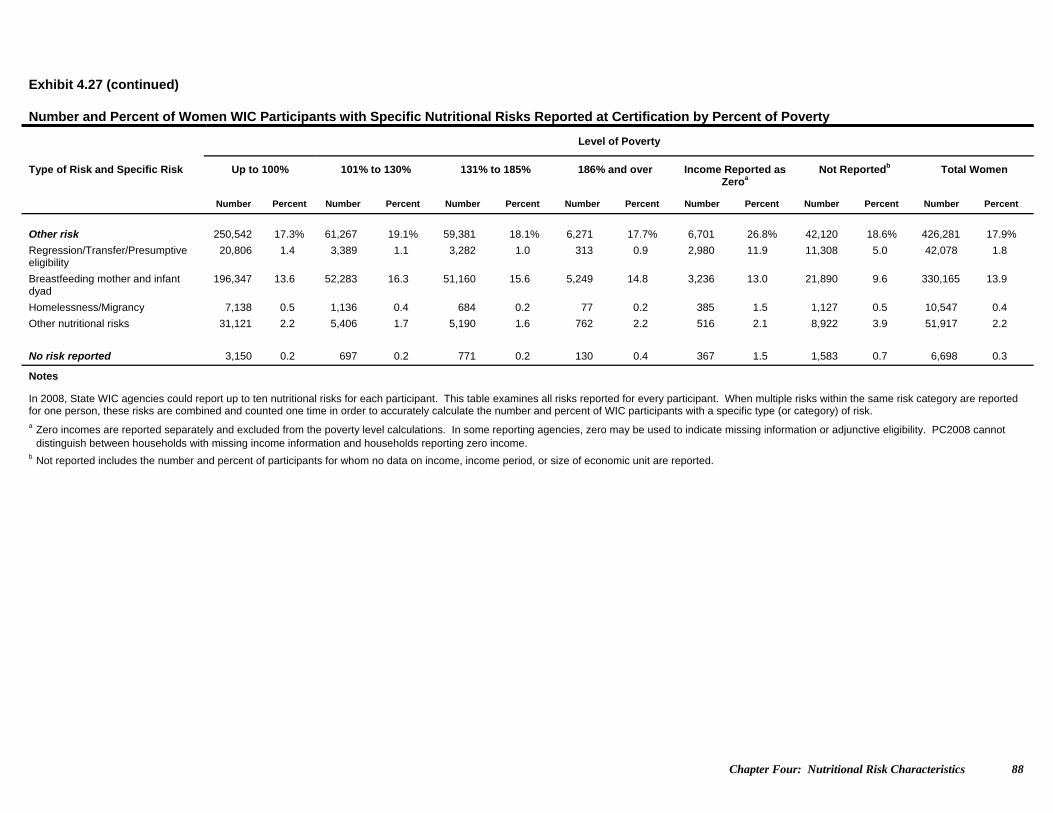
Chapter Four: Nutritional Risk Characteristics 88
Exhibit 4.27 (continued) Number and Percent of Women WIC Participants with Specific Nutritional Risks Reported at Certification by Percent of Poverty
Level of Poverty
Type of Risk and Specific Risk Up to 100% 101% to 130% 131% to 185% 186% and over Income Reported as Zeroa
Not Reportedb Total Women
Number Percent Number Percent Number Percent Number Percent Number Percent Number Percent Number Percent
Other risk 250,542 17.3% 61,267 19.1% 59,381 18.1% 6,271 17.7% 6,701 26.8% 42,120 18.6% 426,281 17.9%
Regression/Transfer/Presumptive eligibility
20,806 1.4 3,389 1.1 3,282 1.0 313 0.9 2,980 11.9 11,308 5.0 42,078 1.8
Breastfeeding mother and infant dyad
196,347 13.6 52,283 16.3 51,160 15.6 5,249 14.8 3,236 13.0 21,890 9.6 330,165 13.9
Homelessness/Migrancy 7,138 0.5 1,136 0.4 684 0.2 77 0.2 385 1.5 1,127 0.5 10,547 0.4
Other nutritional risks 31,121 2.2 5,406 1.7 5,190 1.6 762 2.2 516 2.1 8,922 3.9 51,917 2.2
No risk reported 3,150 0.2 697 0.2 771 0.2 130 0.4 367 1.5 1,583 0.7 6,698 0.3
Notes
In 2008, State WIC agencies could report up to ten nutritional risks for each participant. This table examines all risks reported for every participant. When multiple risks within the same risk category are reported for one person, these risks are combined and counted one time in order to accurately calculate the number and percent of WIC participants with a specific type (or category) of risk. a Zero incomes are reported separately and excluded from the poverty level calculations. In some reporting agencies, zero may be used to indicate missing information or adjunctive eligibility. PC2008 cannot
distinguish between households with missing income information and households reporting zero income. b Not reported includes the number and percent of participants for whom no data on income, income period, or size of economic unit are reported.
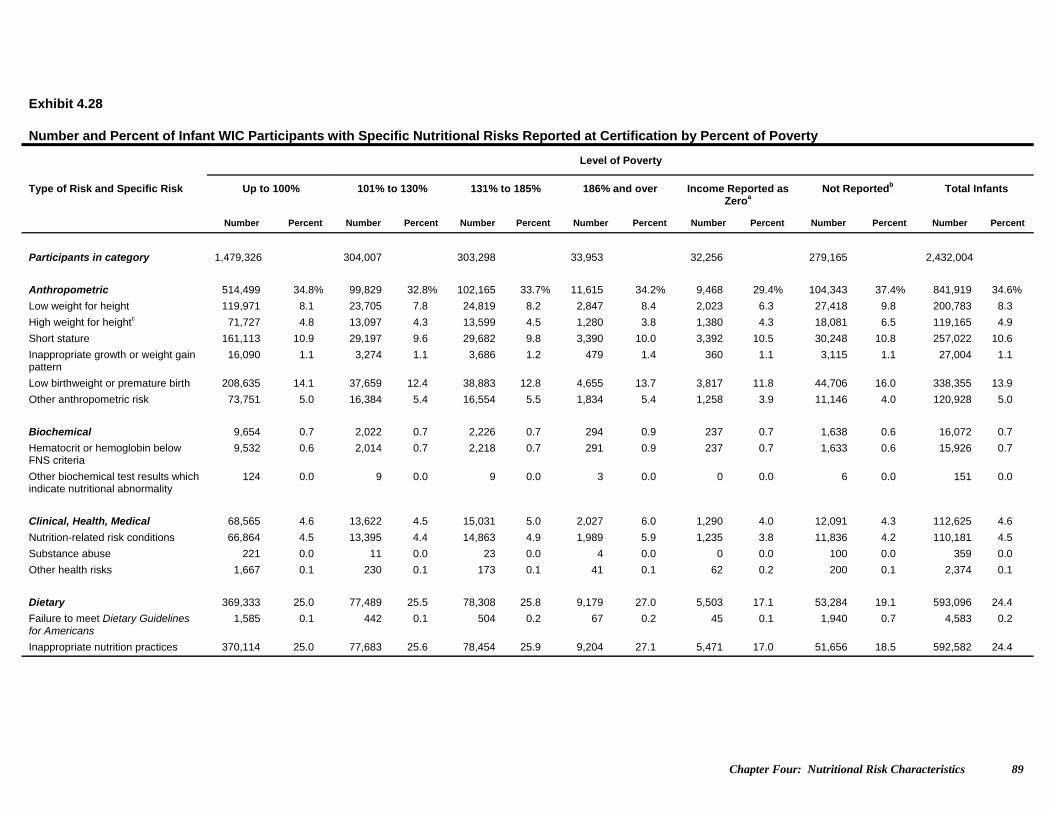
Chapter Four: Nutritional Risk Characteristics 89
Exhibit 4.28 Number and Percent of Infant WIC Participants with Specific Nutritional Risks Reported at Certification by Percent of Poverty
Level of Poverty
Type of Risk and Specific Risk Up to 100% 101% to 130% 131% to 185% 186% and over Income Reported as Zeroa
Not Reportedb Total Infants
Number Percent Number Percent Number Percent Number Percent Number Percent Number Percent Number Percent
Participants in category 1,479,326 304,007 303,298 33,953 32,256 279,165 2,432,004
Anthropometric 514,499 34.8% 99,829 32.8% 102,165 33.7% 11,615 34.2% 9,468 29.4% 104,343 37.4% 841,919 34.6%
Low weight for height 119,971 8.1 23,705 7.8 24,819 8.2 2,847 8.4 2,023 6.3 27,418 9.8 200,783 8.3
High weight for heightc 71,727 4.8 13,097 4.3 13,599 4.5 1,280 3.8 1,380 4.3 18,081 6.5 119,165 4.9
Short stature 161,113 10.9 29,197 9.6 29,682 9.8 3,390 10.0 3,392 10.5 30,248 10.8 257,022 10.6
Inappropriate growth or weight gain pattern
16,090 1.1 3,274 1.1 3,686 1.2 479 1.4 360 1.1 3,115 1.1 27,004 1.1
Low birthweight or premature birth 208,635 14.1 37,659 12.4 38,883 12.8 4,655 13.7 3,817 11.8 44,706 16.0 338,355 13.9
Other anthropometric risk 73,751 5.0 16,384 5.4 16,554 5.5 1,834 5.4 1,258 3.9 11,146 4.0 120,928 5.0
Biochemical 9,654 0.7 2,022 0.7 2,226 0.7 294 0.9 237 0.7 1,638 0.6 16,072 0.7
Hematocrit or hemoglobin below FNS criteria
9,532 0.6 2,014 0.7 2,218 0.7 291 0.9 237 0.7 1,633 0.6 15,926 0.7
Other biochemical test results which indicate nutritional abnormality
124 0.0 9 0.0 9 0.0 3 0.0 0 0.0 6 0.0 151 0.0
Clinical, Health, Medical 68,565 4.6 13,622 4.5 15,031 5.0 2,027 6.0 1,290 4.0 12,091 4.3 112,625 4.6
Nutrition-related risk conditions 66,864 4.5 13,395 4.4 14,863 4.9 1,989 5.9 1,235 3.8 11,836 4.2 110,181 4.5
Substance abuse 221 0.0 11 0.0 23 0.0 4 0.0 0 0.0 100 0.0 359 0.0
Other health risks 1,667 0.1 230 0.1 173 0.1 41 0.1 62 0.2 200 0.1 2,374 0.1
Dietary 369,333 25.0 77,489 25.5 78,308 25.8 9,179 27.0 5,503 17.1 53,284 19.1 593,096 24.4
Failure to meet Dietary Guidelines for Americans
1,585 0.1 442 0.1 504 0.2 67 0.2 45 0.1 1,940 0.7 4,583 0.2
Inappropriate nutrition practices 370,114 25.0 77,683 25.6 78,454 25.9 9,204 27.1 5,471 17.0 51,656 18.5 592,582 24.4
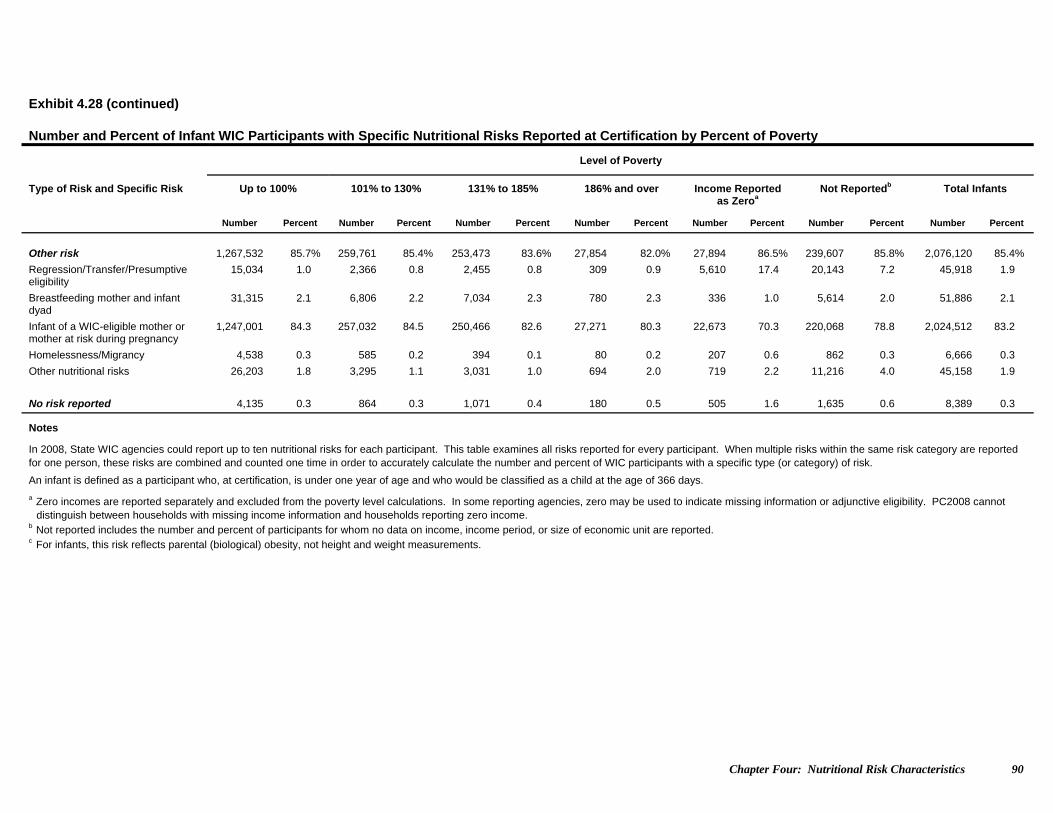
Chapter Four: Nutritional Risk Characteristics 90
Exhibit 4.28 (continued) Number and Percent of Infant WIC Participants with Specific Nutritional Risks Reported at Certification by Percent of Poverty
Level of Poverty
Type of Risk and Specific Risk Up to 100% 101% to 130% 131% to 185% 186% and over Income Reported as Zeroa
Not Reportedb Total Infants
Number Percent Number Percent Number Percent Number Percent Number Percent Number Percent Number Percent
Other risk 1,267,532 85.7% 259,761 85.4% 253,473 83.6% 27,854 82.0% 27,894 86.5% 239,607 85.8% 2,076,120 85.4%
Regression/Transfer/Presumptive eligibility
15,034 1.0 2,366 0.8 2,455 0.8 309 0.9 5,610 17.4 20,143 7.2 45,918 1.9
Breastfeeding mother and infant dyad
31,315 2.1 6,806 2.2 7,034 2.3 780 2.3 336 1.0 5,614 2.0 51,886 2.1
Infant of a WIC-eligible mother or mother at risk during pregnancy
1,247,001 84.3 257,032 84.5 250,466 82.6 27,271 80.3 22,673 70.3 220,068 78.8 2,024,512 83.2
Homelessness/Migrancy 4,538 0.3 585 0.2 394 0.1 80 0.2 207 0.6 862 0.3 6,666 0.3
Other nutritional risks 26,203 1.8 3,295 1.1 3,031 1.0 694 2.0 719 2.2 11,216 4.0 45,158 1.9
No risk reported 4,135 0.3 864 0.3 1,071 0.4 180 0.5 505 1.6 1,635 0.6 8,389 0.3
Notes
In 2008, State WIC agencies could report up to ten nutritional risks for each participant. This table examines all risks reported for every participant. When multiple risks within the same risk category are reported for one person, these risks are combined and counted one time in order to accurately calculate the number and percent of WIC participants with a specific type (or category) of risk.
An infant is defined as a participant who, at certification, is under one year of age and who would be classified as a child at the age of 366 days.
a Zero incomes are reported separately and excluded from the poverty level calculations. In some reporting agencies, zero may be used to indicate missing information or adjunctive eligibility. PC2008 cannot distinguish between households with missing income information and households reporting zero income.
b Not reported includes the number and percent of participants for whom no data on income, income period, or size of economic unit are reported. c For infants, this risk reflects parental (biological) obesity, not height and weight measurements.
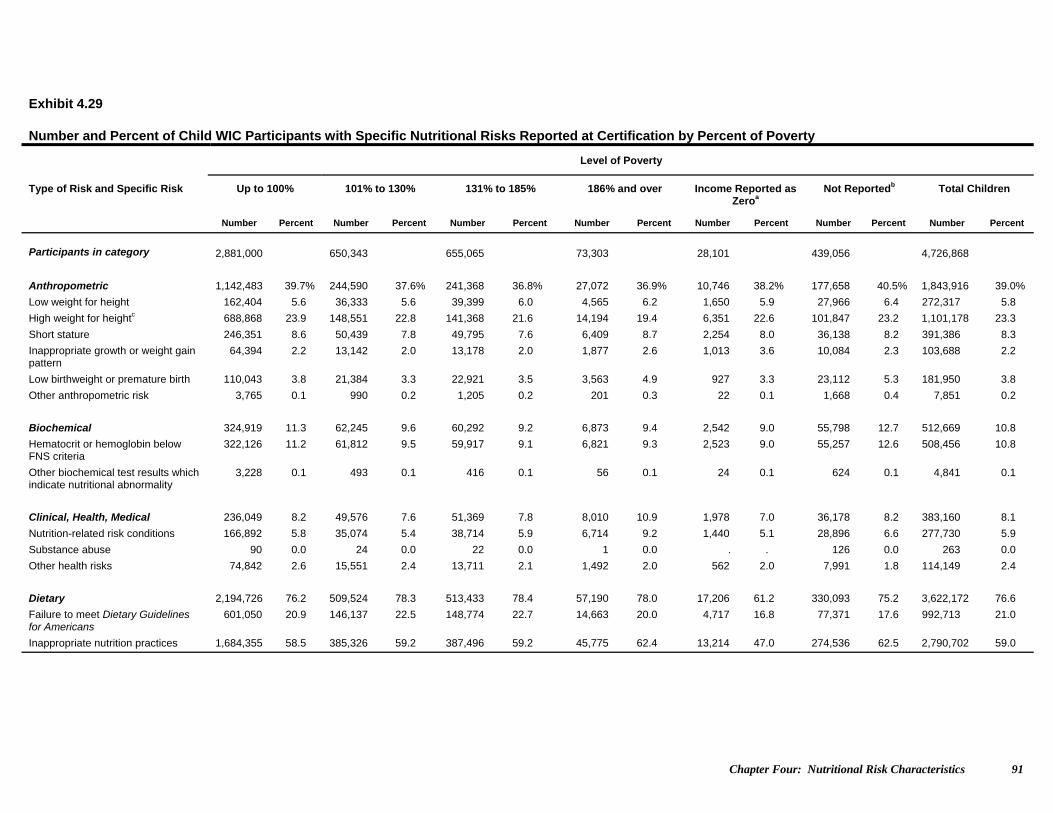
Chapter Four: Nutritional Risk Characteristics 91
Exhibit 4.29 Number and Percent of Child WIC Participants with Specific Nutritional Risks Reported at Certification by Percent of Poverty
Level of Poverty
Type of Risk and Specific Risk Up to 100% 101% to 130% 131% to 185% 186% and over Income Reported as Zeroa
Not Reportedb Total Children
Number Percent Number Percent Number Percent Number Percent Number Percent Number Percent Number Percent
Participants in category 2,881,000 650,343 655,065 73,303 28,101 439,056 4,726,868
Anthropometric 1,142,483 39.7% 244,590 37.6% 241,368 36.8% 27,072 36.9% 10,746 38.2% 177,658 40.5% 1,843,916 39.0%
Low weight for height 162,404 5.6 36,333 5.6 39,399 6.0 4,565 6.2 1,650 5.9 27,966 6.4 272,317 5.8
High weight for heightc 688,868 23.9 148,551 22.8 141,368 21.6 14,194 19.4 6,351 22.6 101,847 23.2 1,101,178 23.3
Short stature 246,351 8.6 50,439 7.8 49,795 7.6 6,409 8.7 2,254 8.0 36,138 8.2 391,386 8.3
Inappropriate growth or weight gain pattern
64,394 2.2 13,142 2.0 13,178 2.0 1,877 2.6 1,013 3.6 10,084 2.3 103,688 2.2
Low birthweight or premature birth 110,043 3.8 21,384 3.3 22,921 3.5 3,563 4.9 927 3.3 23,112 5.3 181,950 3.8
Other anthropometric risk 3,765 0.1 990 0.2 1,205 0.2 201 0.3 22 0.1 1,668 0.4 7,851 0.2
Biochemical 324,919 11.3 62,245 9.6 60,292 9.2 6,873 9.4 2,542 9.0 55,798 12.7 512,669 10.8
Hematocrit or hemoglobin below FNS criteria
322,126 11.2 61,812 9.5 59,917 9.1 6,821 9.3 2,523 9.0 55,257 12.6 508,456 10.8
Other biochemical test results which indicate nutritional abnormality
3,228 0.1 493 0.1 416 0.1 56 0.1 24 0.1 624 0.1 4,841 0.1
Clinical, Health, Medical 236,049 8.2 49,576 7.6 51,369 7.8 8,010 10.9 1,978 7.0 36,178 8.2 383,160 8.1
Nutrition-related risk conditions 166,892 5.8 35,074 5.4 38,714 5.9 6,714 9.2 1,440 5.1 28,896 6.6 277,730 5.9
Substance abuse 90 0.0 24 0.0 22 0.0 1 0.0 . . 126 0.0 263 0.0
Other health risks 74,842 2.6 15,551 2.4 13,711 2.1 1,492 2.0 562 2.0 7,991 1.8 114,149 2.4
Dietary 2,194,726 76.2 509,524 78.3 513,433 78.4 57,190 78.0 17,206 61.2 330,093 75.2 3,622,172 76.6
Failure to meet Dietary Guidelines for Americans
601,050 20.9 146,137 22.5 148,774 22.7 14,663 20.0 4,717 16.8 77,371 17.6 992,713 21.0
Inappropriate nutrition practices 1,684,355 58.5 385,326 59.2 387,496 59.2 45,775 62.4 13,214 47.0 274,536 62.5 2,790,702 59.0
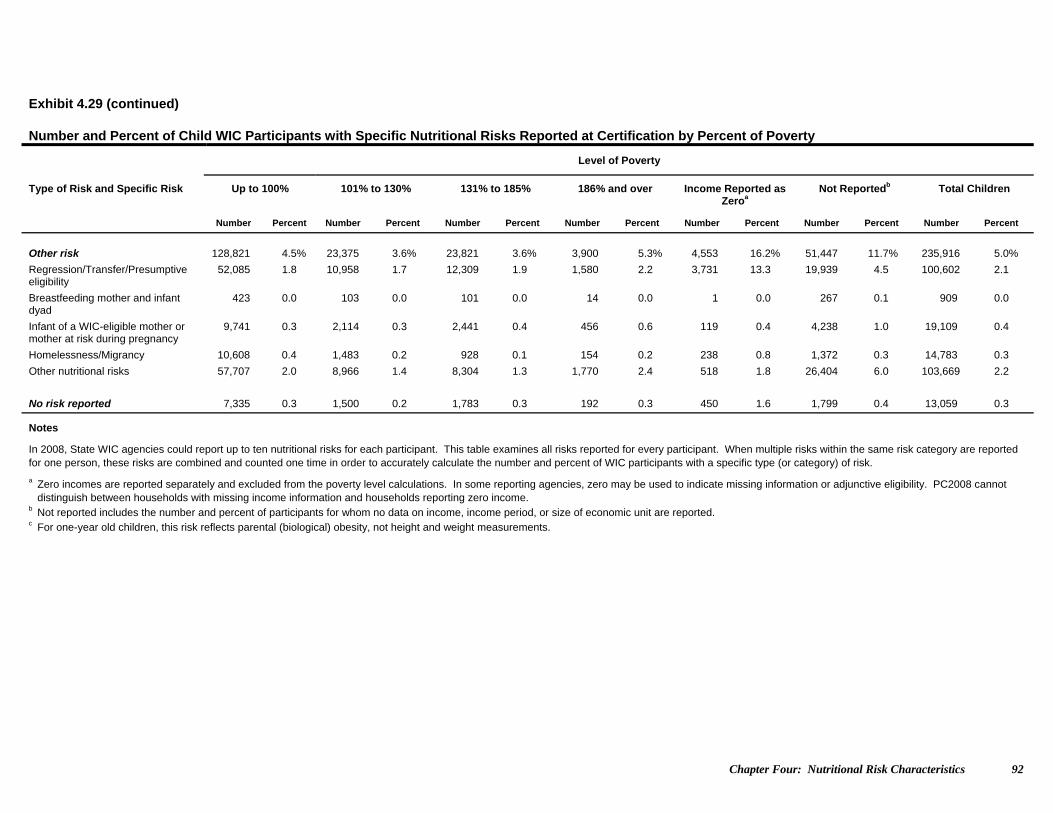
Chapter Four: Nutritional Risk Characteristics 92
Exhibit 4.29 (continued) Number and Percent of Child WIC Participants with Specific Nutritional Risks Reported at Certification by Percent of Poverty
Level of Poverty
Type of Risk and Specific Risk Up to 100% 101% to 130% 131% to 185% 186% and over Income Reported as Zeroa
Not Reportedb Total Children
Number Percent Number Percent Number Percent Number Percent Number Percent Number Percent Number Percent
Other risk 128,821 4.5% 23,375 3.6% 23,821 3.6% 3,900 5.3% 4,553 16.2% 51,447 11.7% 235,916 5.0%
Regression/Transfer/Presumptive eligibility
52,085 1.8 10,958 1.7 12,309 1.9 1,580 2.2 3,731 13.3 19,939 4.5 100,602 2.1
Breastfeeding mother and infant dyad
423 0.0 103 0.0 101 0.0 14 0.0 1 0.0 267 0.1 909 0.0
Infant of a WIC-eligible mother or mother at risk during pregnancy
9,741 0.3 2,114 0.3 2,441 0.4 456 0.6 119 0.4 4,238 1.0 19,109 0.4
Homelessness/Migrancy 10,608 0.4 1,483 0.2 928 0.1 154 0.2 238 0.8 1,372 0.3 14,783 0.3
Other nutritional risks 57,707 2.0 8,966 1.4 8,304 1.3 1,770 2.4 518 1.8 26,404 6.0 103,669 2.2
No risk reported 7,335 0.3 1,500 0.2 1,783 0.3 192 0.3 450 1.6 1,799 0.4 13,059 0.3
Notes
In 2008, State WIC agencies could report up to ten nutritional risks for each participant. This table examines all risks reported for every participant. When multiple risks within the same risk category are reported for one person, these risks are combined and counted one time in order to accurately calculate the number and percent of WIC participants with a specific type (or category) of risk.
a Zero incomes are reported separately and excluded from the poverty level calculations. In some reporting agencies, zero may be used to indicate missing information or adjunctive eligibility. PC2008 cannot distinguish between households with missing income information and households reporting zero income.
b Not reported includes the number and percent of participants for whom no data on income, income period, or size of economic unit are reported. c For one-year old children, this risk reflects parental (biological) obesity, not height and weight measurements.
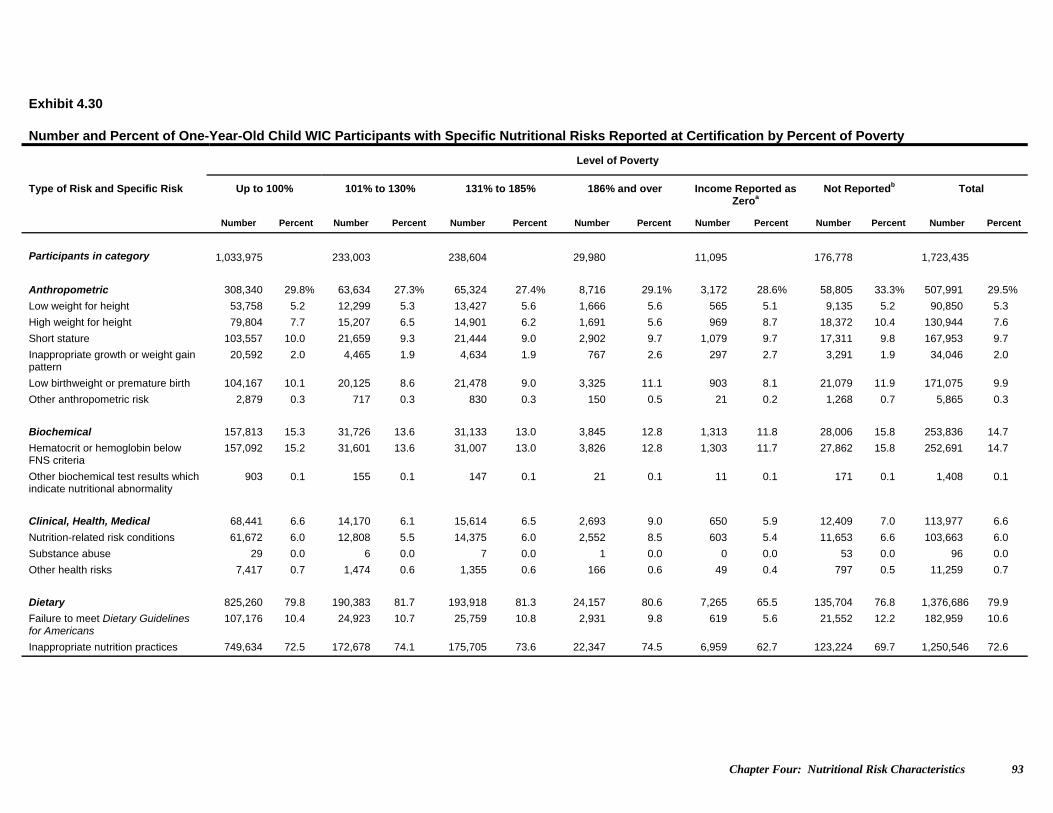
Chapter Four: Nutritional Risk Characteristics 93
Exhibit 4.30 Number and Percent of One-Year-Old Child WIC Participants with Specific Nutritional Risks Reported at Certification by Percent of Poverty
Level of Poverty
Type of Risk and Specific Risk Up to 100% 101% to 130% 131% to 185% 186% and over Income Reported as Zeroa
Not Reportedb Total
Number Percent Number Percent Number Percent Number Percent Number Percent Number Percent Number Percent
Participants in category 1,033,975 233,003 238,604 29,980 11,095 176,778 1,723,435
Anthropometric 308,340 29.8% 63,634 27.3% 65,324 27.4% 8,716 29.1% 3,172 28.6% 58,805 33.3% 507,991 29.5%
Low weight for height 53,758 5.2 12,299 5.3 13,427 5.6 1,666 5.6 565 5.1 9,135 5.2 90,850 5.3
High weight for height 79,804 7.7 15,207 6.5 14,901 6.2 1,691 5.6 969 8.7 18,372 10.4 130,944 7.6
Short stature 103,557 10.0 21,659 9.3 21,444 9.0 2,902 9.7 1,079 9.7 17,311 9.8 167,953 9.7
Inappropriate growth or weight gain pattern
20,592 2.0 4,465 1.9 4,634 1.9 767 2.6 297 2.7 3,291 1.9 34,046 2.0
Low birthweight or premature birth 104,167 10.1 20,125 8.6 21,478 9.0 3,325 11.1 903 8.1 21,079 11.9 171,075 9.9
Other anthropometric risk 2,879 0.3 717 0.3 830 0.3 150 0.5 21 0.2 1,268 0.7 5,865 0.3
Biochemical 157,813 15.3 31,726 13.6 31,133 13.0 3,845 12.8 1,313 11.8 28,006 15.8 253,836 14.7
Hematocrit or hemoglobin below FNS criteria
157,092 15.2 31,601 13.6 31,007 13.0 3,826 12.8 1,303 11.7 27,862 15.8 252,691 14.7
Other biochemical test results which indicate nutritional abnormality
903 0.1 155 0.1 147 0.1 21 0.1 11 0.1 171 0.1 1,408 0.1
Clinical, Health, Medical 68,441 6.6 14,170 6.1 15,614 6.5 2,693 9.0 650 5.9 12,409 7.0 113,977 6.6
Nutrition-related risk conditions 61,672 6.0 12,808 5.5 14,375 6.0 2,552 8.5 603 5.4 11,653 6.6 103,663 6.0
Substance abuse 29 0.0 6 0.0 7 0.0 1 0.0 0 0.0 53 0.0 96 0.0
Other health risks 7,417 0.7 1,474 0.6 1,355 0.6 166 0.6 49 0.4 797 0.5 11,259 0.7
Dietary 825,260 79.8 190,383 81.7 193,918 81.3 24,157 80.6 7,265 65.5 135,704 76.8 1,376,686 79.9
Failure to meet Dietary Guidelines for Americans
107,176 10.4 24,923 10.7 25,759 10.8 2,931 9.8 619 5.6 21,552 12.2 182,959 10.6
Inappropriate nutrition practices 749,634 72.5 172,678 74.1 175,705 73.6 22,347 74.5 6,959 62.7 123,224 69.7 1,250,546 72.6
Chapter Four: Nutritional Risk Characteristics 94
Exhibit 4.30 (continued) Number and Percent of One-Year-Old Child WIC Participants with Specific Nutritional Risks Reported at Certification by Percent of Poverty
Level of Poverty
Type of Risk and Specific Risk Up to 100% 101% to 130% 131% to 185% 186% and over Income Reported as Zeroa
Not Reportedb Total
Number Percent Number Percent Number Percent Number Percent Number Percent Number Percent Number Percent
Other risk 49,613 4.8% 9,220 4.0% 9,681 4.1% 1,717 5.7% 1,898 17.1% 21,721 12.3% 93,850 5.4%
Regression/Transfer/Presumptive eligibility
16,432 1.6 3,562 1.5 4,132 1.7 584 1.9 1,511 13.6 7,433 4.2 33,654 2.0
Breastfeeding mother and infant dyad
287 0.0 77 0.0 74 0.0 10 0.0 1 0.0 139 0.1 588 0.0
Infant of a WIC-eligible mother or mother at risk during pregnancy
9,216 0.9 2,009 0.9 2,312 1.0 443 1.5 118 1.1 3,709 2.1 17,808 1.0
Homelessness/Migrancy 3,612 0.3 542 0.2 336 0.1 65 0.2 94 0.8 574 0.3 5,223 0.3
Other nutritional risks 20,949 2.0 3,179 1.4 2,992 1.3 652 2.2 197 1.8 10,255 5.8 38,225 2.2
No risk reported 3,378 0.3 751 0.3 908 0.4 93 0.3 187 1.7 1,059 0.6 6,377 0.4
Notes
In 2008, State WIC agencies could report up to ten nutritional risks for each participant. This table examines all risks reported for every participant. When multiple risks within the same risk category are reported for one person, these risks are combined and counted one time in order to accurately calculate the number and percent of WIC participants with a specific type (or category) of risk.
a Zero incomes are reported separately and excluded from the poverty level calculations. In some reporting agencies, zero may be used to indicate missing information or adjunctive eligibility. PC2008 cannot distinguish between households with missing income information and households reporting zero income.
b Not reported includes the number and percent of participants for whom no data on income, income period, or size of economic unit are reported.
Chapter Four: Nutritional Risk Characteristics 95
Exhibit 4.31 Number and Percent of Two-Year-Old Child WIC Participants with Specific Nutritional Risks Reported at Certification by Percent of Poverty
Level of Poverty
Type of Risk and Specific Risk Up to 100% 101% to 130% 131% to 185% 186% and over Income Reported as Zeroa
Not Reportedb Total
Number Percent Number Percent Number Percent Number Percent Number Percent Number Percent Number Percent
Participants in category 737,877 167,413 168,017 18,003 7,040 109,251 1,207,602
Anthropometric 321,562 43.6% 69,256 41.4% 67,392 40.1% 7,335 40.7% 2,991 42.5% 47,459 43.4% 515,994 42.7%
Low weight for height 45,013 6.1 10,129 6.1 10,820 6.4 1,274 7.1 431 6.1 7,818 7.2 75,484 6.3
High weight for height 226,153 30.6 48,995 29.3 46,338 27.6 4,746 26.4 2,045 29.0 31,946 29.2 360,223 29.8
Short stature 64,002 8.7 12,865 7.7 12,727 7.6 1,576 8.8 574 8.2 9,009 8.2 100,753 8.3
Inappropriate growth or weight gain pattern
14,619 2.0 2,807 1.7 2,746 1.6 382 2.1 246 3.5 2,336 2.1 23,138 1.9
Low birthweight or premature birth 4,005 0.5 902 0.5 1,006 0.6 174 1.0 19 0.3 1,207 1.1 7,314 0.6
Other anthropometric risk 393 0.1 113 0.1 172 0.1 28 0.2 1 0.0 157 0.1 864 0.1
Biochemical 85,055 11.5 15,369 9.2 14,846 8.8 1,565 8.7 637 9.0 14,477 13.3 131,949 10.9
Hematocrit or hemoglobin below FNS criteria
84,154 11.4 15,220 9.1 14,720 8.8 1,546 8.6 635 9.0 14,304 13.1 130,579 10.8
Other biochemical test results which indicate nutritional abnormality
1,034 0.1 167 0.1 136 0.1 20 0.1 6 0.1 203 0.2 1,566 0.1
Clinical, Health, Medical 58,257 7.9 12,279 7.3 12,783 7.6 1,961 10.9 465 6.6 8,888 8.1 94,633 7.8
Nutrition-related risk conditions 42,272 5.7 8,962 5.4 9,949 5.9 1,686 9.4 335 4.8 7,161 6.6 70,365 5.8
Substance abuse 22 0.0 4 0.0 5 0.0 0 0.0 0 0.0 26 0.0 57 0.0
Other health risks 17,321 2.3 3,577 2.1 3,079 1.8 322 1.8 136 1.9 1,920 1.8 26,355 2.2
Dietary 558,773 75.7 131,185 78.4 131,744 78.4 14,145 78.6 4,214 59.9 82,580 75.6 922,640 76.4
Failure to meet Dietary Guidelines for Americans
182,537 24.7 44,838 26.8 46,246 27.5 4,599 25.5 1,586 22.5 22,260 20.4 302,067 25.0
Inappropriate nutrition practices 404,266 54.8 93,232 55.7 92,604 55.1 10,538 58.5 2,837 40.3 66,273 60.7 669,751 55.5
Chapter Four: Nutritional Risk Characteristics 96
Exhibit 4.31 (continued) Number and Percent of Two-Year-Old Child WIC Participants with Specific Nutritional Risks Reported at Certification by Percent of Poverty
Level of Poverty
Type of Risk and Specific Risk Up to 100% 101% to 130% 131% to 185% 186% and over Income Reported as Zeroa
Not Reportedb Total
Number Percent Number Percent Number Percent Number Percent Number Percent Number Percent Number Percent
Other risk 31,179 4.20% 5,518 3.30% 5,602 3.30% 863 4.80% 1,138 16.20% 12,329 11.30% 56,629 4.70%
Regression/Transfer/Presumptive eligibility
13,729 1.9 2,844 1.7 3,202 1.9 391 2.2 947 13.5 5,165 4.7 26,278 2.2
Breastfeeding mother and infant dyad
49 0.0 10 0.0 4 0.0 2 0.0 0 0.0 44 0.0 109 0.0
Infant of a WIC-eligible mother or mother at risk during pregnancy
191 0.0 46 0.0 51 0.0 3 0.0 1 0.0 228 0.2 520 0.0
Homelessness/Migrancy 2,710 0.4 368 0.2 243 0.1 35 0.2 72 1.0 351 0.3 3,779 0.3
Other nutritional risks 14,873 2.0 2,289 1.4 2,141 1.3 448 2.5 134 1.9 6,720 6.2 26,604 2.2
No risk reported 1,562 0.2 310 0.2 373 0.2 40 0.2 119 1.7 261 0.2 2,664 0.2
Notes
In 2008, State WIC agencies could report up to ten nutritional risks for each participant. This table examines all risks reported for every participant. When multiple risks within the same risk category are reported for one person, these risks are combined and counted one time in order to accurately calculate the number and percent of WIC participants with a specific risk or broad risk category. a Zero incomes are reported separately and excluded from the poverty level calculations. In some reporting agencies, zero may be used to indicate missing information or adjunctive eligibility. PC2008 cannot
distinguish between households with missing income information and households reporting zero income. b Not reported includes the number and percent of participants for whom no data on income, income period, or size of economic unit are reported.

Chapter Four: Nutritional Risk Characteristics 97
Exhibit 4.32 Number and Percent of Three-Year-Old Child WIC Participants with Specific Nutritional Risks Reported at Certification by Percent of Poverty
Level of Poverty
Type of Risk and Specific Risk Up to 100% 101% to 130% 131% to 185% 186% and over Income Reported as Zeroa
Not Reportedb Total
Number Percent Number Percent Number Percent Number Percent Number Percent Number Percent Number Percent
Participants in category 641,516 143,725 144,251 14,864 5,985 89,406 1,039,746
Anthropometric 295,831 46.1% 63,561 44.2% 62,680 43.5% 6,416 43.2% 2,710 45.3% 41,494 46.4% 472,692 45.5%
Low weight for height 37,873 5.9 8,305 5.8 9,111 6.3 954 6.4 410 6.9 6,613 7.4 63,266 6.1
High weight for height 218,759 34.1 47,496 33.0 45,686 31.7 4,502 30.3 1,960 32.8 29,606 33.1 348,009 33.5
Short stature 47,979 7.5 9,523 6.6 9,389 6.5 1,169 7.9 375 6.3 6,121 6.8 74,556 7.2
Inappropriate growth or weight gain pattern
16,613 2.6 3,223 2.2 3,301 2.3 404 2.7 261 4.4 2,504 2.8 26,307 2.5
Low birthweight or premature birth 1,116 0.2 202 0.1 276 0.2 35 0.2 4 0.1 511 0.6 2,144 0.2
Other anthropometric risk 285 0.0 92 0.1 115 0.1 15 0.1 0 0.0 129 0.1 636 0.1
Biochemical 54,425 8.5 10,033 7.0 9,518 6.6 968 6.5 411 6.9 8,733 9.8 84,087 8.1
Hematocrit or hemoglobin below FNS criteria
53,650 8.4 9,927 6.9 9,443 6.5 956 6.4 406 6.8 8,598 9.6 82,979 8.0
Other biochemical test results which indicate nutritional abnormality
858 0.1 113 0.1 82 0.1 12 0.1 5 0.1 150 0.2 1,220 0.1
Clinical, Health, Medical 60,300 9.4 12,656 8.8 12,953 9.0 1,888 12.7 473 7.9 8,510 9.5 96,779 9.3
Nutrition-related risk conditions 36,435 5.7 7,619 5.3 8,505 5.9 1,448 9.7 300 5.0 5,896 6.6 60,204 5.8
Substance abuse 26 0.0 5 0.0 6 0.0 0 0.0 0 0.0 27 0.0 64 0.0
Other health risks 25,768 4.0 5,383 3.7 4,806 3.3 495 3.3 178 3.0 2,857 3.2 39,488 3.8
Dietary 471,736 73.5 108,943 75.8 109,880 76.2 11,208 75.4 3,397 56.8 65,912 73.7 771,077 74.2
Failure to meet Dietary Guidelines for Americans
175,424 27.3 42,683 29.7 43,294 30.0 4,091 27.5 1,437 24.0 19,394 21.7 286,323 27.5
Inappropriate nutrition practices 315,824 49.2 71,184 49.5 71,749 49.7 7,821 52.6 2,087 34.9 50,806 56.8 519,471 50.0
Chapter Four: Nutritional Risk Characteristics 98
Exhibit 4.32 (continued) Number and Percent of Three-Year-Old Child WIC Participants with Specific Nutritional Risks Reported at Certification by Percent of Poverty
Level of Poverty
Type of Risk and Specific Risk Up to 100% 101% to 130% 131% to 185% 186% and over Income Reported as Zeroa
Not Reportedb Total
Number Percent Number Percent Number Percent Number Percent Number Percent Number Percent Number Percent
Other risk 27,590 4.3% 4,904 3.4% 4,915 3.4% 777 5.2% 955 16.0% 10,038 11.2% 49,180 4.7%
Regression/Transfer/Presumptive eligibility
12,531 2.0 2,601 1.8 2,838 2.0 350 2.4 804 13.4 4,238 4.7 23,362 2.2
Breastfeeding mother and infant dyad
52 0.0 8 0.0 13 0.0 2 0.0 0 0.0 51 0.1 126 0.0
Infant of a WIC-eligible mother or mother at risk during pregnancy
162 0.0 30 0.0 37 0.0 5 0.0 0 0.0 180 0.2 414 0.0
Homelessness/Migrancy 2,539 0.4 346 0.2 217 0.2 32 0.2 45 0.8 267 0.3 3,446 0.3
Other nutritional risks 12,585 2.0 1,955 1.4 1,838 1.3 400 2.7 117 2.0 5,419 6.1 22,314 2.1
No risk reported 1,407 0.2 263 0.2 301 0.2 35 0.2 98 1.6 191 0.2 2,296 0.2
Notes
In 2008, State WIC agencies could report up to ten nutritional risks for each participant. This table examines all risks reported for every participant. When multiple risks within the same risk category are reported for one person, these risks are combined and counted one time in order to accurately calculate the number and percent of WIC participants with a specific risk or broad risk category. a Zero incomes are reported separately and excluded from the poverty level calculations. In some reporting agencies, zero may be used to indicate missing information or adjunctive eligibility. PC2008 cannot
distinguish between households with missing income information and households reporting zero income. b Not reported includes the number and percent of participants for whom no data on income, income period, or size of economic unit are reported.
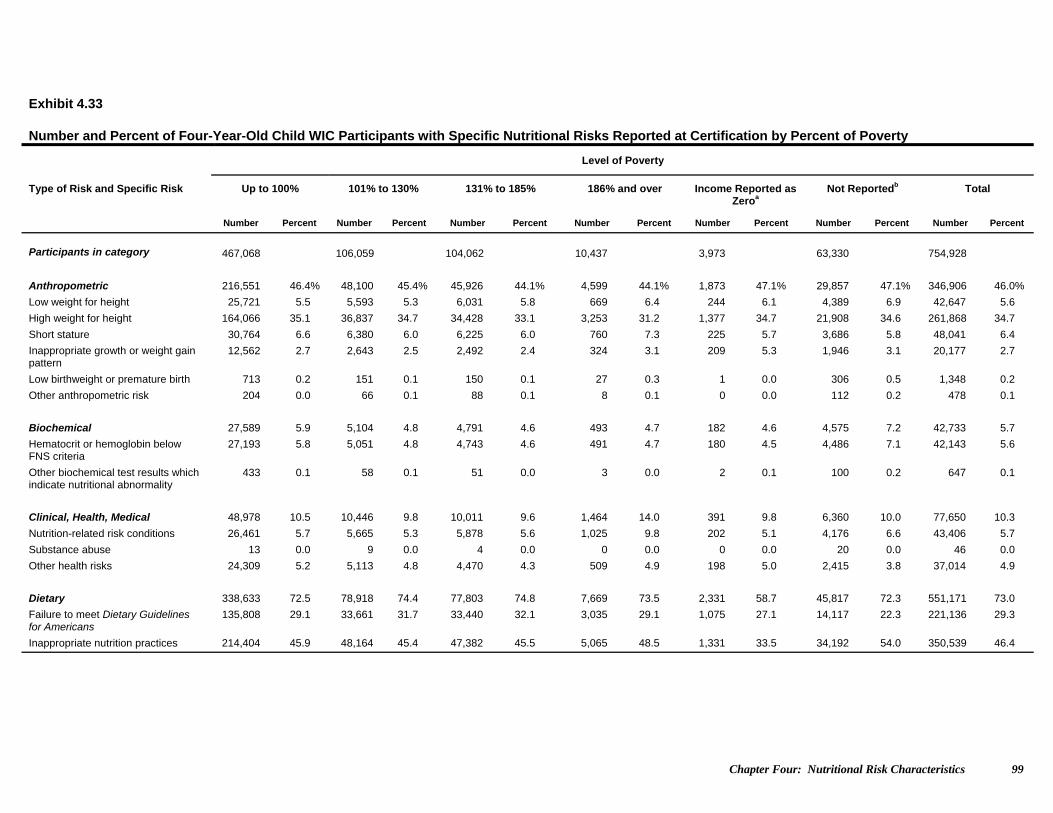
Chapter Four: Nutritional Risk Characteristics 99
Exhibit 4.33 Number and Percent of Four-Year-Old Child WIC Participants with Specific Nutritional Risks Reported at Certification by Percent of Poverty
Level of Poverty
Type of Risk and Specific Risk Up to 100% 101% to 130% 131% to 185% 186% and over Income Reported as Zeroa
Not Reportedb Total
Number Percent Number Percent Number Percent Number Percent Number Percent Number Percent Number Percent
Participants in category 467,068 106,059 104,062 10,437 3,973 63,330 754,928
Anthropometric 216,551 46.4% 48,100 45.4% 45,926 44.1% 4,599 44.1% 1,873 47.1% 29,857 47.1% 346,906 46.0%
Low weight for height 25,721 5.5 5,593 5.3 6,031 5.8 669 6.4 244 6.1 4,389 6.9 42,647 5.6
High weight for height 164,066 35.1 36,837 34.7 34,428 33.1 3,253 31.2 1,377 34.7 21,908 34.6 261,868 34.7
Short stature 30,764 6.6 6,380 6.0 6,225 6.0 760 7.3 225 5.7 3,686 5.8 48,041 6.4
Inappropriate growth or weight gain pattern
12,562 2.7 2,643 2.5 2,492 2.4 324 3.1 209 5.3 1,946 3.1 20,177 2.7
Low birthweight or premature birth 713 0.2 151 0.1 150 0.1 27 0.3 1 0.0 306 0.5 1,348 0.2
Other anthropometric risk 204 0.0 66 0.1 88 0.1 8 0.1 0 0.0 112 0.2 478 0.1
Biochemical 27,589 5.9 5,104 4.8 4,791 4.6 493 4.7 182 4.6 4,575 7.2 42,733 5.7
Hematocrit or hemoglobin below FNS criteria
27,193 5.8 5,051 4.8 4,743 4.6 491 4.7 180 4.5 4,486 7.1 42,143 5.6
Other biochemical test results which indicate nutritional abnormality
433 0.1 58 0.1 51 0.0 3 0.0 2 0.1 100 0.2 647 0.1
Clinical, Health, Medical 48,978 10.5 10,446 9.8 10,011 9.6 1,464 14.0 391 9.8 6,360 10.0 77,650 10.3
Nutrition-related risk conditions 26,461 5.7 5,665 5.3 5,878 5.6 1,025 9.8 202 5.1 4,176 6.6 43,406 5.7
Substance abuse 13 0.0 9 0.0 4 0.0 0 0.0 0 0.0 20 0.0 46 0.0
Other health risks 24,309 5.2 5,113 4.8 4,470 4.3 509 4.9 198 5.0 2,415 3.8 37,014 4.9
Dietary 338,633 72.5 78,918 74.4 77,803 74.8 7,669 73.5 2,331 58.7 45,817 72.3 551,171 73.0
Failure to meet Dietary Guidelines for Americans
135,808 29.1 33,661 31.7 33,440 32.1 3,035 29.1 1,075 27.1 14,117 22.3 221,136 29.3
Inappropriate nutrition practices 214,404 45.9 48,164 45.4 47,382 45.5 5,065 48.5 1,331 33.5 34,192 54.0 350,539 46.4

Chapter Four: Nutritional Risk Characteristics 100
Exhibit 4.33 (continued) Number and Percent of Four-Year-Old Child WIC Participants with Specific Nutritional Risks Reported at Certification by Percent of Poverty
Level of Poverty
Type of Risk and Specific Risk Up to 100% 101% to 130% 131% to 185% 186% and over Income Reported as Zeroa
Not Reportedb Total
Number Percent Number Percent Number Percent Number Percent Number Percent Number Percent Number Percent
Other risk 20,380 4.4% 3,716 3.5% 3,608 3.5% 539 5.2% 561 14.1% 7,339 11.6% 36,143 4.8%
Regression/Transfer/Presumptive eligibility
9,381 2.0 1,949 1.8 2,135 2.1 254 2.4 468 11.8 3,093 4.9 17,280 2.3
Breastfeeding mother and infant dyad
34 0.0 8 0.0 10 0.0 0 0.0 0 0.0 33 0.1 85 0.0
Infant of a WIC-eligible mother or mother at risk during pregnancy
140 0.0 22 0.0 29 0.0 4 0.0 0 0.0 118 0.2 313 0.0
Homelessness/Migrancy 1,746 0.4 226 0.2 132 0.1 22 0.2 27 0.7 180 0.3 2,333 0.3
Other nutritional risks 9,285 2.0 1,536 1.4 1,333 1.3 267 2.6 70 1.8 4,004 6.3 16,495 2.2
No risk reported 954 0.2 170 0.2 195 0.2 23 0.2 39 1.0 117 0.2 1,498 0.2
Notes
In 2008, State WIC agencies could report up to ten nutritional risks for each participant. This table examines all risks reported for every participant. When multiple risks within the same risk category are reported for one person, these risks are combined and counted one time in order to accurately calculate the number and percent of WIC participants with a specific risk or broad risk category. a Zero incomes are reported separately and excluded from the poverty level calculations. In some reporting agencies, zero may be used to indicate missing information or adjunctive eligibility. PC2008 cannot
distinguish between households with missing income information and households reporting zero income. b Not reported includes the number and percent of participants for whom no data on income, income period, or size of economic unit are reported.
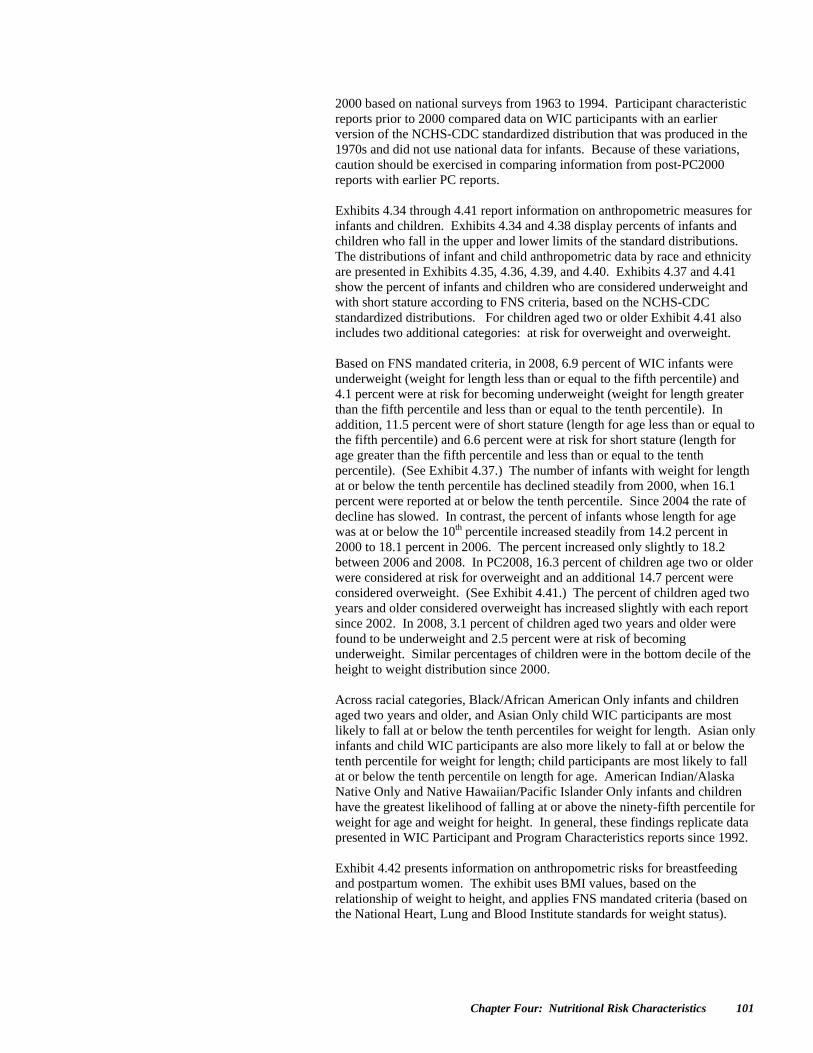
Chapter Four: Nutritional Risk Characteristics 101
2000 based on national surveys from 1963 to 1994. Participant characteristic reports prior to 2000 compared data on WIC participants with an earlier version of the NCHS-CDC standardized distribution that was produced in the 1970s and did not use national data for infants. Because of these variations, caution should be exercised in comparing information from post-PC2000 reports with earlier PC reports. Exhibits 4.34 through 4.41 report information on anthropometric measures for infants and children. Exhibits 4.34 and 4.38 display percents of infants and children who fall in the upper and lower limits of the standard distributions. The distributions of infant and child anthropometric data by race and ethnicity are presented in Exhibits 4.35, 4.36, 4.39, and 4.40. Exhibits 4.37 and 4.41 show the percent of infants and children who are considered underweight and with short stature according to FNS criteria, based on the NCHS-CDC standardized distributions. For children aged two or older Exhibit 4.41 also includes two additional categories: at risk for overweight and overweight.
Based on FNS mandated criteria, in 2008, 6.9 percent of WIC infants were underweight (weight for length less than or equal to the fifth percentile) and 4.1 percent were at risk for becoming underweight (weight for length greater than the fifth percentile and less than or equal to the tenth percentile). In addition, 11.5 percent were of short stature (length for age less than or equal to the fifth percentile) and 6.6 percent were at risk for short stature (length for age greater than the fifth percentile and less than or equal to the tenth percentile). (See Exhibit 4.37.) The number of infants with weight for length at or below the tenth percentile has declined steadily from 2000, when 16.1 percent were reported at or below the tenth percentile. Since 2004 the rate of decline has slowed. In contrast, the percent of infants whose length for age was at or below the 10th percentile increased steadily from 14.2 percent in 2000 to 18.1 percent in 2006. The percent increased only slightly to 18.2 between 2006 and 2008. In PC2008, 16.3 percent of children age two or older were considered at risk for overweight and an additional 14.7 percent were considered overweight. (See Exhibit 4.41.) The percent of children aged two years and older considered overweight has increased slightly with each report since 2002. In 2008, 3.1 percent of children aged two years and older were found to be underweight and 2.5 percent were at risk of becoming underweight. Similar percentages of children were in the bottom decile of the height to weight distribution since 2000.
Across racial categories, Black/African American Only infants and children aged two years and older, and Asian Only child WIC participants are most likely to fall at or below the tenth percentiles for weight for length. Asian only infants and child WIC participants are also more likely to fall at or below the tenth percentile for weight for length; child participants are most likely to fall at or below the tenth percentile on length for age. American Indian/Alaska Native Only and Native Hawaiian/Pacific Islander Only infants and children have the greatest likelihood of falling at or above the ninety-fifth percentile for weight for age and weight for height. In general, these findings replicate data presented in WIC Participant and Program Characteristics reports since 1992.
Exhibit 4.42 presents information on anthropometric risks for breastfeeding and postpartum women. The exhibit uses BMI values, based on the relationship of weight to height, and applies FNS mandated criteria (based on the National Heart, Lung and Blood Institute standards for weight status).
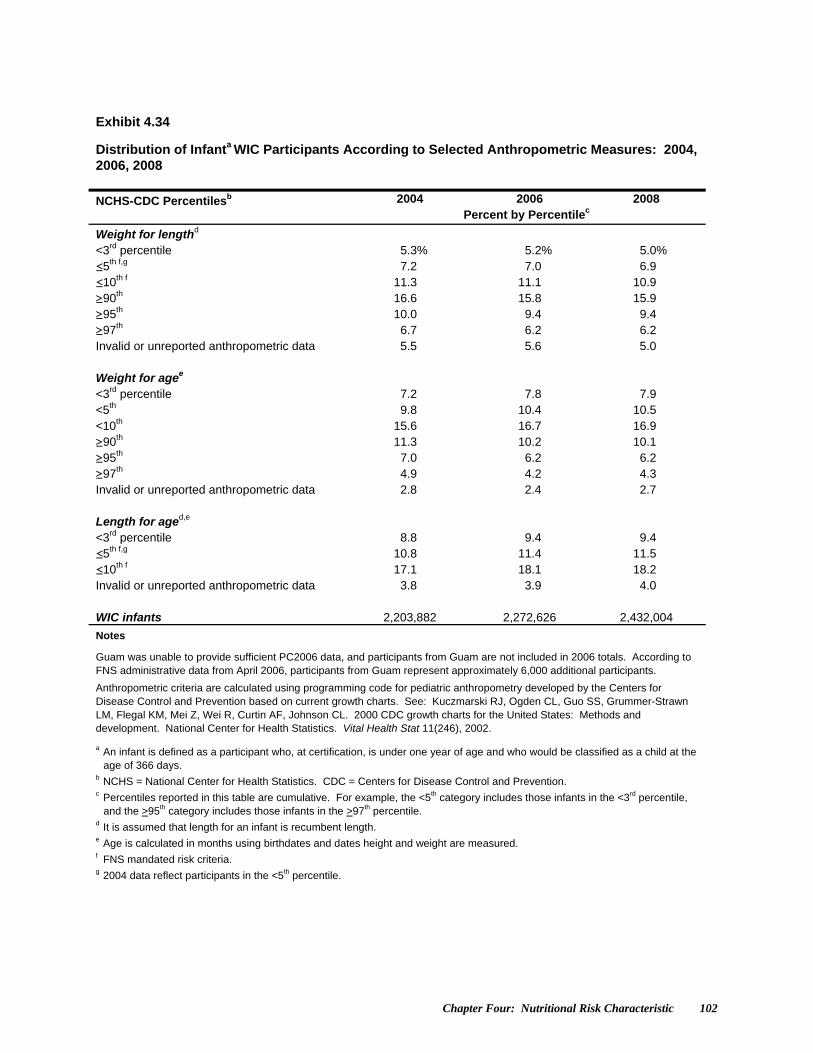
Chapter Four: Nutritional Risk Characteristic 102
Exhibit 4.34
Distribution of Infanta WIC Participants According to Selected Anthropometric Measures: 2004, 2006, 2008
NCHS-CDC Percentilesb 2004 2006 2008
Percent by Percentilec
Weight for lengthd
<3rd percentile 5.3% 5.2% 5.0% ≤5th f,g 7.2 7.0 6.9 ≤10th f 11.3 11.1 10.9 ≥90th 16.6 15.8 15.9 ≥95th 10.0 9.4 9.4 ≥97th 6.7 6.2 6.2 Invalid or unreported anthropometric data 5.5 5.6 5.0 Weight for agee <3rd percentile 7.2 7.8 7.9 <5th 9.8 10.4 10.5 <10th 15.6 16.7 16.9 ≥90th 11.3 10.2 10.1 ≥95th 7.0 6.2 6.2 ≥97th 4.9 4.2 4.3 Invalid or unreported anthropometric data 2.8 2.4 2.7 Length for aged,e <3rd percentile 8.8 9.4 9.4 ≤5th f,g 10.8 11.4 11.5 ≤10th f 17.1 18.1 18.2 Invalid or unreported anthropometric data 3.8 3.9 4.0 WIC infants 2,203,882 2,272,626 2,432,004
Notes
Guam was unable to provide sufficient PC2006 data, and participants from Guam are not included in 2006 totals. According to FNS administrative data from April 2006, participants from Guam represent approximately 6,000 additional participants.
Anthropometric criteria are calculated using programming code for pediatric anthropometry developed by the Centers for Disease Control and Prevention based on current growth charts. See: Kuczmarski RJ, Ogden CL, Guo SS, Grummer-Strawn LM, Flegal KM, Mei Z, Wei R, Curtin AF, Johnson CL. 2000 CDC growth charts for the United States: Methods and development. National Center for Health Statistics. Vital Health Stat 11(246), 2002. a An infant is defined as a participant who, at certification, is under one year of age and who would be classified as a child at the
age of 366 days. b NCHS = National Center for Health Statistics. CDC = Centers for Disease Control and Prevention. c Percentiles reported in this table are cumulative. For example, the <5th category includes those infants in the <3rd percentile,
and the >95th category includes those infants in the >97th percentile. d It is assumed that length for an infant is recumbent length. e Age is calculated in months using birthdates and dates height and weight are measured. f FNS mandated risk criteria. g 2004 data reflect participants in the <5th percentile.
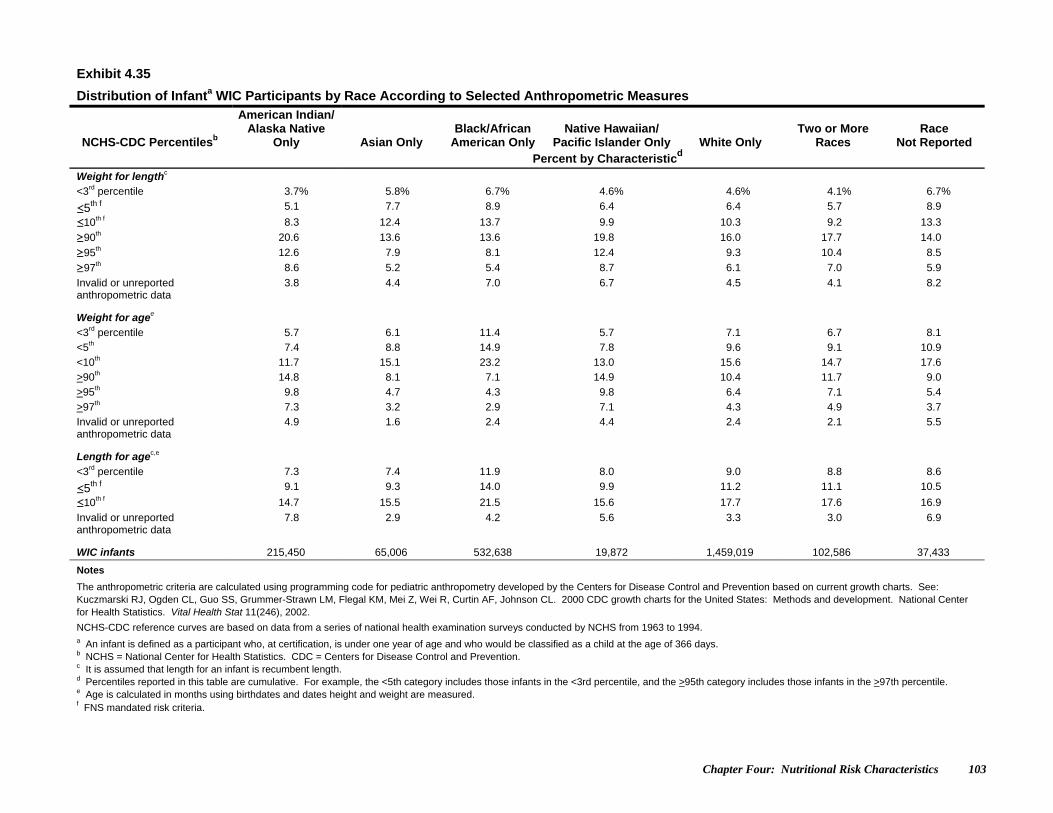
Chapter Four: Nutritional Risk Characteristics 103
Exhibit 4.35
Distribution of Infanta WIC Participants by Race According to Selected Anthropometric Measures
NCHS-CDC Percentilesb
American Indian/Alaska Native
Only Asian Only Black/African
American Only Native Hawaiian/
Pacific Islander Only White Only Two or More
Races Race
Not Reported Percent by Characteristicd
Weight for lengthc
<3rd percentile 3.7% 5.8% 6.7% 4.6% 4.6% 4.1% 6.7%
≤5th f 5.1 7.7 8.9 6.4 6.4 5.7 8.9
≤10th f 8.3 12.4 13.7 9.9 10.3 9.2 13.3
≥90th 20.6 13.6 13.6 19.8 16.0 17.7 14.0
≥95th 12.6 7.9 8.1 12.4 9.3 10.4 8.5
≥97th 8.6 5.2 5.4 8.7 6.1 7.0 5.9
Invalid or unreported anthropometric data
3.8 4.4 7.0 6.7 4.5 4.1 8.2
Weight for agee
<3rd percentile 5.7 6.1 11.4 5.7 7.1 6.7 8.1
<5th 7.4 8.8 14.9 7.8 9.6 9.1 10.9
<10th 11.7 15.1 23.2 13.0 15.6 14.7 17.6
>90th 14.8 8.1 7.1 14.9 10.4 11.7 9.0
>95th 9.8 4.7 4.3 9.8 6.4 7.1 5.4
>97th 7.3 3.2 2.9 7.1 4.3 4.9 3.7
Invalid or unreported anthropometric data
4.9 1.6 2.4 4.4 2.4 2.1 5.5
Length for agec,e
<3rd percentile 7.3 7.4 11.9 8.0 9.0 8.8 8.6
≤5th f 9.1 9.3 14.0 9.9 11.2 11.1 10.5
≤10th f 14.7 15.5 21.5 15.6 17.7 17.6 16.9
Invalid or unreported anthropometric data
7.8 2.9 4.2 5.6 3.3 3.0 6.9
WIC infants 215,450 65,006 532,638 19,872 1,459,019 102,586 37,433
Notes
The anthropometric criteria are calculated using programming code for pediatric anthropometry developed by the Centers for Disease Control and Prevention based on current growth charts. See: Kuczmarski RJ, Ogden CL, Guo SS, Grummer-Strawn LM, Flegal KM, Mei Z, Wei R, Curtin AF, Johnson CL. 2000 CDC growth charts for the United States: Methods and development. National Center for Health Statistics. Vital Health Stat 11(246), 2002.
NCHS-CDC reference curves are based on data from a series of national health examination surveys conducted by NCHS from 1963 to 1994. a An infant is defined as a participant who, at certification, is under one year of age and who would be classified as a child at the age of 366 days. b NCHS = National Center for Health Statistics. CDC = Centers for Disease Control and Prevention. c It is assumed that length for an infant is recumbent length. d Percentiles reported in this table are cumulative. For example, the <5th category includes those infants in the <3rd percentile, and the >95th category includes those infants in the >97th percentile. e Age is calculated in months using birthdates and dates height and weight are measured. f FNS mandated risk criteria.
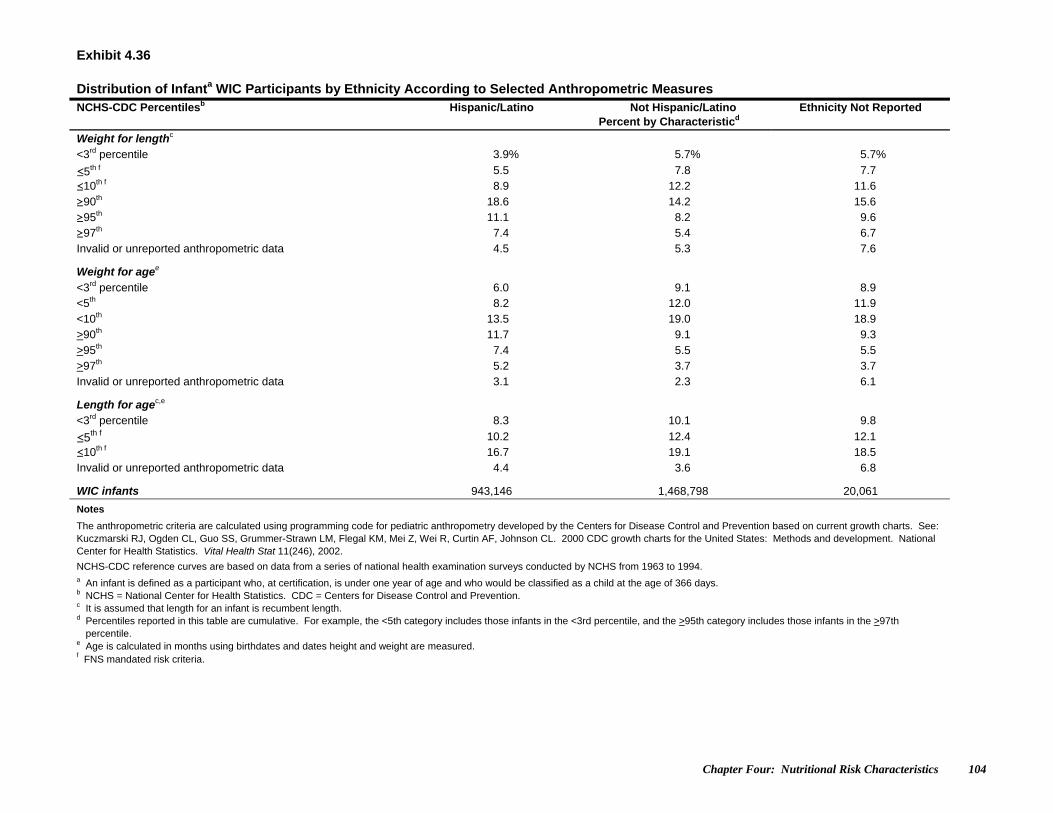
Chapter Four: Nutritional Risk Characteristics 104
Exhibit 4.36 Distribution of Infanta WIC Participants by Ethnicity According to Selected Anthropometric Measures NCHS-CDC Percentilesb Hispanic/Latino Not Hispanic/Latino Ethnicity Not Reported Percent by Characteristicd
Weight for lengthc <3rd percentile 3.9% 5.7% 5.7%
≤5th f 5.5 7.8 7.7 ≤10th f 8.9 12.2 11.6 ≥90th 18.6 14.2 15.6 ≥95th 11.1 8.2 9.6 ≥97th 7.4 5.4 6.7 Invalid or unreported anthropometric data 4.5 5.3 7.6
Weight for agee <3rd percentile 6.0 9.1 8.9 <5th 8.2 12.0 11.9 <10th 13.5 19.0 18.9 >90th 11.7 9.1 9.3 >95th 7.4 5.5 5.5 >97th 5.2 3.7 3.7 Invalid or unreported anthropometric data 3.1 2.3 6.1
Length for agec,e <3rd percentile 8.3 10.1 9.8
≤5th f 10.2 12.4 12.1 ≤10th f 16.7 19.1 18.5 Invalid or unreported anthropometric data 4.4 3.6 6.8
WIC infants 943,146 1,468,798 20,061
Notes
The anthropometric criteria are calculated using programming code for pediatric anthropometry developed by the Centers for Disease Control and Prevention based on current growth charts. See: Kuczmarski RJ, Ogden CL, Guo SS, Grummer-Strawn LM, Flegal KM, Mei Z, Wei R, Curtin AF, Johnson CL. 2000 CDC growth charts for the United States: Methods and development. National Center for Health Statistics. Vital Health Stat 11(246), 2002.
NCHS-CDC reference curves are based on data from a series of national health examination surveys conducted by NCHS from 1963 to 1994. a An infant is defined as a participant who, at certification, is under one year of age and who would be classified as a child at the age of 366 days. b NCHS = National Center for Health Statistics. CDC = Centers for Disease Control and Prevention. c It is assumed that length for an infant is recumbent length. d Percentiles reported in this table are cumulative. For example, the <5th category includes those infants in the <3rd percentile, and the >95th category includes those infants in the >97th
percentile. e Age is calculated in months using birthdates and dates height and weight are measured. f FNS mandated risk criteria.
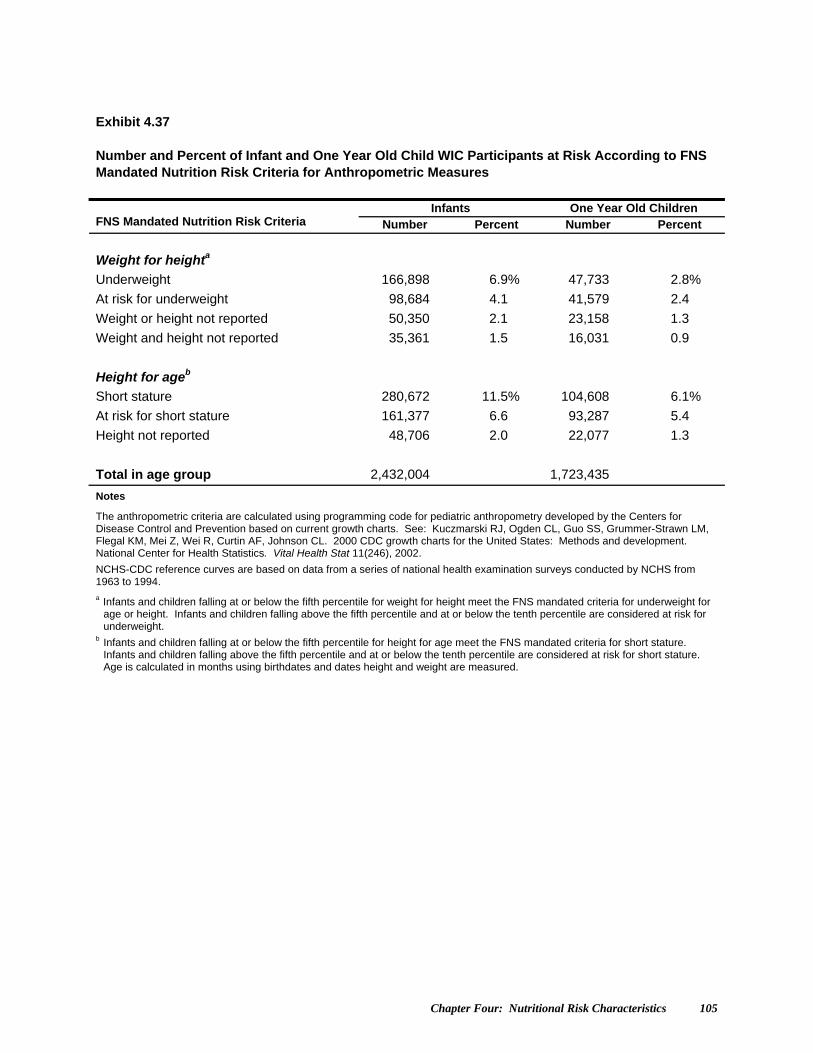
Chapter Four: Nutritional Risk Characteristics 105
Exhibit 4.37 Number and Percent of Infant and One Year Old Child WIC Participants at Risk According to FNS Mandated Nutrition Risk Criteria for Anthropometric Measures
Infants One Year Old Children FNS Mandated Nutrition Risk Criteria Number Percent Number Percent
Weight for heighta
Underweight 166,898 6.9% 47,733 2.8%
At risk for underweight 98,684 4.1 41,579 2.4
Weight or height not reported 50,350 2.1 23,158 1.3
Weight and height not reported 35,361 1.5 16,031 0.9
Height for ageb
Short stature 280,672 11.5% 104,608 6.1%
At risk for short stature 161,377 6.6 93,287 5.4
Height not reported 48,706 2.0 22,077 1.3
Total in age group 2,432,004 1,723,435
Notes
The anthropometric criteria are calculated using programming code for pediatric anthropometry developed by the Centers for Disease Control and Prevention based on current growth charts. See: Kuczmarski RJ, Ogden CL, Guo SS, Grummer-Strawn LM, Flegal KM, Mei Z, Wei R, Curtin AF, Johnson CL. 2000 CDC growth charts for the United States: Methods and development. National Center for Health Statistics. Vital Health Stat 11(246), 2002.
NCHS-CDC reference curves are based on data from a series of national health examination surveys conducted by NCHS from 1963 to 1994.
a Infants and children falling at or below the fifth percentile for weight for height meet the FNS mandated criteria for underweight for age or height. Infants and children falling above the fifth percentile and at or below the tenth percentile are considered at risk for underweight.
b Infants and children falling at or below the fifth percentile for height for age meet the FNS mandated criteria for short stature. Infants and children falling above the fifth percentile and at or below the tenth percentile are considered at risk for short stature. Age is calculated in months using birthdates and dates height and weight are measured.
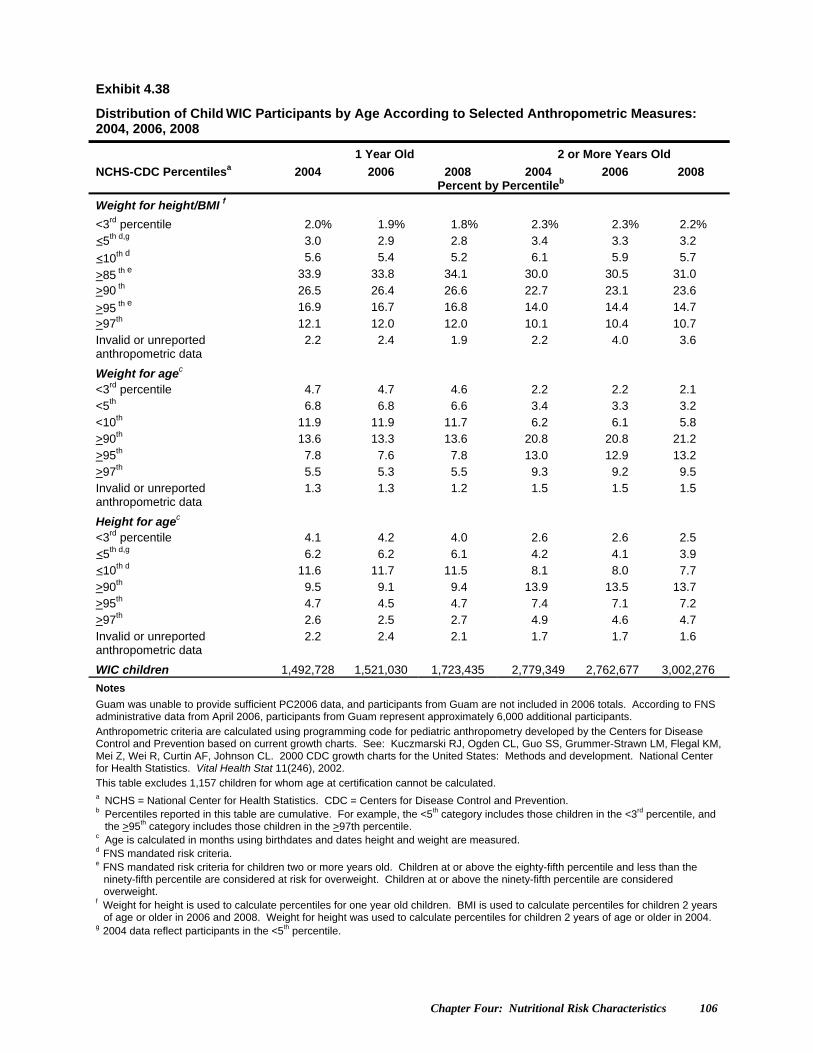
Chapter Four: Nutritional Risk Characteristics 106
Exhibit 4.38 Distribution of Child WIC Participants by Age According to Selected Anthropometric Measures: 2004, 2006, 2008
1 Year Old 2 or More Years Old
NCHS-CDC Percentilesa 2004 2006 2008 2004 2006 2008 Percent by Percentileb
Weight for height/BMI f <3rd percentile 2.0% 1.9% 1.8% 2.3% 2.3% 2.2% ≤5th d,g 3.0 2.9 2.8 3.4 3.3 3.2
≤10th d 5.6 5.4 5.2 6.1 5.9 5.7
>85 th e 33.9 33.8 34.1 30.0 30.5 31.0 >90 th 26.5 26.4 26.6 22.7 23.1 23.6
>95 th e 16.9 16.7 16.8 14.0 14.4 14.7 >97th 12.1 12.0 12.0 10.1 10.4 10.7 Invalid or unreported anthropometric data
2.2 2.4 1.9 2.2 4.0 3.6
Weight for agec
<3rd percentile 4.7 4.7 4.6 2.2 2.2 2.1 <5th 6.8 6.8 6.6 3.4 3.3 3.2 <10th 11.9 11.9 11.7 6.2 6.1 5.8 >90th 13.6 13.3 13.6 20.8 20.8 21.2 >95th 7.8 7.6 7.8 13.0 12.9 13.2 >97th 5.5 5.3 5.5 9.3 9.2 9.5 Invalid or unreported anthropometric data
1.3 1.3 1.2 1.5 1.5 1.5
Height for agec
<3rd percentile 4.1 4.2 4.0 2.6 2.6 2.5 ≤5th d,g 6.2 6.2 6.1 4.2 4.1 3.9 ≤10th d 11.6 11.7 11.5 8.1 8.0 7.7 >90th 9.5 9.1 9.4 13.9 13.5 13.7 >95th 4.7 4.5 4.7 7.4 7.1 7.2 >97th 2.6 2.5 2.7 4.9 4.6 4.7 Invalid or unreported anthropometric data
2.2 2.4 2.1 1.7 1.7 1.6
WIC children 1,492,728 1,521,030 1,723,435 2,779,349 2,762,677 3,002,276
Notes
Guam was unable to provide sufficient PC2006 data, and participants from Guam are not included in 2006 totals. According to FNS administrative data from April 2006, participants from Guam represent approximately 6,000 additional participants.
Anthropometric criteria are calculated using programming code for pediatric anthropometry developed by the Centers for Disease Control and Prevention based on current growth charts. See: Kuczmarski RJ, Ogden CL, Guo SS, Grummer-Strawn LM, Flegal KM, Mei Z, Wei R, Curtin AF, Johnson CL. 2000 CDC growth charts for the United States: Methods and development. National Center for Health Statistics. Vital Health Stat 11(246), 2002.
This table excludes 1,157 children for whom age at certification cannot be calculated. a NCHS = National Center for Health Statistics. CDC = Centers for Disease Control and Prevention. b Percentiles reported in this table are cumulative. For example, the <5th category includes those children in the <3rd percentile, and
the >95th category includes those children in the >97th percentile. c Age is calculated in months using birthdates and dates height and weight are measured. d FNS mandated risk criteria. e FNS mandated risk criteria for children two or more years old. Children at or above the eighty-fifth percentile and less than the
ninety-fifth percentile are considered at risk for overweight. Children at or above the ninety-fifth percentile are considered overweight.
f Weight for height is used to calculate percentiles for one year old children. BMI is used to calculate percentiles for children 2 years of age or older in 2006 and 2008. Weight for height was used to calculate percentiles for children 2 years of age or older in 2004.
g 2004 data reflect participants in the <5th percentile.
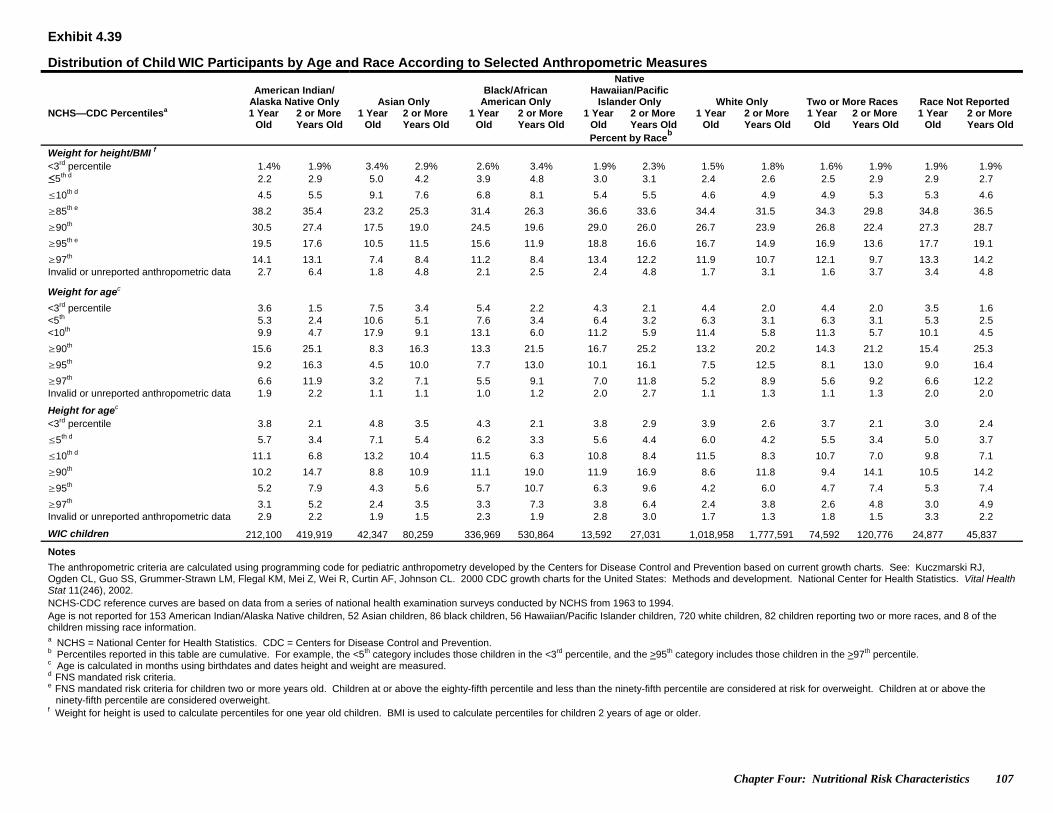
Chapter Four: Nutritional Risk Characteristics 107
Exhibit 4.39
Distribution of Child WIC Participants by Age and Race According to Selected Anthropometric Measures
American Indian/
Alaska Native Only Asian Only Black/African
American Only
Native Hawaiian/Pacific
Islander Only White Only Two or More Races Race Not Reported NCHS—CDC Percentilesa 1 Year
Old 2 or More Years Old
1 Year Old
2 or More Years Old
1 Year Old
2 or More Years Old
1 Year Old
2 or More Years Old
1 Year Old
2 or More Years Old
1 Year Old
2 or More Years Old
1 Year Old
2 or More Years Old
Percent by Raceb
Weight for height/BMI f <3rd percentile 1.4% 1.9% 3.4% 2.9% 2.6% 3.4% 1.9% 2.3% 1.5% 1.8% 1.6% 1.9% 1.9% 1.9% ≤5th d 2.2 2.9 5.0 4.2 3.9 4.8 3.0 3.1 2.4 2.6 2.5 2.9 2.9 2.7
≤10th d 4.5 5.5 9.1 7.6 6.8 8.1 5.4 5.5 4.6 4.9 4.9 5.3 5.3 4.6
≥85th e 38.2 35.4 23.2 25.3 31.4 26.3 36.6 33.6 34.4 31.5 34.3 29.8 34.8 36.5
≥90th 30.5 27.4 17.5 19.0 24.5 19.6 29.0 26.0 26.7 23.9 26.8 22.4 27.3 28.7
≥95th e 19.5 17.6 10.5 11.5 15.6 11.9 18.8 16.6 16.7 14.9 16.9 13.6 17.7 19.1
≥97th 14.1 13.1 7.4 8.4 11.2 8.4 13.4 12.2 11.9 10.7 12.1 9.7 13.3 14.2 Invalid or unreported anthropometric data 2.7 6.4 1.8 4.8 2.1 2.5 2.4 4.8 1.7 3.1 1.6 3.7 3.4 4.8
Weight for agec <3rd percentile 3.6 1.5 7.5 3.4 5.4 2.2 4.3 2.1 4.4 2.0 4.4 2.0 3.5 1.6 <5th 5.3 2.4 10.6 5.1 7.6 3.4 6.4 3.2 6.3 3.1 6.3 3.1 5.3 2.5 <10th 9.9 4.7 17.9 9.1 13.1 6.0 11.2 5.9 11.4 5.8 11.3 5.7 10.1 4.5
≥90th 15.6 25.1 8.3 16.3 13.3 21.5 16.7 25.2 13.2 20.2 14.3 21.2 15.4 25.3
≥95th 9.2 16.3 4.5 10.0 7.7 13.0 10.1 16.1 7.5 12.5 8.1 13.0 9.0 16.4
≥97th 6.6 11.9 3.2 7.1 5.5 9.1 7.0 11.8 5.2 8.9 5.6 9.2 6.6 12.2 Invalid or unreported anthropometric data 1.9 2.2 1.1 1.1 1.0 1.2 2.0 2.7 1.1 1.3 1.1 1.3 2.0 2.0
Height for agec <3rd percentile 3.8 2.1 4.8 3.5 4.3 2.1 3.8 2.9 3.9 2.6 3.7 2.1 3.0 2.4
≤5th d 5.7 3.4 7.1 5.4 6.2 3.3 5.6 4.4 6.0 4.2 5.5 3.4 5.0 3.7
≤10th d 11.1 6.8 13.2 10.4 11.5 6.3 10.8 8.4 11.5 8.3 10.7 7.0 9.8 7.1
≥90th 10.2 14.7 8.8 10.9 11.1 19.0 11.9 16.9 8.6 11.8 9.4 14.1 10.5 14.2
≥95th 5.2 7.9 4.3 5.6 5.7 10.7 6.3 9.6 4.2 6.0 4.7 7.4 5.3 7.4
≥97th 3.1 5.2 2.4 3.5 3.3 7.3 3.8 6.4 2.4 3.8 2.6 4.8 3.0 4.9 Invalid or unreported anthropometric data 2.9 2.2 1.9 1.5 2.3 1.9 2.8 3.0 1.7 1.3 1.8 1.5 3.3 2.2
WIC children 212,100 419,919 42,347 80,259 336,969 530,864 13,592 27,031 1,018,958 1,777,591 74,592 120,776 24,877 45,837
Notes
The anthropometric criteria are calculated using programming code for pediatric anthropometry developed by the Centers for Disease Control and Prevention based on current growth charts. See: Kuczmarski RJ, Ogden CL, Guo SS, Grummer-Strawn LM, Flegal KM, Mei Z, Wei R, Curtin AF, Johnson CL. 2000 CDC growth charts for the United States: Methods and development. National Center for Health Statistics. Vital Health Stat 11(246), 2002. NCHS-CDC reference curves are based on data from a series of national health examination surveys conducted by NCHS from 1963 to 1994. Age is not reported for 153 American Indian/Alaska Native children, 52 Asian children, 86 black children, 56 Hawaiian/Pacific Islander children, 720 white children, 82 children reporting two or more races, and 8 of the children missing race information. a NCHS = National Center for Health Statistics. CDC = Centers for Disease Control and Prevention. b Percentiles reported in this table are cumulative. For example, the <5th category includes those children in the <3rd percentile, and the >95th category includes those children in the >97th percentile. c Age is calculated in months using birthdates and dates height and weight are measured. d FNS mandated risk criteria. e FNS mandated risk criteria for children two or more years old. Children at or above the eighty-fifth percentile and less than the ninety-fifth percentile are considered at risk for overweight. Children at or above the
ninety-fifth percentile are considered overweight. f Weight for height is used to calculate percentiles for one year old children. BMI is used to calculate percentiles for children 2 years of age or older.
Chapter Four: Nutritional Risk Characteristics 108
Exhibit 4.40 Distribution of Child WIC Participants by Age and Ethnicity According to Selected Anthropometric Measures Hispanic/Latino Not Hispanic/Latino Ethnicity Not Reported NCHS—CDC Percentilesa
1 Year Old 2 or More Years Old 1 Year Old
2 or More Years Old 1 Year Old
2 or More Years Old
Percent by Ethnicityb
Weight for height/BMI f <3rd percentile 1.3% 1.6% 2.2% 2.6% 2.4% 2.1%
≤5th d 2.0 2.4 3.3 3.8 3.6 2.9
≤10th d 4.0 4.5 6.0 6.7 6.4 5.0
≥85th e 37.5 34.9 31.4 27.5 32.3 37.0
≥90th 29.6 27.0 24.2 20.4 25.2 29.2
≥95th e 18.9 17.4 15.1 12.2 16.4 19.4
≥97th 13.6 12.9 10.7 8.6 12.1 14.5 Invalid or unreported anthropometric data 2.2 4.7 1.7 2.5 2.8 3.1
Weight for age c <3rd percentile 3.6 1.6 5.3 2.4 4.2 1.8 <5th 5.3 2.6 7.5 3.6 6.2 2.6 <10th 10.0 4.9 12.9 6.5 11.5 4.7
≥90th 14.9 23.3 12.5 19.3 13.9 24.0
≥95th 8.7 15.0 7.0 11.5 8.1 15.5
≥97th 6.2 11.0 4.9 8.0 5.9 11.4 Invalid or unreported anthropometric data 1.5 1.8 0.9 1.1 2.1 1.8
Height for age c <3rd percentile 3.7 2.3 4.2 2.5 3.4 2.8
≤5th d 5.7 3.8 6.3 4.0 5.5 4.2
≤10th d 11.2 7.6 11.6 7.7 10.9 7.8
≥90th 9.2 12.8 9.5 14.4 9.9 13.1
≥95th 4.7 6.6 4.7 7.7 5.1 6.7
≥97th 2.7 4.3 2.7 5.0 2.8 4.3 Invalid or unreported anthropometric data 2.2 1.8 1.8 1.4 2.6 1.8
WIC children 731,305 1,393,398 979,188 1,585,879 12,942 23,000
Notes
The anthropometric criteria are calculated using programming code for pediatric anthropometry developed by the Centers for Disease Control and Prevention based on current growth charts. See: Kuczmarski RJ, Ogden CL, Guo SS, Grummer-Strawn LM, Flegal KM, Mei Z, Wei R, Curtin AF, Johnson CL. 2000 CDC growth charts for the United States: Methods and development. National Center for Health Statistics. Vital Health Stat 11(246), 2002.
NCHS-CDC reference curves are based on data from a series of national health examination surveys conducted by NCHS from 1963 to 1994.
Age is not reported for 263 Hispanic children, 889 non-Hispanic children, and 5 of the children missing ethnicity information. a NCHS = National Center for Health Statistics. CDC = Centers for Disease Control and Prevention. b Percentiles reported in this table are cumulative. For example, the <5th category includes those children in the <3rd percentile, and the >95th category includes those children in the >97th
percentile. c Age is calculated in months using birthdates and dates height and weight are measured. d FNS mandated risk criteria. e FNS mandated risk criteria for children two or more years old. Children at or above the eighty-fifth percentile and less than the ninety-fifth percentile are considered at risk for overweight.
Children at or above the ninety-fifth percentile are considered overweight. f Weight for height is used to calculate percentiles for one year old children. BMI is used to calculate percentiles for children 2 years of age or older.
Chapter Four: Nutritional Risk Characteristics 109
Exhibit 4.41 Number and Percent of Child WIC Participants Age 2 or More at Risk According to FNS-Mandated Nutrition Risk Criteria for Anthropometric Measures
2 Years 3 Years 4 Years Total Children Age 2 or More
Number Percent Number Percent Number Percent Number Percent
FNS Mandated Nutrition Risk Criteria BMIa Underweight 38,991 3.2% 33,202 3.2% 22,376 3.0% 94,569 3.1% At risk for underweight 32,279 2.7 26,463 2.5 17,515 2.3 76,257 2.5 At risk for overweight 187,381 15.5 174,150 16.7 128,376 17.0 489,906 16.3 Overweight 156,378 12.9 161,781 15.6 123,363 16.3 441,522 14.7 Weight or height not reported 13,469 1.1 9,682 0.9 6,846 0.9 29,998 1.0 Weight and height not reported 10,425 0.9 7,534 0.7 5,309 0.7 23,268 0.8 Height for ageb Short stature 51,909 4.3% 40,230 3.9% 26,044 3.4% 118,182 3.9% At risk for short stature 51,552 4.3 37,430 3.6 24,932 3.3 113,913 3.8 Height not reported 12,756 1.1 9,033 0.9 6,272 0.8 28,061 0.9 Children in age group 1,207,602 1,039,746 754,928 3,002,276
Notes
The anthropometric criteria are calculated using programming code for pediatric anthropometry developed by the Centers for Disease Control and Prevention based on current growth charts. See: Kuczmarski RJ, Ogden CL, Guo SS, Grummer-Strawn LM, Flegal KM, Mei Z, Wei R, Curtin AF, Johnson CL. 2000 CDC growth charts for the United States: Methods and development. National Center for Health Statistics. Vital Health Stat 11(246), 2002.
NCHS-CDC reference curves are based on data from a series of national health examination surveys conducted by NCHS from 1963 to 1994.
This table excludes 1,157 children for whom age at certification can not be calculated.
a Children falling at or below the fifth percentile for BMI meet the FNS mandated criteria for underweight for height. Children falling above the fifth percentile and at or below the tenth percentile are considered at risk for underweight. Children at or above the eighty-fifth percentile and less than the ninety-fifth percentile are considered at risk for overweight. Children at or above the ninety-fifth percentile are considered overweight.
b Children falling at or below the fifth percentile for height for age meet the FNS mandated criteria for short stature. Children falling above the fifth percentile and at or below the tenth percentile are considered at risk for short stature. Age is calculated in months using birthdates and dates height and weight are measured.
Chapter Four: Nutritional Risk Characteristics 110
Exhibit 4.42 Number and Percent of Breastfeeding and Postpartum Women WIC Participants at Risk According to FNS-Mandated Nutrition Risk Criteria for Anthropometric Measures
Breastfeeding Women Postpartum Women
Number Percent Number Percent
FNS Mandated Nutrition Risk Criteria
Current weight for height
Underweight a 4,867 0.7% 7,494 1.1%
Overweight a 458,449 69.9 492,844 69.7
Weight not reported 11,296 1.7 13,769 1.9
Height not reported 8,068 1.2 10,424 1.5
Weight or height not reported 12,912 2.0 15,194 2.1
Weight and height not reported 6,452 1.0 8,999 1.3
Women in category 656,134 707,507
Notes a Underweight is defined as Body Mass Index (BMI) less than 18.5. Overweight is defined as BMI greater than or equal to 25.0. Prior to PC2004, reports defined underweight as BMI less than 19.8, and overweight as BMI greater than or equal to 26.1.
Chapter Four: Nutritional Risk Characteristics 111
BMI values for women less than 18.5 are considered underweight and values greater than or equal to 25.0 are considered overweight. Using these BMI cutoffs, nearly 70 percent of these participant groups are overweight. Just about 1 percent of women in both categories are considered underweight. Prior to 2004, participant characteristic reports defined underweight as BMI less than 19.8 and overweight as BMI greater than or equal to 26.1. Application of these more stringent measures suggests that comparisons of PC2008 with earlier reports, other than PC2004 and PC2006, should be made with caution.
It is interesting to compare this information with the State-specific nutritional risks reported in Exhibit 4.6 where not quite half of breastfeeding and postpartum women (50.7 percent and 49.0 percent, respectively) are reported as having high weight for height. These differences between the incidence of high weight for height in the anthropometric risks and the reported nutritional risks might be attributed to two factors. First, and more importantly, some participants may be overweight according to FNS mandated criteria, and the risk may not be recorded. Other risks may have been considered more important or urgent. Second, while most States use the FNS overweight definition, some States may have chosen to use higher percentile cutoffs than mandated by FNS, which would lead to fewer participants classified as overweight in Exhibit 4.6 compared with Exhibit 4.42. Reported nutritional risks are based on State-specific criteria defining overweight while the anthropometric data use the national standard. State-specific variations in overweight criteria coupled with State differences in the WIC population can lead to differences in the incidence of high weight for height between the two measures.
Blood Measures Beginning in April 1999, FNS established national standards for determining
nutritional risk using hemoglobin and hematocrit measures based on recommendations from the Centers for Disease Control and Prevention (CDC). Exhibit 4.43 reports the FNS mandated criteria for different categories of WIC participants. Because prior to 2000, States could set their own criteria for hemoglobin and hematocrit and because CDC cutoffs changed slightly between PC98 and PC2000, comparisons of data from PC2000 and later years with prior participant characteristic reports should be made with caution.
As part of the minimum data set for PC2008, States reported hemoglobin and hematocrit values for women, children, and infants over nine months of age. Blood measures were reported for 62.1 percent of all participants. (See Exhibit 4.44.) Most of the missing values are for infants who are not required to be tested unless they are over nine months of age when they are certified for WIC benefits. In addition, Federal regulations allow for children two through four years of age who had normal results at previous certification appointments to be tested annually. In these cases, State information systems may report blood measures as missing. Unreported blood measures for women reflect, in part, WIC policy that allows participants to have blood tests completed within 90 days of certification.
Exhibits 4.45 and 4.46 provide information on numbers and proportions of WIC enrollees falling below the FNS mandated hematologic standards for anemia. Anemia rates for postpartum women are consistently high (36.9 percent), as they have been since 1992. Nearly one-quarter (23.4 percent) of all WIC women are anemic. For children, anemia rates decrease with age from 15.0 percent among one-year-old children to 5.9 percent among four year
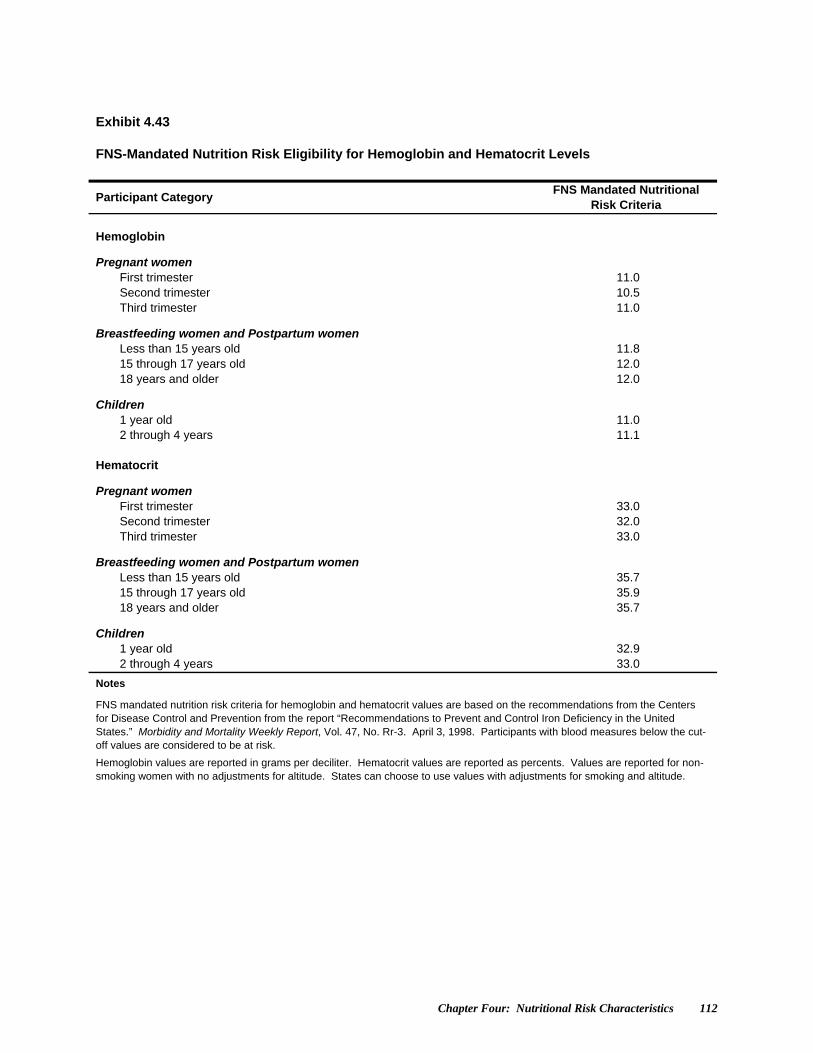
Chapter Four: Nutritional Risk Characteristics 112
Exhibit 4.43 FNS-Mandated Nutrition Risk Eligibility for Hemoglobin and Hematocrit Levels
Participant Category FNS Mandated Nutritional
Risk Criteria Hemoglobin
Pregnant women First trimester 11.0 Second trimester 10.5 Third trimester 11.0
Breastfeeding women and Postpartum women Less than 15 years old 11.8 15 through 17 years old 12.0 18 years and older 12.0
Children 1 year old 11.0 2 through 4 years 11.1 Hematocrit
Pregnant women First trimester 33.0 Second trimester 32.0 Third trimester 33.0
Breastfeeding women and Postpartum women Less than 15 years old 35.7 15 through 17 years old 35.9 18 years and older 35.7
Children 1 year old 32.9 2 through 4 years 33.0
Notes
FNS mandated nutrition risk criteria for hemoglobin and hematocrit values are based on the recommendations from the Centers for Disease Control and Prevention from the report “Recommendations to Prevent and Control Iron Deficiency in the United States.” Morbidity and Mortality Weekly Report, Vol. 47, No. Rr-3. April 3, 1998. Participants with blood measures below the cut-off values are considered to be at risk.
Hemoglobin values are reported in grams per deciliter. Hematocrit values are reported as percents. Values are reported for non-smoking women with no adjustments for altitude. States can choose to use values with adjustments for smoking and altitude.
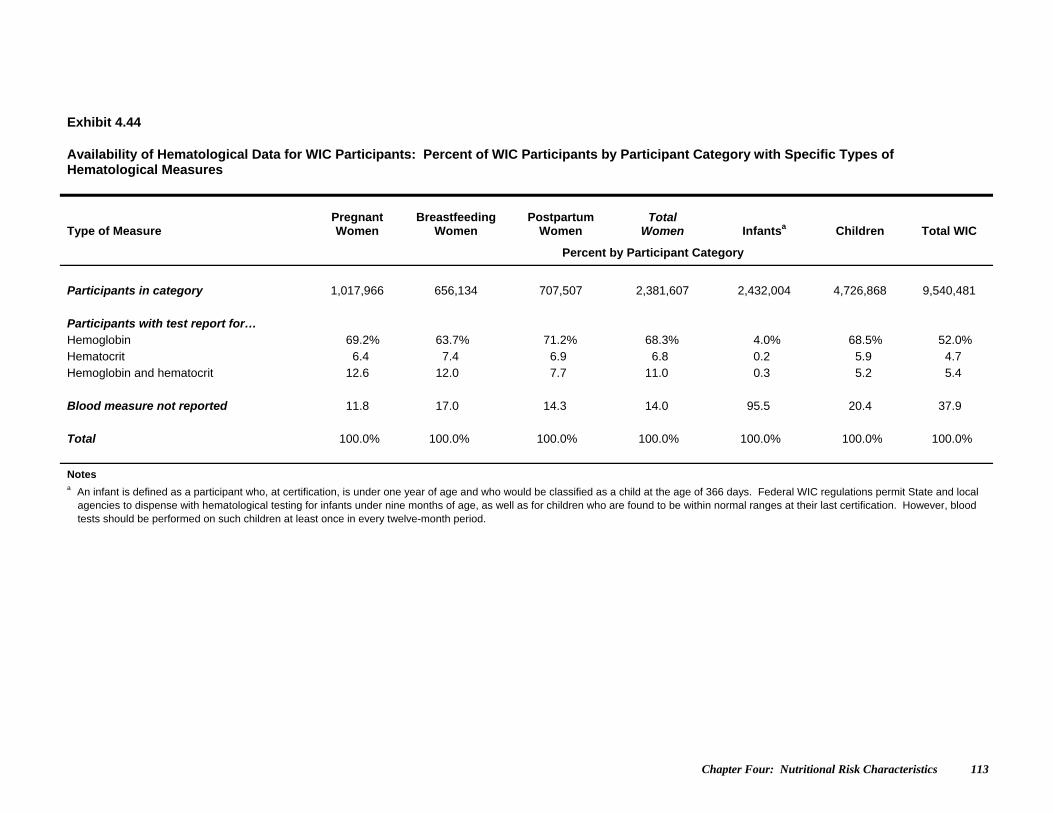
Chapter Four: Nutritional Risk Characteristics 113
Exhibit 4.44 Availability of Hematological Data for WIC Participants: Percent of WIC Participants by Participant Category with Specific Types of Hematological Measures
Type of Measure Pregnant Women
Breastfeeding Women
Postpartum Women
Total Women Infantsa Children Total WIC
Percent by Participant Category
Participants in category 1,017,966 656,134 707,507 2,381,607 2,432,004 4,726,868 9,540,481 Participants with test report for… Hemoglobin 69.2% 63.7% 71.2% 68.3% 4.0% 68.5% 52.0% Hematocrit 6.4 7.4 6.9 6.8 0.2 5.9 4.7 Hemoglobin and hematocrit 12.6 12.0 7.7 11.0 0.3 5.2 5.4 Blood measure not reported 11.8 17.0 14.3 14.0 95.5 20.4 37.9 Total 100.0% 100.0% 100.0% 100.0% 100.0% 100.0% 100.0%
Notes a An infant is defined as a participant who, at certification, is under one year of age and who would be classified as a child at the age of 366 days. Federal WIC regulations permit State and local
agencies to dispense with hematological testing for infants under nine months of age, as well as for children who are found to be within normal ranges at their last certification. However, blood tests should be performed on such children at least once in every twelve-month period.
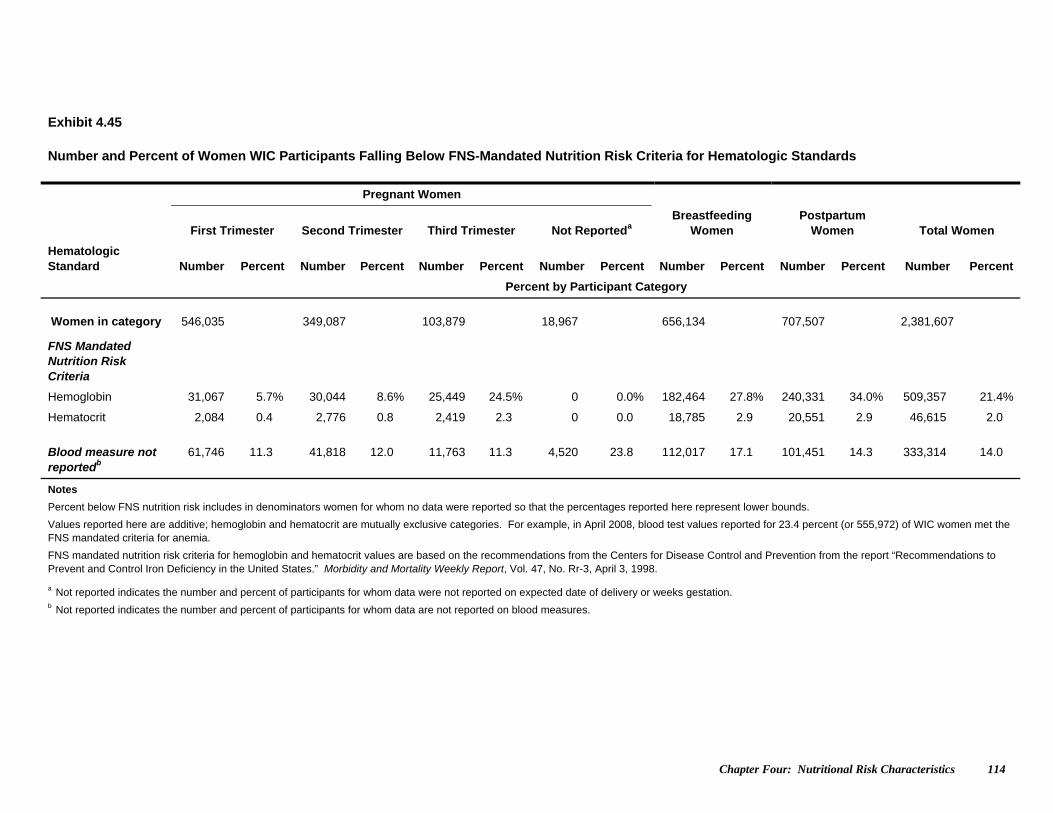
Chapter Four: Nutritional Risk Characteristics 114
Exhibit 4.45 Number and Percent of Women WIC Participants Falling Below FNS-Mandated Nutrition Risk Criteria for Hematologic Standards
Pregnant Women
First Trimester Second Trimester Third Trimester Not Reporteda Breastfeeding
Women Postpartum
Women Total Women
Hematologic Standard Number Percent Number Percent Number Percent Number Percent Number Percent Number Percent Number Percent
Percent by Participant Category
Women in category 546,035 349,087 103,879 18,967 656,134 707,507 2,381,607
FNS Mandated Nutrition Risk Criteria
Hemoglobin 31,067 5.7% 30,044 8.6% 25,449 24.5% 0 0.0% 182,464 27.8% 240,331 34.0% 509,357 21.4%
Hematocrit 2,084 0.4 2,776 0.8 2,419 2.3 0 0.0 18,785 2.9 20,551 2.9 46,615 2.0
Blood measure not reportedb
61,746 11.3 41,818 12.0 11,763 11.3 4,520 23.8 112,017 17.1 101,451 14.3 333,314 14.0
Notes
Percent below FNS nutrition risk includes in denominators women for whom no data were reported so that the percentages reported here represent lower bounds.
Values reported here are additive; hemoglobin and hematocrit are mutually exclusive categories. For example, in April 2008, blood test values reported for 23.4 percent (or 555,972) of WIC women met the FNS mandated criteria for anemia.
FNS mandated nutrition risk criteria for hemoglobin and hematocrit values are based on the recommendations from the Centers for Disease Control and Prevention from the report “Recommendations to Prevent and Control Iron Deficiency in the United States.” Morbidity and Mortality Weekly Report, Vol. 47, No. Rr-3, April 3, 1998. a Not reported indicates the number and percent of participants for whom data were not reported on expected date of delivery or weeks gestation. b Not reported indicates the number and percent of participants for whom data are not reported on blood measures.
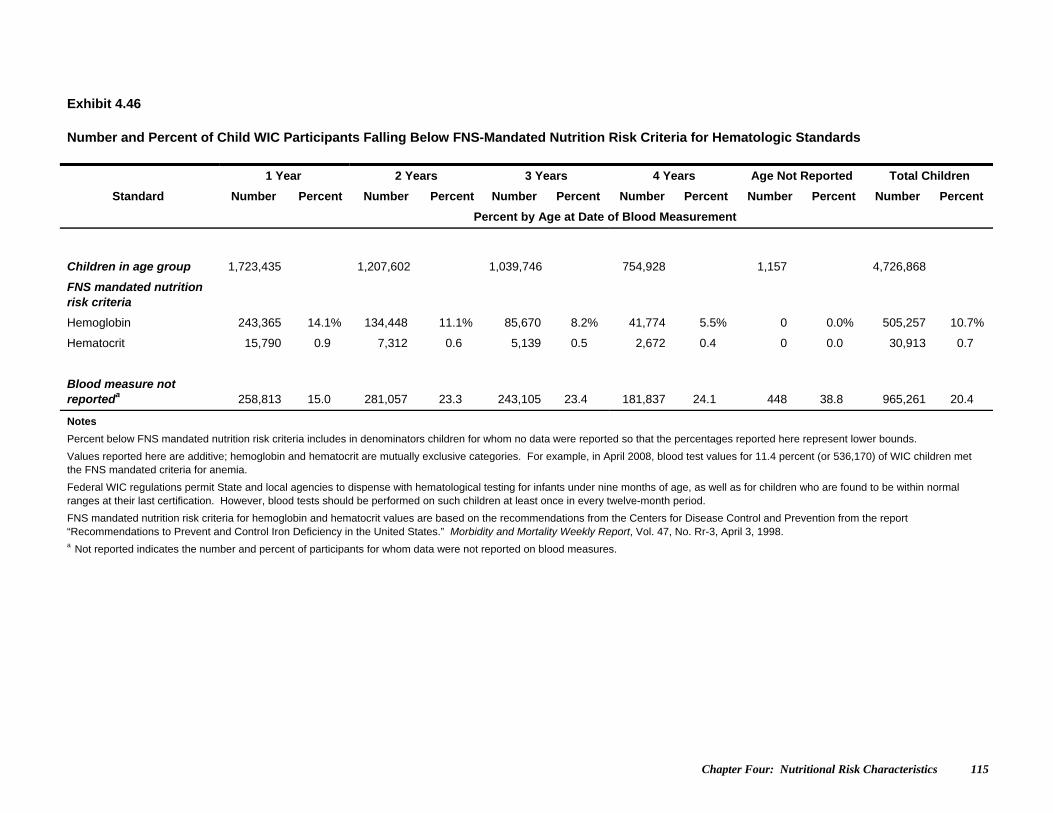
Chapter Four: Nutritional Risk Characteristics 115
Exhibit 4.46 Number and Percent of Child WIC Participants Falling Below FNS-Mandated Nutrition Risk Criteria for Hematologic Standards
1 Year 2 Years 3 Years 4 Years Age Not Reported Total Children
Standard Number Percent Number Percent Number Percent Number Percent Number Percent Number Percent
Percent by Age at Date of Blood Measurement
Children in age group 1,723,435 1,207,602 1,039,746 754,928 1,157 4,726,868
FNS mandated nutrition risk criteria
Hemoglobin 243,365 14.1% 134,448 11.1% 85,670 8.2% 41,774 5.5% 0 0.0% 505,257 10.7%
Hematocrit 15,790 0.9 7,312 0.6 5,139 0.5 2,672 0.4 0 0.0 30,913 0.7
Blood measure not reporteda 258,813 15.0 281,057 23.3 243,105 23.4 181,837 24.1 448 38.8 965,261 20.4
Notes
Percent below FNS mandated nutrition risk criteria includes in denominators children for whom no data were reported so that the percentages reported here represent lower bounds.
Values reported here are additive; hemoglobin and hematocrit are mutually exclusive categories. For example, in April 2008, blood test values for 11.4 percent (or 536,170) of WIC children met the FNS mandated criteria for anemia.
Federal WIC regulations permit State and local agencies to dispense with hematological testing for infants under nine months of age, as well as for children who are found to be within normal ranges at their last certification. However, blood tests should be performed on such children at least once in every twelve-month period.
FNS mandated nutrition risk criteria for hemoglobin and hematocrit values are based on the recommendations from the Centers for Disease Control and Prevention from the report “Recommendations to Prevent and Control Iron Deficiency in the United States.” Morbidity and Mortality Weekly Report, Vol. 47, No. Rr-3, April 3, 1998. a Not reported indicates the number and percent of participants for whom data were not reported on blood measures.
Chapter Four: Nutritional Risk Characteristics 116
olds. Note that, in computing table entries for both women and children, percents below FNS standards were calculated by excluding women and children for whom data were not reported from numerators but including them in denominators. While percentages reported here must be treated as representative of lower bound estimates of the prevalence of anemia in the WIC population, these estimates may be close to the true values. Children aged two through four with normal hematocrit and hemoglobin values within the six months prior to certification are not required to be tested so that unreported data are likely to be concentrated among children who had normal blood values.
It is interesting to compare PC2008 findings on anemia in WIC women with information on the US population. Recent nationally representative data on the prevalence of iron deficiency among women during childbearing years are available from the continuing National Health and Nutrition Examination Survey (NHANES). Information from NHANES 2003-2006 indicates that between 7 percent and 9 percent of non-pregnant women aged 15 to 45 display hemoglobin or hematocrit values below the FNS mandated cutoffs. WIC non-pregnant women are therefore roughly three times more likely than the general population to show evidence of anemia. Anemia rates among WIC pregnant women are similar to the national rates of non-pregnant women. Information on anemia by race and ethnicity appears in Exhibits 4.47 through 4.50. Interpretation of these data must include consideration of unreported data, which are higher among American Indian/Alaska Native Only, Asian Only, and Hispanic WIC women than for other racial and ethnic categories. In PC2008, as in previous reports, Black/African American Only women and children display the highest reported levels of anemia. American Indian/Alaska Native Only and White Only WIC women participants and American Indian/Alaska Native Only child participants reported the lowest levels of anemia. Across racial and ethnic categories, percentages of anemic children measured against FNS criteria peak either at one or two years of age and then decrease with age.
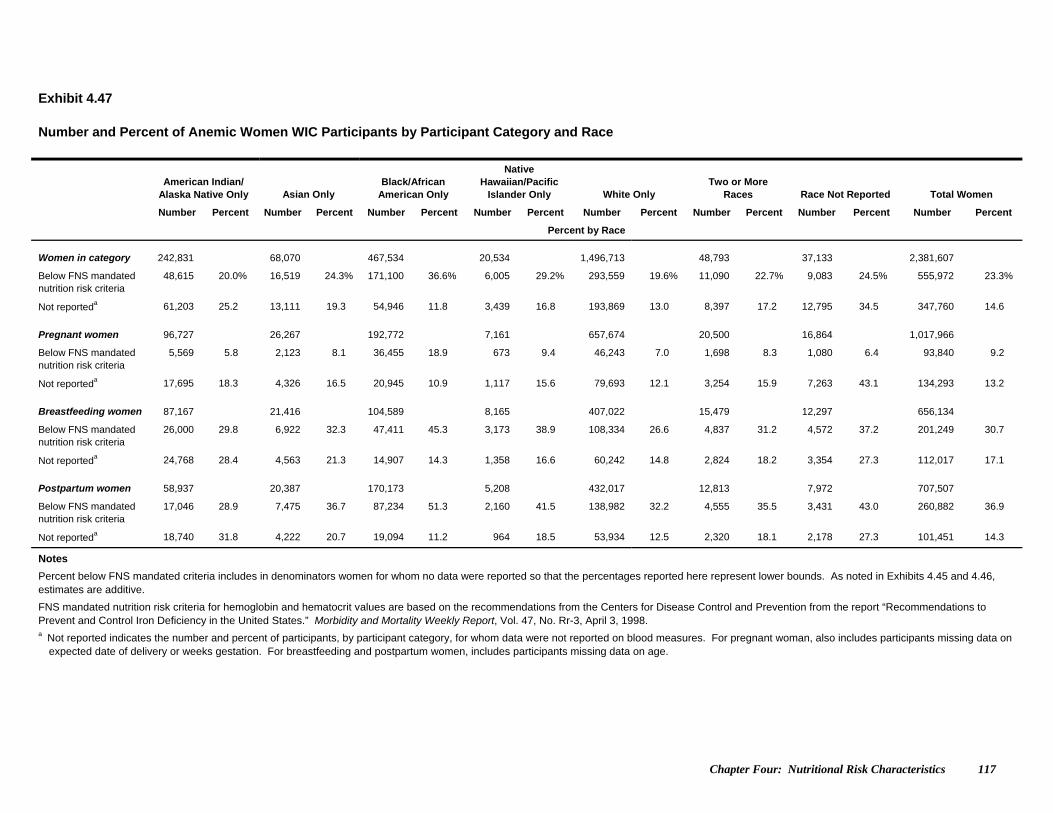
Chapter Four: Nutritional Risk Characteristics 117
Exhibit 4.47 Number and Percent of Anemic Women WIC Participants by Participant Category and Race
American Indian/
Alaska Native Only Asian Only Black/African
American Only
Native Hawaiian/Pacific
Islander Only White Only Two or More
Races Race Not Reported Total Women
Number Percent Number Percent Number Percent Number Percent Number Percent Number Percent Number Percent Number Percent
Percent by Race
Women in category 242,831 68,070 467,534 20,534 1,496,713 48,793 37,133 2,381,607
Below FNS mandated nutrition risk criteria
48,615 20.0% 16,519 24.3% 171,100 36.6% 6,005 29.2% 293,559 19.6% 11,090 22.7% 9,083 24.5% 555,972 23.3%
Not reporteda 61,203 25.2 13,111 19.3 54,946 11.8 3,439 16.8 193,869 13.0 8,397 17.2 12,795 34.5 347,760 14.6
Pregnant women 96,727 26,267 192,772 7,161 657,674 20,500 16,864 1,017,966
Below FNS mandated nutrition risk criteria
5,569 5.8 2,123 8.1 36,455 18.9 673 9.4 46,243 7.0 1,698 8.3 1,080 6.4 93,840 9.2
Not reporteda 17,695 18.3 4,326 16.5 20,945 10.9 1,117 15.6 79,693 12.1 3,254 15.9 7,263 43.1 134,293 13.2
Breastfeeding women 87,167 21,416 104,589 8,165 407,022 15,479 12,297 656,134
Below FNS mandated nutrition risk criteria
26,000 29.8 6,922 32.3 47,411 45.3 3,173 38.9 108,334 26.6 4,837 31.2 4,572 37.2 201,249 30.7
Not reporteda 24,768 28.4 4,563 21.3 14,907 14.3 1,358 16.6 60,242 14.8 2,824 18.2 3,354 27.3 112,017 17.1
Postpartum women 58,937 20,387 170,173 5,208 432,017 12,813 7,972 707,507
Below FNS mandated nutrition risk criteria
17,046 28.9 7,475 36.7 87,234 51.3 2,160 41.5 138,982 32.2 4,555 35.5 3,431 43.0 260,882 36.9
Not reporteda 18,740 31.8 4,222 20.7 19,094 11.2 964 18.5 53,934 12.5 2,320 18.1 2,178 27.3 101,451 14.3
Notes
Percent below FNS mandated criteria includes in denominators women for whom no data were reported so that the percentages reported here represent lower bounds. As noted in Exhibits 4.45 and 4.46, estimates are additive.
FNS mandated nutrition risk criteria for hemoglobin and hematocrit values are based on the recommendations from the Centers for Disease Control and Prevention from the report “Recommendations to Prevent and Control Iron Deficiency in the United States.” Morbidity and Mortality Weekly Report, Vol. 47, No. Rr-3, April 3, 1998. a Not reported indicates the number and percent of participants, by participant category, for whom data were not reported on blood measures. For pregnant woman, also includes participants missing data on
expected date of delivery or weeks gestation. For breastfeeding and postpartum women, includes participants missing data on age.
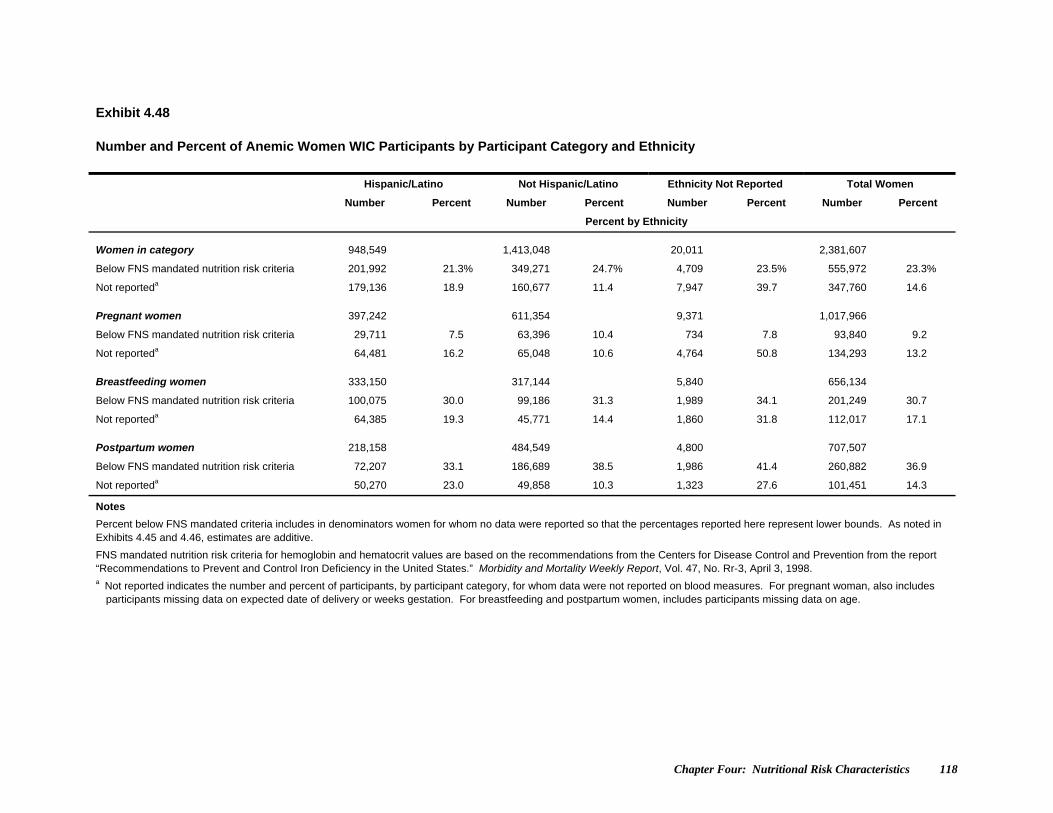
Chapter Four: Nutritional Risk Characteristics 118
Exhibit 4.48 Number and Percent of Anemic Women WIC Participants by Participant Category and Ethnicity
Hispanic/Latino Not Hispanic/Latino Ethnicity Not Reported Total Women
Number Percent Number Percent Number Percent Number Percent
Percent by Ethnicity
Women in category 948,549 1,413,048 20,011 2,381,607
Below FNS mandated nutrition risk criteria 201,992 21.3% 349,271 24.7% 4,709 23.5% 555,972 23.3%
Not reporteda 179,136 18.9 160,677 11.4 7,947 39.7 347,760 14.6
Pregnant women 397,242 611,354 9,371 1,017,966
Below FNS mandated nutrition risk criteria 29,711 7.5 63,396 10.4 734 7.8 93,840 9.2
Not reporteda 64,481 16.2 65,048 10.6 4,764 50.8 134,293 13.2
Breastfeeding women 333,150 317,144 5,840 656,134
Below FNS mandated nutrition risk criteria 100,075 30.0 99,186 31.3 1,989 34.1 201,249 30.7
Not reporteda 64,385 19.3 45,771 14.4 1,860 31.8 112,017 17.1
Postpartum women 218,158 484,549 4,800 707,507
Below FNS mandated nutrition risk criteria 72,207 33.1 186,689 38.5 1,986 41.4 260,882 36.9
Not reporteda 50,270 23.0 49,858 10.3 1,323 27.6 101,451 14.3
Notes
Percent below FNS mandated criteria includes in denominators women for whom no data were reported so that the percentages reported here represent lower bounds. As noted in Exhibits 4.45 and 4.46, estimates are additive.
FNS mandated nutrition risk criteria for hemoglobin and hematocrit values are based on the recommendations from the Centers for Disease Control and Prevention from the report “Recommendations to Prevent and Control Iron Deficiency in the United States.” Morbidity and Mortality Weekly Report, Vol. 47, No. Rr-3, April 3, 1998. a Not reported indicates the number and percent of participants, by participant category, for whom data were not reported on blood measures. For pregnant woman, also includes
participants missing data on expected date of delivery or weeks gestation. For breastfeeding and postpartum women, includes participants missing data on age.
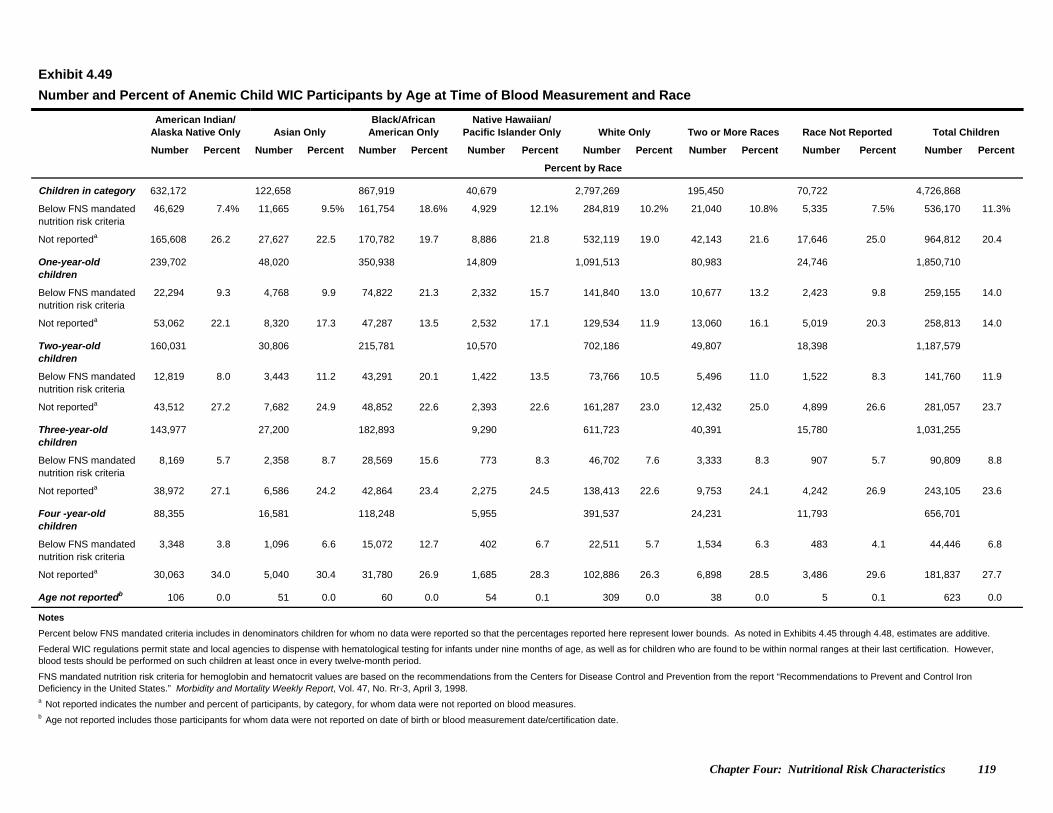
Chapter Four: Nutritional Risk Characteristics 119
Exhibit 4.49
Number and Percent of Anemic Child WIC Participants by Age at Time of Blood Measurement and Race
American Indian/
Alaska Native Only Asian Only Black/African
American Only Native Hawaiian/
Pacific Islander Only White Only Two or More Races Race Not Reported Total Children
Number Percent Number Percent Number Percent Number Percent Number Percent Number Percent Number Percent Number Percent
Percent by Race
Children in category 632,172 122,658 867,919 40,679 2,797,269 195,450 70,722 4,726,868
Below FNS mandated nutrition risk criteria
46,629 7.4% 11,665 9.5% 161,754 18.6% 4,929 12.1% 284,819 10.2% 21,040 10.8% 5,335 7.5% 536,170 11.3%
Not reporteda 165,608 26.2 27,627 22.5 170,782 19.7 8,886 21.8 532,119 19.0 42,143 21.6 17,646 25.0 964,812 20.4
One-year-old children
239,702 48,020 350,938 14,809 1,091,513 80,983 24,746 1,850,710
Below FNS mandated nutrition risk criteria
22,294 9.3 4,768 9.9 74,822 21.3 2,332 15.7 141,840 13.0 10,677 13.2 2,423 9.8 259,155 14.0
Not reporteda 53,062 22.1 8,320 17.3 47,287 13.5 2,532 17.1 129,534 11.9 13,060 16.1 5,019 20.3 258,813 14.0
Two-year-old children
160,031 30,806 215,781 10,570 702,186 49,807 18,398 1,187,579
Below FNS mandated nutrition risk criteria
12,819 8.0 3,443 11.2 43,291 20.1 1,422 13.5 73,766 10.5 5,496 11.0 1,522 8.3 141,760 11.9
Not reporteda 43,512 27.2 7,682 24.9 48,852 22.6 2,393 22.6 161,287 23.0 12,432 25.0 4,899 26.6 281,057 23.7
Three-year-old children
143,977 27,200 182,893 9,290 611,723 40,391 15,780 1,031,255
Below FNS mandated nutrition risk criteria
8,169 5.7 2,358 8.7 28,569 15.6 773 8.3 46,702 7.6 3,333 8.3 907 5.7 90,809 8.8
Not reporteda 38,972 27.1 6,586 24.2 42,864 23.4 2,275 24.5 138,413 22.6 9,753 24.1 4,242 26.9 243,105 23.6
Four -year-old children
88,355 16,581 118,248 5,955 391,537 24,231 11,793 656,701
Below FNS mandated nutrition risk criteria
3,348 3.8 1,096 6.6 15,072 12.7 402 6.7 22,511 5.7 1,534 6.3 483 4.1 44,446 6.8
Not reporteda 30,063 34.0 5,040 30.4 31,780 26.9 1,685 28.3 102,886 26.3 6,898 28.5 3,486 29.6 181,837 27.7
Age not reportedb 106 0.0 51 0.0 60 0.0 54 0.1 309 0.0 38 0.0 5 0.1 623 0.0
Notes
Percent below FNS mandated criteria includes in denominators children for whom no data were reported so that the percentages reported here represent lower bounds. As noted in Exhibits 4.45 through 4.48, estimates are additive.
Federal WIC regulations permit state and local agencies to dispense with hematological testing for infants under nine months of age, as well as for children who are found to be within normal ranges at their last certification. However, blood tests should be performed on such children at least once in every twelve-month period.
FNS mandated nutrition risk criteria for hemoglobin and hematocrit values are based on the recommendations from the Centers for Disease Control and Prevention from the report “Recommendations to Prevent and Control Iron Deficiency in the United States.” Morbidity and Mortality Weekly Report, Vol. 47, No. Rr-3, April 3, 1998. a Not reported indicates the number and percent of participants, by category, for whom data were not reported on blood measures. b Age not reported includes those participants for whom data were not reported on date of birth or blood measurement date/certification date.
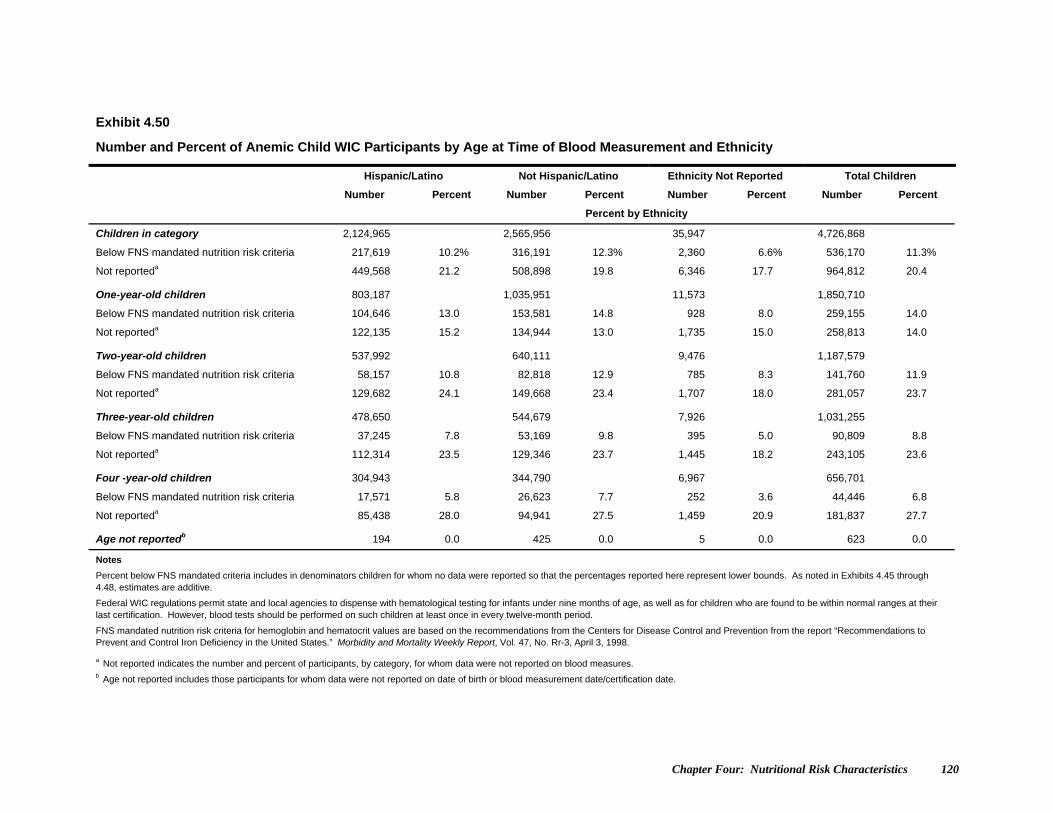
Chapter Four: Nutritional Risk Characteristics 120
Exhibit 4.50
Number and Percent of Anemic Child WIC Participants by Age at Time of Blood Measurement and Ethnicity
Hispanic/Latino Not Hispanic/Latino Ethnicity Not Reported Total Children
Number Percent Number Percent Number Percent Number Percent
Percent by Ethnicity
Children in category 2,124,965 2,565,956 35,947 4,726,868
Below FNS mandated nutrition risk criteria 217,619 10.2% 316,191 12.3% 2,360 6.6% 536,170 11.3%
Not reporteda 449,568 21.2 508,898 19.8 6,346 17.7 964,812 20.4
One-year-old children 803,187 1,035,951 11,573 1,850,710
Below FNS mandated nutrition risk criteria 104,646 13.0 153,581 14.8 928 8.0 259,155 14.0
Not reporteda 122,135 15.2 134,944 13.0 1,735 15.0 258,813 14.0
Two-year-old children 537,992 640,111 9,476 1,187,579
Below FNS mandated nutrition risk criteria 58,157 10.8 82,818 12.9 785 8.3 141,760 11.9
Not reporteda 129,682 24.1 149,668 23.4 1,707 18.0 281,057 23.7
Three-year-old children 478,650 544,679 7,926 1,031,255
Below FNS mandated nutrition risk criteria 37,245 7.8 53,169 9.8 395 5.0 90,809 8.8
Not reporteda 112,314 23.5 129,346 23.7 1,445 18.2 243,105 23.6
Four -year-old children 304,943 344,790 6,967 656,701
Below FNS mandated nutrition risk criteria 17,571 5.8 26,623 7.7 252 3.6 44,446 6.8
Not reporteda 85,438 28.0 94,941 27.5 1,459 20.9 181,837 27.7
Age not reportedb 194 0.0 425 0.0 5 0.0 623 0.0
Notes
Percent below FNS mandated criteria includes in denominators children for whom no data were reported so that the percentages reported here represent lower bounds. As noted in Exhibits 4.45 through 4.48, estimates are additive.
Federal WIC regulations permit state and local agencies to dispense with hematological testing for infants under nine months of age, as well as for children who are found to be within normal ranges at their last certification. However, blood tests should be performed on such children at least once in every twelve-month period.
FNS mandated nutrition risk criteria for hemoglobin and hematocrit values are based on the recommendations from the Centers for Disease Control and Prevention from the report “Recommendations to Prevent and Control Iron Deficiency in the United States.” Morbidity and Mortality Weekly Report, Vol. 47, No. Rr-3, April 3, 1998. a Not reported indicates the number and percent of participants, by category, for whom data were not reported on blood measures. b Age not reported includes those participants for whom data were not reported on date of birth or blood measurement date/certification date.
Chapter Five: Priority Levels 121
5. PRIORITY LEVELS As described in Chapter One of this report, the WIC Program must operate within the annual funding levels established by the Congress. The number of participants served by the program depends on the total funds available as well as on the allocation of these funds by FNS to individual States. For each local agency, a maximum caseload is determined based on the agency's funding level and predicted caseload turnover. When a local WIC agency reaches the maximum participation level, a system of priorities is followed in allocating caseload "slots" to eligible applicants. Some WIC agencies maintain waiting lists of eligible applicants to fill openings as they become available. Federal regulations define seven levels of priority for service provision in local agencies. These levels are based on applicant categories and type of nutrition risk. (See Exhibit 5.1.) In general, precedence is given to medically based (anthropometric, biochemical, and medical) nutrition risks over risks based only on inadequate diet. Further, higher priority levels are assigned to infants, pregnant women, and breastfeeding women. State agencies may create sub-priorities and may expand priority levels III, IV, or V to include high-risk postpartum women. In addition, State agencies have the option of assigning risk solely on the basis of the applicant’s homeless or migrant status. Homeless or migrant participants may be assigned to priority levels IV, V, or VI according to their certification category, or to priority level VII regardless of their certification category. Priority level distribution by participant category is presented in Exhibit 5.2. Exhibits 5.3 and 5.4 describe the priority level distribution by age for infants and children, respectively. Since 1994, States have reported priority levels for at least 99 percent of WIC participants. Between 1998 and 2000, there was a shift in priority level assignments from medically based priorities to dietary priorities for pregnant women, postpartum women, and children. This change most likely reflected revisions in the FNS criteria for anemia instituted in 1999. The limits for defining anemia were standardized for the WIC Program and set at a more conservative threshold than previously used by some States. As a result, some participants who would have been considered at nutritional risk because of low blood iron based on pre-1999 State criteria, did not meet the criteria for this nutrition risk. The proportion of pregnant WIC enrollees in priority level I dropped 6.9 percentage points, and the proportion of postpartum women in priority level III dropped 8.1 percentage points between 1998 and 2000. Since 2000, these proportions have remained relatively stable with the percentage of pregnant women in priority level I at about 85 percent in all years since 2000, and the percentage of postpartum women in priority level III between 33 percent and 37 percent. The percentages of WIC women assigned to priority levels IV and VI increased by similar proportions between 1998 and 2000; these percentages have also remained relatively constant since 2000. The percentages of women in priority level IV and priority level VI have been between 10 and 11 percent and between 15 and 16 percent, respectively, as shown in prior years’ reports. For infants, in contrast, there has been a marked shift from Priority II to Priority I since 2000. The percentage of infants assigned to Priority II decreased from 44.7 percent in 2000 to 38.0 percent in 2008. Conversely, the percentage of infants assigned to Priority I increased from 48.5 percent in 2000 to 55.4 percent in 2008. The increase since 2000 in the proportion of infants assigned medically based priorities likely reflects several factors, including: implementation of FNS uniform nutritional risk criteria in 1999, an
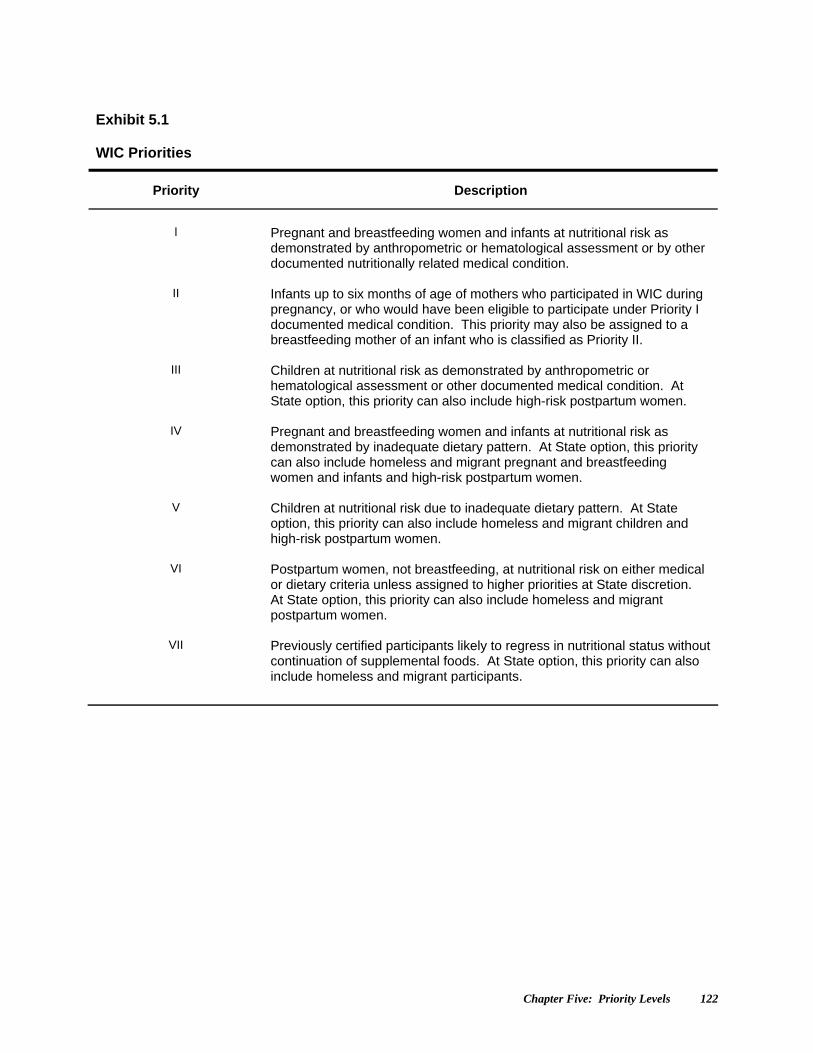
Chapter Five: Priority Levels 122
Exhibit 5.1
WIC Priorities
Priority Description
l Pregnant and breastfeeding women and infants at nutritional risk as
demonstrated by anthropometric or hematological assessment or by other documented nutritionally related medical condition.
II Infants up to six months of age of mothers who participated in WIC during
pregnancy, or who would have been eligible to participate under Priority I documented medical condition. This priority may also be assigned to a breastfeeding mother of an infant who is classified as Priority II.
III Children at nutritional risk as demonstrated by anthropometric or
hematological assessment or other documented medical condition. At State option, this priority can also include high-risk postpartum women.
IV Pregnant and breastfeeding women and infants at nutritional risk as
demonstrated by inadequate dietary pattern. At State option, this priority can also include homeless and migrant pregnant and breastfeeding women and infants and high-risk postpartum women.
V Children at nutritional risk due to inadequate dietary pattern. At State
option, this priority can also include homeless and migrant children and high-risk postpartum women.
VI Postpartum women, not breastfeeding, at nutritional risk on either medical
or dietary criteria unless assigned to higher priorities at State discretion. At State option, this priority can also include homeless and migrant postpartum women.
VII Previously certified participants likely to regress in nutritional status without
continuation of supplemental foods. At State option, this priority can also include homeless and migrant participants.

Chapter Five: Priority Levels 123
Exhibit 5.2 Priority of All WIC Participants by Participant Category
Pregnant Women Breastfeeding
Women Postpartum
Women Total Women Infantsa Children Total WIC
Priority Number Percent Number Percent Number Percent Number Percent Number Percent Number Percent Number Percent
Percent by Participant Category
Priority reported
Ib 879,887 86.4% 595,166 90.7% 9,406 1.3% 1,484,459 62.3% 1,346,791 55.4% 30,562 0.6% 2,861,812 30.0%
II 270 0.0 9,052 1.4 231 0.0 9,553 0.4 923,474 38.0 4,052 0.1 937,078 9.8
III 41 0.0 3,546 0.5 236,172 33.4 239,759 10.1 1,546 0.1 2,359,551 49.9 2,600,855 27.3
IV 133,323 13.1 43,951 6.7 53,070 7.5 230,344 9.7 143,358 5.9 7,192 0.2 380,894 4.0
V 216 0.0 201 0.0 31,973 4.5 32,390 1.4 3,881 0.2 2,261,411 47.8 2,297,682 24.1
VI 566 0.1 1,311 0.2 369,226 52.2 371,103 15.6 75 0.0 98 0.0 371,276 3.9
VII 1,029 0.1 1,584 0.2 1,530 0.2 4,143 0.2 2,950 0.1 44,759 0.9 51,851 0.5
No priority reported 2,635 0.3 1,323 0.2 5,900 0.8 9,858 0.4 9,929 0.4 19,245 0.4 39,032 0.4
US WIC 1,017,966 656,134 707,507 2,381,607 2,432,004 4,726,868 9,540,481
Notes
Percents may not add to 100.0% and subtotals may not add to totals due to rounding and to the use of weights in the case of several State agencies that either under- or over-reported the number of participants. Northern Mariana Islands was unable to provide sufficient data on WIC priorities.
About 2.1 percent of one-year-old children are eleven-month-old infants who have been recertified as children. About 0.1 percent of WIC participants who are classified as infants are participants older than 365 days. a An infant is defined as a participant who, at certification, is under one year of age and who will be classified as a child at the age of 366 days. b A small proportion of postpartum women and children may not have had their State-level record or priorities updated on State-maintained management information systems when they were certified for WIC benefits in different certification categories.
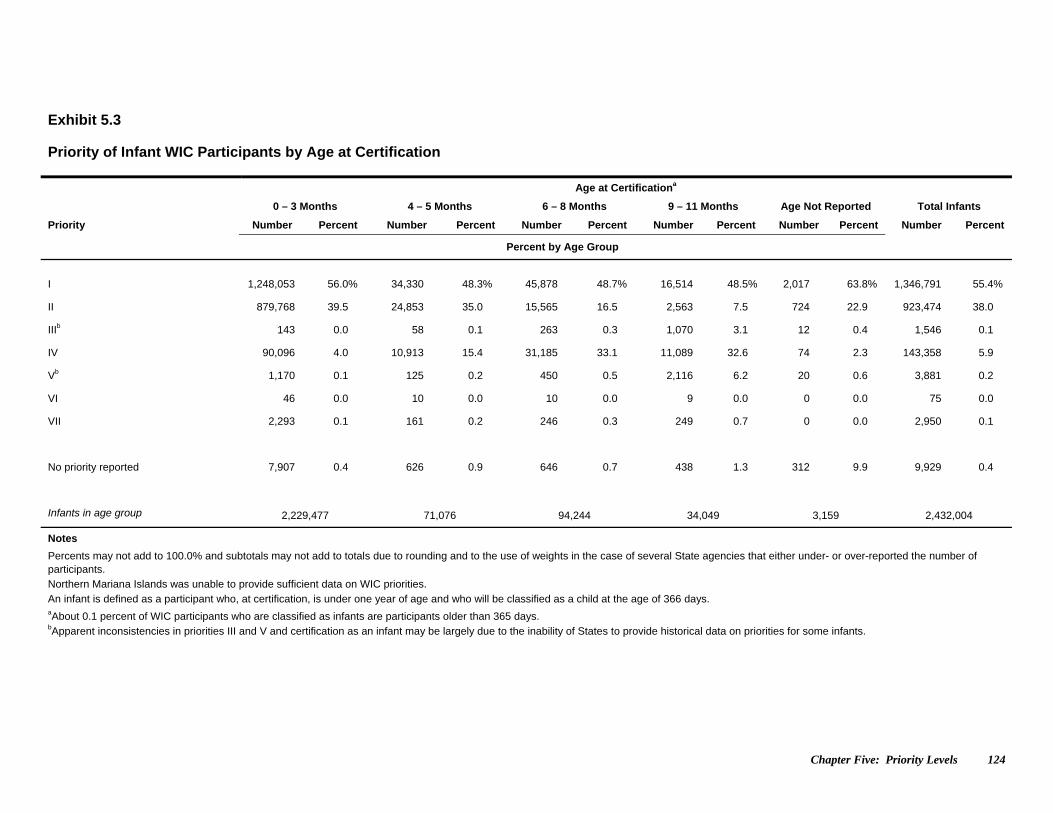
Chapter Five: Priority Levels 124
Exhibit 5.3 Priority of Infant WIC Participants by Age at Certification
Age at Certificationa
0 – 3 Months 4 – 5 Months 6 – 8 Months 9 – 11 Months Age Not Reported Total Infants
Priority Number Percent Number Percent Number Percent Number Percent Number Percent Number Percent
Percent by Age Group
I 1,248,053 56.0% 34,330 48.3% 45,878 48.7% 16,514 48.5% 2,017 63.8% 1,346,791 55.4%
II 879,768 39.5 24,853 35.0 15,565 16.5 2,563 7.5 724 22.9 923,474 38.0
IIIb 143 0.0 58 0.1 263 0.3 1,070 3.1 12 0.4 1,546 0.1
IV 90,096 4.0 10,913 15.4 31,185 33.1 11,089 32.6 74 2.3 143,358 5.9
Vb 1,170 0.1 125 0.2 450 0.5 2,116 6.2 20 0.6 3,881 0.2
VI 46 0.0 10 0.0 10 0.0 9 0.0 0 0.0 75 0.0
VII 2,293 0.1 161 0.2 246 0.3 249 0.7 0 0.0 2,950 0.1
No priority reported 7,907 0.4 626 0.9 646 0.7 438 1.3 312 9.9 9,929 0.4
Infants in age group 2,229,477 71,076 94,244 34,049 3,159 2,432,004
Notes
Percents may not add to 100.0% and subtotals may not add to totals due to rounding and to the use of weights in the case of several State agencies that either under- or over-reported the number of participants. Northern Mariana Islands was unable to provide sufficient data on WIC priorities.
An infant is defined as a participant who, at certification, is under one year of age and who will be classified as a child at the age of 366 days. aAbout 0.1 percent of WIC participants who are classified as infants are participants older than 365 days. bApparent inconsistencies in priorities III and V and certification as an infant may be largely due to the inability of States to provide historical data on priorities for some infants.
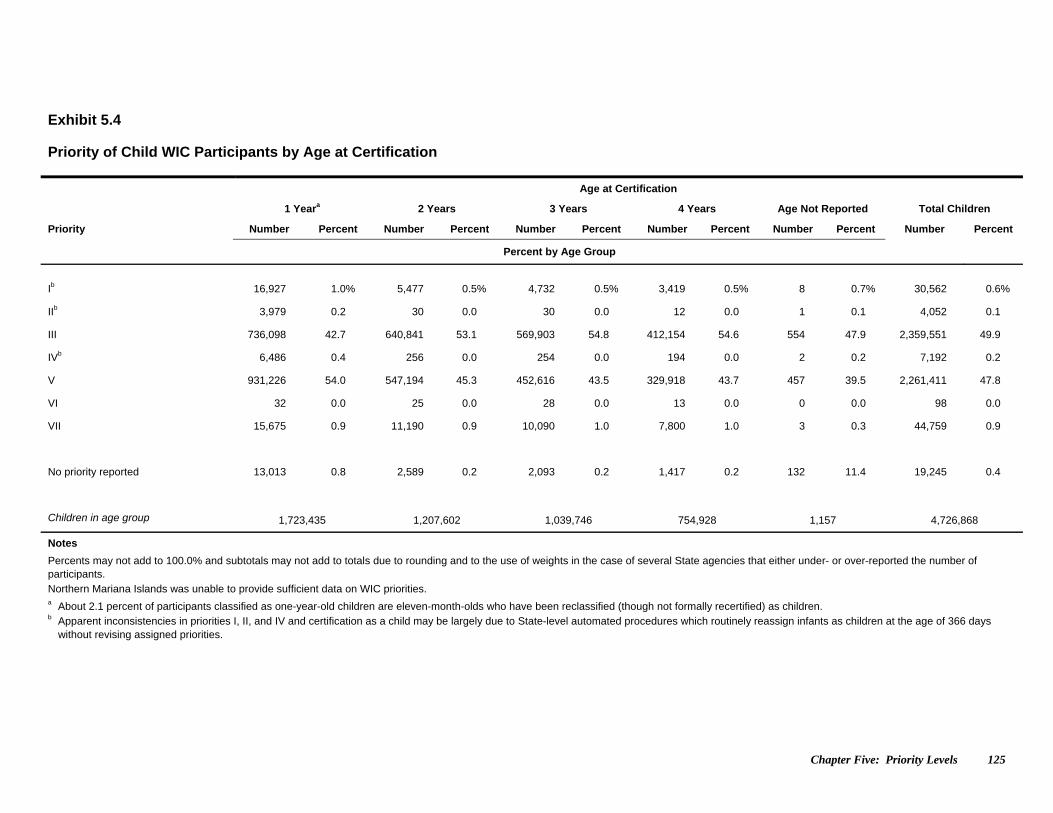
Chapter Five: Priority Levels 125
Exhibit 5.4 Priority of Child WIC Participants by Age at Certification
Age at Certification
1 Yeara 2 Years 3 Years 4 Years Age Not Reported Total Children
Priority Number Percent Number Percent Number Percent Number Percent Number Percent Number Percent
Percent by Age Group
Ib 16,927 1.0% 5,477 0.5% 4,732 0.5% 3,419 0.5% 8 0.7% 30,562 0.6%
IIb 3,979 0.2 30 0.0 30 0.0 12 0.0 1 0.1 4,052 0.1
III 736,098 42.7 640,841 53.1 569,903 54.8 412,154 54.6 554 47.9 2,359,551 49.9
IVb 6,486 0.4 256 0.0 254 0.0 194 0.0 2 0.2 7,192 0.2
V 931,226 54.0 547,194 45.3 452,616 43.5 329,918 43.7 457 39.5 2,261,411 47.8
VI 32 0.0 25 0.0 28 0.0 13 0.0 0 0.0 98 0.0
VII 15,675 0.9 11,190 0.9 10,090 1.0 7,800 1.0 3 0.3 44,759 0.9
No priority reported 13,013 0.8 2,589 0.2 2,093 0.2 1,417 0.2 132 11.4 19,245 0.4
Children in age group 1,723,435 1,207,602 1,039,746 754,928 1,157 4,726,868
Notes
Percents may not add to 100.0% and subtotals may not add to totals due to rounding and to the use of weights in the case of several State agencies that either under- or over-reported the number of participants. Northern Mariana Islands was unable to provide sufficient data on WIC priorities. a About 2.1 percent of participants classified as one-year-old children are eleven-month-olds who have been reclassified (though not formally recertified) as children. b Apparent inconsistencies in priorities I, II, and IV and certification as a child may be largely due to State-level automated procedures which routinely reassign infants as children at the age of 366 days
without revising assigned priorities.
Chapter Five: Priority Levels 126
increase in breastfeeding rates that increased the proportion of breastfeeding women with their infants assigned to Priority I, and, use of parental obesity as an anthropometric risk factor for infants. Parental obesity is based on BMI as determined at mother’s certification or during the first trimester for the mother. Since 2000, the largest margins of increase in Priority I and decrease in Priority II occurred between 2004 and 2006. The proportion of infants assigned to Priority I increased by 2.5 percent, and the proportion assigned to Priority II decreased by 2.3 percent within this two-year period. From 1994 to 1998 the proportion of WIC children assigned to Priority III, a medically based priority, decreased from 68.2 percent to 63.6 percent. During this period, as enrollment increased, WIC programs may have been able to serve a growing number of lower priority children. Between 1998 and 2000, the proportion of children assigned medically based priorities declined more sharply to 50.2 percent in 2000, undoubtedly reflecting the standardization of the anemia criteria. Conversely, the proportion of WIC children assigned to Priority V, a dietary priority, increased from 28.9 percent in 1994 to 34.6 percent in 1998, and subsequently to 47.9 percent in 2000. From 2000 to 2004, the proportion of children assigned to Priority III continued to decrease slightly, whereas the proportion of children assigned to Priority V continued to increase slightly. Since 2004, this trend has reversed slightly, and more children are now assigned to Priority III than to Priority V. In 2008, 49.9 percent and 47.8 percent of children were assigned to Priorities III and V, respectively.
Chapter Six: Breastfeeding of WIC Infants 127
6. BREASTFEEDING OF WIC INFANTS
Since 1989, with passage of the Child Nutrition and WIC Reauthorization Act (PL 101-147), the WIC Program has strongly promoted breastfeeding for pregnant and postpartum participants. The act earmarked a minimum of $8 million a year for breastfeeding promotion. State and local WIC agencies developed a range of strategies to increase breastfeeding incidence and duration among WIC participants. Strategies used to promote and support breastfeeding include: providing current, accurate breastfeeding information through individual or group education for participants and their families; sponsoring peer counselor programs, breast pump loan programs, and support groups; creating breastfeeding-friendly clinic environments and community partnerships; and providing ongoing staff education and training. PL 103-448, passed in 1994, required USDA to begin reporting to the Congress in 1998 on incidence and duration of breastfeeding among WIC participants. This legislation also revised the funding formula for WIC breastfeeding promotion and support, requiring State agencies to spend $21 dollars, adjusted annually for inflation, on each pregnant and breastfeeding woman in support of breastfeeding. FNS, in conjunction with the National WIC Association and the Centers for Disease Control and Prevention (CDC), developed four new MDS items to collect data on breastfeeding. These MDS items, initially collected for seven-to-eleven-month-old infants, are: whether currently breastfed (at time of data collection); whether ever breastfed; length of time breastfed (if not currently breastfed); and date breastfeeding data were collected. Beginning with PC2004, States were asked to collect these data on infants and children aged six to thirteen months in April of the study year. Prior to 1998, States were asked to report breastfeeding information only if their management information systems contained the data. National estimates could not be calculated because many States were unable to report this information. In 1998, reporting of breastfeeding data improved significantly, and national estimates of breastfeeding initiation could be calculated. For breastfeeding duration, however, only individual State-specific estimates could be calculated because of the substantial amount of unreported data on variables needed to calculate duration. PC2008 similarly reports on national rates of breastfeeding initiation as well as on State-level rates of breastfeeding duration. Exhibit 6.1 presents data on breastfeeding initiation rates for six-to-thirteen-month-old infants and children.1 Reporting has improved substantially over time and the PC2008 estimate of the national rate of breastfeeding initiation is based on data from 87 State WIC agencies that serve 99.5 percent of all WIC infants and children aged six to thirteen months. Three State WIC agencies that reported information on less than 75 percent of infants and children in this age range are excluded from these calculations.2 In addition, we do not display data for State agencies that reported information on between 75 percent and 85 percent of infants and children in this age range, although these data are included in the national estimate. As noted above, WIC participants in reporting States and ITOs comprise 99.5 percent of all WIC-enrolled infants and children aged six to thirteen months, and data are available on 95.3 percent of WIC participants in these 87 agencies. Therefore, the national PC2008 estimates are
1 Appendix C presents comparable data on breastfeeding for seven-to-eleven-month-old infants, to allow comparison with previous PC reports. 2 We have excluded these State agencies from our estimate of the national rate to avoid the possibility of bias from incomplete information. The 3 State agencies that are excluded for this reason are: Idaho, Northern Mariana Islands, and ITC-Oklahoma.
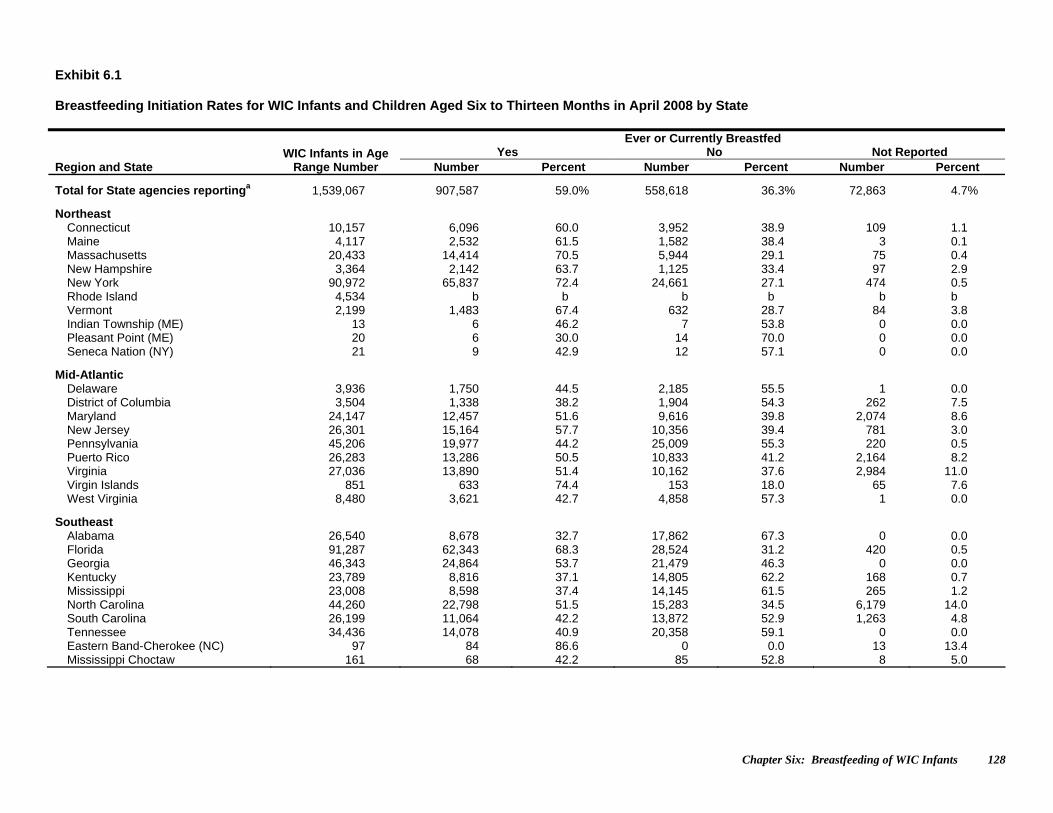
Chapter Six: Breastfeeding of WIC Infants 128
Exhibit 6.1 Breastfeeding Initiation Rates for WIC Infants and Children Aged Six to Thirteen Months in April 2008 by State Ever or Currently Breastfed
Yes No Not Reported Region and State
WIC Infants in Age Range Number Number Percent Number Percent Number Percent
Total for State agencies reportinga 1,539,067 907,587 59.0% 558,618 36.3% 72,863 4.7%
Northeast Connecticut 10,157 6,096 60.0 3,952 38.9 109 1.1 Maine 4,117 2,532 61.5 1,582 38.4 3 0.1 Massachusetts 20,433 14,414 70.5 5,944 29.1 75 0.4 New Hampshire 3,364 2,142 63.7 1,125 33.4 97 2.9 New York 90,972 65,837 72.4 24,661 27.1 474 0.5 Rhode Island 4,534 b b b b b b Vermont 2,199 1,483 67.4 632 28.7 84 3.8 Indian Township (ME) 13 6 46.2 7 53.8 0 0.0 Pleasant Point (ME) 20 6 30.0 14 70.0 0 0.0 Seneca Nation (NY) 21 9 42.9 12 57.1 0 0.0
Mid-Atlantic Delaware 3,936 1,750 44.5 2,185 55.5 1 0.0 District of Columbia 3,504 1,338 38.2 1,904 54.3 262 7.5 Maryland 24,147 12,457 51.6 9,616 39.8 2,074 8.6 New Jersey 26,301 15,164 57.7 10,356 39.4 781 3.0 Pennsylvania 45,206 19,977 44.2 25,009 55.3 220 0.5 Puerto Rico 26,283 13,286 50.5 10,833 41.2 2,164 8.2 Virginia 27,036 13,890 51.4 10,162 37.6 2,984 11.0 Virgin Islands 851 633 74.4 153 18.0 65 7.6 West Virginia 8,480 3,621 42.7 4,858 57.3 1 0.0
Southeast Alabama 26,540 8,678 32.7 17,862 67.3 0 0.0 Florida 91,287 62,343 68.3 28,524 31.2 420 0.5 Georgia 46,343 24,864 53.7 21,479 46.3 0 0.0 Kentucky 23,789 8,816 37.1 14,805 62.2 168 0.7 Mississippi 23,008 8,598 37.4 14,145 61.5 265 1.2 North Carolina 44,260 22,798 51.5 15,283 34.5 6,179 14.0 South Carolina 26,199 11,064 42.2 13,872 52.9 1,263 4.8 Tennessee 34,436 14,078 40.9 20,358 59.1 0 0.0 Eastern Band-Cherokee (NC) 97 84 86.6 0 0.0 13 13.4 Mississippi Choctaw 161 68 42.2 85 52.8 8 5.0
Chapter Six: Breastfeeding of WIC Infants 129
Exhibit 6.1(continued) Breastfeeding Initiation Rates for WIC Infants and Children Aged Six to Thirteen Months in April 2008 by State Ever or Currently Breastfed
Yes No Not Reported
Region and State
WIC Infants in Age Range
Number Number Percent Number Percent Number Percent Midwest Illinois 59,490 37,194 62.5% 21,959 36.9% 337 0.6% Indiana 30,216 18,286 60.5 10,901 36.1 1,029 3.4 Michigan 45,291 20,926 46.2 18,637 41.1 5,728 12.6 Minnesota 24,301 15,371 63.3 6,372 26.2 2,558 10.5 Ohio 47,168 b b b b b b Wisconsin 20,741 13,243 63.8 7,386 35.6 112 0.5
Southwest Arkansas 17,954 b b b b b b Louisiana 27,732 7,192 25.9 20,310 73.2 230 0.8 New Mexico 10,846 7,754 71.5 3,077 28.4 15 0.1 Oklahoma 16,465 9,277 56.3 4,786 29.1 2,402 14.6 Texas 172,328 115,679 67.1 56,371 32.7 278 0.2 ACL (NM) 77 59 76.6 18 23.4 0 0.0 Cherokee Nation (OK) 1,451 599 41.3 649 44.7 203 14.0 Chickasaw Nation (OK) 566 269 47.5 297 52.5 0 0.0 Choctaw Nation (OK) 648 139 21.5 509 78.5 0 0.0 Citizen-Potawatomi (OK) 265 77 29.1 188 70.9 0 0.0 Eight Northern Pueblos (NM) 51 38 74.5 13 25.5 0 0.0 Five Sandoval Pueblos (NM) 63 51 81.0 12 19.0 0 0.0 Muscogee Creek Nation (OK) 456 228 50.0 228 50.0 0 0.0 Osage Nation (OK) 416 165 39.7 251 60.3 0 0.0 Otoe-Missouria (OK) 111 64 57.7 47 42.3 0 0.0 Pueblo of Isleta (NM) 139 117 84.2 21 15.1 1 0.7 Pueblo of San Felipe (NM) 42 37 88.1 5 11.9 0 0.0 Pueblo of Zuni (NM) 125 104 83.2 21 16.8 0 0.0 Santo Domingo (NM) 36 30 83.3 6 16.7 0 0.0 WCD (OK) 564 288 51.1 276 48.9 0 0.0
Mountain Plains Colorado 17,357 12,979 74.8 4,378 25.2 0 0.0 Iowa 12,999 7,722 59.4 5,277 40.6 0 0.0 Kansas 13,534 9,031 66.7 4,355 32.2 148 1.1 Missouri 28,978 15,641 54.0 13,337 46.0 0 0.0 Montana 3,906 2,886 73.9 1,020 26.1 0 0.0 Nebraska 8,757 5,987 68.4 2,748 31.4 22 0.3 North Dakota 2,426 1,449 59.7 977 40.3 0 0.0
Chapter Six: Breastfeeding of WIC Infants 130
Exhibit 6.1(continued) Breastfeeding Initiation Rates for WIC Infants and Children Aged Six to Thirteen Months in April 2008 by State Ever or Currently Breastfed
Yes No Not Reported
Region and State
WIC Infants in Age Range
Number Number Percent Number Percent Number Percent
South Dakota 3,661 2,142 58.5% 1,519 41.5% 0 0.0% Utah 11,727 b b b b b b Wyoming 1,982 1,357 68.5 536 27.0 89 4.5 Cheyenne River Sioux (SD) 102 39 38.2 56 54.9 7 6.9 Eastern Shoshone (WY) 45 23 51.1 16 35.6 6 13.3 Northern Arapaho (WY) 103 78 75.7 22 21.4 3 2.9 Omaha Nation (NE) 67 45 67.2 14 20.9 8 11.9 Rosebud Sioux (SD) 179 112 62.6 64 35.8 3 1.7 Santee Sioux (NE) 11 b b b b b b Standing Rock Sioux (ND) 117 58 49.6 57 48.7 2 1.7 Three Affiliated (ND) 58 31 53.4 19 32.8 8 13.8 Ute Mountain Ute (CO) 28 25 89.3 3 10.7 0 0.0 Winnebago (NE) 33 25 75.8 7 21.2 1 3.0
Western Alaska 4,250 3,531 83.1 719 16.9 0 0.0 American Samoa 803 543 67.6 223 27.8 37 4.6 Arizona 33,564 21,077 62.8 12,449 37.1 38 0.1 California 229,291 150,626 65.7 54,690 23.9 23,975 10.5 Guam 1,310 691 52.7 523 39.9 96 7.4 Hawaii 6,908 5,533 80.1 1,270 18.4 105 1.5 Nevada 11,649 6,665 57.2 4,979 42.7 5 0.0 Oregon 16,706 14,499 86.8 1,925 11.5 282 1.7 Washington 29,062 24,273 83.5 4,333 14.9 456 1.6 ITC-Arizona 2,067 1,314 63.6 744 36.0 9 0.4 ITC-Nevada 289 157 54.3 132 45.7 0 0.0 Navajo Nation (AZ) 1,862 1,396 75.0 402 21.6 64 3.4
Notes
Percents may not add to 100.0% and subtotals may not add to totals due to rounding and to the use of weights in the case of several State agencies that either under- or over-reported the number of participants. a Includes those State WIC agencies reporting data on breastfeeding initiation for 75 percent or more of all six- to thirteen-month-old infants. Agencies excluded are: Idaho, Northern Mariana Islands,
and ITC-Oklahoma. These national estimates are based on information for 99.5 percent of all WIC infants aged six to thirteen months. b State agency reported data on 75 percent or more, but less than 85 percent, of all six- to thirteen-month-old WIC infants. All available data (including these States) were used in establishing the
PC2008 national breastfeeding initiation rate.
Chapter Six: Breastfeeding of WIC Infants 131
based on data for 94.8 percent of all WIC infants and children aged six to thirteen months.3 In the 87 State agencies reporting breastfeeding data, 59.0 percent of all six- to-thirteen-month-old infants and children are currently breastfed or were breastfed at some time. Substantial variation exists among States: some (22 agencies) report more than 70 percent of infants are ever breastfed, while in 10 other States, fewer than 40 percent of infants are ever breastfed. Even greater variation is seen among ITOs: several small ITOs report breastfeeding initiation rates from 80 to nearly 90 percent. Other small ITOs report rates in the 20 to 30 percent range. Based on these State reports, breastfeeding rates among WIC infants and children have increased steadily since 1998 (Exhibit 6.2). Moreover, since 1998, reporting on breastfeeding has steadily improved across several dimensions: more State WIC agencies are reporting; agencies are reporting data on more infants and children in the relevant age range; and the age range for reporting has been broadened. To minimize bias in analyzing changes over time, the comparisons between pairs of years are restricted to the State WIC agencies reporting data in both time periods and to participants in the more restrictive age range of the two comparison points.4 The PC98 benchmark estimate of breastfeeding initiation was 41.5 percent. Restricting the analysis to the 52 State WIC agencies that reported breastfeeding data in both 1998 and 2000, the breastfeeding initiation rate was 41.3 percent in 1998 and 45.7 percent in 2000, an increase of 4.4 percentage points. Similar analyses indicate that the breastfeeding initiation rate increased approximately 4 percentage points between each PC reporting period from 2000 to 2006. For PC2008, the increase is 1.4 percentage points over PC2006 (Exhibit 6.2, bottom panel).5 States were asked to provide information on the length of time infants were breastfed. Many States could not provide these data, so estimates of breastfeeding duration are based on a substantially restricted sample of States and do not constitute national estimates. Only the 64 State agencies that were able to provide duration data for at least 75 percent of infants and children aged six to thirteen months for whom breastfeeding was reportedly initiated are included in Exhibits 6.3 and 6.4.6 Data are shown for the 48 State agencies that provided information on at least 85 percent of breastfed infants. Data for the remaining (16) States are included in the total but are not individually displayed.
3 Calculated as: (99.5)(.953) = 94.8. The measures of breastfeeding initiation and duration are intended to describe WIC infants as a whole. The group of infants aged 6 to 13 months in April 2008 represents eight cohorts (that is, infants who were born in March 2007, April 2007,..., October 2007). Theoretically, initiation rates among these groups could vary systematically because of seasonal factors or age at enrollment. In practice, no systemic seasonal patterns can be identified, although missing data are substantially more common for children aged 13 months in April. Breastfeeding rates can be estimated with greater stability using more cohorts, especially for small State agencies. 4 Appendix C, Exhibit C6.2, presents data on changes in initiation rates for infants aged 7 to 11 months. 5 Our best estimate of the change in breastfeeding rate between 2002 and 2004 uses information only on infants aged seven to eleven months and excludes California from the analysis. Prior to 2004, California’s reported initiation rate was a lower bound estimate based on the conservative assumption that none of the infants for whom breastfeeding initiation data were missing (nearly half of those infants who were not currently breastfed) had ever been breastfed. California’s reporting improved in 2004, resulting in a more accurate estimate of breastfeeding initiation. As a result, comparisons after that time include California. 6 Breastfeeding duration was counted as missing for: (1) currently breastfed infants and children for whom the date breastfeeding data was collected was not reported; (2) currently breastfed infants and children who were less than 22 weeks old when data were collected, whose duration estimates could be substantially underreported; and (3) ever breastfed infants and children for whom duration was not reported.
Chapter Six: Breastfeeding of WIC Infants 132
Exhibit 6.2 Changes in Breastfeeding Initiation Rates for WIC Infants in April: 1998-2008
Breastfeeding Initiation Ratesa
Year Number of States
Reporting Percent Ever or
Currently Breastfed
1998 (infants aged 7 to 11 months) 63 41.5%
2000 (infants aged 7 to 11 months) 68 44.5
2002 (infants aged 7 to 11 months) 68 48.3
2004 (infants and children aged 6 to 13 months) 67 54.6
2006 (infants and children aged 6 to 13 months) 75 57.7
2008 (infants and children aged 6 to 13 months) 87 59.0
Change in Breastfeeding Initiation Rates
Period (participant age range)
Number of States Reporting in Both Years
Beginning of Period Rate
End of Period Rate
Change in Rate
1998-2000 (7 to 11 months) 52 41.3% 45.7% +4.4%
2000-2002 (7 to 11 months) 59 44.4 48.2 +3.8
2002-2004 (7 to 11 months) Excluding Californiab
64 50.0 54.4 +4.4
2004-2006 (6 to 13 months) 61c 54.6 58.3 +3.7
2006-2008 (6 to 13 months) 75 57.7 59.1 +1.4
Notes:
Percents may not add to 100.0% and subtotals may not add to totals due to rounding and to the use of weights in the case of several State agencies that either under- or over-reported the number of participants. a Reported rates are not strictly comparable across years because of differences in the number of State WIC agencies reporting;
inconsistent State reporting (submitting one year but not the next); and variation in the ages of infants for whom data were to be reported.
b Our best estimate of the change in breastfeeding rate between 2002 and 2004 uses information only on infants aged seven to eleven months, and excludes California from the analysis. Prior to 2004, California’s reported initiation rate was a lower bound estimate based on the conservative assumption that none of the infants for whom breastfeeding initiation data were missing (nearly half of those infants who were not currently breastfed) had ever been breastfed. California’s reporting improved in 2004, resulting in a more accurate estimate of breastfeeding initiation.
c For PC2006, Omaha Santee Sioux split to form two separate WIC agencies. Hence the number of common agencies is 61 in PC2004 and 62 in PC2006.
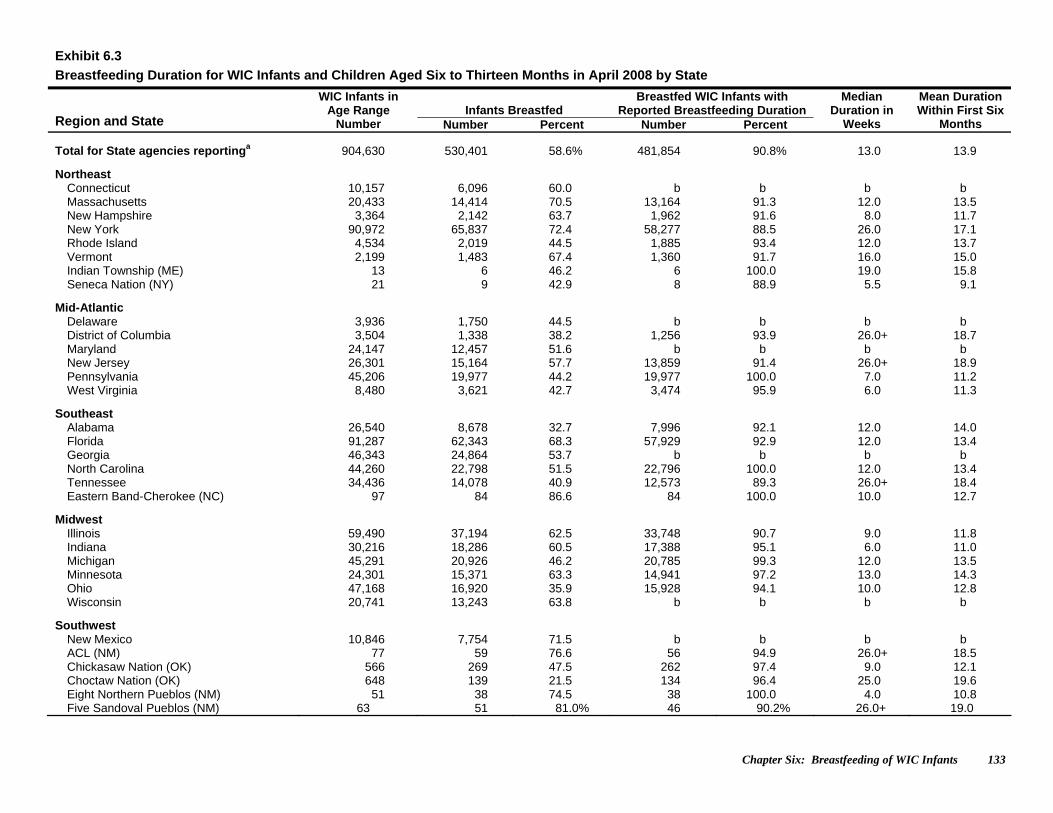
Chapter Six: Breastfeeding of WIC Infants 133
Exhibit 6.3
Breastfeeding Duration for WIC Infants and Children Aged Six to Thirteen Months in April 2008 by State
Infants Breastfed Breastfed WIC Infants with
Reported Breastfeeding Duration Region and State
WIC Infants in Age Range
Number Number Percent Number Percent
Median Duration in
Weeks
Mean Duration Within First Six
Months Total for State agencies reportinga 904,630 530,401 58.6% 481,854 90.8% 13.0 13.9
Northeast Connecticut 10,157 6,096 60.0 b b b b Massachusetts 20,433 14,414 70.5 13,164 91.3 12.0 13.5 New Hampshire 3,364 2,142 63.7 1,962 91.6 8.0 11.7 New York 90,972 65,837 72.4 58,277 88.5 26.0 17.1 Rhode Island 4,534 2,019 44.5 1,885 93.4 12.0 13.7 Vermont 2,199 1,483 67.4 1,360 91.7 16.0 15.0 Indian Township (ME) 13 6 46.2 6 100.0 19.0 15.8 Seneca Nation (NY) 21 9 42.9 8 88.9 5.5 9.1
Mid-Atlantic Delaware 3,936 1,750 44.5 b b b b District of Columbia 3,504 1,338 38.2 1,256 93.9 26.0+ 18.7 Maryland 24,147 12,457 51.6 b b b b New Jersey 26,301 15,164 57.7 13,859 91.4 26.0+ 18.9 Pennsylvania 45,206 19,977 44.2 19,977 100.0 7.0 11.2 West Virginia 8,480 3,621 42.7 3,474 95.9 6.0 11.3
Southeast Alabama 26,540 8,678 32.7 7,996 92.1 12.0 14.0 Florida 91,287 62,343 68.3 57,929 92.9 12.0 13.4 Georgia 46,343 24,864 53.7 b b b b North Carolina 44,260 22,798 51.5 22,796 100.0 12.0 13.4 Tennessee 34,436 14,078 40.9 12,573 89.3 26.0+ 18.4 Eastern Band-Cherokee (NC) 97 84 86.6 84 100.0 10.0 12.7
Midwest Illinois 59,490 37,194 62.5 33,748 90.7 9.0 11.8 Indiana 30,216 18,286 60.5 17,388 95.1 6.0 11.0 Michigan 45,291 20,926 46.2 20,785 99.3 12.0 13.5 Minnesota 24,301 15,371 63.3 14,941 97.2 13.0 14.3 Ohio 47,168 16,920 35.9 15,928 94.1 10.0 12.8 Wisconsin 20,741 13,243 63.8 b b b b
Southwest New Mexico 10,846 7,754 71.5 b b b b ACL (NM) 77 59 76.6 56 94.9 26.0+ 18.5 Chickasaw Nation (OK) 566 269 47.5 262 97.4 9.0 12.1 Choctaw Nation (OK) 648 139 21.5 134 96.4 25.0 19.6 Eight Northern Pueblos (NM) 51 38 74.5 38 100.0 4.0 10.8 Five Sandoval Pueblos (NM) 63 51 81.0% 46 90.2% 26.0+ 19.0
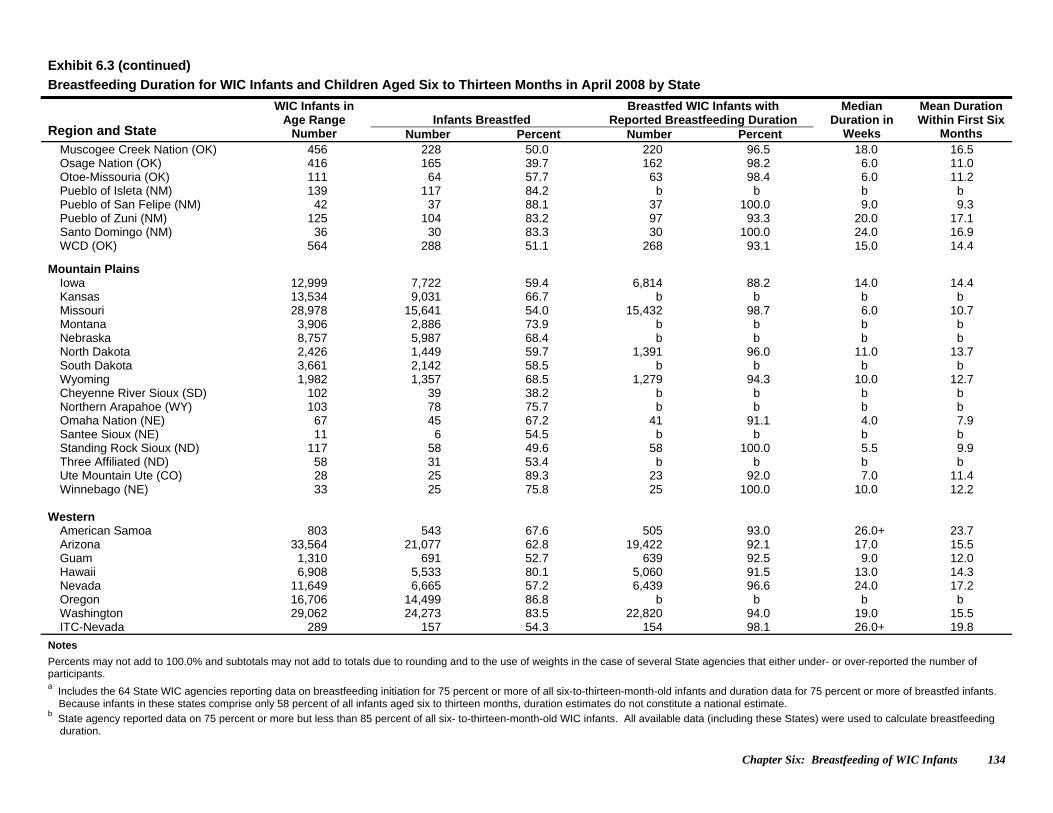
Chapter Six: Breastfeeding of WIC Infants 134
Exhibit 6.3 (continued)
Breastfeeding Duration for WIC Infants and Children Aged Six to Thirteen Months in April 2008 by State
Infants Breastfed Breastfed WIC Infants with
Reported Breastfeeding Duration Region and State
WIC Infants in Age Range
Number Number Percent Number Percent
Median Duration in
Weeks
Mean Duration Within First Six
Months Muscogee Creek Nation (OK) 456 228 50.0 220 96.5 18.0 16.5 Osage Nation (OK) 416 165 39.7 162 98.2 6.0 11.0 Otoe-Missouria (OK) 111 64 57.7 63 98.4 6.0 11.2 Pueblo of Isleta (NM) 139 117 84.2 b b b b Pueblo of San Felipe (NM) 42 37 88.1 37 100.0 9.0 9.3 Pueblo of Zuni (NM) 125 104 83.2 97 93.3 20.0 17.1 Santo Domingo (NM) 36 30 83.3 30 100.0 24.0 16.9 WCD (OK) 564 288 51.1 268 93.1 15.0 14.4
Mountain Plains Iowa 12,999 7,722 59.4 6,814 88.2 14.0 14.4 Kansas 13,534 9,031 66.7 b b b b Missouri 28,978 15,641 54.0 15,432 98.7 6.0 10.7 Montana 3,906 2,886 73.9 b b b b Nebraska 8,757 5,987 68.4 b b b b North Dakota 2,426 1,449 59.7 1,391 96.0 11.0 13.7 South Dakota 3,661 2,142 58.5 b b b b Wyoming 1,982 1,357 68.5 1,279 94.3 10.0 12.7 Cheyenne River Sioux (SD) 102 39 38.2 b b b b Northern Arapahoe (WY) 103 78 75.7 b b b b Omaha Nation (NE) 67 45 67.2 41 91.1 4.0 7.9 Santee Sioux (NE) 11 6 54.5 b b b b Standing Rock Sioux (ND) 117 58 49.6 58 100.0 5.5 9.9 Three Affiliated (ND) 58 31 53.4 b b b b Ute Mountain Ute (CO) 28 25 89.3 23 92.0 7.0 11.4 Winnebago (NE) 33 25 75.8 25 100.0 10.0 12.2 Western American Samoa 803 543 67.6 505 93.0 26.0+ 23.7 Arizona 33,564 21,077 62.8 19,422 92.1 17.0 15.5 Guam 1,310 691 52.7 639 92.5 9.0 12.0 Hawaii 6,908 5,533 80.1 5,060 91.5 13.0 14.3 Nevada 11,649 6,665 57.2 6,439 96.6 24.0 17.2 Oregon 16,706 14,499 86.8 b b b b Washington 29,062 24,273 83.5 22,820 94.0 19.0 15.5 ITC-Nevada 289 157 54.3 154 98.1 26.0+ 19.8
Notes
Percents may not add to 100.0% and subtotals may not add to totals due to rounding and to the use of weights in the case of several State agencies that either under- or over-reported the number of participants. a Includes the 64 State WIC agencies reporting data on breastfeeding initiation for 75 percent or more of all six-to-thirteen-month-old infants and duration data for 75 percent or more of breastfed infants.
Because infants in these states comprise only 58 percent of all infants aged six to thirteen months, duration estimates do not constitute a national estimate. b State agency reported data on 75 percent or more but less than 85 percent of all six- to-thirteen-month-old WIC infants. All available data (including these States) were used to calculate breastfeeding
duration.
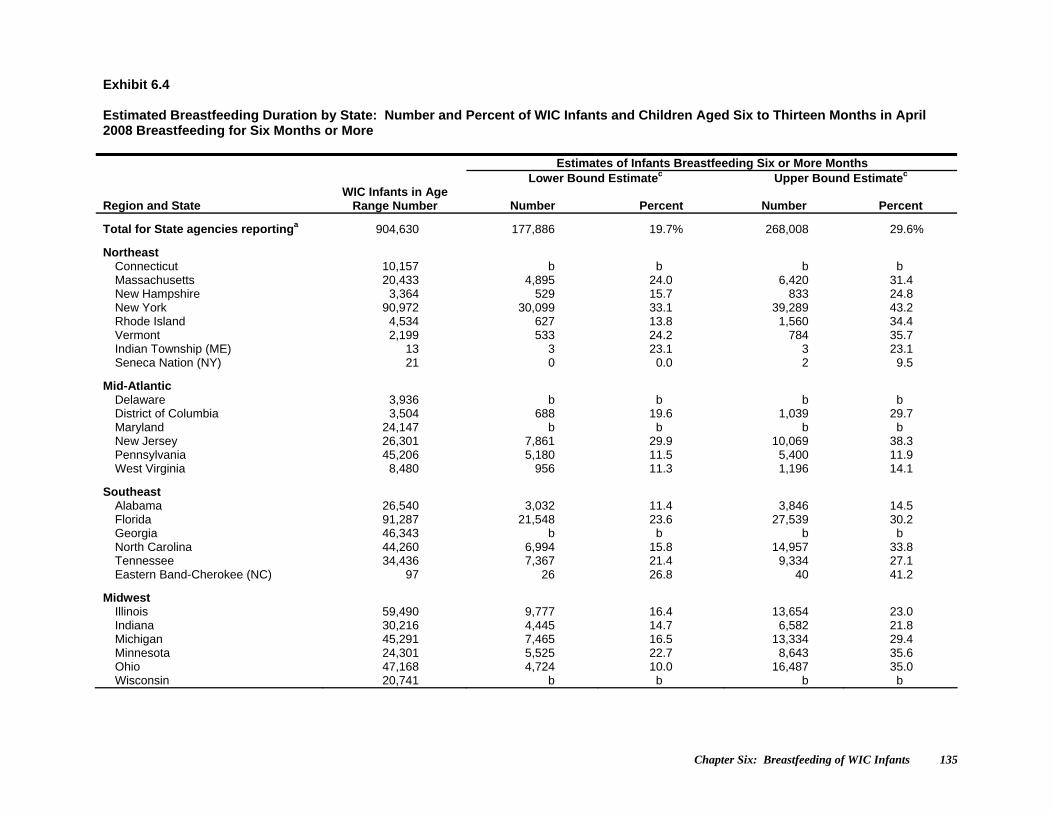
Chapter Six: Breastfeeding of WIC Infants 135
Exhibit 6.4 Estimated Breastfeeding Duration by State: Number and Percent of WIC Infants and Children Aged Six to Thirteen Months in April 2008 Breastfeeding for Six Months or More Estimates of Infants Breastfeeding Six or More Months Lower Bound Estimatec Upper Bound Estimatec
Region and State WIC Infants in Age
Range Number Number Percent Number Percent
Total for State agencies reportinga 904,630 177,886 19.7% 268,008 29.6%
Northeast Connecticut 10,157 b b b b Massachusetts 20,433 4,895 24.0 6,420 31.4 New Hampshire 3,364 529 15.7 833 24.8 New York 90,972 30,099 33.1 39,289 43.2 Rhode Island 4,534 627 13.8 1,560 34.4 Vermont 2,199 533 24.2 784 35.7 Indian Township (ME) 13 3 23.1 3 23.1 Seneca Nation (NY) 21 0 0.0 2 9.5
Mid-Atlantic Delaware 3,936 b b b b District of Columbia 3,504 688 19.6 1,039 29.7 Maryland 24,147 b b b b New Jersey 26,301 7,861 29.9 10,069 38.3 Pennsylvania 45,206 5,180 11.5 5,400 11.9 West Virginia 8,480 956 11.3 1,196 14.1
Southeast Alabama 26,540 3,032 11.4 3,846 14.5 Florida 91,287 21,548 23.6 27,539 30.2 Georgia 46,343 b b b b North Carolina 44,260 6,994 15.8 14,957 33.8 Tennessee 34,436 7,367 21.4 9,334 27.1 Eastern Band-Cherokee (NC) 97 26 26.8 40 41.2
Midwest Illinois 59,490 9,777 16.4 13,654 23.0 Indiana 30,216 4,445 14.7 6,582 21.8 Michigan 45,291 7,465 16.5 13,334 29.4 Minnesota 24,301 5,525 22.7 8,643 35.6 Ohio 47,168 4,724 10.0 16,487 35.0 Wisconsin 20,741 b b b b
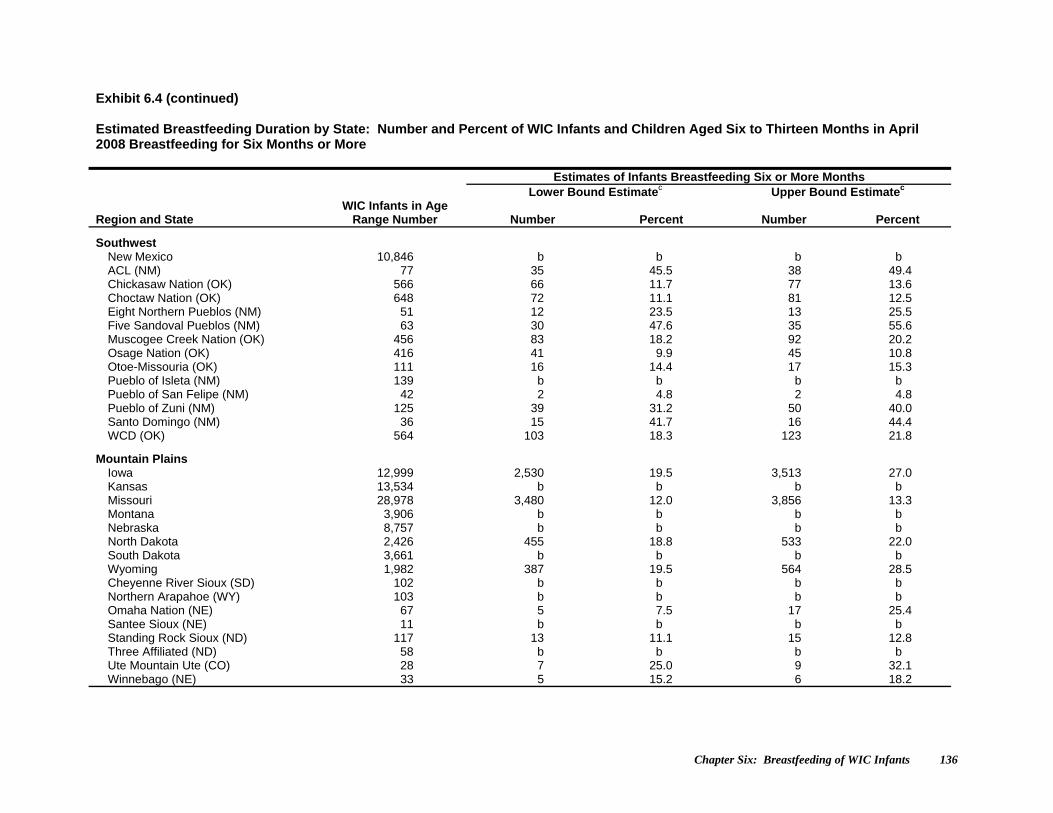
Chapter Six: Breastfeeding of WIC Infants 136
Exhibit 6.4 (continued) Estimated Breastfeeding Duration by State: Number and Percent of WIC Infants and Children Aged Six to Thirteen Months in April 2008 Breastfeeding for Six Months or More Estimates of Infants Breastfeeding Six or More Months Lower Bound Estimatec Upper Bound Estimatec
Region and State WIC Infants in Age
Range Number Number Percent Number Percent
Southwest New Mexico 10,846 b b b b ACL (NM) 77 35 45.5 38 49.4 Chickasaw Nation (OK) 566 66 11.7 77 13.6 Choctaw Nation (OK) 648 72 11.1 81 12.5 Eight Northern Pueblos (NM) 51 12 23.5 13 25.5 Five Sandoval Pueblos (NM) 63 30 47.6 35 55.6 Muscogee Creek Nation (OK) 456 83 18.2 92 20.2 Osage Nation (OK) 416 41 9.9 45 10.8 Otoe-Missouria (OK) 111 16 14.4 17 15.3 Pueblo of Isleta (NM) 139 b b b b Pueblo of San Felipe (NM) 42 2 4.8 2 4.8 Pueblo of Zuni (NM) 125 39 31.2 50 40.0 Santo Domingo (NM) 36 15 41.7 16 44.4 WCD (OK) 564 103 18.3 123 21.8
Mountain Plains Iowa 12,999 2,530 19.5 3,513 27.0 Kansas 13,534 b b b b Missouri 28,978 3,480 12.0 3,856 13.3 Montana 3,906 b b b b Nebraska 8,757 b b b b North Dakota 2,426 455 18.8 533 22.0 South Dakota 3,661 b b b b Wyoming 1,982 387 19.5 564 28.5 Cheyenne River Sioux (SD) 102 b b b b Northern Arapahoe (WY) 103 b b b b Omaha Nation (NE) 67 5 7.5 17 25.4 Santee Sioux (NE) 11 b b b b Standing Rock Sioux (ND) 117 13 11.1 15 12.8 Three Affiliated (ND) 58 b b b b Ute Mountain Ute (CO) 28 7 25.0 9 32.1 Winnebago (NE) 33 5 15.2 6 18.2
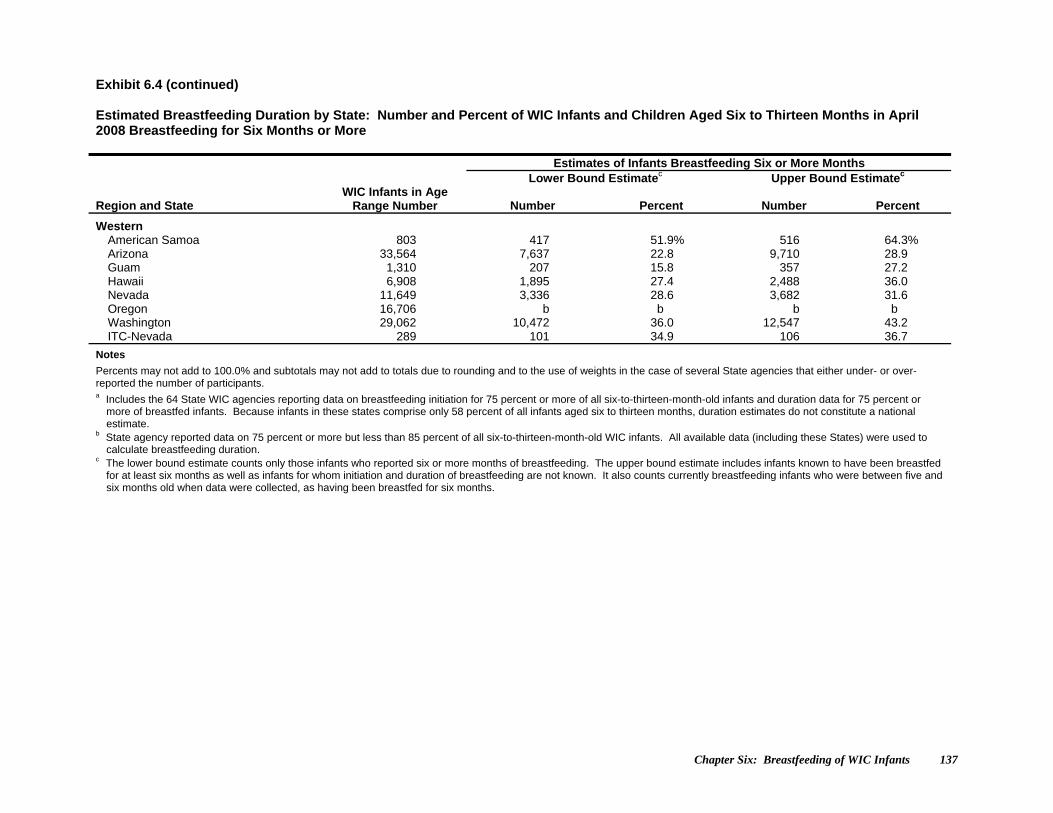
Chapter Six: Breastfeeding of WIC Infants 137
Exhibit 6.4 (continued) Estimated Breastfeeding Duration by State: Number and Percent of WIC Infants and Children Aged Six to Thirteen Months in April 2008 Breastfeeding for Six Months or More Estimates of Infants Breastfeeding Six or More Months Lower Bound Estimatec Upper Bound Estimatec
Region and State WIC Infants in Age
Range Number Number Percent Number Percent
Western American Samoa 803 417 51.9% 516 64.3% Arizona 33,564 7,637 22.8 9,710 28.9 Guam 1,310 207 15.8 357 27.2 Hawaii 6,908 1,895 27.4 2,488 36.0 Nevada 11,649 3,336 28.6 3,682 31.6 Oregon 16,706 b b b b Washington 29,062 10,472 36.0 12,547 43.2 ITC-Nevada 289 101 34.9 106 36.7
Notes
Percents may not add to 100.0% and subtotals may not add to totals due to rounding and to the use of weights in the case of several State agencies that either under- or over-reported the number of participants. a Includes the 64 State WIC agencies reporting data on breastfeeding initiation for 75 percent or more of all six-to-thirteen-month-old infants and duration data for 75 percent or
more of breastfed infants. Because infants in these states comprise only 58 percent of all infants aged six to thirteen months, duration estimates do not constitute a national estimate.
b State agency reported data on 75 percent or more but less than 85 percent of all six-to-thirteen-month-old WIC infants. All available data (including these States) were used to calculate breastfeeding duration.
c The lower bound estimate counts only those infants who reported six or more months of breastfeeding. The upper bound estimate includes infants known to have been breastfed for at least six months as well as infants for whom initiation and duration of breastfeeding are not known. It also counts currently breastfeeding infants who were between five and six months old when data were collected, as having been breastfed for six months.
Chapter Six: Breastfeeding of WIC Infants 138
The breastfeeding duration data are “right censored,” that is, we do not know the full duration for infants who were still breastfeeding when data were collected. Calculating an arithmetic mean of reported duration for both current and ever-breastfed infants would underestimate the duration for those infants currently breastfed. Instead, information on duration is summarized in three statistics that are virtually unaffected by this limitation. First, the median duration is calculated by State as well as for all reporting States combined. Breastfeeding data are collected for infants who are at least six months (26 weeks) old, so breastfeeding status is known for practically all of them through age 26 weeks. For some infants, the most recent data collection may have occurred before they were 26 weeks old but while they were still breastfeeding. This timing does not pose a problem. This is because in nearly all reporting States at the time of data collection, half or more of ever-breastfed infants had stopped breastfeeding. Median duration in nearly all (42) States is 26 weeks or less. In the six remaining States, we know the median duration is greater than 26 weeks, but we cannot measure this duration.7 Therefore, we report median duration as more than 26 (26+) weeks. Second, the mean duration during the first six months is calculated—a value that is known for all infants whose data were collected at age six months or later, regardless of current breastfeeding status. Finally, the percent who breastfed six months or more is examined (Exhibit 6.4). This measure is of special interest because of the health benefits that accrue to infants who are breastfed for at least six months. Across the 64 States reporting data, the median duration of breastfeeding is 13 weeks. Again, substantial variation exists among States. In 16 States, the median was less than ten weeks. In another 20 States, the median was between 10 and 19 weeks. Twelve agencies reported median breastfeeding duration of 20 weeks or more. Medians are not presented for the 16 States that were unable to provide duration data on at least 85 percent of breastfed infants. Exhibit 6.4 attempts to deal with the missing data on initiation and duration of breastfeeding by estimating lower and upper bounds for the percentage of infants and children breastfed for six or more months. The lower bound estimate counts in the numerator only those infants for whom six or more months of breastfeeding was reported. Breastfed infants for whom initiation or duration information is missing are assumed to have been breastfed for less than six months. The upper bound estimates include infants known to have been breastfed for at least six months as well as infants for whom initiation and duration of breastfeeding are not known.8 Across the 64 State WIC agencies reporting breastfeeding duration data, the proportion of infants and children breastfed for six or more months ranges from a lower bound estimate of 19.7 percent to an upper bound estimate of 29.6 percent.
7 Median duration in the 16 State agencies included in, but not displayed individually in, Exhibits 6.3 and 6.4 is not greater than 26 weeks. 8 Only States reporting data for at least 75 percent of six-to-thirteen month old infants and children are included in the upper and lower bound estimates. The range between the upper and lower bounds reflects missing data on breastfeeding initiation and duration. The upper bound also counts “currently” breastfeeding infants and children, who were between five and six months old when data were collected, as having been breastfed for at least six months.
Chapter Seven: Characteristics of Migrant WIC Participants 139
7. CHARACTERISTICS OF MIGRANT WIC PARTICIPANTS Federal regulations define a migrant farmworker as an individual whose principal employment is in agriculture on a seasonal basis, who has been so employed within the last twenty-four months, and who establishes, for the purposes of such employment, a temporary abode. As part of the Minimum Data Set, States are required to report migrant status for all individuals enrolled in the WIC Program. In April 2008, State WIC agencies reported 42,477 individuals as members of migrant farmworker families. This group accounted for less than half of 1 percent of the country’s 9.5 million WIC participants. Similar proportions of migrant WIC enrollees have been reported since 1992. Migrant participation in the WIC Program has tended to be concentrated in a small number of States. In 2008, 63 percent of migrant WIC participants were from four states: California, Florida, New York and Texas (Exhibit 7.1).1 The distribution of migrant WIC participants by State is presented in Appendix D. Migrant status data were missing for 1.5 percent of the entire WIC population in 2008. This includes the two State agencies that were unable to provide data on migrant status in their PC2008 reporting, Oregon and the Northern Mariana Islands. Migrant WIC participants do not differ greatly as a group from other WIC participants. A greater proportion of them are women (29 percent versus 25 percent), and a smaller proportion are infants (21 percent versus 25.5 percent), than among non-migrants. The proportion of migrant WIC children is comparable to the non-migrant WIC children (both at 49.5 percent). The age composition of migrant WIC women at certification is similar to non-migrant WIC women. Similar to the national trend of an increase in the enrollment of breastfeeding women, the percentage of breastfeeding migrant WIC women grew from 4.1 percent of all migrant WIC participants in 1992 to 12.2 percent of migrant WIC participants in 2008. (Calculated from numbers in Exhibit 7.2). Information in that exhibit also indicates that there is a slightly higher percentage of three and four year old children among migrant WIC participants (40.7 percent) than in the general child WIC population (37.9 percent). As with the total WIC population, a high proportion of migrant infants (91.2 percent) enrolled in WIC between zero and three months of age. The distribution of pregnant migrant WIC women by trimester of enrollment paralleled the distribution of pregnant US WIC women. Almost half of migrant prenatal clients (47.7 percent) enrolled in WIC during the first trimester; another 41.8 percent enrolled during the second trimester, and 9.7 percent enrolled in the third trimester (Exhibit 7.3). These percentages are comparable to figures reported in 2006. Migrant WIC enrollees displayed a level of participation in other social support programs that was slightly lower than participation observed in US WIC. (See Exhibit 7.4 and also refer to Exhibit 3.1.) These findings may underestimate participation in TANF, Food Stamp, and Medicaid Programs because of several factors. First, the information was recorded at certification. Staff at local WIC service sites refer WIC enrollees to other programs, and any enrollment subsequent to certification was not
1 In 2006, New York reported a large increase in migrant WIC participants, which increased its share of the national total from 3.4 percent in 2004 to 10.5 percent in 2006. This change was attributed to a large percentage of unreported migrant status prior to August, 2005 when migrant status became a mandatory variable in the New York WIC Program system. In 2008, the share of migrant WIC participants in New York was similar at 10.7 percent.
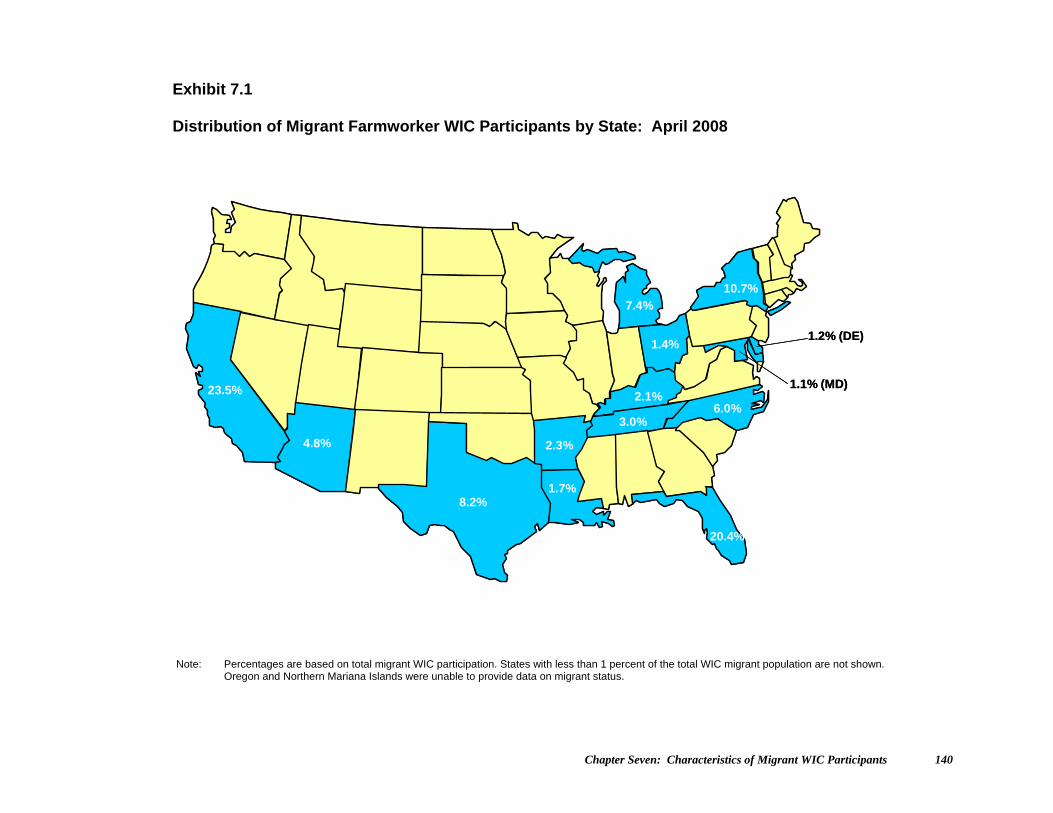
Chapter Seven: Characteristics of Migrant WIC Participants 140
Exhibit 7.1 Distribution of Migrant Farmworker WIC Participants by State: April 2008
Note: Percentages are based on total migrant WIC participation. States with less than 1 percent of the total WIC migrant population are not shown. Oregon and Northern Mariana Islands were unable to provide data on migrant status.
23.5%
8.2%
2.3%
20.4%
6.0%
10.7%
7.4%
4.8%
2.1%
3.0%
1.4%
1.7%
1.1% (MD)
1.2% (DE)
23.5%
8.2%
2.3%
20.4%
6.0%
10.7%
7.4%
4.8%
2.1%
3.0%
1.4%
1.7%
1.1% (MD)
1.2% (DE)
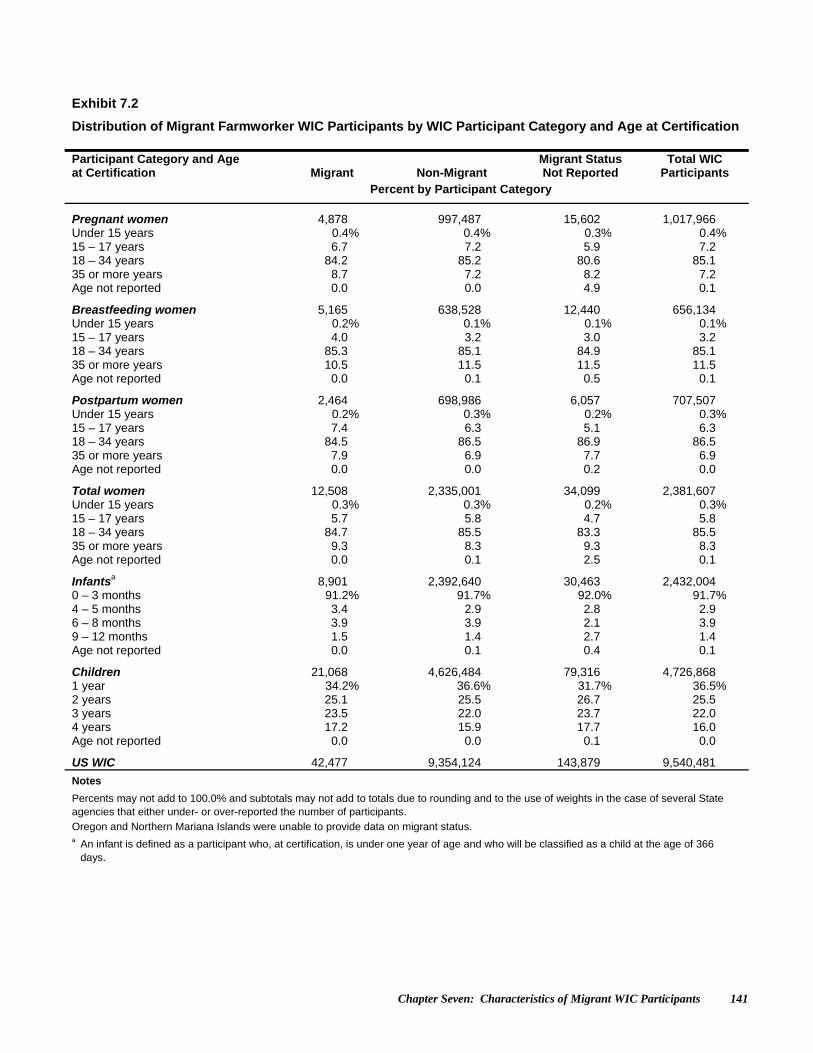
Chapter Seven: Characteristics of Migrant WIC Participants 141
Exhibit 7.2
Distribution of Migrant Farmworker WIC Participants by WIC Participant Category and Age at Certification Participant Category and Age at Certification Migrant Non-Migrant
Migrant Status Not Reported
Total WIC Participants
Percent by Participant Category
Pregnant women 4,878 997,487 15,602 1,017,966 Under 15 years 0.4% 0.4% 0.3% 0.4% 15 – 17 years 6.7 7.2 5.9 7.2 18 – 34 years 84.2 85.2 80.6 85.1 35 or more years 8.7 7.2 8.2 7.2 Age not reported 0.0 0.0 4.9 0.1
Breastfeeding women 5,165 638,528 12,440 656,134 Under 15 years 0.2% 0.1% 0.1% 0.1% 15 – 17 years 4.0 3.2 3.0 3.2 18 – 34 years 85.3 85.1 84.9 85.1 35 or more years 10.5 11.5 11.5 11.5 Age not reported 0.0 0.1 0.5 0.1
Postpartum women 2,464 698,986 6,057 707,507 Under 15 years 0.2% 0.3% 0.2% 0.3% 15 – 17 years 7.4 6.3 5.1 6.3 18 – 34 years 84.5 86.5 86.9 86.5 35 or more years 7.9 6.9 7.7 6.9 Age not reported 0.0 0.0 0.2 0.0
Total women 12,508 2,335,001 34,099 2,381,607 Under 15 years 0.3% 0.3% 0.2% 0.3% 15 – 17 years 5.7 5.8 4.7 5.8 18 – 34 years 84.7 85.5 83.3 85.5 35 or more years 9.3 8.3 9.3 8.3 Age not reported 0.0 0.1 2.5 0.1
Infantsa 8,901 2,392,640 30,463 2,432,004 0 – 3 months 91.2% 91.7% 92.0% 91.7% 4 – 5 months 3.4 2.9 2.8 2.9 6 – 8 months 3.9 3.9 2.1 3.9 9 – 12 months 1.5 1.4 2.7 1.4 Age not reported 0.0 0.1 0.4 0.1
Children 21,068 4,626,484 79,316 4,726,868 1 year 34.2% 36.6% 31.7% 36.5% 2 years 25.1 25.5 26.7 25.5 3 years 23.5 22.0 23.7 22.0 4 years 17.2 15.9 17.7 16.0 Age not reported 0.0 0.0 0.1 0.0
US WIC 42,477 9,354,124 143,879 9,540,481
Notes
Percents may not add to 100.0% and subtotals may not add to totals due to rounding and to the use of weights in the case of several State agencies that either under- or over-reported the number of participants.
Oregon and Northern Mariana Islands were unable to provide data on migrant status. a An infant is defined as a participant who, at certification, is under one year of age and who will be classified as a child at the age of 366
days.
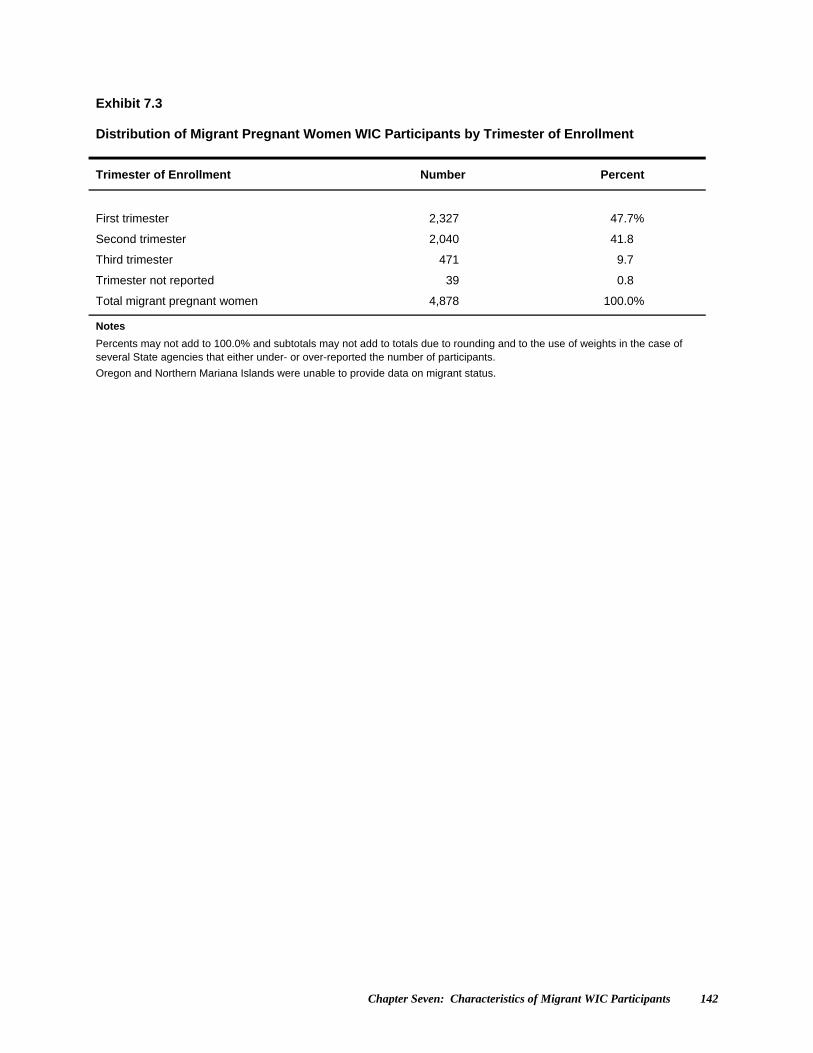
Chapter Seven: Characteristics of Migrant WIC Participants 142
Exhibit 7.3 Distribution of Migrant Pregnant Women WIC Participants by Trimester of Enrollment
Trimester of Enrollment Number Percent
First trimester 2,327 47.7%
Second trimester 2,040 41.8
Third trimester 471 9.7
Trimester not reported 39 0.8
Total migrant pregnant women 4,878 100.0%
Notes
Percents may not add to 100.0% and subtotals may not add to totals due to rounding and to the use of weights in the case of several State agencies that either under- or over-reported the number of participants.
Oregon and Northern Mariana Islands were unable to provide data on migrant status.
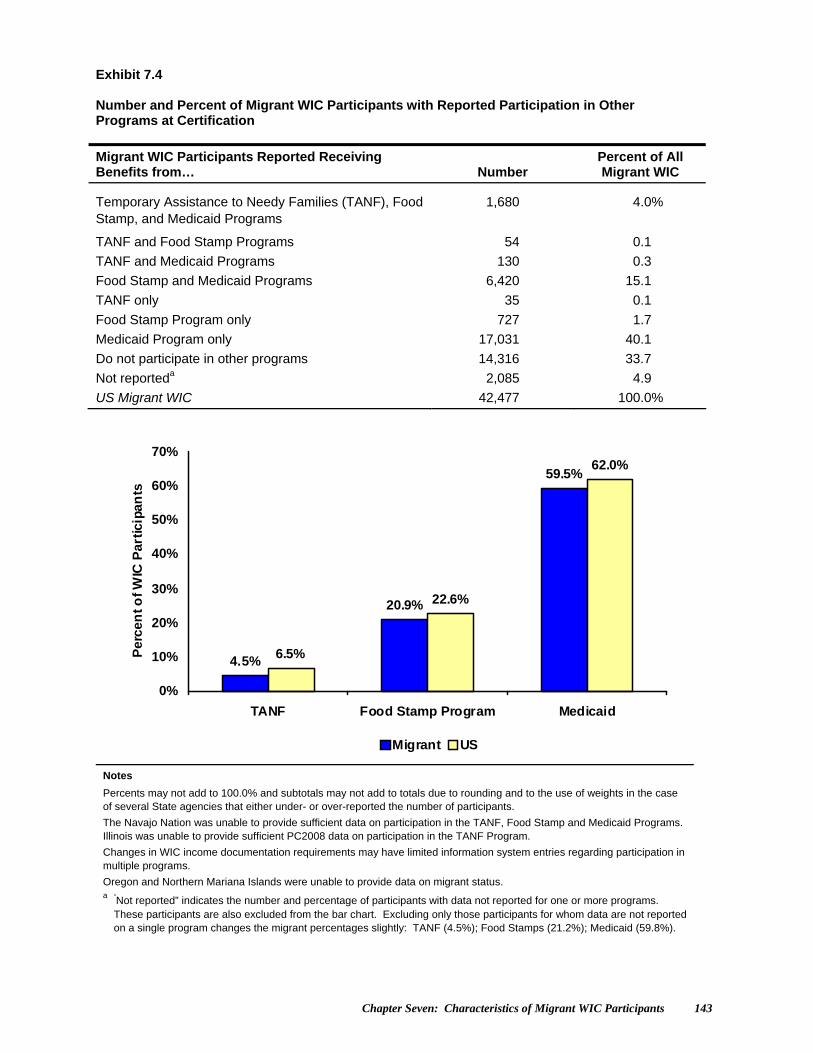
Chapter Seven: Characteristics of Migrant WIC Participants 143
Exhibit 7.4 Number and Percent of Migrant WIC Participants with Reported Participation in Other Programs at Certification
Migrant WIC Participants Reported Receiving Benefits from… Number
Percent of All Migrant WIC
Temporary Assistance to Needy Families (TANF), Food Stamp, and Medicaid Programs
1,680 4.0%
TANF and Food Stamp Programs 54 0.1
TANF and Medicaid Programs 130 0.3
Food Stamp and Medicaid Programs 6,420 15.1
TANF only 35 0.1
Food Stamp Program only 727 1.7
Medicaid Program only 17,031 40.1
Do not participate in other programs 14,316 33.7
Not reporteda 2,085 4.9
US Migrant WIC 42,477 100.0%
4.5%
20.9%
59.5%
6.5%
22.6%
62.0%
0%
10%
20%
30%
40%
50%
60%
70%
TANF Food Stamp Program Medicaid
Per
cen
t of W
IC P
arti
cipa
nts
Migrant US
Notes
Percents may not add to 100.0% and subtotals may not add to totals due to rounding and to the use of weights in the case of several State agencies that either under- or over-reported the number of participants.
The Navajo Nation was unable to provide sufficient data on participation in the TANF, Food Stamp and Medicaid Programs. Illinois was unable to provide sufficient PC2008 data on participation in the TANF Program.
Changes in WIC income documentation requirements may have limited information system entries regarding participation in multiple programs.
Oregon and Northern Mariana Islands were unable to provide data on migrant status. a “Not reported” indicates the number and percentage of participants with data not reported for one or more programs.
These participants are also excluded from the bar chart. Excluding only those participants for whom data are not reported on a single program changes the migrant percentages slightly: TANF (4.5%); Food Stamps (21.2%); Medicaid (59.8%).
Chapter Seven: Characteristics of Migrant WIC Participants 144
captured in the estimates presented here. In addition, data on participation in other programs were not reported for 4.9 percent of migrant WIC enrollees. Finally, constraints in various WIC management information systems as well as required procedures for documenting income and participation in other programs, may have limited the number of programs entered into computer systems by local WIC staff. Consistent with previous PC reporting, migrant WIC enrollees reported slightly lower average family incomes than their non-migrant counterparts in 2008, a discrepancy of 2.1 percent (Exhibit 7.5, $16,191 versus $16,529). The gap between migrant and non-migrant mean incomes has decreased substantially since 1994, when the difference was 20 percent.2 Since 2006, the average income for migrant WIC enrollees has grown by 6.6 percent (from $15,192 to $16,191), similar to the 6.1 percent increase in average income for non-migrant WIC enrollees. Despite their near parity in average income, a substantially larger percentage of migrant WIC participants in 2008 (68.8 percent) were at or below 100 percent of the US poverty thresholdas compared with 60.8 percent of non-migrant WIC participants (Exhibit 7.6). In general, the distribution of nutritional risks for migrant WIC resembled the distribution reported for US WIC. (Compare Exhibits 7.7 and 7.8 with Exhibits 4.6, 4.7, and 4.8.) One exception is that substance abuse was reported less frequently for migrant pregnant women than for the total pregnant WIC population3.9 percent for migrants versus 13.5 percent for US WIC pregnant women. Another exception is that migrant WIC women across all categories were less likely to have nutrition-related risk conditions than non-migrant women in general (8.3 percent versus 18.5 percent). Also, infant of a WIC eligible mother or mother at risk during pregnancy risk was reported less frequently for migrant infants (77.2 percent) than for the total infant WIC population (83.2 percent). The most notable difference between migrant WIC enrollees and the overall WIC population was in the frequency of reporting the homelessness/ migrancy risk: 38.1 percent for migrants and 0.3 percent for overall WIC. By definition, all migrants experience this risk so that the reported frequency is not substantially meaningful. Variations can mostly be explained by changes and idiosyncrasies in reporting policies. Beginning in 2006, the maximum number of nutrition risks that could be reported by States increased from 3 to 10, which allowed States to record nutrition risks that are lower in priority, including homelessness/migrancy. The percentage of migrant WIC participants reporting more than one nutritional risk was 67.3 percent in 2008.3 For the US WIC population at large, the percentage of multiple nutritional risk reporting was substantially lower48.9 percent in 2008. Migrant WIC participants showed somewhat higher rates of anemia than non-migrant participants. Over one quarter (27.8 percent) of migrant women was in this category as compared with 23.3 percent of all WIC women. The difference for WIC children was smaller12.9 percent of migrant WIC children versus 11.3 percent of all WIC
2 The gap between migrant and non-migrant income decreased fairly steadily between 1994 and 2004. In 1996, non-migrant income was 12 percent higher than migrant income. The gap was 6 percent in 1998, and 8 percent in 2000 and 2002. The income and poverty distribution data among migrants must be treated somewhat cautiously in 1998 because of problems with missing income data in Texas. In 1998, almost 17 percent of all WIC migrants were enrolled in Texas, and income data were missing for approximately 78 percent of migrant WIC participants in the State. 3 Migrant WIC statistics from special tabulations not presented here. See Exhibit 4.2 for US WIC.
Chapter Seven: Characteristics of Migrant WIC Participants 145
Exhibit 7.5 Mean and Median Annualized Family or Economic Unit Income of WIC Participants by Participant Category and Migrant Status Pregnant
Women Breastfeeding
Women Postpartum
Women Total Women Infants Children Total WIC
Migrant Farmworkers 4,878 5,165 2,464 12,508 8,901 21,068 42,477 Average (mean) income $15,941 $16,438 $15,551 $16,072 $15,756 $16,436 $16,191 Median income $15,366 $15,600 $14,616 $15,600 $14,560 $15,600 $15,480 Percent with income reported 91.0% 91.9% 89.8% 91.2% 89.1% 93.3% 91.8% Percent with income reported as zeroa 2.6 2.9 1.6 2.5 1.9 0.8 1.5 Percent with income not reportedb 6.4 5.1 8.6 6.3 9.0 5.9 6.7 Non-migrants 997,487 638,528 698,986 2,335,001 2,392,640 4,626,484 9,354,124 Average (mean) income $15,754 $17,505 $14,620 $15,916 $15,663 $17,269 $16,529 Median income $14,448 $16,200 $12,996 $14,560 $14,400 $15,600 $15,221 Percent with income reported 89.5% 91.7% 86.9% 89.3% 87.1% 90.0% 89.1% Percent with income reported as zeroa 1.2 0.9 1.0 1.1 1.3 0.6 0.9 Percent with income not reportedb 9.3 7.3 12.2 9.6 11.6 9.4 10.0 Migrant status not reported 15,602 12,440 6,057 34,099 30,463 79,316 143,879 Average (mean) income $15,471 $17,166 $14,334 $15,896 $15,801 $18,025 $17,051 Median income $14,400 $15,600 $12,600 $14,400 $14,400 $16,224 $15,600 Percent with income reported 92.5% 96.4% 96.1% 94.6% 95.4% 95.2% 95.1% Percent with income reported as zeroa 0.0 0.0 0.1 0.0 0.1 0.0 0.0 Percent with income not reportedb 7.5 3.6 3.8 5.4 4.5 4.7 4.8 US WIC 1,017,966 656,134 707,507 2,381,607 2,432,004 4,726,868 9,540,481
Notes
Percents may not add to 100.0% and subtotals may not add to totals due to rounding and to the use of weights in the case of several State agencies that either under- or over-reported the number of participants.
State and local WIC agencies may collect data on weekly, monthly, or annual incomes. For reporting and analysis, annualized incomes have been computed. Also note that income calculations include only those participants for whom State agencies reported data on income, income period, and size of economic unit. In 2008, a State WIC agency could report actual income or could report an income range. Both types of data are included in the calculations of mean and median incomes.
Oregon and Northern Mariana Islands were unable to provide data on migrant status. a Zero incomes are reported separately and excluded from these mean and median calculations. In some reporting agencies, zero may be used to indicate missing information or adjunctive
eligibility. PC2008 cannot distinguish between households with missing income information and households reporting zero income. b Not reported indicates the percentage of participants by participant category for whom no data on income, income period, or size of economic unit are reported. They are excluded from mean
and median calculations.
Chapter Seven: Characteristics of Migrant WIC Participants 146
Exhibit 7.6 Distribution of Percent of Poverty Level of WIC Participants by Participant Category and Migrant Status Percent of Poverty Level
Pregnant Women
Breastfeeding Women
Postpartum Women
Total Women Infants Children
Total Participants
Percent
Cumulative Percent Percent
Cumulative Percent Percent
Cumulative Percent Percent
Cumulative Percent Percent
Cumulative Percent Percent
Cumulative Percent Percent
Cumulative Percent
Percent by Participant Category
Migrant
0 – 50 25.1% 25.1% 24.3% 24.3% 29.0% 29.0% 25.6% 25.6% 28.8% 28.8% 29.0% 29.0% 27.9% 27.9%
51 – 100 41.2 66.3 43.4 67.8 37.3 66.3 41.3 66.9 37.7 66.5 41.9 70.9 40.9 68.8
101 – 130 13.7 79.9 14.6 82.4 13.4 79.7 14.0 80.9 12.5 79.0 12.9 83.8 13.1 81.9
131 – 150 4.8 84.7 4.8 87.2 4.5 84.1 4.7 85.6 4.3 83.3 4.2 88.0 4.4 86.3
151 – 185 5.2 90.0 4.2 91.3 4.8 88.9 4.7 90.3 4.9 88.1 4.4 92.4 4.6 90.9
186 – 200 0.4 90.4 0.2 91.5 0.3 89.2 0.3 90.6 0.3 88.4 0.4 92.7 0.3 91.2
201 – 225 0.3 90.7 0.2 91.7 0.4 89.5 0.3 90.9 0.2 88.7 0.2 93.0 0.2 91.5
226 – 250 0.2 90.9 0.1 91.8 0.0 89.6 0.1 91.0 0.1 88.8 0.1 93.1 0.1 91.6
Over 250 0.2 91.0 0.2 91.9 0.2 89.8 0.2 91.2 0.3 89.1 0.2 93.3 0.2 91.8
Income reported as zeroa
2.6 93.6 2.9 94.9 1.6 91.4 2.5 93.7 1.9 91.0 0.8 94.1 1.5 93.3
Not reportedb 6.4 100.0% 5.1 100.0% 8.6 100.0% 6.3 100.0% 9.0 100.0% 5.9 100.0% 6.7 100.0%
Total migrant WIC 4,878 5,165 2,464 12,508 8,901 21,068 42,477
Non-Migrant
0 – 50 29.2 29.2 25.5 25.5 35.1 35.1 30.0 30.0 31.6 31.6 28.4 28.4 29.6 29.6
51 – 100 30.3 59.5 34.5 60.0 27.7 62.7 30.7 60.6 29.2 60.7 32.4 60.8 31.2 60.8
101 – 130 13.7 73.2 15.3 75.3 11.4 74.2 13.5 74.1 12.5 73.2 13.7 74.6 13.4 74.1
131 – 150 6.4 79.7 6.7 82.0 5.2 79.3 6.1 80.2 5.6 78.8 6.2 80.8 6.1 80.2
151 – 185 8.3 87.9 8.2 90.3 6.2 85.5 7.6 87.8 6.8 85.7 7.6 88.5 7.4 87.6
186 – 200 0.5 88.5 0.5 90.8 0.4 85.9 0.5 88.3 0.4 86.1 0.5 89.0 0.5 88.1
201 – 225 0.5 89.0 0.4 91.2 0.4 86.3 0.4 88.8 0.4 86.5 0.4 89.4 0.4 88.5
226 – 250 0.3 89.2 0.2 91.4 0.2 86.5 0.2 89.0 0.2 86.8 0.2 89.7 0.2 88.8
Over 250 0.3 89.5 0.3 91.7 0.3 86.9 0.3 89.3 0.3 87.1 0.3 90.0 0.3 89.1
Income reported as zeroa
1.2 90.7 0.9 92.7 1.0 87.8 1.1 90.4 1.3 88.4 0.6 90.6 0.9 90.0
Not reportedb 9.3 100.0% 7.3 100.0% 12.2 100.0% 9.6 100.0% 11.6 100.0% 9.4 100.0% 10.0 100.00%
Total non-migrant WIC 997,487 638,528 698,986 2,335,001 2,392,640 4,626,484 9,354,124
Chapter Seven: Characteristics of Migrant WIC Participants 147
Exhibit 7.6 (continued) Distribution of Percent of Poverty Level of WIC Participants by Participant Category and Migrant Status Percent of Poverty Level
Pregnant Women
Breastfeeding Women
Postpartum Women
Total Women Infants Children
Total Participants
Percent
Cumulative Percent Percent
Cumulative Percent Percent
Cumulative Percent Percent
Cumulative Percent Percent
Cumulative Percent Percent
Cumulative Percent Percent
Cumulative Percent
Percent by Participant Category
Migrant status not reported
0 – 50 35.0% 35.0% 32.2% 32.2% 40.9% 40.9% 35.0% 35.0% 36.5% 36.5% 29.4% 29.4% 32.2% 32.2%
51 – 100 30.8 65.7 33.1 65.3 29.4 70.3 31.4 66.4 30.6 67.1 35.1 64.5 33.3 65.5
101 – 130 13.3 79.0 14.7 80.0 12.3 82.6 13.6 80.0 13.3 80.4 14.6 79.1 14.1 79.6
131 – 150 6.0 85.0 7.0 87.0 5.5 88.1 6.3 86.3 6.2 86.6 6.5 85.6 6.4 86.0
151 – 185 6.3 91.3 7.9 94.9 6.7 94.8 7.0 93.2 7.1 93.7 7.8 93.5 7.5 93.5
186 – 200 0.5 91.7 0.7 95.6 0.3 95.1 0.5 93.7 0.6 94.3 0.7 94.2 0.6 94.1
201 – 225 0.4 92.1 0.4 95.9 0.4 95.5 0.4 94.1 0.4 94.7 0.5 94.6 0.4 94.5
226 – 250 0.2 92.3 0.3 96.2 0.2 95.7 0.2 94.3 0.3 95.0 0.2 94.9 0.2 94.8
Over 250 0.2 92.5 0.2 96.4 0.4 96.1 0.3 94.6 0.4 95.4 0.4 95.2 0.3 95.1
Income reported as zeroa
0.0 92.5 0.0 96.4 0.1 96.2 0.0 94.6 0.1 95.5 0.0 95.3 0.0 95.2
Not reportedb 7.5 100.0% 3.6 100.0% 3.8 100.0% 5.4 100.0% 4.5 100.0% 4.7 100.0% 4.8 100.0%
Total migrant status not reported WIC 15,602 12,440 6,057 34,099 30,463 79,316 143,879
Notes
Percents may not add to 100.0% and subtotals may not add to totals due to rounding and to the use of weights in the case of several State agencies that either under- or over-reported the number of participants. Poverty level calculations are based on income, income period, and household size as reported by State WIC agencies. Oregon and Northern Mariana Islands were unable to provide data on migrant status. a Zero incomes are reported separately and excluded from these income calculations. In some reporting agencies, zero may be used to indicate missing information or adjunctive eligibility. PC2008 cannot,
therefore, distinguish between households with missing income information and households reporting zero income. b Not reported indicates the percentage of participants by participant category for whom no data on income, income period, or size of economic unit are reported. They are excluded from mean and median
calculations.
Chapter Seven: Characteristics of Migrant WIC Participants 148
Exhibit 7.7 Nutritional Risks Reported in at Least 15 Percent of Migrant Farmworker WIC Participants by Participant Category
Participant Category and Type of Risk Percent
Pregnant Women 4,878 Failure to meet Dietary Guidelines for Americans 21.5% General obstetrical risks 32.7 High weight for height 42.4 Homelessness/Migrancy 41.8 Inappropriate growth or weight gain pattern 34.2 Inappropriate nutrition practices 33.0
Breastfeeding Women 5,165 Breastfeeding mother/infant dyad 40.9% Failure to meet Dietary Guidelines for Americans 22.7 General obstetrical risks 26.0 Hematocrit or hemoglobin below State standard 36.3 High weight for height 50.2 Homelessness/Migrancy 45.1 Inappropriate growth or weight gain pattern 24.1 Inappropriate nutrition practices 23.2
Postpartum Women 2,464 Failure to meet Dietary Guidelines for Americans 21.3% General obstetrical risks 28.1 Hematocrit or hemoglobin below State standard 37.4 High weight for height 47.6 Homelessness/Migrancy 33.9 Inappropriate growth or weight gain pattern 24.9 Inappropriate nutrition practices 29.4
Infants 8,901 Homelessness/Migrancy 34.8% Inappropriate nutrition practices 26.1 Infant of a WIC-eligible mother or mother at risk during pregnancy 77.2
Children 21,068 Failure to meet Dietary Guidelines for Americans 20.4% High weight for height 27.5 Homelessness/Migrancy 37.5 Inappropriate nutrition practices 54.9
Total Migrant WIC 42,477 Notes
Percents may not add to 100.0% and subtotals may not add to totals due to rounding and to the use of weights in the case of several State agencies that either under- or over-reported the number of participants.
Each risk shown represents 15 percent or more of all migrant WIC participants in the participant category.
Oregon and Northern Mariana Islands were unable to provide data on migrant status.
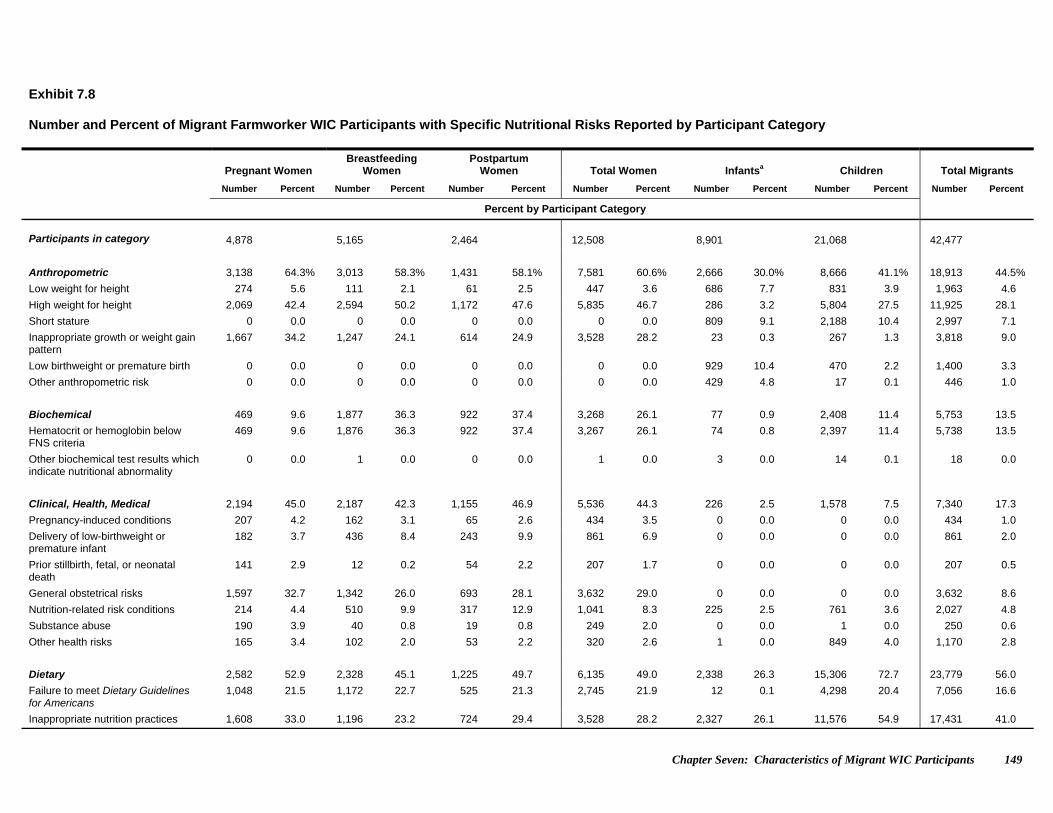
Chapter Seven: Characteristics of Migrant WIC Participants 149
Exhibit 7.8 Number and Percent of Migrant Farmworker WIC Participants with Specific Nutritional Risks Reported by Participant Category
Pregnant Women Breastfeeding
Women Postpartum
Women Total Women Infantsa Children Total Migrants
Number Percent Number Percent Number Percent Number Percent Number Percent Number Percent Number Percent
Percent by Participant Category
Participants in category 4,878 5,165 2,464 12,508 8,901 21,068 42,477
Anthropometric 3,138 64.3% 3,013 58.3% 1,431 58.1% 7,581 60.6% 2,666 30.0% 8,666 41.1% 18,913 44.5%
Low weight for height 274 5.6 111 2.1 61 2.5 447 3.6 686 7.7 831 3.9 1,963 4.6
High weight for height 2,069 42.4 2,594 50.2 1,172 47.6 5,835 46.7 286 3.2 5,804 27.5 11,925 28.1
Short stature 0 0.0 0 0.0 0 0.0 0 0.0 809 9.1 2,188 10.4 2,997 7.1
Inappropriate growth or weight gain pattern
1,667 34.2 1,247 24.1 614 24.9 3,528 28.2 23 0.3 267 1.3 3,818 9.0
Low birthweight or premature birth 0 0.0 0 0.0 0 0.0 0 0.0 929 10.4 470 2.2 1,400 3.3
Other anthropometric risk 0 0.0 0 0.0 0 0.0 0 0.0 429 4.8 17 0.1 446 1.0
Biochemical 469 9.6 1,877 36.3 922 37.4 3,268 26.1 77 0.9 2,408 11.4 5,753 13.5
Hematocrit or hemoglobin below FNS criteria
469 9.6 1,876 36.3 922 37.4 3,267 26.1 74 0.8 2,397 11.4 5,738 13.5
Other biochemical test results which indicate nutritional abnormality
0 0.0 1 0.0 0 0.0 1 0.0 3 0.0 14 0.1 18 0.0
Clinical, Health, Medical 2,194 45.0 2,187 42.3 1,155 46.9 5,536 44.3 226 2.5 1,578 7.5 7,340 17.3
Pregnancy-induced conditions 207 4.2 162 3.1 65 2.6 434 3.5 0 0.0 0 0.0 434 1.0
Delivery of low-birthweight or premature infant
182 3.7 436 8.4 243 9.9 861 6.9 0 0.0 0 0.0 861 2.0
Prior stillbirth, fetal, or neonatal death
141 2.9 12 0.2 54 2.2 207 1.7 0 0.0 0 0.0 207 0.5
General obstetrical risks 1,597 32.7 1,342 26.0 693 28.1 3,632 29.0 0 0.0 0 0.0 3,632 8.6
Nutrition-related risk conditions 214 4.4 510 9.9 317 12.9 1,041 8.3 225 2.5 761 3.6 2,027 4.8
Substance abuse 190 3.9 40 0.8 19 0.8 249 2.0 0 0.0 1 0.0 250 0.6
Other health risks 165 3.4 102 2.0 53 2.2 320 2.6 1 0.0 849 4.0 1,170 2.8
Dietary 2,582 52.9 2,328 45.1 1,225 49.7 6,135 49.0 2,338 26.3 15,306 72.7 23,779 56.0
Failure to meet Dietary Guidelines for Americans
1,048 21.5 1,172 22.7 525 21.3 2,745 21.9 12 0.1 4,298 20.4 7,056 16.6
Inappropriate nutrition practices 1,608 33.0 1,196 23.2 724 29.4 3,528 28.2 2,327 26.1 11,576 54.9 17,431 41.0
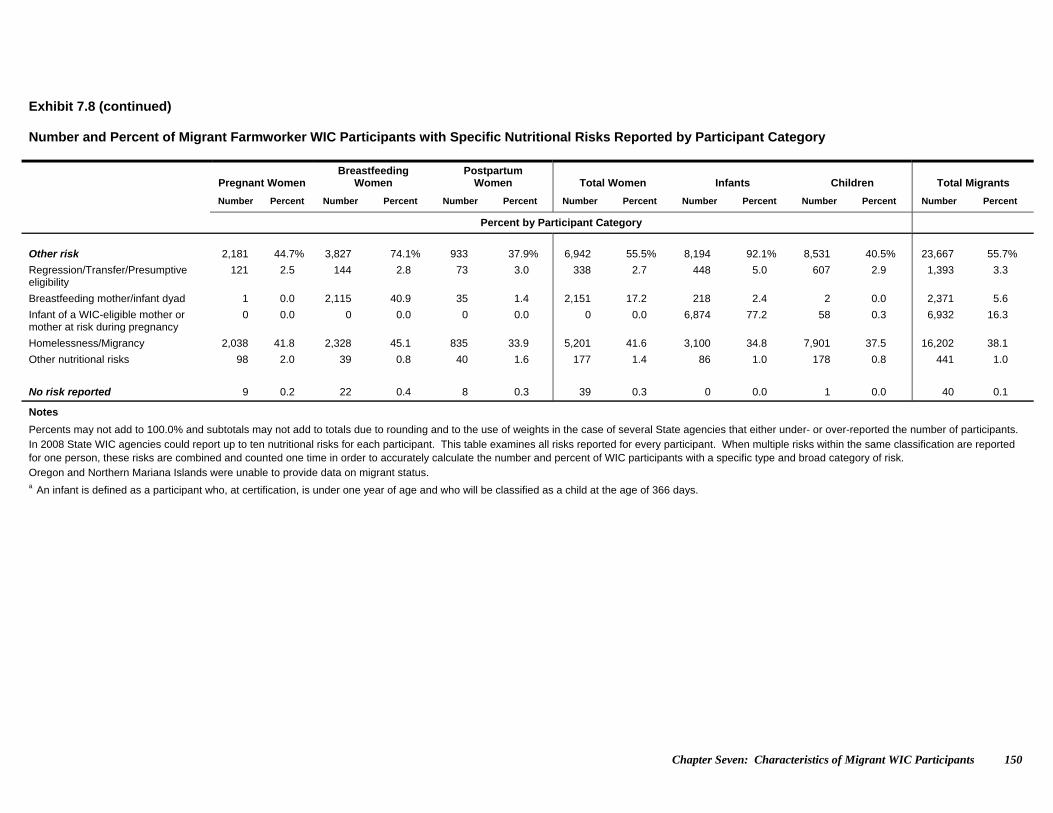
Chapter Seven: Characteristics of Migrant WIC Participants 150
Exhibit 7.8 (continued) Number and Percent of Migrant Farmworker WIC Participants with Specific Nutritional Risks Reported by Participant Category
Pregnant Women Breastfeeding
Women Postpartum
Women Total Women Infants Children Total Migrants
Number Percent Number Percent Number Percent Number Percent Number Percent Number Percent Number Percent
Percent by Participant Category
Other risk 2,181 44.7% 3,827 74.1% 933 37.9% 6,942 55.5% 8,194 92.1% 8,531 40.5% 23,667 55.7%
Regression/Transfer/Presumptive eligibility
121 2.5 144 2.8 73 3.0 338 2.7 448 5.0 607 2.9 1,393 3.3
Breastfeeding mother/infant dyad 1 0.0 2,115 40.9 35 1.4 2,151 17.2 218 2.4 2 0.0 2,371 5.6
Infant of a WIC-eligible mother or mother at risk during pregnancy
0 0.0 0 0.0 0 0.0 0 0.0 6,874 77.2 58 0.3 6,932 16.3
Homelessness/Migrancy 2,038 41.8 2,328 45.1 835 33.9 5,201 41.6 3,100 34.8 7,901 37.5 16,202 38.1
Other nutritional risks 98 2.0 39 0.8 40 1.6 177 1.4 86 1.0 178 0.8 441 1.0
No risk reported 9 0.2 22 0.4 8 0.3 39 0.3 0 0.0 1 0.0 40 0.1
Notes
Percents may not add to 100.0% and subtotals may not add to totals due to rounding and to the use of weights in the case of several State agencies that either under- or over-reported the number of participants. In 2008 State WIC agencies could report up to ten nutritional risks for each participant. This table examines all risks reported for every participant. When multiple risks within the same classification are reported for one person, these risks are combined and counted one time in order to accurately calculate the number and percent of WIC participants with a specific type and broad category of risk. Oregon and Northern Mariana Islands were unable to provide data on migrant status. a An infant is defined as a participant who, at certification, is under one year of age and who will be classified as a child at the age of 366 days.
Chapter Seven: Characteristics of Migrant WIC Participants 151
children. (Compare Exhibit 7.9 with Exhibits 4.47, 4.48, 4.49, and 4.50.) In addition, migrant children two years of age and older were more likely (by 4.3 percentage points) than their non-migrant counterparts to be overweight. (Compare Exhibit 7.10 and Exhibit 4.38.) The priority level distribution for migrant WIC enrollees (Exhibit 7.11) was similar to the distribution reported for US WIC (Exhibit 5.2). Migrant WIC infants were somewhat less likely to have higher (medically based, Priorities I and II) priorities than the overall infant WIC population, with 88.9 percent of migrant WIC infants so reporting as compared with 93.4 percent of US WIC infants. Also, significantly more migrant WIC postpartum women were assigned to Priority IV than the overall WIC postpartum women category (19.5 percent versus 7.5 percent), which is consistent with the priority assignment for high-risk postpartum women and migrant pregnant and breastfeeding women assigned at the time of certification. With priority not reported for 1.2 percent of migrant WIC participants, 98.7 percent are assigned to Priorities I through VI, with 67.1 percent of migrant WIC participants placed in Priorities I, II, or III and categorized with anthropometric, biochemical, and clinical risks. Priority VII is for individuals certified solely due to migrancy, homelessness or regression and is used to ensure that there is some way to certify migrants when they cannot be placed in a higher Priority. Only a very small proportion (0.1 percent) of migrant WIC participants were assigned to Priority VII.
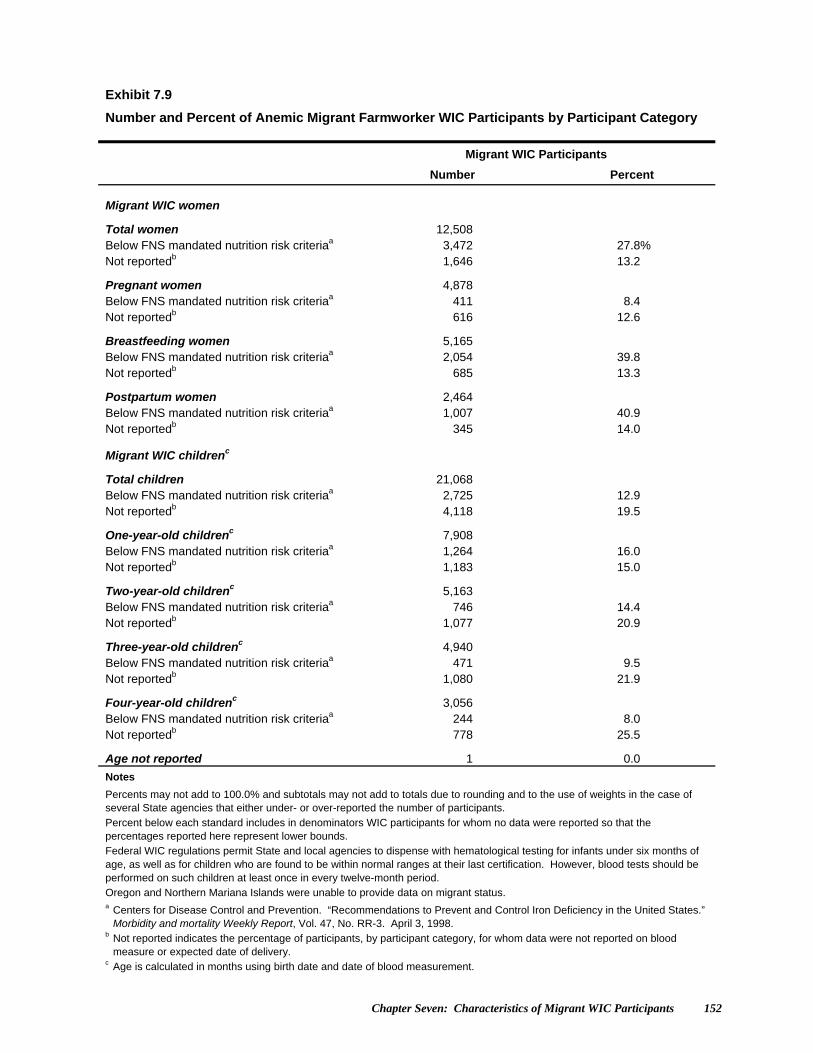
Chapter Seven: Characteristics of Migrant WIC Participants 152
Exhibit 7.9
Number and Percent of Anemic Migrant Farmworker WIC Participants by Participant Category
Migrant WIC Participants
Number Percent
Migrant WIC women
Total women 12,508 Below FNS mandated nutrition risk criteriaa 3,472 27.8% Not reportedb 1,646 13.2
Pregnant women 4,878 Below FNS mandated nutrition risk criteriaa 411 8.4 Not reportedb 616 12.6
Breastfeeding women 5,165 Below FNS mandated nutrition risk criteriaa 2,054 39.8 Not reportedb 685 13.3
Postpartum women 2,464 Below FNS mandated nutrition risk criteriaa 1,007 40.9 Not reportedb 345 14.0
Migrant WIC childrenc
Total children 21,068 Below FNS mandated nutrition risk criteriaa 2,725 12.9 Not reportedb 4,118 19.5
One-year-old childrenc 7,908 Below FNS mandated nutrition risk criteriaa 1,264 16.0 Not reportedb 1,183 15.0
Two-year-old childrenc 5,163 Below FNS mandated nutrition risk criteriaa 746 14.4 Not reportedb 1,077 20.9
Three-year-old childrenc 4,940 Below FNS mandated nutrition risk criteriaa 471 9.5 Not reportedb 1,080 21.9
Four-year-old childrenc 3,056 Below FNS mandated nutrition risk criteriaa 244 8.0 Not reportedb 778 25.5
Age not reported 1 0.0
Notes
Percents may not add to 100.0% and subtotals may not add to totals due to rounding and to the use of weights in the case of several State agencies that either under- or over-reported the number of participants.
Percent below each standard includes in denominators WIC participants for whom no data were reported so that the percentages reported here represent lower bounds. Federal WIC regulations permit State and local agencies to dispense with hematological testing for infants under six months of age, as well as for children who are found to be within normal ranges at their last certification. However, blood tests should be performed on such children at least once in every twelve-month period. Oregon and Northern Mariana Islands were unable to provide data on migrant status. a Centers for Disease Control and Prevention. “Recommendations to Prevent and Control Iron Deficiency in the United States.”
Morbidity and mortality Weekly Report, Vol. 47, No. RR-3. April 3, 1998. b Not reported indicates the percentage of participants, by participant category, for whom data were not reported on blood
measure or expected date of delivery. c Age is calculated in months using birth date and date of blood measurement.
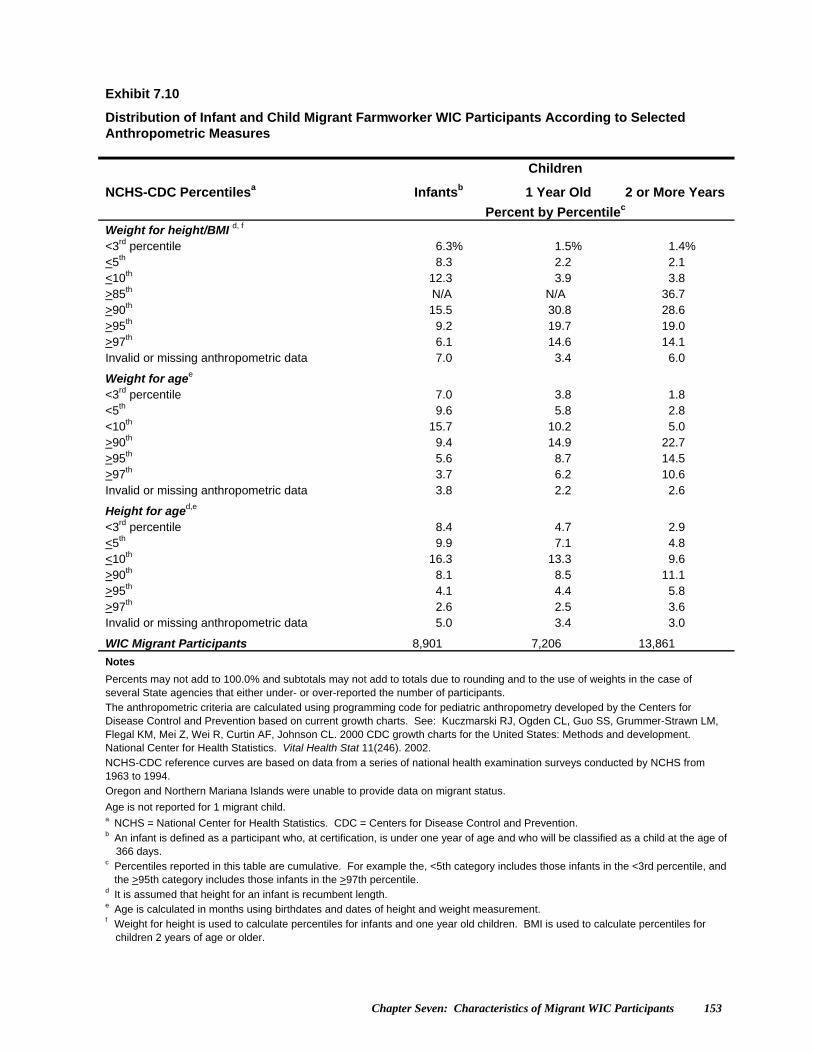
Chapter Seven: Characteristics of Migrant WIC Participants 153
Exhibit 7.10
Distribution of Infant and Child Migrant Farmworker WIC Participants According to Selected Anthropometric Measures
Children
NCHS-CDC Percentilesa Infantsb 1 Year Old 2 or More Years
Percent by Percentilec Weight for height/BMI d, f <3rd percentile 6.3% 1.5% 1.4% <5th 8.3 2.2 2.1 <10th 12.3 3.9 3.8 >85th N/A N/A 36.7 >90th 15.5 30.8 28.6 >95th 9.2 19.7 19.0 >97th 6.1 14.6 14.1 Invalid or missing anthropometric data 7.0 3.4 6.0
Weight for agee <3rd percentile 7.0 3.8 1.8 <5th 9.6 5.8 2.8 <10th 15.7 10.2 5.0 >90th 9.4 14.9 22.7 >95th 5.6 8.7 14.5 >97th 3.7 6.2 10.6 Invalid or missing anthropometric data 3.8 2.2 2.6
Height for aged,e <3rd percentile 8.4 4.7 2.9 <5th 9.9 7.1 4.8 <10th 16.3 13.3 9.6 >90th 8.1 8.5 11.1 >95th 4.1 4.4 5.8 >97th 2.6 2.5 3.6 Invalid or missing anthropometric data 5.0 3.4 3.0
WIC Migrant Participants 8,901 7,206 13,861
Notes
Percents may not add to 100.0% and subtotals may not add to totals due to rounding and to the use of weights in the case of several State agencies that either under- or over-reported the number of participants. The anthropometric criteria are calculated using programming code for pediatric anthropometry developed by the Centers for Disease Control and Prevention based on current growth charts. See: Kuczmarski RJ, Ogden CL, Guo SS, Grummer-Strawn LM, Flegal KM, Mei Z, Wei R, Curtin AF, Johnson CL. 2000 CDC growth charts for the United States: Methods and development. National Center for Health Statistics. Vital Health Stat 11(246). 2002.
NCHS-CDC reference curves are based on data from a series of national health examination surveys conducted by NCHS from 1963 to 1994.
Oregon and Northern Mariana Islands were unable to provide data on migrant status.
Age is not reported for 1 migrant child. a NCHS = National Center for Health Statistics. CDC = Centers for Disease Control and Prevention. b An infant is defined as a participant who, at certification, is under one year of age and who will be classified as a child at the age of
366 days. c Percentiles reported in this table are cumulative. For example the, <5th category includes those infants in the <3rd percentile, and
the >95th category includes those infants in the >97th percentile. d It is assumed that height for an infant is recumbent length. e Age is calculated in months using birthdates and dates of height and weight measurement. f Weight for height is used to calculate percentiles for infants and one year old children. BMI is used to calculate percentiles for
children 2 years of age or older.
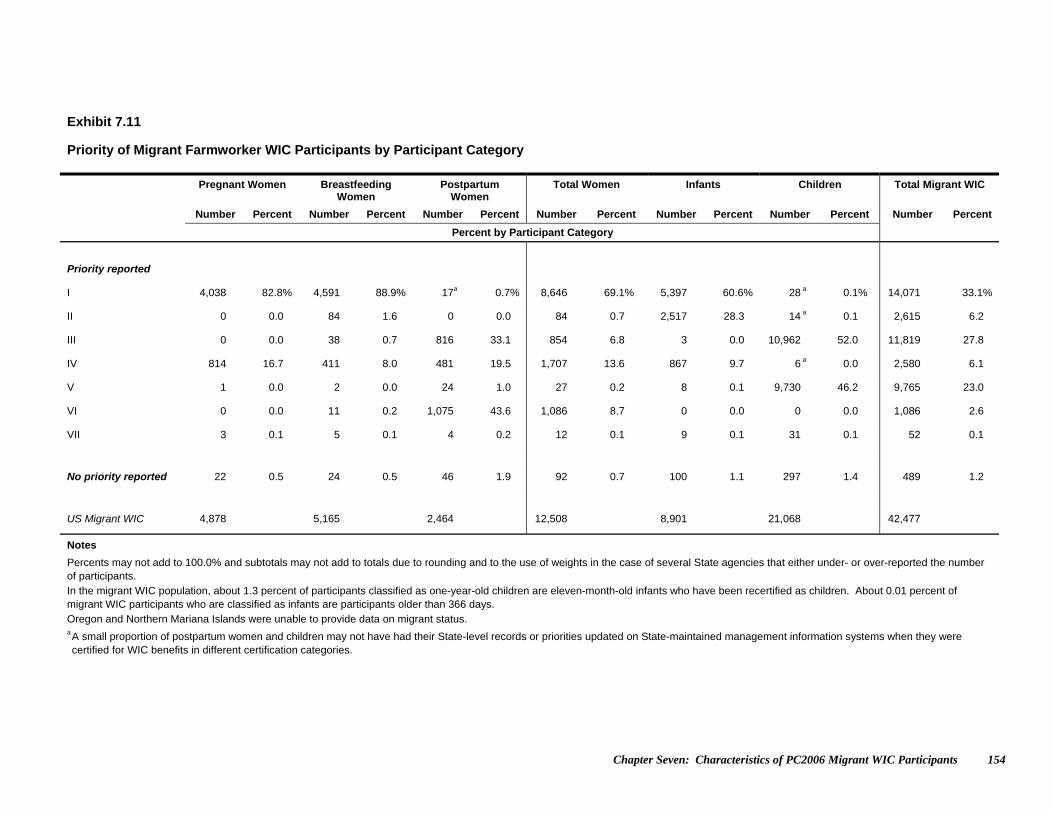
Chapter Seven: Characteristics of PC2006 Migrant WIC Participants 154
Exhibit 7.11
Priority of Migrant Farmworker WIC Participants by Participant Category
Pregnant Women Breastfeeding Women
Postpartum Women
Total Women Infants Children Total Migrant WIC
Number Percent Number Percent Number Percent Number Percent Number Percent Number Percent Number Percent
Percent by Participant Category
Priority reported
I 4,038 82.8% 4,591 88.9% 17a 0.7% 8,646 69.1% 5,397 60.6% 28 a 0.1% 14,071 33.1%
II 0 0.0 84 1.6 0 0.0 84 0.7 2,517 28.3 14 a 0.1 2,615 6.2
III 0 0.0 38 0.7 816 33.1 854 6.8 3 0.0 10,962 52.0 11,819 27.8
IV 814 16.7 411 8.0 481 19.5 1,707 13.6 867 9.7 6 a 0.0 2,580 6.1
V 1 0.0 2 0.0 24 1.0 27 0.2 8 0.1 9,730 46.2 9,765 23.0
VI 0 0.0 11 0.2 1,075 43.6 1,086 8.7 0 0.0 0 0.0 1,086 2.6
VII 3 0.1 5 0.1 4 0.2 12 0.1 9 0.1 31 0.1 52 0.1
No priority reported 22 0.5 24 0.5 46 1.9 92 0.7 100 1.1 297 1.4 489 1.2
US Migrant WIC 4,878 5,165 2,464 12,508 8,901 21,068 42,477
Notes
Percents may not add to 100.0% and subtotals may not add to totals due to rounding and to the use of weights in the case of several State agencies that either under- or over-reported the number of participants. In the migrant WIC population, about 1.3 percent of participants classified as one-year-old children are eleven-month-old infants who have been recertified as children. About 0.01 percent of migrant WIC participants who are classified as infants are participants older than 366 days. Oregon and Northern Mariana Islands were unable to provide data on migrant status. a A small proportion of postpartum women and children may not have had their State-level records or priorities updated on State-maintained management information systems when they were certified for WIC benefits in different certification categories.
APPENDIX A
Chapter Two Supplemental Tables
WIC PARTICIPANTS BY PARTICIPANT CATEGORY BY STATE
SUPPLEMENTAL RACIAL AND ETHNIC TABULATIONS

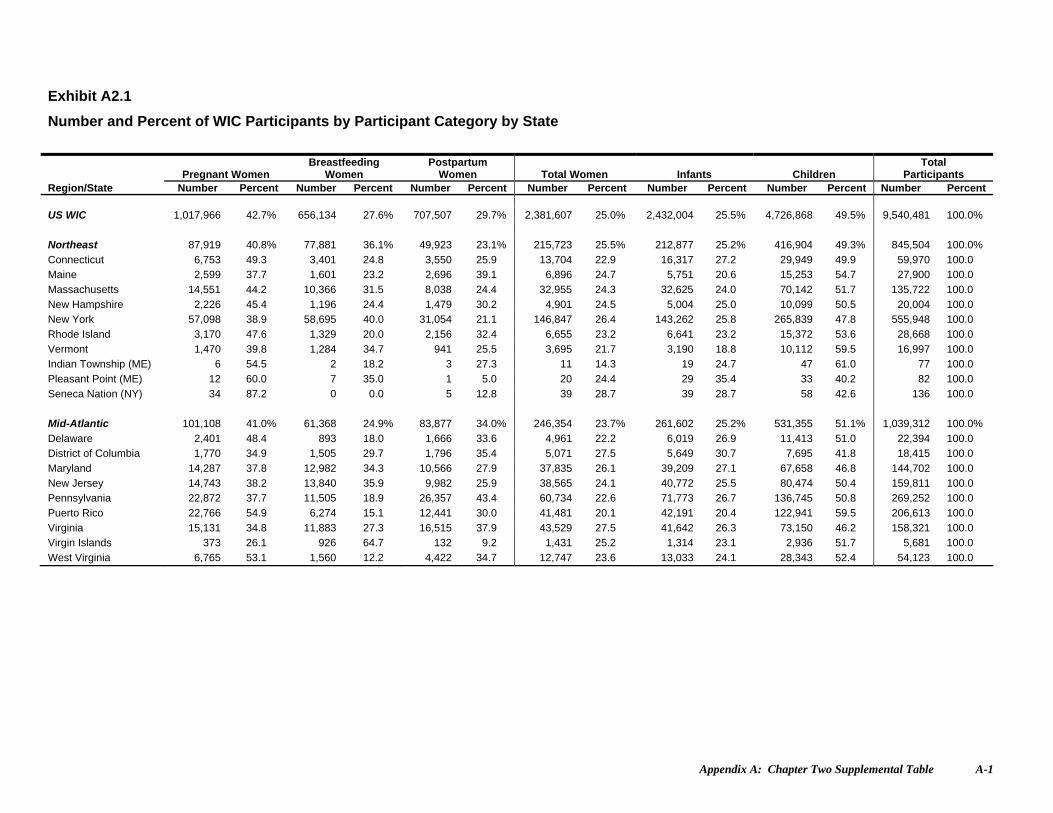
Appendix A: Chapter Two Supplemental Table A-1
Exhibit A2.1
Number and Percent of WIC Participants by Participant Category by State
Pregnant Women Breastfeeding
Women Postpartum
Women Total Women Infants Children Total
Participants Region/State Number Percent Number Percent Number Percent Number Percent Number Percent Number Percent Number Percent US WIC 1,017,966 42.7% 656,134 27.6% 707,507 29.7% 2,381,607 25.0% 2,432,004 25.5% 4,726,868 49.5% 9,540,481 100.0%
Northeast 87,919 40.8% 77,881 36.1% 49,923 23.1% 215,723 25.5% 212,877 25.2% 416,904 49.3% 845,504 100.0%
Connecticut 6,753 49.3 3,401 24.8 3,550 25.9 13,704 22.9 16,317 27.2 29,949 49.9 59,970 100.0
Maine 2,599 37.7 1,601 23.2 2,696 39.1 6,896 24.7 5,751 20.6 15,253 54.7 27,900 100.0
Massachusetts 14,551 44.2 10,366 31.5 8,038 24.4 32,955 24.3 32,625 24.0 70,142 51.7 135,722 100.0
New Hampshire 2,226 45.4 1,196 24.4 1,479 30.2 4,901 24.5 5,004 25.0 10,099 50.5 20,004 100.0
New York 57,098 38.9 58,695 40.0 31,054 21.1 146,847 26.4 143,262 25.8 265,839 47.8 555,948 100.0
Rhode Island 3,170 47.6 1,329 20.0 2,156 32.4 6,655 23.2 6,641 23.2 15,372 53.6 28,668 100.0
Vermont 1,470 39.8 1,284 34.7 941 25.5 3,695 21.7 3,190 18.8 10,112 59.5 16,997 100.0
Indian Township (ME) 6 54.5 2 18.2 3 27.3 11 14.3 19 24.7 47 61.0 77 100.0
Pleasant Point (ME) 12 60.0 7 35.0 1 5.0 20 24.4 29 35.4 33 40.2 82 100.0
Seneca Nation (NY) 34 87.2 0 0.0 5 12.8 39 28.7 39 28.7 58 42.6 136 100.0
Mid-Atlantic 101,108 41.0% 61,368 24.9% 83,877 34.0% 246,354 23.7% 261,602 25.2% 531,355 51.1% 1,039,312 100.0%
Delaware 2,401 48.4 893 18.0 1,666 33.6 4,961 22.2 6,019 26.9 11,413 51.0 22,394 100.0
District of Columbia 1,770 34.9 1,505 29.7 1,796 35.4 5,071 27.5 5,649 30.7 7,695 41.8 18,415 100.0
Maryland 14,287 37.8 12,982 34.3 10,566 27.9 37,835 26.1 39,209 27.1 67,658 46.8 144,702 100.0
New Jersey 14,743 38.2 13,840 35.9 9,982 25.9 38,565 24.1 40,772 25.5 80,474 50.4 159,811 100.0
Pennsylvania 22,872 37.7 11,505 18.9 26,357 43.4 60,734 22.6 71,773 26.7 136,745 50.8 269,252 100.0
Puerto Rico 22,766 54.9 6,274 15.1 12,441 30.0 41,481 20.1 42,191 20.4 122,941 59.5 206,613 100.0
Virginia 15,131 34.8 11,883 27.3 16,515 37.9 43,529 27.5 41,642 26.3 73,150 46.2 158,321 100.0
Virgin Islands 373 26.1 926 64.7 132 9.2 1,431 25.2 1,314 23.1 2,936 51.7 5,681 100.0
West Virginia 6,765 53.1 1,560 12.2 4,422 34.7 12,747 23.6 13,033 24.1 28,343 52.4 54,123 100.0
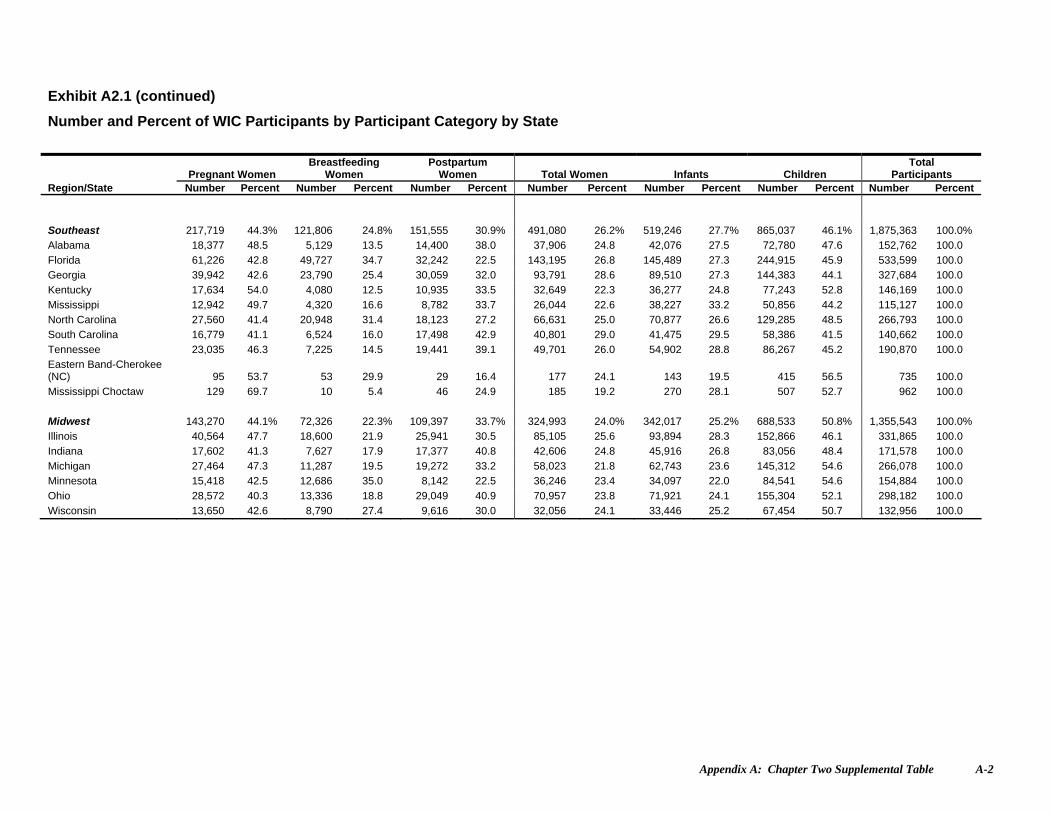
Appendix A: Chapter Two Supplemental Table A-2
Exhibit A2.1 (continued)
Number and Percent of WIC Participants by Participant Category by State
Pregnant Women Breastfeeding
Women Postpartum
Women Total Women Infants Children Total
Participants Region/State Number Percent Number Percent Number Percent Number Percent Number Percent Number Percent Number Percent
Southeast 217,719 44.3% 121,806 24.8% 151,555 30.9% 491,080 26.2% 519,246 27.7% 865,037 46.1% 1,875,363 100.0%
Alabama 18,377 48.5 5,129 13.5 14,400 38.0 37,906 24.8 42,076 27.5 72,780 47.6 152,762 100.0
Florida 61,226 42.8 49,727 34.7 32,242 22.5 143,195 26.8 145,489 27.3 244,915 45.9 533,599 100.0
Georgia 39,942 42.6 23,790 25.4 30,059 32.0 93,791 28.6 89,510 27.3 144,383 44.1 327,684 100.0
Kentucky 17,634 54.0 4,080 12.5 10,935 33.5 32,649 22.3 36,277 24.8 77,243 52.8 146,169 100.0
Mississippi 12,942 49.7 4,320 16.6 8,782 33.7 26,044 22.6 38,227 33.2 50,856 44.2 115,127 100.0
North Carolina 27,560 41.4 20,948 31.4 18,123 27.2 66,631 25.0 70,877 26.6 129,285 48.5 266,793 100.0
South Carolina 16,779 41.1 6,524 16.0 17,498 42.9 40,801 29.0 41,475 29.5 58,386 41.5 140,662 100.0
Tennessee 23,035 46.3 7,225 14.5 19,441 39.1 49,701 26.0 54,902 28.8 86,267 45.2 190,870 100.0
Eastern Band-Cherokee (NC) 95 53.7 53 29.9 29 16.4 177 24.1 143 19.5 415 56.5 735 100.0
Mississippi Choctaw 129 69.7 10 5.4 46 24.9 185 19.2 270 28.1 507 52.7 962 100.0
Midwest 143,270 44.1% 72,326 22.3% 109,397 33.7% 324,993 24.0% 342,017 25.2% 688,533 50.8% 1,355,543 100.0%
Illinois 40,564 47.7 18,600 21.9 25,941 30.5 85,105 25.6 93,894 28.3 152,866 46.1 331,865 100.0
Indiana 17,602 41.3 7,627 17.9 17,377 40.8 42,606 24.8 45,916 26.8 83,056 48.4 171,578 100.0
Michigan 27,464 47.3 11,287 19.5 19,272 33.2 58,023 21.8 62,743 23.6 145,312 54.6 266,078 100.0
Minnesota 15,418 42.5 12,686 35.0 8,142 22.5 36,246 23.4 34,097 22.0 84,541 54.6 154,884 100.0
Ohio 28,572 40.3 13,336 18.8 29,049 40.9 70,957 23.8 71,921 24.1 155,304 52.1 298,182 100.0
Wisconsin 13,650 42.6 8,790 27.4 9,616 30.0 32,056 24.1 33,446 25.2 67,454 50.7 132,956 100.0

Appendix A: Chapter Two Supplemental Table A-3
Exhibit A2.1 (continued)
Number and Percent of WIC Participants by Participant Category by State
Pregnant Women Breastfeeding
Women Postpartum
Women Total Women Infants Children Total
Participants Number Percent Number Percent Number Percent Number Percent Number Percent Number Percent Number Percent
Percent of Total Women Percent of Total Participants Southwest 160,291 43.3% 94,421 25.5% 115,111 31.1% 369,823 25.1% 389,900 26.4% 715,557 48.5% 1,475,280 100.0%
Arkansas 12,546 45.6 4,046 14.7 10,898 39.6 27,490 28.1 27,640 28.3 42,537 43.6 97,667 100.0
Louisiana 16,726 41.9 4,770 12.0 18,387 46.1 39,883 26.8 44,085 29.6 65,118 43.7 149,086 100.0
New Mexico 8,243 50.4 4,245 25.9 3,879 23.7 16,367 24.2 16,332 24.1 35,009 51.7 67,708 100.0
Oklahoma 12,692 50.3 4,468 17.7 8,060 32.0 25,220 24.5 25,962 25.2 51,855 50.3 103,037 100.0
Texas 106,899 42.2 75,502 29.8 71,134 28.1 253,535 24.7 268,281 26.2 503,333 49.1 1,025,149 100.0
ACL (NM) 47 35.6 53 40.2 32 24.2 132 22.2 124 20.9 338 56.9 594 100.0
Cherokee Nation (OK) 1,102 52.2 312 14.8 698 33.0 2,112 23.7 2,173 24.4 4,637 52.0 8,922 100.0
Chickasaw Nation (OK) 383 40.5 142 15.0 420 44.4 945 24.4 877 22.6 2,052 53.0 3,874 100.0
Choctaw Nation (OK) 317 39.2 157 19.4 334 41.3 808 22.1 959 26.2 1,896 51.8 3,663 100.0
Citizen-Potawatomi (OK) 141 44.8 51 16.2 123 39.0 315 18.0 367 20.9 1,070 61.1 1,752 100.0
Eight Northern Pueblos (NM) 21 33.9 22 35.5 19 30.6 62 19.0 82 25.2 182 55.8 326 100.0
Five Sandoval Pueblos (NM) 44 47.8 40 43.5 8 8.7 92 24.0 79 20.6 212 55.4 383 100.0
ITC-Oklahoma 74 42.3 20 11.4 81 46.3 175 20.3 193 22.4 495 57.4 863 100.0
Muscogee Creek Nation (OK) 262 40.5 122 18.9 263 40.6 647 21.9 645 21.8 1,665 56.3 2,957 100.0
Osage Nation (OK) 199 39.1 90 17.7 220 43.2 509 20.6 623 25.3 1,334 54.1 2,466 100.0
Otoe-Missouria (OK) 78 42.2 28 15.1 79 42.7 185 24.1 174 22.7 409 53.3 768 100.0
Pueblo of Isleta (NM) 88 38.4 80 34.9 61 26.6 229 21.6 226 21.3 604 57.0 1,059 100.0
Pueblo of San Felipe (NM) 26 38.8 24 35.8 17 25.4 67 20.7 65 20.1 191 59.1 323 100.0
Pueblo of Zuni (NM) 79 42.7 68 36.8 38 20.5 185 22.2 146 17.5 501 60.2 832 100.0
Santo Domingo (NM) 18 34.0 25 47.2 10 18.9 53 22.3 50 21.0 135 56.7 238 100.0
WCD (OK) 306 37.7 156 19.2 350 43.1 812 22.5 817 22.6 1,984 54.9 3,613 100.0
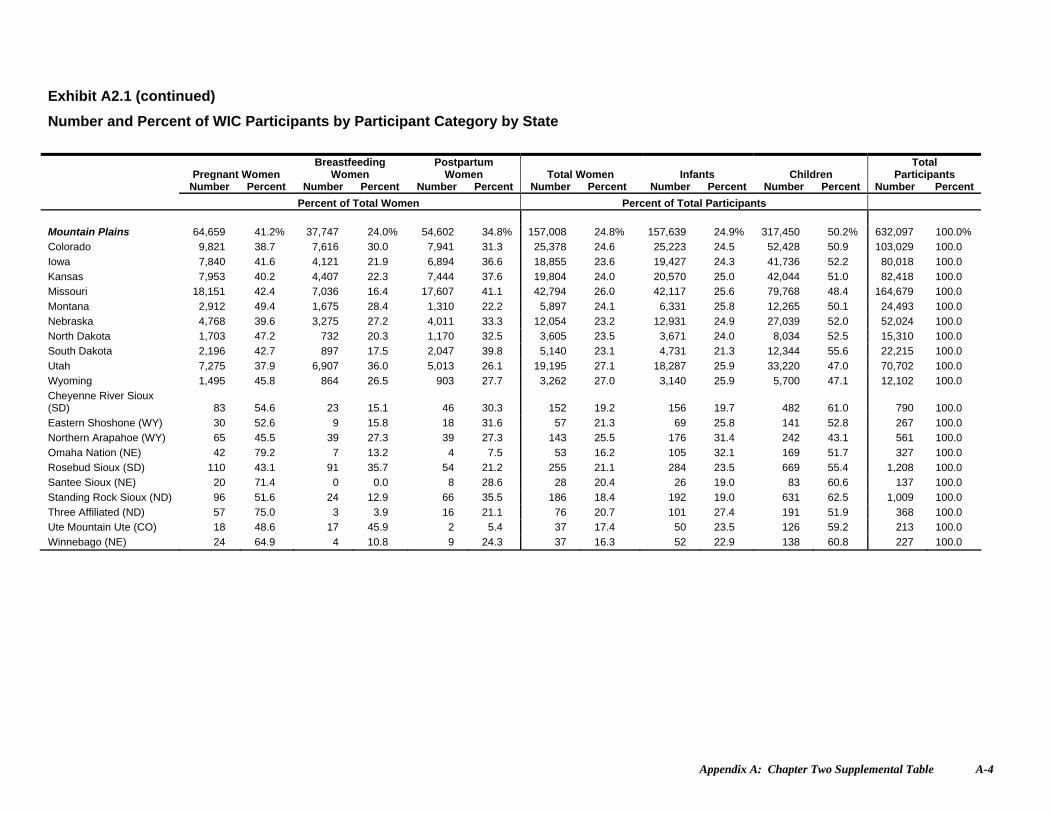
Appendix A: Chapter Two Supplemental Table A-4
Exhibit A2.1 (continued)
Number and Percent of WIC Participants by Participant Category by State
Pregnant Women Breastfeeding
Women Postpartum
Women Total Women Infants Children Total
Participants Number Percent Number Percent Number Percent Number Percent Number Percent Number Percent Number Percent
Percent of Total Women Percent of Total Participants Mountain Plains 64,659 41.2% 37,747 24.0% 54,602 34.8% 157,008 24.8% 157,639 24.9% 317,450 50.2% 632,097 100.0%
Colorado 9,821 38.7 7,616 30.0 7,941 31.3 25,378 24.6 25,223 24.5 52,428 50.9 103,029 100.0
Iowa 7,840 41.6 4,121 21.9 6,894 36.6 18,855 23.6 19,427 24.3 41,736 52.2 80,018 100.0
Kansas 7,953 40.2 4,407 22.3 7,444 37.6 19,804 24.0 20,570 25.0 42,044 51.0 82,418 100.0
Missouri 18,151 42.4 7,036 16.4 17,607 41.1 42,794 26.0 42,117 25.6 79,768 48.4 164,679 100.0
Montana 2,912 49.4 1,675 28.4 1,310 22.2 5,897 24.1 6,331 25.8 12,265 50.1 24,493 100.0
Nebraska 4,768 39.6 3,275 27.2 4,011 33.3 12,054 23.2 12,931 24.9 27,039 52.0 52,024 100.0
North Dakota 1,703 47.2 732 20.3 1,170 32.5 3,605 23.5 3,671 24.0 8,034 52.5 15,310 100.0
South Dakota 2,196 42.7 897 17.5 2,047 39.8 5,140 23.1 4,731 21.3 12,344 55.6 22,215 100.0
Utah 7,275 37.9 6,907 36.0 5,013 26.1 19,195 27.1 18,287 25.9 33,220 47.0 70,702 100.0
Wyoming 1,495 45.8 864 26.5 903 27.7 3,262 27.0 3,140 25.9 5,700 47.1 12,102 100.0
Cheyenne River Sioux (SD) 83 54.6 23 15.1 46 30.3 152 19.2 156 19.7 482 61.0 790 100.0
Eastern Shoshone (WY) 30 52.6 9 15.8 18 31.6 57 21.3 69 25.8 141 52.8 267 100.0
Northern Arapahoe (WY) 65 45.5 39 27.3 39 27.3 143 25.5 176 31.4 242 43.1 561 100.0
Omaha Nation (NE) 42 79.2 7 13.2 4 7.5 53 16.2 105 32.1 169 51.7 327 100.0
Rosebud Sioux (SD) 110 43.1 91 35.7 54 21.2 255 21.1 284 23.5 669 55.4 1,208 100.0
Santee Sioux (NE) 20 71.4 0 0.0 8 28.6 28 20.4 26 19.0 83 60.6 137 100.0
Standing Rock Sioux (ND) 96 51.6 24 12.9 66 35.5 186 18.4 192 19.0 631 62.5 1,009 100.0
Three Affiliated (ND) 57 75.0 3 3.9 16 21.1 76 20.7 101 27.4 191 51.9 368 100.0
Ute Mountain Ute (CO) 18 48.6 17 45.9 2 5.4 37 17.4 50 23.5 126 59.2 213 100.0
Winnebago (NE) 24 64.9 4 10.8 9 24.3 37 16.3 52 22.9 138 60.8 227 100.0
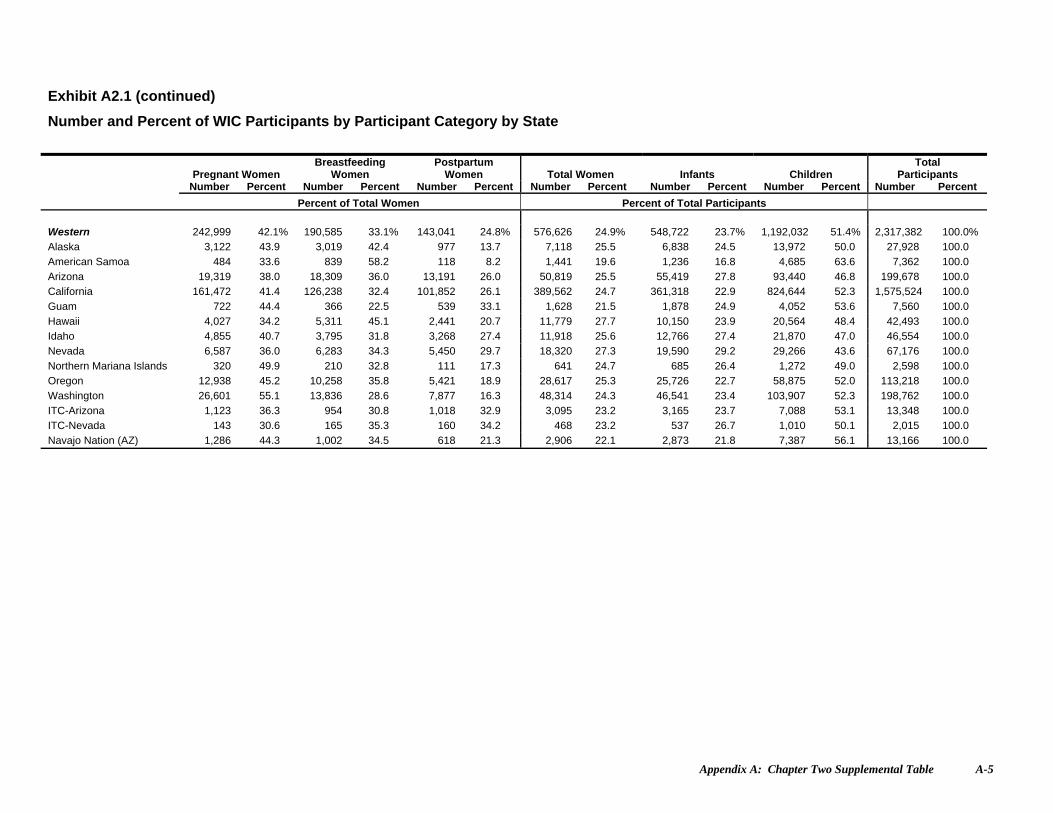
Appendix A: Chapter Two Supplemental Table A-5
Exhibit A2.1 (continued)
Number and Percent of WIC Participants by Participant Category by State
Pregnant Women Breastfeeding
Women Postpartum
Women Total Women Infants Children Total
Participants Number Percent Number Percent Number Percent Number Percent Number Percent Number Percent Number Percent
Percent of Total Women Percent of Total Participants
Western 242,999 42.1% 190,585 33.1% 143,041 24.8% 576,626 24.9% 548,722 23.7% 1,192,032 51.4% 2,317,382 100.0%
Alaska 3,122 43.9 3,019 42.4 977 13.7 7,118 25.5 6,838 24.5 13,972 50.0 27,928 100.0
American Samoa 484 33.6 839 58.2 118 8.2 1,441 19.6 1,236 16.8 4,685 63.6 7,362 100.0
Arizona 19,319 38.0 18,309 36.0 13,191 26.0 50,819 25.5 55,419 27.8 93,440 46.8 199,678 100.0
California 161,472 41.4 126,238 32.4 101,852 26.1 389,562 24.7 361,318 22.9 824,644 52.3 1,575,524 100.0
Guam 722 44.4 366 22.5 539 33.1 1,628 21.5 1,878 24.9 4,052 53.6 7,560 100.0
Hawaii 4,027 34.2 5,311 45.1 2,441 20.7 11,779 27.7 10,150 23.9 20,564 48.4 42,493 100.0
Idaho 4,855 40.7 3,795 31.8 3,268 27.4 11,918 25.6 12,766 27.4 21,870 47.0 46,554 100.0
Nevada 6,587 36.0 6,283 34.3 5,450 29.7 18,320 27.3 19,590 29.2 29,266 43.6 67,176 100.0
Northern Mariana Islands 320 49.9 210 32.8 111 17.3 641 24.7 685 26.4 1,272 49.0 2,598 100.0
Oregon 12,938 45.2 10,258 35.8 5,421 18.9 28,617 25.3 25,726 22.7 58,875 52.0 113,218 100.0
Washington 26,601 55.1 13,836 28.6 7,877 16.3 48,314 24.3 46,541 23.4 103,907 52.3 198,762 100.0
ITC-Arizona 1,123 36.3 954 30.8 1,018 32.9 3,095 23.2 3,165 23.7 7,088 53.1 13,348 100.0
ITC-Nevada 143 30.6 165 35.3 160 34.2 468 23.2 537 26.7 1,010 50.1 2,015 100.0
Navajo Nation (AZ) 1,286 44.3 1,002 34.5 618 21.3 2,906 22.1 2,873 21.8 7,387 56.1 13,166 100.0

Appendix A: Chapter Two Supplemental Tables A-6
Exhibit A2.6a Distribution of Race for WIC Participants Reporting Two or More Races
Race Number
Percent of Two or
More Races Population
Two races 319,437 92.1% White; Black or African American 137,836 39.7 White; American Indian and Alaska Native 111,239 32.1 White; Asian 24,087 6.9 White; Native Hawaiian and Other Pacific Islander 11,859 3.4 Black or African American; American Indian and Alaska Native 13,512 3.9 Black or African American; Asian 5,670 1.6 Black or African American; Native Hawaiian and Other Pacific Islander 3,261 0.9 American Indian and Alaska Native; Asian 3,658 1.1 American Indian and Alaska Native; Native Hawaiian and Other Pacific Islander 1,996 0.6 Asian; Native Hawaiian and Other Pacific Islander 6,318 1.8
Three races 22,973 6.6 White; Black or African American; American Indian and Alaska Native 7,128 2.1 White; Black or African American; Asian 1,761 0.5 White; Black or African American; Native Hawaiian and Other Pacific Islander 1,223 0.4 White; American Indian and Alaska Native; Asian 1,400 0.4 White; American Indian and Alaska Native; Asian; Native Hawaiian and Other Pacific Islander 873 0.3 White; Asian; Native Hawaiian and Other Pacific Islander 7,665 2.2 Black or African American; American Indian and Alaska Native; Asian 514 0.1 Black or African American; American Indian and Alaska Native; Native Hawaiian and Other Pacific Islander 328 0.1 Black or African American; Asian; Native Hawaiian and Other Pacific Islander 517 0.1 American Indian and Alaska Native; Asian; Native Hawaiian and Other Pacific Islander 1,565 0.5
Four races 2,084 0.6 White; Black or African American; American Indian and Alaska Native; Asian 356 0.1 White; Black or African American; American Indian and Alaska Native; Native Hawaiian and Other Pacific Islander 251 0.1 White; Black or African American; Asian; Native Hawaiian and Other Pacific Islander 401 0.1 White; American Indian and Alaska Native; Asian; Native Hawaiian and Other Pacific Islander 516 0.1 Black or African American; American Indian and Alaska Native; Asian; Native Hawaiian and Other Pacific Islander 560 0.2
Five races 2,334 0.7 White, Black, American Indian, Asian, Native Hawaiian 2,334 0.7 Two or more races 346,829 100.0
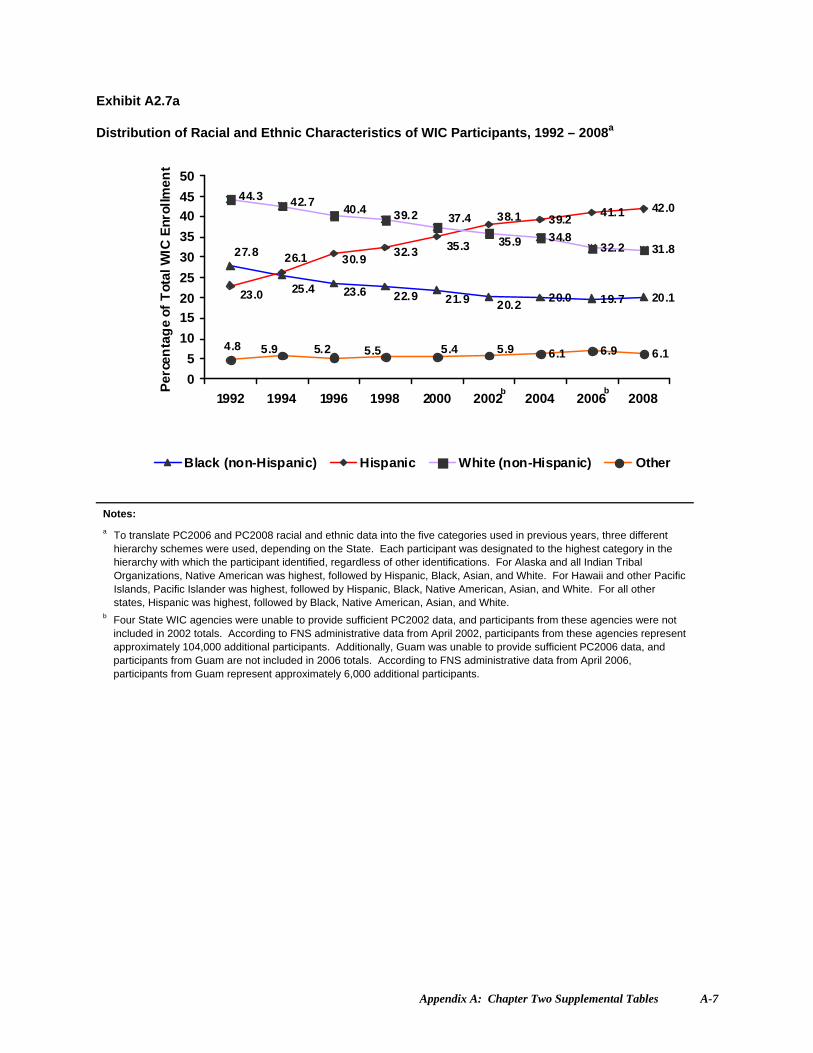
Appendix A: Chapter Two Supplemental Tables A-7
Exhibit A2.7a Distribution of Racial and Ethnic Characteristics of WIC Participants, 1992 – 2008a
20.0 19.7 20.1
39.241.1 42.0
34.832.2 31.8
6.1 6.9 6.1
25.4
27.8
23.6 22.9 21.9 20.2
26.135.3
23.0
38.1
32.330.9
37.439.240.442.744.3
35.9
5.9 5.44.8 5.2 5.5 5.9
0
5
10
15
20
25
30
35
40
45
50
1992 1994 1996 1998 2000 2002 2004 2006 2008
Per
cen
tag
e o
f T
ota
l WIC
En
rollm
ent
Black (non-Hispanic) Hispanic White (non-Hispanic) Other
Notes:
a To translate PC2006 and PC2008 racial and ethnic data into the five categories used in previous years, three different hierarchy schemes were used, depending on the State. Each participant was designated to the highest category in the hierarchy with which the participant identified, regardless of other identifications. For Alaska and all Indian Tribal Organizations, Native American was highest, followed by Hispanic, Black, Asian, and White. For Hawaii and other Pacific Islands, Pacific Islander was highest, followed by Hispanic, Black, Native American, Asian, and White. For all other states, Hispanic was highest, followed by Black, Native American, Asian, and White.
b Four State WIC agencies were unable to provide sufficient PC2002 data, and participants from these agencies were not included in 2002 totals. According to FNS administrative data from April 2002, participants from these agencies represent approximately 104,000 additional participants. Additionally, Guam was unable to provide sufficient PC2006 data, and participants from Guam are not included in 2006 totals. According to FNS administrative data from April 2006, participants from Guam represent approximately 6,000 additional participants.
b b
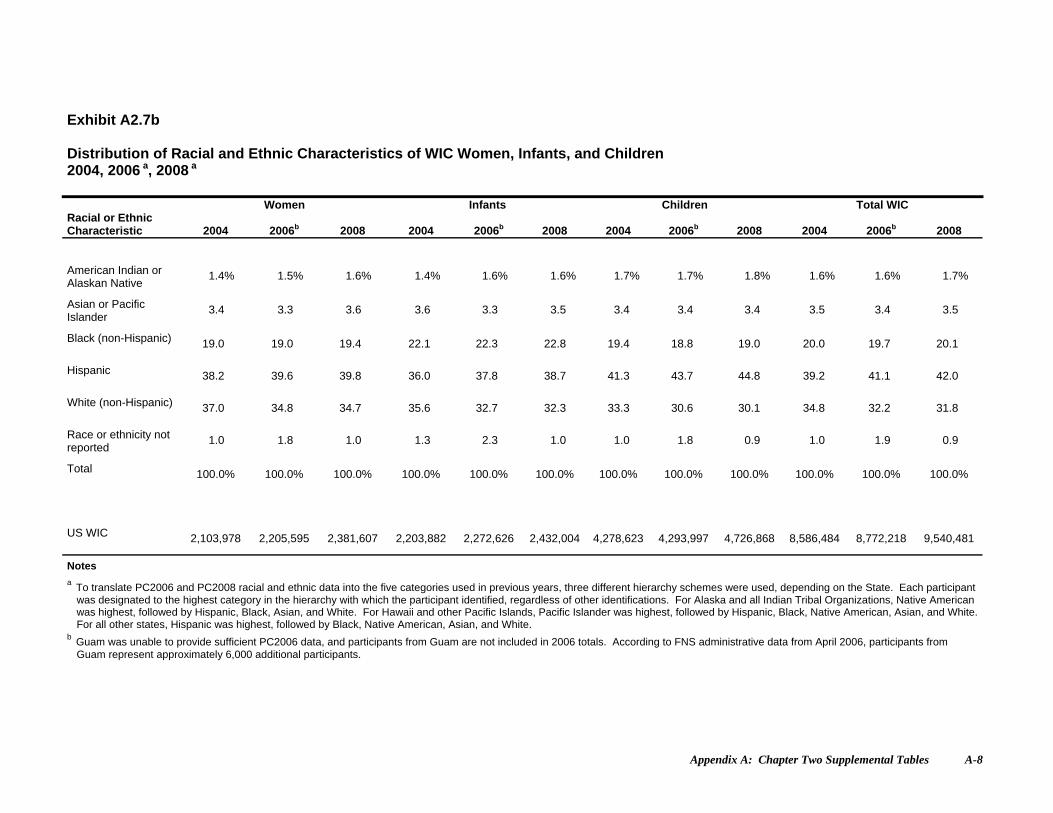
Appendix A: Chapter Two Supplemental Tables A-8
Exhibit A2.7b Distribution of Racial and Ethnic Characteristics of WIC Women, Infants, and Children 2004, 2006 a, 2008 a Women Infants Children Total WIC Racial or Ethnic Characteristic 2004 2006b 2008 2004 2006b 2008 2004 2006b 2008 2004 2006b 2008
American Indian or Alaskan Native
1.4% 1.5% 1.6% 1.4% 1.6% 1.6% 1.7% 1.7% 1.8% 1.6% 1.6% 1.7%
Asian or Pacific Islander
3.4 3.3 3.6 3.6 3.3 3.5 3.4 3.4 3.4 3.5 3.4 3.5
Black (non-Hispanic) 19.0 19.0 19.4 22.1 22.3 22.8 19.4 18.8 19.0 20.0 19.7 20.1
Hispanic 38.2 39.6 39.8 36.0 37.8 38.7 41.3 43.7 44.8 39.2 41.1 42.0
White (non-Hispanic) 37.0 34.8 34.7 35.6 32.7 32.3 33.3 30.6 30.1 34.8 32.2 31.8
Race or ethnicity not reported
1.0 1.8 1.0 1.3 2.3 1.0 1.0 1.8 0.9 1.0 1.9 0.9
Total 100.0% 100.0% 100.0% 100.0% 100.0% 100.0% 100.0% 100.0% 100.0% 100.0% 100.0% 100.0%
US WIC 2,103,978 2,205,595 2,381,607 2,203,882 2,272,626 2,432,004 4,278,623 4,293,997 4,726,868 8,586,484 8,772,218 9,540,481
Notes
a To translate PC2006 and PC2008 racial and ethnic data into the five categories used in previous years, three different hierarchy schemes were used, depending on the State. Each participant was designated to the highest category in the hierarchy with which the participant identified, regardless of other identifications. For Alaska and all Indian Tribal Organizations, Native American was highest, followed by Hispanic, Black, Asian, and White. For Hawaii and other Pacific Islands, Pacific Islander was highest, followed by Hispanic, Black, Native American, Asian, and White. For all other states, Hispanic was highest, followed by Black, Native American, Asian, and White.
b Guam was unable to provide sufficient PC2006 data, and participants from Guam are not included in 2006 totals. According to FNS administrative data from April 2006, participants from Guam represent approximately 6,000 additional participants.
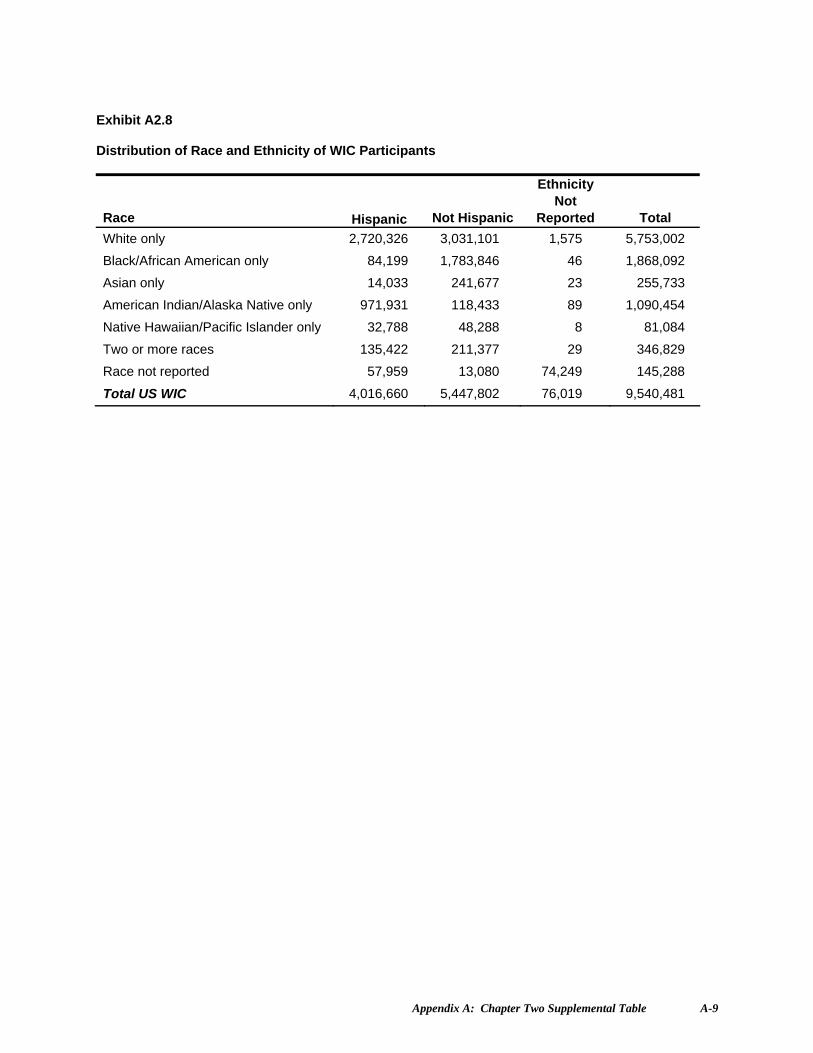
Appendix A: Chapter Two Supplemental Table A-9
Exhibit A2.8 Distribution of Race and Ethnicity of WIC Participants
Race Hispanic Not Hispanic
Ethnicity Not
Reported Total
White only 2,720,326 3,031,101 1,575 5,753,002
Black/African American only 84,199 1,783,846 46 1,868,092
Asian only 14,033 241,677 23 255,733
American Indian/Alaska Native only 971,931 118,433 89 1,090,454
Native Hawaiian/Pacific Islander only 32,788 48,288 8 81,084
Two or more races 135,422 211,377 29 346,829
Race not reported 57,959 13,080 74,249 145,288
Total US WIC 4,016,660 5,447,802 76,019 9,540,481
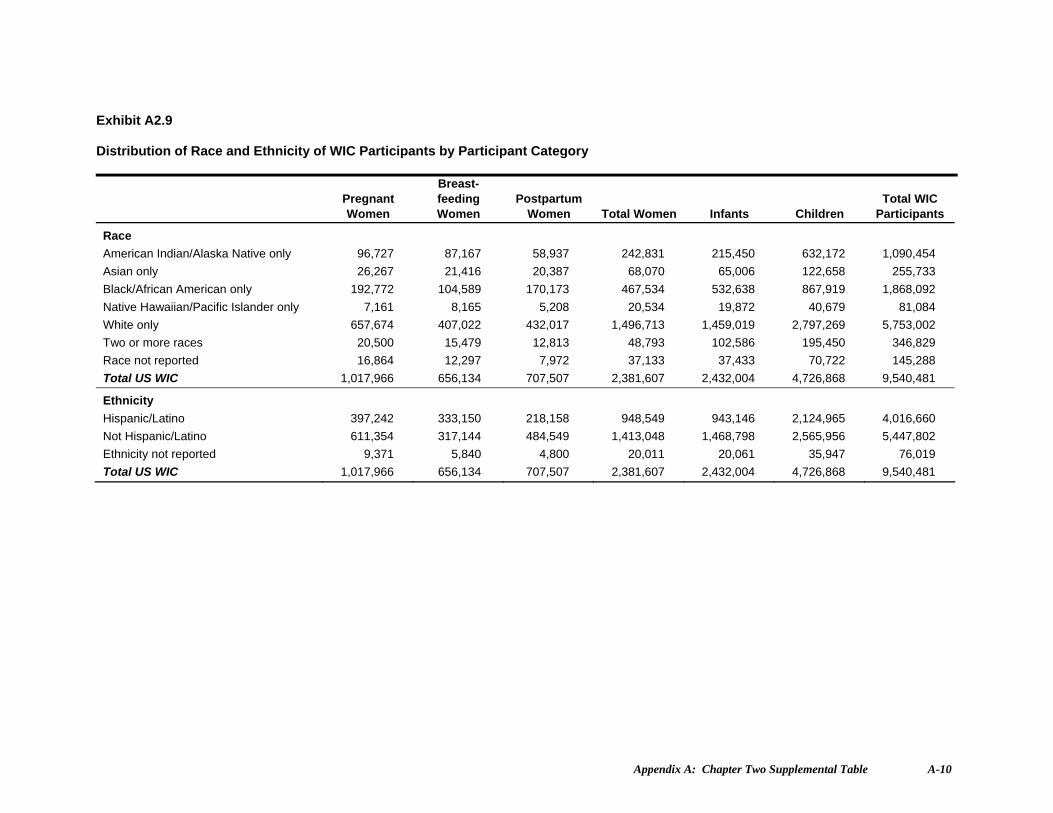
Appendix A: Chapter Two Supplemental Table A-10
Exhibit A2.9 Distribution of Race and Ethnicity of WIC Participants by Participant Category
Pregnant Women
Breast-feeding Women
Postpartum Women Total Women Infants Children
Total WIC Participants
Race
American Indian/Alaska Native only 96,727 87,167 58,937 242,831 215,450 632,172 1,090,454
Asian only 26,267 21,416 20,387 68,070 65,006 122,658 255,733
Black/African American only 192,772 104,589 170,173 467,534 532,638 867,919 1,868,092
Native Hawaiian/Pacific Islander only 7,161 8,165 5,208 20,534 19,872 40,679 81,084
White only 657,674 407,022 432,017 1,496,713 1,459,019 2,797,269 5,753,002
Two or more races 20,500 15,479 12,813 48,793 102,586 195,450 346,829
Race not reported 16,864 12,297 7,972 37,133 37,433 70,722 145,288
Total US WIC 1,017,966 656,134 707,507 2,381,607 2,432,004 4,726,868 9,540,481
Ethnicity
Hispanic/Latino 397,242 333,150 218,158 948,549 943,146 2,124,965 4,016,660
Not Hispanic/Latino 611,354 317,144 484,549 1,413,048 1,468,798 2,565,956 5,447,802
Ethnicity not reported 9,371 5,840 4,800 20,011 20,061 35,947 76,019
Total US WIC 1,017,966 656,134 707,507 2,381,607 2,432,004 4,726,868 9,540,481
APPENDIX B
CHAPTER THREE SUPPLEMENTAL TABLE
DISTRIBUTION OF POVERTY, 2002, 2004, 2006, 2008

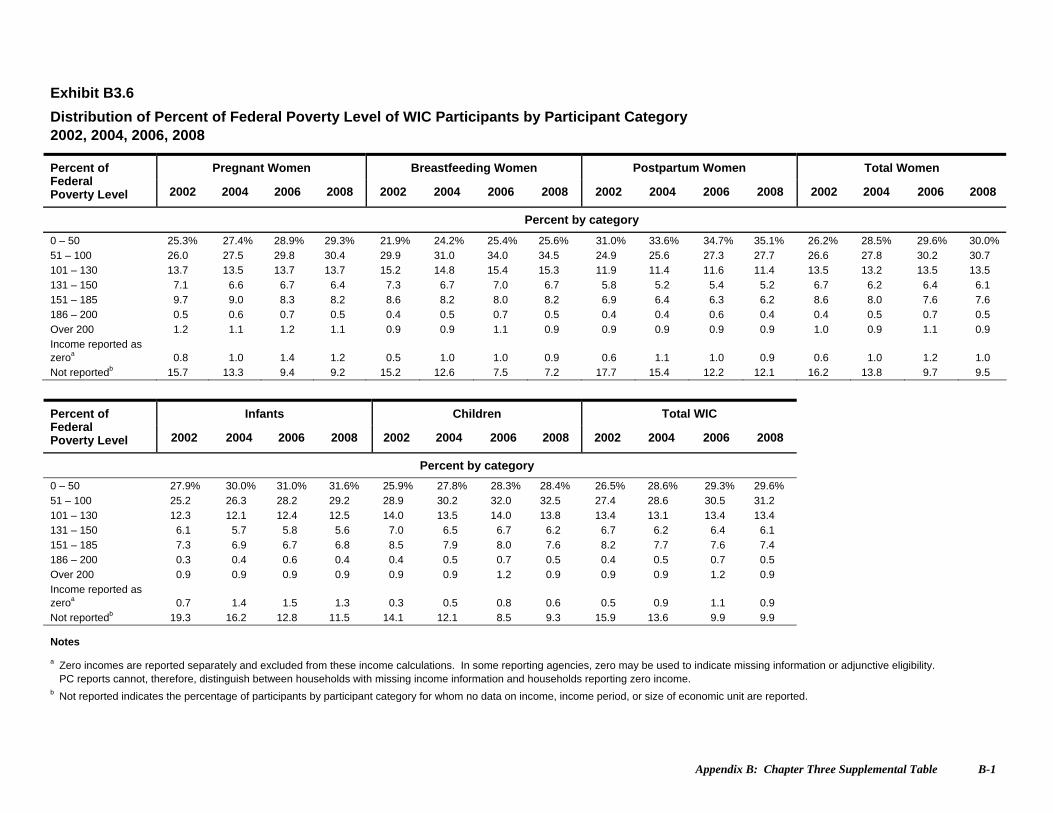
Appendix B: Chapter Three Supplemental Table B-1
Exhibit B3.6
Distribution of Percent of Federal Poverty Level of WIC Participants by Participant Category 2002, 2004, 2006, 2008
Pregnant Women Breastfeeding Women Postpartum Women Total Women Percent of Federal Poverty Level 2002 2004 2006 2008 2002 2004 2006 2008 2002 2004 2006 2008 2002 2004 2006 2008
Percent by category
0 – 50 25.3% 27.4% 28.9% 29.3% 21.9% 24.2% 25.4% 25.6% 31.0% 33.6% 34.7% 35.1% 26.2% 28.5% 29.6% 30.0% 51 – 100 26.0 27.5 29.8 30.4 29.9 31.0 34.0 34.5 24.9 25.6 27.3 27.7 26.6 27.8 30.2 30.7 101 – 130 13.7 13.5 13.7 13.7 15.2 14.8 15.4 15.3 11.9 11.4 11.6 11.4 13.5 13.2 13.5 13.5
131 – 150 7.1 6.6 6.7 6.4 7.3 6.7 7.0 6.7 5.8 5.2 5.4 5.2 6.7 6.2 6.4 6.1 151 – 185 9.7 9.0 8.3 8.2 8.6 8.2 8.0 8.2 6.9 6.4 6.3 6.2 8.6 8.0 7.6 7.6 186 – 200 0.5 0.6 0.7 0.5 0.4 0.5 0.7 0.5 0.4 0.4 0.6 0.4 0.4 0.5 0.7 0.5
Over 200 1.2 1.1 1.2 1.1 0.9 0.9 1.1 0.9 0.9 0.9 0.9 0.9 1.0 0.9 1.1 0.9 Income reported as zeroa 0.8 1.0 1.4 1.2 0.5 1.0 1.0 0.9 0.6 1.1 1.0 0.9 0.6 1.0 1.2 1.0 Not reportedb 15.7 13.3 9.4 9.2 15.2 12.6 7.5 7.2 17.7 15.4 12.2 12.1 16.2 13.8 9.7 9.5
Infants Children Total WIC Percent of Federal Poverty Level 2002 2004 2006 2008 2002 2004 2006 2008 2002 2004 2006 2008
Percent by category
0 – 50 27.9% 30.0% 31.0% 31.6% 25.9% 27.8% 28.3% 28.4% 26.5% 28.6% 29.3% 29.6%
51 – 100 25.2 26.3 28.2 29.2 28.9 30.2 32.0 32.5 27.4 28.6 30.5 31.2 101 – 130 12.3 12.1 12.4 12.5 14.0 13.5 14.0 13.8 13.4 13.1 13.4 13.4 131 – 150 6.1 5.7 5.8 5.6 7.0 6.5 6.7 6.2 6.7 6.2 6.4 6.1
151 – 185 7.3 6.9 6.7 6.8 8.5 7.9 8.0 7.6 8.2 7.7 7.6 7.4 186 – 200 0.3 0.4 0.6 0.4 0.4 0.5 0.7 0.5 0.4 0.5 0.7 0.5 Over 200 0.9 0.9 0.9 0.9 0.9 0.9 1.2 0.9 0.9 0.9 1.2 0.9
Income reported as zeroa 0.7 1.4 1.5 1.3 0.3 0.5 0.8 0.6 0.5 0.9 1.1 0.9 Not reportedb 19.3 16.2 12.8 11.5 14.1 12.1 8.5 9.3 15.9 13.6 9.9 9.9
Notes a Zero incomes are reported separately and excluded from these income calculations. In some reporting agencies, zero may be used to indicate missing information or adjunctive eligibility.
PC reports cannot, therefore, distinguish between households with missing income information and households reporting zero income. b Not reported indicates the percentage of participants by participant category for whom no data on income, income period, or size of economic unit are reported.

Appendix B: Chapter Three Supplemental Table B-2
APPENDIX C
CHAPTER SIX SUPPLEMENTAL TABLES
BREASTFEEDING INITIATION AND DURATION RATES FOR WIC INFANTS AGED SEVEN TO ELEVEN MONTHS
IN APRIL 2008 BY STATE

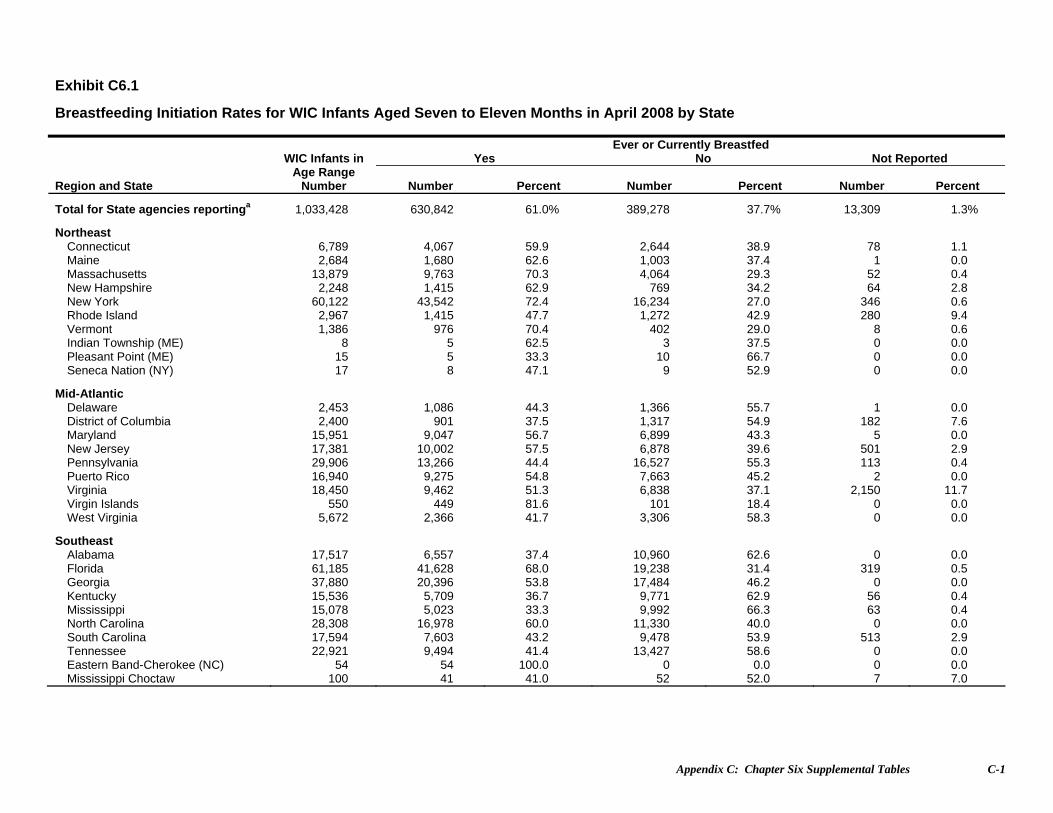
Appendix C: Chapter Six Supplemental Tables C-1
Exhibit C6.1
Breastfeeding Initiation Rates for WIC Infants Aged Seven to Eleven Months in April 2008 by State Ever or Currently Breastfed
Yes No Not Reported
Region and State
WIC Infants in Age Range
Number Number Percent Number Percent Number Percent
Total for State agencies reportinga 1,033,428 630,842 61.0% 389,278 37.7% 13,309 1.3%
Northeast Connecticut 6,789 4,067 59.9 2,644 38.9 78 1.1 Maine 2,684 1,680 62.6 1,003 37.4 1 0.0 Massachusetts 13,879 9,763 70.3 4,064 29.3 52 0.4 New Hampshire 2,248 1,415 62.9 769 34.2 64 2.8 New York 60,122 43,542 72.4 16,234 27.0 346 0.6 Rhode Island 2,967 1,415 47.7 1,272 42.9 280 9.4 Vermont 1,386 976 70.4 402 29.0 8 0.6 Indian Township (ME) 8 5 62.5 3 37.5 0 0.0 Pleasant Point (ME) 15 5 33.3 10 66.7 0 0.0 Seneca Nation (NY) 17 8 47.1 9 52.9 0 0.0
Mid-Atlantic Delaware 2,453 1,086 44.3 1,366 55.7 1 0.0 District of Columbia 2,400 901 37.5 1,317 54.9 182 7.6 Maryland 15,951 9,047 56.7 6,899 43.3 5 0.0 New Jersey 17,381 10,002 57.5 6,878 39.6 501 2.9 Pennsylvania 29,906 13,266 44.4 16,527 55.3 113 0.4 Puerto Rico 16,940 9,275 54.8 7,663 45.2 2 0.0 Virginia 18,450 9,462 51.3 6,838 37.1 2,150 11.7 Virgin Islands 550 449 81.6 101 18.4 0 0.0 West Virginia 5,672 2,366 41.7 3,306 58.3 0 0.0
Southeast Alabama 17,517 6,557 37.4 10,960 62.6 0 0.0 Florida 61,185 41,628 68.0 19,238 31.4 319 0.5 Georgia 37,880 20,396 53.8 17,484 46.2 0 0.0 Kentucky 15,536 5,709 36.7 9,771 62.9 56 0.4 Mississippi 15,078 5,023 33.3 9,992 66.3 63 0.4 North Carolina 28,308 16,978 60.0 11,330 40.0 0 0.0 South Carolina 17,594 7,603 43.2 9,478 53.9 513 2.9 Tennessee 22,921 9,494 41.4 13,427 58.6 0 0.0 Eastern Band-Cherokee (NC) 54 54 100.0 0 0.0 0 0.0 Mississippi Choctaw 100 41 41.0 52 52.0 7 7.0
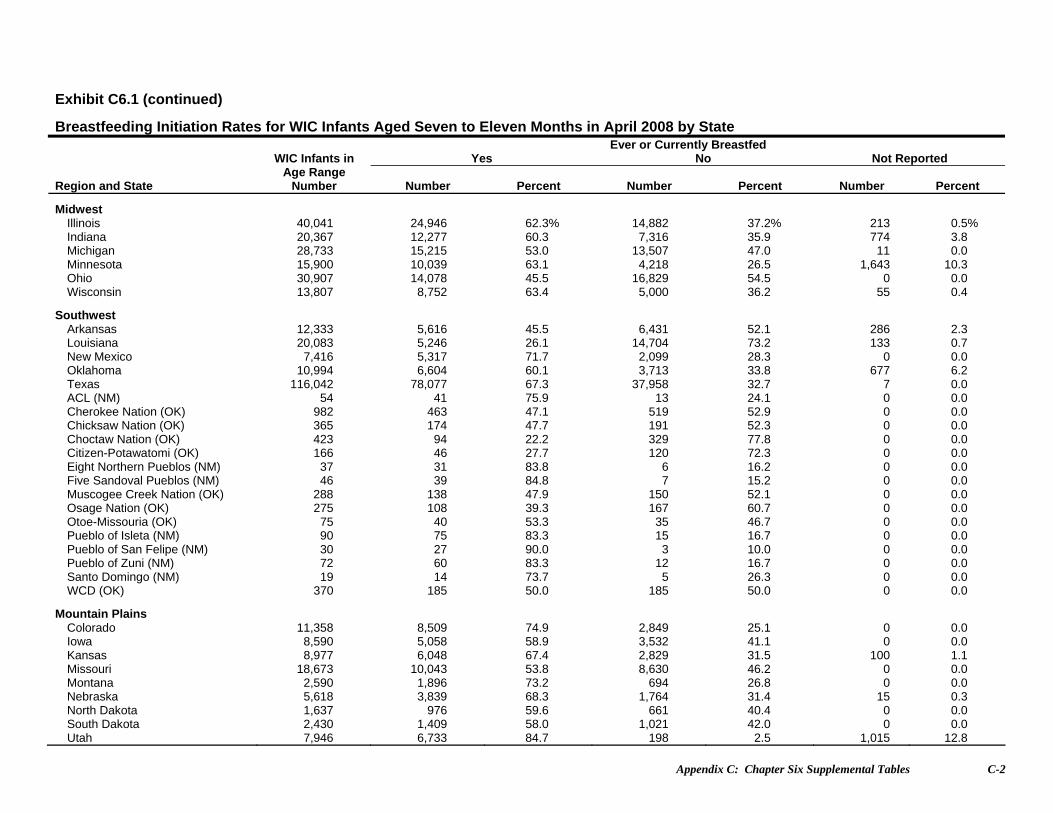
Appendix C: Chapter Six Supplemental Tables C-2
Exhibit C6.1 (continued)
Breastfeeding Initiation Rates for WIC Infants Aged Seven to Eleven Months in April 2008 by State Ever or Currently Breastfed
Yes No Not Reported
Region and State
WIC Infants in Age Range
Number Number Percent Number Percent Number Percent
Midwest Illinois 40,041 24,946 62.3% 14,882 37.2% 213 0.5% Indiana 20,367 12,277 60.3 7,316 35.9 774 3.8 Michigan 28,733 15,215 53.0 13,507 47.0 11 0.0 Minnesota 15,900 10,039 63.1 4,218 26.5 1,643 10.3 Ohio 30,907 14,078 45.5 16,829 54.5 0 0.0 Wisconsin 13,807 8,752 63.4 5,000 36.2 55 0.4
Southwest Arkansas 12,333 5,616 45.5 6,431 52.1 286 2.3 Louisiana 20,083 5,246 26.1 14,704 73.2 133 0.7 New Mexico 7,416 5,317 71.7 2,099 28.3 0 0.0 Oklahoma 10,994 6,604 60.1 3,713 33.8 677 6.2 Texas 116,042 78,077 67.3 37,958 32.7 7 0.0 ACL (NM) 54 41 75.9 13 24.1 0 0.0 Cherokee Nation (OK) 982 463 47.1 519 52.9 0 0.0 Chicksaw Nation (OK) 365 174 47.7 191 52.3 0 0.0 Choctaw Nation (OK) 423 94 22.2 329 77.8 0 0.0 Citizen-Potawatomi (OK) 166 46 27.7 120 72.3 0 0.0 Eight Northern Pueblos (NM) 37 31 83.8 6 16.2 0 0.0 Five Sandoval Pueblos (NM) 46 39 84.8 7 15.2 0 0.0 Muscogee Creek Nation (OK) 288 138 47.9 150 52.1 0 0.0 Osage Nation (OK) 275 108 39.3 167 60.7 0 0.0 Otoe-Missouria (OK) 75 40 53.3 35 46.7 0 0.0 Pueblo of Isleta (NM) 90 75 83.3 15 16.7 0 0.0 Pueblo of San Felipe (NM) 30 27 90.0 3 10.0 0 0.0 Pueblo of Zuni (NM) 72 60 83.3 12 16.7 0 0.0 Santo Domingo (NM) 19 14 73.7 5 26.3 0 0.0 WCD (OK) 370 185 50.0 185 50.0 0 0.0
Mountain Plains Colorado 11,358 8,509 74.9 2,849 25.1 0 0.0 Iowa 8,590 5,058 58.9 3,532 41.1 0 0.0 Kansas 8,977 6,048 67.4 2,829 31.5 100 1.1 Missouri 18,673 10,043 53.8 8,630 46.2 0 0.0 Montana 2,590 1,896 73.2 694 26.8 0 0.0 Nebraska 5,618 3,839 68.3 1,764 31.4 15 0.3 North Dakota 1,637 976 59.6 661 40.4 0 0.0 South Dakota 2,430 1,409 58.0 1,021 42.0 0 0.0 Utah 7,946 6,733 84.7 198 2.5 1,015 12.8
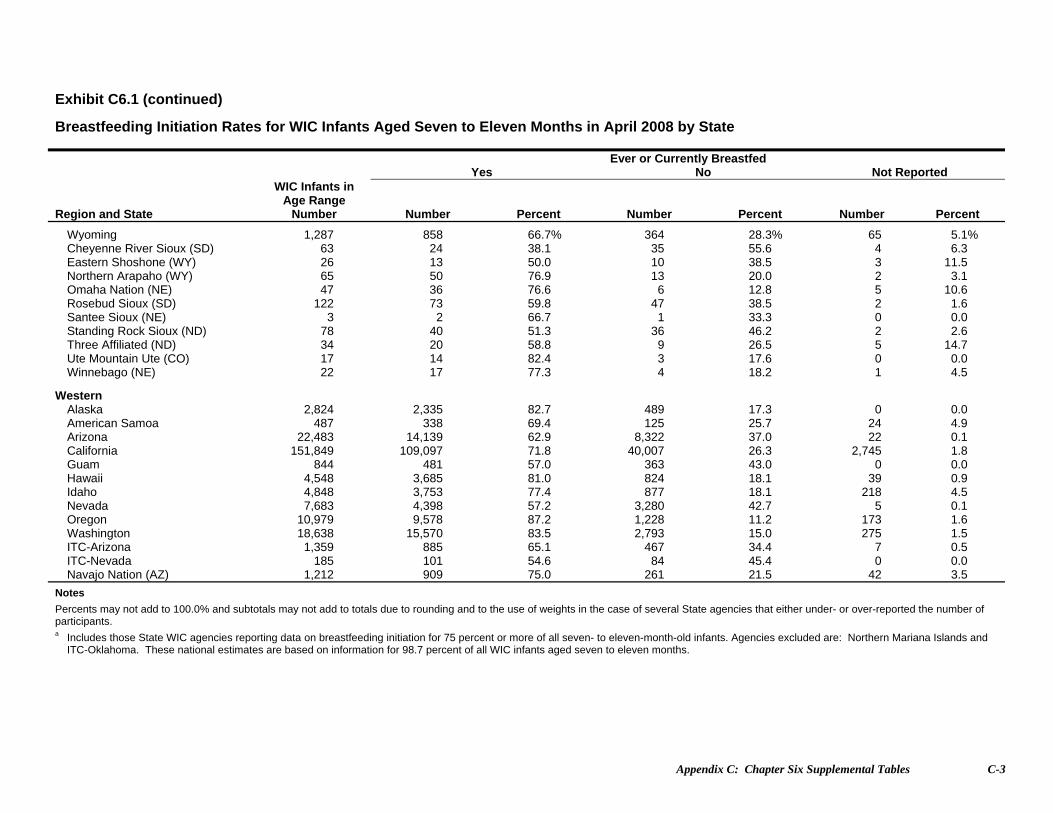
Appendix C: Chapter Six Supplemental Tables C-3
Exhibit C6.1 (continued)
Breastfeeding Initiation Rates for WIC Infants Aged Seven to Eleven Months in April 2008 by State
Ever or Currently Breastfed Yes No Not Reported
Region and State
WIC Infants in Age Range
Number Number Percent Number Percent Number Percent
Wyoming 1,287 858 66.7% 364 28.3% 65 5.1% Cheyenne River Sioux (SD) 63 24 38.1 35 55.6 4 6.3 Eastern Shoshone (WY) 26 13 50.0 10 38.5 3 11.5 Northern Arapaho (WY) 65 50 76.9 13 20.0 2 3.1 Omaha Nation (NE) 47 36 76.6 6 12.8 5 10.6 Rosebud Sioux (SD) 122 73 59.8 47 38.5 2 1.6 Santee Sioux (NE) 3 2 66.7 1 33.3 0 0.0 Standing Rock Sioux (ND) 78 40 51.3 36 46.2 2 2.6 Three Affiliated (ND) 34 20 58.8 9 26.5 5 14.7 Ute Mountain Ute (CO) 17 14 82.4 3 17.6 0 0.0 Winnebago (NE) 22 17 77.3 4 18.2 1 4.5
Western Alaska 2,824 2,335 82.7 489 17.3 0 0.0 American Samoa 487 338 69.4 125 25.7 24 4.9 Arizona 22,483 14,139 62.9 8,322 37.0 22 0.1 California 151,849 109,097 71.8 40,007 26.3 2,745 1.8 Guam 844 481 57.0 363 43.0 0 0.0 Hawaii 4,548 3,685 81.0 824 18.1 39 0.9 Idaho 4,848 3,753 77.4 877 18.1 218 4.5 Nevada 7,683 4,398 57.2 3,280 42.7 5 0.1 Oregon 10,979 9,578 87.2 1,228 11.2 173 1.6 Washington 18,638 15,570 83.5 2,793 15.0 275 1.5 ITC-Arizona 1,359 885 65.1 467 34.4 7 0.5 ITC-Nevada 185 101 54.6 84 45.4 0 0.0 Navajo Nation (AZ) 1,212 909 75.0 261 21.5 42 3.5
Notes
Percents may not add to 100.0% and subtotals may not add to totals due to rounding and to the use of weights in the case of several State agencies that either under- or over-reported the number of participants. a Includes those State WIC agencies reporting data on breastfeeding initiation for 75 percent or more of all seven- to eleven-month-old infants. Agencies excluded are: Northern Mariana Islands and
ITC-Oklahoma. These national estimates are based on information for 98.7 percent of all WIC infants aged seven to eleven months.
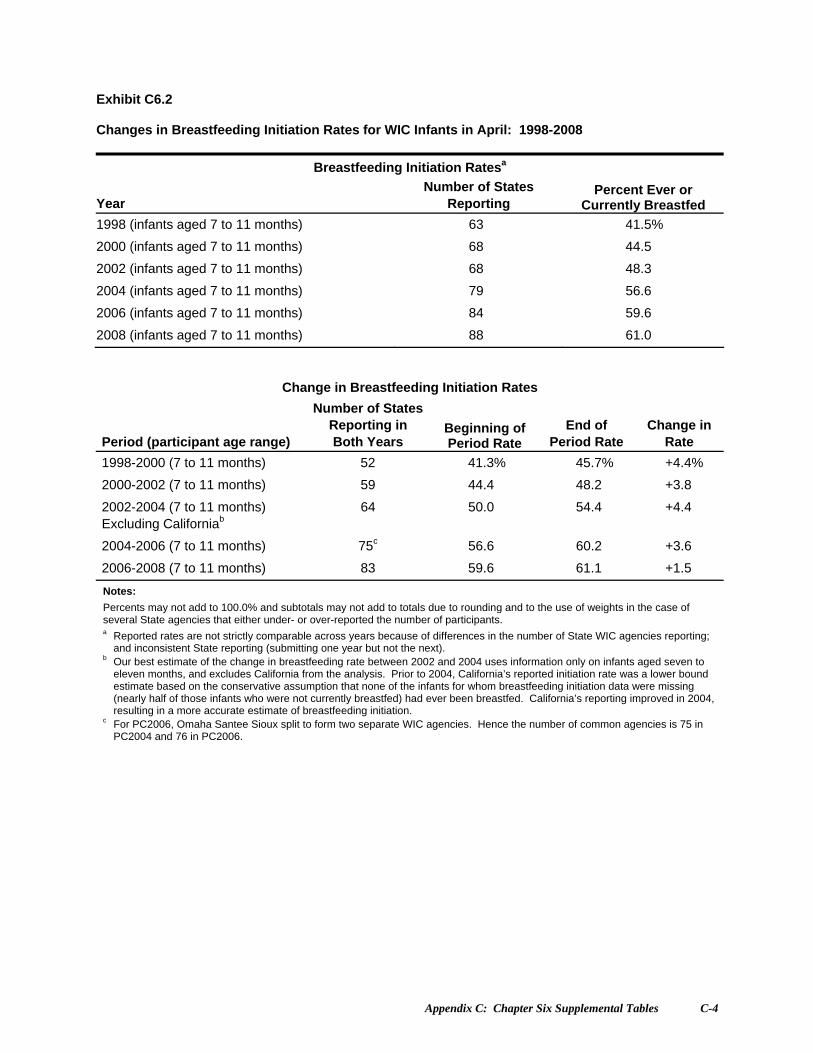
Appendix C: Chapter Six Supplemental Tables C-4
Exhibit C6.2 Changes in Breastfeeding Initiation Rates for WIC Infants in April: 1998-2008
Breastfeeding Initiation Ratesa
Year Number of States
Reporting Percent Ever or
Currently Breastfed
1998 (infants aged 7 to 11 months) 63 41.5%
2000 (infants aged 7 to 11 months) 68 44.5
2002 (infants aged 7 to 11 months) 68 48.3
2004 (infants aged 7 to 11 months) 79 56.6
2006 (infants aged 7 to 11 months) 84 59.6
2008 (infants aged 7 to 11 months) 88 61.0
Change in Breastfeeding Initiation Rates
Period (participant age range)
Number of States Reporting in Both Years
Beginning of Period Rate
End of Period Rate
Change in Rate
1998-2000 (7 to 11 months) 52 41.3% 45.7% +4.4%
2000-2002 (7 to 11 months) 59 44.4 48.2 +3.8
2002-2004 (7 to 11 months) Excluding Californiab
64 50.0 54.4 +4.4
2004-2006 (7 to 11 months) 75c 56.6 60.2 +3.6
2006-2008 (7 to 11 months) 83 59.6 61.1 +1.5
Notes:
Percents may not add to 100.0% and subtotals may not add to totals due to rounding and to the use of weights in the case of several State agencies that either under- or over-reported the number of participants. a Reported rates are not strictly comparable across years because of differences in the number of State WIC agencies reporting;
and inconsistent State reporting (submitting one year but not the next). b Our best estimate of the change in breastfeeding rate between 2002 and 2004 uses information only on infants aged seven to
eleven months, and excludes California from the analysis. Prior to 2004, California’s reported initiation rate was a lower bound estimate based on the conservative assumption that none of the infants for whom breastfeeding initiation data were missing (nearly half of those infants who were not currently breastfed) had ever been breastfed. California’s reporting improved in 2004, resulting in a more accurate estimate of breastfeeding initiation.
c For PC2006, Omaha Santee Sioux split to form two separate WIC agencies. Hence the number of common agencies is 75 in PC2004 and 76 in PC2006.
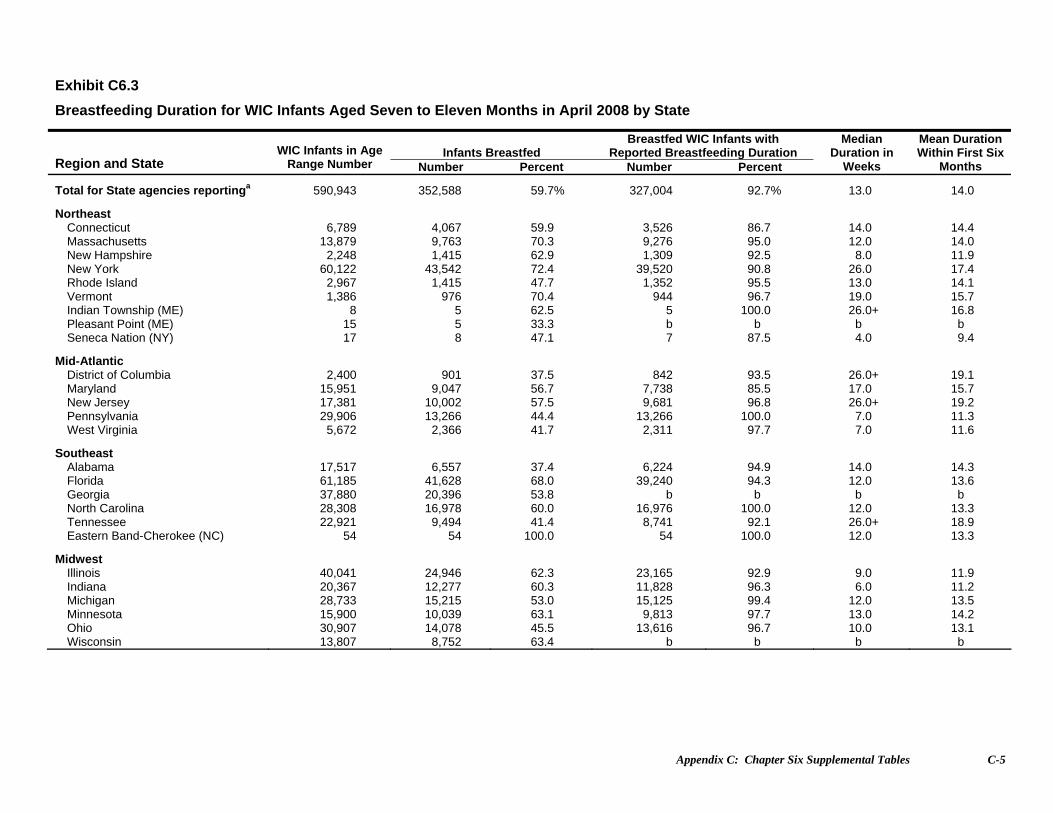
Appendix C: Chapter Six Supplemental Tables C-5
Exhibit C6.3
Breastfeeding Duration for WIC Infants Aged Seven to Eleven Months in April 2008 by State
Infants Breastfed Breastfed WIC Infants with
Reported Breastfeeding Duration Region and State
WIC Infants in Age Range Number Number Percent Number Percent
Median Duration in
Weeks
Mean Duration Within First Six
Months
Total for State agencies reportinga 590,943 352,588 59.7% 327,004 92.7% 13.0 14.0
Northeast Connecticut 6,789 4,067 59.9 3,526 86.7 14.0 14.4 Massachusetts 13,879 9,763 70.3 9,276 95.0 12.0 14.0 New Hampshire 2,248 1,415 62.9 1,309 92.5 8.0 11.9 New York 60,122 43,542 72.4 39,520 90.8 26.0 17.4 Rhode Island 2,967 1,415 47.7 1,352 95.5 13.0 14.1 Vermont 1,386 976 70.4 944 96.7 19.0 15.7 Indian Township (ME) 8 5 62.5 5 100.0 26.0+ 16.8 Pleasant Point (ME) 15 5 33.3 b b b b Seneca Nation (NY) 17 8 47.1 7 87.5 4.0 9.4
Mid-Atlantic District of Columbia 2,400 901 37.5 842 93.5 26.0+ 19.1 Maryland 15,951 9,047 56.7 7,738 85.5 17.0 15.7 New Jersey 17,381 10,002 57.5 9,681 96.8 26.0+ 19.2 Pennsylvania 29,906 13,266 44.4 13,266 100.0 7.0 11.3 West Virginia 5,672 2,366 41.7 2,311 97.7 7.0 11.6
Southeast Alabama 17,517 6,557 37.4 6,224 94.9 14.0 14.3 Florida 61,185 41,628 68.0 39,240 94.3 12.0 13.6 Georgia 37,880 20,396 53.8 b b b b North Carolina 28,308 16,978 60.0 16,976 100.0 12.0 13.3 Tennessee 22,921 9,494 41.4 8,741 92.1 26.0+ 18.9 Eastern Band-Cherokee (NC) 54 54 100.0 54 100.0 12.0 13.3
Midwest Illinois 40,041 24,946 62.3 23,165 92.9 9.0 11.9 Indiana 20,367 12,277 60.3 11,828 96.3 6.0 11.2 Michigan 28,733 15,215 53.0 15,125 99.4 12.0 13.5 Minnesota 15,900 10,039 63.1 9,813 97.7 13.0 14.2 Ohio 30,907 14,078 45.5 13,616 96.7 10.0 13.1 Wisconsin 13,807 8,752 63.4 b b b b

Appendix C: Chapter Six Supplemental Tables C-6
Exhibit C6.3 (continued)
Breastfeeding Duration for WIC Infants Aged Seven to Eleven Months in April 2008 by State
Infants Breastfed Breastfed WIC Infants with
Reported Breastfeeding Duration Region and State
WIC Infants in Age Range
Number Number Percent Number Percent
Median Duration in
Weeks
Mean Duration Within First Six
Months
Southwest New Mexico 7,416 5,317 71.7% b b b b ACL (NM) 54 41 75.9 38 92.7 26.0+ 19.4 Chicksaw Nation (OK) 365 174 47.7 170 97.7 8.0 11.7 Choctaw Nation (OK) 423 94 22.2 93 98.9 24.0 19.3 Eight Northern Pueblos (NM) 37 31 83.8 31 100.0 4.0 10.4 Five Sandoval Pueblos (NM) 46 39 84.8 35 89.7 26.0+ 17.5 Muscogee Creek Nation (OK) 288 138 47.9 135 97.8 19.0 16.7 Osage Nation (OK) 275 108 39.3 107 99.1 6.0 10.8 Otoe-Missouria (OK) 75 40 53.3 39 97.5 6.0 10.5 Pueblo of Isleta (NM) 90 75 83.3 68 90.7 15.5 14.8 Pueblo of San Felipe (NM) 30 27 90.0 27 100.0 9.0 7.9 Pueblo of Zuni (NM) 72 60 83.3 57 95.0 22.0 17.9 Santo Domingo (NM) 19 14 73.7 14 100.0 23.5 16.4 WCD (OK) 370 185 50.0 170 91.9 14.0 14.1
Mountain Plains Iowa 8,590 5,058 58.9 4,461 88.2 13.0 14.3 Kansas 8,977 6,048 67.4 b b b b Missouri 18,673 10,043 53.8 9,991 99.5 6.0 10.8 Montana 2,590 1,896 73.2 b b b b Nebraska 5,618 3,839 68.3 b b b b North Dakota 1,637 976 59.6 938 96.1 11.0 13.7 South Dakota 2,430 1,409 58.0 b b b b Wyoming 1,287 858 66.7 815 95.0 10.0 12.6 Cheyenne River Sioux (SD) 63 24 38.1 21 87.5 4.0 8.0 Eastern Shoshone (WY) 26 13 50.0 b b b b Northern Arapahoe (WY) 65 50 76.9 b b b b Omaha Nation (NE) 47 36 76.6 32 88.9 4.0 8.0 Standing Rock Sioux (ND) 78 40 51.3 40 100.0 6.0 10.0 Three Affiliated (ND) 34 20 58.8 19 95.0 5.0 8.8 Ute Mountaun Ute (CO) 17 14 82.4 12 85.7 10.0 13.3 Winnebago (NE) 22 17 77.3 17 100.0 6.0 8.9
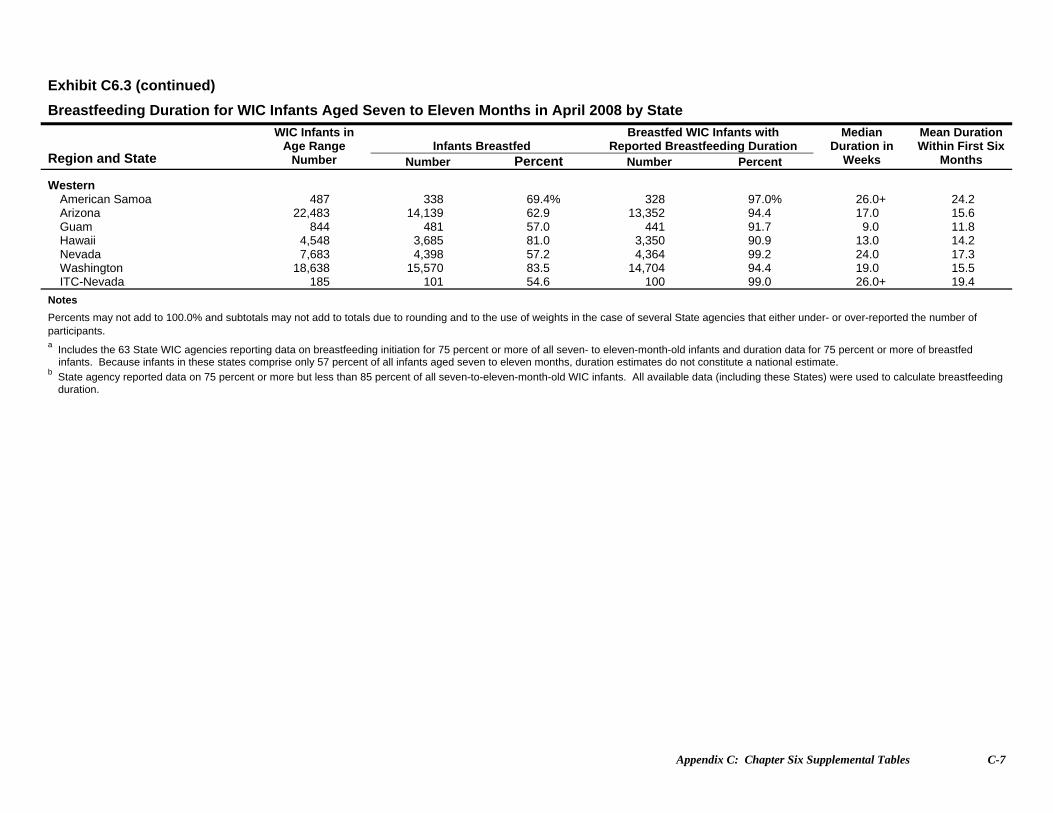
Appendix C: Chapter Six Supplemental Tables C-7
Exhibit C6.3 (continued)
Breastfeeding Duration for WIC Infants Aged Seven to Eleven Months in April 2008 by State
Infants Breastfed Breastfed WIC Infants with
Reported Breastfeeding Duration Region and State
WIC Infants in Age Range
Number Number Percent Number Percent
Median Duration in
Weeks
Mean Duration Within First Six
Months
Western American Samoa 487 338 69.4% 328 97.0% 26.0+ 24.2 Arizona 22,483 14,139 62.9 13,352 94.4 17.0 15.6 Guam 844 481 57.0 441 91.7 9.0 11.8 Hawaii 4,548 3,685 81.0 3,350 90.9 13.0 14.2 Nevada 7,683 4,398 57.2 4,364 99.2 24.0 17.3 Washington 18,638 15,570 83.5 14,704 94.4 19.0 15.5 ITC-Nevada 185 101 54.6 100 99.0 26.0+ 19.4
Notes
Percents may not add to 100.0% and subtotals may not add to totals due to rounding and to the use of weights in the case of several State agencies that either under- or over-reported the number of participants. a Includes the 63 State WIC agencies reporting data on breastfeeding initiation for 75 percent or more of all seven- to eleven-month-old infants and duration data for 75 percent or more of breastfed
infants. Because infants in these states comprise only 57 percent of all infants aged seven to eleven months, duration estimates do not constitute a national estimate. b State agency reported data on 75 percent or more but less than 85 percent of all seven-to-eleven-month-old WIC infants. All available data (including these States) were used to calculate breastfeeding duration.
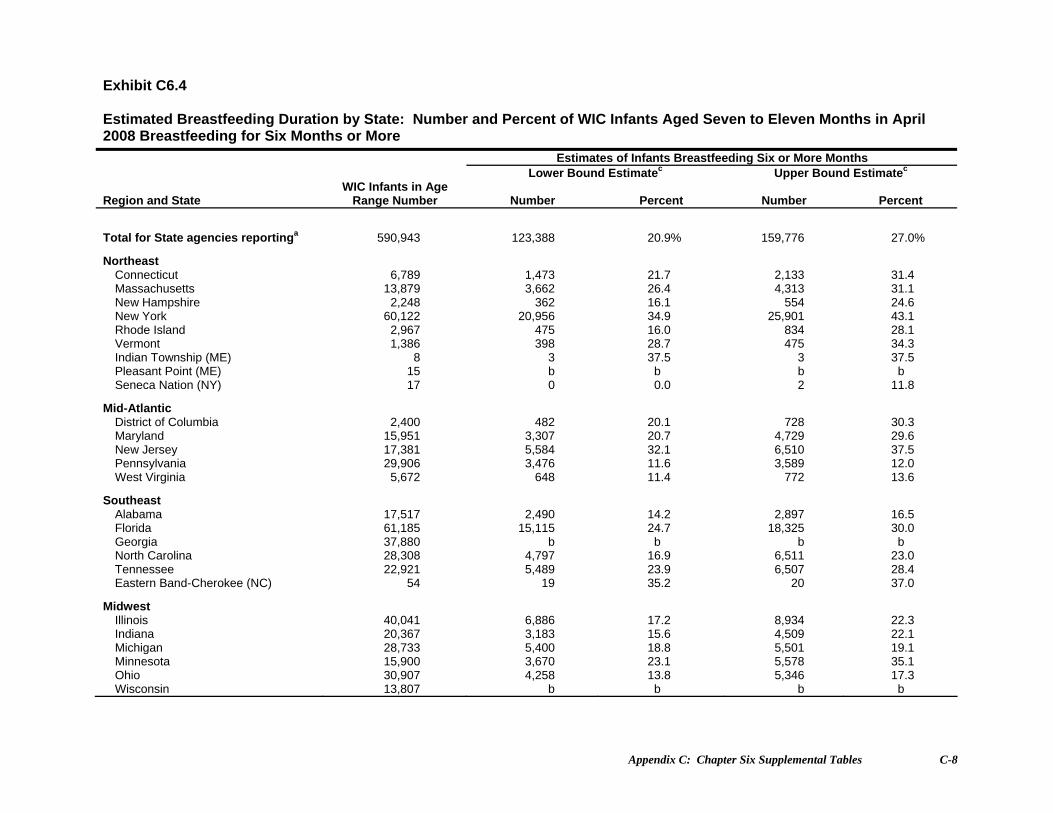
Appendix C: Chapter Six Supplemental Tables C-8
Exhibit C6.4 Estimated Breastfeeding Duration by State: Number and Percent of WIC Infants Aged Seven to Eleven Months in April 2008 Breastfeeding for Six Months or More
Estimates of Infants Breastfeeding Six or More Months Lower Bound Estimatec Upper Bound Estimatec
Region and State WIC Infants in Age
Range Number Number Percent Number Percent
Total for State agencies reportinga 590,943 123,388 20.9% 159,776 27.0%
Northeast Connecticut 6,789 1,473 21.7 2,133 31.4 Massachusetts 13,879 3,662 26.4 4,313 31.1 New Hampshire 2,248 362 16.1 554 24.6 New York 60,122 20,956 34.9 25,901 43.1 Rhode Island 2,967 475 16.0 834 28.1 Vermont 1,386 398 28.7 475 34.3 Indian Township (ME) 8 3 37.5 3 37.5 Pleasant Point (ME) 15 b b b b Seneca Nation (NY) 17 0 0.0 2 11.8
Mid-Atlantic District of Columbia 2,400 482 20.1 728 30.3 Maryland 15,951 3,307 20.7 4,729 29.6 New Jersey 17,381 5,584 32.1 6,510 37.5 Pennsylvania 29,906 3,476 11.6 3,589 12.0 West Virginia 5,672 648 11.4 772 13.6
Southeast Alabama 17,517 2,490 14.2 2,897 16.5 Florida 61,185 15,115 24.7 18,325 30.0 Georgia 37,880 b b b b North Carolina 28,308 4,797 16.9 6,511 23.0 Tennessee 22,921 5,489 23.9 6,507 28.4 Eastern Band-Cherokee (NC) 54 19 35.2 20 37.0
Midwest Illinois 40,041 6,886 17.2 8,934 22.3 Indiana 20,367 3,183 15.6 4,509 22.1 Michigan 28,733 5,400 18.8 5,501 19.1 Minnesota 15,900 3,670 23.1 5,578 35.1 Ohio 30,907 4,258 13.8 5,346 17.3 Wisconsin 13,807 b b b b
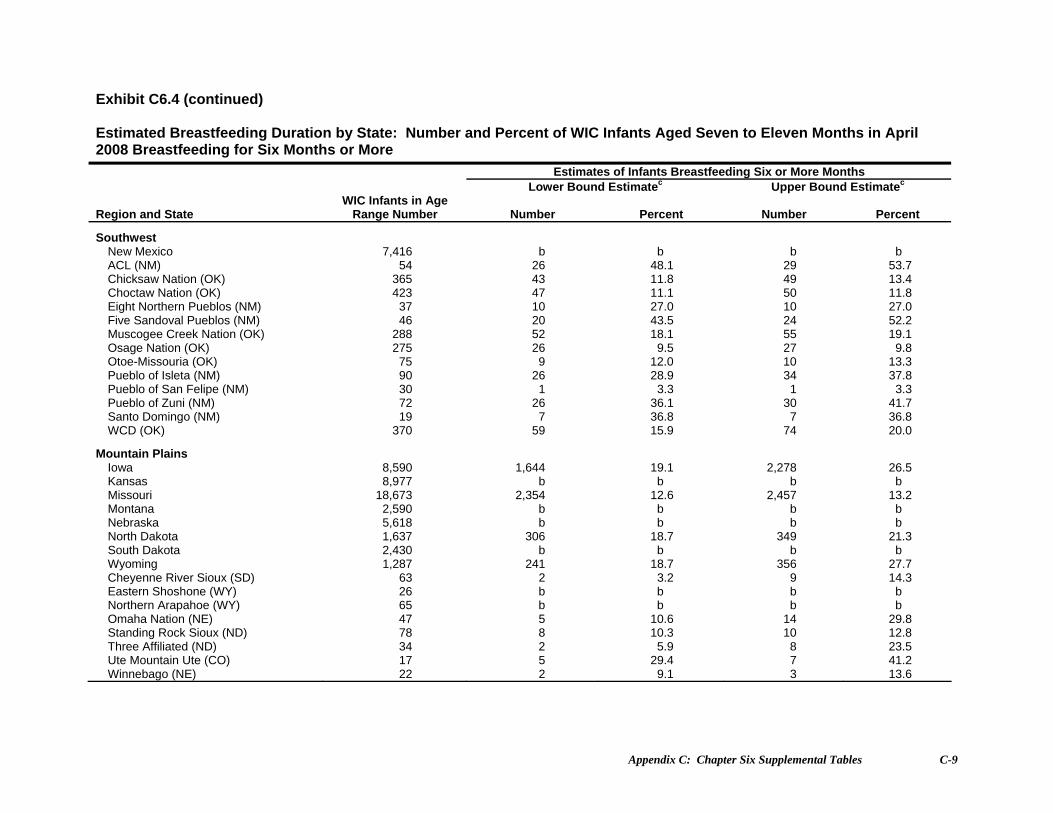
Appendix C: Chapter Six Supplemental Tables C-9
Exhibit C6.4 (continued) Estimated Breastfeeding Duration by State: Number and Percent of WIC Infants Aged Seven to Eleven Months in April 2008 Breastfeeding for Six Months or More
Estimates of Infants Breastfeeding Six or More Months Lower Bound Estimatec Upper Bound Estimatec
Region and State WIC Infants in Age
Range Number Number Percent Number Percent
Southwest New Mexico 7,416 b b b b ACL (NM) 54 26 48.1 29 53.7 Chicksaw Nation (OK) 365 43 11.8 49 13.4 Choctaw Nation (OK) 423 47 11.1 50 11.8 Eight Northern Pueblos (NM) 37 10 27.0 10 27.0 Five Sandoval Pueblos (NM) 46 20 43.5 24 52.2 Muscogee Creek Nation (OK) 288 52 18.1 55 19.1 Osage Nation (OK) 275 26 9.5 27 9.8 Otoe-Missouria (OK) 75 9 12.0 10 13.3 Pueblo of Isleta (NM) 90 26 28.9 34 37.8 Pueblo of San Felipe (NM) 30 1 3.3 1 3.3 Pueblo of Zuni (NM) 72 26 36.1 30 41.7 Santo Domingo (NM) 19 7 36.8 7 36.8 WCD (OK) 370 59 15.9 74 20.0
Mountain Plains Iowa 8,590 1,644 19.1 2,278 26.5 Kansas 8,977 b b b b Missouri 18,673 2,354 12.6 2,457 13.2 Montana 2,590 b b b b Nebraska 5,618 b b b b North Dakota 1,637 306 18.7 349 21.3 South Dakota 2,430 b b b b Wyoming 1,287 241 18.7 356 27.7 Cheyenne River Sioux (SD) 63 2 3.2 9 14.3 Eastern Shoshone (WY) 26 b b b b Northern Arapahoe (WY) 65 b b b b Omaha Nation (NE) 47 5 10.6 14 29.8 Standing Rock Sioux (ND) 78 8 10.3 10 12.8 Three Affiliated (ND) 34 2 5.9 8 23.5 Ute Mountain Ute (CO) 17 5 29.4 7 41.2 Winnebago (NE) 22 2 9.1 3 13.6

Appendix C: Chapter Six Supplemental Tables C-10
Exhibit C6.4 (continued) Estimated Breastfeeding Duration by State: Number and Percent of WIC Infants Aged Seven to Eleven Months in April 2008 Breastfeeding for Six Months or More
Estimates of Infants Breastfeeding Six or More Months Lower Bound Estimatec Upper Bound Estimatec
Region and State WIC Infants in Age
Range Number Number Percent Number Percent
Western American Samoa 487 283 58.1% 329 67.6% Arizona 22,483 5,351 23.8 6,349 28.2 Guam 844 140 16.5 181 21.4 Hawaii 4,548 1,251 27.5 1,634 35.9 Nevada 7,683 2,320 30.2 2,388 31.1 Washington 18,638 6,770 36.3 8,005 42.9 ITC-Nevada 185 62 33.5 65 35.1
Notes
Percents may not add to 100.0% and subtotals may not add to totals due to rounding and to the use of weights in the case of several State agencies that either under- or over-reported the number of participants. a Includes the 63 State WIC agencies reporting data on breastfeeding initiation for 75 percent or more of all seven- to eleven-month-old infants and duration data for 75 percent or
more of breastfed infants. Because infants in these states comprise only 57 percent of all infants aged seven to eleven months, duration estimates do not constitute a national estimate.
b State agency reported data on 75 percent or more but less than 85 percent of all seven- to eleven-month-old WIC infants. All available data (including these States) were used to calculate breastfeeding duration.
c The lower bound estimate counts only those infants who reported six or more months of breastfeeding. The upper bound estimate includes infants known to have been breastfed for at least six months as well as infants for whom initiation and duration of breastfeeding are not known. It also counts currently breastfeeding infants, who were between five and six months old when data were collected, as having been breastfed for six months.
APPENDIX D
CHAPTER SEVEN SUPPLEMENTAL TABLE
DISTRIBUTION OF MIGRANT WIC PARTICIPANTS BY STATE

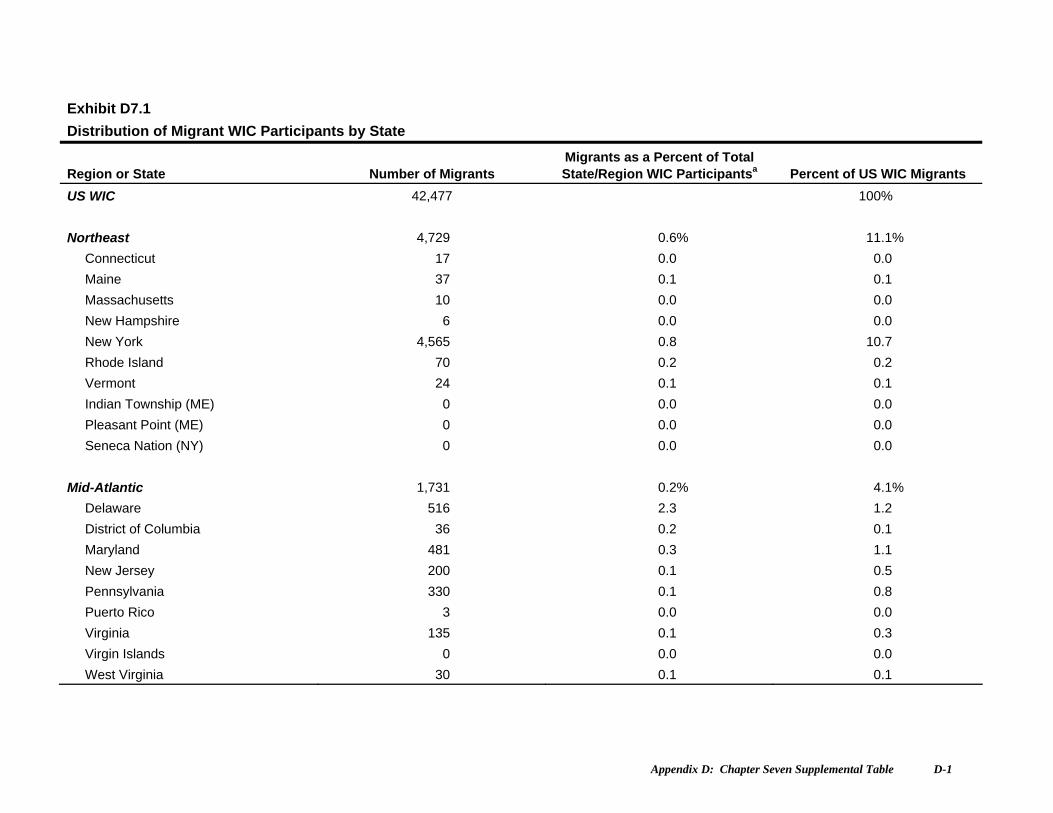
Appendix D: Chapter Seven Supplemental Table D-1
Exhibit D7.1
Distribution of Migrant WIC Participants by State
Region or State Number of Migrants Migrants as a Percent of Total State/Region WIC Participantsa Percent of US WIC Migrants
US WIC 42,477 100%
Northeast 4,729 0.6% 11.1%
Connecticut 17 0.0 0.0
Maine 37 0.1 0.1
Massachusetts 10 0.0 0.0
New Hampshire 6 0.0 0.0
New York 4,565 0.8 10.7
Rhode Island 70 0.2 0.2
Vermont 24 0.1 0.1
Indian Township (ME) 0 0.0 0.0
Pleasant Point (ME) 0 0.0 0.0
Seneca Nation (NY) 0 0.0 0.0
Mid-Atlantic 1,731 0.2% 4.1%
Delaware 516 2.3 1.2
District of Columbia 36 0.2 0.1
Maryland 481 0.3 1.1
New Jersey 200 0.1 0.5
Pennsylvania 330 0.1 0.8
Puerto Rico 3 0.0 0.0
Virginia 135 0.1 0.3
Virgin Islands 0 0.0 0.0
West Virginia 30 0.1 0.1

Appendix D: Chapter Seven Supplemental Table D-2
Exhibit D7.1 (continued)
Distribution of Migrant WIC Participants by State
Region or State Number of Migrants Migrants as a Percent of Total State/Region WIC Participantsa Percent of US WIC Migrants
Southeast 13,758 0.7% 32.4%
Alabama 90 0.1 0.2
Florida 8,650 1.6 20.4
Georgia 101 0.0 0.2
Kentucky 893 0.6 2.1
Mississippi 0 0.0 0.0
North Carolina 2,528 0.9 6.0
South Carolina 221 0.2 0.5
Tennessee 1,272 0.7 3.0
Eastern Band-Cherokee (NC) 3 0.4 0.0
Mississippi Choctaw 0 0.0 0.0
Midwest 4,293 0.3% 10.1%
Illinois 112 0.0 0.3
Indiana 80 0.0 0.2
Michigan 3,125 1.2 7.4
Minnesota 321 0.2 0.8
Ohio 587 0.2 1.4
Wisconsin 68 0.1 0.2
Appendix D: Chapter Seven Supplemental Table D-3
Exhibit D7.1 (continued)
Distribution of Migrant WIC Participants by State
Region or State Number of Migrants Migrants as a Percent of Total State/Region WIC Participantsa Percent of US WIC Migrants
Southwest 5,224 0.4% 12.3%
Arkansas 995 1.0 2.3
Louisiana 708 0.5 1.7
New Mexico 18 0.0 0.0
Oklahoma 2 0.0 0.0
Texas 3,496 0.3 8.2
ACL (NM) 0 0.0 0.0
Cherokee Nation (OK) 1 0.0 0.0
Chickasaw Nation (OK) 2 0.1 0.0
Choctaw Nation (OK) 2 0.1 0.0
Citizen-Potawatomi (OK) 0 0.0 0.0
Eight Northern Pueblos (NM) 0 0.0 0.0
Five Sandoval Pueblos (NM) 0 0.0 0.0
ITC-Oklahoma 0 0.0 0.0
Muscogee Creek Nation (OK) 0 0.0 0.0
Osage Nation (OK) 0 0.0 0.0
Otoe-Missouria (OK) 0 0.0 0.0
Pueblo of Isleta (OK) 0 0.0 0.0
Pueblo of San Felipe (NM) 0 0.0 0.0
Pueblo of Zuñi (NM) 0 0.0 0.0
Santo Domingo (NM) 0 0.0 0.0
WCD (OK) 0 0.0 0.0
Appendix D: Chapter Seven Supplemental Table D-4
Exhibit D7.1 (continued)
Distribution of Migrant WIC Participants by State
Region or State Number of Migrants Migrants as a Percent of Total State/Region WIC Participantsa Percent of US WIC Migrants
Mountain Plains 374 0.1% 0.9% Colorado 97 0.1 0.2 Iowa 37 0.0 0.1 Kansas 16 0.0 0.0 Missouri 9 0.0 0.0 Montana 20 0.1 0.0 Nebraska 40 0.1 0.1 North Dakota 57 0.4 0.1 South Dakota 2 0.0 0.0 Utah 85 0.1 0.2 Wyoming 11 0.1 0.0 Cheyenne River Sioux (SD) 0 0.0 0.0 Eastern Shoshone (WY) 0 0.0 0.0 Northern Arapahoe (WY) 0 0.0 0.0 Omaha Nation (NE) 0 0.0 0.0 Rosebud Sioux (SD) 0 0.0 0.0 Santee Sioux Nation (NE) 0 0.0 0.0 Standing Rock Sioux (ND) 0 0.0 0.0 Three Affiliated (ND) 0 0.0 0.0 Ute Mountain Ute (CO) 0 0.0 0.0 Winnebago (NE) 0 0.0 0.0
Appendix D: Chapter Seven Supplemental Table D-5
Exhibit D7.1 (continued)
Distribution of Migrant WIC Participants by State
Region or State Number of Migrants Migrants as a Percent of Total State/Region WIC Participantsa Percent of US WIC Migrants
Western 12,369 0.5% 29.1% Alaska 9 0.0 0.0 American Samoa 0 0.0 0.0 Arizona 2,022 1.0 4.8 California 9,987 0.6 23.5 Guam 1 0.0 0.0 Hawaii 8 0.0 0.0 Idaho 67 0.1 0.2 Nevada 38 0.1 0.1 Northern Mariana Islands NA NA NA Oregon NA NA NA Washington 222 0.1 0.5 ITC-Arizona 12 0.1 0.0 ITC-Nevada 3 0.1 0.0 Navajo Nation (AZ) 0 0.0 0.0
Notes
NA = Migrant status data not reported.
a For States, calculated as number of migrant WIC participants in State as a percentage of total WIC participants in State. For Regions, calculated as number of migrant WIC participants in Region as a percentage of total WIC participants in Region.

Appendix D: Chapter Seven Supplemental Table D-6
APPENDIX E
SUPPLEMENTAL DATA SET
STATE-BY-STATE TABLES

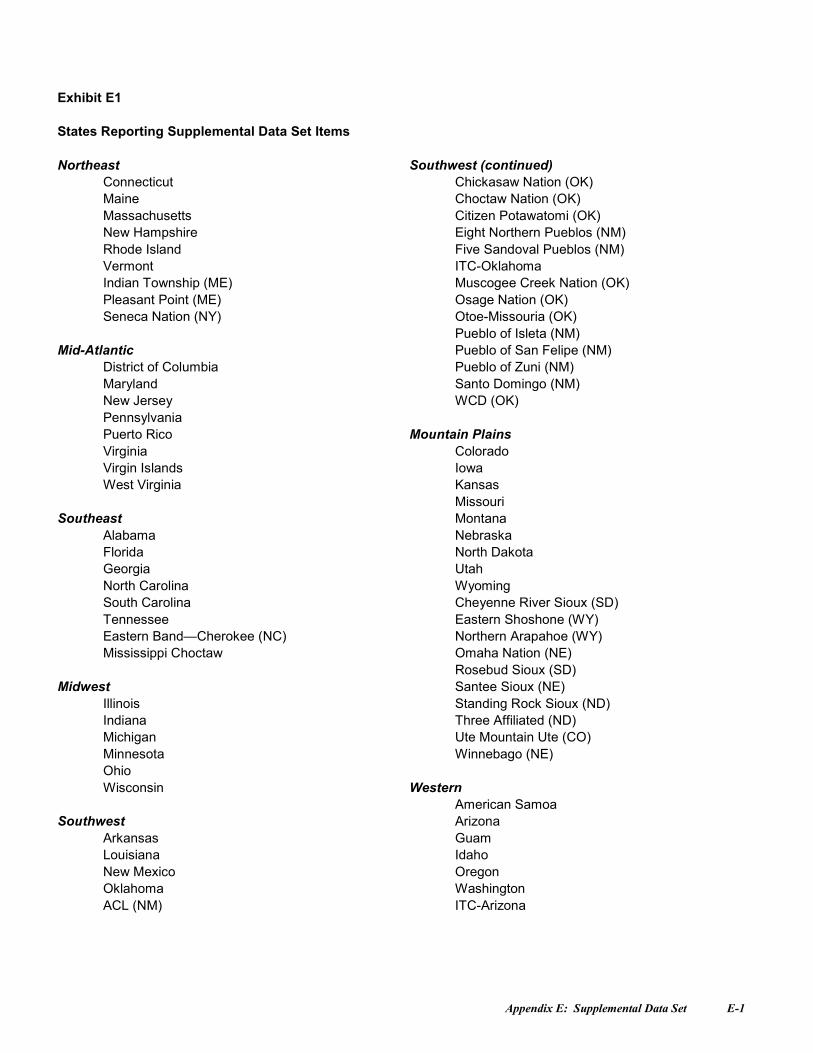
Appendix E: Supplemental Data Set E-1
Exhibit E1
States Reporting Supplemental Data Set Items
NortheastConnecticutMaineMassachusettsNew HampshireRhode IslandVermontIndian Township (ME)Pleasant Point (ME)Seneca Nation (NY)
Mid-AtlanticDistrict of ColumbiaMarylandNew JerseyPennsylvaniaPuerto RicoVirginiaVirgin IslandsWest Virginia
SoutheastAlabamaFloridaGeorgiaNorth CarolinaSouth CarolinaTennesseeEastern Band—Cherokee (NC)Mississippi Choctaw
MidwestIllinoisIndianaMichiganMinnesotaOhioWisconsin
SouthwestArkansasLouisianaNew MexicoOklahomaACL (NM)
Southwest (continued)Chickasaw Nation (OK)Choctaw Nation (OK)Citizen Potawatomi (OK)Eight Northern Pueblos (NM)Five Sandoval Pueblos (NM)ITC-OklahomaMuscogee Creek Nation (OK)Osage Nation (OK)Otoe-Missouria (OK)Pueblo of Isleta (NM)Pueblo of San Felipe (NM)Pueblo of Zuni (NM)Santo Domingo (NM)WCD (OK)
Mountain PlainsColoradoIowaKansasMissouriMontanaNebraskaNorth DakotaUtahWyomingCheyenne River Sioux (SD)Eastern Shoshone (WY)Northern Arapahoe (WY)Omaha Nation (NE)Rosebud Sioux (SD)Santee Sioux (NE)Standing Rock Sioux (ND)Three Affiliated (ND)Ute Mountain Ute (CO)Winnebago (NE)
WesternAmerican SamoaArizonaGuamIdahoOregonWashingtonITC-Arizona
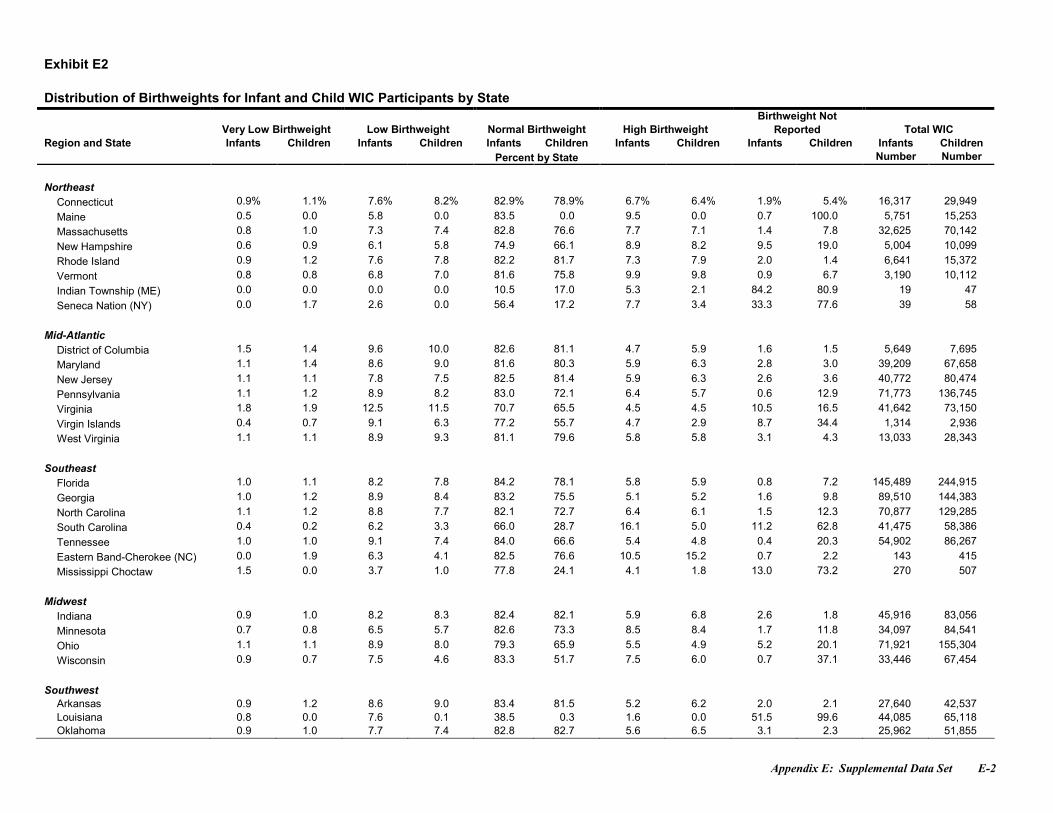
Appendix E: Supplemental Data Set E-2
Exhibit E2
Distribution of Birthweights for Infant and Child WIC Participants by State
Very Low Birthweight Low Birthweight Normal Birthweight High BirthweightBirthweight Not
Reported Total WICRegion and State Infants Children Infants Children Infants Children Infants Children Infants Children Infants Children
Percent by State Number Number
NortheastConnecticut 0.9% 1.1% 7.6% 8.2% 82.9% 78.9% 6.7% 6.4% 1.9% 5.4% 16,317 29,949Maine 0.5 0.0 5.8 0.0 83.5 0.0 9.5 0.0 0.7 100.0 5,751 15,253Massachusetts 0.8 1.0 7.3 7.4 82.8 76.6 7.7 7.1 1.4 7.8 32,625 70,142New Hampshire 0.6 0.9 6.1 5.8 74.9 66.1 8.9 8.2 9.5 19.0 5,004 10,099Rhode Island 0.9 1.2 7.6 7.8 82.2 81.7 7.3 7.9 2.0 1.4 6,641 15,372Vermont 0.8 0.8 6.8 7.0 81.6 75.8 9.9 9.8 0.9 6.7 3,190 10,112Indian Township (ME) 0.0 0.0 0.0 0.0 10.5 17.0 5.3 2.1 84.2 80.9 19 47Seneca Nation (NY) 0.0 1.7 2.6 0.0 56.4 17.2 7.7 3.4 33.3 77.6 39 58
Mid-AtlanticDistrict of Columbia 1.5 1.4 9.6 10.0 82.6 81.1 4.7 5.9 1.6 1.5 5,649 7,695Maryland 1.1 1.4 8.6 9.0 81.6 80.3 5.9 6.3 2.8 3.0 39,209 67,658New Jersey 1.1 1.1 7.8 7.5 82.5 81.4 5.9 6.3 2.6 3.6 40,772 80,474Pennsylvania 1.1 1.2 8.9 8.2 83.0 72.1 6.4 5.7 0.6 12.9 71,773 136,745Virginia 1.8 1.9 12.5 11.5 70.7 65.5 4.5 4.5 10.5 16.5 41,642 73,150Virgin Islands 0.4 0.7 9.1 6.3 77.2 55.7 4.7 2.9 8.7 34.4 1,314 2,936West Virginia 1.1 1.1 8.9 9.3 81.1 79.6 5.8 5.8 3.1 4.3 13,033 28,343
SoutheastFlorida 1.0 1.1 8.2 7.8 84.2 78.1 5.8 5.9 0.8 7.2 145,489 244,915Georgia 1.0 1.2 8.9 8.4 83.2 75.5 5.1 5.2 1.6 9.8 89,510 144,383North Carolina 1.1 1.2 8.8 7.7 82.1 72.7 6.4 6.1 1.5 12.3 70,877 129,285South Carolina 0.4 0.2 6.2 3.3 66.0 28.7 16.1 5.0 11.2 62.8 41,475 58,386Tennessee 1.0 1.0 9.1 7.4 84.0 66.6 5.4 4.8 0.4 20.3 54,902 86,267Eastern Band-Cherokee (NC) 0.0 1.9 6.3 4.1 82.5 76.6 10.5 15.2 0.7 2.2 143 415Mississippi Choctaw 1.5 0.0 3.7 1.0 77.8 24.1 4.1 1.8 13.0 73.2 270 507
MidwestIndiana 0.9 1.0 8.2 8.3 82.4 82.1 5.9 6.8 2.6 1.8 45,916 83,056Minnesota 0.7 0.8 6.5 5.7 82.6 73.3 8.5 8.4 1.7 11.8 34,097 84,541Ohio 1.1 1.1 8.9 8.0 79.3 65.9 5.5 4.9 5.2 20.1 71,921 155,304Wisconsin 0.9 0.7 7.5 4.6 83.3 51.7 7.5 6.0 0.7 37.1 33,446 67,454
SouthwestArkansas 0.9 1.2 8.6 9.0 83.4 81.5 5.2 6.2 2.0 2.1 27,640 42,537Louisiana 0.8 0.0 7.6 0.1 38.5 0.3 1.6 0.0 51.5 99.6 44,085 65,118Oklahoma 0.9 1.0 7.7 7.4 82.8 82.7 5.6 6.5 3.1 2.3 25,962 51,855
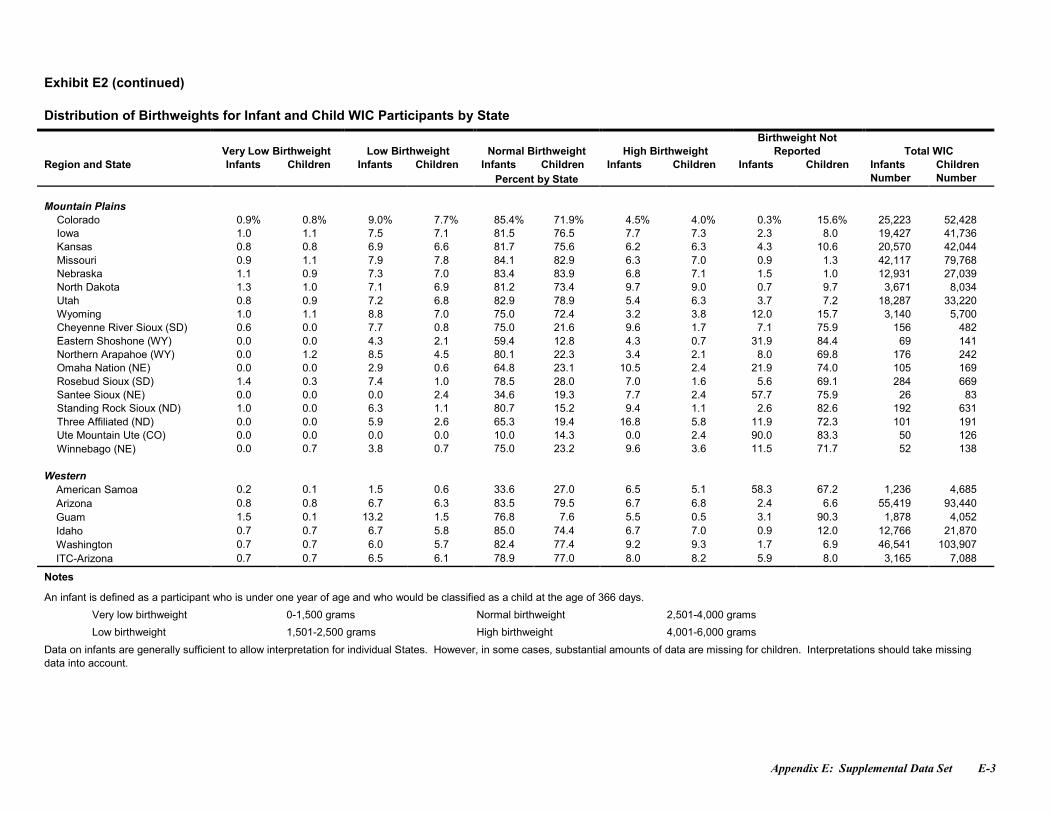
Appendix E: Supplemental Data Set E-3
Exhibit E2 (continued)
Distribution of Birthweights for Infant and Child WIC Participants by State
Very Low Birthweight Low Birthweight Normal Birthweight High BirthweightBirthweight Not
Reported Total WICRegion and State Infants Children Infants Children Infants Children Infants Children Infants Children Infants Children
Percent by State Number Number
Mountain PlainsColorado 0.9% 0.8% 9.0% 7.7% 85.4% 71.9% 4.5% 4.0% 0.3% 15.6% 25,223 52,428Iowa 1.0 1.1 7.5 7.1 81.5 76.5 7.7 7.3 2.3 8.0 19,427 41,736Kansas 0.8 0.8 6.9 6.6 81.7 75.6 6.2 6.3 4.3 10.6 20,570 42,044Missouri 0.9 1.1 7.9 7.8 84.1 82.9 6.3 7.0 0.9 1.3 42,117 79,768Nebraska 1.1 0.9 7.3 7.0 83.4 83.9 6.8 7.1 1.5 1.0 12,931 27,039North Dakota 1.3 1.0 7.1 6.9 81.2 73.4 9.7 9.0 0.7 9.7 3,671 8,034Utah 0.8 0.9 7.2 6.8 82.9 78.9 5.4 6.3 3.7 7.2 18,287 33,220Wyoming 1.0 1.1 8.8 7.0 75.0 72.4 3.2 3.8 12.0 15.7 3,140 5,700Cheyenne River Sioux (SD) 0.6 0.0 7.7 0.8 75.0 21.6 9.6 1.7 7.1 75.9 156 482Eastern Shoshone (WY) 0.0 0.0 4.3 2.1 59.4 12.8 4.3 0.7 31.9 84.4 69 141Northern Arapahoe (WY) 0.0 1.2 8.5 4.5 80.1 22.3 3.4 2.1 8.0 69.8 176 242Omaha Nation (NE) 0.0 0.0 2.9 0.6 64.8 23.1 10.5 2.4 21.9 74.0 105 169Rosebud Sioux (SD) 1.4 0.3 7.4 1.0 78.5 28.0 7.0 1.6 5.6 69.1 284 669Santee Sioux (NE) 0.0 0.0 0.0 2.4 34.6 19.3 7.7 2.4 57.7 75.9 26 83Standing Rock Sioux (ND) 1.0 0.0 6.3 1.1 80.7 15.2 9.4 1.1 2.6 82.6 192 631Three Affiliated (ND) 0.0 0.0 5.9 2.6 65.3 19.4 16.8 5.8 11.9 72.3 101 191Ute Mountain Ute (CO) 0.0 0.0 0.0 0.0 10.0 14.3 0.0 2.4 90.0 83.3 50 126Winnebago (NE) 0.0 0.7 3.8 0.7 75.0 23.2 9.6 3.6 11.5 71.7 52 138
WesternAmerican Samoa 0.2 0.1 1.5 0.6 33.6 27.0 6.5 5.1 58.3 67.2 1,236 4,685Arizona 0.8 0.8 6.7 6.3 83.5 79.5 6.7 6.8 2.4 6.6 55,419 93,440Guam 1.5 0.1 13.2 1.5 76.8 7.6 5.5 0.5 3.1 90.3 1,878 4,052Idaho 0.7 0.7 6.7 5.8 85.0 74.4 6.7 7.0 0.9 12.0 12,766 21,870Washington 0.7 0.7 6.0 5.7 82.4 77.4 9.2 9.3 1.7 6.9 46,541 103,907ITC-Arizona 0.7 0.7 6.5 6.1 78.9 77.0 8.0 8.2 5.9 8.0 3,165 7,088
Notes
An infant is defined as a participant who is under one year of age and who would be classified as a child at the age of 366 days.
Very low birthweight 0-1,500 grams Normal birthweight 2,501-4,000 grams
Low birthweight 1,501-2,500 grams High birthweight 4,001-6,000 grams
Data on infants are generally sufficient to allow interpretation for individual States. However, in some cases, substantial amounts of data are missing for children. Interpretations should take missingdata into account.
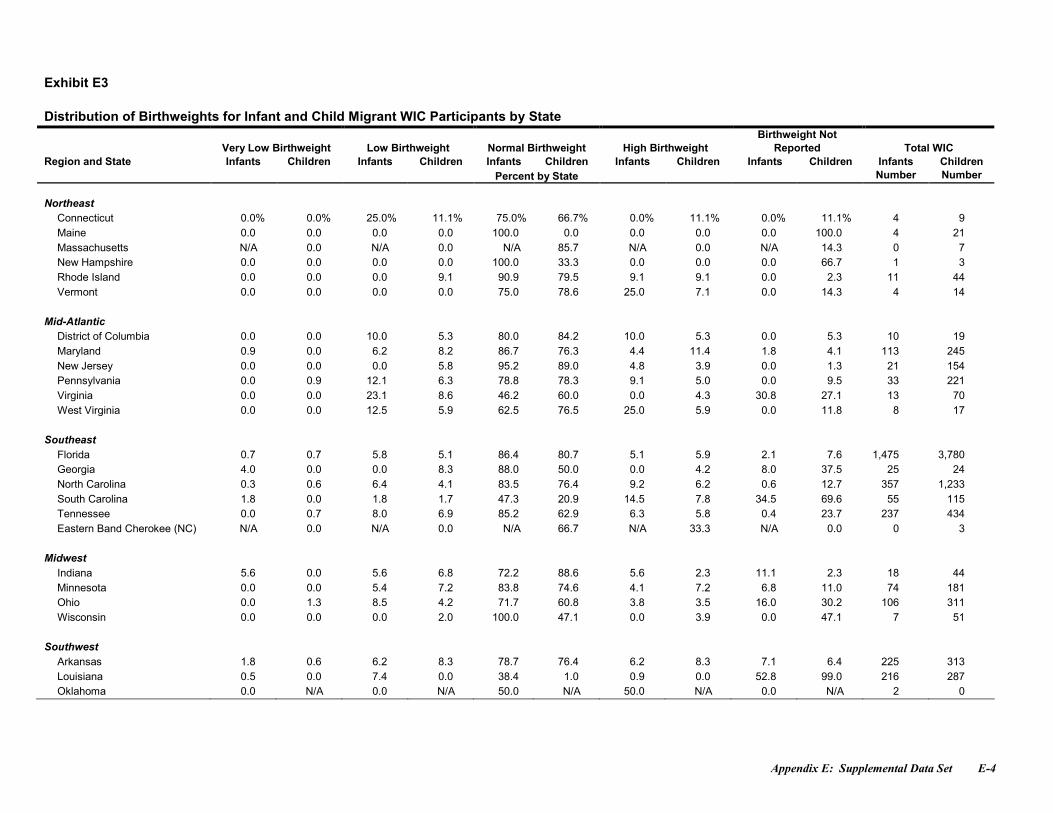
Appendix E: Supplemental Data Set E-4
Exhibit E3
Distribution of Birthweights for Infant and Child Migrant WIC Participants by State
Very Low Birthweight Low Birthweight Normal Birthweight High BirthweightBirthweight Not
Reported Total WICRegion and State Infants Children Infants Children Infants Children Infants Children Infants Children Infants Children
Percent by State Number Number
NortheastConnecticut 0.0% 0.0% 25.0% 11.1% 75.0% 66.7% 0.0% 11.1% 0.0% 11.1% 4 9Maine 0.0 0.0 0.0 0.0 100.0 0.0 0.0 0.0 0.0 100.0 4 21Massachusetts N/A 0.0 N/A 0.0 N/A 85.7 N/A 0.0 N/A 14.3 0 7New Hampshire 0.0 0.0 0.0 0.0 100.0 33.3 0.0 0.0 0.0 66.7 1 3Rhode Island 0.0 0.0 0.0 9.1 90.9 79.5 9.1 9.1 0.0 2.3 11 44Vermont 0.0 0.0 0.0 0.0 75.0 78.6 25.0 7.1 0.0 14.3 4 14
Mid-AtlanticDistrict of Columbia 0.0 0.0 10.0 5.3 80.0 84.2 10.0 5.3 0.0 5.3 10 19Maryland 0.9 0.0 6.2 8.2 86.7 76.3 4.4 11.4 1.8 4.1 113 245New Jersey 0.0 0.0 0.0 5.8 95.2 89.0 4.8 3.9 0.0 1.3 21 154Pennsylvania 0.0 0.9 12.1 6.3 78.8 78.3 9.1 5.0 0.0 9.5 33 221Virginia 0.0 0.0 23.1 8.6 46.2 60.0 0.0 4.3 30.8 27.1 13 70West Virginia 0.0 0.0 12.5 5.9 62.5 76.5 25.0 5.9 0.0 11.8 8 17
SoutheastFlorida 0.7 0.7 5.8 5.1 86.4 80.7 5.1 5.9 2.1 7.6 1,475 3,780Georgia 4.0 0.0 0.0 8.3 88.0 50.0 0.0 4.2 8.0 37.5 25 24North Carolina 0.3 0.6 6.4 4.1 83.5 76.4 9.2 6.2 0.6 12.7 357 1,233South Carolina 1.8 0.0 1.8 1.7 47.3 20.9 14.5 7.8 34.5 69.6 55 115Tennessee 0.0 0.7 8.0 6.9 85.2 62.9 6.3 5.8 0.4 23.7 237 434Eastern Band Cherokee (NC) N/A 0.0 N/A 0.0 N/A 66.7 N/A 33.3 N/A 0.0 0 3
MidwestIndiana 5.6 0.0 5.6 6.8 72.2 88.6 5.6 2.3 11.1 2.3 18 44Minnesota 0.0 0.0 5.4 7.2 83.8 74.6 4.1 7.2 6.8 11.0 74 181Ohio 0.0 1.3 8.5 4.2 71.7 60.8 3.8 3.5 16.0 30.2 106 311Wisconsin 0.0 0.0 0.0 2.0 100.0 47.1 0.0 3.9 0.0 47.1 7 51
SouthwestArkansas 1.8 0.6 6.2 8.3 78.7 76.4 6.2 8.3 7.1 6.4 225 313Louisiana 0.5 0.0 7.4 0.0 38.4 1.0 0.9 0.0 52.8 99.0 216 287Oklahoma 0.0 N/A 0.0 N/A 50.0 N/A 50.0 N/A 0.0 N/A 2 0
Appendix E: Supplemental Data Set E-5
Exhibit E3 (continued)
Distribution of Birthweights for Infant and Child Migrant WIC Participants by State
Very Low Birthweight Low Birthweight Normal Birthweight High BirthweightBirthweight Not
Reported Total WICRegion and State Infants Children Infants Children Infants Children Infants Children Infants Children Infants Children
Percent by State Number Number
Mountain PlainsColorado 4.3 2.3 8.7 4.5 87.0 65.9 0.0 2.3 0.0 25.0 23 44Iowa 0.0 0.0 20.0 4.2 60.0 70.8 0.0 20.8 20.0 4.2 5 24Kansas 0.0 0.0 0.0 0.0 25.0 16.7 50.0 33.3 25.0 50.0 4 6Missouri 0.0 0.0 0.0 0.0 50.0 100.0 25.0 0.0 25.0 0.0 4 5Nebraska 0.0 0.0 0.0 0.0 83.3 75.0 0.0 20.0 16.7 5.0 6 20North Dakota 0.0 0.0 9.1 6.3 63.6 75.0 18.2 15.6 9.1 3.1 11 32Utah 0.0 1.9 6.7 7.5 60.0 81.1 26.7 1.9 6.7 7.5 15 53Wyoming 0.0 0.0 25.0 0.0 75.0 50.0 0.0 0.0 0.0 50.0 4 2
WesternArizona 1.1 1.1 9.2 6.0 82.1 79.7 6.3 6.8 1.3 6.4 630 926Idaho 0.0 0.0 0.0 2.7 88.2 56.8 0.0 10.8 11.8 29.7 17 37Washington 0.0 2.6 2.4 7.0 90.5 63.2 7.1 7.9 0.0 19.3 42 114ITC-Arizona 0.0 0.0 0.0 0.0 100.0 100.0 0.0 0.0 0.0 0.0 1 5
Notes
An infant is defined as a participant who is under one year of age and who would be classified as a child at the age of 366 days.
Very low birthweight 0-1,500 gramsLow birthweight 1,501-2,500 gramsNormal birthweight 2,501-4,000 gramsHigh birthweight 4,001-6,000 grams
Data on infants are generally sufficient to allow interpretation for individual States. However, in some cases, substantial amounts of data are missing for children. Interpretations should take missingdata into account.
Appendix E: Supplemental Data Set E-6
Exhibit E4
Mean Birthweight in Grams of WIC Infants by Race by State
Region and State
AmericanIndian/AlaskaNative Only Asian Only
Black/AfricanAmerican
Only
NativeHawaiian/
PacificIslander Only White Only
Two or MoreRaces
Race NotReportedb
Total WICInfants
NortheastConnecticut
Infants in category Number 513 327 4,221 87 10,850 265 54 16,317Percent reporting birth weight % 99.4 97.2 98.5 98.9 98.2 99.2 38.9 98.1Mean Grams 3287.3 3192.3 3164.1 3218.7 3262.1 3274.4 3507.3 3236.4
MaineInfants in category Number 32 72 269 a 5,000 376 2 5,751Percent reporting birth weight % 100.0 94.4 95.2 a 99.6 99.5 100.0 99.3Mean Grams 3525.1 3081.0 3358.0 a 3329.4 3306.9 3458.7 3327.4
MassachusettsInfants in category Number 31 1,804 5,913 0 15,592 0 9,285 32,625Percent reporting birth weight % 96.8 99.1 98.6 N/A 98.6 N/A 98.3 98.6Mean Grams 3279.2 3187.7 3206.8 N/A 3303.3 N/A 3264.3 3268.3
New HampshireInfants in category Number 150 84 197 a 4,454 115 4 5,004Percent reporting birth weight % 90.0 86.9 84.8 a 90.7 95.7 75.0 90.5Mean Grams 3370.3 3324.3 3211.5 a 3325.1 3248.1 3666.6 3320.6
Rhode IslandInfants in category Number 36 218 1,147 218 4,365 586 71 6,641Percent reporting birth weight % 100.0 98.6 99.1 99.1 99.0 99.3 1.4 98.0Mean Grams 3171.3 3172.0 3224.2 3271.1 3271.3 3262.0 3090.2 3258.4
VermontInfants in category Number a 12 54 11 2,945 52 116 3,190Percent reporting birth weight % a 100.0 96.3 100.0 99.2 100.0 99.1 99.1Mean Grams a 3583.9 3088.0 3512.8 3326.1 3458.7 3271.4 3324.0
Indian Township (ME)Infants in category Number 10 0 0 0 0 9 0 19Percent reporting birth weight % 30.0 N/A N/A N/A N/A 0.0 N/A 15.8Mean Grams 3931.2 N/A N/A N/A N/A N/A N/A 3931.2
Seneca Nation (NY)Infants in category Number 37 0 0 0 a 0 2 39Percent reporting birth weight % 64.9 N/A N/A N/A a N/A 100.0 66.7Mean Grams 3557.9 N/A N/A N/A a N/A 3345.3 3541.6
Mid-AtlanticDistrict of Columbia
Infants in category Number 10 97 4,165 17 1,338 6 16 5,649Percent reporting birth weight % 100.0 99.0 98.6 100.0 99.0 100.0 N/A 98.4Mean Grams 3189.4 3278.9 3111.3 3050.1 3270.2 3255.5 N/A 3152.2
MarylandInfants in category Number 1,373 983 18,623 902 15,177 2,129 22 39,209Percent reporting birth weight % 94.1 95.6 97.0 99.1 97.8 98.2 13.6 97.2Mean Grams 3272.6 3177.9 3122.3 3303.6 3267.9 3254.7 2806.7 3197.0
Appendix E: Supplemental Data Set E-7
Exhibit E4 (continued)
Mean Birthweight in Grams of WIC Infants by Race by State
Region and State
AmericanIndian/AlaskaNative Only Asian Only
Black/AfricanAmerican
Only
NativeHawaiian/
PacificIslander Only White Only
Two or MoreRaces
Race NotReportedb
Total WICInfants
New JerseyInfants in category Number 1,149 1,030 12,106 1,069 24,419 908 91 40,772Percent reporting birth weight % 97.9 97.7 97.4 97.8 97.5 97.1 40.7 97.4Mean Grams 3219.5 3158.2 3126.6 3281.2 3271.8 3229.0 3064.9 3223.4
PennsylvaniaInfants in category Number 695 1,646 19,773 2,569 44,980 2,110 0 71,773Percent reporting birth weight % 99.4 99.8 99.3 99.5 99.5 99.8 N/A 99.4Mean Grams 3222.7 3182.8 3120.0 3191.3 3246.5 3184.5 N/A 3206.2
VirginiaInfants in category Number 592 902 15,197 65 22,977 1,552 357 41,642Percent reporting birth weight % 90.5 87.4 89.4 83.1 90.9 90.9 3.9 89.5Mean Grams 3299.0 3219.5 3059.5 3097.0 3249.9 3228.7 3270.4 3179.5
Virgin IslandsInfants in category Number 0 a 1,216 a 73 16 9 1,314Percent reporting birth weight % N/A a 91.2 a 91.8 93.8 100.0 91.3Mean Grams N/A a 3169.2 a 3292.4 3086.4 3128.0 3174.8
West VirginiaInfants in category Number 50 33 518 a 11,595 833 4 13,033Percent reporting birth weight % 98.0 97.0 96.3 a 97.0 95.8 100.0 96.9Mean Grams 3228.4 3254.0 3065.7 a 3183.6 3202.2 3139.8 3180.4
SoutheastFlorida
Infants in category Number 2,168 1,353 44,248 268 91,520 5,932 0 145,489Percent reporting birth weight % 99.1 99.6 99.0 99.3 99.3 99.2 N/A 99.2Mean Grams 3270.7 3178.8 3096.0 3204.5 3260.9 3231.6 N/A 3209.0
GeorgiaInfants in category Number 793 2,356 39,437 172 44,649 2,103 0 89,510Percent reporting birth weight % 98.5 98.5 98.4 96.5 98.3 98.4 N/A 98.4Mean Grams 3241.0 3114.7 3068.9 3235.1 3266.5 3244.2 N/A 3174.6
North CarolinaInfants in category Number 1,245 963 24,348 52 39,533 1,282 3,454 70,877Percent reporting birth weight % 99.3 98.0 98.2 96.2 98.7 98.8 97.3 98.5Mean Grams 3195.8 3202.5 3096.5 3265.4 3268.0 3232.3 3306.8 3208.3
South CarolinaInfants in category Number 86 369 19,403 46 21,471 96 4 41,475Percent reporting birth weight % 84.9 82.1 90.4 78.3 87.4 86.5 75.0 88.8Mean Grams 3473.8 3462.2 3290.5 3744.6 3559.4 3256.2 3439.8 3429.7
TennesseeInfants in category Number 0 350 16,219 16 37,174 805 338 54,902Percent reporting birth weight % N/A 99.1 99.3 100.0 99.7 99.9 99.7 99.6Mean Grams N/A 3199.4 3068.9 3270.9 3228.7 3200.3 3181.7 3180.7
Appendix E: Supplemental Data Set E-8
Exhibit E4 (continued)
Mean Birthweight in Grams of WIC Infants by Race by State
Region and State
AmericanIndian/AlaskaNative Only Asian Only
Black/AfricanAmerican
Only
NativeHawaiian/
PacificIslander Only White Only
Two or MoreRaces
Race NotReportedb
Total WICInfants
Eastern Band-Cherokee (NC)Infants in category Number 119 0 a 0 7 14 3 143Percent reporting birth weight % 100.0 N/A a N/A 100.0 92.9 100.0 99.3Mean Grams 3392.2 N/A a N/A 2814.8 3234.1 3487.1 3351.3
Mississippi ChoctawInfants in category Number 255 a a a a 14 1 270Percent reporting birth weight % 86.7 a a a a 92.9 100.0 87.0Mean Grams 3279.9 a a a a 3210.1 2948.4 3274.6
MidwestIndiana
Infants in category Number 237 449 8,825 53 33,843 2,060 449 45,916Percent reporting birth weight % 98.3 97.8 98.0 100.0 98.5 98.3 3.8 97.4Mean Grams 3298.0 3212.3 3082.9 3323.4 3247.4 3205.3 3221.9 3213.7
MinnesotaInfants in category Number 1,838 2,395 5,552 56 20,647 3,605 4 34,097Percent reporting birth weight % 97.8 99.1 97.4 98.2 98.5 98.4 100.0 98.3Mean Grams 3379.9 3163.1 3226.6 3221.6 3341.1 3295.7 3465.8 3307.1
OhioInfants in category Number 309 496 20,056 115 47,311 3,634 0 71,921Percent reporting birth weight % 95.5 91.5 94.0 93.9 95.2 94.2 N/A 94.8Mean Grams 3199.0 3177.8 3082.9 3175.7 3232.5 3175.6 N/A 3187.7
WisconsinInfants in category Number 894 1,388 6,880 69 21,906 2,309 0 33,446Percent reporting birth weight % 99.6 99.6 98.8 97.1 99.4 99.4 N/A 99.3Mean Grams 3394.9 3179.3 3099.4 3365.2 3303.7 3278.0 NA 3257.5
SouthwestArkansas
Infants in category Number 184 233 7,734 148 18,741 600 0 27,640Percent reporting birth weight % 98.4 99.6 98.3 99.3 97.9 97.3 N/A 98.0Mean Grams 3239.3 3148.4 3044.4 3083.4 3242.2 3175.3 N/A 3183.6
LouisianaInfants in category Number 336 444 23,426 147 18,945 787 0 44,085Percent reporting birth weight % 52.7 48.9 52.0 44.2 44.4 42.1 N/A 48.5Mean Grams 3099.8 3013.2 2898.3 3153.4 3052.7 3024.5 N/A 2964.6
OklahomaInfants in category Number 1,641 286 3,318 107 18,599 2,008 3 25,962Percent reporting birth weight % 97.0 97.2 97.1 98.1 96.9 96.8 100.0 96.9Mean Grams 3281.1 3153.0 3070.0 3206.0 3239.0 3195.1 2427.8 3215.4
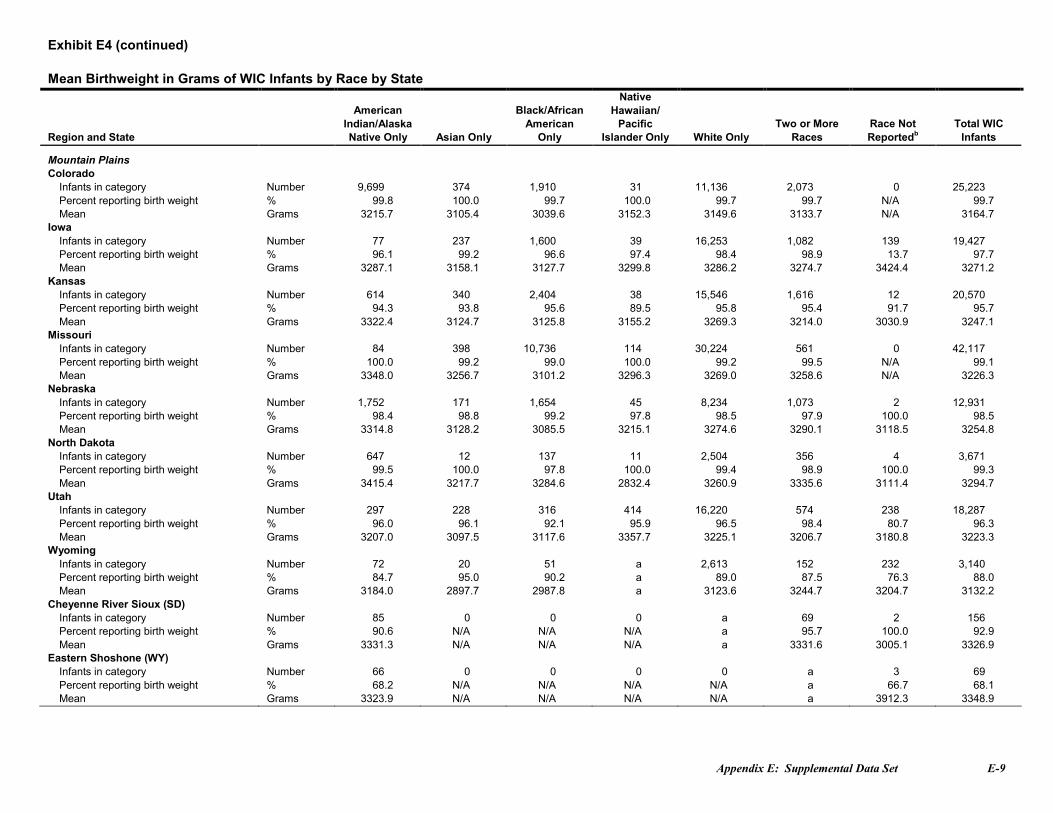
Appendix E: Supplemental Data Set E-9
Exhibit E4 (continued)
Mean Birthweight in Grams of WIC Infants by Race by State
Region and State
AmericanIndian/AlaskaNative Only Asian Only
Black/AfricanAmerican
Only
NativeHawaiian/
PacificIslander Only White Only
Two or MoreRaces
Race NotReportedb
Total WICInfants
Mountain PlainsColorado
Infants in category Number 9,699 374 1,910 31 11,136 2,073 0 25,223Percent reporting birth weight % 99.8 100.0 99.7 100.0 99.7 99.7 N/A 99.7Mean Grams 3215.7 3105.4 3039.6 3152.3 3149.6 3133.7 N/A 3164.7
IowaInfants in category Number 77 237 1,600 39 16,253 1,082 139 19,427Percent reporting birth weight % 96.1 99.2 96.6 97.4 98.4 98.9 13.7 97.7Mean Grams 3287.1 3158.1 3127.7 3299.8 3286.2 3274.7 3424.4 3271.2
KansasInfants in category Number 614 340 2,404 38 15,546 1,616 12 20,570Percent reporting birth weight % 94.3 93.8 95.6 89.5 95.8 95.4 91.7 95.7Mean Grams 3322.4 3124.7 3125.8 3155.2 3269.3 3214.0 3030.9 3247.1
MissouriInfants in category Number 84 398 10,736 114 30,224 561 0 42,117Percent reporting birth weight % 100.0 99.2 99.0 100.0 99.2 99.5 N/A 99.1Mean Grams 3348.0 3256.7 3101.2 3296.3 3269.0 3258.6 N/A 3226.3
NebraskaInfants in category Number 1,752 171 1,654 45 8,234 1,073 2 12,931Percent reporting birth weight % 98.4 98.8 99.2 97.8 98.5 97.9 100.0 98.5Mean Grams 3314.8 3128.2 3085.5 3215.1 3274.6 3290.1 3118.5 3254.8
North DakotaInfants in category Number 647 12 137 11 2,504 356 4 3,671Percent reporting birth weight % 99.5 100.0 97.8 100.0 99.4 98.9 100.0 99.3Mean Grams 3415.4 3217.7 3284.6 2832.4 3260.9 3335.6 3111.4 3294.7
UtahInfants in category Number 297 228 316 414 16,220 574 238 18,287Percent reporting birth weight % 96.0 96.1 92.1 95.9 96.5 98.4 80.7 96.3Mean Grams 3207.0 3097.5 3117.6 3357.7 3225.1 3206.7 3180.8 3223.3
WyomingInfants in category Number 72 20 51 a 2,613 152 232 3,140Percent reporting birth weight % 84.7 95.0 90.2 a 89.0 87.5 76.3 88.0Mean Grams 3184.0 2897.7 2987.8 a 3123.6 3244.7 3204.7 3132.2
Cheyenne River Sioux (SD)Infants in category Number 85 0 0 0 a 69 2 156Percent reporting birth weight % 90.6 N/A N/A N/A a 95.7 100.0 92.9Mean Grams 3331.3 N/A N/A N/A a 3331.6 3005.1 3326.9
Eastern Shoshone (WY)Infants in category Number 66 0 0 0 0 a 3 69Percent reporting birth weight % 68.2 N/A N/A N/A N/A a 66.7 68.1Mean Grams 3323.9 N/A N/A N/A N/A a 3912.3 3348.9

Appendix E: Supplemental Data Set E-10
Exhibit E4 (continued)
Mean Birthweight in Grams of WIC Infants by Race by State
Region and State
AmericanIndian/AlaskaNative Only Asian Only
Black/AfricanAmerican
Only
NativeHawaiian/
PacificIslander Only White Only
Two or MoreRaces
Race NotReportedb
Total WICInfants
Northern Arapahoe (WY)Infants in category Number 163 0 0 0 7 6 0 176Percent reporting birth weight % 91.4 N/A N/A N/A 100.0 100.0 N/A 92.0Mean Grams 3233.0 N/A N/A N/A 3288.6 3061.8 N/A 3229.1
Omaha Nation (NE)Infants in category Number 101 0 0 0 a a 4 105Percent reporting birth weight % 78.2 N/A N/A N/A a a 75.0 78.1Mean Grams 3545.5 N/A N/A N/A a a 3250.8 3534.8
Rosebud Sioux (SD)Infants in category Number 272 0 0 0 7 a 5 284Percent reporting birth weight % 94.1 N/A N/A N/A 100.0 a 100.0 94.4Mean Grams 3272.2 N/A N/A N/A 3418.2 a 3447.4 3279.3
Santee Sioux (NE)Infants in category Number 24 0 0 0 a a 2 26Percent reporting birth weight % 41.7 N/A N/A N/A a a 50.0 42.3Mean Grams 3583.4 N/A N/A N/A a a 3855.6 3608.2
Standing Rock Sioux (ND)Infants in category Number 184 0 0 0 a a 8 192Percent reporting birth weight % 97.3 N/A N/A N/A a a 100.0 97.4Mean Grams 3355.1 N/A N/A N/A a a 3543.7 3363.2
Three Affiliated (ND)Infants in category Number 69 0 0 0 0 32 0 101Percent reporting birth weight % 87.0 N/A N/A N/A N/A 90.6 N/A 88.1Mean Grams 3458.7 N/A N/A N/A N/A 3535.0 N/A 3483.5
Ute Mountain Ute (CO)Infants in category Number 49 a a a a a 1 50Percent reporting birth weight % 10.2 a a a a a 0.0 10.0Mean Grams 3265.9 a a a a a N/A 3265.9
Winnebago (NE)Infants in category Number 49 0 0 0 a 0 3 52Percent reporting birth weight % 87.8 N/A N/A N/A a N/A 100.0 88.5Mean Grams 3417.8 N/A N/A N/A a N/A 3364.2 3414.3
WesternAmerican Samoa
Infants in category Number 0 6 0 1,212 0 18 0 1,236Percent reporting birth weight % N/A 66.7 N/A 41.2 N/A 72.2 N/A 41.7Mean Grams N/A 3019.3 N/A 3490.5 N/A 3245.0 N/A 3480.6
ArizonaInfants in category Number 1,113 465 2,929 214 48,963 1,735 0 55,419Percent reporting birth weight % 94.8 96.1 95.7 95.8 97.9 95.7 N/A 97.6Mean Grams 3296.3 3152.7 3124.1 3295.2 3274.3 3235.1 N/A 3264.8
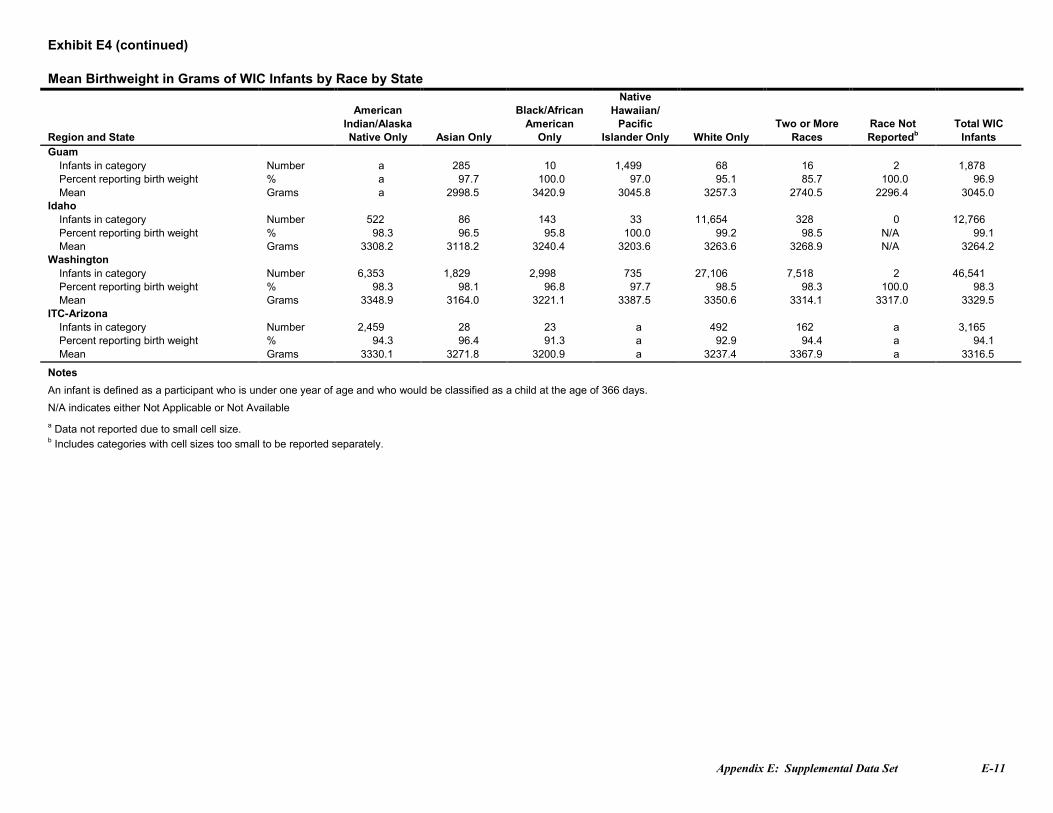
Appendix E: Supplemental Data Set E-11
Exhibit E4 (continued)
Mean Birthweight in Grams of WIC Infants by Race by State
Region and State
AmericanIndian/AlaskaNative Only Asian Only
Black/AfricanAmerican
Only
NativeHawaiian/
PacificIslander Only White Only
Two or MoreRaces
Race NotReportedb
Total WICInfants
GuamInfants in category Number a 285 10 1,499 68 16 2 1,878Percent reporting birth weight % a 97.7 100.0 97.0 95.1 85.7 100.0 96.9Mean Grams a 2998.5 3420.9 3045.8 3257.3 2740.5 2296.4 3045.0
IdahoInfants in category Number 522 86 143 33 11,654 328 0 12,766Percent reporting birth weight % 98.3 96.5 95.8 100.0 99.2 98.5 N/A 99.1Mean Grams 3308.2 3118.2 3240.4 3203.6 3263.6 3268.9 N/A 3264.2
WashingtonInfants in category Number 6,353 1,829 2,998 735 27,106 7,518 2 46,541Percent reporting birth weight % 98.3 98.1 96.8 97.7 98.5 98.3 100.0 98.3Mean Grams 3348.9 3164.0 3221.1 3387.5 3350.6 3314.1 3317.0 3329.5
ITC-ArizonaInfants in category Number 2,459 28 23 a 492 162 a 3,165Percent reporting birth weight % 94.3 96.4 91.3 a 92.9 94.4 a 94.1Mean Grams 3330.1 3271.8 3200.9 a 3237.4 3367.9 a 3316.5
Notes
An infant is defined as a participant who is under one year of age and who would be classified as a child at the age of 366 days.
N/A indicates either Not Applicable or Not Availablea Data not reported due to small cell size.b Includes categories with cell sizes too small to be reported separately.
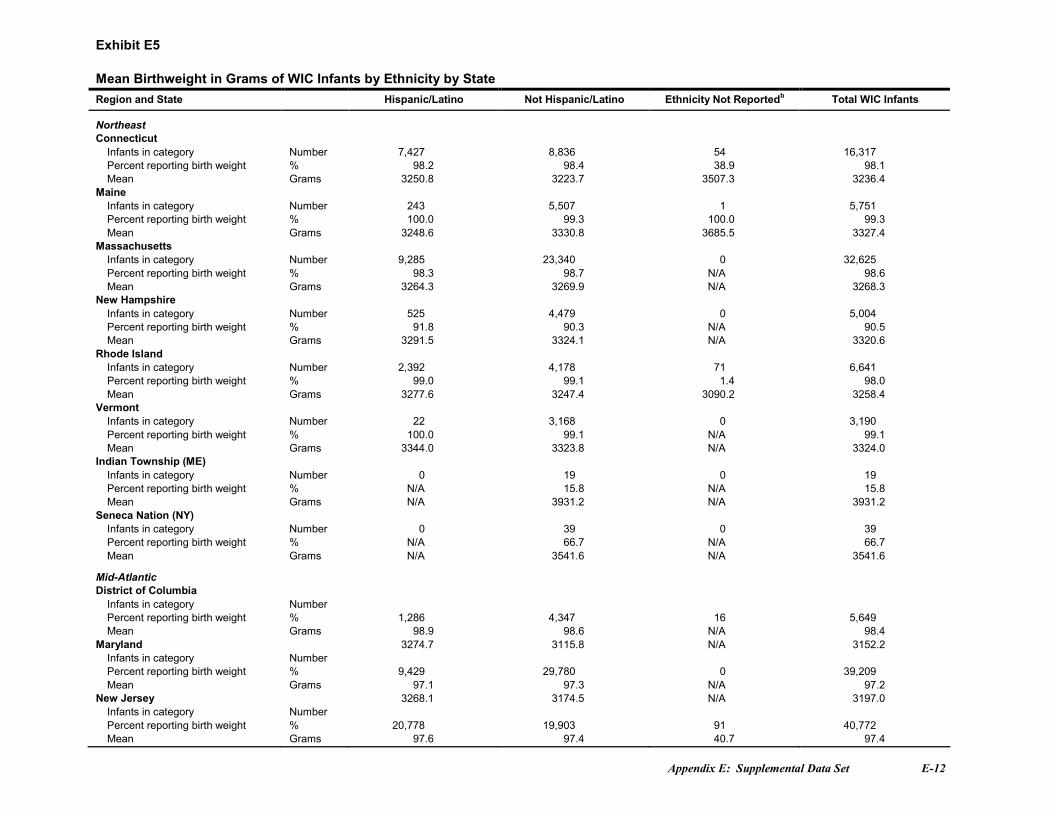
Appendix E: Supplemental Data Set E-12
Exhibit E5
Mean Birthweight in Grams of WIC Infants by Ethnicity by StateRegion and State Hispanic/Latino Not Hispanic/Latino Ethnicity Not Reportedb Total WIC Infants
NortheastConnecticut
Infants in category Number 7,427 8,836 54 16,317Percent reporting birth weight % 98.2 98.4 38.9 98.1Mean Grams 3250.8 3223.7 3507.3 3236.4
MaineInfants in category Number 243 5,507 1 5,751Percent reporting birth weight % 100.0 99.3 100.0 99.3Mean Grams 3248.6 3330.8 3685.5 3327.4
MassachusettsInfants in category Number 9,285 23,340 0 32,625Percent reporting birth weight % 98.3 98.7 N/A 98.6Mean Grams 3264.3 3269.9 N/A 3268.3
New HampshireInfants in category Number 525 4,479 0 5,004Percent reporting birth weight % 91.8 90.3 N/A 90.5Mean Grams 3291.5 3324.1 N/A 3320.6
Rhode IslandInfants in category Number 2,392 4,178 71 6,641Percent reporting birth weight % 99.0 99.1 1.4 98.0Mean Grams 3277.6 3247.4 3090.2 3258.4
VermontInfants in category Number 22 3,168 0 3,190Percent reporting birth weight % 100.0 99.1 N/A 99.1Mean Grams 3344.0 3323.8 N/A 3324.0
Indian Township (ME)Infants in category Number 0 19 0 19Percent reporting birth weight % N/A 15.8 N/A 15.8Mean Grams N/A 3931.2 N/A 3931.2
Seneca Nation (NY)Infants in category Number 0 39 0 39Percent reporting birth weight % N/A 66.7 N/A 66.7Mean Grams N/A 3541.6 N/A 3541.6
Mid-AtlanticDistrict of Columbia
Infants in category NumberPercent reporting birth weight % 1,286 4,347 16 5,649Mean Grams 98.9 98.6 N/A 98.4
Maryland 3274.7 3115.8 N/A 3152.2Infants in category NumberPercent reporting birth weight % 9,429 29,780 0 39,209Mean Grams 97.1 97.3 N/A 97.2
New Jersey 3268.1 3174.5 N/A 3197.0Infants in category NumberPercent reporting birth weight % 20,778 19,903 91 40,772Mean Grams 97.6 97.4 40.7 97.4
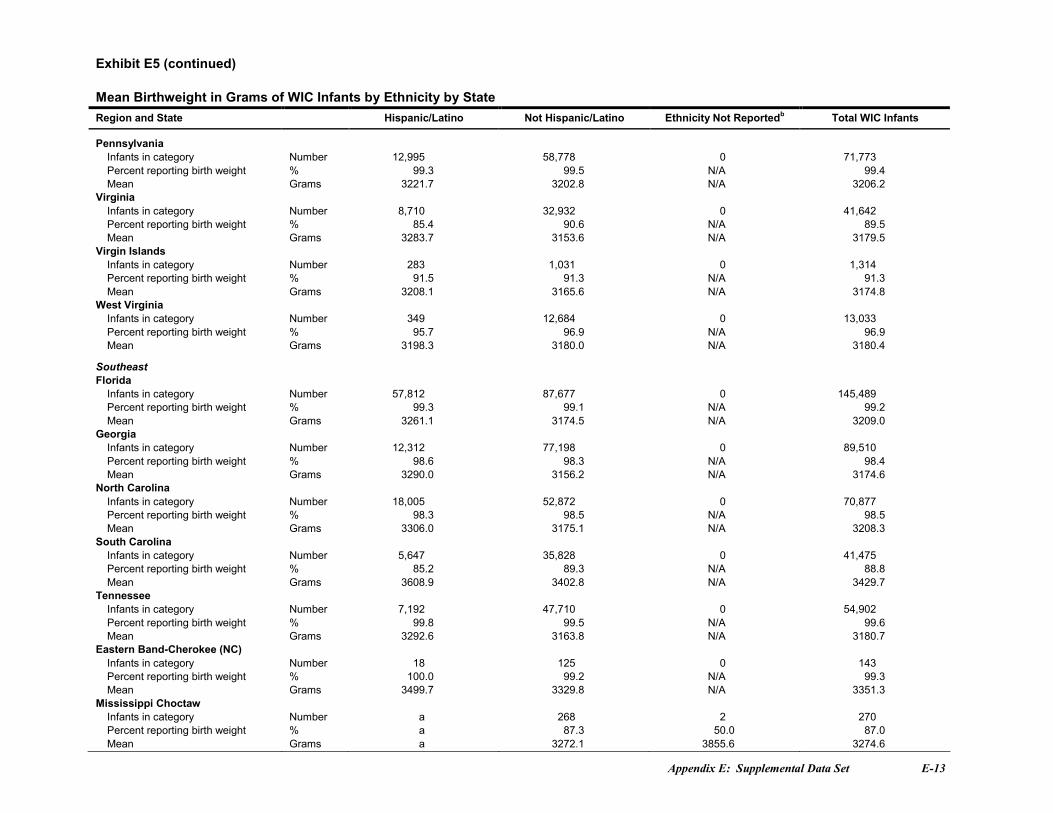
Appendix E: Supplemental Data Set E-13
Exhibit E5 (continued)
Mean Birthweight in Grams of WIC Infants by Ethnicity by StateRegion and State Hispanic/Latino Not Hispanic/Latino Ethnicity Not Reportedb Total WIC Infants
PennsylvaniaInfants in category Number 12,995 58,778 0 71,773Percent reporting birth weight % 99.3 99.5 N/A 99.4Mean Grams 3221.7 3202.8 N/A 3206.2
VirginiaInfants in category Number 8,710 32,932 0 41,642Percent reporting birth weight % 85.4 90.6 N/A 89.5Mean Grams 3283.7 3153.6 N/A 3179.5
Virgin IslandsInfants in category Number 283 1,031 0 1,314Percent reporting birth weight % 91.5 91.3 N/A 91.3Mean Grams 3208.1 3165.6 N/A 3174.8
West VirginiaInfants in category Number 349 12,684 0 13,033Percent reporting birth weight % 95.7 96.9 N/A 96.9Mean Grams 3198.3 3180.0 N/A 3180.4
SoutheastFlorida
Infants in category Number 57,812 87,677 0 145,489Percent reporting birth weight % 99.3 99.1 N/A 99.2Mean Grams 3261.1 3174.5 N/A 3209.0
GeorgiaInfants in category Number 12,312 77,198 0 89,510Percent reporting birth weight % 98.6 98.3 N/A 98.4Mean Grams 3290.0 3156.2 N/A 3174.6
North CarolinaInfants in category Number 18,005 52,872 0 70,877Percent reporting birth weight % 98.3 98.5 N/A 98.5Mean Grams 3306.0 3175.1 N/A 3208.3
South CarolinaInfants in category Number 5,647 35,828 0 41,475Percent reporting birth weight % 85.2 89.3 N/A 88.8Mean Grams 3608.9 3402.8 N/A 3429.7
TennesseeInfants in category Number 7,192 47,710 0 54,902Percent reporting birth weight % 99.8 99.5 N/A 99.6Mean Grams 3292.6 3163.8 N/A 3180.7
Eastern Band-Cherokee (NC)Infants in category Number 18 125 0 143Percent reporting birth weight % 100.0 99.2 N/A 99.3Mean Grams 3499.7 3329.8 N/A 3351.3
Mississippi ChoctawInfants in category Number a 268 2 270Percent reporting birth weight % a 87.3 50.0 87.0Mean Grams a 3272.1 3855.6 3274.6
Appendix E: Supplemental Data Set E-14
Exhibit E5 (continued)
Mean Birthweight in Grams of WIC Infants by Ethnicity by StateRegion and State Hispanic/Latino Not Hispanic/Latino Ethnicity Not Reportedb Total WIC Infants
MidwestIndiana
Infants in category Number 7,900 37,567 449 45,916Percent reporting birth weight % 98.3 98.4 3.8 97.4Mean Grams 3299.5 3195.7 3221.9 3213.7
MinnesotaInfants in category Number 6,095 28,002 0 34,097Percent reporting birth weight % 97.8 98.4 N/A 98.3Mean Grams 3329.5 3302.3 N/A 3307.1
OhioInfants in category Number 5,495 66,426 0 71,921Percent reporting birth weight % 90.9 95.1 N/A 94.8Mean Grams 3225.1 3184.7 N/A 3187.7
WisconsinInfants in category Number 7,616 25,830 0 33,446Percent reporting birth weight % 99.3 99.2 N/A 99.3Mean Grams 3320.6 3238.9 N/A 3257.5
SouthwestArkansas
Infants in category Number 4,299 23,341 0 27,640Percent reporting birth weight % 97.8 98.1 N/A 98.0Mean Grams 3270.2 3167.7 N/A 3183.6
LouisianaInfants in category Number 2,567 41,518 0 44,085Percent reporting birth weight % 51.1 48.3 N/A 48.5Mean Grams 3139.0 2953.2 N/A 2964.6
OklahomaInfants in category Number 6,179 19,783 0 25,962Percent reporting birth weight % 96.8 97.0 N/A 96.9Mean Grams 3259.9 3201.6 N/A 3215.4
Mountain PlainsColorado
Infants in category Number 14,468 10,755 0 25,223Percent reporting birth weight % 99.7 99.7 N/A 99.7Mean Grams 3188.8 3132.5 N/A 3164.7
IowaInfants in category Number 3,938 15,489 0 19,427Percent reporting birth weight % 97.9 97.6 N/A 97.7Mean Grams 3281.1 3268.7 N/A 3271.2
KansasInfants in category Number 6,509 14,061 0 20,570Percent reporting birth weight % 95.4 95.8 N/A 95.7Mean Grams 3309.1 3218.5 N/A 3247.1
Appendix E: Supplemental Data Set E-15
Exhibit E5 (continued)
Mean Birthweight in Grams of WIC Infants by Ethnicity by StateRegion and State Hispanic/Latino Not Hispanic/Latino Ethnicity Not Reportedb Total WIC Infants
MissouriInfants in category Number 4,068 38,049 0 42,117Percent reporting birth weight % 99.1 99.1 N/A 99.1Mean Grams 3317.7 3216.5 N/A 3226.3
NebraskaInfants in category Number 4,014 8,917 0 12,931Percent reporting birth weight % 98.4 98.6 N/A 98.5Mean Grams 3292.1 3238.0 N/A 3254.8
North DakotaInfants in category Number 324 3,347 0 3,671Percent reporting birth weight % 97.5 99.5 N/A 99.3Mean Grams 3281.7 3295.9 N/A 3294.7
UtahInfants in category Number 7,512 10,775 0 18,287Percent reporting birth weight % 95.8 96.6 N/A 96.3Mean Grams 3224.7 3222.4 N/A 3223.3
WyomingInfants in category Number 766 2,144 230 3,140Percent reporting birth weight % 85.8 90.0 76.5 88.0Mean Grams 3125.9 3127.7 3204.5 3132.2
Cheyenne River Sioux (SD)Infants in category Number 0 156 0 156Percent reporting birth weight % N/A 92.9 N/A 92.9Mean Grams N/A 3326.9 N/A 3326.9
Eastern Shoshone (WY)Infants in category Number a 67 2 69Percent reporting birth weight % a 67.2 100.0 68.1Mean Grams a 3334 3685.5 3348.9
Northern Arapahoe (WY)Infants in category Number 14 162 0 176Percent reporting birth weight % 92.9 92.0 N/A 92.0Mean Grams 3157.8 3235.3 N/A 3229.1
Omaha Nation (NE)Infants in category Number 0 105 0 105Percent reporting birth weight % N/A 78.1 N/A 78.1Mean Grams N/A 3534.8 N/A 3534.8
Rosebud Sioux (SD)Infants in category Number a 281 3 284Percent reporting birth weight % a 94.3 100.0 94.4Mean Grams a 3274.5 3704.4 3279.3
Santee Sioux (NE)Infants in category Number 0 26 0 26Percent reporting birth weight % N/A 42.3 N/A 42.3Mean Grams N/A 3608.2 N/A 3608.2
Appendix E: Supplemental Data Set E-16
Exhibit E5 (continued)
Mean Birthweight in Grams of WIC Infants by Ethnicity by StateRegion and State Hispanic/Latino Not Hispanic/Latino Ethnicity Not Reportedb Total WIC Infants
Standing Rock Sioux (ND)Infants in category Number 0 192 0 192Percent reporting birth weight % N/A 97.4 N/A 97.4Mean Grams N/A 3363.2 N/A 3363.2
Three Affiliated (ND)Infants in category Number a 96 5 101Percent reporting birth weight % a 88.5 80.0 88.1Mean Grams a 3467.4 3827.3 3483.5
Ute Mountain Ute (CO)Infants in category Number 0 50 0 50Percent reporting birth weight % N/A 10.0 N/A 10.0Mean Grams N/A 3265.9 N/A 3265.9
Winnebago (NE)Infants in category Number a 51 a 52Percent reporting birth weight % a 88.2 a 88.5Mean Grams a 3422.2 a 3414.3
WesternAmerican Samoa
Infants in category Number 0 1,236 0 1,236Percent reporting birth weight % N/A 41.7 N/A 41.7Mean Grams N/A 3480.6 N/A 3480.6
ArizonaInfants in category Number 38,737 16,682 0 55,419Percent reporting birth weight % 98.1 96.3 N/A 97.6Mean Grams 3283.3 3221.0 N/A 3264.8
GuamInfants in category Number 20 1,859 0 1,878Percent reporting birth weight % 100.0 96.9 N/A 96.9Mean Grams 3116.9 3044.2 N/A 3045
IdahoInfants in category Number 4,027 8,739 0 12,766Percent reporting birth weight % 99.0 99.2 N/A 99.1Mean Grams 3263.6 3264.4 N/A 3264.2
WashingtonInfants in category Number 17,580 28,961 0 46,541Percent reporting birth weight % 98.5 98.2 N/A 98.3Mean Grams 3334.5 3326.5 N/A 3329.5
ITC-ArizonaInfants in category Number 1,143 2,022 0 3,165Percent reporting birth weight % 94.8 93.8 N/A 94.1Mean Grams 3288.4 3332.5 N/A 3316.5
Notes
An infant is defined as a participant who is under one year of age and who would be classified as a child at the age of 366 days.a Data not reported due to small cell size.b Includes categories with cell sizes too small to be reported separately.
Appendix E: Supplemental Data Set E-17
Exhibit E6
Mean Birthweight in Grams of WIC Children by Race by State
Region and State
AmericanIndian/AlaskaNative Only Asian Only
Black/AfricanAmerican
Only
NativeHawaiian/
PacificIslander Only White Only
Two or MoreRaces
Race NotReportedb
Total WICChildren
NortheastConnecticut
Children in category Number 1,368 555 7,414 369 19,735 478 30 29,949Percent reporting birth weight % 98.2 93.2 94.8 94.6 94.4 97.3 10.0 94.6Mean Grams 3301.8 3161.5 3156.2 3190.6 3243.8 3234.9 3279.2 3222.6
MaineChildren in category Number 89 155 1,012 9 13,199 789 0 15,253Percent reporting birth weight % 0.0% 0.0% 0.0% 0.0% 0.0% 0.0% 0.0% 0.0%Mean Grams N/A N/A N/A N/A N/A N/A N/A N/A
MassachusettsChildren in category Number 82 4,076 13,345 0 28,452 0 24,187 70,142Percent reporting birth weight % 93.9 92.9 92.4 N/A 91.7 N/A 92.6 92.2Mean Grams 3402.4 3190.6 3187.8 N/A 3295.6 N/A 3247.9 3252.5
New HampshireChildren in category Number 200 178 534 a 9,021 162 4 10,099Percent reporting birth weight % 65.0 73.0 60.7 a 82.9 72.8 50.0 81.0Mean Grams 3250.7 3303.0 3287.5 a 3308.3 3314.8 3132.7 3306.5
Rhode IslandChildren in category Number 100 394 2,542 89 10,927 1,293 27 15,372Percent reporting birth weight % 100.0 99.5 97.9 98.9 99.0 98.8 0.0 98.6Mean Grams 3081.1 3117.1 3214.0 3181.0 3271.4 3243.0 N/A 3253.8
VermontChildren in category Number 23 84 255 39 9,315 265 131 10,112Percent reporting birth weight % 91.3 92.9 81.2 97.4 93.7 92.8 91.6 93.3Mean Grams 2983.5 3225.7 3271.9 3255.0 3329.9 3355.1 3394.0 3328.1
Indian Township (ME)Children in category Number 38 0 0 0 a a 9 47Percent reporting birth weight % 13.2 N/A N/A N/A a a 44.4 19.1Mean Grams 3651.5 N/A N/A N/A a a 3373.7 3528.0
Seneca Nation (NY)Children in category Number 54 0 0 0 a a 4 58Percent reporting birth weight % 22.2 N/A N/A N/A a a 25.0 22.4Mean Grams 3298.1 N/A N/A N/A a a 2948.4 3271.2
Mid-AtlanticDistrict of Columbia
Children in category Number 30 165 5,262 15 2,196 18 9 7,695Percent reporting birth weight % 100.0 97.0 98.7 100.0 98.5 100.0 0.0 98.5Mean Grams 3408.6 3216.5 3120.2 3507.8 3253.6 3378.4 N/A 3162.8
MarylandChildren in category Number 3,707 1,688 30,864 1,773 25,733 3,885 8 67,658Percent reporting birth weight % 96.1 95.0 97.0 98.5 96.9 98.1 62.5 97.0Mean Grams 3262.4 3169.8 3118.3 3282.7 3271.7 3229.0 3475.7 3196.5
Appendix E: Supplemental Data Set E-18
Exhibit E6 (continued)
Mean Birthweight in Grams of WIC Children by Race by State
Region and State
AmericanIndian/AlaskaNative Only Asian Only
Black/AfricanAmerican
Only
NativeHawaiian/
PacificIslander Only White Only
Two or MoreRaces
Race NotReportedb
Total WICChildren
New JerseyChildren in category Number 3,555 2,553 20,704 2,508 49,248 1,808 98 80,474Percent reporting birth weight % 98.0 94.2 95.7 98.6 96.7 97.0 59.2 96.4Mean Grams 3227.0 3157.4 3126.1 3260.1 3275.8 3250.9 3235.3 3230.6
PennsylvaniaChildren in category Number 2,149 3,191 31,369 4,229 91,447 4,360 0 136,745Percent reporting birth weight % 87.2 83.4 87.8 86.0 87.0 88.3 N/A 87.1Mean Grams 3188.4 3179.2 3104.4 3162.5 3229.7 3206.6 N/A 3196.1
VirginiaChildren in category Number 1,190 1,871 25,897 192 41,579 2,304 117 73,150Percent reporting birth weight % 84.1 74.0 86.0 72.4 82.6 82.5 0.0 83.5Mean Grams 3350.1 3204.1 3066.9 3262.7 3251.8 3225.5 N/A 3184.1
Virgin IslandsChildren in category Number a 16 2,703 0 149 65 3 2,936Percent reporting birth weight % a 93.8 64.6 N/A 79.2 67.7 100.0 65.6Mean Grams a 3158.2 3145.1 N/A 3198 3299.6 3931.2 3153.2
West VirginiaChildren in category Number 119 48 965 12 25,451 1,748 0 28,343Percent reporting birth weight % 82.4 89.6 94.1 83.3 96.0 92.7 N/A 95.7Mean Grams 3308.3 3065.8 3034.3 2905.9 3197.6 3199.8 N/A 3192.4
SoutheastFlorida
Children in category Number 5,536 2,249 72,687 489 154,766 9,186 2 244,915Percent reporting birth weight % 94.2 88.0 95.0 89.8 91.8 93.0 100.0 92.8Mean Grams 3277.8 3174.2 3101.2 3211.9 3261.9 3236.8 2650.7 3211.7
GeorgiaChildren in category Number 1,366 3,644 60,256 316 75,927 2,874 0 144,383Percent reporting birth weight % 86.8 89.9 90.6 75.3 90.2 88.3 N/A 90.2Mean Grams 3244.1 3108.9 3065.7 3312.1 3262.3 3246.7 N/A 3175.7
North CarolinaChildren in category Number 1,950 1,745 39,884 133 77,667 2,216 5,690 129,285Percent reporting birth weight % 93.1 82.2 89.4 78.9 87.7 90.6 73.6 87.7Mean Grams 3190.0 3173.8 3086.4 3317.5 3276.3 3252.9 3311.6 3214.8
South CarolinaChildren in category Number 142 474 28,003 85 29,505 177 0 58,386Percent reporting birth weight % 36.6 26.6 41.7 28.2 33.2 30.5 N/A 37.2Mean Grams 3300.0 3524.0 3206.1 3346.5 3451.2 3535.9 N/A 3319.7
TennesseeChildren in category Number 0 399 20,017 32 64,239 923 657 86,267Percent reporting birth weight % N/A 67.2 76.5 43.8 80.8 81.7 76.1 79.7Mean Grams N/A 3184.0 3070.0 3266.3 3220.1 3210.0 3190.2 3186.2
Appendix E: Supplemental Data Set E-19
Exhibit E6 (continued)
Mean Birthweight in Grams of WIC Children by Race by State
Region and State
AmericanIndian/AlaskaNative Only Asian Only
Black/AfricanAmerican
Only
NativeHawaiian/
PacificIslander Only White Only
Two or MoreRaces
Race NotReportedb
Total WICChildren
Eastern Band-Cherokee (NC)Children in category Number 398 0 a 0 13 a 4 415Percent reporting birth weight % 98.0 N/A a N/A 92.3 a 100.0 97.8Mean Grams 3358.1 N/A a N/A 3650.1 a 3267.4 3365.8
Mississippi ChoctawChildren in category Number 448 0 0 0 0 59 0 507Percent reporting birth weight % 27.7 N/A N/A N/A N/A 20.3 N/A 26.8Mean Grams 3399.3 N/A N/A N/A N/A 3373.7 N/A 3397.0
MidwestIndiana
Children in category Number 826 871 14,623 152 62,361 4,019 204 83,056Percent reporting birth weight % 99.0 91.2 97.6 97.4 98.7 98.4 6.9 98.2Mean Grams 3333.4 3174.2 3093.3 3239.9 3257.3 3237.0 3215.7 3227.5
MinnesotaChildren in category Number 6,066 6,255 14,016 169 49,961 8,068 6 84,541Percent reporting birth weight % 88.6 87.4 84.7 85.8 89.5 86.5 50.0 88.2Mean Grams 3393.7 3182.7 3259.3 3330.4 3347.6 3305.0 3458.7 3320.7
OhioChildren in category Number 613 1,118 41,424 264 102,549 9,331 5 155,304Percent reporting birth weight % 72.8 72.2 78.9 72.3 80.3 82.3 0.0 79.9Mean Grams 3208.3 3164.9 3081.1 3126.2 3218.8 3176.3 N/A 3179.4
WisconsinChildren in category Number 2,865 3,173 12,115 98 44,185 5,018 0 67,454Percent reporting birth weight % 61.5 62.7 68.2 54.1 61.3 65.6 N/A 62.9Mean Grams 3393.5 3240.0 3105.5 3365.1 3341.3 3290.2 N/A 3288.9
SouthwestArkansas
Children in category Number 401 286 10,454 151 30,454 791 0 42,537Percent reporting birth weight % 97.8 95.5 97.8 98.7 98.0 96.5 N/A 97.9Mean Grams 3237.0 3174.2 3039.3 3126.7 3249.5 3204.3 N/A 3196.0
LouisianaChildren in category Number 399 558 36,249 174 26,844 893 1 65,118Percent reporting birth weight % N/A 0.9 0.5 1.1 0.3 N/A N/A 0.4Mean Grams N/A 3226.2 2986.3 3402.0 2978.7 N/A N/A 2991.3
OklahomaChildren in category Number 3,832 528 5,944 259 37,828 3,464 0 51,855Percent reporting birth weight % 97.2 96.8 97.1 96.1 97.8 98.0 N/A 97.7Mean Grams 3291.9 3199.1 3062.8 3297.7 3265.9 3226.5 N/A 3241.5
Mountain PlainsColorado
Children in category Number 22,364 626 3,292 63 20,535 5,548 0 52,428Percent reporting birth weight % 86.8 82.4 81.7 65.1 81.2 88.6 N/A 84.4Mean Grams 3211.1 3050.9 3030.5 3269.2 3147.0 3140.9 N/A 3166.3
Appendix E: Supplemental Data Set E-20
Exhibit E6 (continued)
Mean Birthweight in Grams of WIC Children by Race by State
Region and State
AmericanIndian/AlaskaNative Only Asian Only
Black/AfricanAmerican
Only
NativeHawaiian/
PacificIslander Only White Only
Two or MoreRaces
Race NotReportedb
Total WICChildren
IowaChildren in category Number 191 478 3,462 82 35,205 2,307 11 41,736Percent reporting birth weight % 82.2 91.4 87.5 84.1 92.4 93.7 0.0 92.0Mean Grams 3280.1 3116.0 3115.8 3209.7 3288.4 3255.6 N/A 3270.8
KansasChildren in category Number 1,013 577 5,527 73 34,408 446 0 42,044Percent reporting birth weight % 89.0 88.0 91.1 80.8 89.3 79.6 N/A 89.4Mean Grams 3318.1 3150.1 3121.2 3348.7 3274.5 3240.4 N/A 3253.1
MissouriChildren in category Number 126 737 15,739 196 61,923 1,047 0 79,768Percent reporting birth weight % 98.4 96.6 98.0 98.5 98.9 98.6 N/A 98.7Mean Grams 3214.5 3179.7 3102.7 3278.2 3268.2 3272.2 N/A 3235.0
NebraskaChildren in category Number 4,476 334 3,041 51 17,465 1,671 1 27,039Percent reporting birth weight % 99.2 98.5 97.8 98.0 99.1 99.0 100.0 99.0Mean Grams 3304.1 3159.5 3115.4 3186.5 3274.0 3257.7 3940.7 3258.8
North DakotaChildren in category Number 1,994 49 357 31 5,148 449 6 8,034Percent reporting birth weight % 94.4 83.7 75.9 83.9 90.2 84.6 83.3 90.3Mean Grams 3406.1 3187.6 3318.5 3078.2 3274.5 3293.5 3424.7 3310.2
UtahChildren in category Number 545 385 624 479 29,976 653 558 33,220Percent reporting birth weight % 94.9 91.4 83.8 88.7 93.2 92.8 83.7 92.8Mean Grams 3234.5 3128.6 3131.9 3369.6 3249.4 3229.6 3225.3 3246.7
WyomingChildren in category Number 186 21 100 9 4,975 228 181 5,700Percent reporting birth weight % 82.3 76.2 72.0 88.9 85.2 86.0 66.9 84.3Mean Grams 3191.5 3086.6 3063.8 3019.3 3166.7 3166.5 3201.0 3166.3
Cheyenne River Sioux (SD)Children in category Number 270 0 0 0 a 209 3 482Percent reporting birth weight % 23.0 N/A N/A N/A a 24.9 66.7 24.1Mean Grams 3339.8 N/A N/A N/A a 3340.9 3572.1 3344.3
Eastern Shoshone (WY)Children in category Number 134 0 0 0 a a 7 141Percent reporting birth weight % 15.7 N/A N/A N/A a a 14.3 15.6Mean Grams 3256.2 N/A N/A N/A a a 3061.8 3247.4
Northern Arapahoe (WY)Children in category Number 229 0 a 0 a 9 4 242Percent reporting birth weight % 30.6 N/A a N/A a 11.1 50.0 30.2Mean Grams 3162.2 N/A a N/A a 2835.0 2211.3 3131.7
Omaha Nation (NE)Children in category Number 169 0 0 0 0 0 0 169Percent reporting birth weight % 26.0 N/A N/A N/A N/A N/A N/A 26.0Mean Grams 3546.3 N/A N/A N/A N/A N/A N/A 3546.3
Appendix E: Supplemental Data Set E-21
Exhibit E6 (continued)
Mean Birthweight in Grams of WIC Children by Race by State
Region and State
AmericanIndian/AlaskaNative Only Asian Only
Black/AfricanAmerican
Only
NativeHawaiian/
PacificIslander Only White Only
Two or MoreRaces
Race NotReportedb
Total WICChildren
Rosebud Sioux (SD)Children in category Number 617 0 0 0 8 44 0 669Percent reporting birth weight % 31.9 N/A N/A N/A 25.0 18.2 N/A 30.9Mean Grams 3291.5 N/A N/A N/A 2948.4 3231.9 N/A 3285.9
Santee Sioux (NE)Children in category Number 73 0 0 0 a a 10 83Percent reporting birth weight % 21.9 N/A N/A N/A a a 40.0 24.1Mean Grams 3572.1 N/A N/A N/A a a 2778.3 3413.3
Standing Rock Sioux (ND)Children in category Number 613 a a a 9 8 1 631Percent reporting birth weight % 17.5 a a a 22.2 12.5 0.0 17.4Mean Grams 3338.4 a a a 3515.4 3288.6 N/A 3341.2
Three Affiliated (ND)Children in category Number 125 0 0 0 0 66 0 191Percent reporting birth weight % 28.0 N/A N/A N/A N/A 27.3 N/A 27.7Mean Grams 3589.9 N/A N/A N/A N/A 3357.9 N/A 3511.1
Ute Mountain Ute (CO)Children in category Number 126 0 0 0 0 0 0 126Percent reporting birth weight % 16.7 N/A N/A N/A N/A N/A N/A 16.7Mean Grams 3493.8 N/A N/A N/A N/A N/A N/A 3493.8
Winnebago (NE)Children in category Number 135 0 0 0 a a 3 138Percent reporting birth weight % 28.9 N/A N/A N/A a a 0.0 28.3Mean Grams 3468.9 N/A N/A N/A a a N/A 3468.9
WesternAmerican Samoa
Children in category Number a 26 a 4,634 a 20 5 4,685Percent reporting birth weight % a 34.6 a 32.7 a 55.0 20.0 32.8Mean Grams a 3244.5 a 3523.8 a 3402.0 2721.6 3520.7
ArizonaChildren in category Number 2,137 627 4,616 288 83,335 2,437 0 93,440Percent reporting birth weight % 92.0 88.0 89.2 88.9 93.7 94.1 N/A 93.4Mean Grams 3284.7 3132.2 3112.1 3266.0 3280.2 3240.1 N/A 3270.4
GuamChildren in category Number a 763 21 3,158 102 6 3 4,052Percent reporting birth weight % a 9.0 19.0 10.0 4.9 0.0 0.0 9.7Mean Grams a 2953.7 2983.8 3027.5 2404.1 N/A N/A 3006.3
IdahoChildren in category Number 1,257 173 268 53 19,650 469 0 21,870Percent reporting birth weight % 88.6 78.6 72.4 67.9 88.3 87.2 N/A 88.0Mean Grams 3293.3 3128.3 3149.6 3197.3 3284.7 3286.9 N/A 3282.6
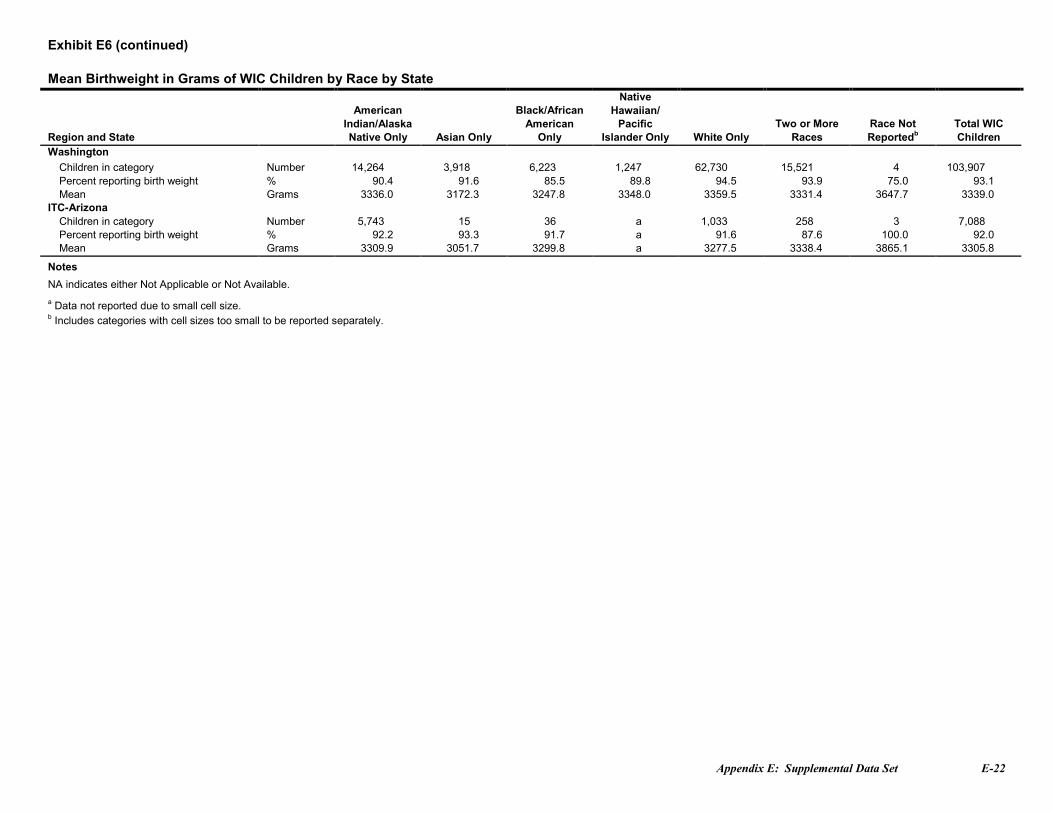
Appendix E: Supplemental Data Set E-22
Exhibit E6 (continued)
Mean Birthweight in Grams of WIC Children by Race by State
Region and State
AmericanIndian/AlaskaNative Only Asian Only
Black/AfricanAmerican
Only
NativeHawaiian/
PacificIslander Only White Only
Two or MoreRaces
Race NotReportedb
Total WICChildren
WashingtonChildren in category Number 14,264 3,918 6,223 1,247 62,730 15,521 4 103,907Percent reporting birth weight % 90.4 91.6 85.5 89.8 94.5 93.9 75.0 93.1Mean Grams 3336.0 3172.3 3247.8 3348.0 3359.5 3331.4 3647.7 3339.0
ITC-ArizonaChildren in category Number 5,743 15 36 a 1,033 258 3 7,088Percent reporting birth weight % 92.2 93.3 91.7 a 91.6 87.6 100.0 92.0Mean Grams 3309.9 3051.7 3299.8 a 3277.5 3338.4 3865.1 3305.8
Notes
NA indicates either Not Applicable or Not Available.a Data not reported due to small cell size.b Includes categories with cell sizes too small to be reported separately.

Appendix E: Supplemental Data Set E-23
Exhibit E7
Mean Birthweight in Grams of WIC Children by Ethnicity by StateRegion and State Hispanic/Latino Not Hispanic/Latino Ethnicity Not Reportedb Total WIC Children
NortheastConnecticut
Children in category Number 14,626 15,293 30 29,949Percent reporting birth weight % 94.5 94.9 10.0 94.6Mean Grams 3233.4 3212.2 3279.2 3222.6
MaineChildren in category Number 570 14,683 0 15,253Percent reporting birth weight % 0.0% 0.0% 0.0% 0.0%Mean Grams N/A N/A N/A N/A
MassachusettsChildren in category Number 24,187 45,955 0 70,142Percent reporting birth weight % 92.6 92.0 N/A 92.2Mean Grams 3247.9 3255.0 N/A 3252.5
New HampshireChildren in category Number 710 9,389 0 10,099Percent reporting birth weight % 68.5 81.9 N/A 81.0Mean Grams 3307.4 3306.4 N/A 3306.5
Rhode IslandChildren in category Number 6,378 8,967 27 15,372Percent reporting birth weight % 98.9 98.7 N/A 98.6Mean Grams 3268.3 3243.5 N/A 3253.8
VermontChildren in category Number 123 9,989 0 10,112Percent reporting birth weight % 86.2 93.4 N/A 93.3Mean Grams 3230.6 3329.2 N/A 3328.1
Indian Township (ME)Children in category Number a 46 a 47Percent reporting birth weight % a 19.6 a 19.1Mean Grams a 3528.0 a 3528.0
Seneca Nation (NY)Children in category Number 0 58 0 58Percent reporting birth weight % N/A 22.4 N/A 22.4Mean Grams N/A 3271.2 N/A 3271.2
Mid-AtlanticDistrict of Columbia
Children in category Number 2,148 5,538 9 7,695Percent reporting birth weight % 98.6 98.7 N/A 98.5Mean Grams 3256.2 3126.6 N/A 3162.8
MarylandChildren in category Number 18,335 49,323 0 67,658Percent reporting birth weight % 96.4 97.2 N/A 97.0Mean Grams 3274.3 3167.9 N/A 3196.5
New JerseyChildren in category Number 44,554 35,822 98 80,474Percent reporting birth weight % 96.6 96.3 59.2 96.4Mean Grams 3261.7 3191.8 3235.3 3230.6
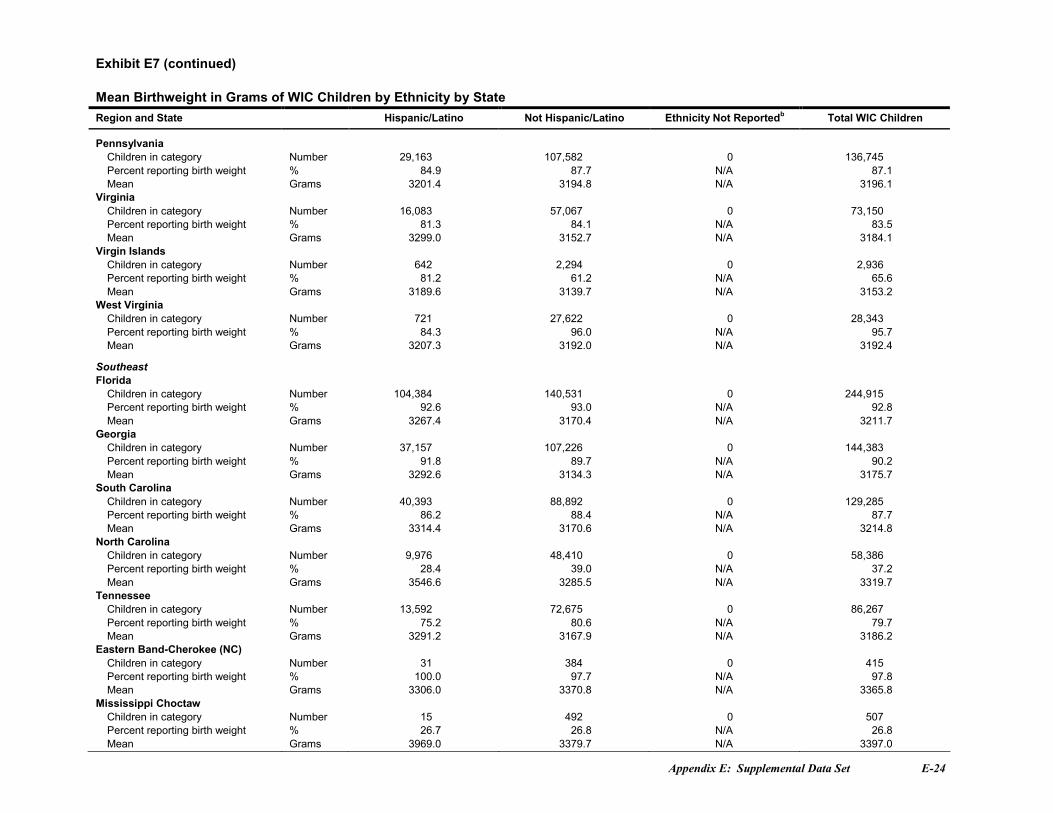
Appendix E: Supplemental Data Set E-24
Exhibit E7 (continued)
Mean Birthweight in Grams of WIC Children by Ethnicity by StateRegion and State Hispanic/Latino Not Hispanic/Latino Ethnicity Not Reportedb Total WIC Children
PennsylvaniaChildren in category Number 29,163 107,582 0 136,745Percent reporting birth weight % 84.9 87.7 N/A 87.1Mean Grams 3201.4 3194.8 N/A 3196.1
VirginiaChildren in category Number 16,083 57,067 0 73,150Percent reporting birth weight % 81.3 84.1 N/A 83.5Mean Grams 3299.0 3152.7 N/A 3184.1
Virgin IslandsChildren in category Number 642 2,294 0 2,936Percent reporting birth weight % 81.2 61.2 N/A 65.6Mean Grams 3189.6 3139.7 N/A 3153.2
West VirginiaChildren in category Number 721 27,622 0 28,343Percent reporting birth weight % 84.3 96.0 N/A 95.7Mean Grams 3207.3 3192.0 N/A 3192.4
SoutheastFlorida
Children in category Number 104,384 140,531 0 244,915Percent reporting birth weight % 92.6 93.0 N/A 92.8Mean Grams 3267.4 3170.4 N/A 3211.7
GeorgiaChildren in category Number 37,157 107,226 0 144,383Percent reporting birth weight % 91.8 89.7 N/A 90.2Mean Grams 3292.6 3134.3 N/A 3175.7
South CarolinaChildren in category Number 40,393 88,892 0 129,285Percent reporting birth weight % 86.2 88.4 N/A 87.7Mean Grams 3314.4 3170.6 N/A 3214.8
North CarolinaChildren in category Number 9,976 48,410 0 58,386Percent reporting birth weight % 28.4 39.0 N/A 37.2Mean Grams 3546.6 3285.5 N/A 3319.7
TennesseeChildren in category Number 13,592 72,675 0 86,267Percent reporting birth weight % 75.2 80.6 N/A 79.7Mean Grams 3291.2 3167.9 N/A 3186.2
Eastern Band-Cherokee (NC)Children in category Number 31 384 0 415Percent reporting birth weight % 100.0 97.7 N/A 97.8Mean Grams 3306.0 3370.8 N/A 3365.8
Mississippi ChoctawChildren in category Number 15 492 0 507Percent reporting birth weight % 26.7 26.8 N/A 26.8Mean Grams 3969.0 3379.7 N/A 3397.0
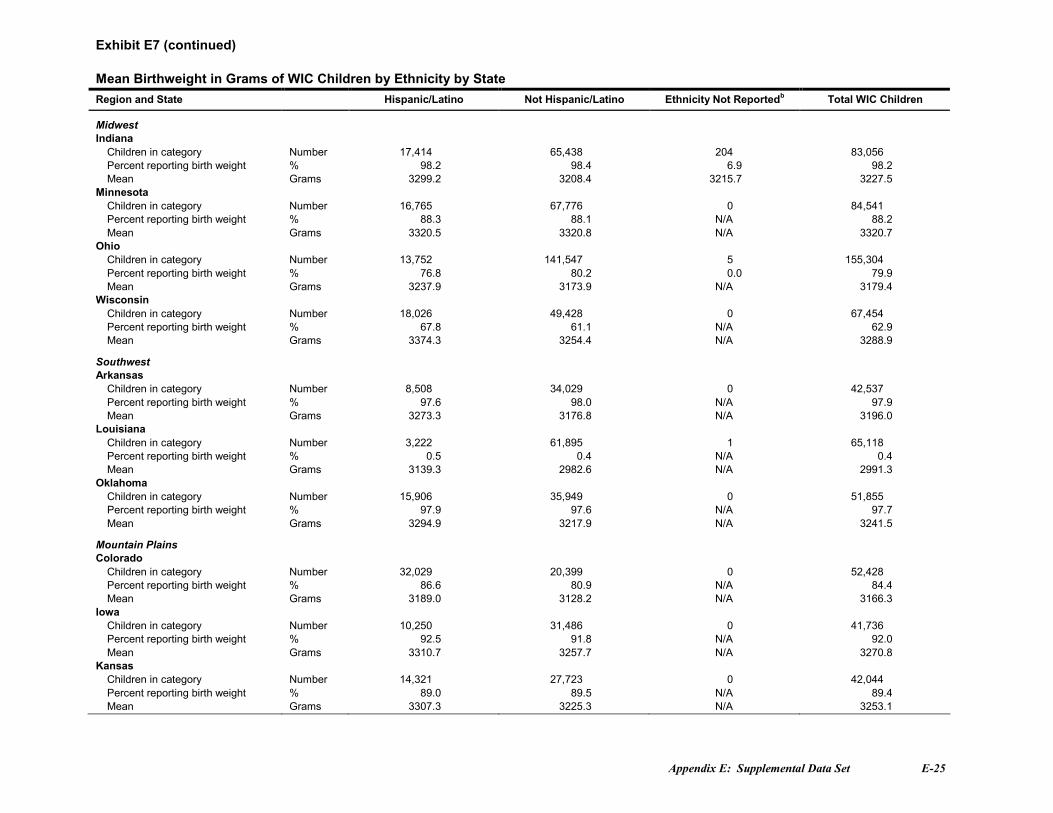
Appendix E: Supplemental Data Set E-25
Exhibit E7 (continued)
Mean Birthweight in Grams of WIC Children by Ethnicity by StateRegion and State Hispanic/Latino Not Hispanic/Latino Ethnicity Not Reportedb Total WIC Children
MidwestIndiana
Children in category Number 17,414 65,438 204 83,056Percent reporting birth weight % 98.2 98.4 6.9 98.2Mean Grams 3299.2 3208.4 3215.7 3227.5
MinnesotaChildren in category Number 16,765 67,776 0 84,541Percent reporting birth weight % 88.3 88.1 N/A 88.2Mean Grams 3320.5 3320.8 N/A 3320.7
OhioChildren in category Number 13,752 141,547 5 155,304Percent reporting birth weight % 76.8 80.2 0.0 79.9Mean Grams 3237.9 3173.9 N/A 3179.4
WisconsinChildren in category Number 18,026 49,428 0 67,454Percent reporting birth weight % 67.8 61.1 N/A 62.9Mean Grams 3374.3 3254.4 N/A 3288.9
SouthwestArkansas
Children in category Number 8,508 34,029 0 42,537Percent reporting birth weight % 97.6 98.0 N/A 97.9Mean Grams 3273.3 3176.8 N/A 3196.0
LouisianaChildren in category Number 3,222 61,895 1 65,118Percent reporting birth weight % 0.5 0.4 N/A 0.4Mean Grams 3139.3 2982.6 N/A 2991.3
OklahomaChildren in category Number 15,906 35,949 0 51,855Percent reporting birth weight % 97.9 97.6 N/A 97.7Mean Grams 3294.9 3217.9 N/A 3241.5
Mountain PlainsColorado
Children in category Number 32,029 20,399 0 52,428Percent reporting birth weight % 86.6 80.9 N/A 84.4Mean Grams 3189.0 3128.2 N/A 3166.3
IowaChildren in category Number 10,250 31,486 0 41,736Percent reporting birth weight % 92.5 91.8 N/A 92.0Mean Grams 3310.7 3257.7 N/A 3270.8
KansasChildren in category Number 14,321 27,723 0 42,044Percent reporting birth weight % 89.0 89.5 N/A 89.4Mean Grams 3307.3 3225.3 N/A 3253.1
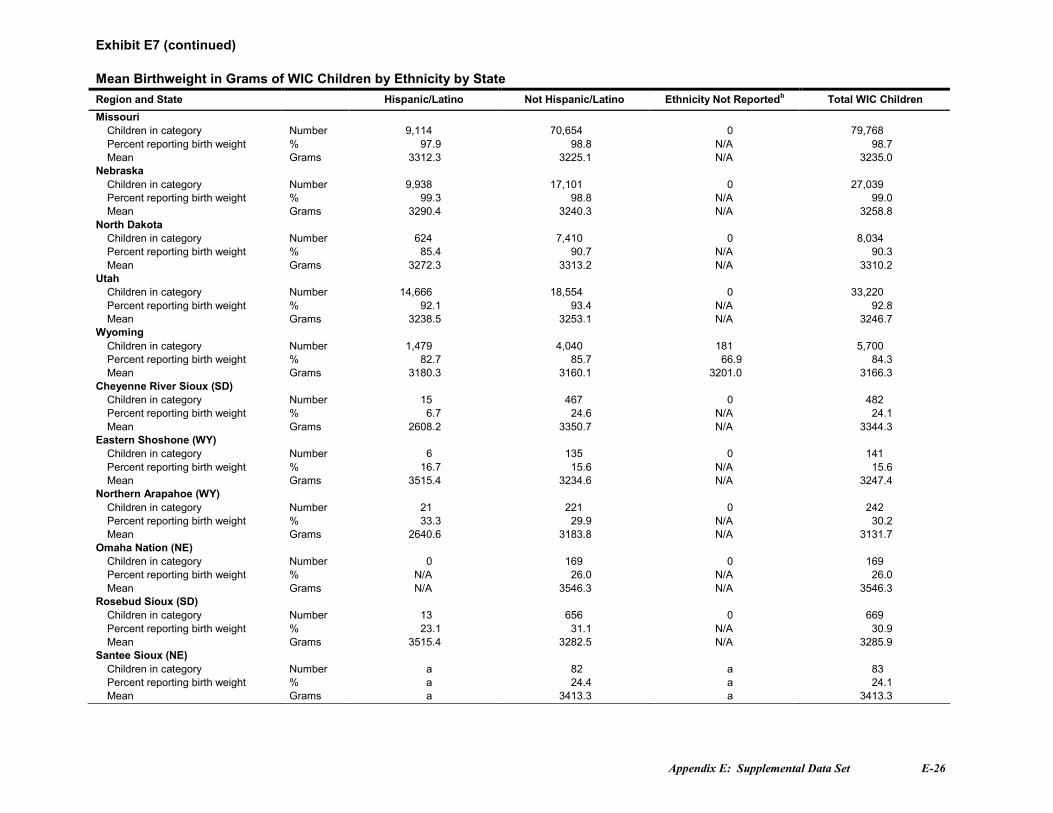
Appendix E: Supplemental Data Set E-26
Exhibit E7 (continued)
Mean Birthweight in Grams of WIC Children by Ethnicity by StateRegion and State Hispanic/Latino Not Hispanic/Latino Ethnicity Not Reportedb Total WIC Children
MissouriChildren in category Number 9,114 70,654 0 79,768Percent reporting birth weight % 97.9 98.8 N/A 98.7Mean Grams 3312.3 3225.1 N/A 3235.0
NebraskaChildren in category Number 9,938 17,101 0 27,039Percent reporting birth weight % 99.3 98.8 N/A 99.0Mean Grams 3290.4 3240.3 N/A 3258.8
North DakotaChildren in category Number 624 7,410 0 8,034Percent reporting birth weight % 85.4 90.7 N/A 90.3Mean Grams 3272.3 3313.2 N/A 3310.2
UtahChildren in category Number 14,666 18,554 0 33,220Percent reporting birth weight % 92.1 93.4 N/A 92.8Mean Grams 3238.5 3253.1 N/A 3246.7
WyomingChildren in category Number 1,479 4,040 181 5,700Percent reporting birth weight % 82.7 85.7 66.9 84.3Mean Grams 3180.3 3160.1 3201.0 3166.3
Cheyenne River Sioux (SD)Children in category Number 15 467 0 482Percent reporting birth weight % 6.7 24.6 N/A 24.1Mean Grams 2608.2 3350.7 N/A 3344.3
Eastern Shoshone (WY)Children in category Number 6 135 0 141Percent reporting birth weight % 16.7 15.6 N/A 15.6Mean Grams 3515.4 3234.6 N/A 3247.4
Northern Arapahoe (WY)Children in category Number 21 221 0 242Percent reporting birth weight % 33.3 29.9 N/A 30.2Mean Grams 2640.6 3183.8 N/A 3131.7
Omaha Nation (NE)Children in category Number 0 169 0 169Percent reporting birth weight % N/A 26.0 N/A 26.0Mean Grams N/A 3546.3 N/A 3546.3
Rosebud Sioux (SD)Children in category Number 13 656 0 669Percent reporting birth weight % 23.1 31.1 N/A 30.9Mean Grams 3515.4 3282.5 N/A 3285.9
Santee Sioux (NE)Children in category Number a 82 a 83Percent reporting birth weight % a 24.4 a 24.1Mean Grams a 3413.3 a 3413.3
Appendix E: Supplemental Data Set E-27
Exhibit E7 (continued)
Mean Birthweight in Grams of WIC Children by Ethnicity by StateRegion and State Hispanic/Latino Not Hispanic/Latino Ethnicity Not Reportedb Total WIC Children
Standing Rock Sioux (ND)Children in category Number a 629 2 631Percent reporting birth weight % a 17.5 0.0 17.4Mean Grams a 3341.2 N/A 3341.2
Three Affiliated (ND)Children in category Number 16 175 0 191Percent reporting birth weight % 18.8 28.6 N/A 27.7Mean Grams 3666.6 3501.8 N/A 3511.1
Ute Mountain Ute (CO)Children in category Number 0 126 0 126Percent reporting birth weight % N/A 16.7 N/A 16.7Mean Grams N/A 3493.8 N/A 3493.8
Winnebago (NE)Children in category Number a 135 3 138Percent reporting birth weight % a 28.9 0.0 28.3Mean Grams a 3468.9 N/A 3468.9
WesternAmerican Samoa
Children in category Number a 4,683 2 4,685Percent reporting birth weight % a 32.8 50.0 32.8Mean Grams a 3520.8 3345.3 3520.7
ArizonaChildren in category Number 68,494 24,946 0 93,440Percent reporting birth weight % 94.2 91.3 N/A 93.4Mean Grams 3284.8 3229.6 N/A 3270.4
GuamChildren in category Number 22 4,031 0 4,052Percent reporting birth weight % N/A 9.7 N/A 9.7Mean Grams N/A 3006.3 N/A 3006.3
IdahoChildren in category Number 7,831 14,039 0 21,870Percent reporting birth weight % 89.0 87.4 N/A 88.0Mean Grams 3284.7 3281.4 N/A 3282.6
WashingtonChildren in category Number 44,675 59,232 0 103,907Percent reporting birth weight % 93.4 92.9 N/A 93.1Mean Grams 3331.5 3344.6 N/A 3339.0
ITC-ArizonaChildren in category Number 2,219 4,869 0 7,088Percent reporting birth weight % 91.1 92.3 N/A 92.0Mean Grams 3305.5 3305.9 N/A 3305.8
Notes
N/A indicates either Not Applicable or Not Availablea Data not reported due to small cell size.b Includes categories with cell sizes too small to be reported separately.

Appendix E: Supplemental Data Set E-28
Exhibit E8
Length of Enrollment in WIC for Women WIC Participants for Most Recent Pregnancy from First WIC Certification to April 30, 2008 by ParticipantCategory by Statea
Region and State Pregnant Women Breastfeeding Women Postpartum Women Total WIC Women
Northeast
Connecticut
Women in Category Number 6,753 3,401 3,550 13,704
Percent reporting first WIC certification date % 77.0 82.6 81.0 79.4
Mean Weeks 14 40 34 26
Mode Weeks 8 38 41 13
Massachusetts
Women in Category Number 14,551 10,366 8,038 32,955
Percent reporting first WIC certification date % 99.9 100.0 100.0 100.0
Mean Weeks 15 44 35 29
Mode Weeks 4 37 37 14
New Hampshire
Women in Category Number 2,226 1,196 1,479 4,901
Percent reporting first WIC certification date % 100.0 99.9 99.9 99.9
Mean Weeks 15 40 34 27
Mode Weeks 10 45 42 *
Rhode Island
Women in Category Number 3,170 1,329 2,156 6,655
Percent reporting first WIC certification date % 98.8 99.5 99.5 99.1
Mean Weeks 15 41 34 26
Mode Weeks 10 35 36 14
Vermont
Women in Category Number 1,470 1,284 941 3,695
Percent reporting first WIC certification date % 91.8 97.2 97.2 95.0
Mean Weeks 16 20 17 17
Mode Weeks 3 4 21 3
Indian Township (ME)
Women in Category Number 6 2 3 11
Percent reporting first WIC certification date % 100.0 100.0 100.0 100.0
Mean Weeks 25 64 46 38
Mode Weeks 17 * * 17
Appendix E: Supplemental Data Set E-29
Exhibit E8 (continued)
Length of Enrollment in WIC for Women WIC Participants for Most Recent Pregnancy from First WIC Certification to April 30, 2008 by ParticipantCategory by State
Region and State Pregnant Women Breastfeeding Women Postpartum Women Total WIC WomenPleasant Point (ME)
Women in Category Number 12 7 1 20
Percent reporting first WIC certification date % 100.0 100.0 100.0 100.0
Mean Weeks 18 47 61 30
Mode Weeks * 54 61 54
Seneca Nation (NY)
Women in Category Number 34 0 5 39
Percent reporting first WIC certification date % 97.1 N/A 100.0 97.4
Mean Weeks 16 N/A 21 16
Mode Weeks * N/A * *
Mid-AtlanticDistrict of Columbia
Women in Category Number 1,770 1,505 1,796 5,071
Percent reporting first WIC certification date % 100.0 99.3 99.9 99.8
Mean Weeks 13 37 28 25
Mode Weeks 4 34 25 14
Maryland
Women in Category Number 14,287 12,982 10,566 37,835
Percent reporting first WIC certification date % 100.0 100.0 100.0 100.0
Mean Weeks 13 40 31 27
Mode Weeks 2 36 36 14
New Jersey
Women in Category Number 14,743 13,840 9,982 38,565
Percent reporting first WIC certification date % 98.9 99.1 98.9 99.0
Mean Weeks 12 35 26 24
Mode Weeks 3 33 34 7
Pennsylvania
Women in Category Number 22,872 11,505 26,357 60,734
Percent reporting first WIC certification date % 98.3 98.6 99.3 98.8
Mean Weeks 13 35 29 24
Mode Weeks 1 38 36 7
Appendix E: Supplemental Data Set E-30
Exhibit E8 (continued)
Length of Enrollment in WIC for Women WIC Participants for Most Recent Pregnancy from First WIC Certification to April 30, 2008 by ParticipantCategory by State
Region and State Pregnant Women Breastfeeding Women Postpartum Women Total WIC WomenPuerto Rico
Women in Category Number 22,766 6,274 12,441 41,481
Percent reporting first WIC certification date % 80.7 73.3 72.6 77.2
Mean Weeks 17 48 41 28
Mode Weeks 14 45 36 14
Virginia
Women in Category Number 15,131 11,883 16,515 43,529
Percent reporting first WIC certification date % 70.0 79.4 73.9 74.0
Mean Weeks 12 24 20 19
Mode Weeks 7 1 16 7
Virgin Islands
Women in Category Number 373 926 132 1,431
Percent reporting first WIC certification date % 99.7 100.0 100.0 99.9
Mean Weeks 12 39 28 31
Mode Weeks 2 * 30 2
West Virginia
Women in Category Number 6,765 1,560 4,422 12,747
Percent reporting first WIC certification date % 51.8 52.9 52.4 52.1
Mean Weeks 17 44 40 28
Mode Weeks 10 * * 16
SoutheastAlabama
Women in Category Number 18,377 5,129 14,400 37,906
Percent reporting first WIC certification date % 64.5 69.1 66.3 65.8
Mean Weeks 14 42 37 27
Mode Weeks 5 45 38 9
Florida
Women in Category Number 61,226 49,727 32,242 143,195
Percent reporting first WIC certification date % 99.9 100.0 100.0 100.0
Mean Weeks 15 42 33 28
Mode Weeks 3 39 39 16
Georgia
Women in Category Number 39,942 23,790 30,059 93,791
Percent reporting first WIC certification date % 66.7 96.0 94.4 83.0
Mean Weeks 16 32 32 26
Mode Weeks 7 36 26 16

Appendix E: Supplemental Data Set E-31
Exhibit E8 (continued)
Length of Enrollment in WIC for Women WIC Participants for Most Recent Pregnancy from First WIC Certification to April 30, 2008 by ParticipantCategory by State
Region and State Pregnant Women Breastfeeding Women Postpartum Women Total WIC WomenSouth Carolina
Women in Category Number 16,779 6,524 17,498 40,801
Percent reporting first WIC certification date % 99.9 94.5 99.4 98.8
Mean Weeks 14 44 33 27
Mode Weeks 4 47 37 4
Mississippi Choctaw
Women in Category Number 129 10 46 185
Percent reporting first WIC certification date % 99.2 100.0 100.0 99.5
Mean Weeks 18 45 41 25
Mode Weeks * 47 40 *
MidwestIllinois
Women in Category Number 40,564 18,600 25,941 85,105
Percent reporting first WIC certification date % 100.0 100.0 100.0 100.0
Mean Weeks 15 23 13 16
Mode Weeks 5 16 14 5
Indiana
Women in Category Number 17,602 7,627 17,377 42,606
Percent reporting first WIC certification date % 99.9 99.9 99.8 99.9
Mean Weeks 14 33 31 24
Mode Weeks 2 29 40 16
Michigan
Women in Category Number 27,464 11,287 19,272 58,023
Percent reporting first WIC certification date % 76.7 79.6 80.6 78.6
Mean Weeks 15 39 33 26
Mode Weeks 2 33 36 13
Minnesota
Women in Category Number 15,418 12,686 8,142 36,246
Percent reporting first WIC certification date % 99.7 99.1 98.8 99.3
Mean Weeks 15 41 32 28
Mode Weeks 2 37 37 *
Appendix E: Supplemental Data Set E-32
Exhibit E8 (continued)
Length of Enrollment in WIC for Women WIC Participants for Most Recent Pregnancy from First WIC Certification to April 30, 2008 by ParticipantCategory by State
Region and State Pregnant Women Breastfeeding Women Postpartum Women Total WIC WomenOhio
Women in Category Number 28,572 13,336 29,049 70,957
Percent reporting first WIC certification date % 88.8 92.0 94.9 91.9
Mean Weeks 14 39 34 27
Mode Weeks 1 36 * 14
Wisconsin
Women in Category Number 13,650 8,790 9,616 32,056
Percent reporting first WIC certification date % 97.5 97.4 98.7 97.8
Mean Weeks 15 40 32 27
Mode Weeks 2 41 32 14
SouthwestLouisiana
Women in Category Number 16,726 4,770 18,387 39,883
Percent reporting first WIC certification date % 82.1 93.2 91.6 87.8
Mean Weeks 14 38 36 28
Mode 4 26 37 16
New Mexico
Women in Category Number 8,243 4,245 3,879 16,367
Percent reporting first WIC certification date % 99.8 11.0 0.4 53.2
Mean Weeks 16 20 15 17
Mode 3 28 * 3
Oklahoma
Women in Category Number 12,692 4,468 8,060 25,220
Percent reporting first WIC certification date % 57.2 60.4 58.0 58.1
Mean Weeks 15 40 38 27
Mode Weeks 4 40 46 4
ACL (NM)
Women in Category Number 47 53 32 132
Percent reporting first WIC certification date % 57.4 64.2 56.3 59.8
Mean Weeks 14 48 31 32
Mode Weeks 3 47 * *
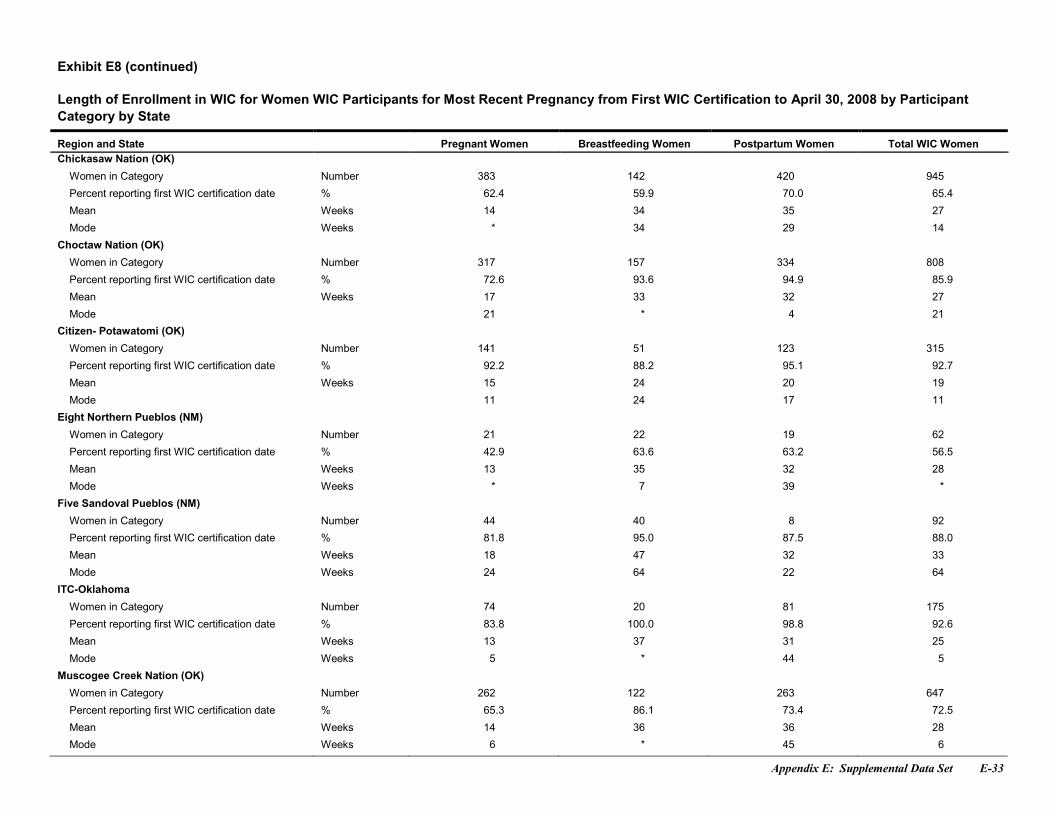
Appendix E: Supplemental Data Set E-33
Exhibit E8 (continued)
Length of Enrollment in WIC for Women WIC Participants for Most Recent Pregnancy from First WIC Certification to April 30, 2008 by ParticipantCategory by State
Region and State Pregnant Women Breastfeeding Women Postpartum Women Total WIC WomenChickasaw Nation (OK)
Women in Category Number 383 142 420 945
Percent reporting first WIC certification date % 62.4 59.9 70.0 65.4
Mean Weeks 14 34 35 27
Mode Weeks * 34 29 14
Choctaw Nation (OK)
Women in Category Number 317 157 334 808
Percent reporting first WIC certification date % 72.6 93.6 94.9 85.9
Mean Weeks 17 33 32 27
Mode 21 * 4 21
Citizen- Potawatomi (OK)
Women in Category Number 141 51 123 315
Percent reporting first WIC certification date % 92.2 88.2 95.1 92.7
Mean Weeks 15 24 20 19
Mode 11 24 17 11
Eight Northern Pueblos (NM)
Women in Category Number 21 22 19 62
Percent reporting first WIC certification date % 42.9 63.6 63.2 56.5
Mean Weeks 13 35 32 28
Mode Weeks * 7 39 *
Five Sandoval Pueblos (NM)
Women in Category Number 44 40 8 92
Percent reporting first WIC certification date % 81.8 95.0 87.5 88.0
Mean Weeks 18 47 32 33
Mode Weeks 24 64 22 64
ITC-Oklahoma
Women in Category Number 74 20 81 175
Percent reporting first WIC certification date % 83.8 100.0 98.8 92.6
Mean Weeks 13 37 31 25
Mode Weeks 5 * 44 5
Muscogee Creek Nation (OK)
Women in Category Number 262 122 263 647
Percent reporting first WIC certification date % 65.3 86.1 73.4 72.5
Mean Weeks 14 36 36 28
Mode Weeks 6 * 45 6
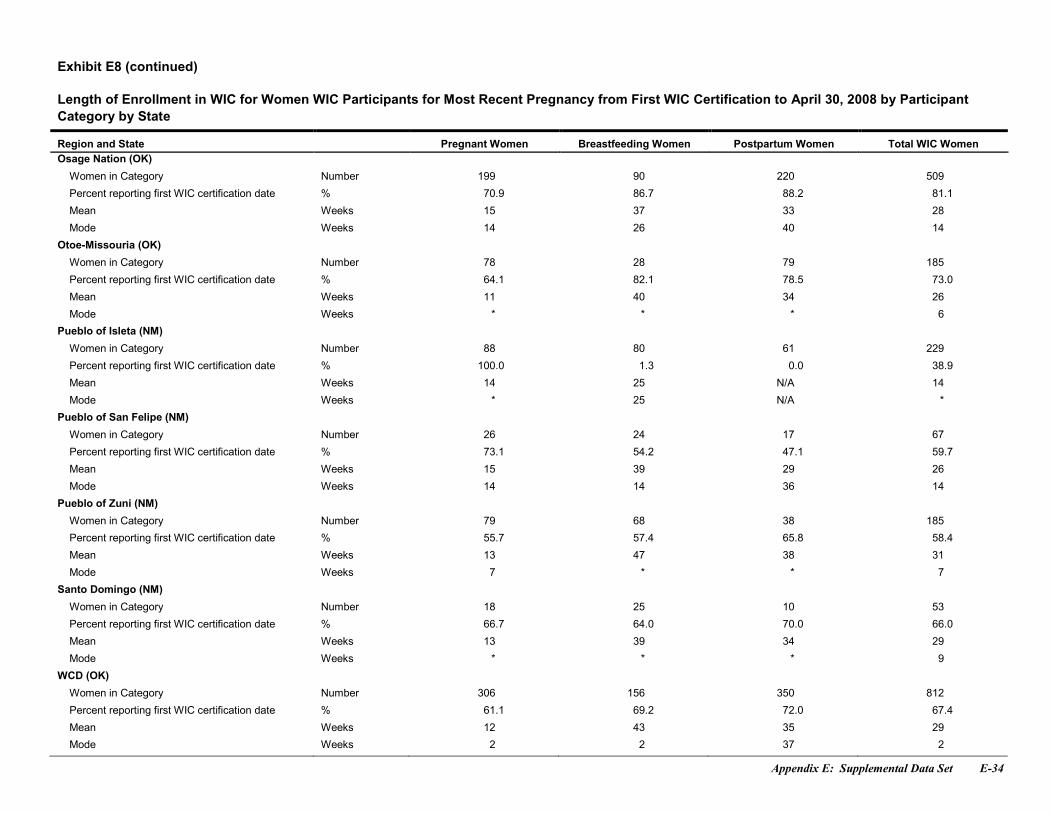
Appendix E: Supplemental Data Set E-34
Exhibit E8 (continued)
Length of Enrollment in WIC for Women WIC Participants for Most Recent Pregnancy from First WIC Certification to April 30, 2008 by ParticipantCategory by State
Region and State Pregnant Women Breastfeeding Women Postpartum Women Total WIC WomenOsage Nation (OK)
Women in Category Number 199 90 220 509
Percent reporting first WIC certification date % 70.9 86.7 88.2 81.1
Mean Weeks 15 37 33 28
Mode Weeks 14 26 40 14
Otoe-Missouria (OK)
Women in Category Number 78 28 79 185
Percent reporting first WIC certification date % 64.1 82.1 78.5 73.0
Mean Weeks 11 40 34 26
Mode Weeks * * * 6
Pueblo of Isleta (NM)
Women in Category Number 88 80 61 229
Percent reporting first WIC certification date % 100.0 1.3 0.0 38.9
Mean Weeks 14 25 N/A 14
Mode Weeks * 25 N/A *
Pueblo of San Felipe (NM)
Women in Category Number 26 24 17 67
Percent reporting first WIC certification date % 73.1 54.2 47.1 59.7
Mean Weeks 15 39 29 26
Mode Weeks 14 14 36 14
Pueblo of Zuni (NM)
Women in Category Number 79 68 38 185
Percent reporting first WIC certification date % 55.7 57.4 65.8 58.4
Mean Weeks 13 47 38 31
Mode Weeks 7 * * 7
Santo Domingo (NM)
Women in Category Number 18 25 10 53
Percent reporting first WIC certification date % 66.7 64.0 70.0 66.0
Mean Weeks 13 39 34 29
Mode Weeks * * * 9
WCD (OK)
Women in Category Number 306 156 350 812
Percent reporting first WIC certification date % 61.1 69.2 72.0 67.4
Mean Weeks 12 43 35 29
Mode Weeks 2 2 37 2
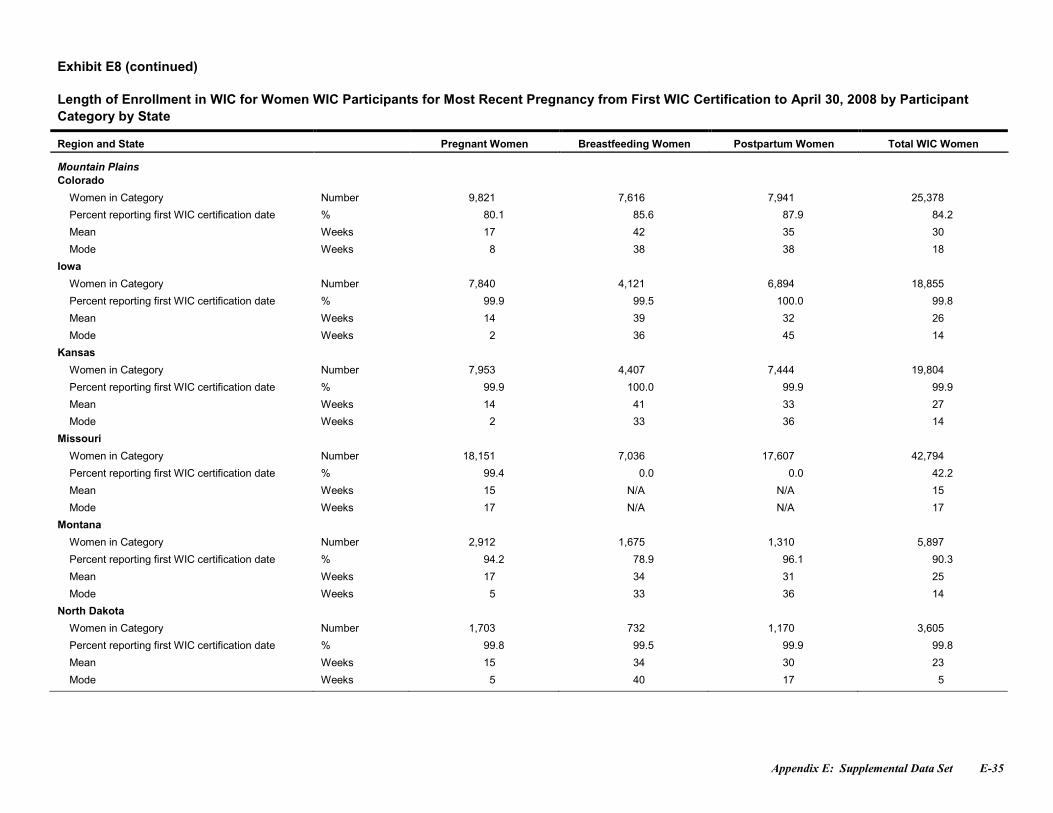
Appendix E: Supplemental Data Set E-35
Exhibit E8 (continued)
Length of Enrollment in WIC for Women WIC Participants for Most Recent Pregnancy from First WIC Certification to April 30, 2008 by ParticipantCategory by State
Region and State Pregnant Women Breastfeeding Women Postpartum Women Total WIC Women
Mountain PlainsColorado
Women in Category Number 9,821 7,616 7,941 25,378
Percent reporting first WIC certification date % 80.1 85.6 87.9 84.2
Mean Weeks 17 42 35 30
Mode Weeks 8 38 38 18
Iowa
Women in Category Number 7,840 4,121 6,894 18,855
Percent reporting first WIC certification date % 99.9 99.5 100.0 99.8
Mean Weeks 14 39 32 26
Mode Weeks 2 36 45 14
Kansas
Women in Category Number 7,953 4,407 7,444 19,804
Percent reporting first WIC certification date % 99.9 100.0 99.9 99.9
Mean Weeks 14 41 33 27
Mode Weeks 2 33 36 14
Missouri
Women in Category Number 18,151 7,036 17,607 42,794
Percent reporting first WIC certification date % 99.4 0.0 0.0 42.2
Mean Weeks 15 N/A N/A 15
Mode Weeks 17 N/A N/A 17
Montana
Women in Category Number 2,912 1,675 1,310 5,897
Percent reporting first WIC certification date % 94.2 78.9 96.1 90.3
Mean Weeks 17 34 31 25
Mode Weeks 5 33 36 14
North Dakota
Women in Category Number 1,703 732 1,170 3,605
Percent reporting first WIC certification date % 99.8 99.5 99.9 99.8
Mean Weeks 15 34 30 23
Mode Weeks 5 40 17 5
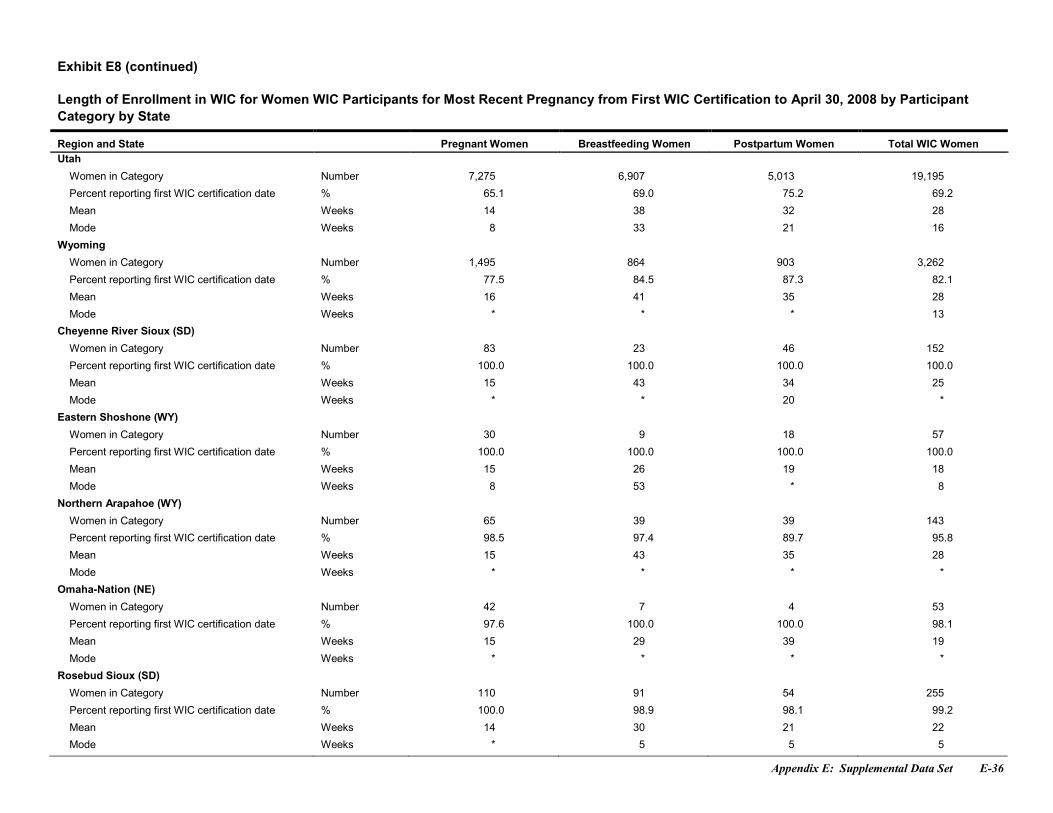
Appendix E: Supplemental Data Set E-36
Exhibit E8 (continued)
Length of Enrollment in WIC for Women WIC Participants for Most Recent Pregnancy from First WIC Certification to April 30, 2008 by ParticipantCategory by State
Region and State Pregnant Women Breastfeeding Women Postpartum Women Total WIC WomenUtah
Women in Category Number 7,275 6,907 5,013 19,195
Percent reporting first WIC certification date % 65.1 69.0 75.2 69.2
Mean Weeks 14 38 32 28
Mode Weeks 8 33 21 16
Wyoming
Women in Category Number 1,495 864 903 3,262
Percent reporting first WIC certification date % 77.5 84.5 87.3 82.1
Mean Weeks 16 41 35 28
Mode Weeks * * * 13
Cheyenne River Sioux (SD)
Women in Category Number 83 23 46 152
Percent reporting first WIC certification date % 100.0 100.0 100.0 100.0
Mean Weeks 15 43 34 25
Mode Weeks * * 20 *
Eastern Shoshone (WY)
Women in Category Number 30 9 18 57
Percent reporting first WIC certification date % 100.0 100.0 100.0 100.0
Mean Weeks 15 26 19 18
Mode Weeks 8 53 * 8
Northern Arapahoe (WY)
Women in Category Number 65 39 39 143
Percent reporting first WIC certification date % 98.5 97.4 89.7 95.8
Mean Weeks 15 43 35 28
Mode Weeks * * * *
Omaha-Nation (NE)
Women in Category Number 42 7 4 53
Percent reporting first WIC certification date % 97.6 100.0 100.0 98.1
Mean Weeks 15 29 39 19
Mode Weeks * * * *
Rosebud Sioux (SD)
Women in Category Number 110 91 54 255
Percent reporting first WIC certification date % 100.0 98.9 98.1 99.2
Mean Weeks 14 30 21 22
Mode Weeks * 5 5 5
Appendix E: Supplemental Data Set E-37
Exhibit E8 (continued)
Length of Enrollment in WIC for Women WIC Participants for Most Recent Pregnancy from First WIC Certification to April 30, 2008 by ParticipantCategory by State
Region and State Pregnant Women Breastfeeding Women Postpartum Women Total WIC WomenSantee Sioux (NE)
Women in Category Number 20 0 8 28
Percent reporting first WIC certification date % 100.0 N/A 100.0 100.0
Mean Weeks 19 N/A 33 23
Mode Weeks 29 N/A 41 29
Standing Rock Sioux (ND)
Women in Category Number 96 24 66 186
Percent reporting first WIC certification date % 99.0 100.0 92.4 96.8
Mean Weeks 17 38 36 26
Mode Weeks 7 13 36 13
Three Affiliated (ND)
Women in Category Number 57 3 16 76
Percent reporting first WIC certification date % 100.0 100.0 93.8 98.7
Mean Weeks 20 20 27 22
Mode Weeks 14 * * 14
Ute Mountain Ute (CO)
Women in Category Number 18 17 2 37
Percent reporting first WIC certification date % 100.0 100.0 100.0 100.0
Mean Weeks 18 37 33 27
Mode Weeks 11 * * *
Winnebago (NE)
Women in Category Number 24 4 9 37
Percent reporting first WIC certification date % 100.0 100.0 100.0 100.0
Mean Weeks 18 36 35 24
Mode Weeks 4 * * 4
WesternAmerican Samoa
Women in Category Number 484 839 118 1,441
Percent reporting first WIC certification date % 100.0 100.0 100.0 100.0
Mean Weeks 14 26 23 22
Mode Weeks 11 25 22 25
Appendix E: Supplemental Data Set E-38
Exhibit E8 (continued)
Length of Enrollment in WIC for Women WIC Participants for Most Recent Pregnancy from First WIC Certification to April 30, 2008 by ParticipantCategory by State
Region and State Pregnant Women Breastfeeding Women Postpartum Women Total WIC WomenArizona
Women in Category Number 19,319 18,309 13,191 50,819
Percent reporting first WIC certification date % 100.0 100.0 100.0 100.0
Mean Weeks 13 38 30 26
Mode Weeks * 40 39 16
Guam
Women in Category Number 722 366 539 1,628
Percent reporting first WIC certification date % 0.0 97.3 89.5 51.5
Mean Weeks N/A 15 17 16
Mode Weeks N/A 2 * 2
ITC-Arizona
Women in Category Number 1,123 954 1,018 3,095
Percent reporting first WIC certification date % 100.0 100.0 99.9 100.0
Mean Weeks 14 40 32 28
Mode Weeks * 42 43 7
Notes
N/A indicates either Not Applicable or Not Available.a For pregnant women, date of the first WIC certification refers to the first WIC certification for the current pregnancy. For breastfeeding and postpartum women, this refers to the first WIC certificationfor the most recent pregnancy
*Multiple modes by participant category by State.
State Category Modes
New Hampshire Total WIC Women 10 14Indian Township Breastfeeding Women 48 80Indian Township Postpartum Women 22 56 60Pleasant Point Pregnant Women 3 20Seneca Nation Pregnant Women 8 25Seneca Nation Postpartum Women 3 4 20 30 48Seneca Nation Total WIC Women 8 25 30Virgin Islands Breastfeeding Women 33 36 45West Virginia Breastfeeding Women 39 41West Virginia Postpartum Women 41 43Mississippi Choctaw Pregnant Women 3 7 21 22Mississippi Choctaw Total WIC Women 3 40Minnesota Total WIC Women 10 14Ohio Postpartum Women 36 41New Mexico Postpartum Women 14 16 23
Appendix E: Supplemental Data Set E-39
State Category Modes
ACL Postpartum Women 10 11 12ACL Total WIC Women 3 47Chickasaw Nation Pregnant Women 7 10 12Choctaw Nation Breastfeeding Women 21 30Eight Northern Pueblos Pregnant Women 16 20Eight Northern Pueblos Total WIC Women 16 20ITC-Oklahoma Breastfeeding Women 4 15 62Muscogee Creek Nation Breastfeeding Women 11 22Otoe-Missouria Pregnant Women 6 7Otoe-Missouria Breastfeeding Women 17 26 46Otoe-Missouria Postpartum Women 9 38 39Pueblo of Isleta Pregnant Women 15 16Pueblo of Isleta Total WIC Women 15 16Pueblo of Zuni Breastfeeding Women 39 40 41 42 44 63 64 75Pueblo of Zuni Postpartum Women 42 56Santo Domingo Pregnant Women 3 9 15Santo Domingo Breastfeeding Women 50 54Santo Domingo Postpartum Women 9 21 22 27 28 43 90Wyoming Pregnant Women 3 10Wyoming Breastfeeding Women 40 42Wyoming Postpartum Women 22 40 52Cheyenne River Sioux Pregnant Women 1 7 14Cheyenne River Sioux Breastfeeding Women 41 52 58Cheyenne River Sioux Total WIC Women 1 20Eastern Shoshone Postpartum Women 2 17Northern Arapahoe Pregnant Women 5 6Northern Arapahoe Breastfeeding Women 27 30 31 43 48 67 69 88Northern Arapahoe Postpartum Women 15 25 32 33 40 46Northern Arapahoe Total WIC Women 10 31Omaha Nation Pregnant Women 6 10Omaha Nation Breastfeeding Women 2 19 23 24 25 44 68Omaha Nation Postpartum Women 22 37 46 52Omaha Nation Total WIC Women 6 10Rosebud Sioux Pregnant Women 4 10Three Affiliated Breastfeeding Women 5 15 39Three Affiliated Postpartum Women 4 51Ute Mountain Ute Breastfeeding Women 2 8 10 14 22 26 36 37 38 42 46 48 56 57 59 60 66Ute Mountain Ute Postpartum Women 20 45Ute Mountain Ute Total WIC Women 11 22Winnebago Breastfeeding Women 4 14 58 68Winnebago Postpartum Women 6 7 20 32 43 44 53 55 57Arizona Pregnant Women 4 5Guam Postpartum Women 6 9 12 15ITC-Arizona Pregnant Women 1 2
Appendix E: Supplemental Data Set E-40
Exhibit E9
Length of Enrollment in WIC for Infant and Child WIC Participants from First WIC Certification to April 30, 2008 by Age and by Statea
Infants Children
Region and State0-5
Months6-11
MonthsAge Not
Reported Total 1 Year 2 Years 3 Years 4 YearsAge Not
Reported Total
NortheastConnecticut
Participants in category Number 16,033 283 1 16,317 10,975 7,789 6,469 4,716 0 29,949Percent reporting first WIC certification date % 100.0 99.6 0.0 100.0 100.0 100.0 100.0 100.0 N/A 100.0Mean Weeks 25 22 N/A 25 75 122 161 199 N/A 125Mode Weeks 17 * N/A 17 69 121 194 243 N/A 69
MassachusettsParticipants in category Number 32,114 511 0 32,625 24,098 18,574 15,911 11,559 0 70,142Percent reporting first WIC certification date % 100.0 100.0 N/A 100.0 100.0 100.0 100.0 100.0 N/A 100.0Mean Weeks 25 13 N/A 25 75 122 163 201 N/A 128Mode Weeks 17 * N/A 17 62 131 178 239 N/A 62
New HampshireParticipants in category Number 4,877 127 0 5,004 3,907 2,541 2,143 1,508 0 10,099Percent reporting first WIC certification date % 100.0 100.0 N/A 100.0 100.0 100.0 100.0 100.0 N/A 100.0Mean Weeks 25 13 N/A 25 73 119 129 133 N/A 105Mode Weeks 14 22 N/A 14 62 137 128 132 N/A 132
Rhode IslandParticipants in category Number 5,908 534 199 6,641 5,600 3,875 3,397 2,463 37 15,372Percent reporting first WIC certification date % 100.0 100.0 0.0 97.0 100.0 99.7 99.8 99.7 0.0 99.6Mean Weeks 24 35 N/A 25 75 123 146 167 N/A 117Mode Weeks 18 46 N/A 18 54 142 123 123 N/A 123
VermontParticipants in category Number 2,406 728 56 3,190 3,528 2,531 2,311 1,697 45 10,112Percent reporting first WIC certification date % 91.5 99.2 0.0 91.6 99.9 99.9 99.6 99.8 0.0 99.3Mean Weeks 22 36 N/A 26 76 124 162 193 N/A 127Mode Weeks 24 * N/A 24 * 138 189 233 N/A 56
Indian Township (ME)Participants in category Number 19 0 0 19 19 16 7 5 0 47Percent reporting first WIC certification date % 100.0 N/A N/A 100.0 100.0 100.0 100.0 100.0 N/A 100.0Mean Weeks 27 N/A N/A 27 76 134 161 205 N/A 122Mode Weeks * N/A N/A * 78 110 * * N/A *
Pleasant Point (ME)Participants in category Number 25 4 0 29 10 10 7 6 0 33Percent reporting first WIC certification date % 100.0 100.0 N/A 100.0 100.0 100.0 100.0 100.0 N/A 100.0Mean Weeks 29 21 N/A 28 79 110 177 222 N/A 135Mode Weeks 43 * N/A 43 78 * 186 * N/A *
Seneca Nation (NY)Participants in category Number 35 4 0 39 23 14 14 7 0 58Percent reporting first WIC certification date % 100.0 100.0 N/A 100.0 100.0 100.0 100.0 100.0 N/A 100.0Mean Weeks 20 18 N/A 20 70 122 160 161 N/A 115Mode Weeks 8 * N/A 8 * * 209 * N/A *
Appendix E: Supplemental Data Set E-41
Exhibit E9 (continued)
Length of Enrollment in WIC for Infant and Child WIC Participants from First WIC Certification to April 30, 2008 by Age and by State
Infants Children
Region and State0-5
Months6-11
MonthsAge Not
Reported Total 1 Year 2 Years 3 Years 4 YearsAge Not
Reported TotalMid-AtlanticDistrict of Columbia
Participants in category Number 5,583 66 0 5,649 3,190 1,982 1,534 989 0 7,695Percent reporting first WIC certification date % 100.0 100.0 N/A 100.0 100.0 99.9 100.0 100.0 N/A 100.0Mean Weeks 25 14 N/A 25 74 123 137 146 N/A 109Mode Weeks 17 * N/A 17 69 118 133 142 N/A 133
MarylandParticipants in category Number 36,720 2,487 2 39,209 25,427 17,645 14,628 9,958 0 67,658Percent reporting first WIC certification date % 100.0 100.0 0.0 100.0 100.0 100.0 100.0 100.0 N/A 100.0Mean Weeks 25 42 N/A 26 77 126 171 210 N/A 130Mode Weeks 14 54 N/A 14 66 140 189 236 N/A 66
New JerseyParticipants in category Number 24,449 16,322 1 40,772 31,390 20,326 17,301 11,457 0 80,474Percent reporting first WIC certification date % 99.9 99.8 0.0 99.8 99.8 99.8 99.8 99.7 N/A 99.8Mean Weeks 14 37 N/A 23 73 125 170 208 N/A 126Mode Weeks 17 36 N/A 17 52 125 182 233 N/A 52
PennsylvaniaParticipants in category Number 69,343 2,426 4 71,773 50,616 34,765 29,990 21,373 1 136,745Percent reporting first WIC certification date % 99.1 98.9 0.0 99.1 99.5 99.6 99.6 99.7 100.0 99.6Mean Weeks 25 35 N/A 26 62 90 109 126 202 89Mode Weeks 17 7 N/A 17 69 13 1 13 202 13
Puerto RicoParticipants in category Number 38,370 1,831 1,990 42,191 40,306 32,627 29,492 20,503 13 122,941Percent reporting first WIC certification date % 95.4 95.1 0.0 90.9 97.4 98.4 98.7 98.2 0.0 98.1Mean Weeks 27 32 N/A 27 76 128 177 220 N/A 138Mode Weeks 14 36 N/A 14 66 119 188 223 N/A 66
VirginiaParticipants in category Number 40,838 804 0 41,642 29,408 18,576 14,976 10,190 0 73,150Percent reporting first WIC certification date % 100.0 100.0 N/A 100.0 100.0 100.0 100.0 100.0 N/A 100.0Mean Weeks 24 17 N/A 23 71 121 165 202 N/A 121Mode Weeks 17 * N/A 17 67 125 185 237 N/A 67
Virgin IslandsParticipants in category Number 1,268 46 0 1,314 1,054 765 659 458 0 2,936Percent reporting first WIC certification date % 100.0 100.0 N/A 100.0 100.0 100.0 100.0 100.0 N/A 100.0Mean Weeks 26 30 N/A 26 76 94 85 87 N/A 84Mode Weeks 28 * N/A 28 * 80 82 99 N/A 85
West VirginiaParticipants in category Number 12,739 261 33 13,033 11,227 6,870 5,904 4,105 237 28,343Percent reporting first WIC certification date % 98.6 98.9 0.0 98.4 99.8 99.8 99.8 100.0 0.0 99.0Mean Weeks 24 22 N/A 24 77 131 177 214 N/A 131Mode Weeks 17 16 N/A 17 62 132 193 242 N/A 62
Appendix E: Supplemental Data Set E-42
Exhibit E9 (continued)
Length of Enrollment in WIC for Infant and Child WIC Participants from First WIC Certification to April 30, 2008 by Age and by State
Infants Children
Region and State0-5
Months6-11
MonthsAge Not
Reported Total 1 Year 2 Years 3 Years 4 YearsAge Not
Reported Total
SoutheastAlabama
Participants in category Number 40,033 2,041 2 42,076 29,035 18,401 14,968 10,375 1 72,780Percent reporting first WIC certification date % 100.0 100.0 50.0 100.0 100.0 100.0 100.0 100.0 100.0 100.0Mean Weeks 25 33 9 25 73 120 161 195 78 120Mode Weeks 22 54 9 17 69 132 180 245 78 69
FloridaParticipants in category Number 140,312 5,173 4 145,489 93,145 63,987 52,744 35,039 0 244,915Percent reporting first WIC certification date % 100.0 100.0 0.0 100.0 100.0 100.0 100.0 100.0 N/A 100.0Mean Weeks 26 30 N/A 26 75 125 168 199 N/A 126Mode Weeks 17 2 N/A 17 69 130 186 230 N/A 69
GeorgiaParticipants in category Number 88,527 963 20 89,510 49,606 39,625 32,913 22,239 0 144,383Percent reporting first WIC certification date % 99.9 100.0 0.0 99.8 99.9 99.9 99.9 99.8 N/A 99.9Mean Weeks 24 15 N/A 24 84 125 165 202 N/A 132Mode Weeks 17 2 N/A 17 85 138 190 242 N/A 84
South CarolinaParticipants in category Number 40,601 830 44 41,475 25,901 13,823 11,224 7,420 18 58,386Percent reporting first WIC certification date % 100.0 100.0 11.4 99.9 100.0 100.0 100.0 100.0 0.0 100.0Mean Weeks 25 28 27 25 73 75 67 69 N/A 72Mode Weeks 16 16 28 16 69 78 93 78 N/A 69
Mississippi ChoctawParticipants in category Number 269 1 0 270 168 140 117 82 0 507Percent reporting first WIC certification date % 100.0 100.0 N/A 100.0 100.0 100.0 100.0 100.0 N/A 100.0Mean Weeks 27 10 N/A 27 83 131 185 233 N/A 144Mode Weeks * 10 N/A * * * 196 * N/A *
MidwestIllinois
Participants in category Number 92,618 1,240 36 93,894 57,895 40,020 32,505 22,445 1 152,866Percent reporting first WIC certification date % 100.0 100.0 0.0 100.0 100.0 100.0 100.0 100.0 100.0 100.0Mean Weeks 26 13 N/A 25 13 13 13 13 15 13Mode Weeks 16 4 N/A 16 14 1 1 1 15 1
IndianaParticipants in category Number 45,193 722 1 45,916 33,258 20,706 17,207 11,885 0 83,056Percent reporting first WIC certification date % 99.6 97.2 0.0 99.6 99.3 99.3 99.1 99.0 N/A 99.2Mean Weeks 24 11 N/A 24 73 124 169 206 N/A 124Mode Weeks 17 * N/A 17 53 131 189 238 N/A 53
MichiganParticipants in category Number 43,345 19,395 3 62,743 58,361 36,233 30,810 19,906 2 145,312Percent reporting first WIC certification date % 100.0 99.9 0.0 99.9 99.3 95.3 92.7 91.0 0.0 95.8Mean Weeks 19 36 N/A 24 74 119 150 177 N/A 114Mode Weeks 16 40 N/A 22 53 140 192 245 N/A 53
Appendix E: Supplemental Data Set E-43
Exhibit E9 (continued)
Length of Enrollment in WIC for Infant and Child WIC Participants from First WIC Certification to April 30, 2008 by Age and by State
Infants Children
Region and State0-5
Months6-11
MonthsAge Not
Reported Total 1 Year 2 Years 3 Years 4 YearsAge Not
Reported TotalMinnesota
Participants in category Number 33,597 500 0 34,097 32,439 20,843 18,115 13,143 1 84,541Percent reporting first WIC certification date % 99.5 89.4 N/A 99.3 99.5 99.8 99.9 99.9 0.0 99.7Mean Weeks 24 13 N/A 24 74 126 170 209 N/A 129Mode Weeks 17 2 N/A 17 54 134 189 242 N/A 54
OhioParticipants in category Number 50,759 21,152 10 71,921 60,816 38,459 33,164 22,856 9 155,304Percent reporting first WIC certification date % 100.0 100.0 0.0 100.0 100.0 99.9 99.9 99.9 0.0 99.9Mean Weeks 19 37 N/A 24 73 109 134 158 N/A 108Mode Weeks 14 * N/A 14 62 140 184 240 N/A 66
WisconsinParticipants in category Number 31,630 1,811 5 33,446 24,381 17,314 14,858 10,901 0 67,454Percent reporting first WIC certification date % 98.3 99.6 0.0 98.4 99.6 99.5 99.6 99.8 N/A 99.6Mean Weeks 25 44 N/A 26 67 92 112 128 N/A 93Mode Weeks 17 53 N/A 17 58 130 1 1 N/A 1
SouthwestLouisiana
Participants in category Number 43,371 713 1 44,085 27,894 16,073 12,745 8,406 0 65,118Percent reporting first WIC certification date % 100.0 100.0 0.0 100.0 100.0 100.0 100.0 100.0 N/A 100.0Mean Weeks 24 25 N/A 24 74 98 83 84 N/A 83Mode Weeks 16 4 N/A 16 67 100 100 99 N/A 100
New MexicoParticipants in category Number 15,865 467 0 16,332 12,504 9,066 8,005 5,432 2 35,009Percent reporting first WIC certification date % 100.0 100.0 N/A 100.0 100.0 100.0 100.0 100.0 0.0 100.0Mean Weeks 25 13 N/A 24 73 123 166 202 N/A 127Mode Weeks 3 3 N/A 3 69 136 185 239 N/A 80
OklahomaParticipants in category Number 24,900 1,055 7 25,962 18,811 13,389 11,343 8,176 137 51,855Percent reporting first WIC certification date % 97.5 99.8 0.0 97.5 99.5 99.5 99.6 99.7 0.0 99.3Mean Weeks 23 35 N/A 24 72 121 164 203 N/A 126Mode Weeks 10 52 N/A 10 69 121 171 225 N/A 62
ACL (NM)Participants in category Number 102 22 0 124 122 89 81 46 0 338Percent reporting first WIC certification date % 100.0 100.0 N/A 100.0 100.0 100.0 100.0 100.0 N/A 100.0Mean Weeks 21 37 N/A 24 74 128 167 221 N/A 130Mode Weeks 17 35 N/A 17 56 134 186 229 N/A 56
Chickasaw Nation (OK)Participants in category Number 754 123 0 877 784 520 458 290 0 2,052Percent reporting first WIC certification date % 100.0 100.0 N/A 100.0 100.0 100.0 100.0 100.0 N/A 100.0Mean Weeks 22 32 N/A 23 72 116 152 190 N/A 118Mode Weeks 14 38 N/A 14 78 152 187 241 N/A 78
Appendix E: Supplemental Data Set E-44
Exhibit E9 (continued)
Length of Enrollment in WIC for Infant and Child WIC Participants from First WIC Certification to April 30, 2008 by Age and by State
Infants Children
Region and State0-5
Months6-11
MonthsAge Not
Reported Total 1 Year 2 Years 3 Years 4 YearsAge Not
Reported TotalChoctaw Nation (OK)
Participants in category Number 712 245 2 959 740 477 410 268 1 1,896Percent reporting first WIC certification date % 99.3 97.1 0.0 98.5 97.0 99.8 100.0 99.6 0.0 98.7Mean Weeks 19 36 N/A 23 49 44 44 47 N/A 46Mode Weeks 7 50 N/A 7 47 * 29 29 N/A 29
Citizen-Potawatomi (OK)Participants in category Number 352 6 9 367 353 282 260 172 3 1,070Percent reporting first WIC certification date % 94.6 100.0 0.0 92.4 98.3 98.6 98.8 98.8 0.0 98.3Mean Weeks 27 10 N/A 27 15 16 15 16 N/A 15Mode Weeks 38 * N/A 38 * 23 8 3 N/A 3
Eight Northern Pueblos (NM)Participants in category Number 65 17 0 82 67 44 44 27 0 182Percent reporting first WIC certification date % 100.0 100.0 N/A 100.0 100.0 100.0 100.0 100.0 N/A 100.0Mean Weeks 21 39 N/A 25 77 117 172 225 N/A 131Mode Weeks 7 46 N/A 7 95 148 186 * N/A 95
Five Sandoval Pueblos (NM)Participants in category Number 57 22 0 79 79 51 42 40 0 212Percent reporting first WIC certification date % 100.0 100.0 N/A 100.0 100.0 100.0 100.0 100.0 N/A 100.0Mean Weeks 22 32 N/A 25 73 123 165 197 N/A 127Mode Weeks * * N/A 43 90 * * * N/A *
ITC-OklahomaParticipants in category Number 190 3 0 193 184 121 108 82 0 495Percent reporting first WIC certification date % 100.0 100.0 N/A 100.0 100.0 100.0 100.0 100.0 N/A 100.0Mean Weeks 25 21 N/A 25 69 105 132 166 N/A 108Mode Weeks 35 * N/A 35 62 143 196 255 N/A 62
Muscogee Creek Nation (OK)Participants in category Number 375 270 0 645 596 397 393 279 0 1,665Percent reporting first WIC certification date % 100.0 100.0 N/A 100.0 100.0 100.0 100.0 100.0 N/A 100.0Mean Weeks 17 34 N/A 24 64 103 139 156 N/A 106Mode Weeks 17 45 N/A 17 78 147 196 * N/A 78
Osage Nation (OK)Participants in category Number 504 119 0 623 491 331 304 207 1 1,334Percent reporting first WIC certification date % 100.0 100.0 N/A 100.0 100.0 100.0 99.7 100.0 0.0 99.9Mean Weeks 20 32 N/A 22 70 115 153 176 N/A 117Mode Weeks 15 28 N/A * * 130 160 * N/A 69
Otoe Missouria (OK)Participants in category Number 129 45 0 174 152 105 92 60 0 409Percent reporting first WIC certification date % 100.0 100.0 N/A 100.0 100.0 100.0 100.0 100.0 N/A 100.0Mean Weeks 19 37 N/A 23 69 112 150 190 N/A 116Mode Weeks * 34 N/A * 78 * 191 241 N/A 78
Pueblo of Isleta (NM)Participants in category Number 221 5 0 226 205 145 121 133 0 604Percent reporting first WIC certification date % 100.0 100.0 N/A 100.0 100.0 100.0 100.0 100.0 N/A 100.0Mean Weeks 24 10 N/A 24 74 118 138 133 N/A 110Mode Weeks 17 * N/A 17 * * 167 165 N/A 168
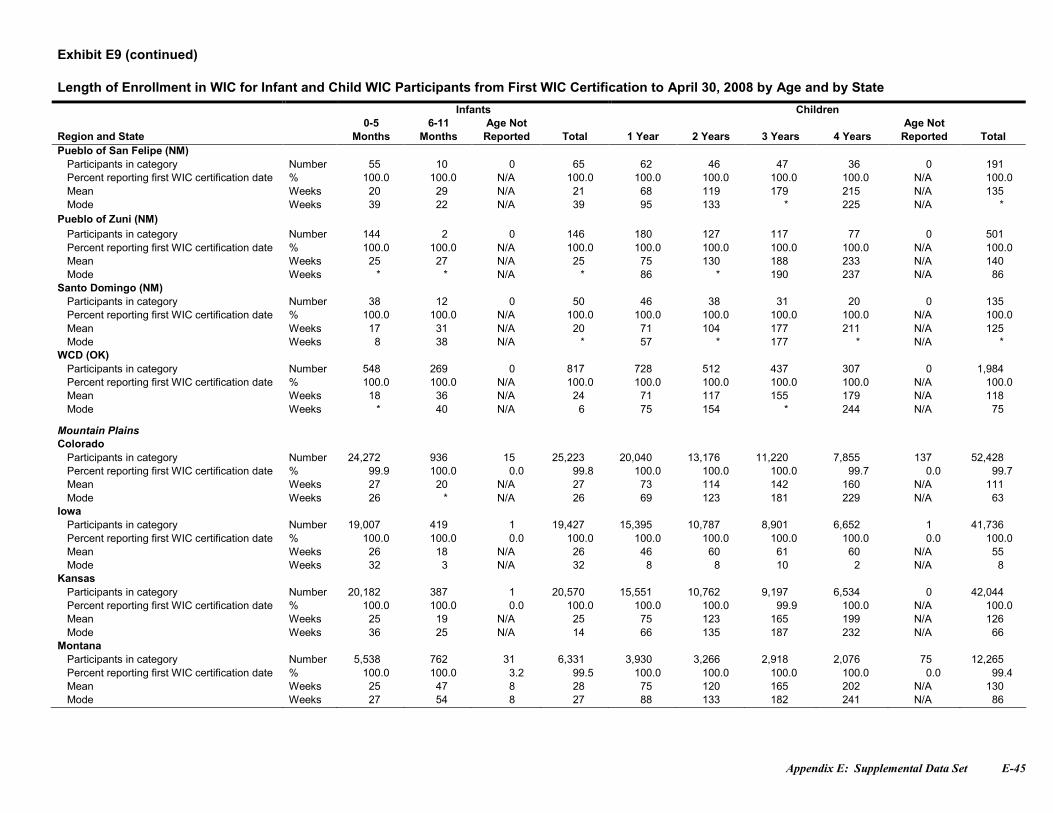
Appendix E: Supplemental Data Set E-45
Exhibit E9 (continued)
Length of Enrollment in WIC for Infant and Child WIC Participants from First WIC Certification to April 30, 2008 by Age and by State
Infants Children
Region and State0-5
Months6-11
MonthsAge Not
Reported Total 1 Year 2 Years 3 Years 4 YearsAge Not
Reported TotalPueblo of San Felipe (NM)
Participants in category Number 55 10 0 65 62 46 47 36 0 191Percent reporting first WIC certification date % 100.0 100.0 N/A 100.0 100.0 100.0 100.0 100.0 N/A 100.0Mean Weeks 20 29 N/A 21 68 119 179 215 N/A 135Mode Weeks 39 22 N/A 39 95 133 * 225 N/A *
Pueblo of Zuni (NM)Participants in category Number 144 2 0 146 180 127 117 77 0 501Percent reporting first WIC certification date % 100.0 100.0 N/A 100.0 100.0 100.0 100.0 100.0 N/A 100.0Mean Weeks 25 27 N/A 25 75 130 188 233 N/A 140Mode Weeks * * N/A * 86 * 190 237 N/A 86
Santo Domingo (NM)Participants in category Number 38 12 0 50 46 38 31 20 0 135Percent reporting first WIC certification date % 100.0 100.0 N/A 100.0 100.0 100.0 100.0 100.0 N/A 100.0Mean Weeks 17 31 N/A 20 71 104 177 211 N/A 125Mode Weeks 8 38 N/A * 57 * 177 * N/A *
WCD (OK)Participants in category Number 548 269 0 817 728 512 437 307 0 1,984Percent reporting first WIC certification date % 100.0 100.0 N/A 100.0 100.0 100.0 100.0 100.0 N/A 100.0Mean Weeks 18 36 N/A 24 71 117 155 179 N/A 118Mode Weeks * 40 N/A 6 75 154 * 244 N/A 75
Mountain PlainsColorado
Participants in category Number 24,272 936 15 25,223 20,040 13,176 11,220 7,855 137 52,428Percent reporting first WIC certification date % 99.9 100.0 0.0 99.8 100.0 100.0 100.0 99.7 0.0 99.7Mean Weeks 27 20 N/A 27 73 114 142 160 N/A 111Mode Weeks 26 * N/A 26 69 123 181 229 N/A 63
IowaParticipants in category Number 19,007 419 1 19,427 15,395 10,787 8,901 6,652 1 41,736Percent reporting first WIC certification date % 100.0 100.0 0.0 100.0 100.0 100.0 100.0 100.0 0.0 100.0Mean Weeks 26 18 N/A 26 46 60 61 60 N/A 55Mode Weeks 32 3 N/A 32 8 8 10 2 N/A 8
KansasParticipants in category Number 20,182 387 1 20,570 15,551 10,762 9,197 6,534 0 42,044Percent reporting first WIC certification date % 100.0 100.0 0.0 100.0 100.0 100.0 99.9 100.0 N/A 100.0Mean Weeks 25 19 N/A 25 75 123 165 199 N/A 126Mode Weeks 36 25 N/A 14 66 135 187 232 N/A 66
MontanaParticipants in category Number 5,538 762 31 6,331 3,930 3,266 2,918 2,076 75 12,265Percent reporting first WIC certification date % 100.0 100.0 3.2 99.5 100.0 100.0 100.0 100.0 0.0 99.4Mean Weeks 25 47 8 28 75 120 165 202 N/A 130Mode Weeks 27 54 8 27 88 133 182 241 N/A 86
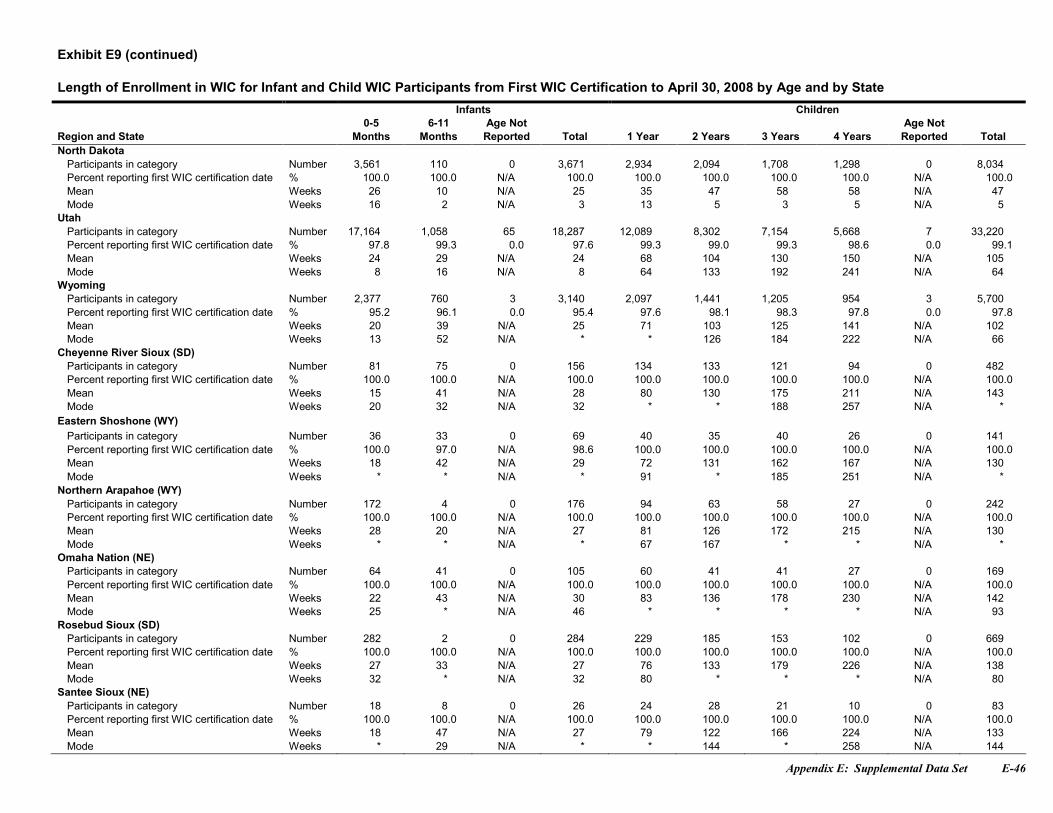
Appendix E: Supplemental Data Set E-46
Exhibit E9 (continued)
Length of Enrollment in WIC for Infant and Child WIC Participants from First WIC Certification to April 30, 2008 by Age and by State
Infants Children
Region and State0-5
Months6-11
MonthsAge Not
Reported Total 1 Year 2 Years 3 Years 4 YearsAge Not
Reported TotalNorth Dakota
Participants in category Number 3,561 110 0 3,671 2,934 2,094 1,708 1,298 0 8,034Percent reporting first WIC certification date % 100.0 100.0 N/A 100.0 100.0 100.0 100.0 100.0 N/A 100.0Mean Weeks 26 10 N/A 25 35 47 58 58 N/A 47Mode Weeks 16 2 N/A 3 13 5 3 5 N/A 5
UtahParticipants in category Number 17,164 1,058 65 18,287 12,089 8,302 7,154 5,668 7 33,220Percent reporting first WIC certification date % 97.8 99.3 0.0 97.6 99.3 99.0 99.3 98.6 0.0 99.1Mean Weeks 24 29 N/A 24 68 104 130 150 N/A 105Mode Weeks 8 16 N/A 8 64 133 192 241 N/A 64
WyomingParticipants in category Number 2,377 760 3 3,140 2,097 1,441 1,205 954 3 5,700Percent reporting first WIC certification date % 95.2 96.1 0.0 95.4 97.6 98.1 98.3 97.8 0.0 97.8Mean Weeks 20 39 N/A 25 71 103 125 141 N/A 102Mode Weeks 13 52 N/A * * 126 184 222 N/A 66
Cheyenne River Sioux (SD)Participants in category Number 81 75 0 156 134 133 121 94 0 482Percent reporting first WIC certification date % 100.0 100.0 N/A 100.0 100.0 100.0 100.0 100.0 N/A 100.0Mean Weeks 15 41 N/A 28 80 130 175 211 N/A 143Mode Weeks 20 32 N/A 32 * * 188 257 N/A *
Eastern Shoshone (WY)Participants in category Number 36 33 0 69 40 35 40 26 0 141Percent reporting first WIC certification date % 100.0 97.0 N/A 98.6 100.0 100.0 100.0 100.0 N/A 100.0Mean Weeks 18 42 N/A 29 72 131 162 167 N/A 130Mode Weeks * * N/A * 91 * 185 251 N/A *
Northern Arapahoe (WY)Participants in category Number 172 4 0 176 94 63 58 27 0 242Percent reporting first WIC certification date % 100.0 100.0 N/A 100.0 100.0 100.0 100.0 100.0 N/A 100.0Mean Weeks 28 20 N/A 27 81 126 172 215 N/A 130Mode Weeks * * N/A * 67 167 * * N/A *
Omaha Nation (NE)Participants in category Number 64 41 0 105 60 41 41 27 0 169Percent reporting first WIC certification date % 100.0 100.0 N/A 100.0 100.0 100.0 100.0 100.0 N/A 100.0Mean Weeks 22 43 N/A 30 83 136 178 230 N/A 142Mode Weeks 25 * N/A 46 * * * * N/A 93
Rosebud Sioux (SD)Participants in category Number 282 2 0 284 229 185 153 102 0 669Percent reporting first WIC certification date % 100.0 100.0 N/A 100.0 100.0 100.0 100.0 100.0 N/A 100.0Mean Weeks 27 33 N/A 27 76 133 179 226 N/A 138Mode Weeks 32 * N/A 32 80 * * * N/A 80
Santee Sioux (NE)Participants in category Number 18 8 0 26 24 28 21 10 0 83Percent reporting first WIC certification date % 100.0 100.0 N/A 100.0 100.0 100.0 100.0 100.0 N/A 100.0Mean Weeks 18 47 N/A 27 79 122 166 224 N/A 133Mode Weeks * 29 N/A * * 144 * 258 N/A 144
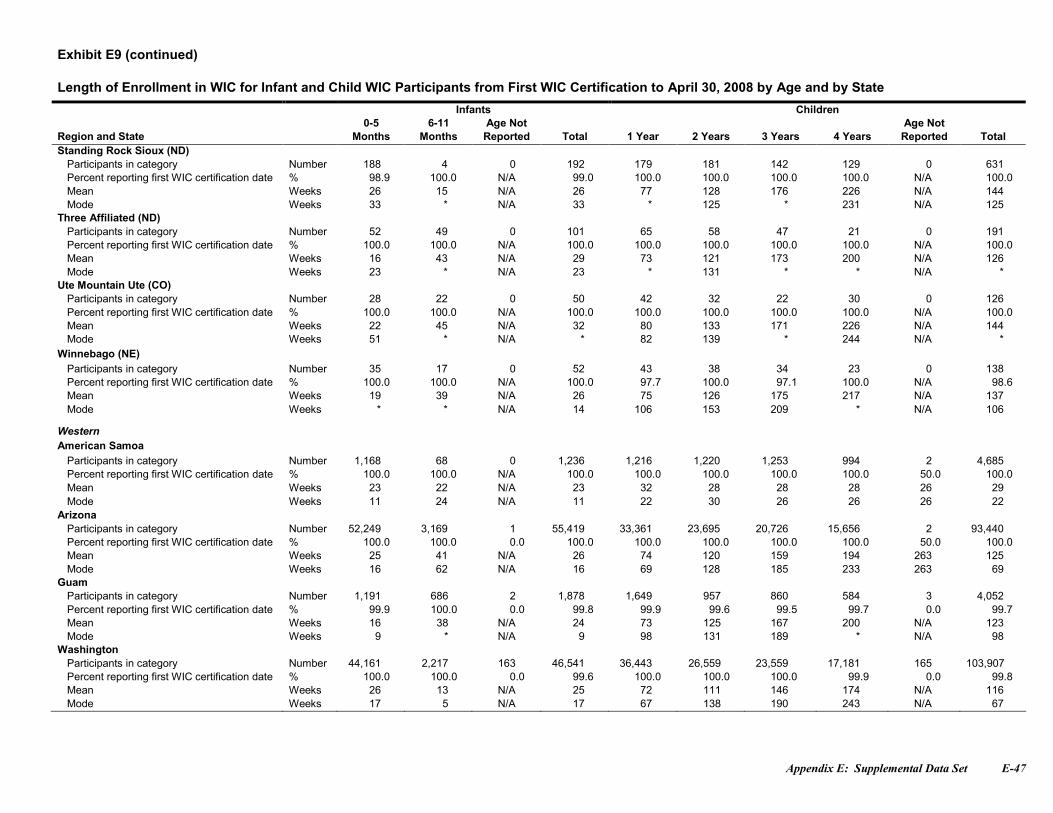
Appendix E: Supplemental Data Set E-47
Exhibit E9 (continued)
Length of Enrollment in WIC for Infant and Child WIC Participants from First WIC Certification to April 30, 2008 by Age and by State
Infants Children
Region and State0-5
Months6-11
MonthsAge Not
Reported Total 1 Year 2 Years 3 Years 4 YearsAge Not
Reported TotalStanding Rock Sioux (ND)
Participants in category Number 188 4 0 192 179 181 142 129 0 631Percent reporting first WIC certification date % 98.9 100.0 N/A 99.0 100.0 100.0 100.0 100.0 N/A 100.0Mean Weeks 26 15 N/A 26 77 128 176 226 N/A 144Mode Weeks 33 * N/A 33 * 125 * 231 N/A 125
Three Affiliated (ND)Participants in category Number 52 49 0 101 65 58 47 21 0 191Percent reporting first WIC certification date % 100.0 100.0 N/A 100.0 100.0 100.0 100.0 100.0 N/A 100.0Mean Weeks 16 43 N/A 29 73 121 173 200 N/A 126Mode Weeks 23 * N/A 23 * 131 * * N/A *
Ute Mountain Ute (CO)Participants in category Number 28 22 0 50 42 32 22 30 0 126Percent reporting first WIC certification date % 100.0 100.0 N/A 100.0 100.0 100.0 100.0 100.0 N/A 100.0Mean Weeks 22 45 N/A 32 80 133 171 226 N/A 144Mode Weeks 51 * N/A * 82 139 * 244 N/A *
Winnebago (NE)Participants in category Number 35 17 0 52 43 38 34 23 0 138Percent reporting first WIC certification date % 100.0 100.0 N/A 100.0 97.7 100.0 97.1 100.0 N/A 98.6Mean Weeks 19 39 N/A 26 75 126 175 217 N/A 137Mode Weeks * * N/A 14 106 153 209 * N/A 106
WesternAmerican Samoa
Participants in category Number 1,168 68 0 1,236 1,216 1,220 1,253 994 2 4,685Percent reporting first WIC certification date % 100.0 100.0 N/A 100.0 100.0 100.0 100.0 100.0 50.0 100.0Mean Weeks 23 22 N/A 23 32 28 28 28 26 29Mode Weeks 11 24 N/A 11 22 30 26 26 26 22
ArizonaParticipants in category Number 52,249 3,169 1 55,419 33,361 23,695 20,726 15,656 2 93,440Percent reporting first WIC certification date % 100.0 100.0 0.0 100.0 100.0 100.0 100.0 100.0 50.0 100.0Mean Weeks 25 41 N/A 26 74 120 159 194 263 125Mode Weeks 16 62 N/A 16 69 128 185 233 263 69
GuamParticipants in category Number 1,191 686 2 1,878 1,649 957 860 584 3 4,052Percent reporting first WIC certification date % 99.9 100.0 0.0 99.8 99.9 99.6 99.5 99.7 0.0 99.7Mean Weeks 16 38 N/A 24 73 125 167 200 N/A 123Mode Weeks 9 * N/A 9 98 131 189 * N/A 98
WashingtonParticipants in category Number 44,161 2,217 163 46,541 36,443 26,559 23,559 17,181 165 103,907Percent reporting first WIC certification date % 100.0 100.0 0.0 99.6 100.0 100.0 100.0 99.9 0.0 99.8Mean Weeks 26 13 N/A 25 72 111 146 174 N/A 116Mode Weeks 17 5 N/A 17 67 138 190 243 N/A 67
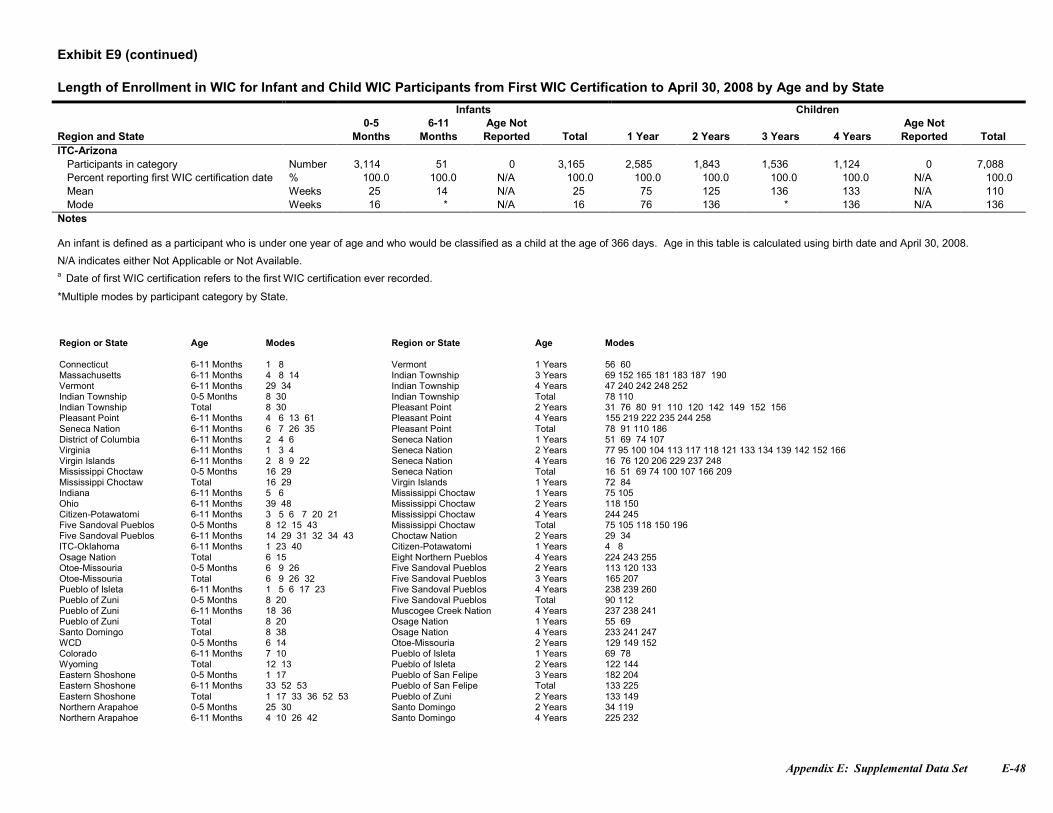
Appendix E: Supplemental Data Set E-48
Exhibit E9 (continued)
Length of Enrollment in WIC for Infant and Child WIC Participants from First WIC Certification to April 30, 2008 by Age and by State
Infants Children
Region and State0-5
Months6-11
MonthsAge Not
Reported Total 1 Year 2 Years 3 Years 4 YearsAge Not
Reported TotalITC-Arizona
Participants in category Number 3,114 51 0 3,165 2,585 1,843 1,536 1,124 0 7,088Percent reporting first WIC certification date % 100.0 100.0 N/A 100.0 100.0 100.0 100.0 100.0 N/A 100.0Mean Weeks 25 14 N/A 25 75 125 136 133 N/A 110Mode Weeks 16 * N/A 16 76 136 * 136 N/A 136
Notes
An infant is defined as a participant who is under one year of age and who would be classified as a child at the age of 366 days. Age in this table is calculated using birth date and April 30, 2008.
N/A indicates either Not Applicable or Not Available.a Date of first WIC certification refers to the first WIC certification ever recorded.
*Multiple modes by participant category by State.
Region or State Age Modes Region or State Age Modes
Connecticut 6-11 Months 1 8 Vermont 1 Years 56 60Massachusetts 6-11 Months 4 8 14 Indian Township 3 Years 69 152 165 181 183 187 190Vermont 6-11 Months 29 34 Indian Township 4 Years 47 240 242 248 252Indian Township 0-5 Months 8 30 Indian Township Total 78 110Indian Township Total 8 30 Pleasant Point 2 Years 31 76 80 91 110 120 142 149 152 156Pleasant Point 6-11 Months 4 6 13 61 Pleasant Point 4 Years 155 219 222 235 244 258Seneca Nation 6-11 Months 6 7 26 35 Pleasant Point Total 78 91 110 186District of Columbia 6-11 Months 2 4 6 Seneca Nation 1 Years 51 69 74 107Virginia 6-11 Months 1 3 4 Seneca Nation 2 Years 77 95 100 104 113 117 118 121 133 134 139 142 152 166Virgin Islands 6-11 Months 2 8 9 22 Seneca Nation 4 Years 16 76 120 206 229 237 248Mississippi Choctaw 0-5 Months 16 29 Seneca Nation Total 16 51 69 74 100 107 166 209Mississippi Choctaw Total 16 29 Virgin Islands 1 Years 72 84Indiana 6-11 Months 5 6 Mississippi Choctaw 1 Years 75 105Ohio 6-11 Months 39 48 Mississippi Choctaw 2 Years 118 150Citizen-Potawatomi 6-11 Months 3 5 6 7 20 21 Mississippi Choctaw 4 Years 244 245Five Sandoval Pueblos 0-5 Months 8 12 15 43 Mississippi Choctaw Total 75 105 118 150 196Five Sandoval Pueblos 6-11 Months 14 29 31 32 34 43 Choctaw Nation 2 Years 29 34ITC-Oklahoma 6-11 Months 1 23 40 Citizen-Potawatomi 1 Years 4 8Osage Nation Total 6 15 Eight Northern Pueblos 4 Years 224 243 255Otoe-Missouria 0-5 Months 6 9 26 Five Sandoval Pueblos 2 Years 113 120 133Otoe-Missouria Total 6 9 26 32 Five Sandoval Pueblos 3 Years 165 207Pueblo of Isleta 6-11 Months 1 5 6 17 23 Five Sandoval Pueblos 4 Years 238 239 260Pueblo of Zuni 0-5 Months 8 20 Five Sandoval Pueblos Total 90 112Pueblo of Zuni 6-11 Months 18 36 Muscogee Creek Nation 4 Years 237 238 241Pueblo of Zuni Total 8 20 Osage Nation 1 Years 55 69Santo Domingo Total 8 38 Osage Nation 4 Years 233 241 247WCD 0-5 Months 6 14 Otoe-Missouria 2 Years 129 149 152Colorado 6-11 Months 7 10 Pueblo of Isleta 1 Years 69 78Wyoming Total 12 13 Pueblo of Isleta 2 Years 122 144Eastern Shoshone 0-5 Months 1 17 Pueblo of San Felipe 3 Years 182 204Eastern Shoshone 6-11 Months 33 52 53 Pueblo of San Felipe Total 133 225Eastern Shoshone Total 1 17 33 36 52 53 Pueblo of Zuni 2 Years 133 149Northern Arapahoe 0-5 Months 25 30 Santo Domingo 2 Years 34 119Northern Arapahoe 6-11 Months 4 10 26 42 Santo Domingo 4 Years 225 232
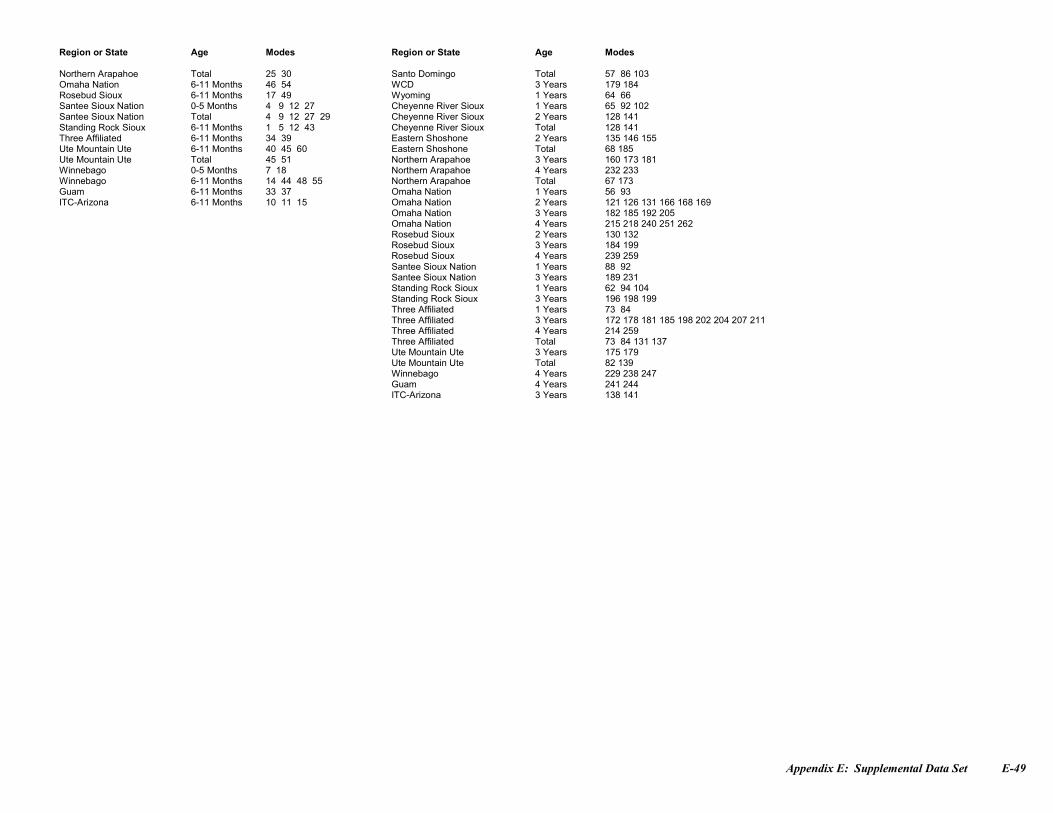
Appendix E: Supplemental Data Set E-49
Region or State Age Modes Region or State Age Modes
Northern Arapahoe Total 25 30 Santo Domingo Total 57 86 103Omaha Nation 6-11 Months 46 54 WCD 3 Years 179 184Rosebud Sioux 6-11 Months 17 49 Wyoming 1 Years 64 66Santee Sioux Nation 0-5 Months 4 9 12 27 Cheyenne River Sioux 1 Years 65 92 102Santee Sioux Nation Total 4 9 12 27 29 Cheyenne River Sioux 2 Years 128 141Standing Rock Sioux 6-11 Months 1 5 12 43 Cheyenne River Sioux Total 128 141Three Affiliated 6-11 Months 34 39 Eastern Shoshone 2 Years 135 146 155Ute Mountain Ute 6-11 Months 40 45 60 Eastern Shoshone Total 68 185Ute Mountain Ute Total 45 51 Northern Arapahoe 3 Years 160 173 181Winnebago 0-5 Months 7 18 Northern Arapahoe 4 Years 232 233Winnebago 6-11 Months 14 44 48 55 Northern Arapahoe Total 67 173Guam 6-11 Months 33 37 Omaha Nation 1 Years 56 93ITC-Arizona 6-11 Months 10 11 15 Omaha Nation 2 Years 121 126 131 166 168 169
Omaha Nation 3 Years 182 185 192 205Omaha Nation 4 Years 215 218 240 251 262Rosebud Sioux 2 Years 130 132Rosebud Sioux 3 Years 184 199Rosebud Sioux 4 Years 239 259Santee Sioux Nation 1 Years 88 92Santee Sioux Nation 3 Years 189 231Standing Rock Sioux 1 Years 62 94 104Standing Rock Sioux 3 Years 196 198 199Three Affiliated 1 Years 73 84Three Affiliated 3 Years 172 178 181 185 198 202 204 207 211Three Affiliated 4 Years 214 259Three Affiliated Total 73 84 131 137Ute Mountain Ute 3 Years 175 179Ute Mountain Ute Total 82 139Winnebago 4 Years 229 238 247Guam 4 Years 241 244ITC-Arizona 3 Years 138 141
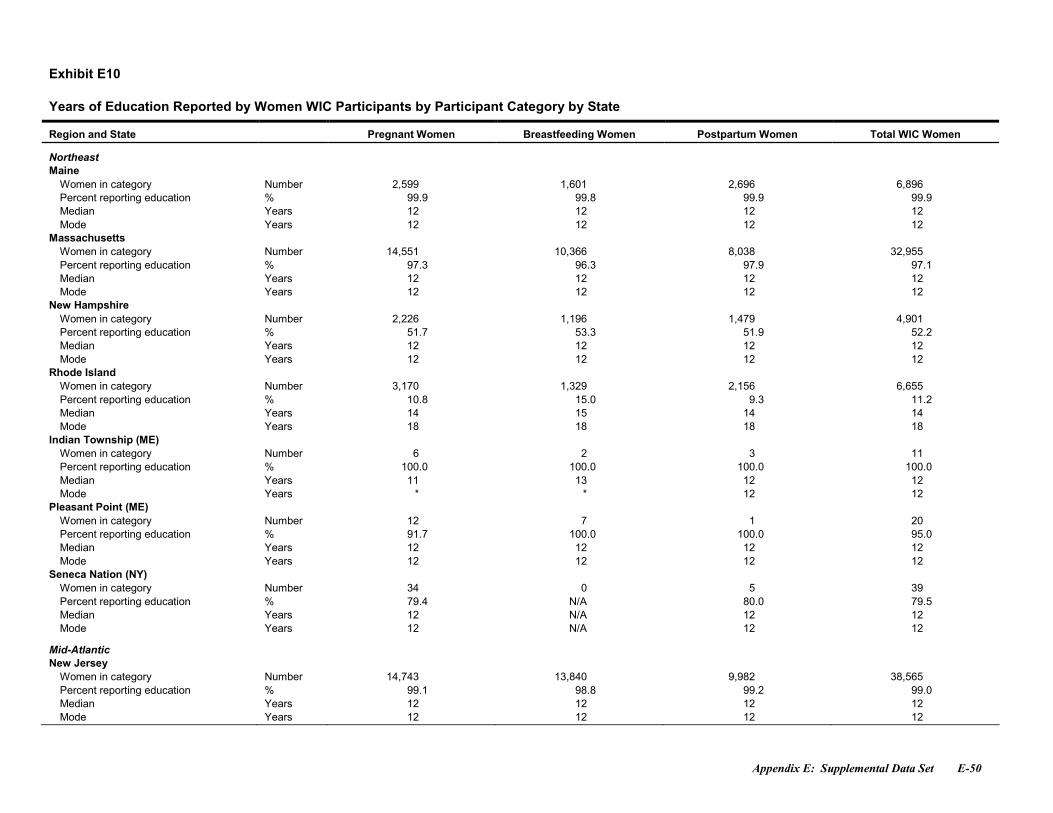
Appendix E: Supplemental Data Set E-50
Exhibit E10
Years of Education Reported by Women WIC Participants by Participant Category by State
Region and State Pregnant Women Breastfeeding Women Postpartum Women Total WIC Women
NortheastMaine
Women in category Number 2,599 1,601 2,696 6,896Percent reporting education % 99.9 99.8 99.9 99.9Median Years 12 12 12 12Mode Years 12 12 12 12
MassachusettsWomen in category Number 14,551 10,366 8,038 32,955Percent reporting education % 97.3 96.3 97.9 97.1Median Years 12 12 12 12Mode Years 12 12 12 12
New HampshireWomen in category Number 2,226 1,196 1,479 4,901Percent reporting education % 51.7 53.3 51.9 52.2Median Years 12 12 12 12Mode Years 12 12 12 12
Rhode IslandWomen in category Number 3,170 1,329 2,156 6,655Percent reporting education % 10.8 15.0 9.3 11.2Median Years 14 15 14 14Mode Years 18 18 18 18
Indian Township (ME)Women in category Number 6 2 3 11Percent reporting education % 100.0 100.0 100.0 100.0Median Years 11 13 12 12Mode Years * * 12 12
Pleasant Point (ME)Women in category Number 12 7 1 20Percent reporting education % 91.7 100.0 100.0 95.0Median Years 12 12 12 12Mode Years 12 12 12 12
Seneca Nation (NY)Women in category Number 34 0 5 39Percent reporting education % 79.4 N/A 80.0 79.5Median Years 12 N/A 12 12Mode Years 12 N/A 12 12
Mid-AtlanticNew Jersey
Women in category Number 14,743 13,840 9,982 38,565Percent reporting education % 99.1 98.8 99.2 99.0Median Years 12 12 12 12Mode Years 12 12 12 12
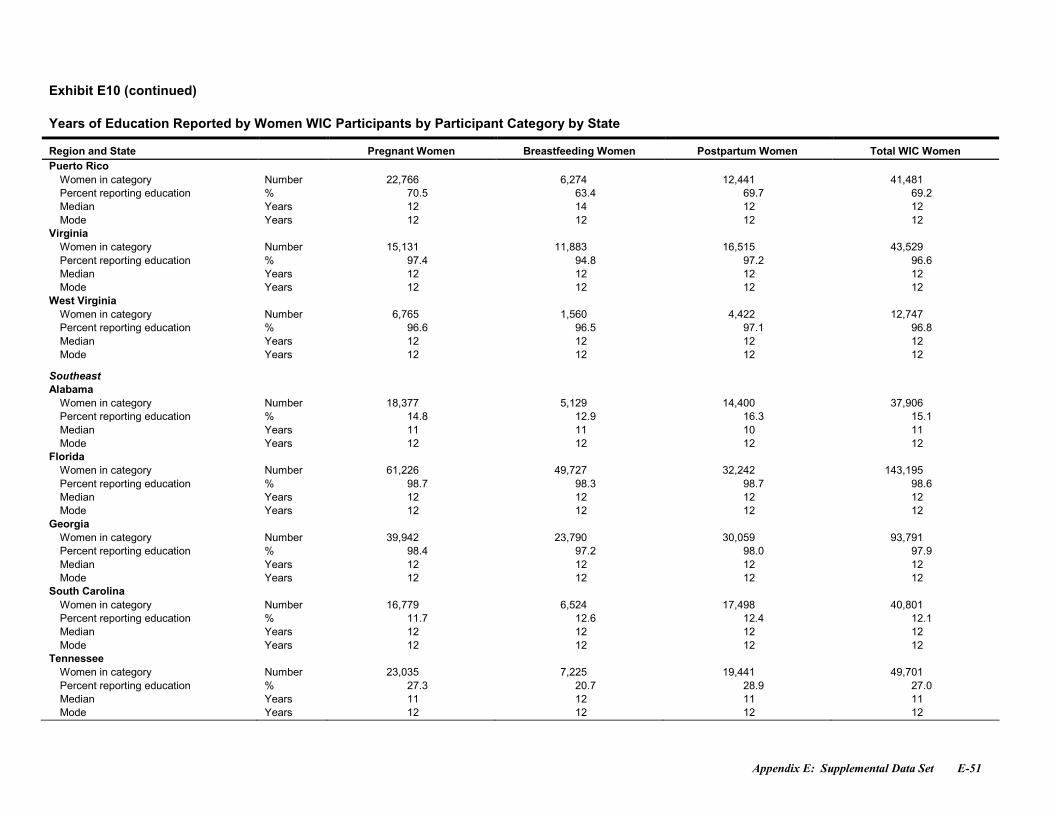
Appendix E: Supplemental Data Set E-51
Exhibit E10 (continued)
Years of Education Reported by Women WIC Participants by Participant Category by State
Region and State Pregnant Women Breastfeeding Women Postpartum Women Total WIC WomenPuerto Rico
Women in category Number 22,766 6,274 12,441 41,481Percent reporting education % 70.5 63.4 69.7 69.2Median Years 12 14 12 12Mode Years 12 12 12 12
VirginiaWomen in category Number 15,131 11,883 16,515 43,529Percent reporting education % 97.4 94.8 97.2 96.6Median Years 12 12 12 12Mode Years 12 12 12 12
West VirginiaWomen in category Number 6,765 1,560 4,422 12,747Percent reporting education % 96.6 96.5 97.1 96.8Median Years 12 12 12 12Mode Years 12 12 12 12
SoutheastAlabama
Women in category Number 18,377 5,129 14,400 37,906Percent reporting education % 14.8 12.9 16.3 15.1Median Years 11 11 10 11Mode Years 12 12 12 12
FloridaWomen in category Number 61,226 49,727 32,242 143,195Percent reporting education % 98.7 98.3 98.7 98.6Median Years 12 12 12 12Mode Years 12 12 12 12
GeorgiaWomen in category Number 39,942 23,790 30,059 93,791Percent reporting education % 98.4 97.2 98.0 97.9Median Years 12 12 12 12Mode Years 12 12 12 12
South CarolinaWomen in category Number 16,779 6,524 17,498 40,801Percent reporting education % 11.7 12.6 12.4 12.1Median Years 12 12 12 12Mode Years 12 12 12 12
TennesseeWomen in category Number 23,035 7,225 19,441 49,701Percent reporting education % 27.3 20.7 28.9 27.0Median Years 11 12 11 11Mode Years 12 12 12 12
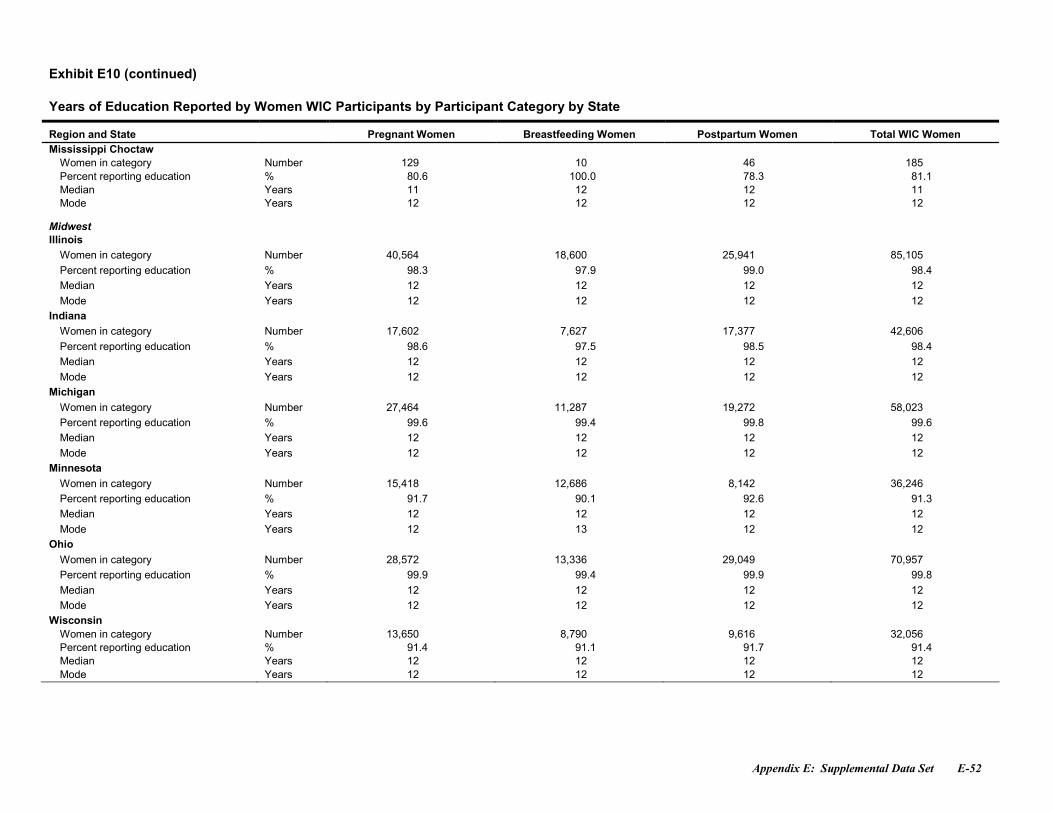
Appendix E: Supplemental Data Set E-52
Exhibit E10 (continued)
Years of Education Reported by Women WIC Participants by Participant Category by State
Region and State Pregnant Women Breastfeeding Women Postpartum Women Total WIC WomenMississippi Choctaw
Women in category Number 129 10 46 185Percent reporting education % 80.6 100.0 78.3 81.1Median Years 11 12 12 11Mode Years 12 12 12 12
MidwestIllinois
Women in category Number 40,564 18,600 25,941 85,105Percent reporting education % 98.3 97.9 99.0 98.4Median Years 12 12 12 12Mode Years 12 12 12 12
IndianaWomen in category Number 17,602 7,627 17,377 42,606Percent reporting education % 98.6 97.5 98.5 98.4Median Years 12 12 12 12Mode Years 12 12 12 12
MichiganWomen in category Number 27,464 11,287 19,272 58,023Percent reporting education % 99.6 99.4 99.8 99.6Median Years 12 12 12 12Mode Years 12 12 12 12
MinnesotaWomen in category Number 15,418 12,686 8,142 36,246Percent reporting education % 91.7 90.1 92.6 91.3Median Years 12 12 12 12Mode Years 12 13 12 12
OhioWomen in category Number 28,572 13,336 29,049 70,957Percent reporting education % 99.9 99.4 99.9 99.8Median Years 12 12 12 12Mode Years 12 12 12 12
WisconsinWomen in category Number 13,650 8,790 9,616 32,056Percent reporting education % 91.4 91.1 91.7 91.4Median Years 12 12 12 12Mode Years 12 12 12 12
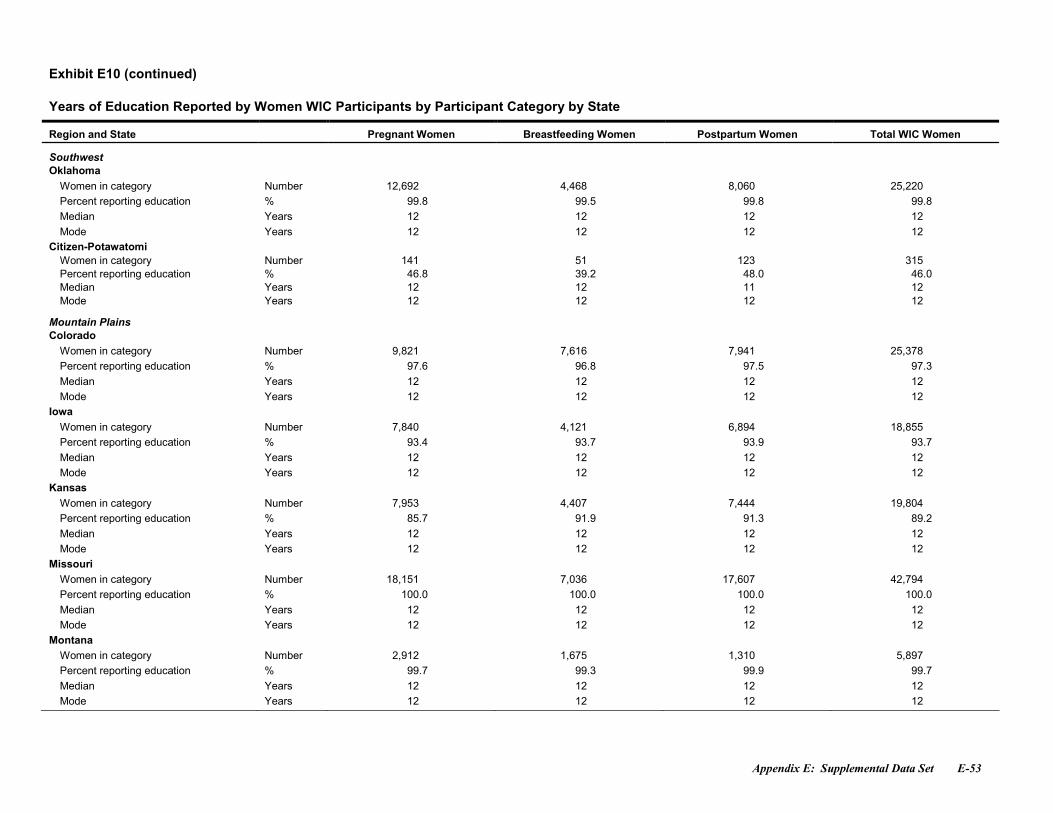
Appendix E: Supplemental Data Set E-53
Exhibit E10 (continued)
Years of Education Reported by Women WIC Participants by Participant Category by State
Region and State Pregnant Women Breastfeeding Women Postpartum Women Total WIC Women
SouthwestOklahoma
Women in category Number 12,692 4,468 8,060 25,220Percent reporting education % 99.8 99.5 99.8 99.8Median Years 12 12 12 12Mode Years 12 12 12 12
Citizen-PotawatomiWomen in category Number 141 51 123 315Percent reporting education % 46.8 39.2 48.0 46.0Median Years 12 12 11 12Mode Years 12 12 12 12
Mountain PlainsColorado
Women in category Number 9,821 7,616 7,941 25,378Percent reporting education % 97.6 96.8 97.5 97.3Median Years 12 12 12 12Mode Years 12 12 12 12
IowaWomen in category Number 7,840 4,121 6,894 18,855Percent reporting education % 93.4 93.7 93.9 93.7Median Years 12 12 12 12Mode Years 12 12 12 12
KansasWomen in category Number 7,953 4,407 7,444 19,804Percent reporting education % 85.7 91.9 91.3 89.2Median Years 12 12 12 12Mode Years 12 12 12 12
MissouriWomen in category Number 18,151 7,036 17,607 42,794Percent reporting education % 100.0 100.0 100.0 100.0Median Years 12 12 12 12Mode Years 12 12 12 12
MontanaWomen in category Number 2,912 1,675 1,310 5,897Percent reporting education % 99.7 99.3 99.9 99.7Median Years 12 12 12 12Mode Years 12 12 12 12
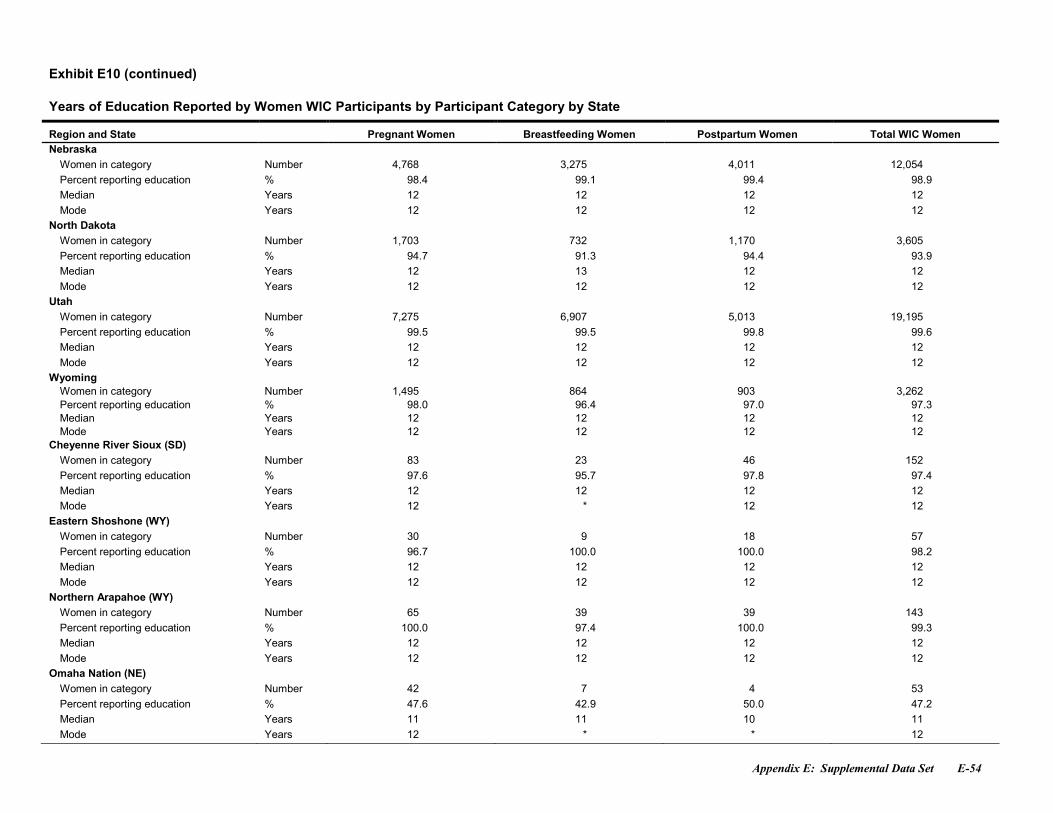
Appendix E: Supplemental Data Set E-54
Exhibit E10 (continued)
Years of Education Reported by Women WIC Participants by Participant Category by State
Region and State Pregnant Women Breastfeeding Women Postpartum Women Total WIC WomenNebraska
Women in category Number 4,768 3,275 4,011 12,054Percent reporting education % 98.4 99.1 99.4 98.9Median Years 12 12 12 12Mode Years 12 12 12 12
North DakotaWomen in category Number 1,703 732 1,170 3,605Percent reporting education % 94.7 91.3 94.4 93.9Median Years 12 13 12 12Mode Years 12 12 12 12
UtahWomen in category Number 7,275 6,907 5,013 19,195Percent reporting education % 99.5 99.5 99.8 99.6Median Years 12 12 12 12Mode Years 12 12 12 12
WyomingWomen in category Number 1,495 864 903 3,262Percent reporting education % 98.0 96.4 97.0 97.3Median Years 12 12 12 12Mode Years 12 12 12 12
Cheyenne River Sioux (SD)Women in category Number 83 23 46 152Percent reporting education % 97.6 95.7 97.8 97.4Median Years 12 12 12 12Mode Years 12 * 12 12
Eastern Shoshone (WY)Women in category Number 30 9 18 57Percent reporting education % 96.7 100.0 100.0 98.2Median Years 12 12 12 12Mode Years 12 12 12 12
Northern Arapahoe (WY)Women in category Number 65 39 39 143Percent reporting education % 100.0 97.4 100.0 99.3Median Years 12 12 12 12Mode Years 12 12 12 12
Omaha Nation (NE)Women in category Number 42 7 4 53Percent reporting education % 47.6 42.9 50.0 47.2Median Years 11 11 10 11Mode Years 12 * * 12
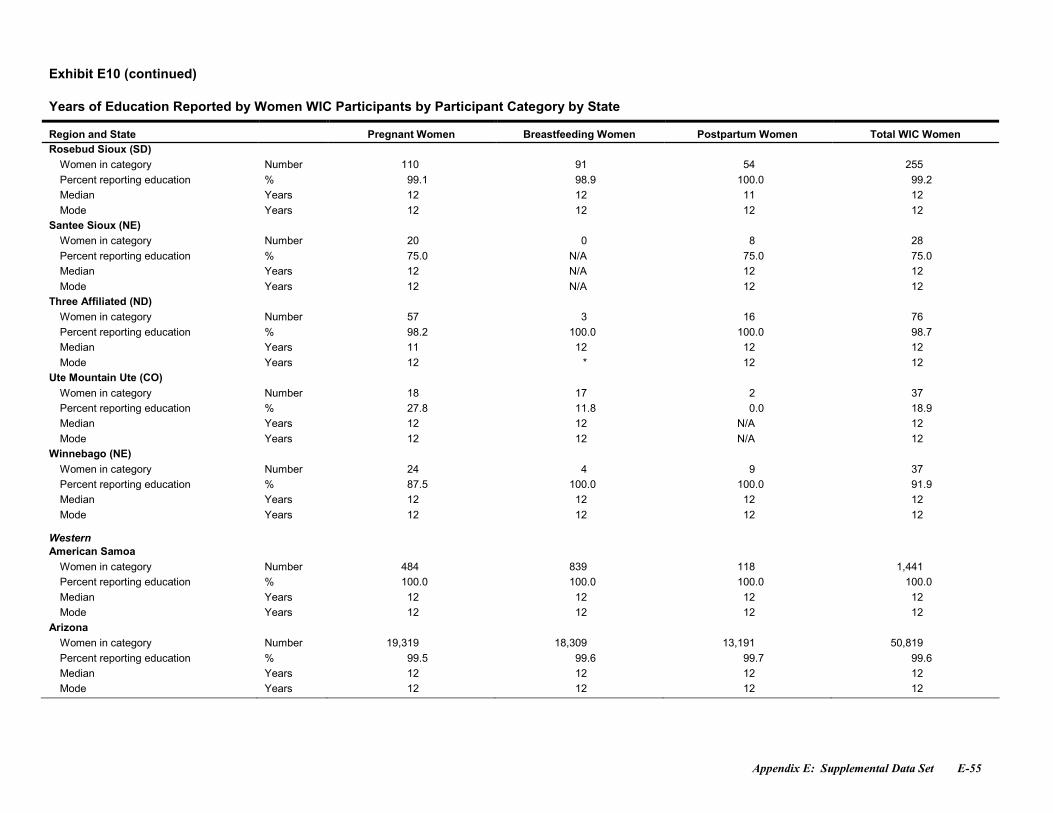
Appendix E: Supplemental Data Set E-55
Exhibit E10 (continued)
Years of Education Reported by Women WIC Participants by Participant Category by State
Region and State Pregnant Women Breastfeeding Women Postpartum Women Total WIC WomenRosebud Sioux (SD)
Women in category Number 110 91 54 255Percent reporting education % 99.1 98.9 100.0 99.2Median Years 12 12 11 12Mode Years 12 12 12 12
Santee Sioux (NE)Women in category Number 20 0 8 28Percent reporting education % 75.0 N/A 75.0 75.0Median Years 12 N/A 12 12Mode Years 12 N/A 12 12
Three Affiliated (ND)Women in category Number 57 3 16 76Percent reporting education % 98.2 100.0 100.0 98.7Median Years 11 12 12 12Mode Years 12 * 12 12
Ute Mountain Ute (CO)Women in category Number 18 17 2 37Percent reporting education % 27.8 11.8 0.0 18.9Median Years 12 12 N/A 12Mode Years 12 12 N/A 12
Winnebago (NE)Women in category Number 24 4 9 37Percent reporting education % 87.5 100.0 100.0 91.9Median Years 12 12 12 12Mode Years 12 12 12 12
WesternAmerican Samoa
Women in category Number 484 839 118 1,441Percent reporting education % 100.0 100.0 100.0 100.0Median Years 12 12 12 12Mode Years 12 12 12 12
ArizonaWomen in category Number 19,319 18,309 13,191 50,819Percent reporting education % 99.5 99.6 99.7 99.6Median Years 12 12 12 12Mode Years 12 12 12 12
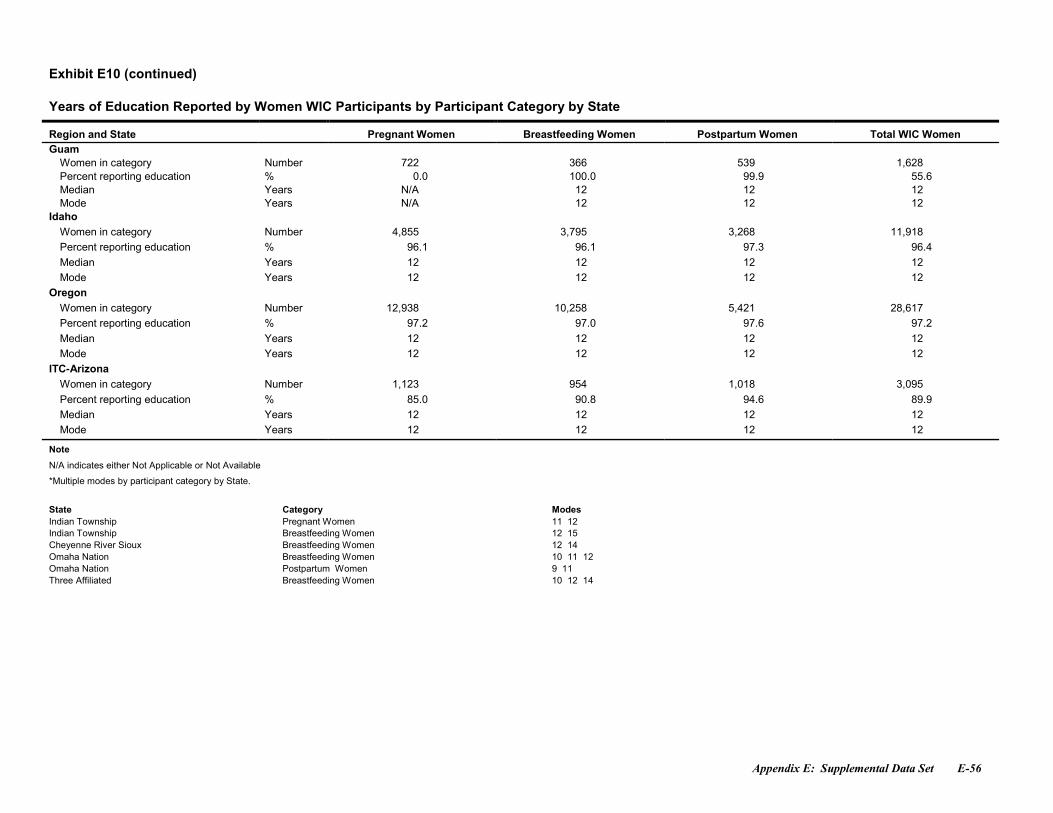
Appendix E: Supplemental Data Set E-56
Exhibit E10 (continued)
Years of Education Reported by Women WIC Participants by Participant Category by State
Region and State Pregnant Women Breastfeeding Women Postpartum Women Total WIC WomenGuam
Women in category Number 722 366 539 1,628Percent reporting education % 0.0 100.0 99.9 55.6Median Years N/A 12 12 12Mode Years N/A 12 12 12
IdahoWomen in category Number 4,855 3,795 3,268 11,918Percent reporting education % 96.1 96.1 97.3 96.4Median Years 12 12 12 12Mode Years 12 12 12 12
OregonWomen in category Number 12,938 10,258 5,421 28,617Percent reporting education % 97.2 97.0 97.6 97.2Median Years 12 12 12 12Mode Years 12 12 12 12
ITC-ArizonaWomen in category Number 1,123 954 1,018 3,095Percent reporting education % 85.0 90.8 94.6 89.9Median Years 12 12 12 12Mode Years 12 12 12 12
Note
N/A indicates either Not Applicable or Not Available
*Multiple modes by participant category by State.
State Category ModesIndian Township Pregnant Women 11 12Indian Township Breastfeeding Women 12 15Cheyenne River Sioux Breastfeeding Women 12 14Omaha Nation Breastfeeding Women 10 11 12Omaha Nation Postpartum Women 9 11Three Affiliated Breastfeeding Women 10 12 14
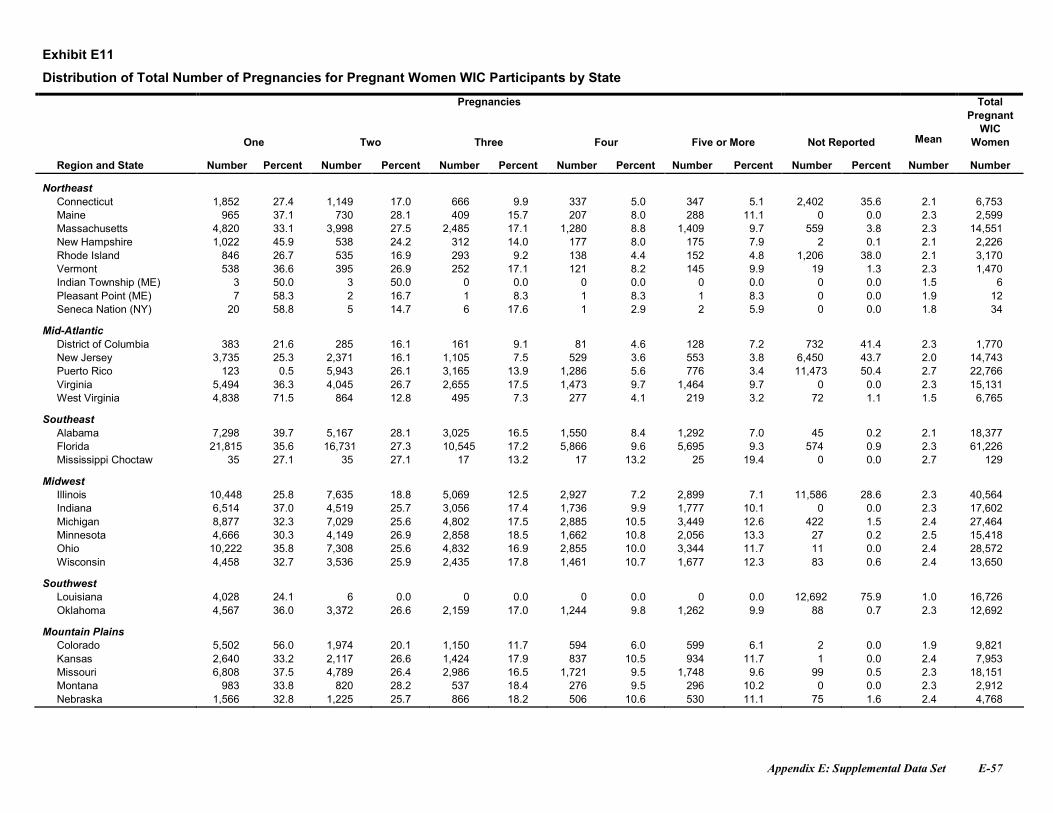
Appendix E: Supplemental Data Set E-57
Exhibit E11
Distribution of Total Number of Pregnancies for Pregnant Women WIC Participants by State
Pregnancies
One Two Three Four Five or More Not Reported Mean
TotalPregnant
WICWomen
Region and State Number Percent Number Percent Number Percent Number Percent Number Percent Number Percent Number Number
NortheastConnecticut 1,852 27.4 1,149 17.0 666 9.9 337 5.0 347 5.1 2,402 35.6 2.1 6,753Maine 965 37.1 730 28.1 409 15.7 207 8.0 288 11.1 0 0.0 2.3 2,599Massachusetts 4,820 33.1 3,998 27.5 2,485 17.1 1,280 8.8 1,409 9.7 559 3.8 2.3 14,551New Hampshire 1,022 45.9 538 24.2 312 14.0 177 8.0 175 7.9 2 0.1 2.1 2,226Rhode Island 846 26.7 535 16.9 293 9.2 138 4.4 152 4.8 1,206 38.0 2.1 3,170Vermont 538 36.6 395 26.9 252 17.1 121 8.2 145 9.9 19 1.3 2.3 1,470Indian Township (ME) 3 50.0 3 50.0 0 0.0 0 0.0 0 0.0 0 0.0 1.5 6Pleasant Point (ME) 7 58.3 2 16.7 1 8.3 1 8.3 1 8.3 0 0.0 1.9 12Seneca Nation (NY) 20 58.8 5 14.7 6 17.6 1 2.9 2 5.9 0 0.0 1.8 34
Mid-AtlanticDistrict of Columbia 383 21.6 285 16.1 161 9.1 81 4.6 128 7.2 732 41.4 2.3 1,770New Jersey 3,735 25.3 2,371 16.1 1,105 7.5 529 3.6 553 3.8 6,450 43.7 2.0 14,743Puerto Rico 123 0.5 5,943 26.1 3,165 13.9 1,286 5.6 776 3.4 11,473 50.4 2.7 22,766Virginia 5,494 36.3 4,045 26.7 2,655 17.5 1,473 9.7 1,464 9.7 0 0.0 2.3 15,131West Virginia 4,838 71.5 864 12.8 495 7.3 277 4.1 219 3.2 72 1.1 1.5 6,765
SoutheastAlabama 7,298 39.7 5,167 28.1 3,025 16.5 1,550 8.4 1,292 7.0 45 0.2 2.1 18,377Florida 21,815 35.6 16,731 27.3 10,545 17.2 5,866 9.6 5,695 9.3 574 0.9 2.3 61,226Mississippi Choctaw 35 27.1 35 27.1 17 13.2 17 13.2 25 19.4 0 0.0 2.7 129
MidwestIllinois 10,448 25.8 7,635 18.8 5,069 12.5 2,927 7.2 2,899 7.1 11,586 28.6 2.3 40,564Indiana 6,514 37.0 4,519 25.7 3,056 17.4 1,736 9.9 1,777 10.1 0 0.0 2.3 17,602Michigan 8,877 32.3 7,029 25.6 4,802 17.5 2,885 10.5 3,449 12.6 422 1.5 2.4 27,464Minnesota 4,666 30.3 4,149 26.9 2,858 18.5 1,662 10.8 2,056 13.3 27 0.2 2.5 15,418Ohio 10,222 35.8 7,308 25.6 4,832 16.9 2,855 10.0 3,344 11.7 11 0.0 2.4 28,572Wisconsin 4,458 32.7 3,536 25.9 2,435 17.8 1,461 10.7 1,677 12.3 83 0.6 2.4 13,650
SouthwestLouisiana 4,028 24.1 6 0.0 0 0.0 0 0.0 0 0.0 12,692 75.9 1.0 16,726Oklahoma 4,567 36.0 3,372 26.6 2,159 17.0 1,244 9.8 1,262 9.9 88 0.7 2.3 12,692
Mountain PlainsColorado 5,502 56.0 1,974 20.1 1,150 11.7 594 6.0 599 6.1 2 0.0 1.9 9,821Kansas 2,640 33.2 2,117 26.6 1,424 17.9 837 10.5 934 11.7 1 0.0 2.4 7,953Missouri 6,808 37.5 4,789 26.4 2,986 16.5 1,721 9.5 1,748 9.6 99 0.5 2.3 18,151Montana 983 33.8 820 28.2 537 18.4 276 9.5 296 10.2 0 0.0 2.3 2,912Nebraska 1,566 32.8 1,225 25.7 866 18.2 506 10.6 530 11.1 75 1.6 2.4 4,768
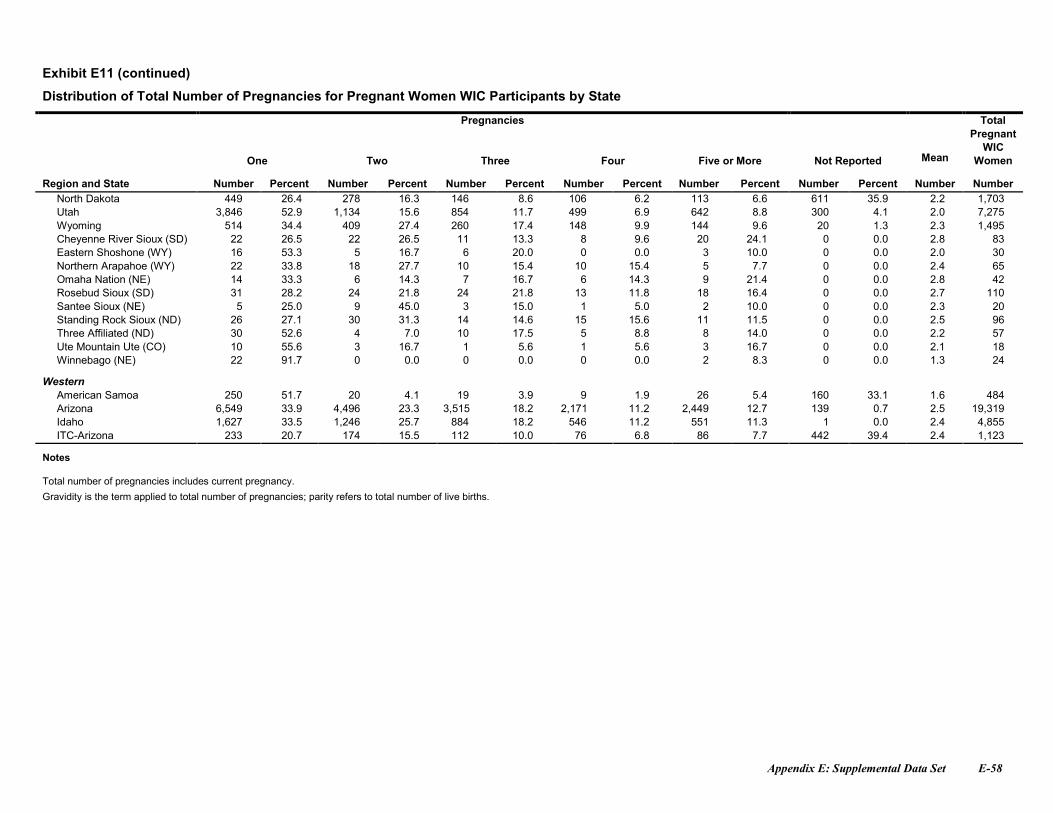
Appendix E: Supplemental Data Set E-58
Exhibit E11 (continued)
Distribution of Total Number of Pregnancies for Pregnant Women WIC Participants by State
Pregnancies
One Two Three Four Five or More Not Reported Mean
TotalPregnant
WICWomen
Region and State Number Percent Number Percent Number Percent Number Percent Number Percent Number Percent Number NumberNorth Dakota 449 26.4 278 16.3 146 8.6 106 6.2 113 6.6 611 35.9 2.2 1,703Utah 3,846 52.9 1,134 15.6 854 11.7 499 6.9 642 8.8 300 4.1 2.0 7,275Wyoming 514 34.4 409 27.4 260 17.4 148 9.9 144 9.6 20 1.3 2.3 1,495Cheyenne River Sioux (SD) 22 26.5 22 26.5 11 13.3 8 9.6 20 24.1 0 0.0 2.8 83Eastern Shoshone (WY) 16 53.3 5 16.7 6 20.0 0 0.0 3 10.0 0 0.0 2.0 30Northern Arapahoe (WY) 22 33.8 18 27.7 10 15.4 10 15.4 5 7.7 0 0.0 2.4 65Omaha Nation (NE) 14 33.3 6 14.3 7 16.7 6 14.3 9 21.4 0 0.0 2.8 42Rosebud Sioux (SD) 31 28.2 24 21.8 24 21.8 13 11.8 18 16.4 0 0.0 2.7 110Santee Sioux (NE) 5 25.0 9 45.0 3 15.0 1 5.0 2 10.0 0 0.0 2.3 20Standing Rock Sioux (ND) 26 27.1 30 31.3 14 14.6 15 15.6 11 11.5 0 0.0 2.5 96Three Affiliated (ND) 30 52.6 4 7.0 10 17.5 5 8.8 8 14.0 0 0.0 2.2 57Ute Mountain Ute (CO) 10 55.6 3 16.7 1 5.6 1 5.6 3 16.7 0 0.0 2.1 18Winnebago (NE) 22 91.7 0 0.0 0 0.0 0 0.0 2 8.3 0 0.0 1.3 24
WesternAmerican Samoa 250 51.7 20 4.1 19 3.9 9 1.9 26 5.4 160 33.1 1.6 484Arizona 6,549 33.9 4,496 23.3 3,515 18.2 2,171 11.2 2,449 12.7 139 0.7 2.5 19,319Idaho 1,627 33.5 1,246 25.7 884 18.2 546 11.2 551 11.3 1 0.0 2.4 4,855ITC-Arizona 233 20.7 174 15.5 112 10.0 76 6.8 86 7.7 442 39.4 2.4 1,123
Notes
Total number of pregnancies includes current pregnancy.
Gravidity is the term applied to total number of pregnancies; parity refers to total number of live births.
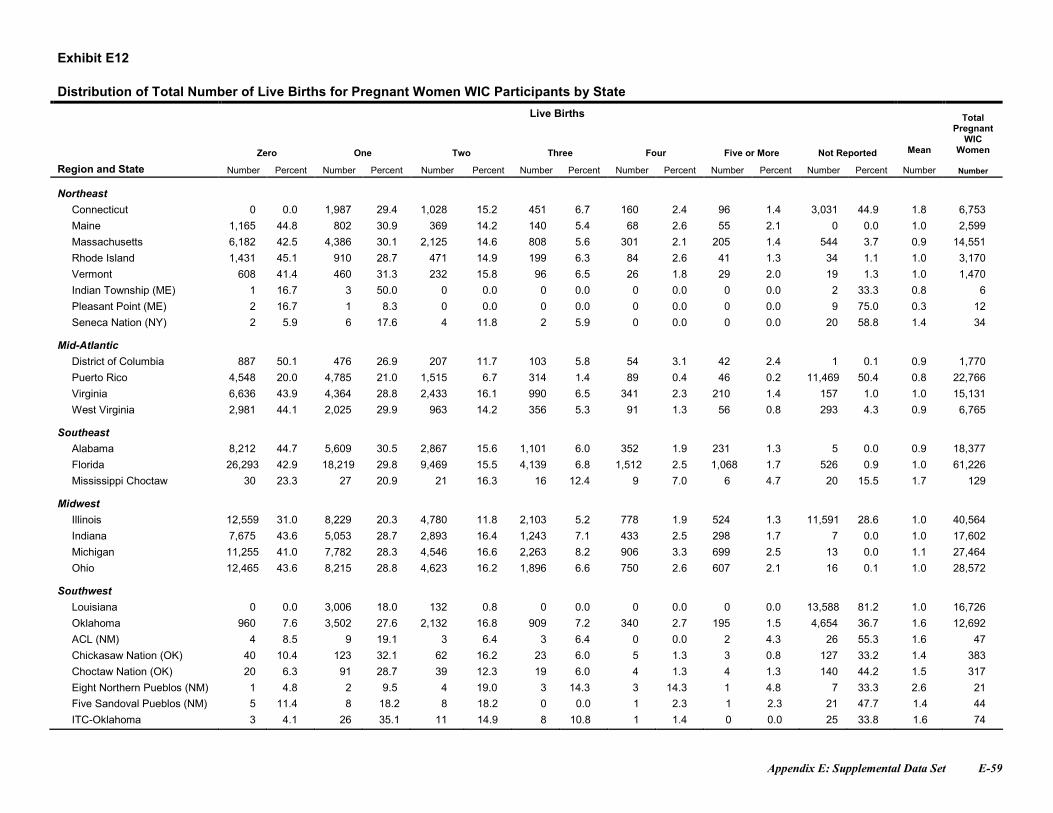
Appendix E: Supplemental Data Set E-59
Exhibit E12
Distribution of Total Number of Live Births for Pregnant Women WIC Participants by State
Live Births
Zero One Two Three Four Five or More Not Reported Mean
TotalPregnant
WICWomen
Region and State Number Percent Number Percent Number Percent Number Percent Number Percent Number Percent Number Percent Number Number
NortheastConnecticut 0 0.0 1,987 29.4 1,028 15.2 451 6.7 160 2.4 96 1.4 3,031 44.9 1.8 6,753Maine 1,165 44.8 802 30.9 369 14.2 140 5.4 68 2.6 55 2.1 0 0.0 1.0 2,599Massachusetts 6,182 42.5 4,386 30.1 2,125 14.6 808 5.6 301 2.1 205 1.4 544 3.7 0.9 14,551Rhode Island 1,431 45.1 910 28.7 471 14.9 199 6.3 84 2.6 41 1.3 34 1.1 1.0 3,170Vermont 608 41.4 460 31.3 232 15.8 96 6.5 26 1.8 29 2.0 19 1.3 1.0 1,470Indian Township (ME) 1 16.7 3 50.0 0 0.0 0 0.0 0 0.0 0 0.0 2 33.3 0.8 6Pleasant Point (ME) 2 16.7 1 8.3 0 0.0 0 0.0 0 0.0 0 0.0 9 75.0 0.3 12Seneca Nation (NY) 2 5.9 6 17.6 4 11.8 2 5.9 0 0.0 0 0.0 20 58.8 1.4 34
Mid-AtlanticDistrict of Columbia 887 50.1 476 26.9 207 11.7 103 5.8 54 3.1 42 2.4 1 0.1 0.9 1,770Puerto Rico 4,548 20.0 4,785 21.0 1,515 6.7 314 1.4 89 0.4 46 0.2 11,469 50.4 0.8 22,766Virginia 6,636 43.9 4,364 28.8 2,433 16.1 990 6.5 341 2.3 210 1.4 157 1.0 1.0 15,131West Virginia 2,981 44.1 2,025 29.9 963 14.2 356 5.3 91 1.3 56 0.8 293 4.3 0.9 6,765
SoutheastAlabama 8,212 44.7 5,609 30.5 2,867 15.6 1,101 6.0 352 1.9 231 1.3 5 0.0 0.9 18,377Florida 26,293 42.9 18,219 29.8 9,469 15.5 4,139 6.8 1,512 2.5 1,068 1.7 526 0.9 1.0 61,226Mississippi Choctaw 30 23.3 27 20.9 21 16.3 16 12.4 9 7.0 6 4.7 20 15.5 1.7 129
MidwestIllinois 12,559 31.0 8,229 20.3 4,780 11.8 2,103 5.2 778 1.9 524 1.3 11,591 28.6 1.0 40,564Indiana 7,675 43.6 5,053 28.7 2,893 16.4 1,243 7.1 433 2.5 298 1.7 7 0.0 1.0 17,602Michigan 11,255 41.0 7,782 28.3 4,546 16.6 2,263 8.2 906 3.3 699 2.5 13 0.0 1.1 27,464Ohio 12,465 43.6 8,215 28.8 4,623 16.2 1,896 6.6 750 2.6 607 2.1 16 0.1 1.0 28,572
SouthwestLouisiana 0 0.0 3,006 18.0 132 0.8 0 0.0 0 0.0 0 0.0 13,588 81.2 1.0 16,726Oklahoma 960 7.6 3,502 27.6 2,132 16.8 909 7.2 340 2.7 195 1.5 4,654 36.7 1.6 12,692ACL (NM) 4 8.5 9 19.1 3 6.4 3 6.4 0 0.0 2 4.3 26 55.3 1.6 47Chickasaw Nation (OK) 40 10.4 123 32.1 62 16.2 23 6.0 5 1.3 3 0.8 127 33.2 1.4 383Choctaw Nation (OK) 20 6.3 91 28.7 39 12.3 19 6.0 4 1.3 4 1.3 140 44.2 1.5 317Eight Northern Pueblos (NM) 1 4.8 2 9.5 4 19.0 3 14.3 3 14.3 1 4.8 7 33.3 2.6 21Five Sandoval Pueblos (NM) 5 11.4 8 18.2 8 18.2 0 0.0 1 2.3 1 2.3 21 47.7 1.4 44ITC-Oklahoma 3 4.1 26 35.1 11 14.9 8 10.8 1 1.4 0 0.0 25 33.8 1.6 74
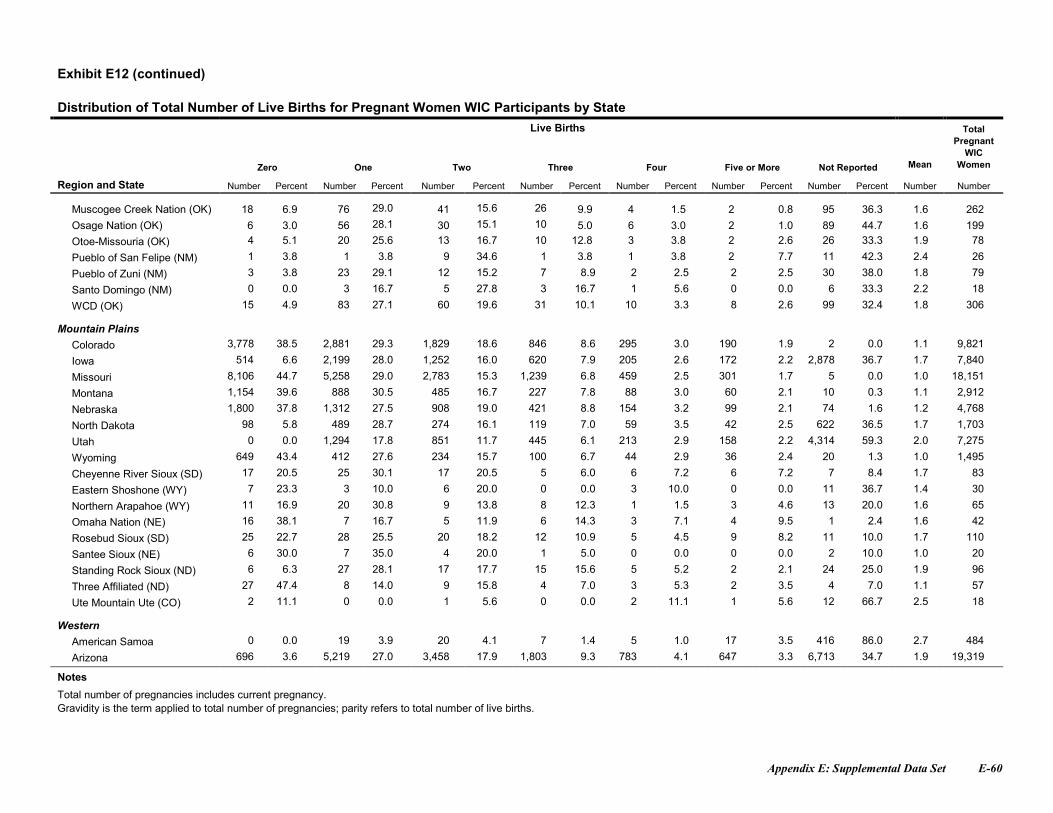
Appendix E: Supplemental Data Set E-60
Exhibit E12 (continued)
Distribution of Total Number of Live Births for Pregnant Women WIC Participants by StateLive Births
Zero One Two Three Four Five or More Not Reported Mean
TotalPregnant
WICWomen
Region and State Number Percent Number Percent Number Percent Number Percent Number Percent Number Percent Number Percent Number Number
Muscogee Creek Nation (OK) 18 6.9 76 29.0 41 15.6 26 9.9 4 1.5 2 0.8 95 36.3 1.6 262Osage Nation (OK) 6 3.0 56 28.1 30 15.1 10 5.0 6 3.0 2 1.0 89 44.7 1.6 199Otoe-Missouria (OK) 4 5.1 20 25.6 13 16.7 10 12.8 3 3.8 2 2.6 26 33.3 1.9 78
Pueblo of San Felipe (NM) 1 3.8 1 3.8 9 34.6 1 3.8 1 3.8 2 7.7 11 42.3 2.4 26
Pueblo of Zuni (NM) 3 3.8 23 29.1 12 15.2 7 8.9 2 2.5 2 2.5 30 38.0 1.8 79
Santo Domingo (NM) 0 0.0 3 16.7 5 27.8 3 16.7 1 5.6 0 0.0 6 33.3 2.2 18
WCD (OK) 15 4.9 83 27.1 60 19.6 31 10.1 10 3.3 8 2.6 99 32.4 1.8 306
Mountain PlainsColorado 3,778 38.5 2,881 29.3 1,829 18.6 846 8.6 295 3.0 190 1.9 2 0.0 1.1 9,821
Iowa 514 6.6 2,199 28.0 1,252 16.0 620 7.9 205 2.6 172 2.2 2,878 36.7 1.7 7,840
Missouri 8,106 44.7 5,258 29.0 2,783 15.3 1,239 6.8 459 2.5 301 1.7 5 0.0 1.0 18,151
Montana 1,154 39.6 888 30.5 485 16.7 227 7.8 88 3.0 60 2.1 10 0.3 1.1 2,912
Nebraska 1,800 37.8 1,312 27.5 908 19.0 421 8.8 154 3.2 99 2.1 74 1.6 1.2 4,768
North Dakota 98 5.8 489 28.7 274 16.1 119 7.0 59 3.5 42 2.5 622 36.5 1.7 1,703
Utah 0 0.0 1,294 17.8 851 11.7 445 6.1 213 2.9 158 2.2 4,314 59.3 2.0 7,275
Wyoming 649 43.4 412 27.6 234 15.7 100 6.7 44 2.9 36 2.4 20 1.3 1.0 1,495
Cheyenne River Sioux (SD) 17 20.5 25 30.1 17 20.5 5 6.0 6 7.2 6 7.2 7 8.4 1.7 83
Eastern Shoshone (WY) 7 23.3 3 10.0 6 20.0 0 0.0 3 10.0 0 0.0 11 36.7 1.4 30
Northern Arapahoe (WY) 11 16.9 20 30.8 9 13.8 8 12.3 1 1.5 3 4.6 13 20.0 1.6 65
Omaha Nation (NE) 16 38.1 7 16.7 5 11.9 6 14.3 3 7.1 4 9.5 1 2.4 1.6 42
Rosebud Sioux (SD) 25 22.7 28 25.5 20 18.2 12 10.9 5 4.5 9 8.2 11 10.0 1.7 110
Santee Sioux (NE) 6 30.0 7 35.0 4 20.0 1 5.0 0 0.0 0 0.0 2 10.0 1.0 20
Standing Rock Sioux (ND) 6 6.3 27 28.1 17 17.7 15 15.6 5 5.2 2 2.1 24 25.0 1.9 96
Three Affiliated (ND) 27 47.4 8 14.0 9 15.8 4 7.0 3 5.3 2 3.5 4 7.0 1.1 57
Ute Mountain Ute (CO) 2 11.1 0 0.0 1 5.6 0 0.0 2 11.1 1 5.6 12 66.7 2.5 18
WesternAmerican Samoa 0 0.0 19 3.9 20 4.1 7 1.4 5 1.0 17 3.5 416 86.0 2.7 484
Arizona 696 3.6 5,219 27.0 3,458 17.9 1,803 9.3 783 4.1 647 3.3 6,713 34.7 1.9 19,319
Notes
Total number of pregnancies includes current pregnancy.Gravidity is the term applied to total number of pregnancies; parity refers to total number of live births.
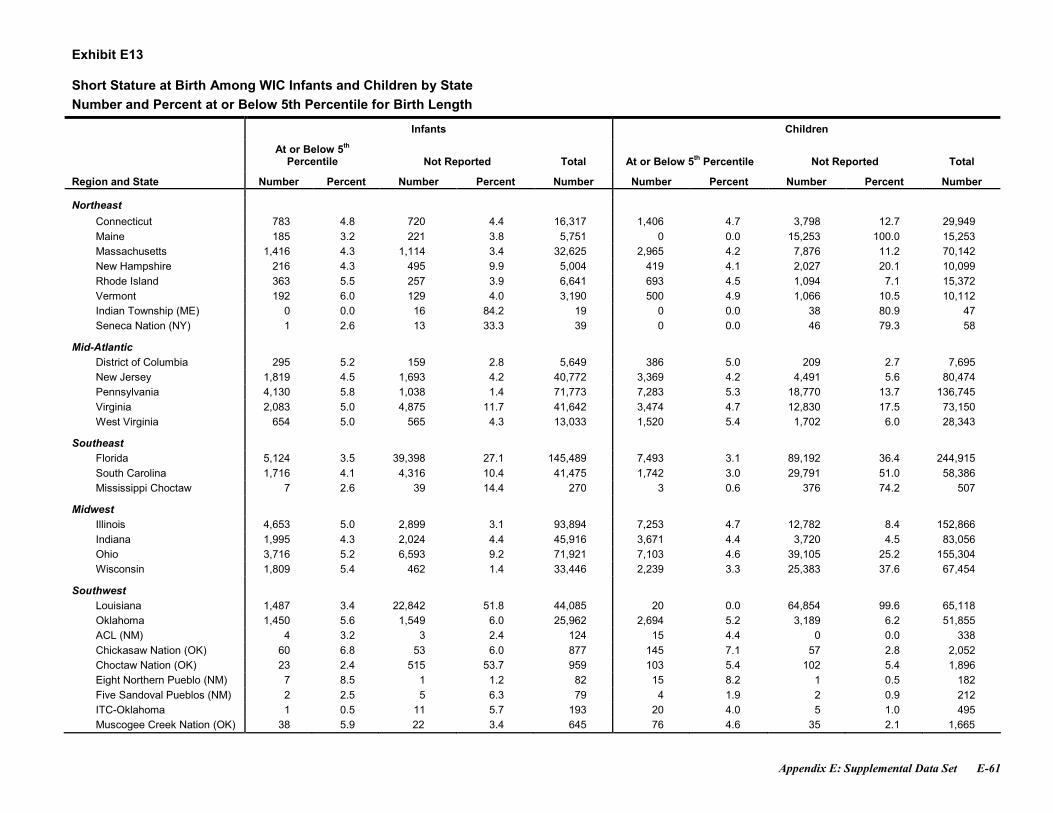
Appendix E: Supplemental Data Set E-61
Exhibit E13
Short Stature at Birth Among WIC Infants and Children by StateNumber and Percent at or Below 5th Percentile for Birth Length
Infants Children
At or Below 5th
Percentile Not Reported Total At or Below 5th Percentile Not Reported Total
Region and State Number Percent Number Percent Number Number Percent Number Percent Number
Northeast
Connecticut 783 4.8 720 4.4 16,317 1,406 4.7 3,798 12.7 29,949Maine 185 3.2 221 3.8 5,751 0 0.0 15,253 100.0 15,253Massachusetts 1,416 4.3 1,114 3.4 32,625 2,965 4.2 7,876 11.2 70,142New Hampshire 216 4.3 495 9.9 5,004 419 4.1 2,027 20.1 10,099Rhode Island 363 5.5 257 3.9 6,641 693 4.5 1,094 7.1 15,372Vermont 192 6.0 129 4.0 3,190 500 4.9 1,066 10.5 10,112Indian Township (ME) 0 0.0 16 84.2 19 0 0.0 38 80.9 47Seneca Nation (NY) 1 2.6 13 33.3 39 0 0.0 46 79.3 58
Mid-AtlanticDistrict of Columbia 295 5.2 159 2.8 5,649 386 5.0 209 2.7 7,695New Jersey 1,819 4.5 1,693 4.2 40,772 3,369 4.2 4,491 5.6 80,474Pennsylvania 4,130 5.8 1,038 1.4 71,773 7,283 5.3 18,770 13.7 136,745Virginia 2,083 5.0 4,875 11.7 41,642 3,474 4.7 12,830 17.5 73,150West Virginia 654 5.0 565 4.3 13,033 1,520 5.4 1,702 6.0 28,343
SoutheastFlorida 5,124 3.5 39,398 27.1 145,489 7,493 3.1 89,192 36.4 244,915South Carolina 1,716 4.1 4,316 10.4 41,475 1,742 3.0 29,791 51.0 58,386Mississippi Choctaw 7 2.6 39 14.4 270 3 0.6 376 74.2 507
MidwestIllinois 4,653 5.0 2,899 3.1 93,894 7,253 4.7 12,782 8.4 152,866Indiana 1,995 4.3 2,024 4.4 45,916 3,671 4.4 3,720 4.5 83,056Ohio 3,716 5.2 6,593 9.2 71,921 7,103 4.6 39,105 25.2 155,304Wisconsin 1,809 5.4 462 1.4 33,446 2,239 3.3 25,383 37.6 67,454
SouthwestLouisiana 1,487 3.4 22,842 51.8 44,085 20 0.0 64,854 99.6 65,118Oklahoma 1,450 5.6 1,549 6.0 25,962 2,694 5.2 3,189 6.2 51,855ACL (NM) 4 3.2 3 2.4 124 15 4.4 0 0.0 338Chickasaw Nation (OK) 60 6.8 53 6.0 877 145 7.1 57 2.8 2,052Choctaw Nation (OK) 23 2.4 515 53.7 959 103 5.4 102 5.4 1,896Eight Northern Pueblo (NM) 7 8.5 1 1.2 82 15 8.2 1 0.5 182Five Sandoval Pueblos (NM) 2 2.5 5 6.3 79 4 1.9 2 0.9 212ITC-Oklahoma 1 0.5 11 5.7 193 20 4.0 5 1.0 495Muscogee Creek Nation (OK) 38 5.9 22 3.4 645 76 4.6 35 2.1 1,665
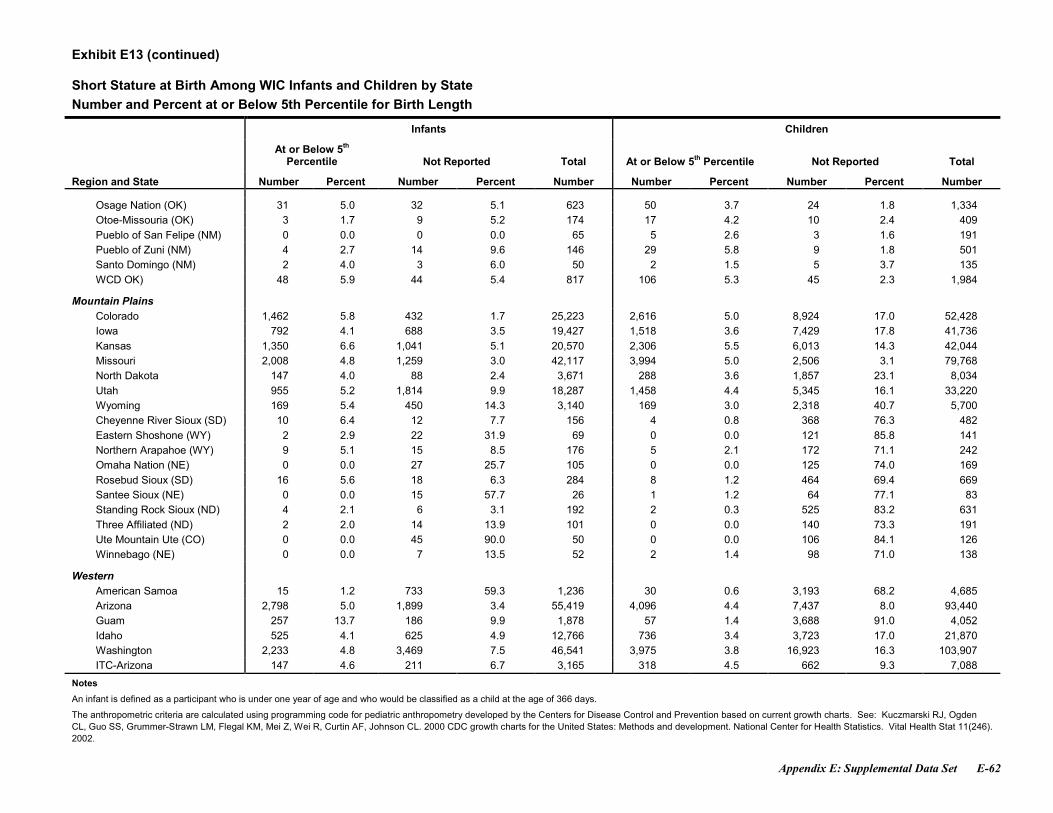
Appendix E: Supplemental Data Set E-62
Exhibit E13 (continued)
Short Stature at Birth Among WIC Infants and Children by StateNumber and Percent at or Below 5th Percentile for Birth Length
Infants Children
At or Below 5th
Percentile Not Reported Total At or Below 5th Percentile Not Reported Total
Region and State Number Percent Number Percent Number Number Percent Number Percent Number
Osage Nation (OK) 31 5.0 32 5.1 623 50 3.7 24 1.8 1,334Otoe-Missouria (OK) 3 1.7 9 5.2 174 17 4.2 10 2.4 409Pueblo of San Felipe (NM) 0 0.0 0 0.0 65 5 2.6 3 1.6 191Pueblo of Zuni (NM) 4 2.7 14 9.6 146 29 5.8 9 1.8 501Santo Domingo (NM) 2 4.0 3 6.0 50 2 1.5 5 3.7 135WCD OK) 48 5.9 44 5.4 817 106 5.3 45 2.3 1,984
Mountain PlainsColorado 1,462 5.8 432 1.7 25,223 2,616 5.0 8,924 17.0 52,428Iowa 792 4.1 688 3.5 19,427 1,518 3.6 7,429 17.8 41,736Kansas 1,350 6.6 1,041 5.1 20,570 2,306 5.5 6,013 14.3 42,044Missouri 2,008 4.8 1,259 3.0 42,117 3,994 5.0 2,506 3.1 79,768North Dakota 147 4.0 88 2.4 3,671 288 3.6 1,857 23.1 8,034Utah 955 5.2 1,814 9.9 18,287 1,458 4.4 5,345 16.1 33,220Wyoming 169 5.4 450 14.3 3,140 169 3.0 2,318 40.7 5,700Cheyenne River Sioux (SD) 10 6.4 12 7.7 156 4 0.8 368 76.3 482Eastern Shoshone (WY) 2 2.9 22 31.9 69 0 0.0 121 85.8 141Northern Arapahoe (WY) 9 5.1 15 8.5 176 5 2.1 172 71.1 242Omaha Nation (NE) 0 0.0 27 25.7 105 0 0.0 125 74.0 169Rosebud Sioux (SD) 16 5.6 18 6.3 284 8 1.2 464 69.4 669Santee Sioux (NE) 0 0.0 15 57.7 26 1 1.2 64 77.1 83Standing Rock Sioux (ND) 4 2.1 6 3.1 192 2 0.3 525 83.2 631Three Affiliated (ND) 2 2.0 14 13.9 101 0 0.0 140 73.3 191Ute Mountain Ute (CO) 0 0.0 45 90.0 50 0 0.0 106 84.1 126Winnebago (NE) 0 0.0 7 13.5 52 2 1.4 98 71.0 138
WesternAmerican Samoa 15 1.2 733 59.3 1,236 30 0.6 3,193 68.2 4,685Arizona 2,798 5.0 1,899 3.4 55,419 4,096 4.4 7,437 8.0 93,440Guam 257 13.7 186 9.9 1,878 57 1.4 3,688 91.0 4,052Idaho 525 4.1 625 4.9 12,766 736 3.4 3,723 17.0 21,870Washington 2,233 4.8 3,469 7.5 46,541 3,975 3.8 16,923 16.3 103,907ITC-Arizona 147 4.6 211 6.7 3,165 318 4.5 662 9.3 7,088
Notes
An infant is defined as a participant who is under one year of age and who would be classified as a child at the age of 366 days.
The anthropometric criteria are calculated using programming code for pediatric anthropometry developed by the Centers for Disease Control and Prevention based on current growth charts. See: Kuczmarski RJ, OgdenCL, Guo SS, Grummer-Strawn LM, Flegal KM, Mei Z, Wei R, Curtin AF, Johnson CL. 2000 CDC growth charts for the United States: Methods and development. National Center for Health Statistics. Vital Health Stat 11(246).2002.
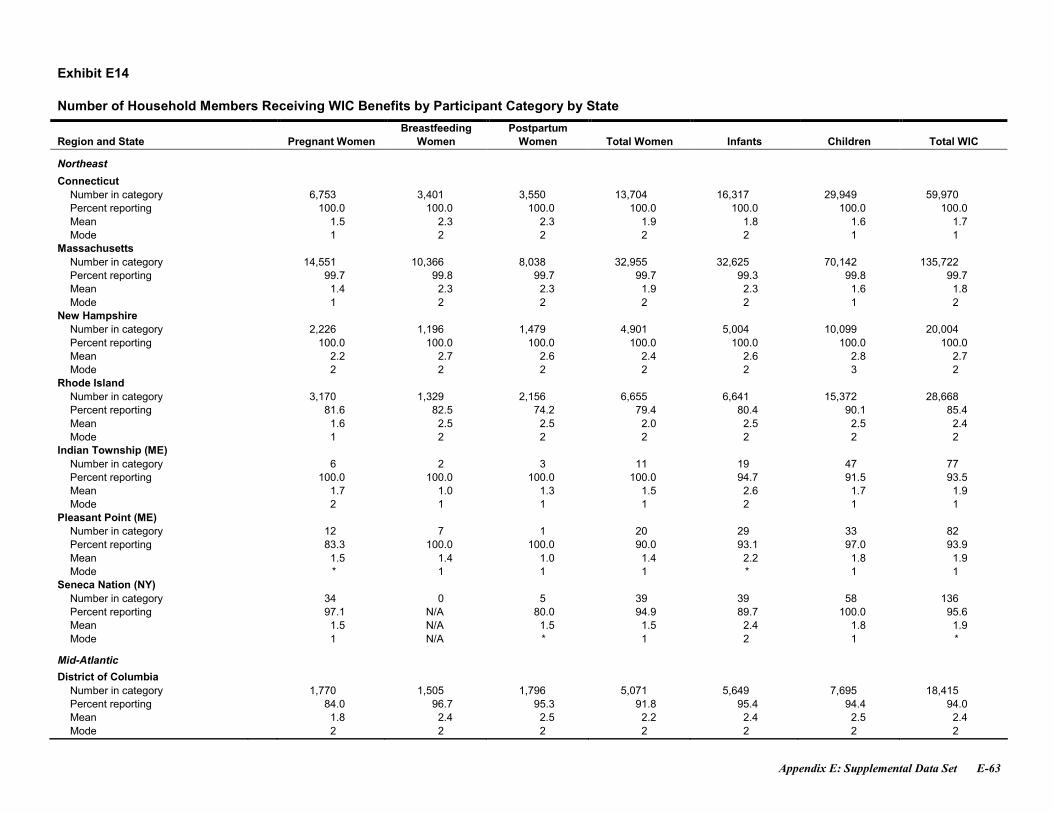
Appendix E: Supplemental Data Set E-63
Exhibit E14
Number of Household Members Receiving WIC Benefits by Participant Category by State
Region and State Pregnant WomenBreastfeeding
WomenPostpartum
Women Total Women Infants Children Total WIC
Northeast
ConnecticutNumber in category 6,753 3,401 3,550 13,704 16,317 29,949 59,970Percent reporting 100.0 100.0 100.0 100.0 100.0 100.0 100.0Mean 1.5 2.3 2.3 1.9 1.8 1.6 1.7Mode 1 2 2 2 2 1 1
MassachusettsNumber in category 14,551 10,366 8,038 32,955 32,625 70,142 135,722Percent reporting 99.7 99.8 99.7 99.7 99.3 99.8 99.7Mean 1.4 2.3 2.3 1.9 2.3 1.6 1.8Mode 1 2 2 2 2 1 2
New HampshireNumber in category 2,226 1,196 1,479 4,901 5,004 10,099 20,004Percent reporting 100.0 100.0 100.0 100.0 100.0 100.0 100.0Mean 2.2 2.7 2.6 2.4 2.6 2.8 2.7Mode 2 2 2 2 2 3 2
Rhode IslandNumber in category 3,170 1,329 2,156 6,655 6,641 15,372 28,668Percent reporting 81.6 82.5 74.2 79.4 80.4 90.1 85.4Mean 1.6 2.5 2.5 2.0 2.5 2.5 2.4Mode 1 2 2 2 2 2 2
Indian Township (ME)Number in category 6 2 3 11 19 47 77Percent reporting 100.0 100.0 100.0 100.0 94.7 91.5 93.5Mean 1.7 1.0 1.3 1.5 2.6 1.7 1.9Mode 2 1 1 1 2 1 1
Pleasant Point (ME)Number in category 12 7 1 20 29 33 82Percent reporting 83.3 100.0 100.0 90.0 93.1 97.0 93.9Mean 1.5 1.4 1.0 1.4 2.2 1.8 1.9Mode * 1 1 1 * 1 1
Seneca Nation (NY)Number in category 34 0 5 39 39 58 136Percent reporting 97.1 N/A 80.0 94.9 89.7 100.0 95.6Mean 1.5 N/A 1.5 1.5 2.4 1.8 1.9Mode 1 N/A * 1 2 1 *
Mid-Atlantic
District of ColumbiaNumber in category 1,770 1,505 1,796 5,071 5,649 7,695 18,415Percent reporting 84.0 96.7 95.3 91.8 95.4 94.4 94.0Mean 1.8 2.4 2.5 2.2 2.4 2.5 2.4Mode 2 2 2 2 2 2 2
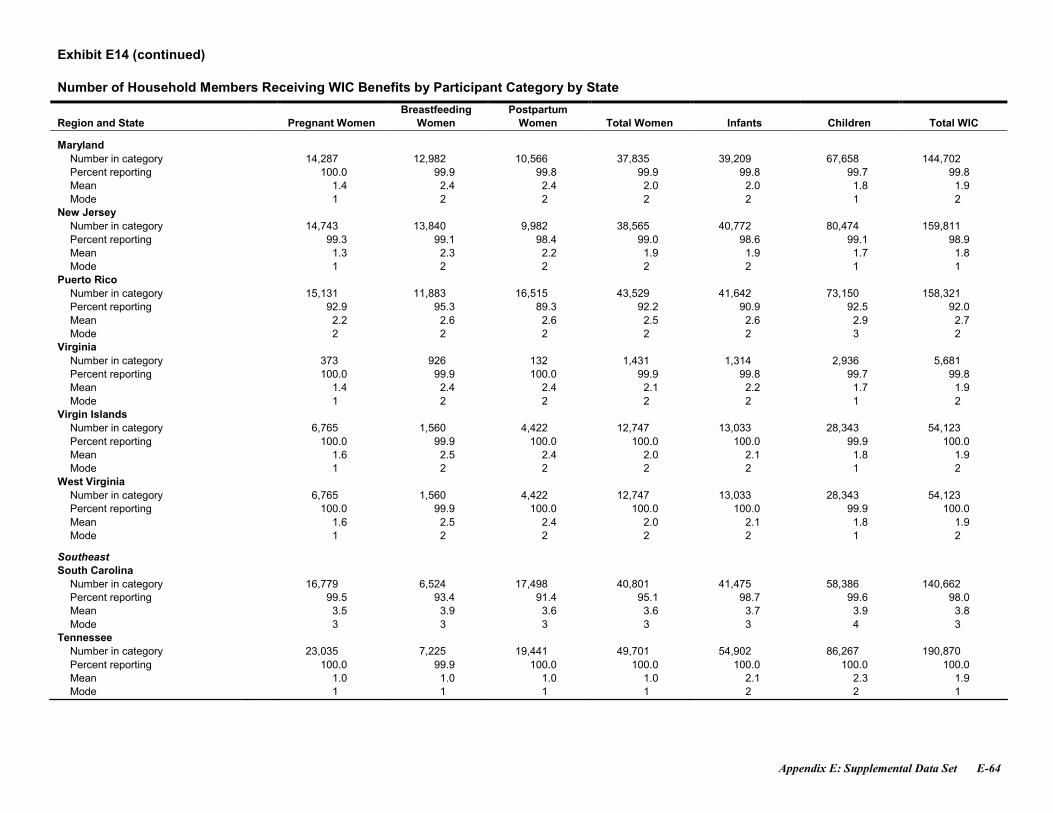
Appendix E: Supplemental Data Set E-64
Exhibit E14 (continued)
Number of Household Members Receiving WIC Benefits by Participant Category by State
Region and State Pregnant WomenBreastfeeding
WomenPostpartum
Women Total Women Infants Children Total WIC
MarylandNumber in category 14,287 12,982 10,566 37,835 39,209 67,658 144,702Percent reporting 100.0 99.9 99.8 99.9 99.8 99.7 99.8Mean 1.4 2.4 2.4 2.0 2.0 1.8 1.9Mode 1 2 2 2 2 1 2
New JerseyNumber in category 14,743 13,840 9,982 38,565 40,772 80,474 159,811Percent reporting 99.3 99.1 98.4 99.0 98.6 99.1 98.9Mean 1.3 2.3 2.2 1.9 1.9 1.7 1.8Mode 1 2 2 2 2 1 1
Puerto RicoNumber in category 15,131 11,883 16,515 43,529 41,642 73,150 158,321Percent reporting 92.9 95.3 89.3 92.2 90.9 92.5 92.0Mean 2.2 2.6 2.6 2.5 2.6 2.9 2.7Mode 2 2 2 2 2 3 2
VirginiaNumber in category 373 926 132 1,431 1,314 2,936 5,681Percent reporting 100.0 99.9 100.0 99.9 99.8 99.7 99.8Mean 1.4 2.4 2.4 2.1 2.2 1.7 1.9Mode 1 2 2 2 2 1 2
Virgin IslandsNumber in category 6,765 1,560 4,422 12,747 13,033 28,343 54,123Percent reporting 100.0 99.9 100.0 100.0 100.0 99.9 100.0Mean 1.6 2.5 2.4 2.0 2.1 1.8 1.9Mode 1 2 2 2 2 1 2
West VirginiaNumber in category 6,765 1,560 4,422 12,747 13,033 28,343 54,123Percent reporting 100.0 99.9 100.0 100.0 100.0 99.9 100.0Mean 1.6 2.5 2.4 2.0 2.1 1.8 1.9Mode 1 2 2 2 2 1 2
SoutheastSouth Carolina
Number in category 16,779 6,524 17,498 40,801 41,475 58,386 140,662Percent reporting 99.5 93.4 91.4 95.1 98.7 99.6 98.0Mean 3.5 3.9 3.6 3.6 3.7 3.9 3.8Mode 3 3 3 3 3 4 3
TennesseeNumber in category 23,035 7,225 19,441 49,701 54,902 86,267 190,870Percent reporting 100.0 99.9 100.0 100.0 100.0 100.0 100.0Mean 1.0 1.0 1.0 1.0 2.1 2.3 1.9Mode 1 1 1 1 2 2 1
Appendix E: Supplemental Data Set E-65
Exhibit E14 (continued)
Number of Household Members Receiving WIC Benefits by Participant Category by State
Region and State Pregnant WomenBreastfeeding
WomenPostpartum
Women Total Women Infants Children Total WIC
Mississippi ChoctawNumber in category 129 10 46 185 270 507 962Percent reporting 100.0 100.0 100.0 100.0 96.3 98.2 98.0Mean 1.8 1.8 1.4 1.7 3.1 2.2 2.4Mode 2 * 1 2 2 1 2
MidwestIllinois 40,564 18,600 25,941 85,105 93,894 152,866 331,865
Number in category 75.7 97.4 94.8 86.3 91.2 90.5 89.6Percent reporting 2.7 2.8 2.8 2.7 2.8 3.1 2.9Mean 2 2 2 2 2 3 2Mode
Indiana 17,602 7,627 17,377 42,606 45,916 83,056 171,578Number in category 100.0 99.9 100.0 100.0 100.0 100.0 100.0Percent reporting 1.5 2.4 2.4 2.0 2.0 1.9 1.9Mean 1 2 2 2 2 1 2Mode
Minnesota 15,418 12,686 8,142 36,246 34,097 84,541 154,884Number in category 98.6 99.4 99.4 99.0 99.5 99.6 99.5Percent reporting 1.6 2.6 2.5 2.1 2.2 1.9 2.0Mean 1 2 2 2 2 1 2Mode 40,564 18,600 25,941 85,105 93,894 152,866 331,865
SouthwestLouisiana
Number in category 16,726 4,770 18,387 39,883 44,085 65,118 149,086Percent reporting 99.9 99.7 99.9 99.9 99.8 99.9 99.9Mean 3.0 3.8 3.7 3.4 3.7 3.9 3.7Mode 2 3 3 3 3 4 3
New MexicoNumber in category 8,243 4,245 3,879 16,367 16,332 35,009 67,708Percent reporting 89.5 92.0 91.8 90.7 96.4 97.0 95.3Mean 1.7 2.7 2.6 2.2 2.0 1.9 2.0Mode 1 2 2 2 2 1 2
ACL (NM)Number in category 47 53 32 132 124 338 594Percent reporting 100.0 100.0 93.8 98.5 97.6 97.6 97.8Mean 1.6 2.8 2.7 2.3 2.7 3.0 2.8Mode 1 2 2 2 2 3 2
Chickasaw Nation (OK)Number in category 383 142 420 945 877 2,052 3,874Percent reporting 91.9 93.0 95.5 93.7 93.2 93.0 93.2Mean 1.6 2.8 2.7 2.3 2.7 2.8 2.6Mode 1 2 2 2 2 3 2

Appendix E: Supplemental Data Set E-66
Exhibit E14 (continued)
Number of Household Members Receiving WIC Benefits by Participant Category by State
Region and State Pregnant WomenBreastfeeding
WomenPostpartum
Women Total Women Infants Children Total WIC
Choctaw Nation (OK)Number in category 317 157 334 808 959 1,896 3,663Percent reporting 95.6 93.0 85.3 90.8 87.5 94.5 91.8Mean 1.7 2.5 2.5 2.2 2.4 2.6 2.5Mode 1 2 2 2 2 3 2
Citizen Potawatomi (OK)Number in category 141 51 123 315 367 1,070 1,752Percent reporting 98.6 98.0 97.6 98.1 98.9 99.6 99.2Mean 1.7 2.4 2.6 2.1 2.4 1.9 2.1Mode 1 2 2 2 2 2 2
Eight Northern Pueblos (NM)Number in category 21 22 19 62 82 182 326Percent reporting 100.0 95.5 94.7 96.8 96.3 94.5 95.4Mean 1.9 2.5 2.7 2.4 2.5 2.6 2.5Mode 1 2 * 2 2 2 2
Five Sandoval Pueblos (NM)Number in category 44 40 8 92 79 212 383Percent reporting 97.7 97.5 100.0 97.8 86.1 96.7 94.8Mean 1.3 2.0 1.8 1.6 1.8 1.8 1.8Mode 1 2 2 1 1 1 1
ITC OklahomaNumber in category 74 20 81 175 193 495 863Percent reporting 98.6 90.0 91.4 94.3 91.7 96.8 95.1Mean 1.6 2.5 2.8 2.2 2.6 2.3 2.4Mode 1 * 2 2 2 2 2
Muscogee Creek Nation (OK)Number in category 262 122 263 647 645 1,665 2,957Percent reporting 99.2 99.2 98.5 98.9 98.4 97.1 97.8Mean 1.6 2.7 2.6 2.2 2.6 2.7 2.6Mode 1 2 2 2 2 3 2
Osage Nation (OK)Number in category 199 90 220 509 623 1,334 2,466Percent reporting 98.0 97.8 96.8 97.4 96.8 96.1 96.6Mean 1.6 2.4 2.4 2.1 2.3 2.3 2.2Mode 1 2 2 2 2 2 2
Otoe-Missouria (OK)Number in category 78 28 79 185 174 409 768Percent reporting 98.7 92.9 97.5 97.3 96.0 96.6 96.6Mean 1.7 2.3 2.5 2.1 2.5 2.6 2.5Mode 1 2 2 2 2 2 2
Pueblo of Isleta (NM)Number in category 88 80 61 229 226 604 1,059Percent reporting 100.0 95.0 82.0 93.4 91.6 97.4 95.3Mean 1.6 2.9 3.0 2.4 2.4 1.9 2.1Mode 1 3 3 2 2 1 2
Appendix E: Supplemental Data Set E-67
Exhibit E14 (continued)
Number of Household Members Receiving WIC Benefits by Participant Category by State
Region and State Pregnant WomenBreastfeeding
WomenPostpartum
Women Total Women Infants Children Total WIC
Pueblo of San Felipe (NM)Number in category 26 24 17 67 65 191 323Percent reporting 88.5 91.7 88.2 89.6 86.2 91.1 89.8Mean 1.5 2.8 2.3 2.2 2.8 2.5 2.5Mode 1 2 2 2 2 2 2
Pueblo of Zuni (NM)Number in category 79 68 38 185 146 501 832Percent reporting 98.7 100.0 100.0 99.5 96.6 99.4 98.9Mean 1.7 2.6 2.4 2.2 2.6 2.4 2.4Mode 1 2 2 2 2 2 2
Santo Domingo (NM)Number in category 18 25 10 53 50 135 238Percent reporting 100.0 100.0 100.0 100.0 98.0 97.0 97.9Mean 1.7 2.4 2.3 2.1 2.4 1.9 2.0Mode 1 2 2 2 2 1 2
WCD (OK)Number in category 306 156 350 812 817 1,984 3,613Percent reporting 96.7 98.1 98.3 97.7 95.6 96.9 96.8Mean 1.7 2.7 2.7 2.3 2.6 2.7 2.6Mode 1 2 2 2 2 3 2
Mountain PlainsColorado
Number in category 9,821 7,616 7,941 25,378 25,223 52,428 103,029Percent reporting 99.5 98.7 98.9 99.1 99.7 99.0 99.2Mean 1.5 2.4 2.3 2.0 2.3 1.8 2.0Mode 1 2 2 2 2 1 2
IowaNumber in category 7,840 4,121 6,894 18,855 19,427 41,736 80,018Percent reporting 99.6 99.2 99.3 99.4 98.2 98.7 98.7Mean 1.6 2.5 2.4 2.1 2.1 1.9 2.0Mode 1 2 2 2 2 1 2
KansasNumber in category 7,953 4,407 7,444 19,804 20,570 42,044 82,418Percent reporting 100.0 100.0 100.0 100.0 100.0 100.0 100.0Mean 2.3 2.7 2.7 2.5 2.7 2.9 2.8Mode 2 2 2 2 2 3 2
MontanaNumber in category 2,912 1,675 1,310 5,897 6,331 12,265 24,493Percent reporting 92.4 99.8 99.0 96.0 99.6 99.7 98.8Mean 1.6 2.5 2.5 2.1 2.4 1.9 2.1Mode 1 2 2 2 2 2 2
Appendix E: Supplemental Data Set E-68
Exhibit E14 (continued)
Number of Household Members Receiving WIC Benefits by Participant Category by State
Region and State Pregnant WomenBreastfeeding
WomenPostpartum
Women Total Women Infants Children Total WIC
NebraskaNumber in category 4,768 3,275 4,011 12,054 12,931 27,039 52,024Percent reporting 100.0 99.9 100.0 100.0 99.9 100.0 100.0Mean 1.6 2.5 2.4 2.1 2.1 1.9 2.0Mode 1 2 2 2 2 1 2
North DakotaNumber in category 1,703 732 1,170 3,605 3,671 8,034 15,310Percent reporting 99.2 99.2 99.6 99.3 98.7 98.8 98.9Mean 1.7 2.6 2.5 2.1 2.1 2.0 2.0Mode 1 2 2 2 2 1 2
UtahNumber in category 7,275 6,907 5,013 19,195 18,287 33,220 70,702Percent reporting 99.7 99.7 99.7 99.7 99.6 99.8 99.7Mean 4.1 4.3 3.9 4.1 4.1 4.7 4.4Mode 3 3 3 3 3 4 4
Cheyenne River Sioux (SD)Number in category 83 23 46 152 156 482 790Percent reporting 95.2 100.0 97.8 96.7 90.4 97.1 95.7Mean 1.7 1.6 1.8 1.7 2.8 2.0 2.1Mode 1 2 2 2 2 1 1
Eastern Shoshone (WY)Number in category 30 9 18 57 69 141 267Percent reporting 90.0 100.0 94.4 93.0 98.6 97.9 97.0Mean 1.6 1.2 1.4 1.4 2.7 2.0 2.1Mode 1 1 1 1 * 2 1
Northern Arapahoe (WY)Number in category 65 39 39 143 176 242 561Percent reporting 93.8 100.0 97.4 96.5 85.8 95.5 92.7Mean 1.5 1.7 1.7 1.6 3.0 2.1 2.2Mode 1 1 1 1 2 1 2
Omaha Nation (NE)Number in category 42 7 4 53 105 169 327Percent reporting 92.9 100.0 100.0 94.3 90.5 97.0 94.5Mean 1.8 2.3 2.3 1.9 2.9 2.1 2.3Mode 1 2 2 2 3 1 1
Rosebud Sioux (SD)Number in category 110 91 54 255 284 669 1,208Percent reporting 96.4 98.9 98.1 97.6 93.7 98.5 97.2Mean 1.6 1.5 1.7 1.6 3.0 2.2 2.3Mode 1 1 1 1 2 1 1
Santee Sioux (NE)Number in category 20 0 8 28 26 83 137Percent reporting 95.0 N/A 100.0 96.4 80.8 100.0 95.6Mean 1.8 N/A 1.6 1.8 2.7 2.0 2.1Mode 2 N/A 1 2 2 1 1
Appendix E: Supplemental Data Set E-69
Exhibit E14 (continued)
Number of Household Members Receiving WIC Benefits by Participant Category by State
Region and State Pregnant WomenBreastfeeding
WomenPostpartum
Women Total Women Infants Children Total WIC
Standing Rock Sioux (ND)Number in category 96 24 66 186 192 631 1,009Percent reporting 97.9 100.0 100.0 98.9 88.5 94.9 94.4Mean 1.8 1.4 1.7 1.7 3.0 2.2 2.3Mode 2 1 1 2 2 1 1
Three Affiliated (ND)Number in category 57 3 16 76 101 191 368Percent reporting 100.0 100.0 100.0 100.0 94.1 97.9 97.3Mean 1.9 2.3 2.3 2.0 2.6 2.0 2.2Mode 2 2 2 2 2 1 2
Ute Mountain Ute (CO)Number in category 18 17 2 37 50 126 213Percent reporting 100.0 100.0 100.0 100.0 96.0 97.6 97.7Mean 1.8 1.9 2.0 1.9 2.3 1.7 1.9Mode 2 2 2 2 2 1 1
Winnebago (NE)Number in category 24 4 9 37 52 138 227Percent reporting 100.0 100.0 100.0 100.0 96.2 98.6 98.2Mean 2.1 2.3 1.8 2.0 3.1 2.2 2.4Mode 2 2 2 2 3 1 2
WesternAmerican Samoa
Number in category 484 839 118 1,441 1,236 4,685 7,362Percent reporting 100.0 97.3 100.0 98.4 100.0 100.0 99.7Mean 1.9 2.8 2.6 2.5 2.5 2.1 2.2Mode 1 2 2 2 2 1 2
ArizonaNumber in category 19,319 18,309 13,191 50,819 55,419 93,440 199,678Percent reporting 100.0 99.8 100.0 99.9 100.0 100.0 100.0Mean 1.6 2.5 2.5 2.2 2.1 2.0 2.1Mode 1 2 2 2 2 2 2
GuamNumber in category 722 366 539 1,628 1,878 4,052 7,560Percent reporting 0.0 91.9 85.9 49.1 90.9 94.3 83.7Mean N/A 3.2 3.4 3.3 3.1 3.2 3.2Mode N/A 2 3 3 2 3 3
WashingtonNumber in category 26,601 13,836 7,877 48,314 46,541 103,907 198,762Percent reporting 100.0 100.0 100.0 100.0 100.0 100.0 100Mean 2.4 2.9 2.6 2.5 2.8 3.0 2.8Mode 2 2 2 2 2 3 2
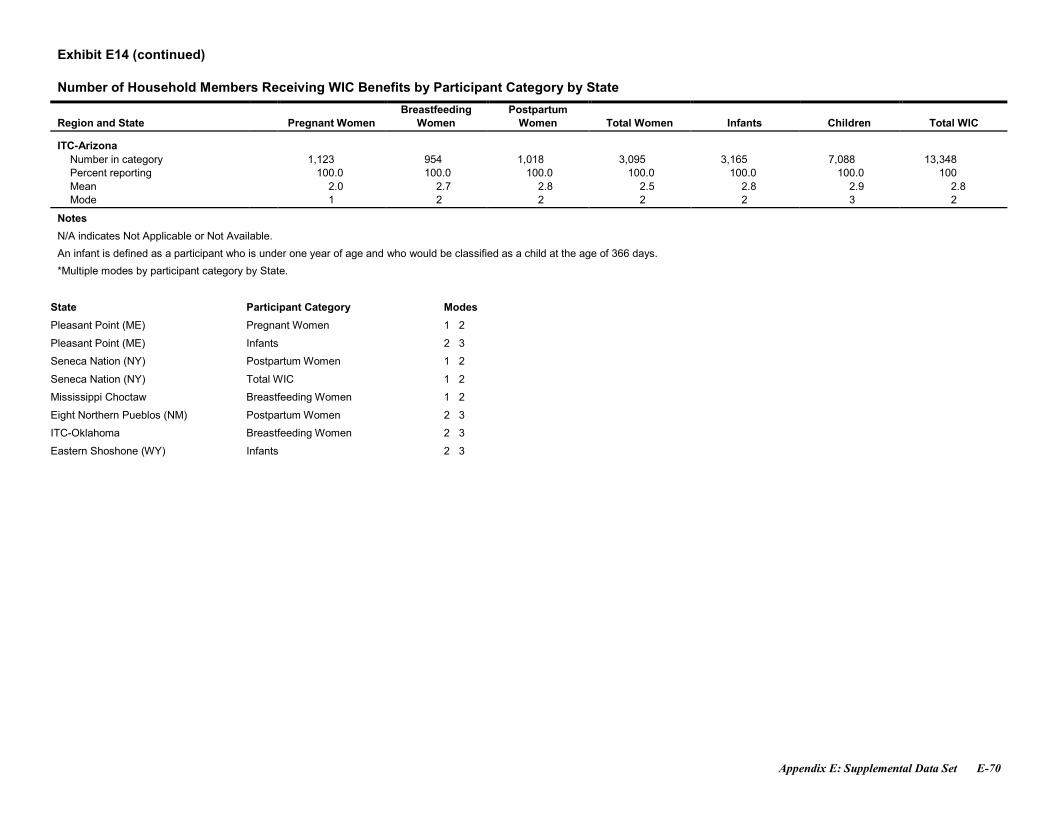
Appendix E: Supplemental Data Set E-70
Exhibit E14 (continued)
Number of Household Members Receiving WIC Benefits by Participant Category by State
Region and State Pregnant WomenBreastfeeding
WomenPostpartum
Women Total Women Infants Children Total WIC
ITC-ArizonaNumber in category 1,123 954 1,018 3,095 3,165 7,088 13,348Percent reporting 100.0 100.0 100.0 100.0 100.0 100.0 100Mean 2.0 2.7 2.8 2.5 2.8 2.9 2.8Mode 1 2 2 2 2 3 2
Notes
N/A indicates Not Applicable or Not Available.
An infant is defined as a participant who is under one year of age and who would be classified as a child at the age of 366 days.
*Multiple modes by participant category by State.
State Participant Category Modes
Pleasant Point (ME) Pregnant Women 1 2
Pleasant Point (ME) Infants 2 3
Seneca Nation (NY) Postpartum Women 1 2
Seneca Nation (NY) Total WIC 1 2
Mississippi Choctaw Breastfeeding Women 1 2
Eight Northern Pueblos (NM) Postpartum Women 2 3
ITC-Oklahoma Breastfeeding Women 2 3
Eastern Shoshone (WY) Infants 2 3
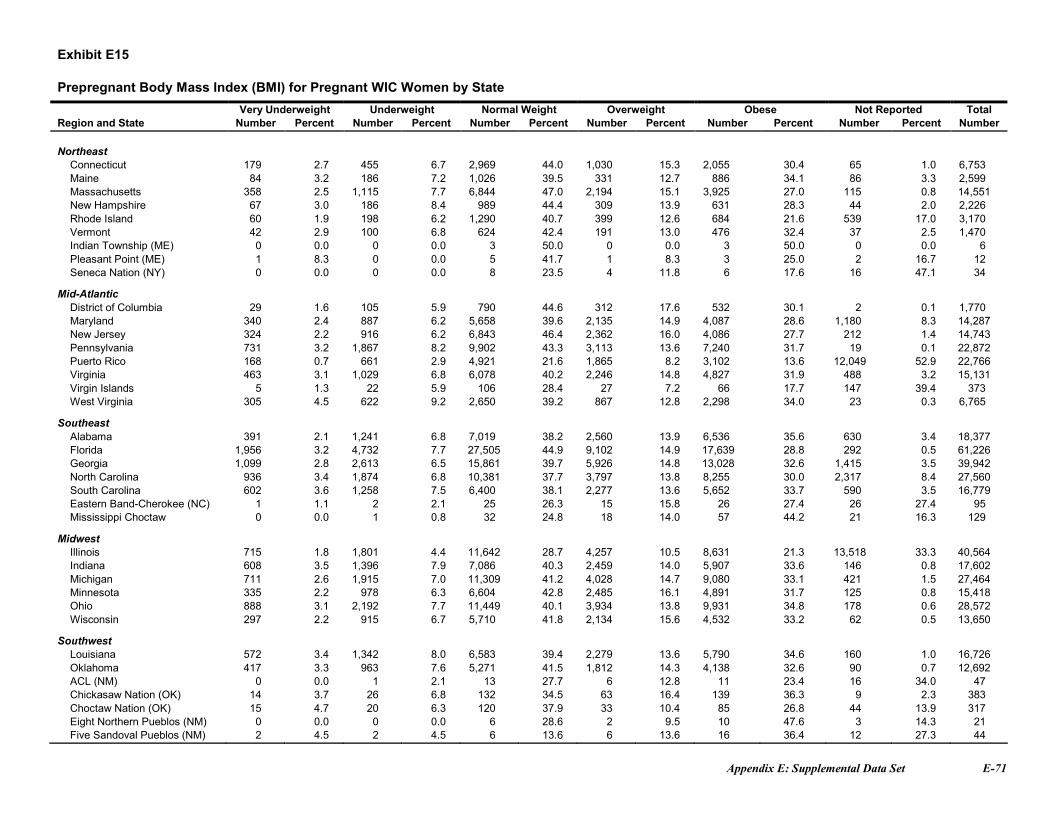
Appendix E: Supplemental Data Set E-71
Exhibit E15
Prepregnant Body Mass Index (BMI) for Pregnant WIC Women by State
Very Underweight Underweight Normal Weight Overweight Obese Not Reported TotalRegion and State Number Percent Number Percent Number Percent Number Percent Number Percent Number Percent Number
NortheastConnecticut 179 2.7 455 6.7 2,969 44.0 1,030 15.3 2,055 30.4 65 1.0 6,753Maine 84 3.2 186 7.2 1,026 39.5 331 12.7 886 34.1 86 3.3 2,599Massachusetts 358 2.5 1,115 7.7 6,844 47.0 2,194 15.1 3,925 27.0 115 0.8 14,551New Hampshire 67 3.0 186 8.4 989 44.4 309 13.9 631 28.3 44 2.0 2,226Rhode Island 60 1.9 198 6.2 1,290 40.7 399 12.6 684 21.6 539 17.0 3,170Vermont 42 2.9 100 6.8 624 42.4 191 13.0 476 32.4 37 2.5 1,470Indian Township (ME) 0 0.0 0 0.0 3 50.0 0 0.0 3 50.0 0 0.0 6Pleasant Point (ME) 1 8.3 0 0.0 5 41.7 1 8.3 3 25.0 2 16.7 12Seneca Nation (NY) 0 0.0 0 0.0 8 23.5 4 11.8 6 17.6 16 47.1 34
Mid-AtlanticDistrict of Columbia 29 1.6 105 5.9 790 44.6 312 17.6 532 30.1 2 0.1 1,770Maryland 340 2.4 887 6.2 5,658 39.6 2,135 14.9 4,087 28.6 1,180 8.3 14,287New Jersey 324 2.2 916 6.2 6,843 46.4 2,362 16.0 4,086 27.7 212 1.4 14,743Pennsylvania 731 3.2 1,867 8.2 9,902 43.3 3,113 13.6 7,240 31.7 19 0.1 22,872Puerto Rico 168 0.7 661 2.9 4,921 21.6 1,865 8.2 3,102 13.6 12,049 52.9 22,766Virginia 463 3.1 1,029 6.8 6,078 40.2 2,246 14.8 4,827 31.9 488 3.2 15,131Virgin Islands 5 1.3 22 5.9 106 28.4 27 7.2 66 17.7 147 39.4 373West Virginia 305 4.5 622 9.2 2,650 39.2 867 12.8 2,298 34.0 23 0.3 6,765
SoutheastAlabama 391 2.1 1,241 6.8 7,019 38.2 2,560 13.9 6,536 35.6 630 3.4 18,377Florida 1,956 3.2 4,732 7.7 27,505 44.9 9,102 14.9 17,639 28.8 292 0.5 61,226Georgia 1,099 2.8 2,613 6.5 15,861 39.7 5,926 14.8 13,028 32.6 1,415 3.5 39,942North Carolina 936 3.4 1,874 6.8 10,381 37.7 3,797 13.8 8,255 30.0 2,317 8.4 27,560South Carolina 602 3.6 1,258 7.5 6,400 38.1 2,277 13.6 5,652 33.7 590 3.5 16,779Eastern Band-Cherokee (NC) 1 1.1 2 2.1 25 26.3 15 15.8 26 27.4 26 27.4 95Mississippi Choctaw 0 0.0 1 0.8 32 24.8 18 14.0 57 44.2 21 16.3 129
MidwestIllinois 715 1.8 1,801 4.4 11,642 28.7 4,257 10.5 8,631 21.3 13,518 33.3 40,564Indiana 608 3.5 1,396 7.9 7,086 40.3 2,459 14.0 5,907 33.6 146 0.8 17,602Michigan 711 2.6 1,915 7.0 11,309 41.2 4,028 14.7 9,080 33.1 421 1.5 27,464Minnesota 335 2.2 978 6.3 6,604 42.8 2,485 16.1 4,891 31.7 125 0.8 15,418Ohio 888 3.1 2,192 7.7 11,449 40.1 3,934 13.8 9,931 34.8 178 0.6 28,572Wisconsin 297 2.2 915 6.7 5,710 41.8 2,134 15.6 4,532 33.2 62 0.5 13,650
SouthwestLouisiana 572 3.4 1,342 8.0 6,583 39.4 2,279 13.6 5,790 34.6 160 1.0 16,726Oklahoma 417 3.3 963 7.6 5,271 41.5 1,812 14.3 4,138 32.6 90 0.7 12,692ACL (NM) 0 0.0 1 2.1 13 27.7 6 12.8 11 23.4 16 34.0 47Chickasaw Nation (OK) 14 3.7 26 6.8 132 34.5 63 16.4 139 36.3 9 2.3 383Choctaw Nation (OK) 15 4.7 20 6.3 120 37.9 33 10.4 85 26.8 44 13.9 317Eight Northern Pueblos (NM) 0 0.0 0 0.0 6 28.6 2 9.5 10 47.6 3 14.3 21Five Sandoval Pueblos (NM) 2 4.5 2 4.5 6 13.6 6 13.6 16 36.4 12 27.3 44
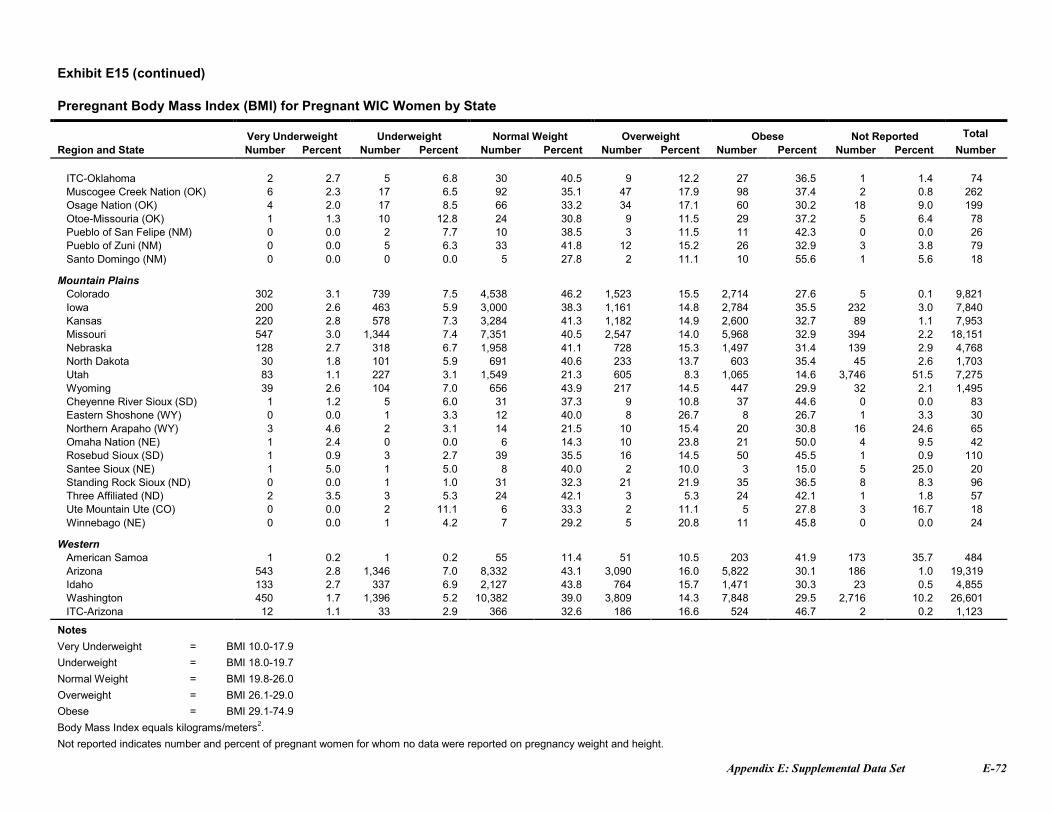
Appendix E: Supplemental Data Set E-72
Exhibit E15 (continued)
Preregnant Body Mass Index (BMI) for Pregnant WIC Women by State
Very Underweight Underweight Normal Weight Overweight Obese Not Reported Total
Region and State Number Percent Number Percent Number Percent Number Percent Number Percent Number Percent Number
ITC-Oklahoma 2 2.7 5 6.8 30 40.5 9 12.2 27 36.5 1 1.4 74Muscogee Creek Nation (OK) 6 2.3 17 6.5 92 35.1 47 17.9 98 37.4 2 0.8 262Osage Nation (OK) 4 2.0 17 8.5 66 33.2 34 17.1 60 30.2 18 9.0 199Otoe-Missouria (OK) 1 1.3 10 12.8 24 30.8 9 11.5 29 37.2 5 6.4 78Pueblo of San Felipe (NM) 0 0.0 2 7.7 10 38.5 3 11.5 11 42.3 0 0.0 26Pueblo of Zuni (NM) 0 0.0 5 6.3 33 41.8 12 15.2 26 32.9 3 3.8 79Santo Domingo (NM) 0 0.0 0 0.0 5 27.8 2 11.1 10 55.6 1 5.6 18
Mountain PlainsColorado 302 3.1 739 7.5 4,538 46.2 1,523 15.5 2,714 27.6 5 0.1 9,821Iowa 200 2.6 463 5.9 3,000 38.3 1,161 14.8 2,784 35.5 232 3.0 7,840Kansas 220 2.8 578 7.3 3,284 41.3 1,182 14.9 2,600 32.7 89 1.1 7,953Missouri 547 3.0 1,344 7.4 7,351 40.5 2,547 14.0 5,968 32.9 394 2.2 18,151Nebraska 128 2.7 318 6.7 1,958 41.1 728 15.3 1,497 31.4 139 2.9 4,768North Dakota 30 1.8 101 5.9 691 40.6 233 13.7 603 35.4 45 2.6 1,703Utah 83 1.1 227 3.1 1,549 21.3 605 8.3 1,065 14.6 3,746 51.5 7,275Wyoming 39 2.6 104 7.0 656 43.9 217 14.5 447 29.9 32 2.1 1,495Cheyenne River Sioux (SD) 1 1.2 5 6.0 31 37.3 9 10.8 37 44.6 0 0.0 83Eastern Shoshone (WY) 0 0.0 1 3.3 12 40.0 8 26.7 8 26.7 1 3.3 30Northern Arapaho (WY) 3 4.6 2 3.1 14 21.5 10 15.4 20 30.8 16 24.6 65Omaha Nation (NE) 1 2.4 0 0.0 6 14.3 10 23.8 21 50.0 4 9.5 42Rosebud Sioux (SD) 1 0.9 3 2.7 39 35.5 16 14.5 50 45.5 1 0.9 110Santee Sioux (NE) 1 5.0 1 5.0 8 40.0 2 10.0 3 15.0 5 25.0 20Standing Rock Sioux (ND) 0 0.0 1 1.0 31 32.3 21 21.9 35 36.5 8 8.3 96Three Affiliated (ND) 2 3.5 3 5.3 24 42.1 3 5.3 24 42.1 1 1.8 57Ute Mountain Ute (CO) 0 0.0 2 11.1 6 33.3 2 11.1 5 27.8 3 16.7 18Winnebago (NE) 0 0.0 1 4.2 7 29.2 5 20.8 11 45.8 0 0.0 24
WesternAmerican Samoa 1 0.2 1 0.2 55 11.4 51 10.5 203 41.9 173 35.7 484Arizona 543 2.8 1,346 7.0 8,332 43.1 3,090 16.0 5,822 30.1 186 1.0 19,319Idaho 133 2.7 337 6.9 2,127 43.8 764 15.7 1,471 30.3 23 0.5 4,855Washington 450 1.7 1,396 5.2 10,382 39.0 3,809 14.3 7,848 29.5 2,716 10.2 26,601ITC-Arizona 12 1.1 33 2.9 366 32.6 186 16.6 524 46.7 2 0.2 1,123
Notes
Very Underweight = BMI 10.0-17.9Underweight = BMI 18.0-19.7
Normal Weight = BMI 19.8-26.0
Overweight = BMI 26.1-29.0Obese = BMI 29.1-74.9
Body Mass Index equals kilograms/meters2.
Not reported indicates number and percent of pregnant women for whom no data were reported on pregnancy weight and height.
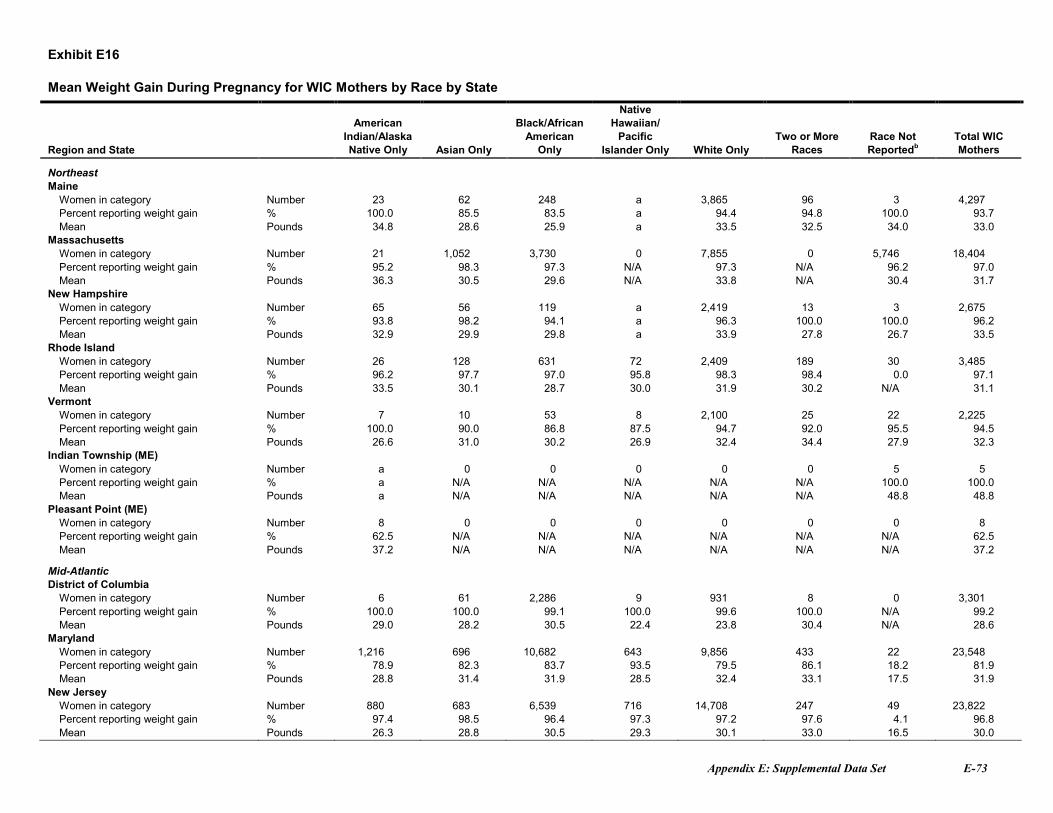
Appendix E: Supplemental Data Set E-73
Exhibit E16
Mean Weight Gain During Pregnancy for WIC Mothers by Race by State
Region and State
AmericanIndian/AlaskaNative Only Asian Only
Black/AfricanAmerican
Only
NativeHawaiian/
PacificIslander Only White Only
Two or MoreRaces
Race NotReportedb
Total WICMothers
NortheastMaine
Women in category Number 23 62 248 a 3,865 96 3 4,297Percent reporting weight gain % 100.0 85.5 83.5 a 94.4 94.8 100.0 93.7Mean Pounds 34.8 28.6 25.9 a 33.5 32.5 34.0 33.0
MassachusettsWomen in category Number 21 1,052 3,730 0 7,855 0 5,746 18,404Percent reporting weight gain % 95.2 98.3 97.3 N/A 97.3 N/A 96.2 97.0Mean Pounds 36.3 30.5 29.6 N/A 33.8 N/A 30.4 31.7
New HampshireWomen in category Number 65 56 119 a 2,419 13 3 2,675Percent reporting weight gain % 93.8 98.2 94.1 a 96.3 100.0 100.0 96.2Mean Pounds 32.9 29.9 29.8 a 33.9 27.8 26.7 33.5
Rhode IslandWomen in category Number 26 128 631 72 2,409 189 30 3,485Percent reporting weight gain % 96.2 97.7 97.0 95.8 98.3 98.4 0.0 97.1Mean Pounds 33.5 30.1 28.7 30.0 31.9 30.2 N/A 31.1
VermontWomen in category Number 7 10 53 8 2,100 25 22 2,225Percent reporting weight gain % 100.0 90.0 86.8 87.5 94.7 92.0 95.5 94.5Mean Pounds 26.6 31.0 30.2 26.9 32.4 34.4 27.9 32.3
Indian Township (ME)Women in category Number a 0 0 0 0 0 5 5Percent reporting weight gain % a N/A N/A N/A N/A N/A 100.0 100.0Mean Pounds a N/A N/A N/A N/A N/A 48.8 48.8
Pleasant Point (ME)Women in category Number 8 0 0 0 0 0 0 8Percent reporting weight gain % 62.5 N/A N/A N/A N/A N/A N/A 62.5Mean Pounds 37.2 N/A N/A N/A N/A N/A N/A 37.2
Mid-AtlanticDistrict of Columbia
Women in category Number 6 61 2,286 9 931 8 0 3,301Percent reporting weight gain % 100.0 100.0 99.1 100.0 99.6 100.0 N/A 99.2Mean Pounds 29.0 28.2 30.5 22.4 23.8 30.4 N/A 28.6
MarylandWomen in category Number 1,216 696 10,682 643 9,856 433 22 23,548Percent reporting weight gain % 78.9 82.3 83.7 93.5 79.5 86.1 18.2 81.9Mean Pounds 28.8 31.4 31.9 28.5 32.4 33.1 17.5 31.9
New JerseyWomen in category Number 880 683 6,539 716 14,708 247 49 23,822Percent reporting weight gain % 97.4 98.5 96.4 97.3 97.2 97.6 4.1 96.8Mean Pounds 26.3 28.8 30.5 29.3 30.1 33.0 16.5 30.0
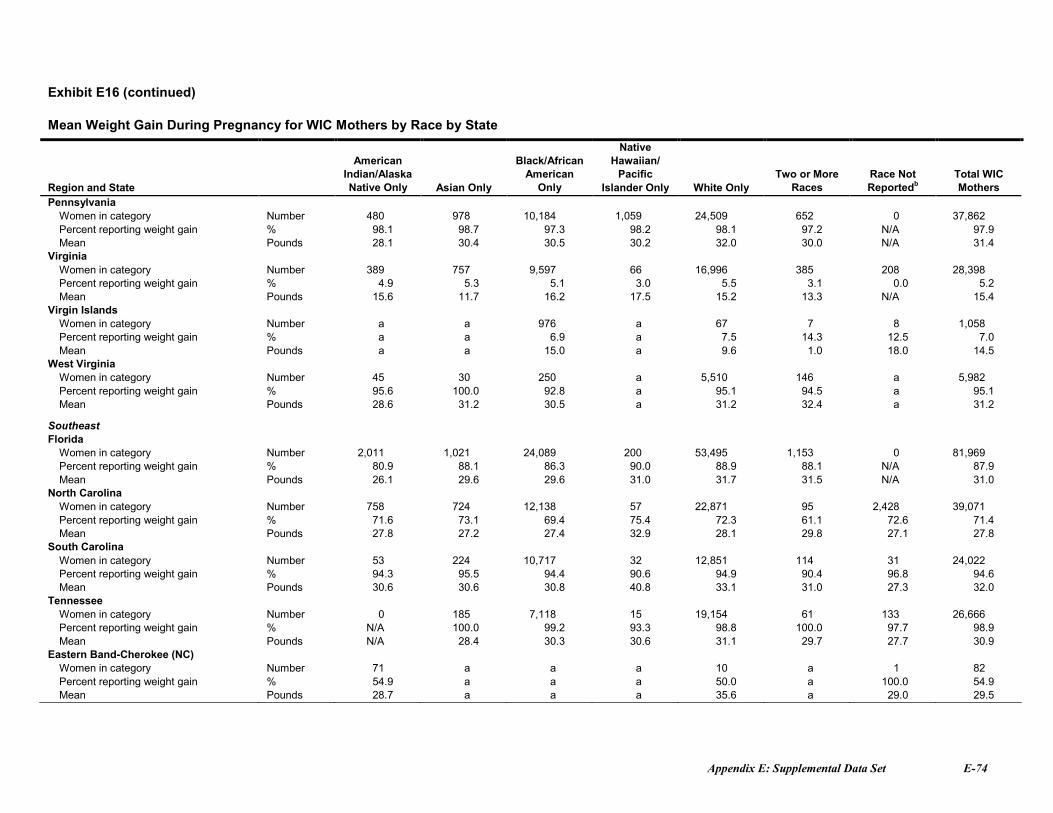
Appendix E: Supplemental Data Set E-74
Exhibit E16 (continued)
Mean Weight Gain During Pregnancy for WIC Mothers by Race by State
Region and State
AmericanIndian/AlaskaNative Only Asian Only
Black/AfricanAmerican
Only
NativeHawaiian/
PacificIslander Only White Only
Two or MoreRaces
Race NotReportedb
Total WICMothers
PennsylvaniaWomen in category Number 480 978 10,184 1,059 24,509 652 0 37,862Percent reporting weight gain % 98.1 98.7 97.3 98.2 98.1 97.2 N/A 97.9Mean Pounds 28.1 30.4 30.5 30.2 32.0 30.0 N/A 31.4
VirginiaWomen in category Number 389 757 9,597 66 16,996 385 208 28,398Percent reporting weight gain % 4.9 5.3 5.1 3.0 5.5 3.1 0.0 5.2Mean Pounds 15.6 11.7 16.2 17.5 15.2 13.3 N/A 15.4
Virgin IslandsWomen in category Number a a 976 a 67 7 8 1,058Percent reporting weight gain % a a 6.9 a 7.5 14.3 12.5 7.0Mean Pounds a a 15.0 a 9.6 1.0 18.0 14.5
West VirginiaWomen in category Number 45 30 250 a 5,510 146 a 5,982Percent reporting weight gain % 95.6 100.0 92.8 a 95.1 94.5 a 95.1Mean Pounds 28.6 31.2 30.5 a 31.2 32.4 a 31.2
SoutheastFlorida
Women in category Number 2,011 1,021 24,089 200 53,495 1,153 0 81,969Percent reporting weight gain % 80.9 88.1 86.3 90.0 88.9 88.1 N/A 87.9Mean Pounds 26.1 29.6 29.6 31.0 31.7 31.5 N/A 31.0
North CarolinaWomen in category Number 758 724 12,138 57 22,871 95 2,428 39,071Percent reporting weight gain % 71.6 73.1 69.4 75.4 72.3 61.1 72.6 71.4Mean Pounds 27.8 27.2 27.4 32.9 28.1 29.8 27.1 27.8
South CarolinaWomen in category Number 53 224 10,717 32 12,851 114 31 24,022Percent reporting weight gain % 94.3 95.5 94.4 90.6 94.9 90.4 96.8 94.6Mean Pounds 30.6 30.6 30.8 40.8 33.1 31.0 27.3 32.0
TennesseeWomen in category Number 0 185 7,118 15 19,154 61 133 26,666Percent reporting weight gain % N/A 100.0 99.2 93.3 98.8 100.0 97.7 98.9Mean Pounds N/A 28.4 30.3 30.6 31.1 29.7 27.7 30.9
Eastern Band-Cherokee (NC)Women in category Number 71 a a a 10 a 1 82Percent reporting weight gain % 54.9 a a a 50.0 a 100.0 54.9Mean Pounds 28.7 a a a 35.6 a 29.0 29.5
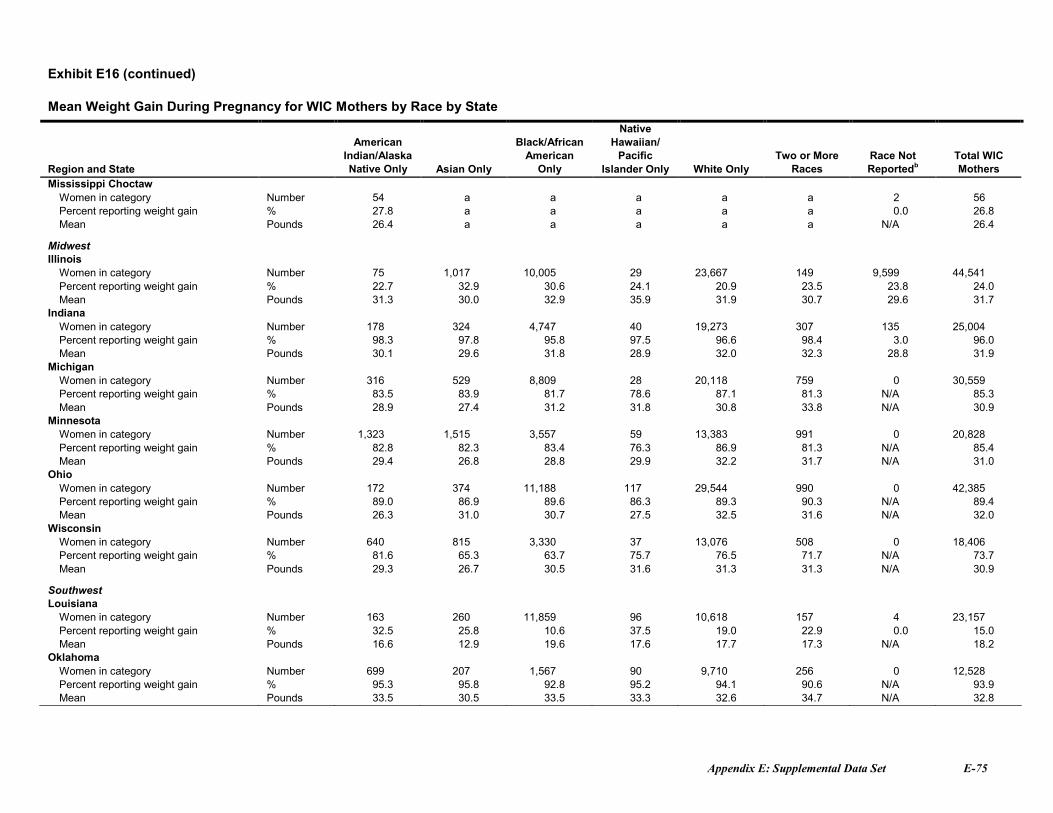
Appendix E: Supplemental Data Set E-75
Exhibit E16 (continued)
Mean Weight Gain During Pregnancy for WIC Mothers by Race by State
Region and State
AmericanIndian/AlaskaNative Only Asian Only
Black/AfricanAmerican
Only
NativeHawaiian/
PacificIslander Only White Only
Two or MoreRaces
Race NotReportedb
Total WICMothers
Mississippi ChoctawWomen in category Number 54 a a a a a 2 56Percent reporting weight gain % 27.8 a a a a a 0.0 26.8Mean Pounds 26.4 a a a a a N/A 26.4
MidwestIllinois
Women in category Number 75 1,017 10,005 29 23,667 149 9,599 44,541Percent reporting weight gain % 22.7 32.9 30.6 24.1 20.9 23.5 23.8 24.0Mean Pounds 31.3 30.0 32.9 35.9 31.9 30.7 29.6 31.7
IndianaWomen in category Number 178 324 4,747 40 19,273 307 135 25,004Percent reporting weight gain % 98.3 97.8 95.8 97.5 96.6 98.4 3.0 96.0Mean Pounds 30.1 29.6 31.8 28.9 32.0 32.3 28.8 31.9
MichiganWomen in category Number 316 529 8,809 28 20,118 759 0 30,559Percent reporting weight gain % 83.5 83.9 81.7 78.6 87.1 81.3 N/A 85.3Mean Pounds 28.9 27.4 31.2 31.8 30.8 33.8 N/A 30.9
MinnesotaWomen in category Number 1,323 1,515 3,557 59 13,383 991 0 20,828Percent reporting weight gain % 82.8 82.3 83.4 76.3 86.9 81.3 N/A 85.4Mean Pounds 29.4 26.8 28.8 29.9 32.2 31.7 N/A 31.0
OhioWomen in category Number 172 374 11,188 117 29,544 990 0 42,385Percent reporting weight gain % 89.0 86.9 89.6 86.3 89.3 90.3 N/A 89.4Mean Pounds 26.3 31.0 30.7 27.5 32.5 31.6 N/A 32.0
WisconsinWomen in category Number 640 815 3,330 37 13,076 508 0 18,406Percent reporting weight gain % 81.6 65.3 63.7 75.7 76.5 71.7 N/A 73.7Mean Pounds 29.3 26.7 30.5 31.6 31.3 31.3 N/A 30.9
SouthwestLouisiana
Women in category Number 163 260 11,859 96 10,618 157 4 23,157Percent reporting weight gain % 32.5 25.8 10.6 37.5 19.0 22.9 0.0 15.0Mean Pounds 16.6 12.9 19.6 17.6 17.7 17.3 N/A 18.2
OklahomaWomen in category Number 699 207 1,567 90 9,710 256 0 12,528Percent reporting weight gain % 95.3 95.8 92.8 95.2 94.1 90.6 N/A 93.9Mean Pounds 33.5 30.5 33.5 33.3 32.6 34.7 N/A 32.8
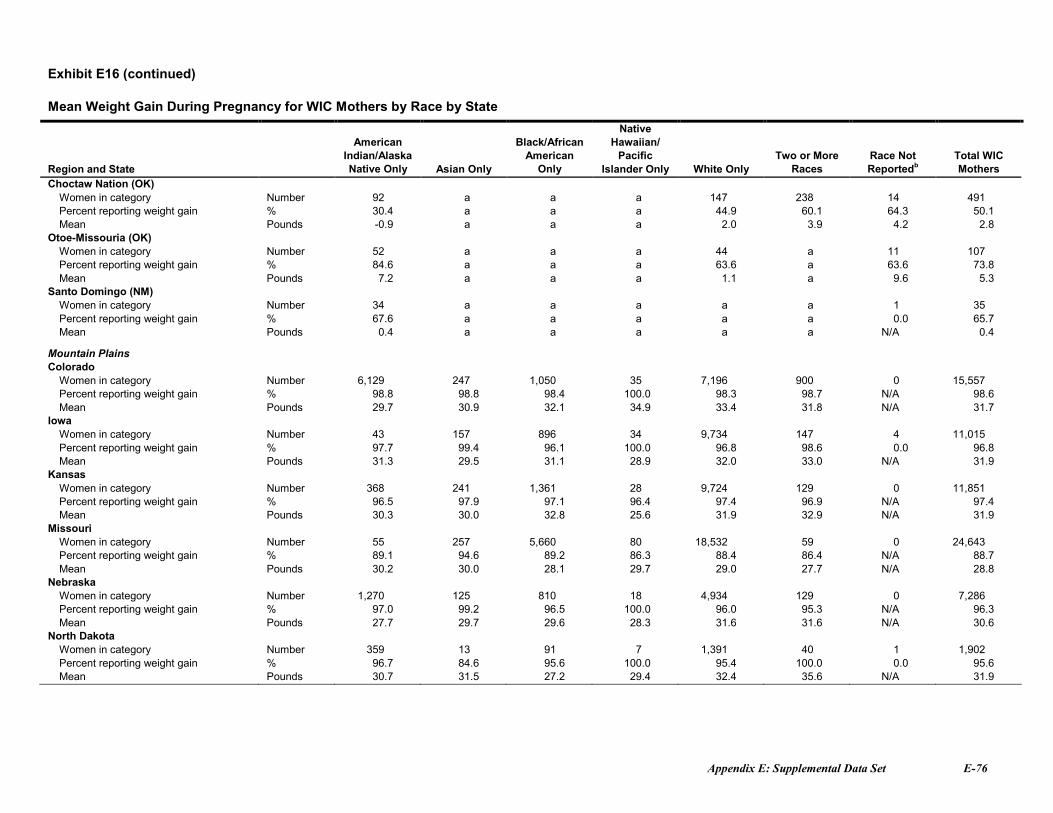
Appendix E: Supplemental Data Set E-76
Exhibit E16 (continued)
Mean Weight Gain During Pregnancy for WIC Mothers by Race by State
Region and State
AmericanIndian/AlaskaNative Only Asian Only
Black/AfricanAmerican
Only
NativeHawaiian/
PacificIslander Only White Only
Two or MoreRaces
Race NotReportedb
Total WICMothers
Choctaw Nation (OK)Women in category Number 92 a a a 147 238 14 491Percent reporting weight gain % 30.4 a a a 44.9 60.1 64.3 50.1Mean Pounds -0.9 a a a 2.0 3.9 4.2 2.8
Otoe-Missouria (OK)Women in category Number 52 a a a 44 a 11 107Percent reporting weight gain % 84.6 a a a 63.6 a 63.6 73.8Mean Pounds 7.2 a a a 1.1 a 9.6 5.3
Santo Domingo (NM)Women in category Number 34 a a a a a 1 35Percent reporting weight gain % 67.6 a a a a a 0.0 65.7Mean Pounds 0.4 a a a a a N/A 0.4
Mountain PlainsColorado
Women in category Number 6,129 247 1,050 35 7,196 900 0 15,557Percent reporting weight gain % 98.8 98.8 98.4 100.0 98.3 98.7 N/A 98.6Mean Pounds 29.7 30.9 32.1 34.9 33.4 31.8 N/A 31.7
IowaWomen in category Number 43 157 896 34 9,734 147 4 11,015Percent reporting weight gain % 97.7 99.4 96.1 100.0 96.8 98.6 0.0 96.8Mean Pounds 31.3 29.5 31.1 28.9 32.0 33.0 N/A 31.9
KansasWomen in category Number 368 241 1,361 28 9,724 129 0 11,851Percent reporting weight gain % 96.5 97.9 97.1 96.4 97.4 96.9 N/A 97.4Mean Pounds 30.3 30.0 32.8 25.6 31.9 32.9 N/A 31.9
MissouriWomen in category Number 55 257 5,660 80 18,532 59 0 24,643Percent reporting weight gain % 89.1 94.6 89.2 86.3 88.4 86.4 N/A 88.7Mean Pounds 30.2 30.0 28.1 29.7 29.0 27.7 N/A 28.8
NebraskaWomen in category Number 1,270 125 810 18 4,934 129 0 7,286Percent reporting weight gain % 97.0 99.2 96.5 100.0 96.0 95.3 N/A 96.3Mean Pounds 27.7 29.7 29.6 28.3 31.6 31.6 N/A 30.6
North DakotaWomen in category Number 359 13 91 7 1,391 40 1 1,902Percent reporting weight gain % 96.7 84.6 95.6 100.0 95.4 100.0 0.0 95.6Mean Pounds 30.7 31.5 27.2 29.4 32.4 35.6 N/A 31.9

Appendix E: Supplemental Data Set E-77
Exhibit E16 (continued)
Mean Weight Gain During Pregnancy for WIC Mothers by Race by State
Region and State
AmericanIndian/AlaskaNative Only Asian Only
Black/AfricanAmerican
Only
NativeHawaiian/
PacificIslander Only White Only
Two or MoreRaces
Race NotReportedb
Total WICMothers
UtahWomen in category Number 196 178 188 189 10,926 74 169 11,920Percent reporting weight gain % 72.4 73.0 69.7 65.1 75.1 70.3 63.3 74.6Mean Pounds 36.1 30.8 29.8 37.4 30.4 29.1 29.1 30.5
WyomingWomen in category Number 58 13 21 a 1,532 28 115 1,767Percent reporting weight gain % 100.0 100.0 100.0 a 96.8 100.0 83.5 96.2Mean Pounds 30.1 28.5 27.3 a 29.2 25.3 30.2 29.2
Cheyenne River Sioux (SD)Women in category Number 40 0 0 0 0 29 0 69Percent reporting weight gain % 87.5 N/A N/A N/A N/A 100.0 N/A 92.8Mean Pounds 25.2 N/A N/A N/A N/A 30.7 N/A 27.7
Eastern Shoshone (WY)Women in category Number 26 a a a a a 1 27Percent reporting weight gain % 84.6 a a a a a 100.0 85.2Mean Pounds 32.9 a a a a a 54.0 33.8
Northern Arapahoe (WY)Women in category Number 73 0 0 0 a a 5 78Percent reporting weight gain % 49.3 N/A N/A N/A a a 40.0 48.7Mean Pounds 28.7 N/A N/A N/A a a 32.3 28.9
Omaha Nation (NE)Women in category Number 10 a a a a a 1 11Percent reporting weight gain % 80.0 a a a a a 0.0 72.7Mean Pounds 33.4 a a a a a N/A 33.4
Rosebud Sioux (SD)Women in category Number 139 0 0 0 a a 6 145Percent reporting weight gain % 65.5 N/A N/A N/A a a 50.0 64.8Mean Pounds 26.7 N/A N/A N/A a a 16.6 26.4
Standing Rock Sioux (ND)Women in category Number 86 0 0 0 a a 4 90Percent reporting weight gain % 91.9 N/A N/A N/A a a 100.0 92.2Mean Pounds 24.6 N/A N/A N/A a a 36.4 25.2
Three Affiliated (ND)Women in category Number 14 0 0 0 0 a 5 19Percent reporting weight gain % 78.6 N/A N/A N/A N/A a 100.0 84.2Mean Pounds 32.9 N/A N/A N/A N/A a 26.0 30.8
Ute Mountain Ute (CO)Women in category Number 19 0 0 0 0 0 0 19Percent reporting weight gain % 15.8 N/A N/A N/A N/A N/A N/A 15.8Mean Pounds 23.0 N/A N/A N/A N/A N/A N/A 23.0

Appendix E: Supplemental Data Set E-78
Exhibit E16 (continued)
Mean Weight Gain During Pregnancy for WIC Mothers by Race by State
Region and State
AmericanIndian/AlaskaNative Only Asian Only
Black/AfricanAmerican
Only
NativeHawaiian/
PacificIslander Only White Only
Two or MoreRaces
Race NotReportedb
Total WICMothers
WesternArizona
Women in category Number 709 300 1,507 121 28,380 483 0 31,500Percent reporting weight gain % 76.2 83.3 74.1 78.5 78.2 83.4 N/A 78.1Mean Pounds 34.0 32.2 35.4 34.3 33.0 34.5 N/A 33.1
GuamWomen in category Number a 166 a 699 34 a 8 905Percent reporting weight gain % a 83.6 a 81.4 87.9 a 75.0 82.0Mean Pounds a 28.3 a 31.7 32.2 a 29.9 31.0
IdahoWomen in category Number 359 75 72 21 6,452 84 0 7,063Percent reporting weight gain % 97.5 97.3 97.2 100.0 98.3 98.8 N/A 98.2Mean Pounds 29.1 30.1 28.0 29.9 31.5 32.3 N/A 31.4
ITC-ArizonaWomen in category Number 1,603 6 13 a 313 35 2 1,972Percent reporting weight gain % 96.2 100.0 100.0 a 96.8 97.1 100.0 96.3Mean Pounds 30.4 20.3 30.2 a 30.8 34.5 24.0 30.5
Notes
The group labeled WIC mothers is comprised of all women certified as breastfeeding or postpartum.a Data not reported due to small cell size.b Includes categories with cell sizes too small to be reported separately.
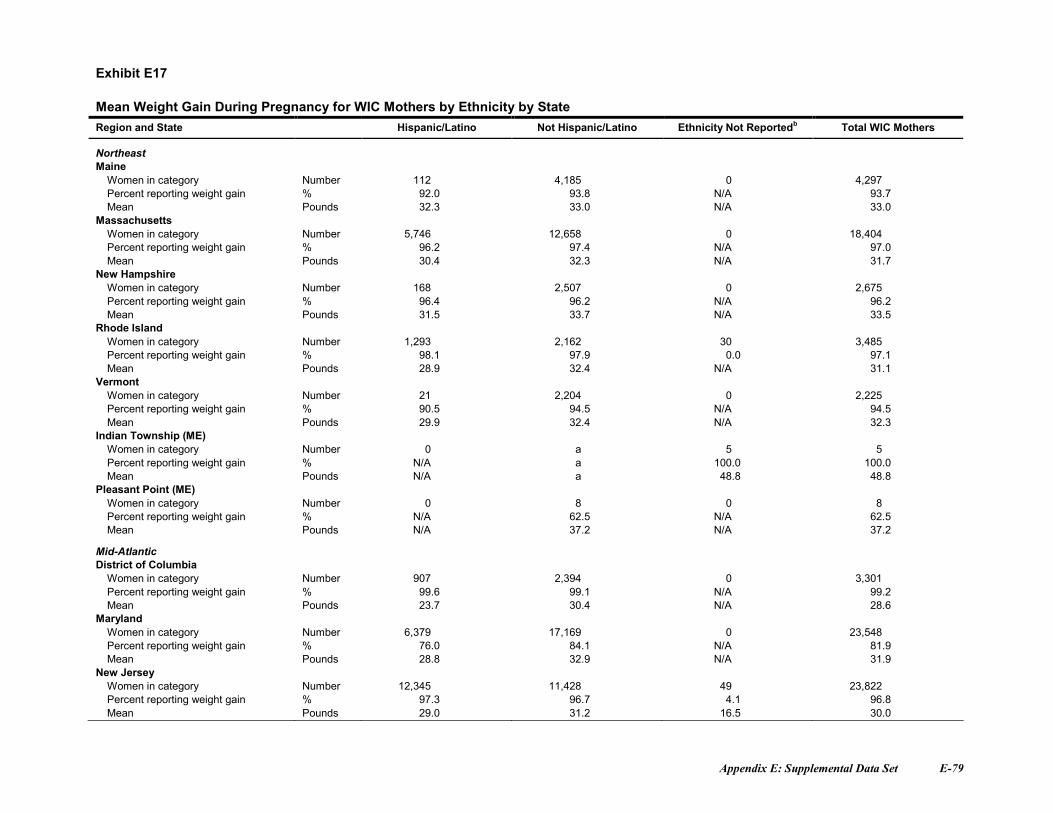
Appendix E: Supplemental Data Set E-79
Exhibit E17
Mean Weight Gain During Pregnancy for WIC Mothers by Ethnicity by StateRegion and State Hispanic/Latino Not Hispanic/Latino Ethnicity Not Reportedb Total WIC Mothers
NortheastMaine
Women in category Number 112 4,185 0 4,297Percent reporting weight gain % 92.0 93.8 N/A 93.7Mean Pounds 32.3 33.0 N/A 33.0
MassachusettsWomen in category Number 5,746 12,658 0 18,404Percent reporting weight gain % 96.2 97.4 N/A 97.0Mean Pounds 30.4 32.3 N/A 31.7
New HampshireWomen in category Number 168 2,507 0 2,675Percent reporting weight gain % 96.4 96.2 N/A 96.2Mean Pounds 31.5 33.7 N/A 33.5
Rhode IslandWomen in category Number 1,293 2,162 30 3,485Percent reporting weight gain % 98.1 97.9 0.0 97.1Mean Pounds 28.9 32.4 N/A 31.1
VermontWomen in category Number 21 2,204 0 2,225Percent reporting weight gain % 90.5 94.5 N/A 94.5Mean Pounds 29.9 32.4 N/A 32.3
Indian Township (ME)Women in category Number 0 a 5 5Percent reporting weight gain % N/A a 100.0 100.0Mean Pounds N/A a 48.8 48.8
Pleasant Point (ME)Women in category Number 0 8 0 8Percent reporting weight gain % N/A 62.5 N/A 62.5Mean Pounds N/A 37.2 N/A 37.2
Mid-AtlanticDistrict of Columbia
Women in category Number 907 2,394 0 3,301Percent reporting weight gain % 99.6 99.1 N/A 99.2Mean Pounds 23.7 30.4 N/A 28.6
MarylandWomen in category Number 6,379 17,169 0 23,548Percent reporting weight gain % 76.0 84.1 N/A 81.9Mean Pounds 28.8 32.9 N/A 31.9
New JerseyWomen in category Number 12,345 11,428 49 23,822Percent reporting weight gain % 97.3 96.7 4.1 96.8Mean Pounds 29.0 31.2 16.5 30.0
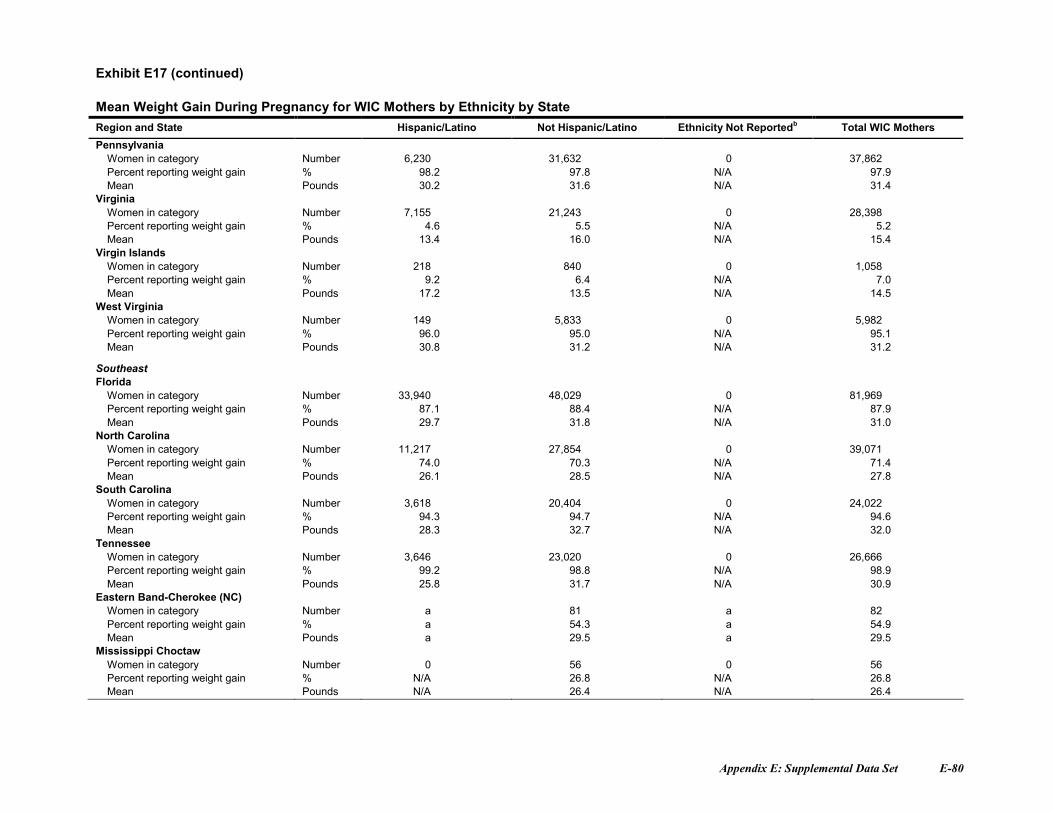
Appendix E: Supplemental Data Set E-80
Exhibit E17 (continued)
Mean Weight Gain During Pregnancy for WIC Mothers by Ethnicity by StateRegion and State Hispanic/Latino Not Hispanic/Latino Ethnicity Not Reportedb Total WIC Mothers
PennsylvaniaWomen in category Number 6,230 31,632 0 37,862Percent reporting weight gain % 98.2 97.8 N/A 97.9Mean Pounds 30.2 31.6 N/A 31.4
VirginiaWomen in category Number 7,155 21,243 0 28,398Percent reporting weight gain % 4.6 5.5 N/A 5.2Mean Pounds 13.4 16.0 N/A 15.4
Virgin IslandsWomen in category Number 218 840 0 1,058Percent reporting weight gain % 9.2 6.4 N/A 7.0Mean Pounds 17.2 13.5 N/A 14.5
West VirginiaWomen in category Number 149 5,833 0 5,982Percent reporting weight gain % 96.0 95.0 N/A 95.1Mean Pounds 30.8 31.2 N/A 31.2
SoutheastFlorida
Women in category Number 33,940 48,029 0 81,969Percent reporting weight gain % 87.1 88.4 N/A 87.9Mean Pounds 29.7 31.8 N/A 31.0
North CarolinaWomen in category Number 11,217 27,854 0 39,071Percent reporting weight gain % 74.0 70.3 N/A 71.4Mean Pounds 26.1 28.5 N/A 27.8
South CarolinaWomen in category Number 3,618 20,404 0 24,022Percent reporting weight gain % 94.3 94.7 N/A 94.6Mean Pounds 28.3 32.7 N/A 32.0
TennesseeWomen in category Number 3,646 23,020 0 26,666Percent reporting weight gain % 99.2 98.8 N/A 98.9Mean Pounds 25.8 31.7 N/A 30.9
Eastern Band-Cherokee (NC)Women in category Number a 81 a 82Percent reporting weight gain % a 54.3 a 54.9Mean Pounds a 29.5 a 29.5
Mississippi ChoctawWomen in category Number 0 56 0 56Percent reporting weight gain % N/A 26.8 N/A 26.8Mean Pounds N/A 26.4 N/A 26.4
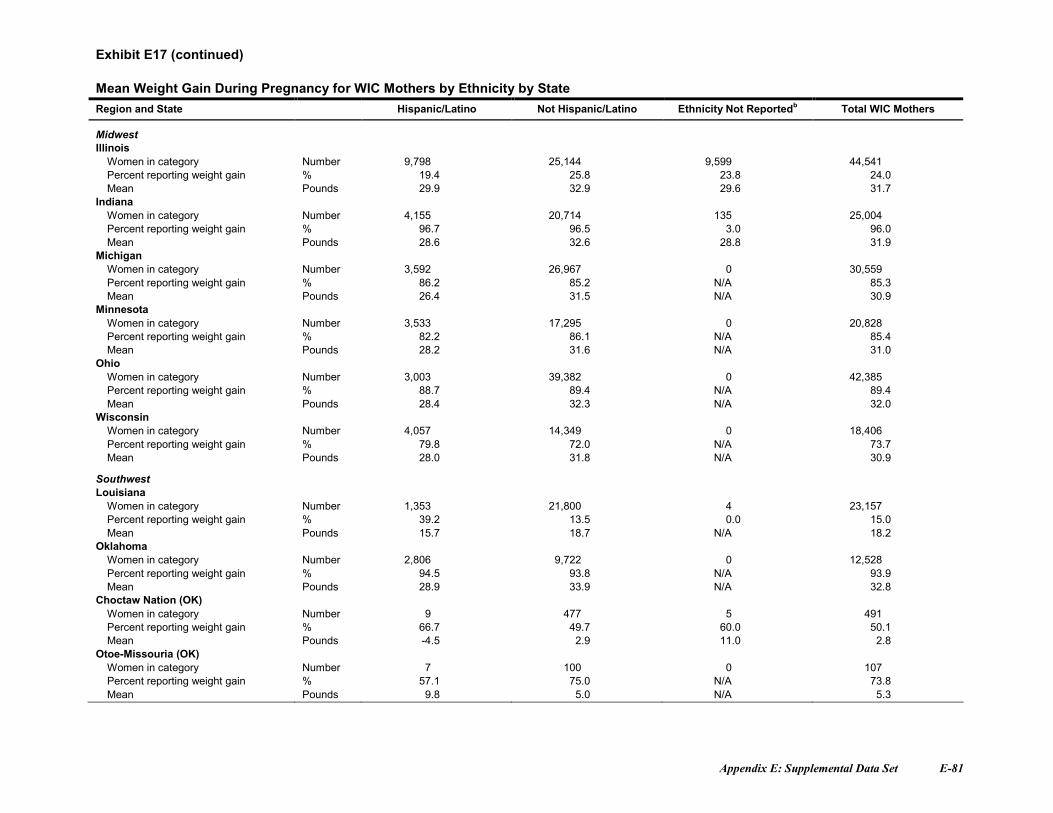
Appendix E: Supplemental Data Set E-81
Exhibit E17 (continued)
Mean Weight Gain During Pregnancy for WIC Mothers by Ethnicity by StateRegion and State Hispanic/Latino Not Hispanic/Latino Ethnicity Not Reportedb Total WIC Mothers
MidwestIllinois
Women in category Number 9,798 25,144 9,599 44,541Percent reporting weight gain % 19.4 25.8 23.8 24.0Mean Pounds 29.9 32.9 29.6 31.7
IndianaWomen in category Number 4,155 20,714 135 25,004Percent reporting weight gain % 96.7 96.5 3.0 96.0Mean Pounds 28.6 32.6 28.8 31.9
MichiganWomen in category Number 3,592 26,967 0 30,559Percent reporting weight gain % 86.2 85.2 N/A 85.3Mean Pounds 26.4 31.5 N/A 30.9
MinnesotaWomen in category Number 3,533 17,295 0 20,828Percent reporting weight gain % 82.2 86.1 N/A 85.4Mean Pounds 28.2 31.6 N/A 31.0
OhioWomen in category Number 3,003 39,382 0 42,385Percent reporting weight gain % 88.7 89.4 N/A 89.4Mean Pounds 28.4 32.3 N/A 32.0
WisconsinWomen in category Number 4,057 14,349 0 18,406Percent reporting weight gain % 79.8 72.0 N/A 73.7Mean Pounds 28.0 31.8 N/A 30.9
SouthwestLouisiana
Women in category Number 1,353 21,800 4 23,157Percent reporting weight gain % 39.2 13.5 0.0 15.0Mean Pounds 15.7 18.7 N/A 18.2
OklahomaWomen in category Number 2,806 9,722 0 12,528Percent reporting weight gain % 94.5 93.8 N/A 93.9Mean Pounds 28.9 33.9 N/A 32.8
Choctaw Nation (OK)Women in category Number 9 477 5 491Percent reporting weight gain % 66.7 49.7 60.0 50.1Mean Pounds -4.5 2.9 11.0 2.8
Otoe-Missouria (OK)Women in category Number 7 100 0 107Percent reporting weight gain % 57.1 75.0 N/A 73.8Mean Pounds 9.8 5.0 N/A 5.3
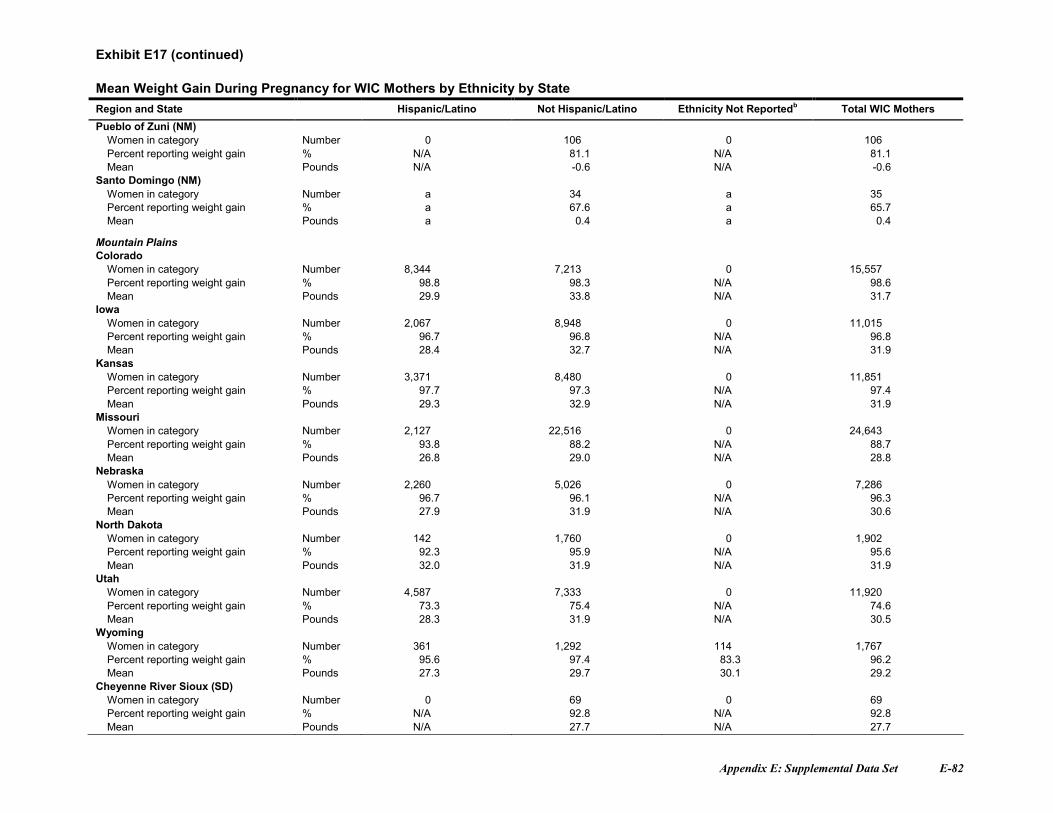
Appendix E: Supplemental Data Set E-82
Exhibit E17 (continued)
Mean Weight Gain During Pregnancy for WIC Mothers by Ethnicity by StateRegion and State Hispanic/Latino Not Hispanic/Latino Ethnicity Not Reportedb Total WIC Mothers
Pueblo of Zuni (NM)Women in category Number 0 106 0 106Percent reporting weight gain % N/A 81.1 N/A 81.1Mean Pounds N/A -0.6 N/A -0.6
Santo Domingo (NM)Women in category Number a 34 a 35Percent reporting weight gain % a 67.6 a 65.7Mean Pounds a 0.4 a 0.4
Mountain PlainsColorado
Women in category Number 8,344 7,213 0 15,557Percent reporting weight gain % 98.8 98.3 N/A 98.6Mean Pounds 29.9 33.8 N/A 31.7
IowaWomen in category Number 2,067 8,948 0 11,015Percent reporting weight gain % 96.7 96.8 N/A 96.8Mean Pounds 28.4 32.7 N/A 31.9
KansasWomen in category Number 3,371 8,480 0 11,851Percent reporting weight gain % 97.7 97.3 N/A 97.4Mean Pounds 29.3 32.9 N/A 31.9
MissouriWomen in category Number 2,127 22,516 0 24,643Percent reporting weight gain % 93.8 88.2 N/A 88.7Mean Pounds 26.8 29.0 N/A 28.8
NebraskaWomen in category Number 2,260 5,026 0 7,286Percent reporting weight gain % 96.7 96.1 N/A 96.3Mean Pounds 27.9 31.9 N/A 30.6
North DakotaWomen in category Number 142 1,760 0 1,902Percent reporting weight gain % 92.3 95.9 N/A 95.6Mean Pounds 32.0 31.9 N/A 31.9
UtahWomen in category Number 4,587 7,333 0 11,920Percent reporting weight gain % 73.3 75.4 N/A 74.6Mean Pounds 28.3 31.9 N/A 30.5
WyomingWomen in category Number 361 1,292 114 1,767Percent reporting weight gain % 95.6 97.4 83.3 96.2Mean Pounds 27.3 29.7 30.1 29.2
Cheyenne River Sioux (SD)Women in category Number 0 69 0 69Percent reporting weight gain % N/A 92.8 N/A 92.8Mean Pounds N/A 27.7 N/A 27.7

Appendix E: Supplemental Data Set E-83
Exhibit E17 (continued)
Mean Weight Gain During Pregnancy for WIC Mothers by Ethnicity by StateRegion and State Hispanic/Latino Not Hispanic/Latino Ethnicity Not Reportedb Total WIC Mothers
Eastern Shoshone (WY)Women in category Number a 26 a 27Percent reporting weight gain % a 84.6 a 85.2Mean Pounds a 32.9 a 33.8
Northern Arapahoe (WY)Women in category Number a 73 5 78Percent reporting weight gain % a 49.3 40.0 48.7Mean Pounds a 28.9 27.8 28.9
Omaha Nation (NE)Women in category Number 0 11 0 11Percent reporting weight gain % N/A 72.7 N/A 72.7Mean Pounds N/A 33.4 N/A 33.4
Rosebud Sioux (SD)Women in category Number a 144 a 145Percent reporting weight gain % a 65.3 a 64.8Mean Pounds a 26.4 a 26.4
Standing Rock Sioux (ND)Women in category Number 0 90 0 90Percent reporting weight gain % N/A 92.2 N/A 92.2Mean Pounds N/A 25.2 N/A 25.2
Three Affiliated (ND)Women in category Number a 16 3 19Percent reporting weight gain % a 81.3 100.0 84.2Mean Pounds a 32.9 21.7 30.8
Ute Mountain Ute (CO)Women in category Number 0 19 0 19Percent reporting weight gain % N/A 15.8 N/A 15.8Mean Pounds N/A 23.0 N/A 23.0
WesternArizona
Women in category Number 21,289 10,211 0 31,500Percent reporting weight gain % 77.0 80.2 N/A 78.1Mean Pounds 31.8 35.9 N/A 33.1
GuamWomen in category Number 7 899 0 905Percent reporting weight gain % 89.3 82.0 N/A 82.0Mean Pounds 32.5 31.0 N/A 31.0
IdahoWomen in category Number 1,921 5,142 0 7,063Percent reporting weight gain % 98.8 98.1 N/A 98.2Mean Pounds 29.3 32.1 N/A 31.4
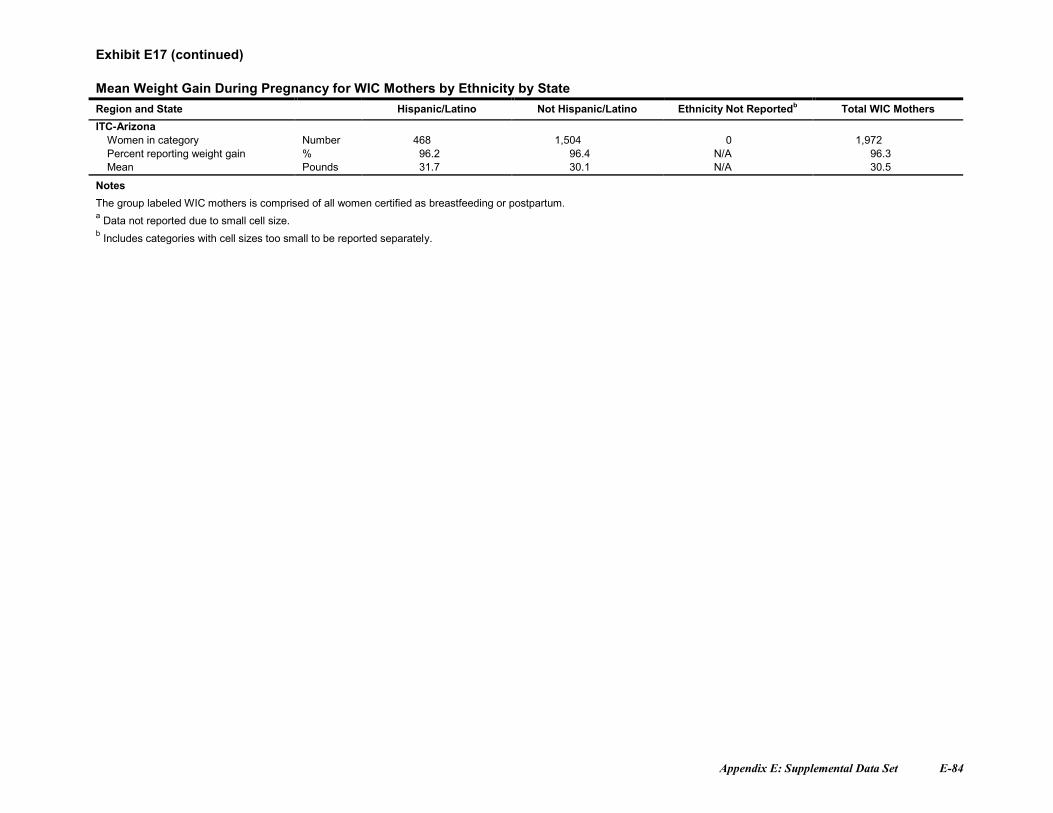
Appendix E: Supplemental Data Set E-84
Exhibit E17 (continued)
Mean Weight Gain During Pregnancy for WIC Mothers by Ethnicity by StateRegion and State Hispanic/Latino Not Hispanic/Latino Ethnicity Not Reportedb Total WIC Mothers
ITC-ArizonaWomen in category Number 468 1,504 0 1,972Percent reporting weight gain % 96.2 96.4 N/A 96.3Mean Pounds 31.7 30.1 N/A 30.5
Notes
The group labeled WIC mothers is comprised of all women certified as breastfeeding or postpartum.a Data not reported due to small cell size.b Includes categories with cell sizes too small to be reported separately.
Appendix E: Supplemental Data Set E-85
Exhibit E18
Lapsed Time In Months Between Last and Current Pregnancies for Pregnant Women WIC Participants by State
Under Six Months 6-11 Months 12-16 Months 17-23 Months 2 or More Years
No PreviousPregnancyReported *
Exp. Date orGestation Not
Reported
Certification DateNot Reported
TotalPregnant
WICWomen
Region and State Number Percent Number Percent Number Percent Number Percent Number Percent Number Percent Number Percent Number Percent Number
NortheastConnecticut 471 7.0 535 7.9 351 5.2 429 6.4 2,278 33.7 2,637 39.0 52 0.8 0 0.0 6,753Massachusetts 1,105 7.6 1,267 8.7 898 6.2 940 6.5 4,898 33.7 5,425 37.3 18 0.1 0 0.0 14,551New Hampshire 92 4.1 130 5.8 72 3.2 82 3.7 316 14.2 1,532 68.8 2 0.1 0 0.0 2,226Rhode Island 242 7.6 246 7.8 194 6.1 202 6.4 1,012 31.9 1,231 38.8 9 0.3 34 1.1 3,170Indian Township (ME) 0 0.0 1 16.7 1 16.7 0 0.0 1 16.7 3 50.0 0 0.0 0 0.0 6Pleasant Point (ME) 2 16.7 0 0.0 0 0.0 1 8.3 3 25.0 6 50.0 0 0.0 0 0.0 12Seneca Nation (NY) 2 5.9 0 0.0 2 5.9 1 2.9 5 14.7 23 67.6 1 2.9 0 0.0 34
Mid-AtlanticDistrict of Columbia 92 5.2 141 8.0 83 4.7 95 5.4 557 31.5 801 45.3 1 0.1 0 0.0 1,770Maryland 891 6.2 1,224 8.6 848 5.9 1,048 7.3 4,812 33.7 5,453 38.2 10 0.1 1 0.0 14,287New Jersey 712 4.8 1,024 6.9 762 5.2 850 5.8 4,784 32.4 6,426 43.6 185 1.3 0 0.0 14,743Puerto Rico 1,288 5.7 1,560 6.9 1,103 4.8 1,149 5.0 6,256 27.5 11,388 50.0 5 0.0 17 0.1 22,766Virginia 1,150 7.6 1,435 9.5 974 6.4 1,070 7.1 4,884 32.3 5,596 37.0 22 0.1 0 0.0 15,131Virgin Islands 17 4.6 25 6.7 23 6.2 16 4.3 111 29.8 181 48.5 0 0.0 0 0.0 373West Virginia 294 4.3 478 7.1 412 6.1 414 6.1 1,810 26.8 3,353 49.6 0 0.0 4 0.1 6,765
SoutheastAlabama 1,022 5.6 1,249 6.8 1,013 5.5 1,118 6.1 5,766 31.4 8,150 44.3 59 0.3 0 0.0 18,377Florida 3,887 6.3 4,874 8.0 3,503 5.7 3,638 5.9 17,377 28.4 27,945 45.6 2 0.0 0 0.0 61,226South Carolina 154 0.9 422 2.5 423 2.5 165 1.0 11 0.1 15,340 91.4 260 1.5 4 0.0 16,779Mississippi Choctaw 21 16.3 17 13.2 13 10.1 12 9.3 27 20.9 37 28.7 2 1.6 0 0.0 129
MidwestIllinois 1,004 2.5 1,769 4.4 1,511 3.7 1,868 4.6 9,710 23.9 12,431 30.6 12,271 30.3 0 0.0 40,564Indiana 1,530 8.7 1,896 10.8 1,311 7.4 1,306 7.4 4,920 28.0 6,535 37.1 103 0.6 1 0.0 17,602Michigan 2,615 9.5 2,722 9.9 1,891 6.9 2,036 7.4 7,716 28.1 10,466 38.1 18 0.1 0 0.0 27,464Minnesota 1,352 8.8 1,621 10.5 1,103 7.2 1,091 7.1 3,584 23.2 6,627 43.0 40 0.3 0 0.0 15,418Ohio 2,799 9.8 3,071 10.7 2,209 7.7 2,144 7.5 7,542 26.4 10,738 37.6 69 0.2 0 0.0 28,572Wisconsin 1,314 9.6 1,543 11.3 1,096 8.0 1,111 8.1 3,981 29.2 4,594 33.7 11 0.1 0 0.0 13,650
SouthwestOklahoma 1,124 8.9 1,326 10.4 876 6.9 998 7.9 3,642 28.7 4,626 36.4 99 0.8 1 0.0 12,692ACL (NM) 4 8.5 0 0.0 2 4.3 2 4.3 11 23.4 26 55.3 2 4.3 0 0.0 47Chickasaw Nation (OK) 37 9.7 41 10.7 20 5.2 33 8.6 110 28.7 137 35.8 5 1.3 0 0.0 383Choctaw Nation (OK) 24 7.6 24 7.6 21 6.6 22 6.9 74 23.3 146 46.1 6 1.9 0 0.0 317Eight Northern Pueblos (NM) 4 19.0 0 0.0 3 14.3 2 9.5 3 14.3 9 42.9 0 0.0 0 0.0 21Five Sandoval Pueblos (NM) 1 2.3 2 4.5 1 2.3 1 2.3 13 29.5 14 31.8 12 27.3 0 0.0 44ITC-Oklahoma 5 6.8 13 17.6 4 5.4 3 4.1 20 27.0 29 39.2 0 0.0 0 0.0 74Muscogee Creek Nation (OK) 19 7.3 41 15.6 20 7.6 19 7.3 64 24.4 98 37.4 1 0.4 0 0.0 262Osage Nation (OK) 9 4.5 21 10.6 15 7.5 10 5.0 48 24.1 82 41.2 14 7.0 0 0.0 199
Appendix E: Supplemental Data Set E-86
Exhibit E18 (continued)
Lapsed Time In Months Between Last and Current Pregnancies for Pregnant Women In WIC Participants by State
Under Six Months 6-11 Months 12-16 Months 17-23 Months 2 or More Years
No PreviousPregnancyReported *
Exp. Date orGestation Not
Reported
Certification DateNot Reported
TotalPregnant
WICWomen
Region and State Number Percent Number Percent Number Percent Number Percent Number Percent Number Percent Number Percent Number Percent Number
Otoe-Missouria (OK) 8 10.3 14 17.9 4 5.1 5 6.4 20 25.6 26 33.3 1 1.3 0 0.0 78Pueblo of San Felipe (NM) 0 0.0 2 7.7 1 3.8 1 3.8 10 38.5 12 46.2 0 0.0 0 0.0 26Pueblo of Zuni (NM) 5 6.3 5 6.3 6 7.6 8 10.1 25 31.6 27 34.2 3 3.8 0 0.0 79Santo Domingo (NM) 2 11.1 1 5.6 0 0.0 0 0.0 9 50.0 6 33.3 0 0.0 0 0.0 18WCD (OK) 33 10.8 34 11.1 21 6.9 22 7.2 91 29.7 98 32.0 7 2.3 0 0.0 306
Mountain PlainsColorado 817 8.3 1,001 10.2 761 7.7 754 7.7 3,224 32.8 3,213 32.7 50 0.5 1 0.0 9,821Iowa 760 9.7 840 10.7 568 7.2 637 8.1 2,038 26.0 2,955 37.7 42 0.5 0 0.0 7,840Kansas 742 9.3 842 10.6 556 7.0 587 7.4 2,110 26.5 3,115 39.2 0 0.0 1 0.0 7,953Missouri 1,445 8.0 1,853 10.2 1,276 7.0 1,331 7.3 5,001 27.6 7,245 39.9 0 0.0 0 0.0 18,151Montana 226 7.8 293 10.1 248 8.5 231 7.9 684 23.5 909 31.2 315 10.8 6 0.2 2,912Nebraska 450 9.4 501 10.5 324 6.8 373 7.8 1,425 29.9 1,688 35.4 7 0.1 0 0.0 4,768North Dakota 158 9.3 164 9.6 130 7.6 141 8.3 446 26.2 660 38.8 4 0.2 0 0.0 1,703Utah 460 6.3 607 8.3 457 6.3 458 6.3 897 12.3 2,818 38.7 1,572 21.6 6 0.1 7,275Wyoming 132 8.8 158 10.6 109 7.3 123 8.2 359 24.0 591 39.5 22 1.5 1 0.1 1,495Cheyenne River Sioux (SD) 6 7.2 3 3.6 12 14.5 8 9.6 32 38.6 22 26.5 0 0.0 0 0.0 83Eastern Shoshone (WY) 0 0.0 3 10.0 0 0.0 0 0.0 8 26.7 18 60.0 1 3.3 0 0.0 30Northern Arapaho (WY) 1 1.5 3 4.6 3 4.6 5 7.7 22 33.8 29 44.6 2 3.1 0 0.0 65Omaha Nation (NE) 9 21.4 6 14.3 2 4.8 1 2.4 7 16.7 17 40.5 0 0.0 0 0.0 42Rosebud Sioux (SD) 7 6.4 22 20.0 11 10.0 6 5.5 31 28.2 33 30.0 0 0.0 0 0.0 110Santee Sioux (NE) 2 10.0 0 0.0 1 5.0 0 0.0 2 10.0 15 75.0 0 0.0 0 0.0 20Standing Rock Sioux (ND) 11 11.5 6 6.3 6 6.3 6 6.3 38 39.6 27 28.1 2 2.1 0 0.0 96Three Affiliated (ND) 2 3.5 4 7.0 3 5.3 3 5.3 14 24.6 31 54.4 0 0.0 0 0.0 57Ute Mountain Ute (CO) 0 0.0 0 0.0 1 5.6 0 0.0 5 27.8 12 66.7 0 0.0 0 0.0 18Winnebago (NE) 3 12.5 1 4.2 0 0.0 1 4.2 1 4.2 17 70.8 1 4.2 0 0.0 24
WesternAmerican Samoa 5 1.0 15 3.1 13 2.7 12 2.5 23 4.8 416 86.0 0 0.0 0 0.0 484Arizona 1,539 8.0 2,009 10.4 1,478 7.7 1,413 7.3 6,056 31.3 6,823 35.3 1 0.0 0 0.0 19,319Idaho 491 10.1 605 12.5 447 9.2 444 9.1 1,199 24.7 1,669 34.4 0 0.0 0 0.0 4,855ITC-Arizona 86 7.7 100 8.9 68 6.1 63 5.6 221 19.7 584 52.0 1 0.1 0 0.0 1,123
Notes
Interconceptual period is the time used to refer to the time between the end of the last pregnancy and the conception of the current pregnancy.
*This column represents pregnant women for whom data on date previous pregnancy ended was not reported.


![schaum's 3,000 Calculus solved problems [Elliott mendelson]](https://img.pdfslide.net/doc/110x75/557d0eb8d8b42a153b8b4fc2/schaums-3000-calculus-solved-problems-elliott-mendelson.jpg)