Embed Size (px)
Citation preview

us.nihonkohden.com
Nihon Kohden Wide Band EEG Analysis Tool
In the evaluation of EEG signals, there is likely benefit from examination of both low amplitude high frequency activity (high frequency oscillations or HFOs) and infra slow activity (DC shifts). While there is benefit from independent examination, the ability to evaluate both ends of the EEG frequency spectrum simultaneously can potentially yield useful information for the clinician. Other frequency ranges can also be selected for independent filtering, for specific clinical use case situations (such as gamma for functional mapping). Nihon Kohden’s EEG Suite (Neurofax, version 05-03), provides a Wide Band EEG analysis Tool with such functionality. This overview will present the computational basis for this tool, options and configurations, and a discussion of the various parameters in the Wide Band EEG Analysis tool.
Specifications of Nihon Kohden’s Amplifiers
One important consideration is the specification of the amplifier used for the EEG data recording. In addition, the user should be comfortable with the specific protocol recording parameters. For example, the maximum EEG frequency range to be analyzed will be determined by the amplifier and protocol sample rate used during signal acquisition. Infra slow EEG activity will be impacted by the selected amplifier time constant filter. The following specifications assume extended file format is utilized to allow for both high sample rate and channel count.
JE-120A, High Density EEG Amplifier
Capable of recording up to 256 EEG channels. Sample rate up to 10,000 Hz per channel depending on number of recording channels selected (64 channels @ 10KHz, 128 channels @ 5KHz, 192 and 256 channels @ 2KHz). Time constant selectable at 2s (0.08 LFF) or 10s (0.016 LFF). Dynamic range selectable at +/- 3.2mV or +/- 12.8mV.1
WEE-1200A Wireless EEG Amplifier
Capable of recording up to 64 EEG channels. Sample rate up to 4,000 Hz per channel depending on wired versus wireless mode. Time constant selectable at 2s (0.08 LFF) or 10s (0.016 LFF). Dynamic range selectable at +/- 3.2mV or +/- 12.8mV. 2
JE-921A EEG Amplifier
Capable of recording 25 EEG channels, with 4 additional channels selectable as EEG or bipolar inputs, and 3 additional bipolar only inputs. Sample rate up to 1,000 Hz per channel. Time constant of 2s (0.08 Hz) and dynamic range of +/- 3.2 mV. 3
Time Range and Frequency Selection
There are multiple EEG time range options for the end user to display EEG data. The time range selected will have an obvious impact on some analysis parameters, however the user can dynamically select the display method that optimizes the display of signals across the EEG frequency spectrum. Selectable options are: +/- 1s (second), 2.5s, 5s, 10s, 30s, and 60s. This time frame is based
Wide Band EEG
White Paper
1 JE-120A operators manual 2 WEE-1200A operators manual3 JE-921A operators manual

us.nihonkohden.com
on the location of the cursor within the EEG, such that if the +/- 30s option is selected, a 60 second window is analyzed with 30 seconds of information displayed before and after the cursor. In addition, a user selected time range of EEG can be utilized. A consideration should be made of the type of EEG signal activity to be analyzed. Due to the nature of the infra slow EEG activity, typically a wider analysis time range will likely yield more useful information. If the EEG activity to be analyzed is specifically HFO (fast), a shorter time window might be desirable.
Minimum and maximum EEG frequency ranges can be selected to provide a more detailed analysis within a selected frequency range. For example, if only HFOs are being analyzed, a range of 80-600 Hz might be desirable. Typical settings for wide band analysis would be a minimum of 0 Hz o 500 or 600 Hz. Analysis can be performed from a minimum frequency as defined by the amplifier set time constant, up to the maximum EEG frequency allowed (Nyquist) based on sample rate.
Wide Band EEG Analysis Options
The Wide Band EEG Analysis Tool provides user selectable signal time frame and frequency range display tools for EEG signals. The analysis methods available are:
• Short Term FFT (fast fourier transform)
• Complex Demodulation
• Wavelet
Short Term FFT
Fast fourier transform with a Hanning window (Figure 1) is utilized for analysis with frequency resolution described as:
with frequency resolution of Δf, sampling frequency of ��, and sample number for analysis of N. Sampling interval in frequency is above “frequency resolution”. Sample number for analysis can be decided with the equation:
Figure1
Figure2
• ComplexDemodulation• Wavelet
TimeRangeandFrequencySelection
TherearemultipleEEGtimerangeoptionsfortheendusertodisplayEEGdata.Thetimerangeselectedwillhaveanobviousimpactonsomeanalysisparameters,howevertheusercandynamicallyselectthedisplaymethodthatoptimizesthedisplayofsignalsacrosstheEEGfrequencyspectrum.Selectableoptionsare:+/-1s(second),2.5s,5s,10s,30s,and60s.ThistimeframeisbasedonthelocationofthecursorwithintheEEG,suchthatifthe+/-30soptionisselected,a60secondwindowisanalyzedwith30secondsofinformationdisplayedbeforeandafterthecursor.Inaddition,auserselectedtimerangerangeofEEGcanbeutilized.AconsiderationshouldbemadeofthetypeofEEGsignalactivitytobeanalyzed.DuetothenatureoftheinfraslowEEGactivity,typicallyawideranalysistimerangewilllikelyyieldmoreusefulinformation.IftheEEGactivitytobeanalyzedisspecificallyHFO(fast),ashortertimewindowmightbedesirable.
MinimumandmaximumEEGfrequencyrangescanbeselectedtoprovideamoredetailedanalysiswithinaselectedfrequencyrange.Forexample,ifonlyHFOsarebeinganalyzed,arangeof80-600Hzmightbedesirable.Typicalsettingsforwidebandanalysiswouldbeaminimumof0Hzo500or600Hz.Analysiscanbeperformedfromaminimumfrequencyasdefinedbytheamplifiersettimeconstant,uptothemaximumEEGfrequencyallowed(Nyquist)basedonsamplerate.
ShortTermFFT
FastfouriertransformwithaHanningwindow(Figure1)isutilizedforanalysiswithfrequencyresolutiondescribedas:
Δf = !!!
withfrequencyresolutionofΔf,samplingfrequencyoffs,andsamplenumberforanalysisofN.Samplingintervalinfrequencyisabove“frequencyresolution”.Samplenumberforanalysiscanbedecidedwiththeequation
N = !!!!
,whichisthenthetimewindowforFFTanalysis.
ComplexDemodulation
Complexdemodulationisutilized(Figure2)forextractionoftheinstantaneousfrequencyandenvelope.SamplingintervalinfrequencyisfortheinitialFFTspectraasabove.
Samplingintervalintimeisthetimewindowtobeusedforthedemodulationcalculations.
TheCDMcutofffrequencyistodefinethelowpassforpurposesoftheanalysis.
, which is then the time window for FFT analysis.
Wide Band EEG
White Paper
Figure1
Figure2
• ComplexDemodulation• Wavelet
TimeRangeandFrequencySelection
TherearemultipleEEGtimerangeoptionsfortheendusertodisplayEEGdata.Thetimerangeselectedwillhaveanobviousimpactonsomeanalysisparameters,howevertheusercandynamicallyselectthedisplaymethodthatoptimizesthedisplayofsignalsacrosstheEEGfrequencyspectrum.Selectableoptionsare:+/-1s(second),2.5s,5s,10s,30s,and60s.ThistimeframeisbasedonthelocationofthecursorwithintheEEG,suchthatifthe+/-30soptionisselected,a60secondwindowisanalyzedwith30secondsofinformationdisplayedbeforeandafterthecursor.Inaddition,auserselectedtimerangerangeofEEGcanbeutilized.AconsiderationshouldbemadeofthetypeofEEGsignalactivitytobeanalyzed.DuetothenatureoftheinfraslowEEGactivity,typicallyawideranalysistimerangewilllikelyyieldmoreusefulinformation.IftheEEGactivitytobeanalyzedisspecificallyHFO(fast),ashortertimewindowmightbedesirable.
MinimumandmaximumEEGfrequencyrangescanbeselectedtoprovideamoredetailedanalysiswithinaselectedfrequencyrange.Forexample,ifonlyHFOsarebeinganalyzed,arangeof80-600Hzmightbedesirable.Typicalsettingsforwidebandanalysiswouldbeaminimumof0Hzo500or600Hz.Analysiscanbeperformedfromaminimumfrequencyasdefinedbytheamplifiersettimeconstant,uptothemaximumEEGfrequencyallowed(Nyquist)basedonsamplerate.
ShortTermFFT
FastfouriertransformwithaHanningwindow(Figure1)isutilizedforanalysiswithfrequencyresolutiondescribedas:
Δf = !!!
withfrequencyresolutionofΔf,samplingfrequencyoffs,andsamplenumberforanalysisofN.Samplingintervalinfrequencyisabove“frequencyresolution”.Samplenumberforanalysiscanbedecidedwiththeequation
N = !!!!
,whichisthenthetimewindowforFFTanalysis.
ComplexDemodulation
Complexdemodulationisutilized(Figure2)forextractionoftheinstantaneousfrequencyandenvelope.SamplingintervalinfrequencyisfortheinitialFFTspectraasabove.
Samplingintervalintimeisthetimewindowtobeusedforthedemodulationcalculations.
TheCDMcutofffrequencyistodefinethelowpassforpurposesoftheanalysis.
Figure 1
Figure1
Figure2
• ComplexDemodulation• Wavelet
TimeRangeandFrequencySelection
TherearemultipleEEGtimerangeoptionsfortheendusertodisplayEEGdata.Thetimerangeselectedwillhaveanobviousimpactonsomeanalysisparameters,howevertheusercandynamicallyselectthedisplaymethodthatoptimizesthedisplayofsignalsacrosstheEEGfrequencyspectrum.Selectableoptionsare:+/-1s(second),2.5s,5s,10s,30s,and60s.ThistimeframeisbasedonthelocationofthecursorwithintheEEG,suchthatifthe+/-30soptionisselected,a60secondwindowisanalyzedwith30secondsofinformationdisplayedbeforeandafterthecursor.Inaddition,auserselectedtimerangerangeofEEGcanbeutilized.AconsiderationshouldbemadeofthetypeofEEGsignalactivitytobeanalyzed.DuetothenatureoftheinfraslowEEGactivity,typicallyawideranalysistimerangewilllikelyyieldmoreusefulinformation.IftheEEGactivitytobeanalyzedisspecificallyHFO(fast),ashortertimewindowmightbedesirable.
MinimumandmaximumEEGfrequencyrangescanbeselectedtoprovideamoredetailedanalysiswithinaselectedfrequencyrange.Forexample,ifonlyHFOsarebeinganalyzed,arangeof80-600Hzmightbedesirable.Typicalsettingsforwidebandanalysiswouldbeaminimumof0Hzo500or600Hz.Analysiscanbeperformedfromaminimumfrequencyasdefinedbytheamplifiersettimeconstant,uptothemaximumEEGfrequencyallowed(Nyquist)basedonsamplerate.
ShortTermFFT
FastfouriertransformwithaHanningwindow(Figure1)isutilizedforanalysiswithfrequencyresolutiondescribedas:
Δf = !!!
withfrequencyresolutionofΔf,samplingfrequencyoffs,andsamplenumberforanalysisofN.Samplingintervalinfrequencyisabove“frequencyresolution”.Samplenumberforanalysiscanbedecidedwiththeequation
N = !!!!
,whichisthenthetimewindowforFFTanalysis.
ComplexDemodulation
Complexdemodulationisutilized(Figure2)forextractionoftheinstantaneousfrequencyandenvelope.SamplingintervalinfrequencyisfortheinitialFFTspectraasabove.
Samplingintervalintimeisthetimewindowtobeusedforthedemodulationcalculations.
TheCDMcutofffrequencyistodefinethelowpassforpurposesoftheanalysis.

us.nihonkohden.com
Complex Demodulation
Complex demodulation is utilized (Figure 2) for extraction of the instantaneous frequency and envelope. Sampling interval in frequency is for the initial FFT spectra as above.
Sampling interval in time is the time window to be used for the demodulation calculations.
The CDM cutoff frequency is to define the low pass for purposes of the analysis.
Wavelet
Complex Morlet analysis (Figure 3) of the wavelets is utilized. This is described as:
L: Wavelet width of right figure f: Target frequency t: Time
Wide Band EEG
White Paper
Figure1
Figure2
• ComplexDemodulation• Wavelet
TimeRangeandFrequencySelection
TherearemultipleEEGtimerangeoptionsfortheendusertodisplayEEGdata.Thetimerangeselectedwillhaveanobviousimpactonsomeanalysisparameters,howevertheusercandynamicallyselectthedisplaymethodthatoptimizesthedisplayofsignalsacrosstheEEGfrequencyspectrum.Selectableoptionsare:+/-1s(second),2.5s,5s,10s,30s,and60s.ThistimeframeisbasedonthelocationofthecursorwithintheEEG,suchthatifthe+/-30soptionisselected,a60secondwindowisanalyzedwith30secondsofinformationdisplayedbeforeandafterthecursor.Inaddition,auserselectedtimerangerangeofEEGcanbeutilized.AconsiderationshouldbemadeofthetypeofEEGsignalactivitytobeanalyzed.DuetothenatureoftheinfraslowEEGactivity,typicallyawideranalysistimerangewilllikelyyieldmoreusefulinformation.IftheEEGactivitytobeanalyzedisspecificallyHFO(fast),ashortertimewindowmightbedesirable.
MinimumandmaximumEEGfrequencyrangescanbeselectedtoprovideamoredetailedanalysiswithinaselectedfrequencyrange.Forexample,ifonlyHFOsarebeinganalyzed,arangeof80-600Hzmightbedesirable.Typicalsettingsforwidebandanalysiswouldbeaminimumof0Hzo500or600Hz.Analysiscanbeperformedfromaminimumfrequencyasdefinedbytheamplifiersettimeconstant,uptothemaximumEEGfrequencyallowed(Nyquist)basedonsamplerate.
ShortTermFFT
FastfouriertransformwithaHanningwindow(Figure1)isutilizedforanalysiswithfrequencyresolutiondescribedas:
Δf = !!!
withfrequencyresolutionofΔf,samplingfrequencyoffs,andsamplenumberforanalysisofN.Samplingintervalinfrequencyisabove“frequencyresolution”.Samplenumberforanalysiscanbedecidedwiththeequation
N = !!!!
,whichisthenthetimewindowforFFTanalysis.
ComplexDemodulation
Complexdemodulationisutilized(Figure2)forextractionoftheinstantaneousfrequencyandenvelope.SamplingintervalinfrequencyisfortheinitialFFTspectraasabove.
Samplingintervalintimeisthetimewindowtobeusedforthedemodulationcalculations.
TheCDMcutofffrequencyistodefinethelowpassforpurposesoftheanalysis.
Figure 2
Figure3
Figure4
Figure5
Wavelet
ComplexMorletanalysis(Figure3)ofthewaveletsisutilized.Thisisdescribedas
ψ = 𝜎𝜎 𝜋𝜋!!/!
e!!!/!!!𝑒𝑒!!!!"#
σ =𝐿𝐿2𝜋𝜋𝜋𝜋
L:Waveletwidthofrightfiguref:Targetfrequencyt:Time
WorkingwithintheWideBandEEGAnalysisResults
OnceEEGsignalanalysishasbeencompleted,thefollowingresultswindow(Figure4)isdisplayed:(+/-30susedfortimerangeofanintracranialmonitoringseizureonset).
Inthisexample(Figure4),allchannelsaredisplayed,usingthedisplaymontagefromtheEEGReviewSuite(NihonKohdenNeurofax,version05-03).Thenumberofelectrodesdisplayed,numberofrows,andcolumnscanbeconfiguredusingtheDisplaySettings(Figure5).
Figure 3
Figure3
Figure4
Figure5
Wavelet
ComplexMorletanalysis(Figure3)ofthewaveletsisutilized.Thisisdescribedas
ψ = 𝜎𝜎 𝜋𝜋!!/!
e!!!/!!!𝑒𝑒!!!!"#
σ =𝐿𝐿2𝜋𝜋𝜋𝜋
L:Waveletwidthofrightfiguref:Targetfrequencyt:Time
WorkingwithintheWideBandEEGAnalysisResults
OnceEEGsignalanalysishasbeencompleted,thefollowingresultswindow(Figure4)isdisplayed:(+/-30susedfortimerangeofanintracranialmonitoringseizureonset).
Inthisexample(Figure4),allchannelsaredisplayed,usingthedisplaymontagefromtheEEGReviewSuite(NihonKohdenNeurofax,version05-03).Thenumberofelectrodesdisplayed,numberofrows,andcolumnscanbeconfiguredusingtheDisplaySettings(Figure5).

us.nihonkohden.com
Working within the Wide Band EEG Analysis Results
Once EEG signal analysis has been completed, the following results window (Figure 4) is displayed: (+/- 30s used for time range of an intracranial monitoring seizure onset).
In this example (Figure 4), all channels are displayed, using the display montage from the EEG Review Suite (Nihon Kohden Neurofax, version 05-03). The number of electrodes displayed, number of rows, and columns can be configured using the Display Settings (Figure 5).
This can be useful for a more detailed examination of a subgroup of EEG electrodes, or when customizing the presentation to create graphics for publication.
All channels are still present (Figure 6), though only the selected number are on a screen at one time, with navigation to other channels available through the scroll bar at the bottom.
Wide Band EEG
White Paper
Figure3
Figure4
Figure5
Wavelet
ComplexMorletanalysis(Figure3)ofthewaveletsisutilized.Thisisdescribedas
ψ = 𝜎𝜎 𝜋𝜋!!/!
e!!!/!!!𝑒𝑒!!!!"#
σ =𝐿𝐿2𝜋𝜋𝜋𝜋
L:Waveletwidthofrightfiguref:Targetfrequencyt:Time
WorkingwithintheWideBandEEGAnalysisResults
OnceEEGsignalanalysishasbeencompleted,thefollowingresultswindow(Figure4)isdisplayed:(+/-30susedfortimerangeofanintracranialmonitoringseizureonset).
Inthisexample(Figure4),allchannelsaredisplayed,usingthedisplaymontagefromtheEEGReviewSuite(NihonKohdenNeurofax,version05-03).Thenumberofelectrodesdisplayed,numberofrows,andcolumnscanbeconfiguredusingtheDisplaySettings(Figure5).
Figure 4
Figure3
Figure4
Figure5
Wavelet
ComplexMorletanalysis(Figure3)ofthewaveletsisutilized.Thisisdescribedas
ψ = 𝜎𝜎 𝜋𝜋!!/!
e!!!/!!!𝑒𝑒!!!!"#
σ =𝐿𝐿2𝜋𝜋𝜋𝜋
L:Waveletwidthofrightfiguref:Targetfrequencyt:Time
WorkingwithintheWideBandEEGAnalysisResults
OnceEEGsignalanalysishasbeencompleted,thefollowingresultswindow(Figure4)isdisplayed:(+/-30susedfortimerangeofanintracranialmonitoringseizureonset).
Inthisexample(Figure4),allchannelsaredisplayed,usingthedisplaymontagefromtheEEGReviewSuite(NihonKohdenNeurofax,version05-03).Thenumberofelectrodesdisplayed,numberofrows,andcolumnscanbeconfiguredusingtheDisplaySettings(Figure5).
Figure 5
Figure6
Figure7
ThiscanbeusefulforamoredetailedexaminationofasubgroupofEEGelectrodes,orwhencustomizingthepresentationtocreategraphicsforpublication.
Allchannelsarestillpresent(Figure6),thoughonlytheselectednumberareonascreenatonetime,withnavigationtootherchannelsavailablethroughthescrollbaratthebottom.
Forpurposesofexploringthesignaldisplayindetail,
Figure 6

us.nihonkohden.com
For purposes of exploring the signal display in detail, a single electrode will be selected and used in Figure 7 above.
Wide Band EEG
White Paper
Figure6
Figure7
ThiscanbeusefulforamoredetailedexaminationofasubgroupofEEGelectrodes,orwhencustomizingthepresentationtocreategraphicsforpublication.
Allchannelsarestillpresent(Figure6),thoughonlytheselectednumberareonascreenatonetime,withnavigationtootherchannelsavailablethroughthescrollbaratthebottom.
Forpurposesofexploringthesignaldisplayindetail,
Figure 7
Functions and icons (explored in depth in next section)
Temporal spectral evolution, frequency changes over time
Electrodes for analysis are displayed in the top left
Display scale for frequency
Based on minimum and maximum frequency selected at time of analysis
Time scale, baseline indication (in purple), scale for EEG waveforms, and scale for power band display in TSE
EEG waveforms at differing filters and colors, customizable and as selected in Waveform Setup

us.nihonkohden.com
Waveform Setup
Waveform setup is used in Figure 8 to select the 4 EEG tracings, filter settings, sensitivity, and colors for the overlapped EEG waveforms. These settings are used to visualize differing EEG waveforms in an overlapped signal display to evaluate artifact while providing a more detailed view of simultaneous activity.
For the example used here, the following were the settings used. These are customizable for the particular clinical use case. Filters can be set (or selected to be unused) independently for low cut, high cut, and AC filter (as selected in the recording protocol for 50 or 60 Hz). Forward or zero phase, and slope of filtering in the case of zero phase; forward at 6 db/oct (LFF) and 6 or 12 or 24 db/oct (HFF), zero phase at 12, 24, and 48 db/oct. Color for display and initial sensitivity may also be selected here.
Please note Figure 9, some studies and clinicians prefer slightly differing frequency range definitions for ripple and fast ripple, and these could also be used. The slope of filtering is of particular importance in looking at HFOs as a zero phase sharp roll off might be desired.
These settings (Figure 10) impact the overlapped EEG waveforms displayed and the statistical analysis for selected ranges of activity within the TSE
window. Activity of interest within this window allows for a selectable box to be used to both evaluate the activity statistics of these frequency bands as well as compare to corresponding areas within other channels.
Wide Band EEG
White Paper
Figure8
asingleelectrodewillbeselectedandusedinFigure7below.
WaveformsetupisusedinFigure8toselectthe4EEGtracings,filtersettings,sensitivity,andcolorsfortheoverlappedEEGwaveforms.ThesesettingsareusedtovisualizedifferingEEGwaveformsinanoverlappedsignaldisplaytoevaluateartifactwhileprovidingamoredetailed
viewofsimultaneousactivity.
Figure9
Figure10
WaveformSetup
Fortheexampleusedhere,thefollowingwerethesettingsused.Thesearecustomizablefortheparticularclinicalusecase.Filterscanbeset(orselectedtobeunused)independentlyforlowcut,highcut,andACfilter(asselectedintherecordingprotocolfor50or60Hz).Forwardorzerophase,andslopeoffilteringinthecaseofzerophase;forwardat6db/oct(LFF)and6or12or24db/oct(HFF),zerophaseat12,24,and48db/oct.Colorfordisplayandinitialsensitivitymayalsobeselectedhere.
PleasenoteFigure9,somestudiesandclinicianspreferslightlydifferingfrequencyrangedefinitionsforrippleandfastripple,andthesecouldalsobeused.Theslopeof
filteringisofparticularimportanceinlookingatHFOsasazerophasesharprolloffmightbedesired.
Thesesettings(Figure10)impacttheoverlappedEEGwaveformsdisplayedandthestatisticalanalysisforselectedrangesofactivitywithintheTSEwindow.Activityofinterestwithinthiswindowallowsforaselectableboxtobeusedtobothevaluatetheactivitystatisticsofthesefrequencybandsaswellascomparetocorrespondingareaswithinotherchannels.
Figure 8
Figure 9
Figure 10

us.nihonkohden.com
Wide Band EEG
White Paper
A left mouse drag window (seen in Figure 11) can be used to select a specific section of EEG. The menu box is displayed with amplitude, positive and negative values, and the frequency bands as defined in the Waveform Setup area. The corresponding selection within the other electrode channels and montage are also displayed for activity comparison. In addition, this function can be used to select a differing area for a baseline (for analysis purposes) if desired or indicated.
Figure11
Aleftmousedragwindow(seeninFigure11)canbeusedtoselectaspecificsectionofEEG.Themenuboxisdisplayedwithamplitude,positiveandnegativevalues,andthefrequencybandsasdefinedintheWaveformSetuparea.Thecorrespondingselectionwithintheotherelectrodechannelsandmontagearealsodisplayedforactivitycomparison.Inaddition,thisfunctioncanbeusedtoselectadifferingareaforabaseline(foranalysispurposes)ifdesiredorindicated.
Additionalfunctions(Figure12)andconfigurationoptionsarealsoavailable,bothindropdownmenuandiconformat,toallowforfinetuningthedisplayoptionsasneeded.Theseadditionalfunctionsandusesare:
Figure12
FILE:
-Saveasbitmap .Thisfunctionsavesthedisplayedresultsasagraphicinbitmapformat.Thisisusefulforinclusioninaclinicalreportorforuseinpublications.
ANALYSIS:
-StartAnalysis .ThisfunctionbringbackuptheSetupAnalysiswindowandwillrerunanalysisifadifferentanalysisconfigurationisdesired.Thiscanbeusefultousethesameselectionofactivity,butwithacomparativeneedtoevaluateinadifferinganalysisdesign.
DISPLAYSETTINGS:
-ShowTimeFrequencyanalysisdata .Allowstoselecttodisplayornotdisplaythequantitative
Figure 11
us.nihonkohden.com
Wide Band EEG
White Paper
Additional Functions
Additional functions (Figure 12) and configuration options are also available, both in drop down menu and icon format, to allow for fine tuning the display options as needed. These additional functions and uses are:
File:
• Save as bitmap
Figure11
Aleftmousedragwindow(seeninFigure11)canbeusedtoselectaspecificsectionofEEG.Themenuboxisdisplayedwithamplitude,positiveandnegativevalues,andthefrequencybandsasdefinedintheWaveformSetuparea.Thecorrespondingselectionwithintheotherelectrodechannelsandmontagearealsodisplayedforactivitycomparison.Inaddition,thisfunctioncanbeusedtoselectadifferingareaforabaseline(foranalysispurposes)ifdesiredorindicated.
Additionalfunctions(Figure12)andconfigurationoptionsarealsoavailable,bothindropdownmenuandiconformat,toallowforfinetuningthedisplayoptionsasneeded.Theseadditionalfunctionsandusesare:
Figure12
FILE:
-Saveasbitmap .Thisfunctionsavesthedisplayedresultsasagraphicinbitmapformat.Thisisusefulforinclusioninaclinicalreportorforuseinpublications.
ANALYSIS:
-StartAnalysis .ThisfunctionbringbackuptheSetupAnalysiswindowandwillrerunanalysisifadifferentanalysisconfigurationisdesired.Thiscanbeusefultousethesameselectionofactivity,butwithacomparativeneedtoevaluateinadifferinganalysisdesign.
DISPLAYSETTINGS:
-ShowTimeFrequencyanalysisdata .Allowstoselecttodisplayornotdisplaythequantitative
. This function saves the displayed results as a graphic in bitmap format. This is useful for inclusion in a clinical report or for use in publications.
Analysis:
• Start Analysis
Figure11
Aleftmousedragwindow(seeninFigure11)canbeusedtoselectaspecificsectionofEEG.Themenuboxisdisplayedwithamplitude,positiveandnegativevalues,andthefrequencybandsasdefinedintheWaveformSetuparea.Thecorrespondingselectionwithintheotherelectrodechannelsandmontagearealsodisplayedforactivitycomparison.Inaddition,thisfunctioncanbeusedtoselectadifferingareaforabaseline(foranalysispurposes)ifdesiredorindicated.
Additionalfunctions(Figure12)andconfigurationoptionsarealsoavailable,bothindropdownmenuandiconformat,toallowforfinetuningthedisplayoptionsasneeded.Theseadditionalfunctionsandusesare:
Figure12
FILE:
-Saveasbitmap .Thisfunctionsavesthedisplayedresultsasagraphicinbitmapformat.Thisisusefulforinclusioninaclinicalreportorforuseinpublications.
ANALYSIS:
-StartAnalysis .ThisfunctionbringbackuptheSetupAnalysiswindowandwillrerunanalysisifadifferentanalysisconfigurationisdesired.Thiscanbeusefultousethesameselectionofactivity,butwithacomparativeneedtoevaluateinadifferinganalysisdesign.
DISPLAYSETTINGS:
-ShowTimeFrequencyanalysisdata .Allowstoselecttodisplayornotdisplaythequantitative
. This function bring back up the Setup Analysis window and will rerun analysis if a different analysis configuration is desired. This can be useful to use the same selection of activity, but with a comparative need to evaluate in a differing analysis design.
Display Settings:
• Show Time Frequency analysis data
Figure11
Aleftmousedragwindow(seeninFigure11)canbeusedtoselectaspecificsectionofEEG.Themenuboxisdisplayedwithamplitude,positiveandnegativevalues,andthefrequencybandsasdefinedintheWaveformSetuparea.Thecorrespondingselectionwithintheotherelectrodechannelsandmontagearealsodisplayedforactivitycomparison.Inaddition,thisfunctioncanbeusedtoselectadifferingareaforabaseline(foranalysispurposes)ifdesiredorindicated.
Additionalfunctions(Figure12)andconfigurationoptionsarealsoavailable,bothindropdownmenuandiconformat,toallowforfinetuningthedisplayoptionsasneeded.Theseadditionalfunctionsandusesare:
Figure12
FILE:
-Saveasbitmap .Thisfunctionsavesthedisplayedresultsasagraphicinbitmapformat.Thisisusefulforinclusioninaclinicalreportorforuseinpublications.
ANALYSIS:
-StartAnalysis .ThisfunctionbringbackuptheSetupAnalysiswindowandwillrerunanalysisifadifferentanalysisconfigurationisdesired.Thiscanbeusefultousethesameselectionofactivity,butwithacomparativeneedtoevaluateinadifferinganalysisdesign.
DISPLAYSETTINGS:
-ShowTimeFrequencyanalysisdata .Allowstoselecttodisplayornotdisplaythequantitative. Allows to select to display or not display the quantitative
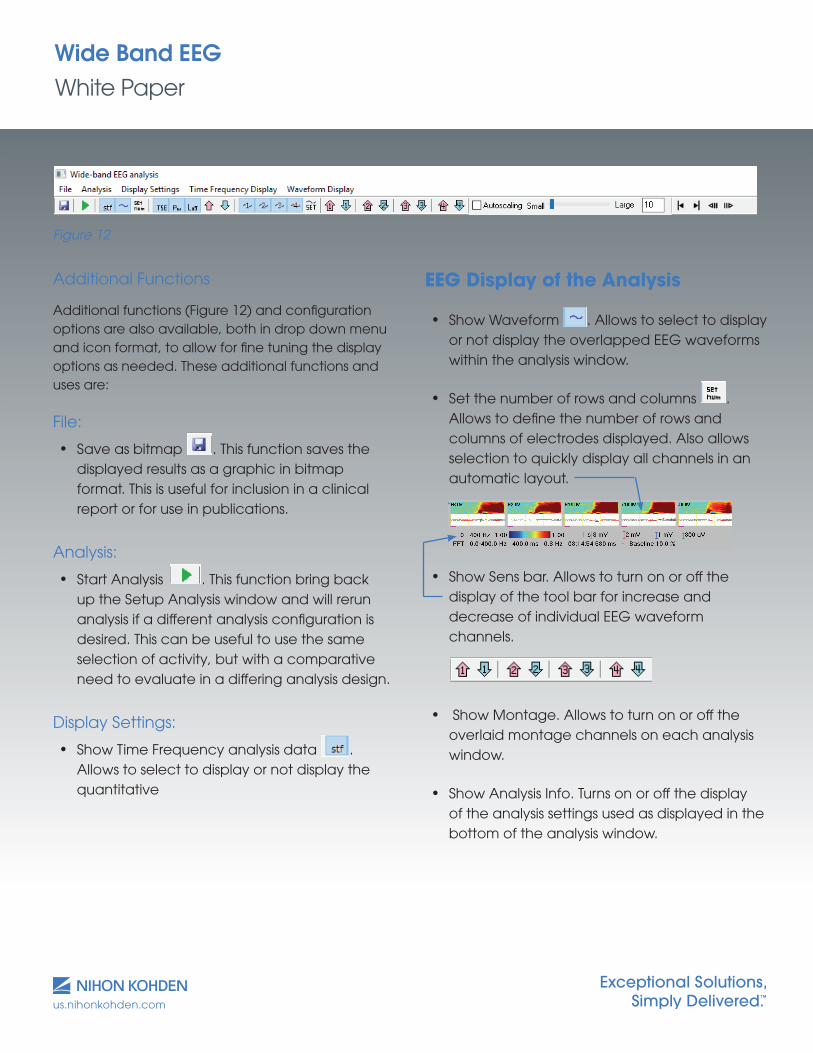
EEG Display of the Analysis
• Show Waveform
EEGDisplayoftheAnalysis
-ShowWaveform .AllowstoselecttodisplayornotdisplaytheoverlappedEEGwaveformswithintheanalysiswindow.
-Setthenumberofrowsandcolumns .Allowstodefinethenumberofrowsandcolumnsofelectrodesdisplayed.Alsoallowsselectiontoquicklydisplayallchannelsinanautomaticlayout.-ShowSensbar.AllowstoturnonoroffthedisplayofthetoolbarforincreaseanddecreaseofindividualEEGwaveformchannels.
-ShowMontage.Allowstoturnonorofftheoverlaidmontagechannelsoneachanalysiswindow.-ShowAnalysisInfo.Turnsonoroffthedisplayoftheanalysissettingsusedasdisplayedinthebottomoftheanalysiswindow.
TIMEFREQUENCYDISPLAY:
-AbsolutePower/AmplitudevsTemporalSpectralEvolution .AllowstoselectifthespectrogramdisplaysusingAbsolutePower/AmplitudeorTemporalSpectralEvolution.NotethatchangingthisdisplaymethodwillalsocorrespondingchangethespectralscaleatthebottomofthewindowtoPower/AmplitudeversusLogorPercentageasselected.
-AmplitudeversusPower .Allowstoselectifthequantitativedisplayusesamplitude(uV)orpower(uV^2).Scaleforquantitativemeasure,ifusingAmplitude/Powerwillalsochangeaccordingly.
-PercentorLogdisplayonTSE .ForTSEdisplay,selectsiftheactivityisdisplayedinapercentage(0-100%)versusalog(-1to1)format.-Smoothing.Selectsifthequantitativedisplayissmoothedornot.
WAVEFORMDISPLAY:
-ShoworhideindividualEEGwaveformsbasedonfilteredparametersnamed .
-WaveformSetup .Bringsupthewindow(aspreviouslydescribed)usedtonameandconfiguretheindividualEEGwaveforms.-BaselineCorrection.Allowstoturnonoroffthebaselineselection.Bydefaulttheinitial10%isusedforthebaseline,orasselectivelydefined.
TOOLBAROPTIONS:
-Gainupordown .Increasesordecreasesthegainofthespectraldisplay.Notethecorrespondingchangeofthescaleatthebottomoftheanalysiswindow.
-IncreaseordecreasetheindividualEEGwaveformsensitivities .Thisallowsforeasyadjustmentoftheindividualoverlappedwaveformsforoptimalviewing.Notechangetosensitivityscaleatbottomofanalysiswindow.
-AutoscalingofEEGwaveforms .AllowsforautomaticscalingofallEEGwaveformsoradjustmentofalldisplaygains.
. Allows to select to display or not display the overlapped EEG waveforms within the analysis window.
• Set the number of rows and columns
EEGDisplayoftheAnalysis
-ShowWaveform .AllowstoselecttodisplayornotdisplaytheoverlappedEEGwaveformswithintheanalysiswindow.
-Setthenumberofrowsandcolumns .Allowstodefinethenumberofrowsandcolumnsofelectrodesdisplayed.Alsoallowsselectiontoquicklydisplayallchannelsinanautomaticlayout.-ShowSensbar.AllowstoturnonoroffthedisplayofthetoolbarforincreaseanddecreaseofindividualEEGwaveformchannels.
-ShowMontage.Allowstoturnonorofftheoverlaidmontagechannelsoneachanalysiswindow.-ShowAnalysisInfo.Turnsonoroffthedisplayoftheanalysissettingsusedasdisplayedinthebottomoftheanalysiswindow.
TIMEFREQUENCYDISPLAY:
-AbsolutePower/AmplitudevsTemporalSpectralEvolution .AllowstoselectifthespectrogramdisplaysusingAbsolutePower/AmplitudeorTemporalSpectralEvolution.NotethatchangingthisdisplaymethodwillalsocorrespondingchangethespectralscaleatthebottomofthewindowtoPower/AmplitudeversusLogorPercentageasselected.
-AmplitudeversusPower .Allowstoselectifthequantitativedisplayusesamplitude(uV)orpower(uV^2).Scaleforquantitativemeasure,ifusingAmplitude/Powerwillalsochangeaccordingly.
-PercentorLogdisplayonTSE .ForTSEdisplay,selectsiftheactivityisdisplayedinapercentage(0-100%)versusalog(-1to1)format.-Smoothing.Selectsifthequantitativedisplayissmoothedornot.
WAVEFORMDISPLAY:
-ShoworhideindividualEEGwaveformsbasedonfilteredparametersnamed .
-WaveformSetup .Bringsupthewindow(aspreviouslydescribed)usedtonameandconfiguretheindividualEEGwaveforms.-BaselineCorrection.Allowstoturnonoroffthebaselineselection.Bydefaulttheinitial10%isusedforthebaseline,orasselectivelydefined.
TOOLBAROPTIONS:
-Gainupordown .Increasesordecreasesthegainofthespectraldisplay.Notethecorrespondingchangeofthescaleatthebottomoftheanalysiswindow.
-IncreaseordecreasetheindividualEEGwaveformsensitivities .Thisallowsforeasyadjustmentoftheindividualoverlappedwaveformsforoptimalviewing.Notechangetosensitivityscaleatbottomofanalysiswindow.
-AutoscalingofEEGwaveforms .AllowsforautomaticscalingofallEEGwaveformsoradjustmentofalldisplaygains.
. Allows to define the number of rows and columns of electrodes displayed. Also allows selection to quickly display all channels in an automatic layout.
• Show Sens bar. Allows to turn on or off the display of the tool bar for increase and decrease of individual EEG waveform channels.
• Show Montage. Allows to turn on or off the overlaid montage channels on each analysis window.
• Show Analysis Info. Turns on or off the display of the analysis settings used as displayed in the bottom of the analysis window.
Figure11
Aleftmousedragwindow(seeninFigure11)canbeusedtoselectaspecificsectionofEEG.Themenuboxisdisplayedwithamplitude,positiveandnegativevalues,andthefrequencybandsasdefinedintheWaveformSetuparea.Thecorrespondingselectionwithintheotherelectrodechannelsandmontagearealsodisplayedforactivitycomparison.Inaddition,thisfunctioncanbeusedtoselectadifferingareaforabaseline(foranalysispurposes)ifdesiredorindicated.
Additionalfunctions(Figure12)andconfigurationoptionsarealsoavailable,bothindropdownmenuandiconformat,toallowforfinetuningthedisplayoptionsasneeded.Theseadditionalfunctionsandusesare:
Figure12
FILE:
-Saveasbitmap .Thisfunctionsavesthedisplayedresultsasagraphicinbitmapformat.Thisisusefulforinclusioninaclinicalreportorforuseinpublications.
ANALYSIS:
-StartAnalysis .ThisfunctionbringbackuptheSetupAnalysiswindowandwillrerunanalysisifadifferentanalysisconfigurationisdesired.Thiscanbeusefultousethesameselectionofactivity,butwithacomparativeneedtoevaluateinadifferinganalysisdesign.
DISPLAYSETTINGS:
-ShowTimeFrequencyanalysisdata .Allowstoselecttodisplayornotdisplaythequantitative
Figure 12
EEGDisplayoftheAnalysis
-ShowWaveform .AllowstoselecttodisplayornotdisplaytheoverlappedEEGwaveformswithintheanalysiswindow.
-Setthenumberofrowsandcolumns .Allowstodefinethenumberofrowsandcolumnsofelectrodesdisplayed.Alsoallowsselectiontoquicklydisplayallchannelsinanautomaticlayout.-ShowSensbar.AllowstoturnonoroffthedisplayofthetoolbarforincreaseanddecreaseofindividualEEGwaveformchannels.
-ShowMontage.Allowstoturnonorofftheoverlaidmontagechannelsoneachanalysiswindow.-ShowAnalysisInfo.Turnsonoroffthedisplayoftheanalysissettingsusedasdisplayedinthebottomoftheanalysiswindow.
TIMEFREQUENCYDISPLAY:
-AbsolutePower/AmplitudevsTemporalSpectralEvolution .AllowstoselectifthespectrogramdisplaysusingAbsolutePower/AmplitudeorTemporalSpectralEvolution.NotethatchangingthisdisplaymethodwillalsocorrespondingchangethespectralscaleatthebottomofthewindowtoPower/AmplitudeversusLogorPercentageasselected.
-AmplitudeversusPower .Allowstoselectifthequantitativedisplayusesamplitude(uV)orpower(uV^2).Scaleforquantitativemeasure,ifusingAmplitude/Powerwillalsochangeaccordingly.
-PercentorLogdisplayonTSE .ForTSEdisplay,selectsiftheactivityisdisplayedinapercentage(0-100%)versusalog(-1to1)format.-Smoothing.Selectsifthequantitativedisplayissmoothedornot.
WAVEFORMDISPLAY:
-ShoworhideindividualEEGwaveformsbasedonfilteredparametersnamed .
-WaveformSetup .Bringsupthewindow(aspreviouslydescribed)usedtonameandconfiguretheindividualEEGwaveforms.-BaselineCorrection.Allowstoturnonoroffthebaselineselection.Bydefaulttheinitial10%isusedforthebaseline,orasselectivelydefined.
TOOLBAROPTIONS:
-Gainupordown .Increasesordecreasesthegainofthespectraldisplay.Notethecorrespondingchangeofthescaleatthebottomoftheanalysiswindow.
-IncreaseordecreasetheindividualEEGwaveformsensitivities .Thisallowsforeasyadjustmentoftheindividualoverlappedwaveformsforoptimalviewing.Notechangetosensitivityscaleatbottomofanalysiswindow.
-AutoscalingofEEGwaveforms .AllowsforautomaticscalingofallEEGwaveformsoradjustmentofalldisplaygains.

us.nihonkohden.com
Wide Band EEG
White Paper
Time Frequency Display:
• Absolute Power/Amplitude vs Temporal Spectral Evolution
EEGDisplayoftheAnalysis
-ShowWaveform .AllowstoselecttodisplayornotdisplaytheoverlappedEEGwaveformswithintheanalysiswindow.
-Setthenumberofrowsandcolumns .Allowstodefinethenumberofrowsandcolumnsofelectrodesdisplayed.Alsoallowsselectiontoquicklydisplayallchannelsinanautomaticlayout.-ShowSensbar.AllowstoturnonoroffthedisplayofthetoolbarforincreaseanddecreaseofindividualEEGwaveformchannels.
-ShowMontage.Allowstoturnonorofftheoverlaidmontagechannelsoneachanalysiswindow.-ShowAnalysisInfo.Turnsonoroffthedisplayoftheanalysissettingsusedasdisplayedinthebottomoftheanalysiswindow.
TIMEFREQUENCYDISPLAY:
-AbsolutePower/AmplitudevsTemporalSpectralEvolution .AllowstoselectifthespectrogramdisplaysusingAbsolutePower/AmplitudeorTemporalSpectralEvolution.NotethatchangingthisdisplaymethodwillalsocorrespondingchangethespectralscaleatthebottomofthewindowtoPower/AmplitudeversusLogorPercentageasselected.
-AmplitudeversusPower .Allowstoselectifthequantitativedisplayusesamplitude(uV)orpower(uV^2).Scaleforquantitativemeasure,ifusingAmplitude/Powerwillalsochangeaccordingly.
-PercentorLogdisplayonTSE .ForTSEdisplay,selectsiftheactivityisdisplayedinapercentage(0-100%)versusalog(-1to1)format.-Smoothing.Selectsifthequantitativedisplayissmoothedornot.
WAVEFORMDISPLAY:
-ShoworhideindividualEEGwaveformsbasedonfilteredparametersnamed .
-WaveformSetup .Bringsupthewindow(aspreviouslydescribed)usedtonameandconfiguretheindividualEEGwaveforms.-BaselineCorrection.Allowstoturnonoroffthebaselineselection.Bydefaulttheinitial10%isusedforthebaseline,orasselectivelydefined.
TOOLBAROPTIONS:
-Gainupordown .Increasesordecreasesthegainofthespectraldisplay.Notethecorrespondingchangeofthescaleatthebottomoftheanalysiswindow.
-IncreaseordecreasetheindividualEEGwaveformsensitivities .Thisallowsforeasyadjustmentoftheindividualoverlappedwaveformsforoptimalviewing.Notechangetosensitivityscaleatbottomofanalysiswindow.
-AutoscalingofEEGwaveforms .AllowsforautomaticscalingofallEEGwaveformsoradjustmentofalldisplaygains.
. Allows to select if the spectrogram displays using Absolute Power/Amplitude or Temporal Spectral Evolution. Note that changing this display method will also corresponding change the spectral scale at the bottom of the window to Power/Amplitude versus Log or Percentage as selected.
• Amplitude versus Power
EEGDisplayoftheAnalysis
-ShowWaveform .AllowstoselecttodisplayornotdisplaytheoverlappedEEGwaveformswithintheanalysiswindow.
-Setthenumberofrowsandcolumns .Allowstodefinethenumberofrowsandcolumnsofelectrodesdisplayed.Alsoallowsselectiontoquicklydisplayallchannelsinanautomaticlayout.-ShowSensbar.AllowstoturnonoroffthedisplayofthetoolbarforincreaseanddecreaseofindividualEEGwaveformchannels.
-ShowMontage.Allowstoturnonorofftheoverlaidmontagechannelsoneachanalysiswindow.-ShowAnalysisInfo.Turnsonoroffthedisplayoftheanalysissettingsusedasdisplayedinthebottomoftheanalysiswindow.
TIMEFREQUENCYDISPLAY:
-AbsolutePower/AmplitudevsTemporalSpectralEvolution .AllowstoselectifthespectrogramdisplaysusingAbsolutePower/AmplitudeorTemporalSpectralEvolution.NotethatchangingthisdisplaymethodwillalsocorrespondingchangethespectralscaleatthebottomofthewindowtoPower/AmplitudeversusLogorPercentageasselected.
-AmplitudeversusPower .Allowstoselectifthequantitativedisplayusesamplitude(uV)orpower(uV^2).Scaleforquantitativemeasure,ifusingAmplitude/Powerwillalsochangeaccordingly.
-PercentorLogdisplayonTSE .ForTSEdisplay,selectsiftheactivityisdisplayedinapercentage(0-100%)versusalog(-1to1)format.-Smoothing.Selectsifthequantitativedisplayissmoothedornot.
WAVEFORMDISPLAY:
-ShoworhideindividualEEGwaveformsbasedonfilteredparametersnamed .
-WaveformSetup .Bringsupthewindow(aspreviouslydescribed)usedtonameandconfiguretheindividualEEGwaveforms.-BaselineCorrection.Allowstoturnonoroffthebaselineselection.Bydefaulttheinitial10%isusedforthebaseline,orasselectivelydefined.
TOOLBAROPTIONS:
-Gainupordown .Increasesordecreasesthegainofthespectraldisplay.Notethecorrespondingchangeofthescaleatthebottomoftheanalysiswindow.
-IncreaseordecreasetheindividualEEGwaveformsensitivities .Thisallowsforeasyadjustmentoftheindividualoverlappedwaveformsforoptimalviewing.Notechangetosensitivityscaleatbottomofanalysiswindow.
-AutoscalingofEEGwaveforms .AllowsforautomaticscalingofallEEGwaveformsoradjustmentofalldisplaygains.
. Allows to select if the quantitative display uses amplitude (uV) or power (uV^2). Scale for quantitative measure, if using Amplitude/Power will also change accordingly.
• Percent or Log display on TSE
EEGDisplayoftheAnalysis
-ShowWaveform .AllowstoselecttodisplayornotdisplaytheoverlappedEEGwaveformswithintheanalysiswindow.
-Setthenumberofrowsandcolumns .Allowstodefinethenumberofrowsandcolumnsofelectrodesdisplayed.Alsoallowsselectiontoquicklydisplayallchannelsinanautomaticlayout.-ShowSensbar.AllowstoturnonoroffthedisplayofthetoolbarforincreaseanddecreaseofindividualEEGwaveformchannels.
-ShowMontage.Allowstoturnonorofftheoverlaidmontagechannelsoneachanalysiswindow.-ShowAnalysisInfo.Turnsonoroffthedisplayoftheanalysissettingsusedasdisplayedinthebottomoftheanalysiswindow.
TIMEFREQUENCYDISPLAY:
-AbsolutePower/AmplitudevsTemporalSpectralEvolution .AllowstoselectifthespectrogramdisplaysusingAbsolutePower/AmplitudeorTemporalSpectralEvolution.NotethatchangingthisdisplaymethodwillalsocorrespondingchangethespectralscaleatthebottomofthewindowtoPower/AmplitudeversusLogorPercentageasselected.
-AmplitudeversusPower .Allowstoselectifthequantitativedisplayusesamplitude(uV)orpower(uV^2).Scaleforquantitativemeasure,ifusingAmplitude/Powerwillalsochangeaccordingly.
-PercentorLogdisplayonTSE .ForTSEdisplay,selectsiftheactivityisdisplayedinapercentage(0-100%)versusalog(-1to1)format.-Smoothing.Selectsifthequantitativedisplayissmoothedornot.
WAVEFORMDISPLAY:
-ShoworhideindividualEEGwaveformsbasedonfilteredparametersnamed .
-WaveformSetup .Bringsupthewindow(aspreviouslydescribed)usedtonameandconfiguretheindividualEEGwaveforms.-BaselineCorrection.Allowstoturnonoroffthebaselineselection.Bydefaulttheinitial10%isusedforthebaseline,orasselectivelydefined.
TOOLBAROPTIONS:
-Gainupordown .Increasesordecreasesthegainofthespectraldisplay.Notethecorrespondingchangeofthescaleatthebottomoftheanalysiswindow.
-IncreaseordecreasetheindividualEEGwaveformsensitivities .Thisallowsforeasyadjustmentoftheindividualoverlappedwaveformsforoptimalviewing.Notechangetosensitivityscaleatbottomofanalysiswindow.
-AutoscalingofEEGwaveforms .AllowsforautomaticscalingofallEEGwaveformsoradjustmentofalldisplaygains.
. For TSE display, selects if the activity is displayed in a percentage (0-100%) versus a log (-1 to 1) format.
• Smoothing. Selects if the quantitative display is smoothed or not.
Waveform Display:
• Show or hide individual EEG waveforms based on filtered parameters named
EEGDisplayoftheAnalysis
-ShowWaveform .AllowstoselecttodisplayornotdisplaytheoverlappedEEGwaveformswithintheanalysiswindow.
-Setthenumberofrowsandcolumns .Allowstodefinethenumberofrowsandcolumnsofelectrodesdisplayed.Alsoallowsselectiontoquicklydisplayallchannelsinanautomaticlayout.-ShowSensbar.AllowstoturnonoroffthedisplayofthetoolbarforincreaseanddecreaseofindividualEEGwaveformchannels.
-ShowMontage.Allowstoturnonorofftheoverlaidmontagechannelsoneachanalysiswindow.-ShowAnalysisInfo.Turnsonoroffthedisplayoftheanalysissettingsusedasdisplayedinthebottomoftheanalysiswindow.
TIMEFREQUENCYDISPLAY:
-AbsolutePower/AmplitudevsTemporalSpectralEvolution .AllowstoselectifthespectrogramdisplaysusingAbsolutePower/AmplitudeorTemporalSpectralEvolution.NotethatchangingthisdisplaymethodwillalsocorrespondingchangethespectralscaleatthebottomofthewindowtoPower/AmplitudeversusLogorPercentageasselected.
-AmplitudeversusPower .Allowstoselectifthequantitativedisplayusesamplitude(uV)orpower(uV^2).Scaleforquantitativemeasure,ifusingAmplitude/Powerwillalsochangeaccordingly.
-PercentorLogdisplayonTSE .ForTSEdisplay,selectsiftheactivityisdisplayedinapercentage(0-100%)versusalog(-1to1)format.-Smoothing.Selectsifthequantitativedisplayissmoothedornot.
WAVEFORMDISPLAY:
-ShoworhideindividualEEGwaveformsbasedonfilteredparametersnamed .
-WaveformSetup .Bringsupthewindow(aspreviouslydescribed)usedtonameandconfiguretheindividualEEGwaveforms.-BaselineCorrection.Allowstoturnonoroffthebaselineselection.Bydefaulttheinitial10%isusedforthebaseline,orasselectivelydefined.
TOOLBAROPTIONS:
-Gainupordown .Increasesordecreasesthegainofthespectraldisplay.Notethecorrespondingchangeofthescaleatthebottomoftheanalysiswindow.
-IncreaseordecreasetheindividualEEGwaveformsensitivities .Thisallowsforeasyadjustmentoftheindividualoverlappedwaveformsforoptimalviewing.Notechangetosensitivityscaleatbottomofanalysiswindow.
-AutoscalingofEEGwaveforms .AllowsforautomaticscalingofallEEGwaveformsoradjustmentofalldisplaygains.
.
• Waveform Setup
EEGDisplayoftheAnalysis
-ShowWaveform .AllowstoselecttodisplayornotdisplaytheoverlappedEEGwaveformswithintheanalysiswindow.
-Setthenumberofrowsandcolumns .Allowstodefinethenumberofrowsandcolumnsofelectrodesdisplayed.Alsoallowsselectiontoquicklydisplayallchannelsinanautomaticlayout.-ShowSensbar.AllowstoturnonoroffthedisplayofthetoolbarforincreaseanddecreaseofindividualEEGwaveformchannels.
-ShowMontage.Allowstoturnonorofftheoverlaidmontagechannelsoneachanalysiswindow.-ShowAnalysisInfo.Turnsonoroffthedisplayoftheanalysissettingsusedasdisplayedinthebottomoftheanalysiswindow.
TIMEFREQUENCYDISPLAY:
-AbsolutePower/AmplitudevsTemporalSpectralEvolution .AllowstoselectifthespectrogramdisplaysusingAbsolutePower/AmplitudeorTemporalSpectralEvolution.NotethatchangingthisdisplaymethodwillalsocorrespondingchangethespectralscaleatthebottomofthewindowtoPower/AmplitudeversusLogorPercentageasselected.
-AmplitudeversusPower .Allowstoselectifthequantitativedisplayusesamplitude(uV)orpower(uV^2).Scaleforquantitativemeasure,ifusingAmplitude/Powerwillalsochangeaccordingly.
-PercentorLogdisplayonTSE .ForTSEdisplay,selectsiftheactivityisdisplayedinapercentage(0-100%)versusalog(-1to1)format.-Smoothing.Selectsifthequantitativedisplayissmoothedornot.
WAVEFORMDISPLAY:
-ShoworhideindividualEEGwaveformsbasedonfilteredparametersnamed .
-WaveformSetup .Bringsupthewindow(aspreviouslydescribed)usedtonameandconfiguretheindividualEEGwaveforms.-BaselineCorrection.Allowstoturnonoroffthebaselineselection.Bydefaulttheinitial10%isusedforthebaseline,orasselectivelydefined.
TOOLBAROPTIONS:
-Gainupordown .Increasesordecreasesthegainofthespectraldisplay.Notethecorrespondingchangeofthescaleatthebottomoftheanalysiswindow.
-IncreaseordecreasetheindividualEEGwaveformsensitivities .Thisallowsforeasyadjustmentoftheindividualoverlappedwaveformsforoptimalviewing.Notechangetosensitivityscaleatbottomofanalysiswindow.
-AutoscalingofEEGwaveforms .AllowsforautomaticscalingofallEEGwaveformsoradjustmentofalldisplaygains.
. Brings up the window (as previously described) used to name and configure the individual EEG waveforms.
• Baseline Correction. Allows to turn on or off the baseline selection. By default the initial 10% is used for the baseline, or as selectively defined.
Toolbar Options:
• Gain up or down
EEGDisplayoftheAnalysis
-ShowWaveform .AllowstoselecttodisplayornotdisplaytheoverlappedEEGwaveformswithintheanalysiswindow.
-Setthenumberofrowsandcolumns .Allowstodefinethenumberofrowsandcolumnsofelectrodesdisplayed.Alsoallowsselectiontoquicklydisplayallchannelsinanautomaticlayout.-ShowSensbar.AllowstoturnonoroffthedisplayofthetoolbarforincreaseanddecreaseofindividualEEGwaveformchannels.
-ShowMontage.Allowstoturnonorofftheoverlaidmontagechannelsoneachanalysiswindow.-ShowAnalysisInfo.Turnsonoroffthedisplayoftheanalysissettingsusedasdisplayedinthebottomoftheanalysiswindow.
TIMEFREQUENCYDISPLAY:
-AbsolutePower/AmplitudevsTemporalSpectralEvolution .AllowstoselectifthespectrogramdisplaysusingAbsolutePower/AmplitudeorTemporalSpectralEvolution.NotethatchangingthisdisplaymethodwillalsocorrespondingchangethespectralscaleatthebottomofthewindowtoPower/AmplitudeversusLogorPercentageasselected.
-AmplitudeversusPower .Allowstoselectifthequantitativedisplayusesamplitude(uV)orpower(uV^2).Scaleforquantitativemeasure,ifusingAmplitude/Powerwillalsochangeaccordingly.
-PercentorLogdisplayonTSE .ForTSEdisplay,selectsiftheactivityisdisplayedinapercentage(0-100%)versusalog(-1to1)format.-Smoothing.Selectsifthequantitativedisplayissmoothedornot.
WAVEFORMDISPLAY:
-ShoworhideindividualEEGwaveformsbasedonfilteredparametersnamed .
-WaveformSetup .Bringsupthewindow(aspreviouslydescribed)usedtonameandconfiguretheindividualEEGwaveforms.-BaselineCorrection.Allowstoturnonoroffthebaselineselection.Bydefaulttheinitial10%isusedforthebaseline,orasselectivelydefined.
TOOLBAROPTIONS:
-Gainupordown .Increasesordecreasesthegainofthespectraldisplay.Notethecorrespondingchangeofthescaleatthebottomoftheanalysiswindow.
-IncreaseordecreasetheindividualEEGwaveformsensitivities .Thisallowsforeasyadjustmentoftheindividualoverlappedwaveformsforoptimalviewing.Notechangetosensitivityscaleatbottomofanalysiswindow.
-AutoscalingofEEGwaveforms .AllowsforautomaticscalingofallEEGwaveformsoradjustmentofalldisplaygains.
. Increases or decreases the gain of the spectral display. Note the corresponding change of the scale at the bottom of the analysis window.
• Increase or decrease the individual EEG waveform sensitivities
EEGDisplayoftheAnalysis
-ShowWaveform .AllowstoselecttodisplayornotdisplaytheoverlappedEEGwaveformswithintheanalysiswindow.
-Setthenumberofrowsandcolumns .Allowstodefinethenumberofrowsandcolumnsofelectrodesdisplayed.Alsoallowsselectiontoquicklydisplayallchannelsinanautomaticlayout.-ShowSensbar.AllowstoturnonoroffthedisplayofthetoolbarforincreaseanddecreaseofindividualEEGwaveformchannels.
-ShowMontage.Allowstoturnonorofftheoverlaidmontagechannelsoneachanalysiswindow.-ShowAnalysisInfo.Turnsonoroffthedisplayoftheanalysissettingsusedasdisplayedinthebottomoftheanalysiswindow.
TIMEFREQUENCYDISPLAY:
-AbsolutePower/AmplitudevsTemporalSpectralEvolution .AllowstoselectifthespectrogramdisplaysusingAbsolutePower/AmplitudeorTemporalSpectralEvolution.NotethatchangingthisdisplaymethodwillalsocorrespondingchangethespectralscaleatthebottomofthewindowtoPower/AmplitudeversusLogorPercentageasselected.
-AmplitudeversusPower .Allowstoselectifthequantitativedisplayusesamplitude(uV)orpower(uV^2).Scaleforquantitativemeasure,ifusingAmplitude/Powerwillalsochangeaccordingly.
-PercentorLogdisplayonTSE .ForTSEdisplay,selectsiftheactivityisdisplayedinapercentage(0-100%)versusalog(-1to1)format.-Smoothing.Selectsifthequantitativedisplayissmoothedornot.
WAVEFORMDISPLAY:
-ShoworhideindividualEEGwaveformsbasedonfilteredparametersnamed .
-WaveformSetup .Bringsupthewindow(aspreviouslydescribed)usedtonameandconfiguretheindividualEEGwaveforms.-BaselineCorrection.Allowstoturnonoroffthebaselineselection.Bydefaulttheinitial10%isusedforthebaseline,orasselectivelydefined.
TOOLBAROPTIONS:
-Gainupordown .Increasesordecreasesthegainofthespectraldisplay.Notethecorrespondingchangeofthescaleatthebottomoftheanalysiswindow.
-IncreaseordecreasetheindividualEEGwaveformsensitivities .Thisallowsforeasyadjustmentoftheindividualoverlappedwaveformsforoptimalviewing.Notechangetosensitivityscaleatbottomofanalysiswindow.
-AutoscalingofEEGwaveforms .AllowsforautomaticscalingofallEEGwaveformsoradjustmentofalldisplaygains.
. This allows for easy adjustment of the individual overlapped waveforms for optimal viewing. Note change to sensitivity scale at bottom of analysis window.
• Autoscaling of EEG waveforms
EEGDisplayoftheAnalysis
-ShowWaveform .AllowstoselecttodisplayornotdisplaytheoverlappedEEGwaveformswithintheanalysiswindow.
-Setthenumberofrowsandcolumns .Allowstodefinethenumberofrowsandcolumnsofelectrodesdisplayed.Alsoallowsselectiontoquicklydisplayallchannelsinanautomaticlayout.-ShowSensbar.AllowstoturnonoroffthedisplayofthetoolbarforincreaseanddecreaseofindividualEEGwaveformchannels.
-ShowMontage.Allowstoturnonorofftheoverlaidmontagechannelsoneachanalysiswindow.-ShowAnalysisInfo.Turnsonoroffthedisplayoftheanalysissettingsusedasdisplayedinthebottomoftheanalysiswindow.
TIMEFREQUENCYDISPLAY:
-AbsolutePower/AmplitudevsTemporalSpectralEvolution .AllowstoselectifthespectrogramdisplaysusingAbsolutePower/AmplitudeorTemporalSpectralEvolution.NotethatchangingthisdisplaymethodwillalsocorrespondingchangethespectralscaleatthebottomofthewindowtoPower/AmplitudeversusLogorPercentageasselected.
-AmplitudeversusPower .Allowstoselectifthequantitativedisplayusesamplitude(uV)orpower(uV^2).Scaleforquantitativemeasure,ifusingAmplitude/Powerwillalsochangeaccordingly.
-PercentorLogdisplayonTSE .ForTSEdisplay,selectsiftheactivityisdisplayedinapercentage(0-100%)versusalog(-1to1)format.-Smoothing.Selectsifthequantitativedisplayissmoothedornot.
WAVEFORMDISPLAY:
-ShoworhideindividualEEGwaveformsbasedonfilteredparametersnamed .
-WaveformSetup .Bringsupthewindow(aspreviouslydescribed)usedtonameandconfiguretheindividualEEGwaveforms.-BaselineCorrection.Allowstoturnonoroffthebaselineselection.Bydefaulttheinitial10%isusedforthebaseline,orasselectivelydefined.
TOOLBAROPTIONS:
-Gainupordown .Increasesordecreasesthegainofthespectraldisplay.Notethecorrespondingchangeofthescaleatthebottomoftheanalysiswindow.
-IncreaseordecreasetheindividualEEGwaveformsensitivities .Thisallowsforeasyadjustmentoftheindividualoverlappedwaveformsforoptimalviewing.Notechangetosensitivityscaleatbottomofanalysiswindow.
-AutoscalingofEEGwaveforms .AllowsforautomaticscalingofallEEGwaveformsoradjustmentofalldisplaygains.
.
Allows for automatic scaling of all EEG waveforms or adjustment of all display gains.
• Paging control -Pagingcontrol .Allowsformovinganalysiswindowforwardorbackwardbyonepageor1/10thofapage.Thisallowseasyarrangementofactivitydisplaytooptimizeviewingofwidebandactivity.
. Allows for moving analysis window forward or backward by one page or 1/10th of a page. This allows easy arrangement of activity display to optimize viewing of wide band activity.

us.nihonkohden.com

us.nihonkohden.com

NMLB 144 [A]-CO-2608
Exceptional Solutions, Simply Delivered is a trademark of Nihon Kohden.
For more information, please contact us at 1-800-325-0283 or visit us.nihonkohden.com