Embed Size (px)
Citation preview

WIDER Working Paper 2016/73
Microsimulation of impacts of tax and transfer in Viet Nam
Feasibility study
Duong Anh Nguyen, Minh Binh Tran, and Anh Mai Le*
June 2016

* All authors Department for Macroeconomic Policy and Integration Studies, Central Institute for Economic Management (CIEM), Hanoi, Viet Nam. Corresponding author: Duong Anh Nguyen, [email protected].
This study has been prepared within the UNU-WIDER project on ‘The economics and politics of taxation and social protection’.
Copyright © UNU-WIDER 2016
Information and requests: [email protected]
ISSN 1798-7237 ISBN 978-92-9256-116-1
Typescript prepared by Leslie O’Brien.
The United Nations University World Institute for Development Economics Research provides economic analysis and policy advice with the aim of promoting sustainable and equitable development. The Institute began operations in 1985 in Helsinki, Finland, as the first research and training centre of the United Nations University. Today it is a unique blend of think tank, research institute, and UN agency—providing a range of services from policy advice to governments as well as freely available original research.
The Institute is funded through income from an endowment fund with additional contributions to its work programme from Denmark, Finland, Sweden, and the United Kingdom.
Katajanokanlaituri 6 B, 00160 Helsinki, Finland
The views expressed in this paper are those of the author(s), and do not necessarily reflect the views of the Institute or the United Nations University, nor the programme/project donors.
Abstract: This paper assesses the feasibility of simulating the distributional impacts produced by various tax and transfer instruments in Viet Nam. Viet Nam’s system of tax and transfer policies underwent frequent changes, in terms of diversity and adjustment scope. The most important source of data is the Viet Nam Household Living Standards Survey. Investigation of the survey data shows the wide-ranging feasibility of simulating tax and benefit instruments, though more details are available for transfer instruments. The microsimulation should thus focus more on the transfer instruments, which invites interests from a range of government agencies, international organizations, and non-governmental organizations.
Keywords: microsimulation, tax, transfer, distributional impact, Viet Nam JEL classification: C15, D04, D31, H21, H24, H53
Acknowledgements: The authors are thankful to UNU-WIDER for supporting the preparation of this paper. We are indebted to Jukka Pirttila and Toon Vanheukelom for thoughtful guidance, comments, and suggestions for improving the paper. The views and opinions expressed in this paper are solely of the authors, and may not necessarily reflect those of the Central Institute for Economic Management of Viet Nam. All remaining errors are solely of the authors.

1
1 Introduction
Viet Nam has embarked on drastic economic reforms since the start of Doi Moi (Renovation) in 1986. Despite uneven paces in different periods, such reforms mainly sought to improve simultaneously the market foundations for Viet Nam’s economy, to engage in international economic integration, and to maintain macroeconomic stability. International economic integration and domestic reforms both served to enhance economic opportunities for the people. Meanwhile, macroeconomic stability generally made way for more relevant price signals and thus more efficient resource allocation. Underlying economic reforms and economic integration has been the change in viewpoints towards the roles of the government and its interventions in the economy. Specifically, the state gradually focused more on facilitating economic activities and correcting market failures, whilst promoting economic freedom for the private sector. Altogether, these contextual improvements facilitated Viet Nam’s socio-economic development process.
The period of 2001–15 has witnessed even more comprehensive and bolder attempts of Viet Nam for economic integration. In line with this, domestic reforms were further advanced in various areas, including state-owned enterprises, banking, public investment, price management, legal framework, etc. At the same time, Viet Nam experienced significant changes in the macroeconomic situation, with major outbreaks of instability in 2007–08 and since late 2010. Such changes partly resulted from external factors, namely: (i) integration into the regional and world economies (via bilateral trade agreement with the United States, World Trade Organization (WTO) accession, various free trade agreements, etc.); and (ii) external shocks (SARS; global financial crisis and economic recession in 2008–09; high oil prices in 2007 and early 2008; rapid hike in food prices in 2008; etc.). These external factors did not work on their own; instead, they closely interacted with the inherent developments, including policy adjustments and own liberalization attempts, to affect Viet Nam’s economic development. Ultimately, the livelihood of people was also affected, which necessitated follow-up changes in tax and transfer policies in Viet Nam, particularly during 2008–12.
Thanks to the above reforms and contextual developments, Viet Nam made various socioeconomic achievements in the past decades. Growth in Gross Domestic Product (GDP) has been continuous, reaching more than 7.4 per cent per annum on average in 1990–10. From the expenditure side, GDP growth was largely sourced from investment and export expansion. Meanwhile, GDP structure shifted away from agriculture-forestry-fishery towards industry-construction, due to drastic growth of the latter. Moreover, Viet Nam’s growth process has been more inclusive. With better participation in economic activities, people’s income was therefore improved significantly. Consequently, the poverty incidence fell sharply from 37.4 per cent in 1998 to just over 12 per cent in 2010 and around 7–7.2 per cent in 2015.
Apart from the benefits, increasing participation in the regional and world economies also makes Viet Nam’s economy more vulnerable to adverse developments in the international markets. On the one hand, the reduction of important tariffs in the absence of replacing domestic tax instruments actually caused increasing concern over declining budget revenues and the fear that it would drain budgetary resources available for direct transfer to households. On the other hand, more direct exposure to international market shocks also increased the vulnerability of domestic households, which in turn requires more relevant and targeted support from the government budget. The impact is not only profound at the macro level, but also attracts attention due to its differential magnitude on different households.

2
As one direction of work to address the above issues, Viet Nam needs to improve its capacity of undertaking ex ante policy impact assessments, particularly with respect to how various tax instruments and transfers affect the households. This issue becomes even more important when household incomes have been more vastly diversified in terms of level, source, exposure to tax, and reliance on transfer, where the use of a representative household no longer suits. In addition, trial and error approach to such policy changes can be more costly, as impacts on the poor and other social groups can hardly be reversed. A modelling approach, with its capacity to quantify the possible macro and/or micro impacts of price changes on certain groups, can help fill in this gap.
This paper attempts to assess the feasibility of conducting a microeconomic simulation of possible distributional impacts produced by various tax and transfer instruments in Viet Nam. In doing so, the study mainly adopts a qualitative approach, reviewing the existing literature and information on household characteristics and related policy information in Viet Nam.
Apart from the Introduction, the remainder of this paper is structured as follows. Section 2 provides a brief literature review of basic information on Viet Nam’s policy framework. Section 3 then describes the tax system. Section 4 focuses on the system of benefits/transfer items. Section 5 looks into the availability of household data from different sources. Section 6 assesses the feasibility of a study on simulating tax-transfer items. Section 7 then discusses the potential partners in the study. Section 8, finally, brainstorms on the perspective of the Central Institute for Economic Management (CIEM) of building and making use of the micro-simulations of tax and transfer policies.
2 Background information
This section intends to discuss the general policy framework that may affect income and poverty level throughout Viet Nam. This will lay the foundation for more concrete discussion of taxes and transfer instruments in subsequent sections. Given the scope of this paper, this section focuses mainly on: (i) general policy framework in Viet Nam of relevance to household income and spending; (ii) income and poverty situation in Viet Nam; and (iii) labour and employment in Viet Nam.
2.1 General policy framework in Viet Nam
Under Viet Nam’s system, the policies are implemented by ministries, ministerial-level agencies, and line authorities. The policies generally assign the tasks to these agencies and authorities, and they have to prepare their own plans for implementation. As a note, the local authorities at the provincial, district levels have almost the same structure of the ministries at the central government, with specific bodies responsible for trade and industry, agriculture and rural development, labour affairs, education and training, etc.
Resources for these ministries and line authorities are largely from the corresponding levels of state budget, though official development assistance (ODA), state credit, proceedings from government bonds or city bonds can be used to finance specific programmes. Apart from that, there might be some charity activities by various social groups and enterprises, and livelihood programmes implemented by non-governmental organizations (NGOs) under the permission of relevant central and local authorities. For instance, ActionAID International Viet Nam has implemented the economic empowerment programme for years in selected provinces, seeking to

3
train local people on economic activities and granting them credits for actual economic activities.1
Regarding the fiscal year, Viet Nam adopts the convention of calendar year as the fiscal year. As an instance, the fiscal year for 2012 started 1 January 2012, and ended 31 December 2012. In this fiscal year of 2012 (where most recent data are available), Viet Nam implemented a temporary waiver of income tax for those with monthly income of VND9 million or less. The period for applying such a waiver was from 1 July 2012 until 31 December 2012.2
The pension system in Viet Nam mainly relies on the state via Social Security of Viet Nam. Social Security of Viet Nam is the state organization, with specific mandate to manage social insurance funds (including health insurance). No private provider of pension is present. In general, the state applies the pension age of 60 for men and 55 for women. Not all people are entitled to pension at stated age.3 This is due to two reasons. First, the employees may have inadequate period of social insurance contribution during their work tenure. Second, mandatory social insurance contributions were only legalized for formally employed labourers. Meanwhile, labourers in the informal sectors or self-employed in agriculture, forestry, and fishery made limited social insurance contributions.
Together with economic reforms in the past decades, Viet Nam has also paid immense attention to social targets. During the years from 2000 to 2015, the country has committed to the Millennium Development Goals (MDGs). Under the MDGs, Viet Nam was committed to: (i) eradicate extreme poverty and hunger; (ii) achieve universal primary education; (iii) promote gender equality and empower women; (iv) reduce child mortality; (v) improve maternal health; (vi) combat HIV/AIDS, malaria, and other diseases; (vii) ensure environmental sustainability; and (viii) promote a global partnership for development. Under the themes from (i) to (vii), the country dedicated its own resources and/or mobilized support from international donors. Such resources were for building knowledge and empowerment of local people, technical assistance, upgrading relevant physical infrastructures, etc. Since 2015, Viet Nam joined the Sustainable Development Goals (SDGs, also known as the Global Goals), which comprise 17 areas and carry the MDG work forward until the year 2030.
Related to education, Viet Nam’s schooling system consists of three levels, namely: primary school, lower secondary school, and upper secondary school. Pupils generally finish primary school at age 11, lower secondary school at age 15, and upper secondary at 18. After finishing upper secondary school, the graduates may choose to go to university, technical college, or vocational school should they want to pursue higher education. Viet Nam’s education system remains dominated by state providers at all levels. Nonetheless, the presence of non-state providers has been increasing over time. Since accession to the WTO in 2007, in particular, various foreign educational institutions have established their presence in Viet Nam.
As of the start of school year 2015–16, Viet Nam had 4.5 million children going to kindergartens, 7.6 million pupils at primary schools, 5.2 million at lower secondary schools, and 2.4 million at upper secondary schools. However, the actual age when the pupil ceased their studies varied from one locality to another. In particular, the poor and mountainous areas often see a number of pupils quitting school before completion. As a result, the data on enrolment rate
1 For more details, see: http://www.actionaid.org/vietnam.
2 Under the Resolution No. 29/2012/QH13 dated 21 June 2012 of the National Assembly.
3 For more details, see Section 4.

4
in Viet Nam lack some consistency. Overall, as of September 2015, Viet Nam had 1.5 per cent of children between 7–11 years old who did not go to primary schools; 6.0 per cent of children between 11–15 years old did not go to lower secondary schools; and 24.1 per cent of children between 15–18 years old did not attend upper secondary schools (Hanoi Portal 2015). Given this gap in providing education and the state’s involvement in education, the state would continue to incur significant expenditure on education, either directly to households or indirectly via state education providers.
In terms of health, the dominance of state providers is even more profound than in education system. The health system is generally divided into three levels, namely: (i) Central level; (ii) provincial level; and (iii) local level. Central level institutions include the Ministry of Health, and all Central hospitals and institutes. The provincial and local level institutions include local branches of Ministry of Health (responsible for healthcare, food safety, birth control), local hospitals, and healthcare centres. Most of the health system’s expenditures have been assumed by the state, either directly from the state budget or via health insurance fund (under Social Security of Viet Nam). Only a modest share of expenditures on healthcare at these public institutions were financed by patients themselves, largely on a voluntary basis as the cost went beyond insurance limit. In addition, the state regulates the prices and fees of an array of healthcare services and pharmaceutical products, and makes decisions to increase such prices and fees at times. In private hospitals, the patients usually have to pay higher prices, mostly afforded by those with higher incomes or via private insurance schemes.
Due to highly emphasized targets on SDGs and deep involvement in the health and education sector, the state has to allocate significant resources for relevant household- or sector-targeted programmes. Such programmes may range from direct subsidy for the poor in using health and education sector, to promoting reduction of general poverty and hunger incidence. Nonetheless, the resources for such programmes have decreased in availability during 2011–15, perhaps due to several reasons. First, economic growth has been slower in 2011–15 relative to 2006–10 (Figure 1), due to greater focus on macroeconomic stabilization and restructuring the economy (CIEM 2013, 2015, 2016). Second, Viet Nam already made excessive use of fiscal stimulus package in 2009–10. To mitigate the impacts of the global financial crisis, the country employed a fiscal stimulus package worth VND145.6 trillion (or 8.7 per cent of GDP, Table 1). Contemporary estimations by the CIEM show that this package only helped increase GDP growth rate by 1–1.5 percentage points (Nguyen 2013a). Third, Viet Nam has graduated from low-income status, which reduced its access to preferential ODA. Due to smaller resource availability for state budget, Viet Nam has to revisit carefully various items of budget expenditures and revenues.4
4 These will be discussed in turn in Sections 3 and 4.

5
Figure 1: GDP growth in Viet Nam, 2000–15
Source: GSO (2015a, 2015b).
Table 1: Viet Nam’s fiscal stimulus package in 2009
Announcement
1 Interest rate subsidy for current capital loans 17,000
2 State development investment 90,800
Various items5 70,800
Issuance of additional bonds 20,000
3 Exemption, reduction, and deferral of taxes 28,000
4 Other expenditures to ensure social security 9,800
Total 145,600
Note: Unit: billion VND. Exchange rate for 2009: US$1=VND18,479.
Source: State Bank of Vietnam (2010); Vo (2011).
2.2 Poverty trends in Viet Nam
The poverty and inequality exhibit different patterns of changes in different periods, namely: (i) from 1998–2000; (ii) from 2001–06; and (iii) from 2007–15.
During 1998–2000, the slow but positive economic growth still made way for social development in Viet Nam. The poverty rate fell from 58.1 per cent in 1990 to 37.4 per cent in 1998 (Table 2), though rural poverty remained high (almost 44.9 per cent). While the poverty rate was rather low in the South East (7.6 per cent), it amounted to 64.5 per cent in the Northern midland and mountainous areas. It should be noted that the figure of poverty under national poverty line6 is smaller than that under the international standards7 (Table 2). In addition, the
5 Including advancement of budget for investment projects of high importance, carried-over capital expenditure from 2008, investment from state budget, etc.
6 For instance, as defined under the Decision No. 09/2011/QD-TTg dated 30 January 2011, the poor households in rural areas are those having average income under VND400,000 per capita per month (equivalent to about US$18 per capita per month). Households in urban areas are classified as poor if their income per capita per month is under VND500,000 (approximately equal to US$22.5 per capita per month). This definition applies for the period from 2011–2015. As can be seen, the national poverty line, even in urban areas, is well below international levels (either US$1.25/day or US$2/day) (State Bank of Vietnam 2010; Prime Minister 2011).
4
5
6
7
8
9
2000 2001 2002 2003 2004 2005 2006 2007 2008 2009 2010 2011 2012 2013 2014 2015
GDP growth Average 2006-2010 Average 2011-2015

6
poverty gap is rather modest in 1998, reaching 14.9 per cent and 34.0 per cent, respectively under the poverty lines of US$1.25/day and US$2/day.
Table 2: Poverty rate under national poverty line, 1998–2014
1998 2002 2004 2006 2008 2010 2012 2014
National Poverty rate 37.4 28.9 18.1 15.5 13.4 14.2 11.1 8.4
By area
Urban 9.0 6.6 8.6 7.7 6.7 6.9 4.3 3.0
Rural 44.9 35.6 21.2 18.0 16.1 17.4 14.1 10.8
By region
Red River Delta 30.7 21.5 12.7 10.0 8.6 8.3 6.0 4.0
Northern midland and mountainous areas 64.5 47.9 29.4 27.5 25.1 29.4 23.8 18.4
North Central and coastal Central region 42.5 35.7 25.3 22.2 19.2 20.4 16.1 11.8
Central Highland 52.4 51.8 29.2 24.0 21.0 22.2 17.8 13.8
South East 7.6 8.2 4.6 3.1 2.5 2.3 1.3 1.0
Mekong River Delta 36.9 23.4 15.3 13.0 11.4 12.6 10.1 7.9
Other poverty-related indicators
Gini 35.5 37.6 36.8 35.8 35.6 39.3 35.6 -
Income share (top 20 per cent) 44.0 45.6 44.5 43.3 43.4 46.2 43.0 -
Income share (bottom 20 per cent) 8.0 7.5 7.2 7.2 7.4 6.5 7.0 -
Poverty gap
Poverty (US$1.25/day) 14.9 11.2 8.4 5.3 3.7 0.8 0.6 -
Poverty (US$2/day) 34.0 28.0 22.9 16.3 13.5 4.2 2.9 -
Poverty headcount ratio
Poverty (US$1.25/day) 49.4 40.1 31.4 21.4 16.8 3.9 2.4 -
Poverty (US$2/day) 78.1 68.7 60.4 48.1 43.3 16.8 12.5 -
Source: Poverty rates are from GSO (2016a); other poverty-related indicators are from World Bank (2015).
As another note, Viet Nam started to see the problem of income inequality. The Gini index reached 35.5 per cent in 1998 (Table 2). However, the 20 per cent richest population already accounted for 44.0 per cent of total income. The corresponding figure for the 20 per cent poorest people was just 8.0 per cent.
In the years 2001–06, recovery and acceleration of economic growth facilitated better progress toward social development in Viet Nam. The poverty rate continued to decrease to 28.9 per cent in 2002 and 15.5 per cent in 2006 (Table 2). More importantly, poverty rate fell nationwide, in both rural and urban areas. The peak poverty rate dropped sharply to 47.9 per cent in 2002 and 27.5 per cent in 2006 in the Northern midland and mountainous areas. Again, since the national poverty line was below the international standards, the table shows higher poverty headcount ratio in 2002–06, despite improvement. The poverty gap also became smaller: as of 2006, the figure reached 5.3 per cent and 16.3 per cent, respectively, under the poverty lines of US$1.25/day and US$2/day. Access to infrastructures services was also enhanced. Eighty-three per cent of the rural population had access to improved water source in 2006, compared with 72
7 Using the poverty lines of US$1.25/day and US$2/day.

7
per cent in 2000. The corresponding figures for urban populations are 96 per cent and 94 per cent. The use of sanitation facilities became more popular, reaching 65 per cent of population in 2006 compared with 54 per cent in 2000. The trend of income inequality was rather mixed in this period. The Gini index increased from 35.5 per cent in 1998 to 37.6 per cent in 2002 (Table 2), implying slightly higher inequality in income. This figure is further complemented by the shares in income of the top and bottom quintiles: the 20 per cent richest population had 45.6 per cent of total income (i.e. higher than in 1998), while the 20 per cent poorest people accounted for just 7.5 per cent (i.e. smaller than in 1998). In 2004–06, however, income inequality was lessened. The Gini index fell continuously to 35.8 per cent in 2006. The income share of the top quintile decreased to 43.3 per cent, while that of the bottom quintile dropped further to 7.2 per cent. As an implication, the poorest and disadvantaged group still experienced difficulties in joining economic activities for generating income.
Between 2007 and 2014, Viet Nam continued to make progress in social aspects. Notwithstanding the upward adjustments of national poverty line, the poverty rate continued to decrease to 13.4 per cent in 2008, 12.6 per cent in 2011, and 8.4 per cent in 2014 (Table 2). Following the trend in 2001–06, poverty reduction has been universal in Viet Nam, with more rapid pace in the rural areas (falling to 16.1 per cent in 2008 and 10.8 per cent in 2014). The Northern midland and mountainous areas continued to experience highest poverty incidence, but the figure dropped further to 25.1 per cent and 18.4 per cent in 2008 and 2014, respectively. The figures for the Red River Delta and the South East were almost negligible in 2014. As an important note, the gap between poverty rate under national poverty line and the international standards became significantly smaller in 2012–14 (Table 2). The poverty gaps fell even more sharply to 0.6 per cent and 2.9 per cent in 2012 under the poverty line of US$1.25/day and US$2/day, respectively. That is, even during the time of slower economic growth, Viet Nam still paid attention to reducing poverty. Access to improved water source and sanitation facilities was also increased. In particular, 94 per cent of rural population had access to improved water source, and 75 per cent of the population used improved sanitation facilities in 2013.
Still, change in income inequality remained ambiguous (Table 2). The Gini index rose to 39.3 per cent in 2010 compared with 35.8 per cent in 2006. In 2010, also, the top quintile reaped the share of 46.2 per cent in national income, i.e. higher than that in 2006 (43.3 per cent). At the same time, the bottom quintile only accounted for 6.5 per cent of total income, reflecting a decrease from 7.2 per cent in 2006. The trend was somehow reversed in 2010–12, with the Gini index and the income share of the top quintile falling, while the share of the bottom quintile rose slightly.
2.3 Labour and employment in Viet Nam
Under Viet Nam’s statistical system, unemployed people are defined as: (i) those who currently have no job but are willing and aspire to have one; (ii) those seeking paid jobs, including those who have never worked before. The number of unemployed people also include some special groups, namely: (i) those who are on temporary displacement from work but are not guaranteed the same job upon return, whilst being willing to work or seek new jobs; (ii) those who do not seek employment in the reference period because they will be assigned a new job after returning from temporary displacement; (iii) those quitting jobs without salary/wage; or (iv) those who do not seek jobs because of belief of their limitations/disadvantages (e.g. poor health or poor skill/qualification, etc.).
Underemployment refers to the situation where: (i) the employee wants to work more (either more jobs, or replacement of current job by another for more hours, or more hours of a current job, or any combination of these three scenarios); (ii) the employee is willing to work for more

8
hours; (iii) the employee actually works less than a certain threshold in a reference week (e.g. underemployment refers to less than 35 hours per week of work).
Table 3 presents the unemployment rate and underemployment rate by region in Viet Nam during 2013–14. The overall unemployment rate in 2014 was 2.1 per cent, just a little bit lower than that in 2013 (2.18 per cent). Meanwhile, 2.35 per cent of employees are underemployed in 2014, representing a decrease from that in 2013 (2.75 per cent). In general, the unemployment rate tends to be larger in urban areas than in rural ones. Conversely, the underemployment rate appears to be higher in rural areas compared with urban ones.
Table 3: Unemployment rate and underemployment rate, 2013–14
Year Region Unemployment rate (%) Underemployment rate (%)
Overall Urban Rural Overall Urban Rural
2014 Whole country 2.10 3.40 1.49 2.35 1.20 2.90
Red River Delta 2.82 4.86 1.87 2.44 0.99 3.12
Northern midland and mountainous areas 0.76 2.35 0.46 1.45 1.03 1.52
North Central and coastal Central region 2.23 3.71 1.70 2.58 1.86 2.84
Central Highland 1.22 1.94 0.93 2.49 1.89 2.73
South East 2.47 3.00 1.60 0.61 0.30 1.11
Mekong River Delta 2.06 2.79 1.83 4.20 2.32 4.80
2013 Whole country 2.18 3.59 1.54 2.75 1.48 3.31
Red River Delta 2.65 5.13 1.60 2.66 1.33 3.20
Northern midland and mountainous areas 0.81 2.26 0.54 1.67 1.23 1.75
North Central and coastal Central region 2.15 3.81 1.58 2.90 2.39 3.07
Central Highland 1.51 2.07 1.30 2.42 2.09 2.54
South East 2.70 3.34 1.69 0.92 0.43 1.68
Mekong River Delta 2.42 2.96 2.24 5.20 2.80 6.00
Note: Underemployment rate is calculated from annual labour force survey.
Source: GSO (2016b).
Compared to other countries, the unemployment rate and underemployment rate in Viet Nam are generally lower. The main reason for this lies in the significant agricultural sector in Viet Nam. Accordingly, labourers without jobs in other sectors could readily return to agriculture to work. This case was most profound in 2009, as agriculture served as the job buffer for labourers being laid off from industrial enterprises after the global financial crisis.
Another noteworthy feature in the case of Viet Nam has been the sizeable informal sector. Notwithstanding its presence, estimating the size of informal sector has never been easy. Various studies in the 1990s mainly rely on a small-scale survey to estimate the extent of informal sector (Cling et al. 2011). Cling et al. (2011) presents the most recent projection of informal employment in Viet Nam. As can be seen in Table 4, informal sector accounted for almost 23.5 per cent of total employment in 2007, and was projected to increase to 26.0 per cent in 2010, and 27.2 per cent in 2015.

9
Table 4: Projection of employment in the informal sector of Viet Nam, 2007–15
2007 (adjusted) 2010 (projections) 2015 (projections)
No. (‘000) Structure (%)
No. (‘000) Structure (%)
No. (‘000) Structure (%)
Public sector 4,954 10.5 4,865 9.7 4,810 8.9
Foreign enterprises
907 1.9 1,508 3.0 2,522 4.6
Domestic enterprises
2,646 5.6 3,932 7.9 5,883 10.8
Formal household businesses
3,584 7.6 3,679 7.3 3,801 7.0
Informal household business
10,866 23.0 12,759 25.5 14,444 26.6
Agriculture 23,118 49.0 22,253 44.4 2,570 4.7
Total employment
46,211 98.0 48,996 97.8 53,031 97.8
Unemployment 935 2.0 1,084 2.2 1,209 2.2
Active population
47,146 100.0 50,080 100.0 54,240 100.0
Source: Revised from Cling et al. (2011: 52), with denominators being the total labour force.
Finally, Viet Nam’s population increased continuously in the period 1995–2015, with the average annual growth rate of 1.22 per cent. As of mid-2015, total population is estimated to reach 91.7 million persons, including 45.25 million male persons; 46.45 million female persons (Figure 2). As of March 2016, population data for 2015 are only disaggregated by gender and by broad region (rural areas or urban areas). Meanwhile, annual population data for 1995–2014 are disaggregated by gender, by broad region (rural areas or urban areas), and by province. The most recent Population Census was carried out in 2009, with the major mid-term update in 2014.
Figure 2: Viet Nam’s population by gender, 1995–2015
Note: Unit: ‘000 persons. Female share (%) is measured on the right-hand axis.
Source: GSO (2015b, 2016c).
50.1
50.2
50.3
50.4
50.5
50.6
50.7
50.8
50.9
51.0
51.1
0
10,000
20,000
30,000
40,000
50,000
60,000
70,000
80,000
90,000
100,000
Population ('000 persons) Female share (%)
10
3 Description of tax and social insurance systems
In general, the policies on taxes and fees issued by central government agencies are applied nationwide. These include the policies on personal income tax, fees, contribution to social insurance (including health insurance), etc. However, subject to delegated authority, the local governments may also have their own items of tax-equivalent fees and transfers to enforce.
3.1 Tax system
Viet Nam’s tax system is currently under renovation process. The changes were more dramatic since 2007, as Viet Nam had to revert to domestic revenues as replacement for revenues from trade (following drastic tariff reduction under the WTO). All economic activities are subject to the types of taxes as follows:
a. Corporate income tax: is the ad valorem tax levied on income of business entities, at the rate of 25 per cent (before 2014) and 22 per cent (since 2014). The exception is with oil and gas extraction where the rate ranges from 32 per cent to 50 per cent, depending on the locality and actual project condition. To promote investment in some sectors or areas, the government may waive and/or reduce corporate income tax.
b. Foreign contractor tax: is the tax applicable on payment to foreign contractors, which includes interest rate payment, copyright fee, service fees, insurance premium, transportation fees, etc.
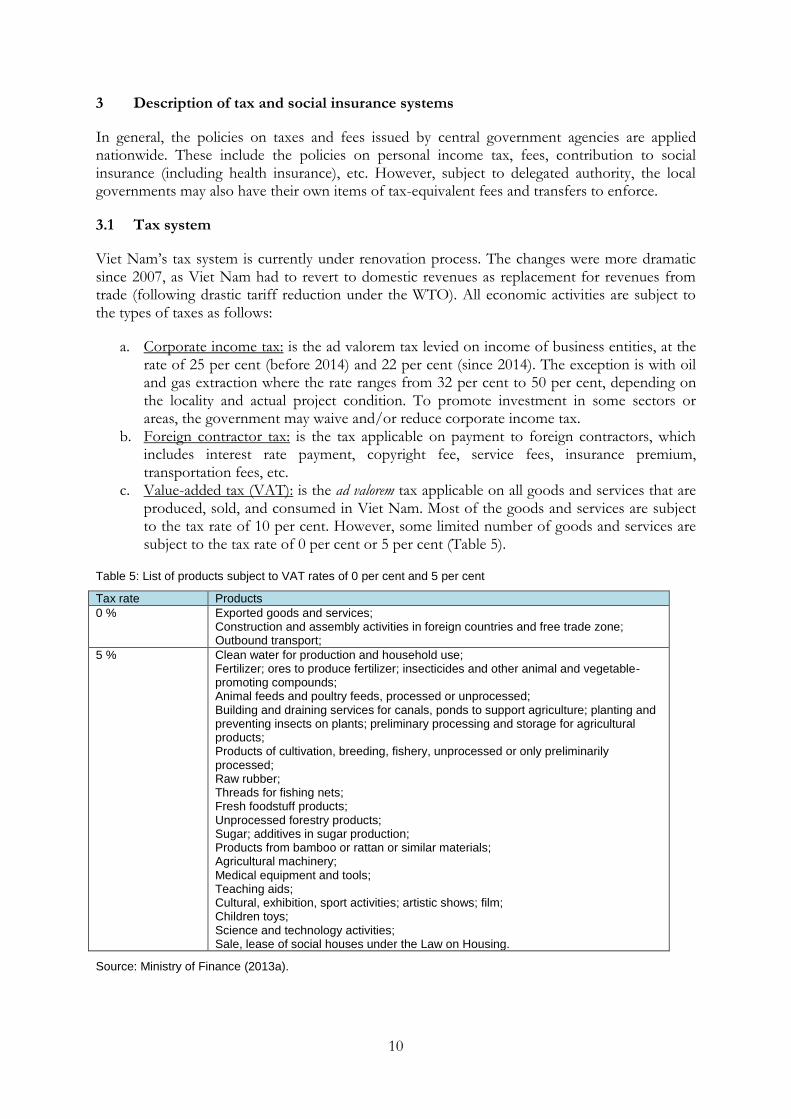
c. Value-added tax (VAT): is the ad valorem tax applicable on all goods and services that are produced, sold, and consumed in Viet Nam. Most of the goods and services are subject to the tax rate of 10 per cent. However, some limited number of goods and services are subject to the tax rate of 0 per cent or 5 per cent (Table 5).
Table 5: List of products subject to VAT rates of 0 per cent and 5 per cent
Tax rate Products
0 % Exported goods and services; Construction and assembly activities in foreign countries and free trade zone; Outbound transport;
5 % Clean water for production and household use; Fertilizer; ores to produce fertilizer; insecticides and other animal and vegetable-promoting compounds; Animal feeds and poultry feeds, processed or unprocessed; Building and draining services for canals, ponds to support agriculture; planting and preventing insects on plants; preliminary processing and storage for agricultural products; Products of cultivation, breeding, fishery, unprocessed or only preliminarily processed; Raw rubber; Threads for fishing nets; Fresh foodstuff products; Unprocessed forestry products; Sugar; additives in sugar production; Products from bamboo or rattan or similar materials; Agricultural machinery; Medical equipment and tools; Teaching aids; Cultural, exhibition, sport activities; artistic shows; film; Children toys; Science and technology activities; Sale, lease of social houses under the Law on Housing.
Source: Ministry of Finance (2013a).

11
d. Import tariff: is the tax applicable on imported products. The actual tax rate varies depending on the classification of product, exporting country, satisfaction of rule of origin, etc. As will be discussed later, this constitutes an important source of revenue for the government, despite smaller share over time due to the trade-liberalization-induced process of phasing out tariff (Figure 3).
Figure 3: Trade-weighted import tariff of Viet Nam, 2001–14
Source: World Bank (2016).
e. Special sales tax: is the tax applicable only to the sale and import of some special products and services. The products subject to special sales tax include: automobiles (of less than 24 seats), beer, cigars, cigarettes, wine and alcohol, motorbikes (of more than 125 cubic centimetres in cylinder), aircraft, yachts, petrol (of all kinds), air conditioners (of less than 90,000 BTU in capacity), playing cards, and joss papers. Such tax is also levied on services, including discotheques, massage, karaoke, casinos, jackpots, slot machines, betting, lottery, and golf. The tax base is the domestic producer price before VAT (for domestically produced goods) or import price plus import tariff (for imported products).
f. Natural resource tax: is the tax levied on the extraction of natural resources such as oil, gas, minerals, products from natural forest, natural aquatic products, and natural water.
g. Real estate tax: is the tax payable for the use of land/real estate by individuals and business entities.
h. Export tax: is the tax applicable on some export products. However, the number of products subject to export tax is quite few.
i. Environment protection tax: is the indirect tax levied on the products of which the production and/or import may cause adverse impacts on the environment.
j. Personal income tax of Vietnamese and foreign staff: is the tax applicable on taxable income of Vietnamese employees and foreign staff working in Viet Nam. Prior to 2007, Viet Nam focused mainly on collecting income from high-income earners. It was only since 2007 that Viet Nam began to implement the personal income tax on a broader group of income earners. The actual brackets and tax rates are covered in Table 6. All income sources are taxed equally, while the income earner has to file the tax declaration individually. The tax bracket will be changed subject to the decision of the Standing Committee of the National Assembly provided that the consumer price index has
17.4
10.6
3.4
0
5
10
15
20
2001 2002 2003 2004 2005 2006 2007 2008 2010 2013 2014

12
increased by more than 20 per cent (from the base level as of July 2013) (National Assembly 2013).
In tax terms, dependent children are defined as: (i) children younger than 18 years old; or (ii) disabled children without capability to work; or (iii) children older than 18 years old who are studying at universities, technical colleges, professional schools, or vocational schools. Other dependent people include: (i) spouse without capability to work; (ii) parents who have already retired or have no capability to work; and (iii) those that the taxpayers have to support directly.
In the case of Viet Nam, income tax is calculated on an individual basis. At the end of the fiscal year, each income earner has to file their own tax declaration, with their own items of income and tax-deductible expenses. The income earners in the family also have to decide to whom the dependent children are assigned. As an example, dependent children can be listed in the tax declaration of mother to reduce taxable income, without caring about the income level of the father. Under the Law on Personal Income Tax in 2007, each income earner has a tax-free income of VND4 million per month (or VND48 million per year) while the tax deductible expenses for each dependent child/person are set at VND1.6 million per month (or VND19.2 million per year). Under the Law on Personal Income Tax in 2012, which took effect 1 July 2013, the tax-free income is set at VND9 million per month (or VND108 million per year), and the tax deductible expenses are increased to VND3.6 million per month (or VND43.2 million per year) (National Assembly 2013).
Until 1 July 2013, the brackets for taxable income were fixed, i.e. without indexation to adjust for inflation. Since 1 July 2013, under the amended Law on Personal Income Tax in 2012, the brackets may be subject to change under the authority of the Standing Committee of the National Assembly should the consumer price index increase by more than 20 per cent.8
Table 6: Income tax brackets
Bracket Taxable income (mil. VND/year)
Taxable income (mil. VND/month) Tax rate (%)
1 Up to 60 To 5 5
2 From 60 to 120 From 5 to 10 10
3 From 120 to 216 From 10 to 18 15
4 From 216 to 384 From 18 to 32 20
5 From 384 to 624 From 32 to 52 25
6 From 624 to 960 From 52 to 80 30
7 Above 960 From 80 35
Note: US$1 = VND22,272.
Source: Authors’ calculations based on National Assembly (2013).
Budget revenues as percentage of GDP varied in different periods (Figure 4). During the years from 1995–99, the figure tended to decrease, largely because of slower economic growth under the impacts of the Asian monetary-financial crisis, which necessitated demand stimulus measures of the government. In the period 2000–11, however, budget revenues went up relatively more rapidly compared to GDP. It should be noted that this period witnessed high economic growth, which was heavily based on investment (including public investment). It was only since 2012 that budget revenues decreased again, with a view to reduce economic burden on the private sector.
8 In fact, the consumer price index rose by 5.8 per cent during July 2013–December 2015.

13
Figure 4: Budget revenues as percentage of GDP
Note: Unit: %.
Source: Authors’ compilations based on CEIC database (2011) and Ministry of Finance (2013b, 2014a, 2014b, 2015a, 2015b).
Table 7 shows the contribution of different tax instruments to total revenues. As can be seen, VAT and corporate income tax constitute the major sources of revenues. The share of VAT in total revenues went up from roughly 12.9 per cent in 2000 to 28.4 per cent in 2010, then fell to 16.8 per cent in 2012, before rising back again to 28.6 per cent in 2015. The figure for corporate income tax rose from 24.5 per cent in 2000 to 35.7 per cent in 2006, and then trended downward to more than 18.4 per cent in 2015. Due to the reduction of import tariff, the revenues from trade (i.e. import and export taxes) had its share in total revenues decrease from 18.0 per cent in 2002 to 9.4 per cent in 2006, then fluctuated before reaching 10.2 per cent in 2015. Revenues from special sales tax and personal income tax only made up small shares of total budget revenues.
Table 7: Share of budget revenues by tax instrument (%)
VAT Special sales tax
Corporate income tax
Personal income tax
Revenues from trade
Other taxes
2000 12.88 5.79 24.51 2.02 14.81 40.01
2001 13.43 6.00 24.84 1.98 16.80 36.95
2002 21.29 5.98 24.05 1.92 18.01 28.75
2003 21.76 5.81 31.14 1.94 14.04 25.32
2004 20.33 6.69 29.85 1.84 11.32 29.97
2005 20.10 6.88 33.22 1.85 10.36 27.58
2006 19.73 6.15 35.71 1.85 9.40 27.15
2007 21.29 5.30 31.88 2.26 11.71 27.56
2008 21.25 5.14 31.88 3.01 13.92 24.81
2009 24.08 6.57 25.34 3.24 17.42 23.36
2010 28.37 6.78 25.69 4.70 13.20 21.26
2011 19.94 4.43 20.36 3.99 8.45 42.81
2012 16.76 4.18 20.78 4.33 6.86 47.09
2013 19.23 5.00 18.42 4.30 7.26 45.79
2014 27.92 6.42 24.05 5.54 9.66 26.40
2015 28.58 6.72 21.01 6.00 10.19 27.51
Source: Authors’ calculations based on CEIC database (2011) and Ministry of Finance (2013b, 2014a, 2014b, 2015a, 2015b).
0
5
10
15
20
25
30
3519
95
1996
1997
1998
1999
2000
2001
2002
2003
2004
2005
2006
2007
2008
2009
2010
2011
2012
2013
2014
2015
Revenue as % of GDP

14
Figure 5 illustrates the rapid increase in revenues from personal income tax, especially since 2007. The average annual growth rate of such revenues during 2007–15 was 30.2 per cent; excluding inflation, the figure amounted to 19.2 per cent. Still, the relatively small share of total budget revenues was no major surprise in Viet Nam. Since 2000, as previously noted, Viet Nam only levied the income tax on high-income earners, which was later replaced by personal income tax under the related Laws in 2007 and 2012. Therefore, the share of revenues from personal income tax (in total budget revenues) actually decreased from 2.0 per cent in 2000 to 1.9 per cent in 2002 and 1.8 per cent in 2004, after which it went up almost continuously to 4.7 per cent in 2010 and 6.0 per cent in 2015 (CEIC database 2011; Ministry of Finance 2013b, 2014a, 2014b, 2015a, 2015b).
Figure 5: Personal income tax in total budget, 2000–15
Note: Share in total revenues is measured in the right hand axis; income tax revenues are measured in billion VND and reflected in the left hand axis.
Source: Authors’ calculations from data obtained from the CEIC database (2011) and Ministry of Finance (2013b, 2014a, 2014b, 2015a, 2015b).
There has been no reported data on the number of payers of personal income tax. Some unofficial estimate shows that the number may reach around 3.9 million persons in 2012 (out of 12.7 million income earners). About 10 per cent of the revenues from personal income tax were from the bottom 2.9 million persons, while the remaining one million accounted for the lion’s share in personal income tax revenues (Nguyen 2013b).
Table 8 tabulates the structures of budget revenues by items. As can be seen, revenues from both crude oil and exports-imports tended to decrease relative to GDP. Domestic revenues assumed more importance, accounting for 70.9 per cent of total budget revenues in Q2 and 73.6 per cent in the first 6 months of 2015, higher than in 2010 and 2011 (64.1 per cent and 62.5 per cent, respectively).
0.00
1.00
2.00
3.00
4.00
5.00
6.00
7.00
0
10,000
20,000
30,000
40,000
50,000
60,000
2000 2001 2002 2003 2004 2005 2006 2007 2008 2009 2010 2011 2012 2013 2014 2015
Income tax Share in total revenues (%)

15
Table 8: Budget revenues and expenditures, 2010–15
2010 2011 2012 2013 2014 2015
I II III IV I II
Total revenues 27.3 26.0 22.7 22.9 25.8 24.0 22.1 16.6 27.9 22.7
Domestic revenue 17.5 16.0 14.7 15.7 17.7 16.1 14.7 11.5 21.5 16.1
Crude oil 3.2 4.0 4.3 3.4 3.4 3.1 2.5 2.2 2.1 2.0
Exports and imports 6.0 5.6 3.3 3.6 4.6 4.7 4.8 2.8 4.4 4.6
Grants 0.5 0.4 0.3 0.2 0.1 0.1 0.2 0.1 0.0 0.0
Total expenditures 30.1 28.3 28.2 26.8 28.8 26.9 25.4 23.8 30.9 27.6
Investment and development expenditures
8.5 7.5 8.3 6.1 4.4 4.9 5.0 3.2 5.1 4.7
Budget deficit 5.5 4.9 5.4 5.5 4.9 4.6 5.3 7.3 4.6 6.4
Budget deficit (excluding principle payments)
2.4 2.1 3.4 3.9 3.0 2.9 3.3 7.2 2.2 4.9
Note: Unit: per cent GDP. Statistics of 2007–12 are final accounts; statistics of 2013 are 2nd
estimates; statistics of 2014 are 1
st estimates (published on 15 December 2014).
Source: Central Institute for Economic Management (2015).
3.2 Social insurance contributions
The system of social insurance also underwent significant change since 2006. The Law on Social Insurance in 2006 identified the contributors of compulsory social insurance as: (i) those with labour contracts without predetermined term or with predetermined term of at least three months; (ii) public servants and staff; (iii) staff in national defence and security areas; and (iv) employers of employees under i, ii, and iii and other business households. The employees under i, ii, and iii had to make monthly compulsory contributions of 5 per cent of gross wage/salary to social insurance fund (under the sub-funds for pension and death gratuity), and the rate increased by 1 percentage point every two years since 2010 until it reached eight per cent. The employer had to contribute: (i) three per cent of the employee’s gross wage to sub-fund for sickness and maternity leave, of which two per cent would be withheld by the employer to make timely payment to the employee; (ii) 1 per cent of the employee’s gross wage to sub-fund for work-related injuries and occupational hazard; (iii) 11 per cent of the employee’s gross wage to the sub-funds for pension and death gratuity, and the rate increased by 1 percentage point every two years since 2010 until it reached 14 per cent (National Assembly 2006).
The employees may also make voluntary contributions to social insurance fund if they are of working age. However, the rate of contribution is fixed at 16 per cent of gross wage of the employee (since 2010, the rate increased by two percentage points every two years until it reached 22 per cent). The employee may choose to contribute on monthly, quarterly, or half-yearly basis.
Meanwhile, contributors of unemployment insurance are those with labour contracts without predetermined term or with predetermined term of between 12 months and 36 months, and the employers (of at least 10 employees). The employee contributes 1 per cent of gross wage to the unemployment insurance fund, the employer contributes another 1 per cent of employee’s gross wages, and the government provides budget-financed support of 1 per cent.
Apart from the above statutory contributions, households in Viet Nam often have to make a range of contributions, which are either fixed or variable (in terms of percentage or monetary value). These contributions can be to support schools, medical centres, or donations to

16
disadvantaged groups. By nature, these contributions are voluntary, but the households often feel such contributions are unavoidable.
Table 9 shows the number of contributors to social insurances, disaggregated by types of contribution (i.e. compulsory or voluntary). The number of people making compulsory contributions to social insurance rose from 8.2 million in 2007 to 11.2 million in 2014, at the average annual pace of 4.6 per cent. The number of voluntary contributors to social insurance remained relatively small, but also increased from 6,000 to 190,000 during the period 2008–14. The number of contributors also rose more rapidly than total labour force; accordingly, the share of labourers contributing to social insurance rose continuously from 17.3 per cent in 2007 to 18.9 per cent in 2010 and 21.3 per cent in 2014.
Table 9: Number of contributors to social insurance, 2007–14
No.
Item 2007 2008 2009 2010 2011 2012 2013 2014
1 Compulsory social insurance
8,173 8,539 8,901 9,441 10,104 10,437 10,881 11,230
2 Voluntary social insurance
6 41 81 96 140 174 190
Total 8,173 8,545 8,942 9,522 10,200 10,577 11,055 11,420
Share of labour force ( per cent)
17.33 17.72 18.13 18.90 19.84 20.21 20.76 21.25
Note: Unit: ‘000 persons.
Source: Social Security of Viet Nam (cited in Ministry of Labour-Invalids and Social Affairs 2014).
Nonetheless, Viet Nam still encounters several prevalent issues in social insurance. The first issue lies in outstanding debt to social insurance, as a number of private employers withheld the social insurance contribution from employees but failed to make prompt payment to Social Security fund. The amount of outstanding debt to social security funds (including social insurance, health insurance, and unemployment insurance) was almost VND7.6 trillion, with the private firms accounting for around VND5.3 trillion. As the second issue, the coverage of social insurance is rather limited. As of 2014, social security only covered one-fifth of the labour force.
Still, the above contributions to social insurance underestimate the actual expenses on contribution-equivalent items in Viet Nam. In fact, the households in Viet Nam also make several types of contributions, such as donations/charity to support the disadvantaged people/region,9 acquisition of bonds, etc. Nonetheless, there is neither official data nor estimates for these items.
4 Description of benefit system
This section focuses on the type of benefits available to households in Viet Nam. These benefits can be either contributory, or non-contributory. As discussed in Section 2, the fiscal space in Viet Nam has been deteriorating due to rapid increase in public debts and budget deficits; consequently, non-contributory transfers to households have become scarcer. Meanwhile, the contributory benefits were under the Law on Social Insurance in 2006 (National Assembly 2006). Accordingly, the benefits varied depending on the types of contribution to various social insurance sub-funds. Major changes in the amended Law on Social Insurance in 2014 (in effect
9 Some of these are almost compulsory, such as the contribution of one-day salary by staff under government payroll to help the victims of floods.

17
since 2016, which is not reflected in available data; National Assembly 2014) will be identified accordingly.
4.1 Compulsory social insurance
Under compulsory social insurance, the types of contributory provisions include: (i) sickness support; (ii) maternal support; (iii) support to work-related injuries or occupational hazard; (iv) pension; and (v) death gratuity.
Sickness support is provided to the employee in the period of 30 days per year (if the employee has contributed to social insurance fund for less than 15 years), or 4510 days (if the period of contribution is between 15 and 30 years), or 60 days (after at least 30 years of contribution) in the case of ordinary diseases. Under paid sick leave, the employee can receive 75 per cent of the salary of the previous month prorated on a daily basis. After the period of sick leave, if the employee remains weak, he or she can have at most 10 days for recovery, with the benefit11 equal to 25 per cent or 40 per cent of the minimum wage, if staying at home or medical centre, respectively. With diseases in the stipulated List that requires long-term treatment, the employee is entitled to a maximum of 180 days of sick leave, which can be extended with lower level payments. The monthly benefit is then equal to 65 per cent, 55 per cent, or 4512 per cent of salary for the last month (before leave) if the period of contribution is at least 30 years, between 15 and 30 years, or less than 15 years, respectively. In case a child is sick, each parent under social insurance is entitled to a leave of maximum 20 days if the child is less than three years old, or maximum 15 days if the child is between three and seven years old.
Maternity leave is provided to: (i) pregnant employees; (ii) female employees giving birth to their children; (iii) employees who adopt children less than four months old;13 and (iv) employees who undertake sterilization. Pregnant employees are entitled to a maximum of five times one-day leave for medical check. After giving birth to a child, the employee can have a leave of four, five, or six months14 depending on normal occupations, hazardous occupations, or status of disability. The employee giving birth to a child is also entitled to: (i) a one-time payment of two months of minimum salary; and (ii) monthly payment equal to the average of the six months preceding maternity leave. Those adopting children four months old or younger can take leave until the children turn four months old, with a one-time payment of two months minimum salary. Those undertaking sterilization can take leave of seven days or 15 days depending on the type of measures.
Support for work-related injuries or occupational hazards is dependent upon the loss of work capacity. Those losing 5 to 30 per cent of work capacity are entitled to two payments. The first payment is equal to (i) five months of minimum salary for the first 5 per cent of work capacity lost; and (ii) one-half of monthly minimum salary for each additional 1 per cent of work capacity lost. The second payment is equal to: (i) 0.5 per cent of monthly salary of the last month before leave if contribution to social insurance for less than one year; and (ii) an additional 0.3 per cent of monthly salary of the last month before leave for every year of social insurance contribution.
10 This changed to 40 days in the amended Law on Social Insurance in 2014 (National Assembly 2014).
11 This combined into a single rate of 30 per cent in the amended Law on Social Insurance in 2014 (National Assembly 2014).
12 This changed to 50 per cent in the amended Law on Social Insurance in 2014 (National Assembly 2014).
13 This changed to six months in the amended Law on Social Insurance in 2014 (National Assembly 2014).
14 This combined into a single period of six months under the amended Law on Social Insurance in 2014 (National Assembly 2014).

18
Those losing at least 31 per cent of work capacity are entitled to two monthly payments. The first monthly payment is equal to: (i) 30 per cent of monthly minimum wage if loss at 31 per cent; and (ii) an additional two per cent of monthly minimum wage for each additional 1 per cent of work capacity loss. The second monthly payment is equal to: (i) 0.5 per cent of monthly salary of the last month before leave if contribution to social insurance for less than one year; and (ii) an additional 0.3 per cent of monthly salary of the last month before leave for every year of social insurance contribution. Under exceptional cases, social insurance fund may provide support in the form of facilities and payment to servants to the employee. In the case of death due to work-related injuries or occupational hazard, the family members are entitled to one-time payment of 36 months of minimum salary (National Assembly 2006).
Pension is provided to employees upon retirement, subject to their meeting requirements in terms of age, period of social insurance contribution, etc. (Table 10). Under the Law on Social Insurance in 2006 (effective since 1 January 2007; National Assembly 2006), employees eligible for pension after 20 years of social insurance contribution are either: (i) male labourers retiring at age 60 or female labourers retiring at 55; and (ii) male labourers between 55 and 60, and female labourers between 50 and 55 who have been working in toxic or dangerous areas (under the list to be identified by the Ministry of Labour-Invalids and Social Affairs and the Ministry of Health; National Assembly 2006) for at least 15 years, or with regional wage-supplementary ratio of at least 0.7 for at least 15 years. For those serving in the army or security forces, the corresponding retirement ages are 55 for male labourers and 50 for women under group (i), and between 50 and 55 for male labourers and between 45 and 50 for female labourers under group (ii). These conditions for state pension age are retained in the new Law on Social Insurance in 2014 (effective since 1 January 2016; National Assembly 2016). The monthly pension is calculated as follows: (i) 45 per cent of referenced salary for the first 15 years of social insurance contribution; and (ii) an additional two per cent for male employees and three per cent for female employees for each additional year of social insurance contribution (to the maximum ratio of 75 per cent).15 A one-time payment is also provided to above retirees in addition to the monthly pension, with the value being 0.5 per cent of referenced monthly salary for each year of social insurance contribution beyond threshold (30 years for males and 25 years for females). For those ineligible for monthly pension, a one-time payment is made with the value of 1.5 months of referenced salary for each year of social insurance contribution.16
15 In the amended Law on Social Insurance in 2014, since 2018, the threshold of 45 per cent of referenced salary will be 15 years of social insurance contribution for female employees. For male counterparts, the corresponding period will be 16 years, 17 years, 18 years, 19 years, and 20 years for those retiring in 2018, 2019, 2020, 2021, and 2022, respectively. After the threshold, the proportion increases by 2 percentage points for each additional year of social insurance contribution, applicable for both male and female employees (National Assembly 2016).
16 In the amended Law on Social Insurance in 2014, 1.5 months of referenced salary apply to the years of social insurance contribution before 2014; since 2014 onwards, each year of social insurance contribution will be converted into two months of referenced salary (National Assembly 2014).

19
Table 10: Formula for referenced salary
Starting point of social insurance contribution Referenced monthly salary
Before 1 January 1995 Average monthly salary for the last five years of work (under the state payroll) or for all years of work (outside the state payroll)
Between 1 January 1995 and 31 December 2000 Average monthly salary for the last six years of work (under the state payroll) or for all years of work (outside the state payroll)
Between 1 January 2001 and 31 December 2006 Average monthly salary for the last eight years of work (under the state payroll) or for all years of work (outside the state payroll)
Since 1 January 2007 Average monthly salary for the last ten years of work (under the state payroll) or for all years of work (outside the state payroll)
Source: Authors’ compilation from National Assembly (2006).
Death gratuity is provided to family members (including children, spouse, mother, father, mother-in-law, father-in-law, and other dependent people subject to eligibility) if the employee or retiree passes away. The monthly payment is equal to 50 per cent of minimum salary (in the presence of other employees/retirees as supporters to those members) or 70 per cent of minimum salary (in the absence of other employees/retirees as supporters to those members). For those ineligible for monthly payment, a one-time payment is made at the value of: (i) 1.5 months of referenced monthly salary for each year of social insurance contribution, with the minimum being three months, if the employee passes away; (ii) 48 months of pension in the first two months after retirement, which will be reduced by 0.5 month for each additional month under pension, if the retiree passes away. In addition, the family is entitled to support to organize the funeral, equal to ten months of minimum salary.
4.2 Voluntary social insurance
Voluntary social insurance covers contributory support in the forms of: (i) pension; and (ii) death gratuity. The value and eligibility of pension and death gratuity are similar to those under compulsory social insurance, except that the referenced salary is calculated based on actual income as basis for contribution.
4.3 Unemployment insurance
Benefits from unemployment insurance include: (i) unemployment benefits; (ii) support for vocational training; and (iii) support in job-seeking. By nature, these benefits are contributory.
Unemployment benefits will be paid to the unemployed person subject to the conditions that: (i) they have paid unemployment insurance for at least 12 months in the last 24 months before unemployment; (ii) they have registered unemployment with Social Security fund; and (iii) they have been unable to find jobs within 15 days after registration of unemployment. The monthly unemployment benefit is equal to 60 per cent of average salary in the last six months before unemployment. The period for receiving unemployment benefits is: (i) three months if unemployment insurance is paid for 12 to 36 months; (ii) six months if unemployment insurance is paid for 36 to 72 months; (iii) nine months if unemployment insurance is paid for 72 to 144 months; and (iv) 12 months if unemployment insurance is paid for more than 144 months. Apart from that, subject to eligibility, the unemployed person can receive financial support for vocational training, job searches, and health insurance during period of unemployment.
Apart from the above benefits, Viet Nam also provides non-contributory payments to support: (i) invalids, families of soldiers killed during the national struggle or national unification, and

20
those merited for supporting the national struggle/national unification; (ii) poor and disadvantaged people; and (iii) selected elderly people. For those under group (i), the death gratuity or other supportive payments are made on both one-time and monthly basis, with the value to be determined in each period by relevant regulations (National Assembly 2006). Other forms of support include education and training, vocational training, assistance with job searches, etc. In accordance with Decree No. 47/2012/ND-CP in 2012 (effective 15 July 2012; Government of Viet Nam 2012), the referenced value is VND1.11 million, which helps identify monthly and one-time payments to various groups of beneficiaries under group (i). Meanwhile, support for the poor and disadvantaged people in group (ii) depends upon the type of programmes to help these people, scale and coverage of the programme, as well as resource availability. Support for these people includes provision of health insurance, fee exemption for education and training, agricultural training, emergency relief during crop loss, etc. Under (iii), a monthly payment is paid to elderly people (more than 60 years old) having no income supporters, and elderly people (more than 80 years old) ineligible for social insurance benefits. As of 2015, the monthly payment is valued at VND270,000 (or US$12.2) per person.
4.4 Benefit system at work
This discussion focuses on the period until 2012. As a note, the most recent survey data on household living standard are available for 2012.17 During the period 2007–12, Viet Nam had 20 million beneficiaries on sick leave (Figure 6). The number of beneficiaries actually increased continuously from almost 2.0 million in 2007 to more than 4.3 million in 2011. It was only in 2012 that the figure dropped to 4.1 million.
Figure 6: Number of beneficiaries on sick leave, 2007–12
Note: Unit: million persons.
Source: Social Security of Viet Nam (cited in Ministry of Labour-Invalids and Social Affairs, 2014).
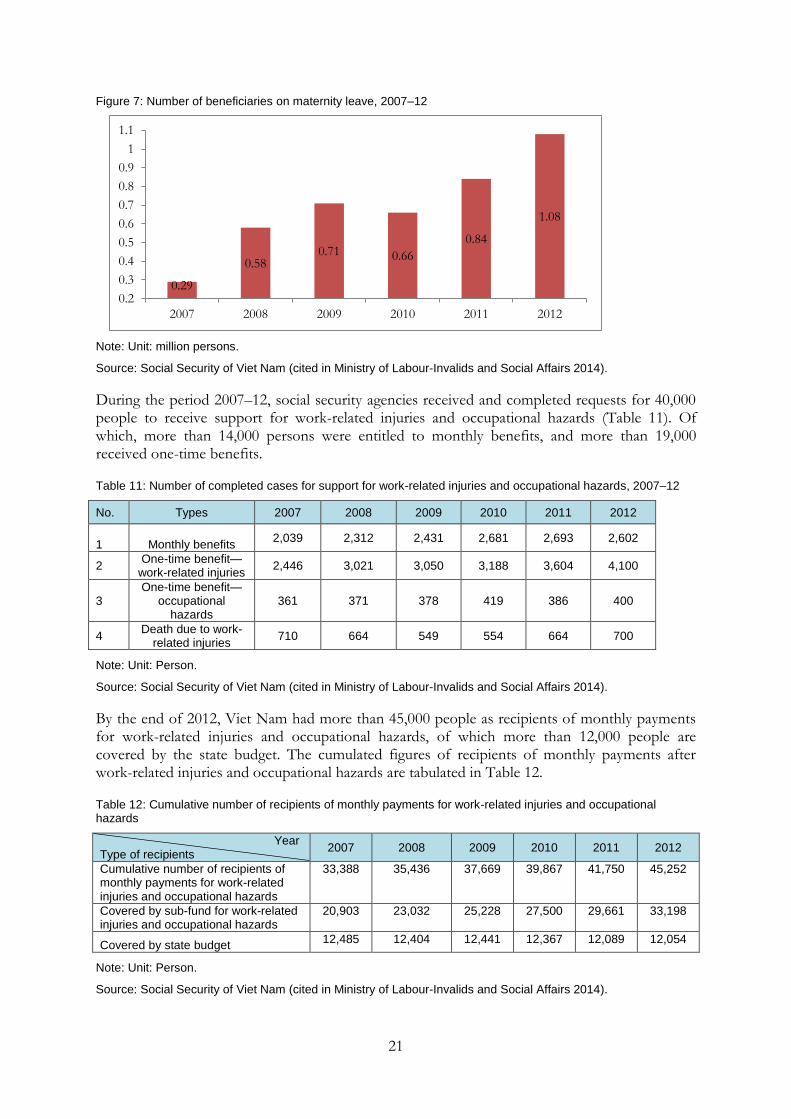
Meanwhile, the period 2007–12 also saw more than 4 million beneficiaries on maternity leave. The figure only exhibited a fall in 2010, whilst increasing in almost all the years (Figure 7).
17 See Section 5.
1.99 2.51
3.25 3.91
4.35 4.12
0.00
0.50
1.00
1.50
2.00
2.50
3.00
3.50
4.00
4.50
2007 2008 2009 2010 2011 2012
21
Figure 7: Number of beneficiaries on maternity leave, 2007–12
Note: Unit: million persons.
Source: Social Security of Viet Nam (cited in Ministry of Labour-Invalids and Social Affairs 2014).
During the period 2007–12, social security agencies received and completed requests for 40,000 people to receive support for work-related injuries and occupational hazards (Table 11). Of which, more than 14,000 persons were entitled to monthly benefits, and more than 19,000 received one-time benefits.
Table 11: Number of completed cases for support for work-related injuries and occupational hazards, 2007–12
No. Types 2007 2008 2009 2010 2011 2012
1 Monthly benefits 2,039 2,312 2,431 2,681 2,693 2,602
2 One-time benefit—
work-related injuries 2,446 3,021 3,050 3,188 3,604 4,100
3 One-time benefit—
occupational hazards
361 371 378 419 386 400
4 Death due to work-
related injuries 710 664 549 554 664 700
Note: Unit: Person.
Source: Social Security of Viet Nam (cited in Ministry of Labour-Invalids and Social Affairs 2014).
By the end of 2012, Viet Nam had more than 45,000 people as recipients of monthly payments for work-related injuries and occupational hazards, of which more than 12,000 people are covered by the state budget. The cumulated figures of recipients of monthly payments after work-related injuries and occupational hazards are tabulated in Table 12.
Table 12: Cumulative number of recipients of monthly payments for work-related injuries and occupational hazards
Year Type of recipients
2007 2008 2009 2010 2011 2012
Cumulative number of recipients of monthly payments for work-related injuries and occupational hazards
33,388 35,436 37,669 39,867 41,750 45,252
Covered by sub-fund for work-related injuries and occupational hazards
20,903 23,032 25,228 27,500 29,661 33,198
Covered by state budget 12,485 12,404 12,441 12,367 12,089 12,054
Note: Unit: Person.
Source: Social Security of Viet Nam (cited in Ministry of Labour-Invalids and Social Affairs 2014).
0.29
0.58 0.71 0.66
0.84
1.08
0.2
0.3
0.4
0.5
0.6
0.7
0.8
0.9
1
1.1
2007 2008 2009 2010 2011 2012

22
The monthly payment also increased over time. In 2007, the average monthly payment was more than VND287,000 per recipient, but the figure then rose continuously to more than VND566,000 per recipient (Figure 8). The average annual growth of monthly payment was 14.6 per cent during 2007–12, which barely exceeded that of consumer price index (13.7 per cent).
Figure 8: Average monthly payment after work-related injuries and occupational hazards, 2007–12
Note: Unit: VND/month.
Source: Social Security of Viet Nam (cited in Ministry of Labour-Invalids and Social Affairs 2014).
The number of employees whose applications for pension were approved increased continuously, from 84,860 in 2007 to 101,200 in 2012 (Table 13). The cumulative number of pensioners rose from almost 1.59 million in 2007 to below 2.0 million in 2012, i.e. on average 4.3 per cent per annum.
Table 13: Number of pensioners, 2007–12
Year Indicator
2007 2008 2009 2010 2011 2012
Number of contributors to social insurance
8,172,502 8,539,467 8,901,170 9,441,246 10,104,497 10,436,868
Number of new pensioners
84,860 98,600 102,286 109,586 112,256 101,200
Cumulative number of pensioners
1,589,111 1,660,259 1,736,375 1,818,062 1,880,521 1,957,727
Covered by state budget 976,119 954,388 932,911 909,674 876,110 860,623
Covered by social insurance fund
612,992 705,871 803,464 908,388 1,004,411 1,097,104
Note: Unit: Person
Source: Social Security of Viet Nam (cited in Ministry of Labour-Invalids and Social Affairs 2014).
The value of pensions also increased over time. In fact, the government made six upward adjustments of pension during the period from 2007 to 2012. As of 2012, the pension was 134 per cent higher than that of December 2007 (Figure 9).
0.29 0.34
0.39 0.45
0.52
0.67
0
0.1
0.2
0.3
0.4
0.5
0.6
0.7
2007 2008 2009 2010 2011 2012

23
Figure 9: Monthly pension, 2007–12
Note: Monthly pension is measured in thousand VND on the left hand axis. The growth rate is in percentage on the right hand axis.
Source: Social Security of Viet Nam (cited in Ministry of Labour-Invalids and Social Affairs 2014).
Among the retirees during 2007–12, about 80 per cent were approved to receive one-time pension payments, with the rest receiving monthly pensions (Table 14). The number of recipients of one-time pensions rose sharply from more than 129,000 in 2007 to more than 601,000 in 2012, i.e. on average by more than 70 per cent per annum.
Table 14: Once-off payment of pension
Year Indicator
2007 2008 2009 2010 2011 2012
Number of new pensioners 84,860 98,600 102,286 109,586 112,256 101,200
Number of recipients of one-time pension payments
129,156 288,309 425,903 498,122 478,462 601,020
Total 214,016 386,909 528,189 607,708 590,718 702,220
Note: Unit: person.
Source: Social Security of Viet Nam (cited in Ministry of Labour-Invalids and Social Affairs 2014).
The number of new recipients of death gratuities also increased steadily in the period from 2007 to 2012. Of which, the number of family members as recipients of monthly death gratuities accounted for almost 45 per cent (Table 15). Meanwhile, 55 per cent of the new recipients were approved to receive one-time payments.
Table 15: Payment of death gratuity
Year Indicator
2007 2008 2009 2010 2011 2012
New recipients of monthly gratuity
19,167 19,416 19,644 21,398 23,842 22,820
New recipients of one-time gratuity payments
21,486 26,697 25,984 27,993 30,382 30,304
Cumulative number of recipients of monthly gratuity
208,481 213,623 220,202 227,125 234,732 242,213
Covered by the state budget 159,536 162,036 165,337 168,996 172,050 175,463
Covered by social insurance fund
48,945 51,587 54,865 58,129 62,682 66,750
Note: Unit: Person.
Source: Social Security of Viet Nam (cited in Ministry of Labour-Invalids and Social Affairs 2014).
Pension Growth rate (%)

24
5 Data sources
5.1 Viet Nam Household Living Standard Survey
The Viet Nam Household Living Standard Survey (VHLSS) is carried out on a biennial basis since 2002. To date, the surveys have been conducted in the years of 2002, 2004, 2006, 2008, 2010, 2012, and 2013. As of March 2016, data for the survey in 2013 (scheduled for publication in 2014) remain unavailable. The most recent data are thus available only for the year 2012.
VHLSS aims to collect information as background for assessing the living standard, poverty incidence, and the income gap, which in turn serve as inputs for policy-making process of the Government of Viet Nam. Surveyees of the VHLSS comprise: (i) households; (ii) members of surveyed households; and (iii) communal governments of surveyed households. The survey is designed to cover 63 provinces and cities directly under the central government. For the year 2012, the survey was conducted at four points in time, namely: March, June, September, and December. At each point in time and in each surveyed locality, the survey takes one month.
The surveyed information seeks to reflect the living standard of the households, including:
Household income, including: level of income, income disaggregated by source (wage, salary; self-employed activities in agriculture, forestry and fishery; production and business activities in non-agriculture-forestry-fishery areas; other proceedings).
Household expenditure: level of expenditure; expenditure items (food, clothes, accommodation, transport, education, health, culture, etc.).
Other information on the household and members of household to help analyse the causes and differences of living standards, including: key demographic aspects (age, gender, ethnicity, marital status); education level; sickness, diseases and use of health services; employment; use of facilities (electricity, water, sanitary condition); participation in hunger eradication and poverty reduction; impacts of migration on household income.
As for the communal units, the surveyed information seeks to identify factors affecting households’ living standard, including: (i) general demographic and ethnic information; (ii) key aspects of socio-economic infrastructures, such as electricity, road, school, medical station, post office, and water source; (iii) economic situation, covering agricultural production (land, trends and reasons for variations of key crops, other conditions such as irrigation and agricultural promotion), and non-agricultural job opportunities; and (iv) some information on social order, environment, credit, and savings.
25
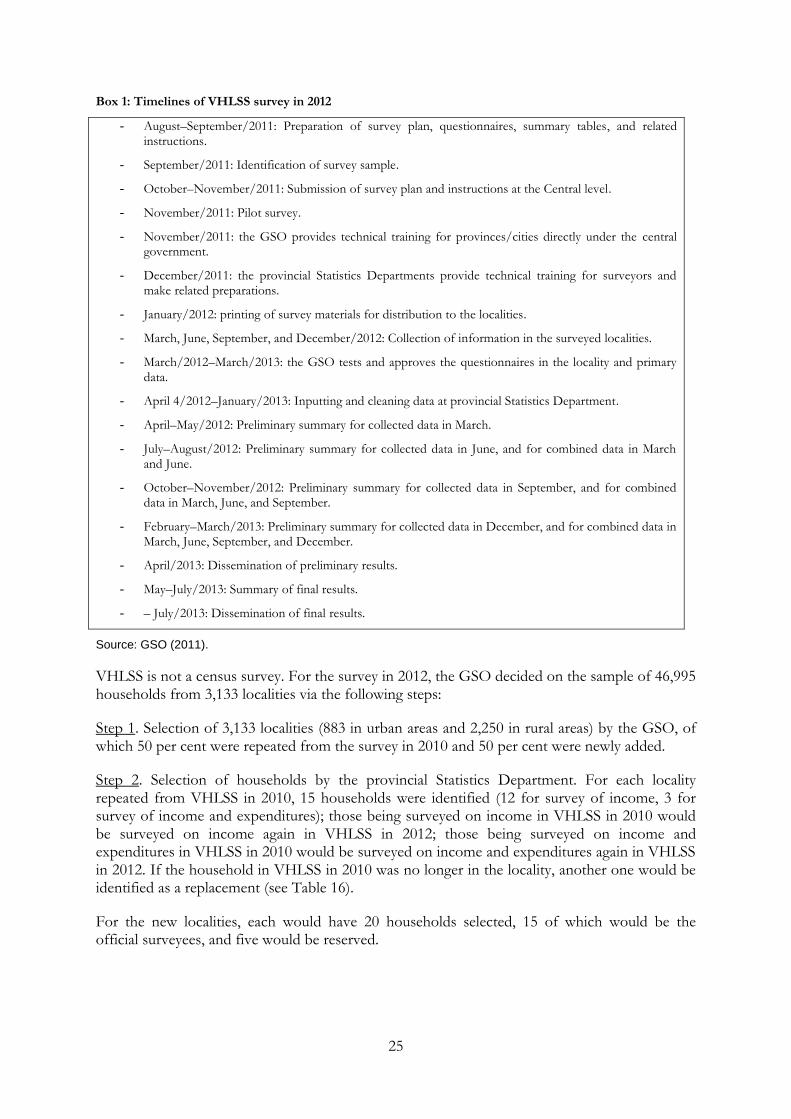
Box 1: Timelines of VHLSS survey in 2012
August–September/2011: Preparation of survey plan, questionnaires, summary tables, and related instructions.
September/2011: Identification of survey sample.
October–November/2011: Submission of survey plan and instructions at the Central level.
November/2011: Pilot survey.
November/2011: the GSO provides technical training for provinces/cities directly under the central government.
December/2011: the provincial Statistics Departments provide technical training for surveyors and make related preparations.
January/2012: printing of survey materials for distribution to the localities.
March, June, September, and December/2012: Collection of information in the surveyed localities.
March/2012–March/2013: the GSO tests and approves the questionnaires in the locality and primary data.
April 4/2012–January/2013: Inputting and cleaning data at provincial Statistics Department.
April–May/2012: Preliminary summary for collected data in March.
July–August/2012: Preliminary summary for collected data in June, and for combined data in March and June.
October–November/2012: Preliminary summary for collected data in September, and for combined data in March, June, and September.
February–March/2013: Preliminary summary for collected data in December, and for combined data in March, June, September, and December.
April/2013: Dissemination of preliminary results.
May–July/2013: Summary of final results.
– July/2013: Dissemination of final results.
Source: GSO (2011).
VHLSS is not a census survey. For the survey in 2012, the GSO decided on the sample of 46,995 households from 3,133 localities via the following steps:
Step 1. Selection of 3,133 localities (883 in urban areas and 2,250 in rural areas) by the GSO, of which 50 per cent were repeated from the survey in 2010 and 50 per cent were newly added.
Step 2. Selection of households by the provincial Statistics Department. For each locality repeated from VHLSS in 2010, 15 households were identified (12 for survey of income, 3 for survey of income and expenditures); those being surveyed on income in VHLSS in 2010 would be surveyed on income again in VHLSS in 2012; those being surveyed on income and expenditures in VHLSS in 2010 would be surveyed on income and expenditures again in VHLSS in 2012. If the household in VHLSS in 2010 was no longer in the locality, another one would be identified as a replacement (see Table 16).
For the new localities, each would have 20 households selected, 15 of which would be the official surveyees, and five would be reserved.

26
Table 16: Allocation of VHLSS sample, 2012
Timing of data collection
Survey sample on income and expenditures
Survey sample on income
Total
(household) (household) Households Localities
Total Of which: March/2012
9,399 2,352
37,596 9,408
46,995 11,760
3,133 784
June/2012 2,349 9,396 11,745 783 September/2012 2,349 9,396 11,745 783 December/2012 2,349 9,396 11,745 783
Source: GSO (2011).
VHLSS employs direct survey based on the questionnaires. The survey was conducted in Vietnamese. Since the survey sample varies from one year to another, data from VHLSS are thus considered as cross-sectional (Figure 10).
Figure 10: Number of surveyed households under various VHLSSs
Source: Authors’ compilation based on data from GSO (2004, 2006, 2008, 2010, 2011, 2012).
The VHLSS data are widely used in various research on Viet Nam, with hardly any well-documented issue of quality/statistical errors.18 The Organisation for Economic Cooperation and Development (OECD 2014) has recently published a review of social cohesion policy in Viet Nam, which incorporates a calculation of VHLSS data on social assistance benefits as a share of total income. Part of the work has focused on the impacts of taxes and transfers on inequality. The types of inequalities under coverage were rather broad, including spatial inequalities in terms of housing, education, health, and employment, and inequalities across generations. OECD (2014) then identified several challenges for social cohesion, namely: (i) persistent and deepening inequalities among certain groups of population, which may impede sustainable and inclusive growth; and (ii) the coverage gaps in social protection and weak redistributive effects of fiscal policies, which may expose many middle-class households to poverty. Other studies that adopt VHLSS data in 2012 include Le et al. (2013), Asian Development Bank (ADB 2014), and Vo and Nguyen (2011). This is not to mention a large
18 Hansen and Le (2013) assert, from their data analysis of Census survey in 1999 and 2009, that the selection of households in VHLSS might be biased. Specifically, the households included in VHLSS surveys are significantly relatively better off than the remainder of the population, which might raise the possibility of downward bias of VHLSS-based poverty data in Viet Nam. Nonetheless, the authors accept that this finding may be indicative only.
9,000
9,139 9,139
9,399 9,399 9,399
8,800
8,900
9,000
9,100
9,200
9,300
9,400
9,500
2004 2006 2008 2010 2012 2013

27
range of studies that adopt previous versions of VHLSS data. As an instance, Vo et al. (2012) employs VHLSS data for 2010 to carry out a macro-micro simulation of impacts of changes in electricity tariff and petrol prices on welfare in Viet Nam.
Box 2: Summary of the work on simulating impacts of changes in electricity tariff and petrol prices on welfare in Viet Nam
The activity has produced several impacts. First, it demonstrates how the macro-micro simulation can be used for projecting the impacts at national, sectoral, and household levels of various policy and regulatory changes. This in turn corrects the issues often encountered in traditional general equilibrium analysis and partial equilibrium analysis in Viet Nam. Within the scope of the activity, the team has organized a training workshop for data analysts and quantitative researchers in Viet Nam, which focused on using developed toolkit for replicating the macro-micro simulation. Some of them have adopted the approach in subsequent research (most recently, the impact assessment of EU-Viet Nam Free Trade Agreement on Viet Nam’s Economy funded by MUTRAP Project). Second, the analytical output from the Activity is well appreciated by relevant policy makers in Viet Nam. Specifically, the evidence on welfare loss (measured by compensating variation)—for submission to the Minister of Finance—was interesting, showcasing that allowing increase of retail fuel and electricity prices alongside monetary transfer to poor households is less costly than keeping the price fixed by means of subsidizing the fuel and electricity companies. The change in practical policy management still takes too long to materialize, as necessary conditions were not ensured. Yet the note of high-level policy makers laid the first concrete foundation for altering the price management regime for fuel and electricity, which the team has been advocating.
Source: Vo et al. (2012).
5.2 Other data sources
Apart from VHLSS, other available data at the micro level in Viet Nam comprise: (i) Enterprise Census; (ii) Labour Force Survey Data; and (iii) Population and Housing Census.
5.2.1 Enterprise Census
The GSO carries out Enterprise Census on an annual basis. The Census seeks to identify information about enterprises’ business situation and characteristics, such as type of enterprise, sector/area of operation, main business activities, revenues, profits, tax payment, number of staff (including gender breakdown), etc. The data are generally available two years after the reference period, e.g. data for 2013 are available in 2015. The first Census was conducted in 2000. As of March 2016, the most recently published data are for the year 2013 and includes all operating firms in Viet Nam. The respective numbers of observations for the Censuses in 2008, 2009, 2010, 2011, and 2012 are 155,771; 205,689; 233,235; 287,896; 339,287; and 352,206 firms.
5.2.2 Labour Force Survey
The GSO conducts Labour Force Surveys to identify information on labour force, employment status, and other aspects of relevance to policy makers. Since 2011, the survey is carried out on a monthly basis, for preliminary estimate of the corresponding quarter. In general, the annual data are published two years after the reference period, e.g. data for 2013 are published in 2015 (even though the official survey plan set out the publication date by late 2014). The survey is conducted on household members older than 15 years old. Detailed information on the survey include identity, marital status, education level, technical qualifications, employment status, key economic activities in the last seven days, underemployment, income of wage earners, etc. In 2013, sample size was 50,640 households per quarter, equivalent to 16,880 households per month. The corresponding figures for 2011 were 76,320 households each quarter and 25,440 each month, and for 2012 were 50,640 households each quarter and 16,880 households each month.

28
5.2.3 Population and Housing Census
The Population and Housing Census aims to identify the basic data on population and housing in various localities of Viet Nam. The Census in 2009 was carried out as of 1 April 2009, which covered Vietnamese residents (including temporary migrants to foreign countries) and those who passed away between 7 February 2008 and 31 March 2009, and their housing status. The household leader was the main supplier of information, though the surveyor might meet the family member directly to clarify/confirm details. Information incorporated in the Census questionnaires include details of family members (personal details, relationship with household leader; education status and level; ethnicity and religion; literacy), housing status (current housing, structure and construction materials of house, area, year of use).
Following the Census in 2009, another sample survey was conducted in 2014 to update the information on population and housing. This sample included 20 per cent of localities in Viet Nam. Of those, 3.4 per cent of households were selected for short-questionnaires survey, i.e. about 30 households in each of the 25,340 localities, to estimate the scale and structure of population at the district level. Of those 12,055 localities, 30 households in each locality were selected for long-questionnaires survey to help estimate the scale and structure of population and housing at the provincial level.
Overall, notwithstanding the number of large-scale surveys on households and individuals in Viet Nam, the connection between these surveys that may allow consistent and rigorous analysis of income, expenditure, and welfare at the micro level is hardly deep. In this regard, VHLSSs still emerge as the most respected and widely used source of data to facilitate household-welfare-based policy analysis and simulation.
6 Assessment of tax-benefit simulation feasibility
This section looks into the feasibility of building a tax-benefit simulation model at the micro level for Viet Nam. To do so, the authors start by investigating the questionnaires and data from the VHLSS for 2012 to find tax-equivalent and transfer-equivalent items for which data are available.
Table 17 shows the rather limited number of tax-equivalent payments for which an analysis based on VHLSS data is possible. Given data availability, in principle, validation of the micro-simulation results on impacts of corresponding tax and benefit transfers can be made possible. Unfortunately, these items are largely aggregates of payments to various tax and contribution-equivalent items. Accordingly, the simulation of change in a specific tax or contribution item (such as income tax, social insurance) can hardly be validated at this stage.
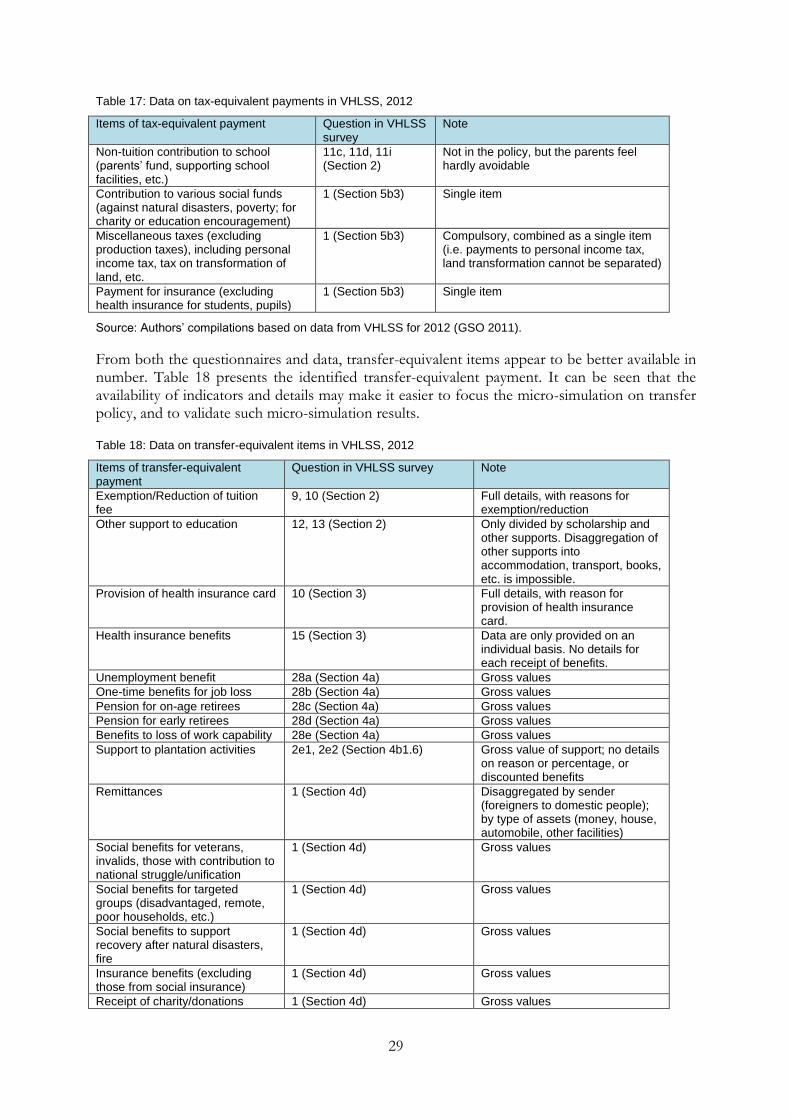
29
Table 17: Data on tax-equivalent payments in VHLSS, 2012
Items of tax-equivalent payment Question in VHLSS survey
Note
Non-tuition contribution to school (parents’ fund, supporting school facilities, etc.)
11c, 11d, 11i (Section 2)
Not in the policy, but the parents feel hardly avoidable
Contribution to various social funds (against natural disasters, poverty; for charity or education encouragement)
1 (Section 5b3) Single item
Miscellaneous taxes (excluding production taxes), including personal income tax, tax on transformation of land, etc.
1 (Section 5b3) Compulsory, combined as a single item (i.e. payments to personal income tax, land transformation cannot be separated)
Payment for insurance (excluding health insurance for students, pupils)
1 (Section 5b3) Single item
Source: Authors’ compilations based on data from VHLSS for 2012 (GSO 2011).
From both the questionnaires and data, transfer-equivalent items appear to be better available in number. Table 18 presents the identified transfer-equivalent payment. It can be seen that the availability of indicators and details may make it easier to focus the micro-simulation on transfer policy, and to validate such micro-simulation results.
Table 18: Data on transfer-equivalent items in VHLSS, 2012
Items of transfer-equivalent payment
Question in VHLSS survey Note
Exemption/Reduction of tuition fee
9, 10 (Section 2) Full details, with reasons for exemption/reduction
Other support to education 12, 13 (Section 2) Only divided by scholarship and other supports. Disaggregation of other supports into accommodation, transport, books, etc. is impossible.
Provision of health insurance card 10 (Section 3) Full details, with reason for provision of health insurance card.
Health insurance benefits 15 (Section 3) Data are only provided on an individual basis. No details for each receipt of benefits.
Unemployment benefit 28a (Section 4a) Gross values
One-time benefits for job loss 28b (Section 4a) Gross values
Pension for on-age retirees 28c (Section 4a) Gross values
Pension for early retirees 28d (Section 4a) Gross values
Benefits to loss of work capability 28e (Section 4a) Gross values
Support to plantation activities 2e1, 2e2 (Section 4b1.6) Gross value of support; no details on reason or percentage, or discounted benefits
Remittances 1 (Section 4d) Disaggregated by sender (foreigners to domestic people); by type of assets (money, house, automobile, other facilities)
Social benefits for veterans, invalids, those with contribution to national struggle/unification
1 (Section 4d) Gross values
Social benefits for targeted groups (disadvantaged, remote, poor households, etc.)
1 (Section 4d) Gross values
Social benefits to support recovery after natural disasters, fire
1 (Section 4d) Gross values
Insurance benefits (excluding those from social insurance)
1 (Section 4d) Gross values
Receipt of charity/donations 1 (Section 4d) Gross values

30
Items of transfer-equivalent payment
Question in VHLSS survey Note
Support to electricity bill 2a (Section 8) Gross value
In-kind provision of food (emergency)
2a (Section 8) Gross value
Support to public servants with low salary
2a (Section 8) Gross value
Support to those with contribution to national struggle/unification
2a (Section 8) Gross value
Support to poor households 2a (Section 8) Gross value
Source: Authors’ compilation based on data obtained from VHLSS survey for 2012 (GSO 2011).
Table 19 summarizes the possibility of simulating tax-benefit policies in 2012 in Viet Nam and, if any, whether the simulation results can be validated. Judging from the summary in Tables 17 and 18, again, it seems that simulation of various tax and transfer instruments can be possible, though the possibility of validation appears to be higher and more concrete for transfer items.
Table 19: Possibility of simulating tax-benefit policies in 2012 in Viet Nam
Tax/Benefit Possibility
Income tax Policy available; Base data available; Can be simulated (macro aggregate from budget is available; but no disaggregated data, so not validated yet)
Tax-deductible income to support dependents
Policy available; base data available; can be simulated, but not validated yet
Non-tuition contribution to school No policy available; data available; can be simulated and validated
Contribution to social insurance Policy available; base data available; can be simulated (but no disaggregated data, so not validated yet)
Contribution to unemployment insurance Policy available; base data available; can be simulated (but no disaggregated data, so not validated yet)
Contribution to health insurance Policy available; base data available; can be simulated; data available, so can be validated;
Contribution to various social funds No policy; data available; may be simulated (depending on potential policy scope)
Miscellaneous taxes Policy available; combined data available; but no data on tax base (so cannot be simulated)
Exemption/Reduction of tuition fees Policy available; base data available; can be simulated; data available, so can be validated
Other support for education Policy available; base data not available; no disaggregated data, so can neither be simulated nor validated
Provision of health insurance card Policy available; base data available; can be simulated and validated
Health insurance benefits No data on occurrence; data on benefits available; can be simulated (uprating on occurrence may be necessary)
Unemployment benefit No data on length of unemployment in the year and previous contribution to unemployment insurance; data on benefits available; can be simulated (uprating on length of unemployment and contribution history may be necessary)
One-time benefits for job loss No data on contribution history; data on benefits available; can be simulated (uprating on contribution history may be necessary)
Pension for on-age retirees No data on contribution history; data on benefits available; can be simulated (uprating on contribution history may be necessary)
Pension for early retirees No data on contribution history; data on benefits available; can be simulated (uprating on contribution history may be necessary)
Benefits for loss of work capability No data on contribution history; no data on occurrence; data on benefits available; can be simulated (uprating on contribution history may be necessary)
Support to plantation activities Only data on benefits available; base data available; can be simulated and validated
Remittances Data available (as gross or sub-item, see Table 18); can be simulated; but no detailed macro data to support this
Social benefits for veterans, invalids, those Policy available; base data available; can be simulated, but not

31
Tax/Benefit Possibility
with contribution to national struggle/unification
validated yet
Social benefits for targeted groups (disadvantaged, remote, poor households, etc.)
Policy and programmes available; no data on the type of government programmes in place (which are potentially overlapping); can be simulated, but not validated yet
Non-contributory transfer to elderly people without pensions
Policy available; base data available; can be simulated
Social benefits to support recovery after natural disasters, fire
Policy and programmes available, but ambiguous; no data on the type of government programmes (which are potentially overlapping); may not be simulated
Insurance benefits (excluding those from social insurance)
No base data available; no disaggregated data available; cannot be simulated and validated
Receipt of charity/donations Neither macro aggregates nor disaggregated data available; cannot be simulated
Support for electricity bill Policy available; data on usage unavailable, so cannot be simulated; Electricity tariff is under implicit subsidy to the poor, which may not be fully recognized
In-kind provision of food (emergency) Policy available; no data on emergency occurrence; cannot be simulated
Support to public servants with low salary Policy available; base data available; data on benefits available; can be simulated and validated
Support to those with contribution to national struggle/unification
Policy available; base data available; data on benefits available; can be simulated and validated
Support to poor households Policy and programmes available, but potentially overlapping; data on benefits available; can be simulated and validated
Birth grant No policy; base data available; can be simulated (not validated yet)
Child grant No policy; base data available; can be simulated (not validated yet)
Maternity leave benefits Policy in place; base data available; can be simulated (not validated yet)
Paternity leave benefits Policy in place; base data available; can be simulated (not validated yet)
Death gratuity Policy in place; base data available; can be simulated (not validated yet)
Voluntary contribution to social insurance Policy in place; base data available; can be simulated (not validated yet; hard to identify macro impacts and sustainability of social insurance fund)
VAT Policy in place; can be simulated and validated, but using Enterprise Census data, rather than VHLSS; macro data available
Special Sale Tax Policy in place; can be simulated and validated, but using Enterprise Census data, rather than VHLSS; macro data available
Source: Authors’ compilations based on data obtained from VHLSS for 2012 (GSO 2011).
Notwithstanding the wide-ranging feasibility for simulating the impacts of tax and transfer policies, the case of Viet Nam is still subject to several limitations, largely on the validation side. First, subsidies to households are often not recognized by the households themselves (especially the poor), or fail to be assessed in terms of the effective magnitude and impacts. As an instance, Viet Nam provided subsidies to electricity tariff, which makes the tariff very low if the volume of consumption is below 50 kWh per month. This policy is not explicitly targeting the poor, though the poor are likely to be the only ones with consumption of less than 50 kWh of electricity per month. Yet the poor often misrecognize such subsidy to electricity consumption, and tend to record the electricity bill only (rather than the amount in the projected absence of subsidy). Similar, petrol subsidies are made explicitly for fishermen, but the record tends to be made of the total expenditure only. Another possible item is interest rate subsidy, which is incorporated into the concessional credits to the poor (including poor students). Nevertheless, such subsidy is often estimated with limited precision by the households.

32
Second, as previously mentioned, income and expenditure data in Viet Nam are not as detailed as in other countries. Some tax instruments are not reflected in data. Meanwhile, transfer data are largely available at aggregate level. Accordingly, some variables under standard models are missing. Given this, validating the simulation results on changes of household income and expenditure encounters serious challenge.
It should also be noted that income might be understated for poor households or rural households. For these households, a number of economic activities are for self-consumption, i.e. the outputs were not marketized. In another instance, the poor households may receive in-kind benefits, such as provisions of books, food, etc. Finding an appropriate proxy price to value such self-consumed output or in-kind benefits is virtually impossible.
7 Potential users and partners
Should the model for simulating micro impacts of tax and transfer instruments be built and operated in Viet Nam, the outcomes should appeal to an array of potential users and partners. The first group involves various bodies of the National Assembly, especially the Financial-Budget Committee, and the Economic Committee. As bodies of the National Assembly—the people-elected bodies with legislative and supervisory power, the Financial-Budget Committee and the Economic Committee play important roles in proposing, assessing, approving, monitoring, and reviewing changes in tax and transfer policies. Fulfilling such roles will be made easier in the presence of tools that help document scientifically the impacts of changes, if any. For instance, a number of questions may arise with regard to tax and transfer policies, such as which portion of household income is sensitive to changes in taxes, whether a reduction of direct transfer to households would materially weaken their livelihood, or whether equal reduction in income tax and direct transfer will actually make households better off. More importantly, policy makers may care not just about net impact at the aggregate level, but also about the patterns of distributional impacts across different groups of households (so as to identify targeted supportive measures). Once these impacts are documented quantitatively and scientifically, the Financial-Budget Committee and Economic Committee can have more appropriate feedback to the making of tax and transfer policies. Eventually, this will lead to approval of changes in taxes and transfers that have favourable implications for households, and/or avoidance of changes that may adversely affect households’ welfare.
Another group of potential users is government agencies. In the case of Viet Nam, these include the Ministry of Finance, the Ministry of Planning and Investment, and the Ministry of Labour-Invalids and Social Affairs. The Ministry of Finance is in charge of budget management, including tax revenue mobilization, budget allocation, and monitoring compliance with budget regulations. The Ministry of Planning and Investment holds responsibility for management of broad economic aggregates, including macroeconomic stability, and cooperation in resource cooperation with the Ministry of Finance. The Ministry of Planning and Investment is also in charge of National Targeted Programmes,19 which aim to address social and environmental issues affecting the livelihood of the people. The Ministry of Labour-Invalids and Social Affairs assumes overall responsibility over labour and employment issues, social security, and related programmes/policies.
Given their responsibilities, the Ministry of Finance, the Ministry of Planning and Investment, and the Ministry of Labour-Invalids and Social Affairs may support the government in making
19 On poverty reduction, HIV/AIDS prevention, etc.

33
proposals, formulating, implementing, and reviewing the various tax and transfer policies at work. They can also rely on evidence from micro simulation to enter into debates among themselves. In doing so, one source of information is the potential implications for households. The micro-simulation based on household data might provide evidence on whether the current tax and transfer regime provide net benefits to the majority of households. In particular, the use of micro-simulation is not new to the above Ministries, as they had at least been exposed to the macro-micro simulation of impacts of electricity tariff and petrol price changes (see Box 2). For instance, assuming the micro-simulation can be operational, the Ministry of Finance may be informed about the pattern of impacts on different groups of households when income tax or brackets are altered, which adds to the projection of increase in gross tax revenues. Similarly, the Ministry of Labour-Invalids and Social Affairs may consider the differential impacts of tax and transfer policies on labour in Viet Nam and other countries (preferably those with similar analytical tools or documented impacts), which is relevant to recommendations on enhancing competitiveness of Vietnamese labourers vis-à-vis foreign ones, and on amending policies on labour migration. Had the micro-simulation been used before the approval of the amended Law on Social Insurance in 2014, in the authors’ belief, the recent statutory change in social insurance contribution by employees would have been more sound.
The third group of important partners is the Government Statistics Office (GSO). Given their technical capacity, they can employ micro-simulation for their own assessment of policy changes. The outcome may become even more meaningful if the GSO can combine micro-simulation results with other in-house information and/or statistics. For instance, if the GSO can improve the quality and availability of GDP via income method (under the System of National Accounts), they can ensure better consistency of micro-simulation results (i.e. at household level) with the net impact at the aggregate level.
Besides, being involved and/or familiar with the use of micro-simulation, particularly in the areas of tax and transfer policies, the GSO may better understand the need for more detailed data. This in turn will induce more meaningful effort to improve the micro data as well as the statistical system. As an example, the GSO may attempt to collect information on households’ payment for different tax items and/or receipts of specific transfers/benefits. Collecting more information requires more efforts and even more resources, yet the GSO may be best placed to understand that such additional investment pays off.
Finally, international organizations, donors, and NGOs may find ample interest in the use of micro-simulation of impacts of tax and transfer policies. The documented impacts can be used as evidence to advocate for sounder fiscal policy. For instance, even in the absence of government agencies’ attempts to amend income tax policy, the international organizations, donors, and NGOs may delve specifically into the shortcomings of such policies, such as whether the rate is excessive to middle-income households. Similarly, whether current health insurance benefits suffice for the poor households can also be justified. In other circumstances, the international organizations, donors, and NGOs may enter debates with government agencies about the aspects of taxes and transfers that they think should be improved for people’s wellbeing. Micro-simulation results on the distributional impacts at household level may make their argument more convincing.
In summary, a range of users and partners can find the use of micro-simulation tool relevant for policy-making in Viet Nam. Introducing and using such a tool is not a one-time process, however. It takes time and resources to build capacity for these users and partners, so that they can understand, support, and make use of the micro-simulation tool. In return, comments, feedback, and requirements from such entities may induce micro-simulation model classes with more diversity and/or higher quality.

34
8 Perspective of the Central Institute for Economic Management
The Central Institute for Economic Management (CIEM) under the Ministry of Planning and Investment conducts research and makes proposals to agencies with relevant authority in the government in the following fields:
Drafting of: (i) roadmaps and plans for preparing and amending mechanisms and policies in macroeconomic management; and (ii) proposals on renovating mechanisms and policies in economic management, business environment development, international economic integration, and other cross-cutting issues in economic management.
Review of domestic economic management and international experiences so as to propose pilot applications of new mechanisms, policies, and models in economic management.
Research on theories and methodologies related to economic management and developing issues in Viet Nam.
Advice on mechanisms and policies in economic management prepared by other agencies and organizations.
Creation of information system in economic management to be used by other agencies, organizations, and individuals in accordance with the laws.
Provision of public services to (i) implement scientific programmes and projects on economic management, business environment development, and other related scientific areas in accordance with the laws; (ii) provide graduate-level training and re-training to economic management staff in accordance with the laws; (iii) provide consultancy on economic management, business environment development; (iv) publish output of scientific research on economic management, business environment development in accordance with the laws; and (v) provide assistance, both technical and substantial, to state-owned enterprises and coordinate with the associations of enterprises of various types.
International cooperation in the field of economic policies and management.
Within the policy-making process of Viet Nam, the CIEM is well-connected with government agencies, bodies of the National Assembly, the business communities, NGOs, and international organizations. CIEM has established research cooperation arrangements with such institutions and networks as Global Development Network, East Asian Development Network, University of Tokyo, Economic Institute for ASEAN and East Asia (ERIA), Asian Development Bank Institute, World Bank, Korea Institute for International Economic Policy, etc.
As one major priority, the CIEM emphasized the need to build capacity for understanding and using various economic models (Figure 11). This is acknowledged to support the policy analysis and forecast, which the CIEM assumes as a government think tank. To date, the CIEM has several classes of models available (11). The CIEM was among the first users of computable general equilibrium (CGE) model in Viet Nam. As previously mentioned, a combination of macro-micro simulation approach has been employed at the CIEM since 2011 following the efforts of Vo et al. (2012), which helps identify the impacts of changes in electricity tariff and petrol price on households’ welfare. Finally, the CIEM built various versions of the econometric models, the most notable of which was the structural macroeconometric model. As of March 2016, the CIEM has two versions of such macroeconometric model, one using quarter data (from 1999 to 2015) and one using annual data (from 1990 to 2015), which produce inputs for various macroeconomic analyses and forecasts by CIEM.

35
Figure 11: Types of models at the CIEM
Source: Authors’ compilation.
It should be noted that the CIEM did not start with sufficient capacity to build above models. During the transition of Viet Nam from central planning regime toward market economy since 1986, the CIEM received support from various donors and partners to improve its modelling capacity. For instance, the German Technical Cooperation (formerly GTZ, currently GIZ) provided support to build macroeconometric models for years until 2012, or the World Bank made a one-time support contribution to the macro-micro simulation in 2011–12 (Vo et al. 2013). Following these initial efforts, the CIEM has attempted to continue using the models in its policy advice and consultancy activities.
From that experience, acknowledging the need of building further capacity to use and develop micro-simulation models, the CIEM may be able to sustain the upcoming model tailored to the analysis of tax and transfer policies. The simulation results may serve as inputs for academic research and publications, and can feed into the policy-making process related to tax and transfer policies. Given that Viet Nam is still underway in amending such policies, the room for engaging CIEM’s simulation results remains ample.
References
Asian Development Bank (2014). ‘Poverty and social assessment for Ha Noi and Ho Chi Minh City power grid development sector project’. Available online at: http://www.adb.org/sites/default/files/linked-documents/46391-001-sd-02.pdf (accessed on 15 December 2015).
CIEM
Econometric
models
(Regression)
Computable
General
Equilibrium
Macro-micro
simulation
Panel data
Cross-
sectional
data
Time series
model
Global Trade
Analysis
Project
Structural macro-econometric model

36
CEIC database (2011). Available online at: https://www.ceicdata.com/en (accessed on 5 November 2011).
Central Institute for Economic Management (CIEM) (2013). Comprehensive Evaluation of Vietnam’s Socio-Economic Performance Five Years After the Accession to the World Trade Organization. Ha Noi: Finance Publishing House.
Central Institute for Economic Management (CIEM) (2015). Macroeconomic Report for Q4 and 2014. Ha Noi: Finance Publishing House.
Central Institute for Economic Management (CIEM) (2016). Macroeconomic Report for Q4 and 2015. Ha Noi: Finance Publishing House.
Cling, J.P, M. Razafindrakoto, and F. Roubaud (2011). ‘The informal economy in Vietnam’. Hanoi. December.
General Statistics Office (GSO) (2004). ‘Plan Document on VHLSS 2004’ [Phương án khảo sát
mức sống dân cư 2004]. In Vietnamese. Ha Noi.
General Statistics Office (GSO) (2006). ‘Plan document on VHLSS 2006’ [Phương án khảo sát
mức sống dân cư 2006]. In Vietnamese. Ha Noi.
General Statistics Office (GSO) (2008). ‘Plan document on VHLSS 2008’ [Phương án khảo sát
mức sống dân cư 2008]. In Vietnamese. Ha Noi.
General Statistics Office (GSO) (2010). ‘Plan document on VHLSS 2010’ [Phương án khảo sát
mức sống dân cư 2010]. In Vietnamese. Ha Noi.
General Statistics Office (GSO) (2011). ‘Plan document on VHLSS 2012’ [Phương án khảo sát
mức sống dân cư 2012]. In Vietnamese. Ha Noi.
General Statistics Office (GSO) (2012). ‘Plan document on VHLSS 2013’ [Phương án khảo sát
mức sống dân cư 2013]. In Vietnamese. Ha Noi.
General Statistics Office (GSO) (2015a). ‘Gross domestic product at comparable price in 2010
by sector’ [Tổng sản phẩm trong nước theo giá so sánh 2010 phân theo khu vực kinh tế]. In Vietnamese. Ha Noi. Available online at: http://www.gso.gov.vn/default.aspx?tabid=715 (accessed on 17 November 2015).
General Statistics Office (GSO) (2015b). ‘Report on socio-economic development in 2015’ [Tình
hình kinh tế - xã hội năm 2015]. In Vietnamese. Ha Noi. Available online at: http://www.gso.gov.vn/default.aspx?tabid=621&ItemID=15507 (accessed on 31 December 2015).
General Statistics Office (GSO) (2016a). ‘Poverty incidence’ [Tỷ lệ nghèo]. In Vietnamese. Ha Noi. Available online at: http://www.gso.gov.vn/default.aspx?tabid=723 (accessed on 12 March 2016).
General Statistics Office (GSO) (2016b). ‘Underemployment rate by area and by geographical
region’ [Tỷ lệ thiếu việc làm trong độ tuổi theo vùng và phân theo thành thị, nông thôn]. In Vietnamese. Ha Noi. Available online at: http://www.gso.gov.vn/default.aspx?tabid=714 (accessed on 12 March 2016).
General Statistics Office (GSO) (2016c). ‘Average Population by Gender and by Urban, Rural
Area’ [Dân số trung bình phân theo giới tính và thành thị, nông thôn]. In Vietnamese. Ha Noi. Available online at: http://www.gso.gov.vn/default.aspx?tabid=714 (accessed on 5 January 2016).

37
Government of Vietnam (2012). ‘Decree 47/2012/ND-CP on benefits for the people with merit
under the national struggle’ [Nghị định quy định mức trợ cấp, phụ cấp ưu đãi đối với người
có công với cách mạng]. In Vietnamese. Ha Noi.
Hanoi Portal (2015). ‘In 2015-2016 school year, Viet Nam had enrolment of nearly 5 million
children and over 15 million pupils’ [‘Năm học 2015 -2016, cả nước gần 5 triệu trẻ em và
hơn 15 triệu học sinh phổ thông đến trường’]. In Vietnamese. Ha Noi. Available online at: http://vanban.hanoi.gov.vn/ktxh/-/hn/xE1UIvYPQPgb/606/180406/10/nam-hoc-2015--2016-ca-nuoc-gan-5-trieu-tre-em-va-hon-15-trieu-hoc-sinh-pho-thong-en-truong.html;jsessionid=jKhuwtAEbrIib1gPcLZyHIlO.undefined (accessed on 14 April 2016).
Hansen, H., and D.T. Le (2013). ‘The importance of being surveyed: the representativeness and impact of the Vietnam Household Living Standards Surveys’. Available online at: http://www.ou.edu.vn/ncktxh/Documents/Seminars/VHLSS%20Impacts.pdf (accessed on 15 December 2015).
Le, C., V.C. Nguyen, T. Nguyen, and T. Phung (2013). ‘Firms’ performance, employment and poverty during the economic slowdown period in Vietnam’. Munich Personal RePEc Archive Paper No. 54140. Available online at: http://mpra.ub.uni-muenchen.de/54140/ (accessed on 17 March 2016).
Ministry of Finance (2013a). ‘Circular No. 219/2013/TT-BTC guiding the implementation of the law on value added tax, and of the decree No. 209/2013/ND-CP which guides the
implementation of the law on value added tax’ [Thông tư hướng dẫn thi hành Luật Thuế
Giá trị gia tăng và Nghị định số 209/2013/NĐ-CP ngày 18/12/2013 của Chính phủ quy
định chi tiết và hướng dẫn thi hành một số điều Luật Thuế Giá trị gia tăng]. In Vietnamese. Ha Noi.
Ministry of Finance (2013b). ‘Final account of state budget in 2011’ [Số liệu quyết toán Ngân
sách nhà nước 2011]. In Vietnamese. Ha Noi.
Ministry of Finance (2014a). ‘Final account of state budget in 2012’ [Số liệu quyết toán Ngân
sách nhà nước 2012]. In Vietnamese. Ha Noi.
Ministry of Finance (2014b). ‘Estimates of state budget in 2014’ [Số liệu ước tính Ngân sách nhà
nước 2014]. In Vietnamese. Ha Noi.
Ministry of Finance (2015a). ‘Final account of state budget in 2013’ [Số liệu quyết toán Ngân
sách nhà nước 2013]. In Vietnamese. Ha Noi.
Ministry of Finance (2015b). ‘Estimates of state budget in 2015’ [Số liệu ước tính Ngân sách nhà
nước 2015]. In Vietnamese. Ha Noi.
Ministry of Labour-Invalids and Social Affairs (2014). ‘Report on the implementation of law on
social insurance in 2006’ [Báo cáo đánh giá thi hành Luật Bảo hiểm xã hội]. In Vietnamese. Ha Noi.
National Assembly (2006). ‘Law on social insurance’ [Luật Bảo hiểm xã hội]. In Vietnamese. Available online at: http://thuvienphapluat.vn/van-ban/Bao-hiem/Luat-bao-hiem-xa-hoi-2006-71-2006-QH11-12985.aspx (accessed on 28 March 2016).
National Assembly (2013). ‘Law on amending the law on personal income tax’ [Luật sửa đổi, bổ
sung một số điều của Luật thuế thu nhập cá nhân]. In Vietnamese. Available online at: http://vanban.chinhphu.vn/portal/page/portal/chinhphu/hethongvanban?class_id=1&mode=detail&document_id=164952 (accessed on 15 March 2016).

38
National Assembly (2014). ‘Law on social insurance’ [Luật Bảo hiểm xã hội]. In Vietnamese. Available online at: http://thuvienphapluat.vn/van-ban/Bao-hiem/Luat-Bao-hiem-xa-hoi-2014-259700.aspx (accessed on 28 March 2016).
Nguyen, H. (2013a). ‘Amended law on personal income tax: closer to reality?’ [Luật thuế thu
nhập cá nhân sửa đổi: đã sát với thực tế cuộc sống?]. In Vietnamese. Available online at: http://duthaoonline.quochoi.vn/DuThao/Lists/TT_TINLAPPHAP/View_Detail.aspx?ItemID=599 (accessed on 5 March 2016).
Nguyen, A.D. (2013b). ‘Raising budget deficit ceiling and issuing additional government bonds: some analyses’. Paper for the GIZ Conference on Viet Nam’s Economy. 23 November 2013.
Organisation for Economic Cooperation and Development (OECD) (2014). Social Cohesion Policy Review of Vietnam. Paris: OECD.
Prime Minister (2011). ‘Decision No. 09/2011/QD-TTg dated 30 January 2011 on the Poverty
Line for 2011-2015’ [Quyết định số 09/2011/QĐ-TTg ngày 30/1/2011 về ban hành
Chuẩn nghèo giai đoạn 2011-2015]. In Vietnamese. Ha Noi: Office of the Prime Minister.
State Bank of Viet Nam (2010). ‘Annual report for 2009’ [Báo cáo thường niên 2009]. In Vietnamese. Ha Noi.
Vo, T.T. (2011). ‘Real time evaluation of ADB’s crisis response: the case of Vietnam’. Report for Asian Development Bank. March. Chiyoda, Tokyo: ADB.
Vo, T.T., and A.D. Nguyen (2011). ‘Agricultural development and rural transformation: the case of Vietnam’. Paper prepared for the ERIA project on Agricultural Development, Trade and Regional Cooperation in an Integrating and Industrializing East Asia.
Vo, T.T., V.H. Pham, and A.D. Nguyen (2012). ‘Assessing social impacts of price and tariff reforms in Vietnam: building capacity for change’. Washington DC: World Bank.
World Bank (2015). ‘World development indicators’. Washington DC: World Bank. Available online at: http://data.worldbank.org/data-catalog/world-development-indicators (accessed on 10 December 2015).
World Bank (2016). ‘Tariff rate, applied, weighted mean, all products (%)’. Washington DC: World Bank. Available online at: http://data.worldbank.org/indicator/TM.TAX.MRCH.WM.AR.ZS (accessed on 2 May 2016).