Embed Size (px)
Citation preview

1 | P a g e
WiFi Hotspot
Network Monitoring Tool:
Project Proposal
A document presented to the
Department of Computer Science
At the
University of Cape Town
By
Pheeha Machaka (MCHPHE002) and Kou-An Wang (WNGKUO002)
2 | P a g e
1. Project Description Wireless Fidelity (Wi-Fi) is a wireless networking technology that uses radio waves to provide high-speed, wireless internet and network connections. This technology is based on the IEEE 802.11 standards, including the 802.11a and 802.11b (IEEE, 1999). This technology has proven to be the fast-wireless networking approach that is relatively easy and inexpensive to implement (Steven J. Vaughan-Nichols, 2003). This is made possible by using wireless access point (AP) or hotspots. The AP will broadcast the signal to Wi-Fi-capable devices within the AP’s range. Capable devices can be, from laptops to cellular mobile devices and PDA’s.
AP’s are installed in business settings. However, business networking no longer happens just in offices (Steven J. Vaughan-Nichols, 2003). Today, widely travelling laptop users access the internet at a variety of places and environments including their homes, corporate offices, and even at public places of congregation such as conference venues, airports, shopping malls, hotels, libraries, arenas and so on – places where they spend a considerable amount of time outside private networks. (Anand Balachandran, 2005).
Over the past few years, there has been an increase in the number of wireless users. These users have access to the internet at various places. Companies like RedButton have taken advantage of the increasing demand for the use of wireless access to the internet.
RedButton has placed their Wi-Fi spots devices in coffee shops, hotels, corporate offices, and many other places that have a potential demand for wireless internet access. The increase in the demand for wireless access to internet in various places has led to an increase in the number of Wi-Fi hotpots that RedButton has installed in these various strategic business positions. They currently have more than 400 hotspot routers installed. As the number of hotspots increase, it becomes more difficult to monitor the devices.
There are a lot of activities occurring at each hotpot at any given time. The network administrators from RedButton want to monitor and manage these activities on the hotspot’s AP device.
In this project, we will design a Wi-Fi Hotspot Network Monitoring Tool. The tool will be made up of three modules or components, that will work together to produce the final product. The three components will be fully explained in the Problem statement.
3 | P a g e
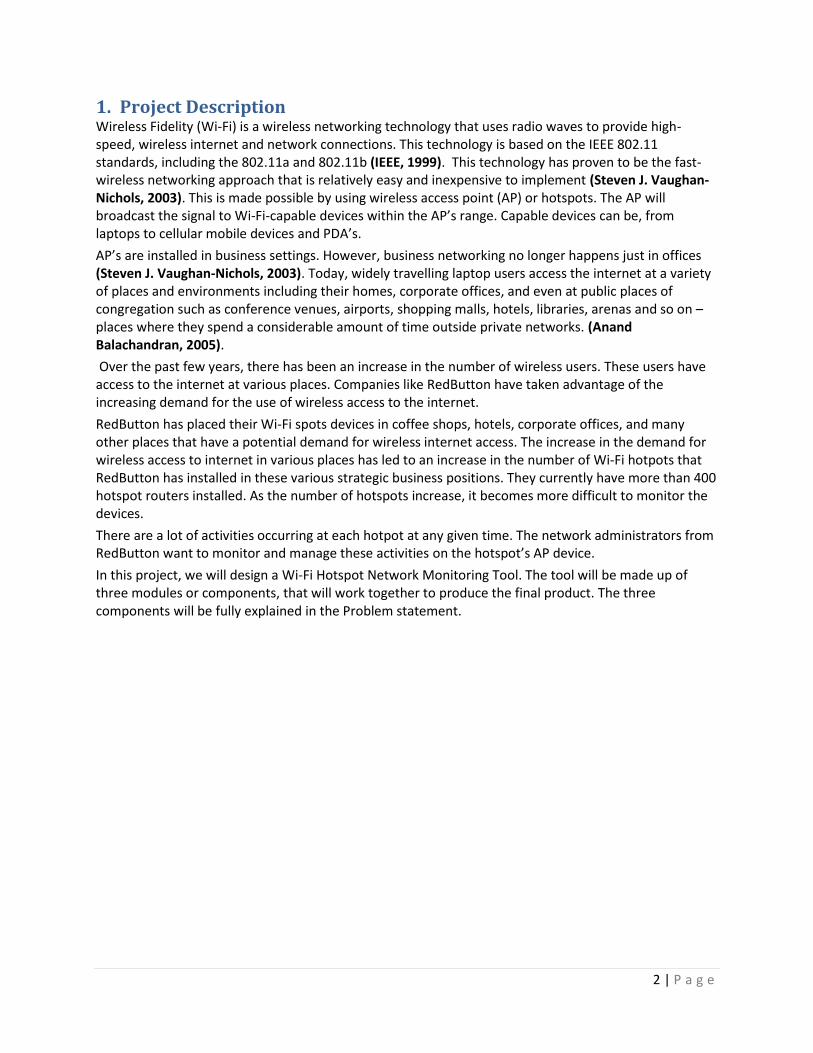
2. Problem Statement RedButton currently does not have a monitoring tool that will produce graphical and numeric data for the network administrator. This makes it very difficult for the network administrator to monitor the network. If the network had a few (less than 10) hotspot devices, it would not be a problem. It becomes extremely difficult now that the network has more than 400 hotpots devices in the country. Figure 1 shows a picture of how the current RedButton network looks. The rectangle with the laptop and the PDA phone represents a hotspot. In each hotspot, there is a WRT54GL router that broadcasts RedButton’s SSID and signal. Through this setting, the client is able to connect to the internet.
The router will also allow the client to connect to the central billing server (for authentication and billing).A RedButton technician (network administrator) can also connect to the central server to check faults with the network. This part of the system does not have a visualization tool to represent graphical and numerical values; therefore the administrator does this manually by formulating their own way of determining the fault with the system.
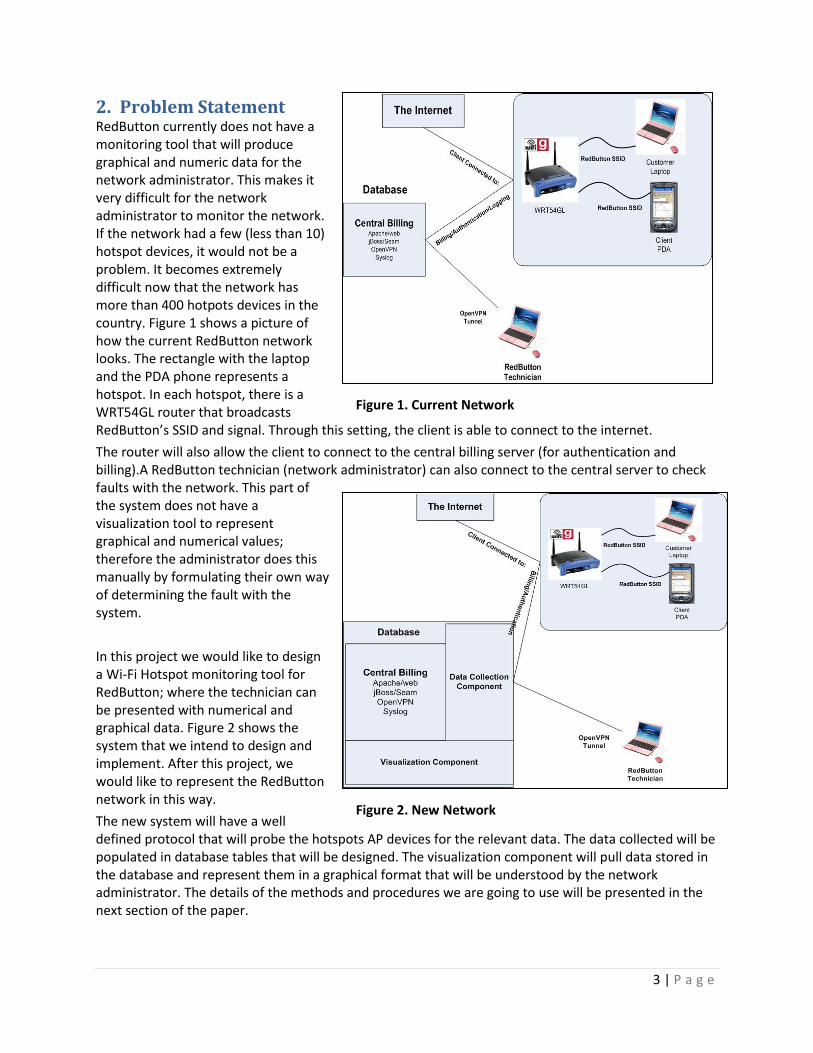
In this project we would like to design a Wi-Fi Hotspot monitoring tool for RedButton; where the technician can be presented with numerical and graphical data. Figure 2 shows the system that we intend to design and implement. After this project, we would like to represent the RedButton network in this way.
The new system will have a well defined protocol that will probe the hotspots AP devices for the relevant data. The data collected will be populated in database tables that will be designed. The visualization component will pull data stored in the database and represent them in a graphical format that will be understood by the network administrator. The details of the methods and procedures we are going to use will be presented in the next section of the paper.
Figure 1. Current Network
Figure 2. New Network
4 | P a g e
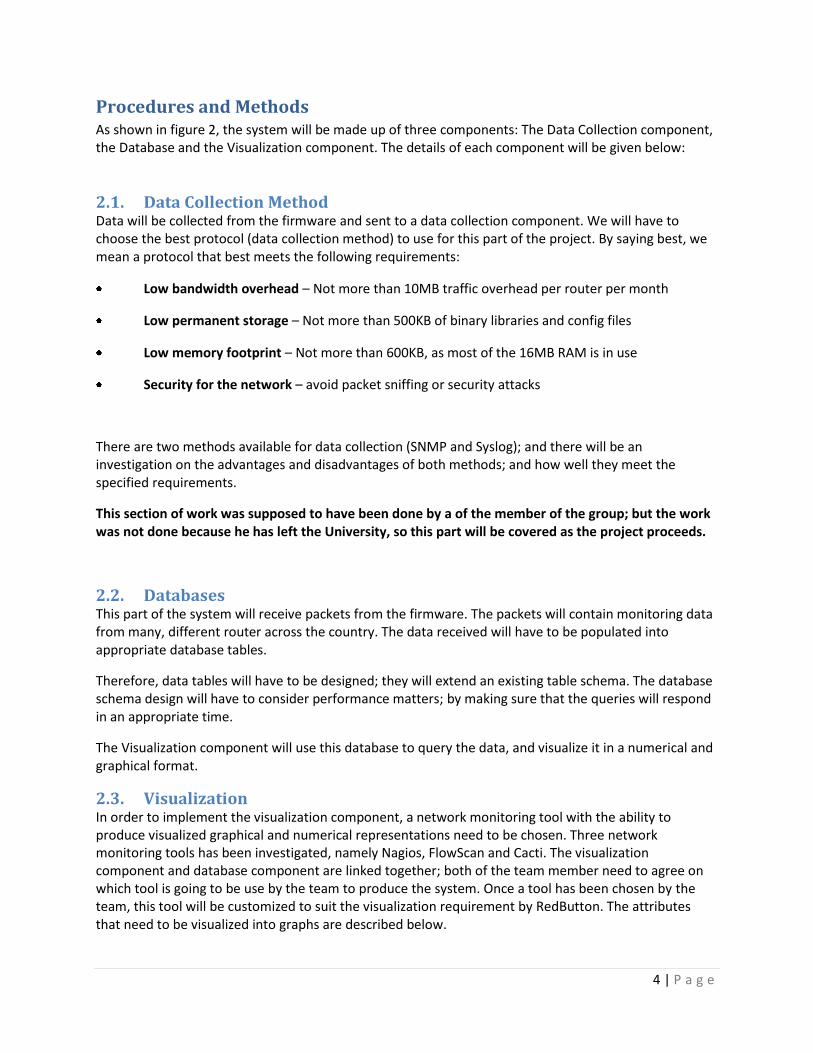
Procedures and Methods As shown in figure 2, the system will be made up of three components: The Data Collection component, the Database and the Visualization component. The details of each component will be given below:
2.1. Data Collection Method Data will be collected from the firmware and sent to a data collection component. We will have to choose the best protocol (data collection method) to use for this part of the project. By saying best, we mean a protocol that best meets the following requirements:
Low bandwidth overhead – Not more than 10MB traffic overhead per router per month
Low permanent storage – Not more than 500KB of binary libraries and config files
Low memory footprint – Not more than 600KB, as most of the 16MB RAM is in use
Security for the network – avoid packet sniffing or security attacks
There are two methods available for data collection (SNMP and Syslog); and there will be an investigation on the advantages and disadvantages of both methods; and how well they meet the specified requirements.
This section of work was supposed to have been done by a of the member of the group; but the work was not done because he has left the University, so this part will be covered as the project proceeds.
2.2. Databases This part of the system will receive packets from the firmware. The packets will contain monitoring data from many, different router across the country. The data received will have to be populated into appropriate database tables.
Therefore, data tables will have to be designed; they will extend an existing table schema. The database schema design will have to consider performance matters; by making sure that the queries will respond in an appropriate time.
The Visualization component will use this database to query the data, and visualize it in a numerical and graphical format.
2.3. Visualization In order to implement the visualization component, a network monitoring tool with the ability to produce visualized graphical and numerical representations need to be chosen. Three network monitoring tools has been investigated, namely Nagios, FlowScan and Cacti. The visualization component and database component are linked together; both of the team member need to agree on which tool is going to be use by the team to produce the system. Once a tool has been chosen by the team, this tool will be customized to suit the visualization requirement by RedButton. The attributes that need to be visualized into graphs are described below.
5 | P a g e
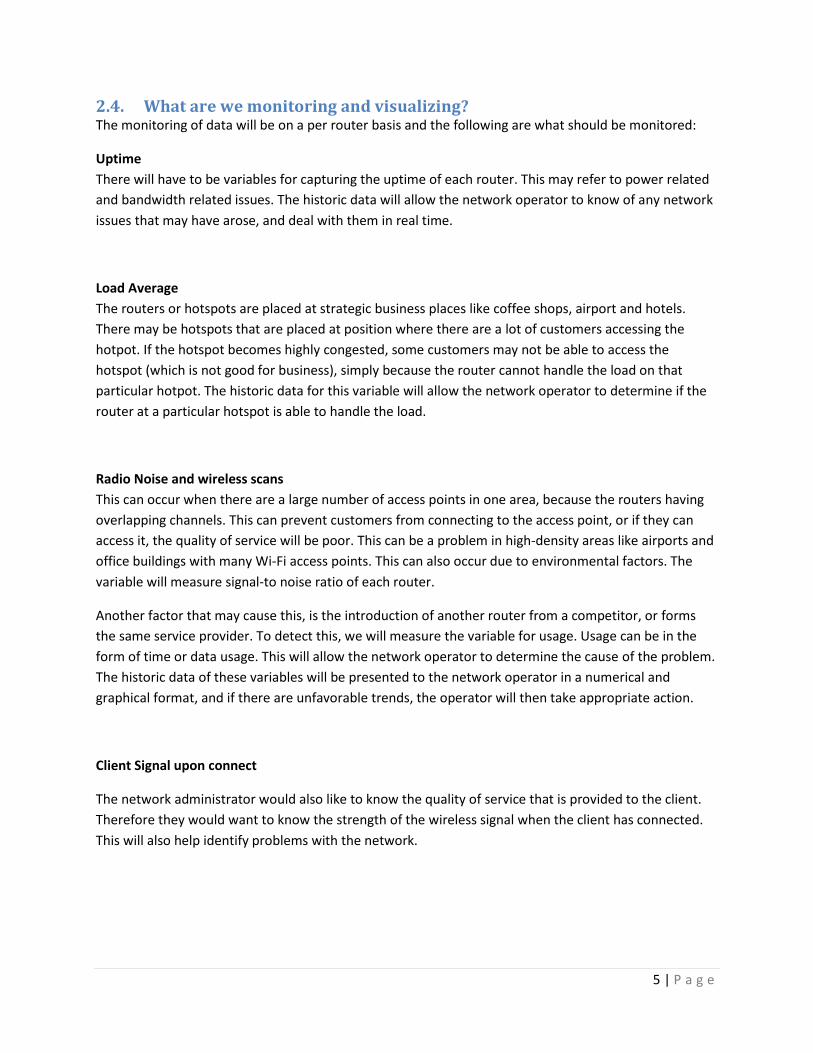
2.4. What are we monitoring and visualizing? The monitoring of data will be on a per router basis and the following are what should be monitored:
Uptime
There will have to be variables for capturing the uptime of each router. This may refer to power related
and bandwidth related issues. The historic data will allow the network operator to know of any network
issues that may have arose, and deal with them in real time.
Load Average
The routers or hotspots are placed at strategic business places like coffee shops, airport and hotels.
There may be hotspots that are placed at position where there are a lot of customers accessing the
hotpot. If the hotspot becomes highly congested, some customers may not be able to access the
hotspot (which is not good for business), simply because the router cannot handle the load on that
particular hotpot. The historic data for this variable will allow the network operator to determine if the
router at a particular hotspot is able to handle the load.
Radio Noise and wireless scans
This can occur when there are a large number of access points in one area, because the routers having
overlapping channels. This can prevent customers from connecting to the access point, or if they can
access it, the quality of service will be poor. This can be a problem in high-density areas like airports and
office buildings with many Wi-Fi access points. This can also occur due to environmental factors. The
variable will measure signal-to noise ratio of each router.
Another factor that may cause this, is the introduction of another router from a competitor, or forms
the same service provider. To detect this, we will measure the variable for usage. Usage can be in the
form of time or data usage. This will allow the network operator to determine the cause of the problem.
The historic data of these variables will be presented to the network operator in a numerical and
graphical format, and if there are unfavorable trends, the operator will then take appropriate action.
Client Signal upon connect
The network administrator would also like to know the quality of service that is provided to the client.
Therefore they would want to know the strength of the wireless signal when the client has connected.
This will also help identify problems with the network.

6 | P a g e
Firmware Version
The network administrator would also like to know what firmware versions are installed on that
particular device. Some problems may be associated with the devices’ firmware, therefore requiring an
upgrade or a downgrade to get the network into a perfect working condition.
WAN/WIFI usage
Historic WAN usage figures can be used to audit upstream supplier usage figures on a per hotspot basis. The difference between the upstream WAN figure and WIFI usage figure is indicative of system overhead.
3. Ethical, professional and Legal Issues The software, operating systems, database tools are open sources; but the existing system that is going
to be installed in our lab has some parts of code which was written by RedButton’s programmers;
therefore a Non-Disclosure agreement (NDA) has to be signed.
NDA’s are commonly signed when two companies or individuals are considering doing business and
need to understand the processes used in each other’s business for the purpose of evaluating the
potential business relationship. NDAs can be "mutual", meaning both parties are restricted in their use
of the materials provided, or they can restrict the use of material by a single party. The NDA has to be
signed by all the members of the team and including the project supervisor.
4. Related Work
4.1. Data Collection Method This part of the work and research was supposed to have been done by the member who has left the
team.
4.2. Databases (Marika K. Thottan, 2003) from Lucent technologies Inc. developed a Monitoring tool (SEQUIN) for a
Multiprotocol Label switching (MPLS)-based network. An MPLS-based network allows packet switching
at a high rate, while retaining the flexibility of Internet Protocol (IP). It enables Service Providers to
preserve network feature where IP can provides support for Quality of Service (QoS) through
differentiated services. More details on how this type of network functions can be found in (Marika K.
Thottan, 2003). To ensure that the level of QoS is met, service providers need to monitor the network
and keep track of Bandwidth utilization and other QoS metrics. SEQUIN uses SNMP-based techniques to
keep track of QoS of metrics for a network service provider. This monitoring tool had the same modules
7 | P a g e
as the ones we are planning to have in our project. The modules perform different tasks, including
network polling, computation of QoS Metrics, and visualizations.
In their monitoring tools database structure, they classified data stored in the database as static or
dynamic. Static information includes system configuration, network element configuration, network
topology, and monitoring agent information. Dynamic information consists of polled SNMP data and
information computed with this data. The polled data were kept in tables that were cleared frequently,
while tables with QoS statistics where kept for a longer period as they were used for decision making.
They used a relational database (SolidTech – provided by SOLID relational databases, a product by IBM –
www.solidtech.com)
(Oiteker, 1998) of the Swiss Federal Institute of Technology wrote a paper describing the history of the
Multi Router Traffic Grapher (MRTG). The paper described the old and current versions of MRTG. The
first version of the MRTG program was a Perl script which uses external utilities to do SNMP queries and
to create images for display in HTML. It logged its data to an ASCII file. The logfiles were then used to
draw graphs on the web page. The logfiles were in plain ASCII, were each line started with a time stamp
followed by the corresponding traffic data. The third version of MRTG used the Round Robin Database
(RRD). With this storage mechanism, MRTG became faster and more configurable. MRTG has moved
from simple, plain files’ storage mechanism to a more sophisticated and reliable database storage
mechanism.
This shows that simple ASCII files can be used for network monitoring, but they have greater
performance disadvantages. (Oiteker, 1998)
4.3. Visualization Security is a very important part of the network monitoring; this is especially true for companies
monitoring wireless hot spot that want to prevent things like loss of bandwidth from network intruders
from happening, many related works have been done for wireless network security, but many
visualization techniques/tools are not capable to automatically detect internet attacks they tend to
simply just display the network data therefore human administrator has to constantly monitoring the
network for attacks, in (Hyunsang Choia)the writers use parallel coordinates to visualize and detect
Internet attacks, they clan they system is intelligent enough to automatically detect and classify attacks
before reporting and visualize them. In (Weichao Wang, 2006) to increase accuracy of detecting Sybil
attacks for their network a user friendly visualization interface was designed together with some
intelligent algorithms to reveal meaningful event correlations from the network topology.
Many existing visualization tools uses plan 2D to represent the network traffic in (Erwan Le Mal ´ecot,
2006) the writers combine 3D and 2D representations of the network traffic activity to try to improve
the usability of their prototype, the 3D and 2D representation views are linked together to provide
complementary functionalities. The 3D representation provides an overview of the communications
between several network zones and the 2D representation provides a detailed view of selected parts of
the 3D zone.

8 | P a g e
Visualization can also combine with autos to produce a better network monitoring tool, in (Christos
Papadopoulos, 2004) they produced a tool called CyberSeer which use a 3D visual representation
combine with autos to alert network administrator when a network event has occurred for example
when packet rate exceeds normal operating levels.
5. Anticipated Outcome
5.1. System (software, key features, major design challenges) At the end of this project a working network monitoring system should be produced, this system should
have the following features included.
The ability to pull data from each WIFI hot spot to its central system.
The ability to efficiently store data to its database.
To be able to visualize data on a per router basis.
The ability to monitor the system remotely (optional)
There are some major design challenges that need to be met by the team; here are some of those
challenges
What protocol should be use for data collection so in the process of collecting information from
routers will not consume too much of bandwidth.
How many tables should be created in order to store the data efficiently / what type of database
should be use.
How to design the database so that visualization component is able to run queries with adequate
response times
How can we visualize those data so it is easy to use, should those visualize graph be represent in
a 2D or 3D view or both, which of visualization tool(s) should we use.
More challenges will be realized as we progress with our project.
A successful project needs to meet all the deadline on time, the system has to meet all requirement
provided by its sponsors (RedButton). The system should be produced within the budget that will be
described by the sponsors; the client should be satisfied with the end product.
The ultimate goal for this project is to produce a network monitoring system for the RedButton
Company and to most importantly score high marks for each of the team member. In order to
determent whether the project has succeeded or not, firstly our sponsor, RedButton, should be satisfied
with the end product that we produce, and our supervisor should also be satisfied with the final system.
9 | P a g e
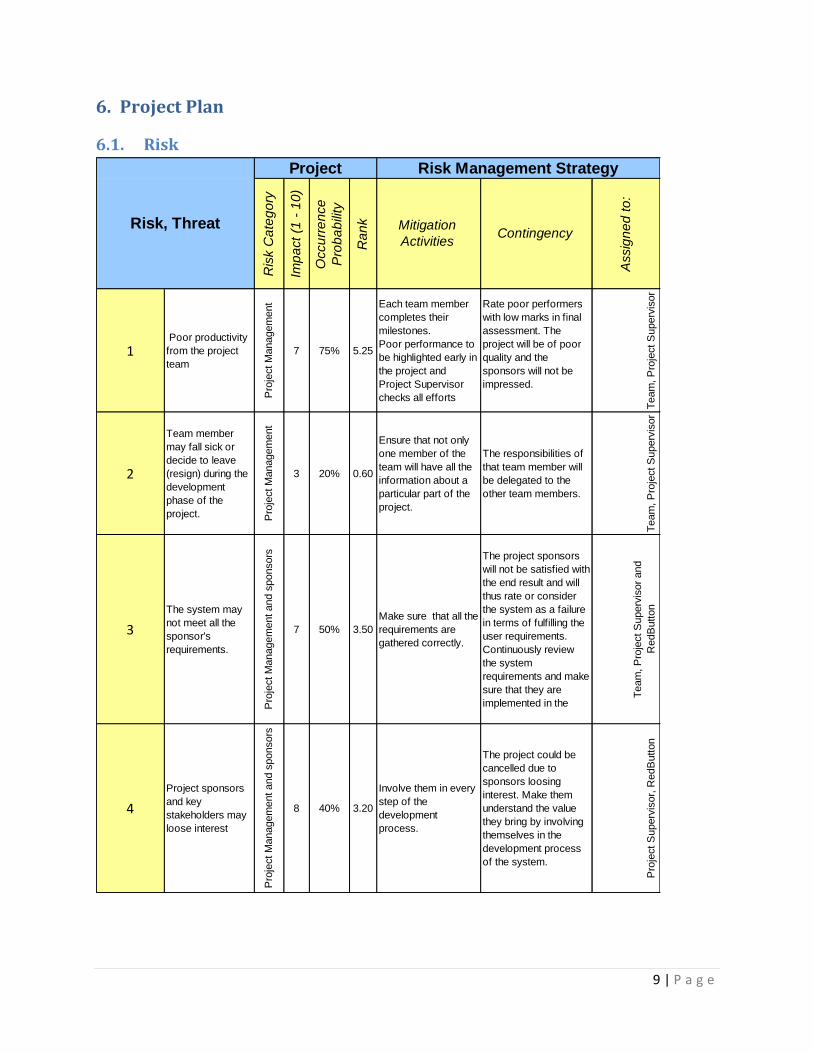
6. Project Plan
6.1. Risk
1 Poor productivity
from the project
team
Pro
ject M
anagem
ent
7 75% 5.25
Each team member
completes their
milestones.
Poor performance to
be highlighted early in
the project and
Project Supervisor
checks all efforts
Rate poor performers
with low marks in final
assessment. The
project will be of poor
quality and the
sponsors will not be
impressed.
Team
, P
roje
ct S
uperv
isor
2
Team member
may fall sick or
decide to leave
(resign) during the
development
phase of the
project. Pro
ject M
anagem
ent
3 20% 0.60
Ensure that not only
one member of the
team will have all the
information about a
particular part of the
project.
The responsibilities of
that team member will
be delegated to the
other team members.
Team
, P
roje
ct S
uperv
isor
3
The system may
not meet all the
sponsor's
requirements.
Pro
ject M
anagem
ent and s
ponsors
7 50% 3.50
Make sure that all the
requirements are
gathered correctly.
The project sponsors
will not be satisfied with
the end result and will
thus rate or consider
the system as a failure
in terms of fulfilling the
user requirements.
Continuously review
the system
requirements and make
sure that they are
implemented in the
Team
, P
roje
ct S
uperv
isor
and
RedB
utton
4
Project sponsors
and key
stakeholders may
loose interest
Pro
ject M
anagem
ent and s
ponsors
8 40% 3.20
Involve them in every
step of the
development
process.
The project could be
cancelled due to
sponsors loosing
interest. Make them
understand the value
they bring by involving
themselves in the
development process
of the system.
Pro
ject S
uperv
isor,
RedB
utton
Mitigation
ActivitiesContingency
Assig
ne
d t
o:
Risk, Threat
Project Risk Management Strategy
Ris
k C
ate
go
ry
Imp
act
(1 -
10
)
Occu
rre
nce
Pro
ba
bili
ty
Ra
nk
10 | P a g e
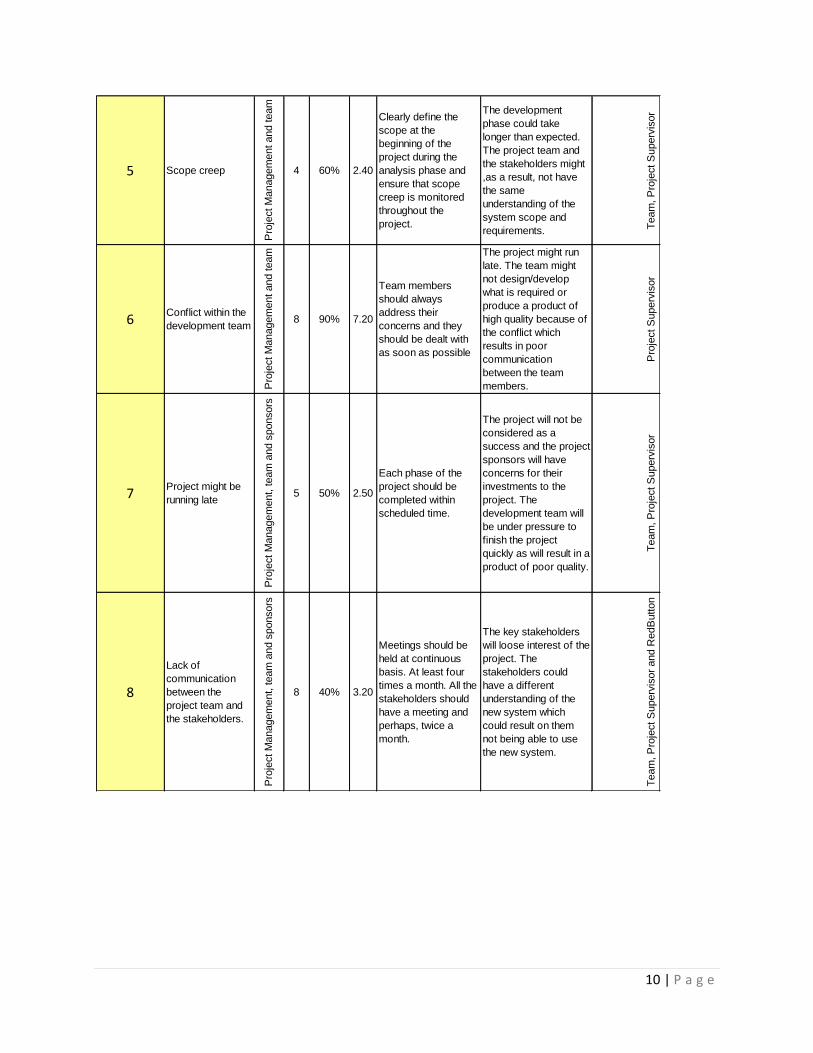
5 Scope creep
Pro
ject M
anagem
ent and team
4 60% 2.40
Clearly define the
scope at the
beginning of the
project during the
analysis phase and
ensure that scope
creep is monitored
throughout the
project.
The development
phase could take
longer than expected.
The project team and
the stakeholders might
,as a result, not have
the same
understanding of the
system scope and
requirements. Team
, P
roje
ct S
uperv
isor
6Conflict within the
development team
Pro
ject M
anagem
ent and team
8 90% 7.20
Team members
should always
address their
concerns and they
should be dealt with
as soon as possible
The project might run
late. The team might
not design/develop
what is required or
produce a product of
high quality because of
the conflict which
results in poor
communication
between the team
members.
Pro
ject S
uperv
isor
7Project might be
running late
Pro
ject M
anagem
ent, team
and s
ponsors
5 50% 2.50
Each phase of the
project should be
completed within
scheduled time.
The project will not be
considered as a
success and the project
sponsors will have
concerns for their
investments to the
project. The
development team will
be under pressure to
finish the project
quickly as will result in a
product of poor quality.
Team
, P
roje
ct S
uperv
isor
8
Lack of
communication
between the
project team and
the stakeholders.
Pro
ject M
anagem
ent, team
and s
ponsors
8 40% 3.20
Meetings should be
held at continuous
basis. At least four
times a month. All the
stakeholders should
have a meeting and
perhaps, twice a
month.
The key stakeholders
will loose interest of the
project. The
stakeholders could
have a different
understanding of the
new system which
could result on them
not being able to use
the new system.
Team
, P
roje
ct S
uperv
isor
and R
edB
utton
11 | P a g e
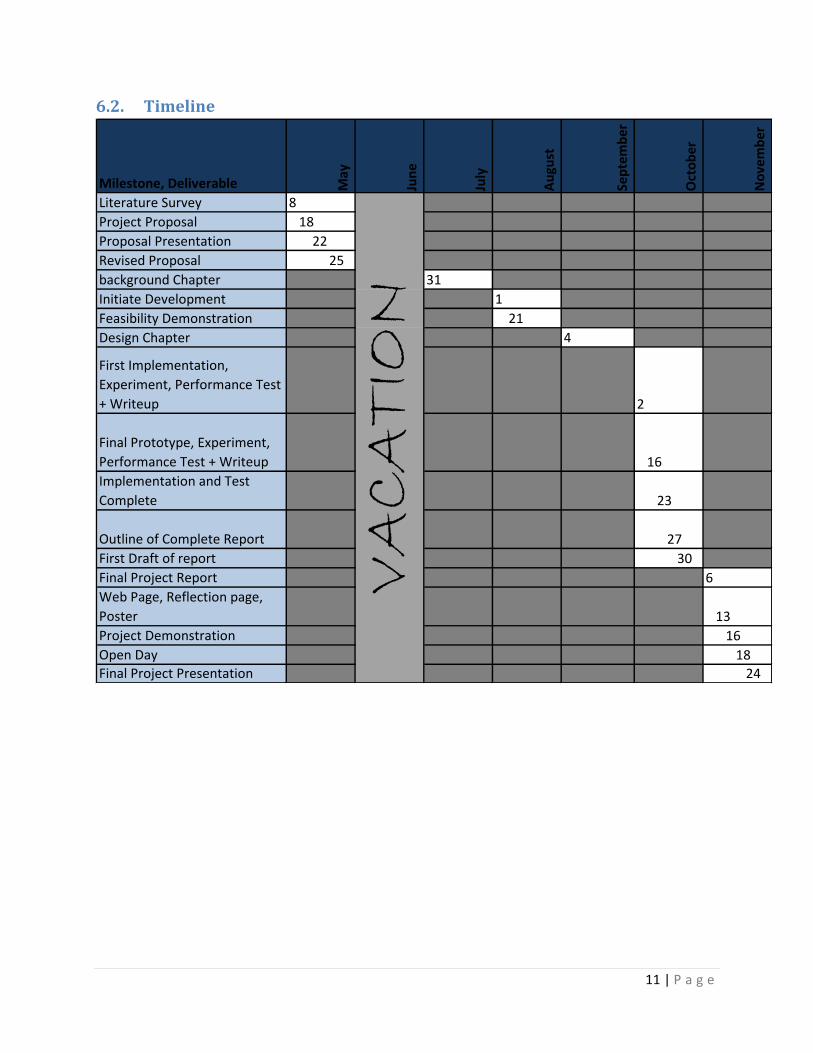
6.2. Timeline
Milestone, Deliverable May
Jun
e
July
Au
gust
Sep
tem
ber
Oct
ob
er
No
vem
ber
Literature Survey 8
Project Proposal 18
Proposal Presentation 22
Revised Proposal 25
background Chapter 31
Initiate Development 1
Feasibility Demonstration 21
Design Chapter 4
First Implementation,
Experiment, Performance Test
+ Writeup 2
Final Prototype, Experiment,
Performance Test + Writeup 16
Implementation and Test
Complete 23
Outline of Complete Report 27
First Draft of report 30
Final Project Report 6
Web Page, Reflection page,
Poster 13
Project Demonstration 16
Open Day 18
Final Project Presentation 24
VACATION
12 | P a g e
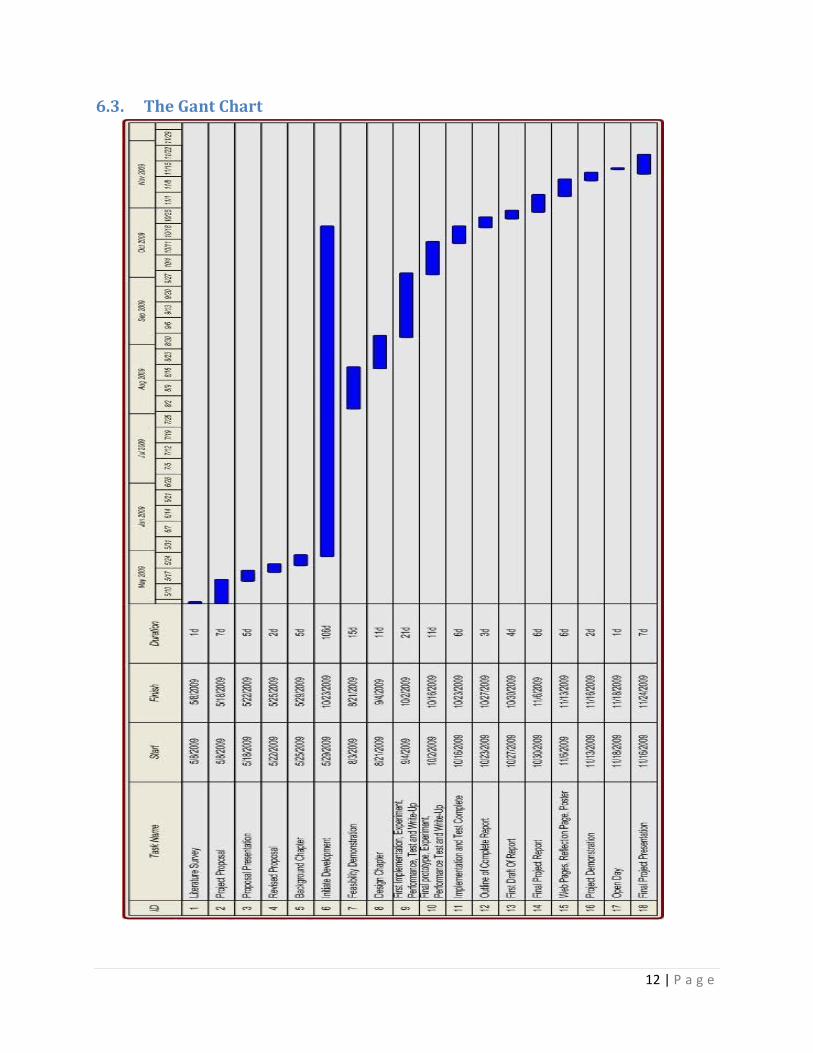
6.3. The Gant Chart
13 | P a g e
6.4. Resources required In this project we will require a demo system that will allow us to test the monitoring tool we are going
to develop. The following will be required:
A computer: Reliable, At least 1GB RAM and 20GB HDD
Routers: 2 or more router will have to be installed in the honours labs for testing purposes
Software: a copy of the software that RedButton uses for supporting their network. Other
software will be downloaded by student, because most of them are open source.
Human Resource: Only one member of the RedButton team should be appointed as responsible
for this project. The appointed member should not be changed during the course of the project;
they will be the communication point between the Development team and Project supervisor.
6.5. Work Allocation Initially this project was divided into three part data collection, database and visualization. One of the team members has quit,
therefore the project is now divided into two parts, where Pheeha Machaka will be doing the data collection and database part
and Kuo-an Wang will be doing the visualization part. Both part are relate closely, so both of the team member will be working
close with each other in order to produce a successful project
7. Works Cited Anand Balachandran, G. M. (2005). Wireless Hotspots: Current Challenges and Future Directions.
Christos Papadopoulos, C. K. (2004). CyberSeer: 3D Audio-Visual Immersion for Network Security and
Management. .
Erwan Le Mal ´ecot, M. K. (2006). Interactively Combining 2D and 3D Visualization for Network Traffic
Monitoring. .
Hyunsang Choia, H. L. (n.d.). Fast detection and visualization of network attacks on parallel coordinates. .
IEEE. (1999). Wireless LAN Medium Access Control (MAC) and Physical Layer (PHY) specifications.
Marika K. Thottan, G. K. (2003). SEQUIN: An SNMP-Based MPLS Network Monitoring System.
Oiteker, T. (1998). The Multi Router Traffic Grapher.
Steven J. Vaughan-Nichols, I. X. (2003). The Challenge Of Wifi Roaming.
Weichao Wang, A. L. (2006). Visualization Assisted Detection of Sybil Attacks in Wireless Networks.
Wikipedia. (n.d.). www.wikipedia.org. Retrieved from Non-Disclosure Agreement.