Embed Size (px)
Citation preview

Wild Steelhead Stock S
t at
us
BC 2006
..
.

British Columbia in PerspectiveBritish Columbia in Perspective
1200 km (720 mi) south to north1200 km (720 mi) south to north
500-1000 km (300 – 600 mi) wide 500-1000 km (300 – 600 mi) wide
950,000 sq km (367,000 sq mi)950,000 sq km (367,000 sq mi)
75% mountains; 60% forested; 75% mountains; 60% forested; 10% farmland and lakes; <2% rivers10% farmland and lakes; <2% rivers
7000 km (4200 mi) of coastline7000 km (4200 mi) of coastline

Population DetailsPopulation Details
~4.0Million total~4.0Million total
~ 60% Vancouver~ 60% Vancouver
~16% Vancouver ~16% Vancouver IslandIsland
~24 % elsewhere but ~24 % elsewhere but only 4% in northern halfonly 4% in northern half
<4% Aboriginal<4% Aboriginal
Most of BC’s steelhead Most of BC’s steelhead staff are in this roomstaff are in this room

B C (Wild) Steelhead FactsB C (Wild) Steelhead Facts
About 580 steelhead “rivers” (3About 580 steelhead “rivers” (3rdrd order or larger) order or larger)
About 630 stocks (85% WSH, 12% ISSH, 3% About 630 stocks (85% WSH, 12% ISSH, 3% CSSH) CSSH) (Ahrens = 401 stocks in 21 CUs)(Ahrens = 401 stocks in 21 CUs)
About 1/3 of rivers along remote mid & N coast About 1/3 of rivers along remote mid & N coast (seldom, if ever, fished)(seldom, if ever, fished)
About 1/4 of rivers on Vancouver Island About 1/4 of rivers on Vancouver Island

BC Steelhead StocksBC Steelhead Stocks

Guesstimates of Abundance Circa 2002Guesstimates of Abundance Circa 2002
Stock TypeStock Type Number of StocksNumber of Stocks
< 500< 500 500 - 1000500 - 1000 > 1000> 1000
WSHWSH 418418 2020 66
CSSHCSSH 4040 22 (1)(1)
ISSHISSH 5050 1111 1111
AllAll 559559 3333 1818

Abundance (cont’d)Abundance (cont’d)
Stock TypeStock Type AbundanceAbundance
Winter SteelheadWinter Steelhead 225,000225,000
Coastal Summer SteelheadCoastal Summer Steelhead 25,00025,000
Interior Summer SteelheadInterior Summer Steelhead 90,00090,000
AllAll 340,000340,000

Hatcheries in Perspective

Number of Streams Stocked with Steelhead Number of Streams Stocked with Steelhead Juveniles Originating From Wild Brood Stock Juveniles Originating From Wild Brood Stock
(F=fry, (F=fry, S=smolt)S=smolt)
Time Time Island Mainland Thompson Cariboo Skeena All Island Mainland Thompson Cariboo Skeena All PeriodPeriod F SF S F SF S F SF S F SF S F SF S FF SS
< 1975 1 3 2 2 0 0 0 0 0 0 3 5< 1975 1 3 2 2 0 0 0 0 0 0 3 5
1975–84 11 15 14 8 1 1 2 0 4 1 32 251975–84 11 15 14 8 1 1 2 0 4 1 32 25
1985–94 19 17 18 19 1 1 3 0 8 1 1985–94 19 17 18 19 1 1 3 0 8 1 49 3849 38
1995–01 11 10 6 14 1 0 0 0 0 1 18 251995–01 11 10 6 14 1 0 0 0 0 1 18 25
2002-05 82002-05 8 55 0? 8 0 0 0 0 0 1 8 130? 8 0 0 0 0 0 1 8 13

Steelhead Releases 1975 - 2001Steelhead Releases 1975 - 2001
PeriodPeriod Av # FryAv # Fry Av # SmoltsAv # Smolts
1975-791975-79 .07M .07M .07M .07M 1980-841980-84 1.03M 1.03M .60M .60M 1985-891985-89 1.59M 1.59M .91M .91M 1990-941990-94 .73M .73M .82M .82M 1995-991995-99 .26M .26M .63M .63M 2000-052000-05 .09M .09M .60M .60M

Stock Assessment Methods
Total Counts Weirs/resistivity counters (Keogh, Deadman, Sustut, Kitwanga, Kloiya)
Indices of Abundance
Gillnet test fisheries (Fraser, Skeena)
Fishwheels (Nass)
Snorkel observations (some total counts)
Aerial Counts (Chilko)
Juvenile sampling


Nass River WatershedNass River WatershedNass Lake
Damdochax Creek
Kwinageese River
Cranberry River
White River
Meziadin Lake
Bowser Lake
Bell-Irving River
Kiteen River
Grease Harbour
Tchitin River
New Aiyansh
Tseax River
Canyon City (Gitwinksihlkw)
Greenville (Lakalzap)
Ishkeenickh River
Kincolith
Kincolith River
Nass River
50 km
N
BC

Fishwheel LocationsFishwheel Locations
Kwinageese River
Cranberry River
White River
Meziadin Lake
Kiteen River
Grease Harbour
Tchitin River
New Aiyansh
Tseax River
Canyon City (Gitwinksihlkw)
Greenville (Lakalzap)
Ishkeenickh River
Kincolith
Kincolith River
Nass River
50 km
N

Nass River FishwheelsNass River Fishwheels
6 wheels operated annually6 wheels operated annually
Mainly for stock assessmentMainly for stock assessment
Late May to late SeptemberLate May to late September
Now operated as the sole in-Now operated as the sole in-season salmon indicator for season salmon indicator for the Nassthe Nass


Nass Steelhead Escapement Nass Steelhead Escapement (1994-2004)(1994-2004)
0
5000
10000
15000
20000
1994 1995 1996 1997 1998 1999 2000 2001 2002 2003 2004
Year
Ste
elh
ead
Escap
em
en
t
5,508
2,049
9,910
12,802
10,004 9,615
13,214,090
13,48112,812
4,336
Preliminary estimate*
Mark recapture estimate Fish wheel expansion estimate

Nass Summer Steelhead Escapement Nass Summer Steelhead Escapement EstimatesEstimates
Indices of Upper Nass Steelhead Escapement
-
2,000
4,000
6,000
8,000
10,000
12,000
14,000
1994 1995 1996 1997 1998 1999 2000 2001 2002 2003 2004 2005

Tyee Test Fishery LocationTyee Test Fishery Location
N
0 6 kmPorcherIsland Kennedy
Island
SmithIsland
DigbyIsland
KaienIsland
ChathamSound
Prince Rupert
Port Edward
EcstallRiver
KhyexRiver
Skeena RiverTyee TestFishery
BC

Tyee Test Fishing SiteTyee Test Fishing Site
SKEENA RIVER
KhyexRiver
Highway16
PortEssignton
Lookout
Tyee Bank
EcstallRiver
Khyex Bank
Tyee Test Fishing Site

Tyee Test Fishery Tyee Test Fishery
Daily Steelhead Index at the Tyee Test Fishery (Selected Years from 1956-2005)
0.00
5.00
10.00
15.00
20.00
1-J
ul
8-J
ul
15-J
ul
22-J
ul
29-J
ul
5-A
ug
12-A
ug
19-A
ug
26-A
ug
2-S
ep
9-S
ep
16-S
ep
23-S
ep
30-S
ep
7-O
ct
Date
Da
ily
In
de
x
1957 (Worst Year)
1998 (Best Year)
2005
All Years Average

Skeena Test Fishery Index 1956-2005Skeena Test Fishery Index 1956-2005
Estimated Annual Escapement of Skeena Summer Run Steelhead at the Tyee Test Fishery,
1956-2005 (All Years To August 24)
0100002000030000400005000060000
19
56
19
60
19
64
19
68
19
72
19
76
19
80
19
84
19
88
19
92
19
96
20
00
20
04
Date
Es
tim
ate
d
Es
ca
pe
me
nt

Upper Sustut River WatershedUpper Sustut River Watershed
SkeenaRiver
BirdflatCreek
Sustut River
Bear Lake
BearRiver
Asitka River
Red Creek
Johanson Creek
JohansonLake
MoosevaleCreek
Two Lake Creek
SustutLake
Study Area
NScale: Approximately 1:340,000
Weir Location

Upper Sustut River WeirUpper Sustut River Weir


Sustut Fence Data - 1992-2005
0
1000
2000
3000
4000
5000
1991 1995 1999 2003
Year
Nu
mb
er
of
Fis
h Steelhead
Sockeye
Chinook
Coho
Bull trout
Rainbow
RMW

Annual escapement trend (17 yrs) in the Bella Coola River for steelhead based on fry data since 1988. LRP = limit reference point; TRP = target reference point for maximum parr/smolt production; 4500 adult
capacity.
0
200
400
600
800
1000
1200
1400
1600
1800
2000
1988 1990 1991 1992 1993 1994 1995 1996 1997 1998 1999 2000 2001 2002 2003 2004 2005
Adul
ts
Escapement
LRP
TRP

Relative stock performance by year in meeting conservation needs (Limit Reference Points) in two steelhead streams.
10%
100%
1000%
1986 1988 1990 1992 1994 1996 1998 2000 2002 2004 2006
Brood Year
%L
RP
Keogh
Bella Coola

Albion Test FisheryAlbion Test Fishery
0
5
10
15
20
1979 1984 1989 1994 1999 2004
Year
Cu
mu
lati
ve
Oc
t. C
PU
E

Trends in ChilkoTrends in Chilko
0
1000
2000
3000
40001
97
2
19
75
19
78
19
81
19
84
19
87
19
90
19
93
19
96
19
99
20
02
20
05
Sp
aw
ne
rs

Deadman Deadman Creek Creek
Resistivity Resistivity Counter Counter

Trends in DeadmanTrends in Deadman
0
500
1000
15001
97
8
19
81
19
84
19
87
19
90
19
93
19
96
19
99
20
02
20
05
Sp
aw
ne
rs
n/a

Trends in BonaparteTrends in Bonaparte
0
200
400
600
8001
98
7
19
89
19
91
19
93
19
95
19
97
19
99
20
01
20
03
20
05
Sp
aw
ne
rs
Fishway Opened

Trends in NicolaTrends in Nicola
0
1000
2000
3000
4000
19
84
19
87
19
90
19
93
19
96
19
99
20
02
20
05
Sp
aw
ne
rs
n/a

Note to Bob, recall that these are not reconstructed returns, these are simply the observed spawner Note to Bob, recall that these are not reconstructed returns, these are simply the observed spawner returns divided by the predominant brood year abundance.returns divided by the predominant brood year abundance.
0
1
2
3
4
51
97
4
19
77
19
80
19
83
19
86
19
89
19
92
19
95
19
98
Brood Year
Retu
rns p
er
sp
aw
ner Chilko
Deadman
Bonaparte
Nicola

Counts of summer steelhead (wild and hatchery) in the Coquihalla River near Hope. Wild capacity = 700 adults. Note F:M ratio favour females. 6 yr lag from
count to adult return.
0
100
200
300
400
500
600
700
74 75 76 77 78 79 80 81 82 83 84 85 86 87 88 89 90 91 92 93 94 95 96 97 98 99 0 1 2 3 4 5
Co
un
t
HWTRP
??


Cheakamus Steelhead Escapement Cheakamus Steelhead Escapement EstimatesEstimates
0
100
200
300
400
500
600
700
800
1996 1997 1998 1999 2000 2001 2002 2003 2004 2005
Es
ca
pe
me
nt

WILD STEELHEAD RETURNS TO THE KEOGH RIVER WILD STEELHEAD RETURNS TO THE KEOGH RIVER 1976 to 20031976 to 2003

• The capacity for smolts dropped from 7,000 (>10,000 with nutrient addition) to <2000 after 1993.
• recent increases in smolts can be attributed to WRP. Extreme low flows in 2004 hindered exit for all species.
Keogh River Steelhead Smolt counts, 1977 to 2005

Smolt-to-adult survival trendsSmolt-to-adult survival trends
2003 estimate based on partial returns.
SAS has dropped from average of 15% to <4%Like wild coho, SAS increased in ‘97 and ‘98, but recently declined based on returns thus far of 2001 smolts

Steelhead smolt yield and adult returns at the Steelhead smolt yield and adult returns at the Keogh River, B.C.Keogh River, B.C.
y = 0.154x
y = 0.0373x0
500
1000
1500
2000
2500
0 2500 5000 7500 10000 12500SMOLTS
AD
UL
T R
ET
UR
NS
1976 to 1989
1990 to 2003
Linear (1976to 1989)Linear (1990to 2003)

Keogh Wild Steelhead (2006 in-season)Keogh Wild Steelhead (2006 in-season)
0
20
40
60
80
100
120
140
12/1
12/8
12/1
5
12/2
2
12/2
9
1/5
1/1
2
1/1
9
1/2
6
2/2
2/9
2/1
6
2/2
3
3/2
3/9
3/1
6
3/2
3
3/3
0
Date
No
s o
f F
ish
1998
1999
2000
2001
2002
2003
2004
2005
2006

TSITIKA RIVER SUMMER STEELHEAD (1976-2005)Snorkel Survey Observations
417
301
406
324
392
277
337
266
202230
149
100
187164
44
104119 129
73 67 63
216193201
103
180
40
127144
170
0
100
200
300
400
500
76 78 80 82 84 86 88 90 92 94 96 98 00 02 04
Year
# of
Ste
elhe
ad

HEBER RIVER SUMMER STEELHEAD (1975-2005)Snorkel Survey Observations - 8.5 km Falls to Mouth
562
323
386367
338
196
223
178
304
167180
211
359
244
394
233
385 387
301
230
122
150
411
392
324
196
100
168
108114
402
0
100
200
300
400
500
600
Geomean = 259

Gold River Peak Winter Steelhead Counts8.1 km Index Section, 1999-2005
106.9
37.2
47.7
37.7
15.812.1 8.8
0
20
40
60
80
100
120
5-Mar-99 31-Mar-00 22-Jan-01 26-Feb-02 6-Feb-03 8-Apr-04 14-Jan-05
Ste
elh
ead
/km

Englishman River Index Counts 1982 - 2005, Peak Steelhead/km
13
20 21
48
43
37
912
5
18
9
24 4 3 4
9
2
85 3 4 5
05
101520253035404550
Ste
elh
ead
/ k
m

Mainland Coast Snorkel Survey Index Sections 1992-2005
0
10
20
30
40
50
Ob
serv
ed
Fis
h/K
m
Glendale
Ahnuhati
Kakweiken
Atwaykellesse
Wahpeeto
Trend

Good
BadUgly

Conservation Status of BC Steelhead Conservation Status of BC Steelhead
Steelhead Status (# stocks)
30%
18%52%
Conservation Concern
Extreme Conservation Concern
Healthy

The CardsThe Cards
Socio-PoliticalSocio-Political– Steelhead are more a nuisance than political priority.Steelhead are more a nuisance than political priority.– Technology is proliferating an illusion of abundance. C&R Technology is proliferating an illusion of abundance. C&R
has been oversold. has been oversold. – Fisheries management = process is the product.Fisheries management = process is the product.
Bio-PhysicalBio-Physical– The “red zone” is creeping north as is the inverse relationship The “red zone” is creeping north as is the inverse relationship
between people/development and fish abundance.between people/development and fish abundance.– The quantity and quality of habitat is not even stable, let The quantity and quality of habitat is not even stable, let
alone increasing. (We aren’t manufacturing any more rivers alone increasing. (We aren’t manufacturing any more rivers and the ocean is a hard act to change.)and the ocean is a hard act to change.)
– Fish culture is not the silver bullet, especially in thermally Fish culture is not the silver bullet, especially in thermally challenged British Columbia.challenged British Columbia.

Final ThoughtsFinal Thoughts
If we want to stretch out the future of steelhead If we want to stretch out the future of steelhead and steelhead fishing, think quality not quantityand steelhead fishing, think quality not quantity
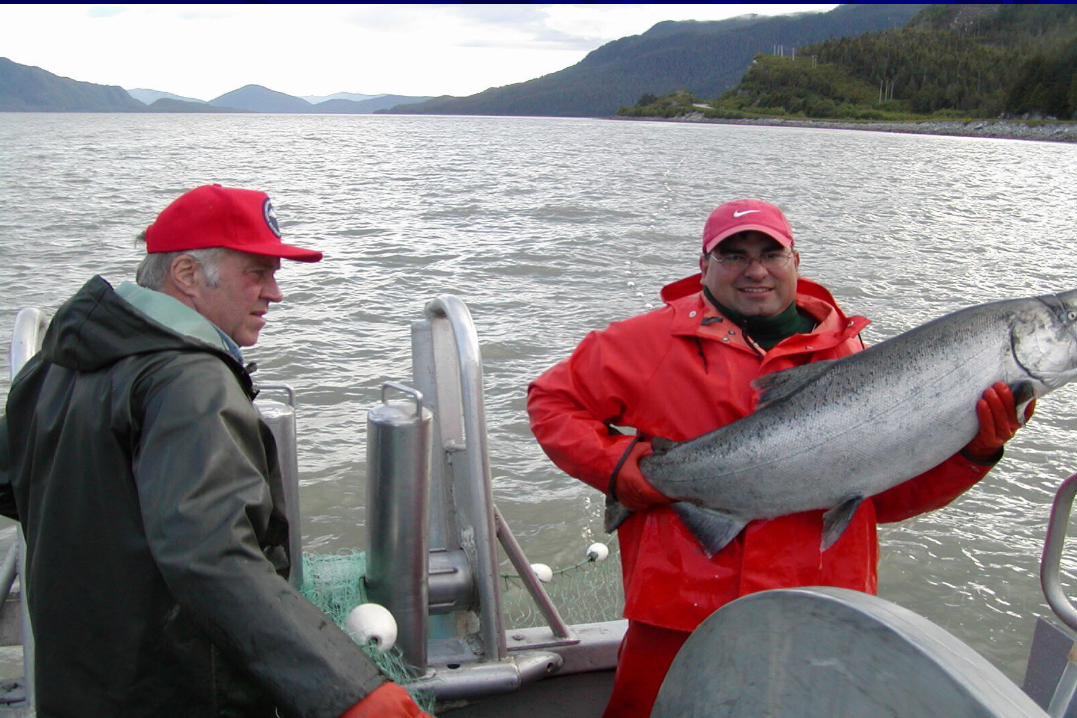
Take lots of pictures. These are the good old Take lots of pictures. These are the good old days.days.

Going…..going………..??????