Embed Size (px)
Citation preview

Wildlife Assessment using Wireless Sensor Networks 1
Wildlife Assessment using Wireless Sensor Networks
Harry Gros-Desormeaux, Philippe Hunel and Nicolas Vidot
0
Wildlife Assessment using
Wireless Sensor Networks
Harry Gros-Desormeaux, Philippe Hunel and Nicolas VidotLAMIA, Université des Antilles et de la Guyane,
Campus de Schœlcher, B.P. 7209, 97275 Schoelcher, French West IndiesFrance
1. Introduction
The endangered species always drew the attention of the scientific community since their dis-appearance would cause irreplaceable loss. To help these species to survive, their habitat isprotected by the laws of environmental protection. Sometimes this protection is not enough,because their natural evolution is the main cause of their disappearance. However, to savethem, it is sometimes possible to transfer them elsewhere that should be similar to their previ-ous habitat to avoid disturbing the balance of wildlife. To model a habitat, several parametersmust be of interest and are generally defined by experts. This is the case for the number ofsinging birds which will be studied in this paper.Today, advances in sensor technology enable the monitoring of species and their habitat ata very low cost. Indeed, the increasing sophistication of wireless sensors bids opportunitiesthat enable new challenges in a lot of areas, including the surveillance one. Progress in theirminiaturization leads to micro-sensors of size of cubic millimeters which, used in large quan-tity, produce huge amounts of data. This paper promotes the use of sensors for monitoringbird endangered in their habitat. Actual methods for counting endangered birds use mainlyhuman labor and because they are not really comprehensive leads to poor estimation. Theuse of sensors deployed in critical environments can help the census of these species and evengenerate new data on their customs.Among the challenges that the use of the sensor technology enable, energy efficiency is themost critical for these wireless networks since battery depletion totally disables a sensor. Inaddition, designing algorithms for wireless networks stems from the distributed computerscience domain with limited devices. Memory space and computational power are often of amagnitude less than miles than their desktop counterparts. This paper investigate the problemand proposes to approximate the number of birds by geometric means derived in a graphproblem.Our paper is organized as follows. First, Section 2 provides an overview of techniques gen-erally used to estimate the locations of multiple sources with a unknown sensor network.Section 4 details our heuristics used to count birds. Section 5 introduces a distributed algo-rithm for counting birds. Experimentation confirms the effectiveness of our counting systemsin Section 6. Then we conclude in Section 7 and gives an overview of our future work.
1
www.intechopen.com
2. Previous Work
Source localization is an area of interest that has been widely studied in these recent years.A comprehensive review of incentives techniques and source localization has been written byKrim and Viberg in (Krim & Viberg, 1996) and it is not difficult to understand that problem hasbeen of particular focus for military needs. Indeed, radar and sonars are a direct applicationof source localization.Several acoustic parameters such as bandwidth, distance sensors, reverberation and thuschange the way the location of the sources are handled. In addition, the algorithms of sourcelocalization depends strongly on physics and rely on the sound characteristics of waveform tocalculate location sources. Waveform audio is known to be broadband (30Hz-15kHz) and sen-sors usually record the sound from near-field sources. The following presents some algorithmsof interest which satisfy these two properties. Near-fields algorithms like close-formed ones(Smith. & Abel, 1987) use time delays between sensors location to estimate the source po-sition. However, though they are computationally less expensive than maximum-likelihoodparametric algorithms (Chen et al., 2001a), they cannot handle efficiently multiple sources(Chen et al., 2001b). Maximum-likelihood (ML) algorithms are inspired by the fact that sourcelocation information is contained in the linear phase shift of the sensor data spectrum ob-tained through a discrete Fourier Transform applied to the wideband data. However, MLtechniques are dominated by low-cost suboptimal techniques like the well-known MUSIC al-gorithm (Schmidt, 1986) which leverages spectral calculus on signal and noise subspaces tofind sources locations.Unlike these approaches, we do not use the acoustic properties of the song of the bird to findits location. Indeed, we assume that our sensors are simple and only detect songs relevant tothe monitored specie. Further, our sensors are wireless and rely on battery power to function.It is important to notice that our algorithms do not try to pinpoint birds, but rather estimatethe number of songbirds that inhabit a region. In our case, only approximate geometric infor-mation is sufficient to establish this estimate.
3. Recognizing the birdsong
The recognition process of birdsong is the first part of our counting systems. Today, it is truethat the performance levels made in the treatment of audio signals are high, but this requireslarge memory and processing power of large size which could exclude limited capacity ofdevices such as wireless sensors.Recognition of species based on acoustic analysis has been widely studied in recent yearsand usually falls within the scope of the classification field. This is particularly the case forrecognition of bird songs. Indeed, for a particular song, it is necessary to determine if it belongsto a specie. For example, the work of Seppo Fagerlund (Fagerlund, 2007) uses support vectormachines to classify the different species of birds based on their songs. Similarly, Jim Caiet al. (Cai et al., 2007) propose a method recognition based on neural networks to find themembership of a song to a bird class. Our recognition process, inspired by the work of Rabiner(Rabiner & Wilpon, 1979), leverages the same mechanics by means of a clustering algorithmto classify the song.Figure 1 gives an overview of our wireless counting system.
www.intechopen.com

Wildlife Assessment using Wireless Sensor Networks 3
Fig. 1. The Counting System
Bird Species Recognition Using Clustering
Our classification method is twofold : a parameterization transformation process of the songin a certain fingerprint, and clustering process to determine its membership.The parametrization process uses the songs of the birds to create a series of coefficients thatdescribe the signal. Although various parameterization methods LPC, LPCC, PLP, dotsexist, we use the MFCC Mel Frequency Cepstral Coefficient because our analysis is limited toa very limited vocabulary on limited devices. Indeed, Christopher Levy compared in (Lévyet al., 2006) different parameterization methods on small systems such as mobile phones forreduced vocabulary and have showed that the parameterization based on MFCC is muchmore effective for such systems.
www.intechopen.com
Once the fingerprint is obtained from the parameterization process, it is added in a set withother fingerprints, themselves derived from a database containing a large number of songs ofindividuals known as the specie. Subsequently, a clustering algorithm (K-Means or EM) isused on all the fingerprints to determine their similarity and to create one or more clusters inwhich will be the bird cluster. For a given footprint, the problem is then to determine its mem-bership to the bird cluster. If that’s the case, data location + Mote timestamp is stored in thedatabase for further processing counting algorithms. Our recognition results are compellingbecause almost all birds are classified correctly in our case.
4. The Counting Algorithm
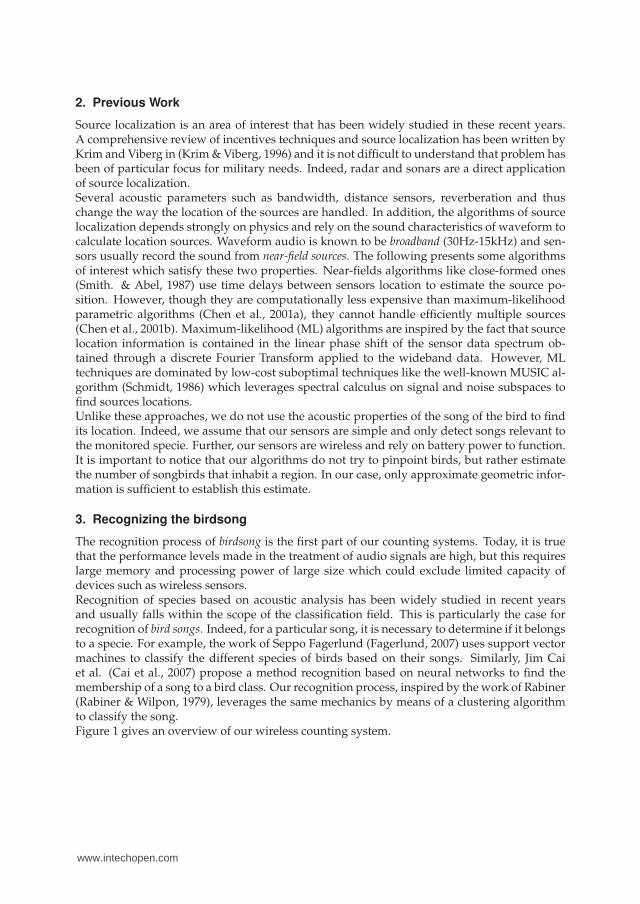
This section is devoted to our counting heuristics inspired by the triangulation detection usedby R. E. Bell to count owls in the forest (Bell, 1964). Our method differs essentially from the factthat we do not use semi-directional devices but omni-directional wireless sensors to looselylocate a birdsong. In our theoretical framework, all motes share the same characteristics build-ing, which means they have the same (processing power, memory, battery, radius of detection,etc). Optimizing routes in wireless sensors networks here are out of concern. We only focuson the manner to detect birds in their habitat viewed as a 2D area. Further, we do not haveany assumptions on the number of birds, on their movements or even their customs.More formally, let denote M = {m1, . . . , mn} the set of all the motes which covers the habitat.Each mote has the same detection radius r. All motes can report information to the basestation B which holds our counting algorithm, assuming that B is always reachable by everymote. Let Ft : M → {0, 1}, the detection function which returns 1 if a mote mi detects a bird,0 otherwise at time t. The base station stores the detection array Dt = [Ft(m1), . . . , Ft(mn)]which reveals the detection state of each mote at time t. Note that the base stores detectionarrays at a sampling rate determined empirically, that is, detection arrays Di are stored in adata set D at the base B. Fig. 2 shows an example of motes placed on a 2D area.
BirdMote
Detection radius
Fig. 2. Motes, birds and the hard underlying unity Chart
We propose to count one bird for all the motes which trigger at time t and for which radiusof detection intersect mutually. We call such a set a Maximal Detection Set denoted MDS(N)with N ⊂ M where N is the set of the motes which trigger at time t. The grayed area infigure 2 is a MDS. Let’s denote such a subset W = {m ∈ M | ∀mi, mj ∈ M, r(mi) ∧ r(mj)}.
www.intechopen.com
Wildlife Assessment using Wireless Sensor Networks 5
BirdMote
Detection radius
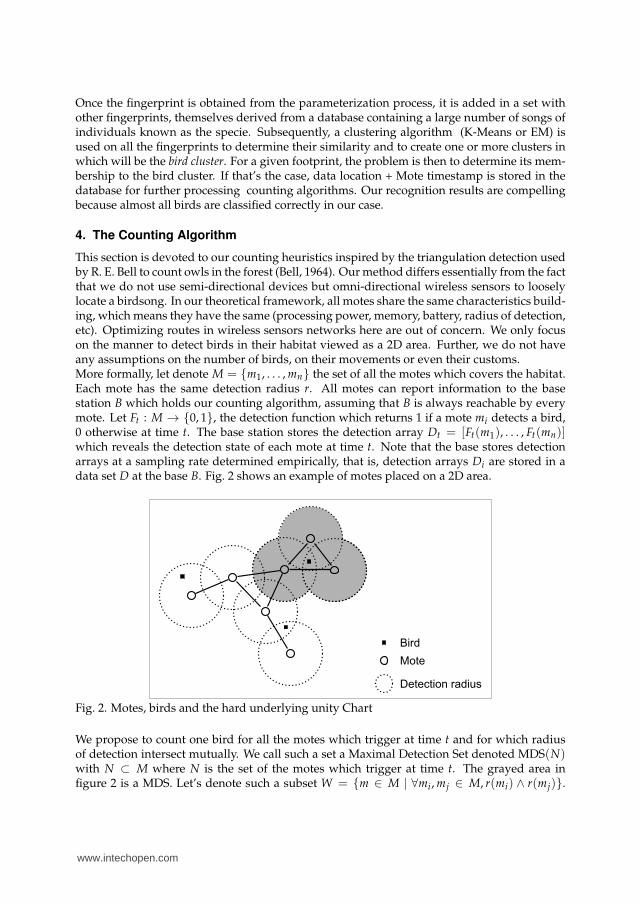
Finding the Maximum Detection Set is similar to find a maximum clique (Bomze et al., 1999).Let’s see why.A unit disk graph G(V, E) is an intersection graph of disks of unit radius, that is, ∀ij ∈ E, theunit circle of center i intersects the unit circle of center j. The set of each center of these circlesis called the model of the unit disk graph. This class of graph is well studied and is extensivelyused in the field of ad hoc networks (Kuhn et al., 2008). Indeed, UDGs (Unit Disk Graphs) canrepresent an ideal view of an ad hoc networks and provides strong theoretical result due to thegeometric properties of the model. For example, Clark and al. (Clark et al., 1990) show thatfinding a maximal clique for an UDG is polynomial given its model. More recently, Raghavanand Spinrad (Raghavan & Spinrad, 2003) have shown that it is even possible to compute themaximum clique without the model in polynomial time.Without loss of generality, let G(V, E) a graph where V is the set of the motes and E, the setof edges where the edge ij exists if and only if the detection radius of mote i intersects thedetection radius of mote j. Clearly, G is a unit disk graph. Unfortunately, a clique in G onlygives motes which are pairwise adjacent and we are interested in motes which are mutuallyadjacent, that is motes which intersect mutually. We propose to alter all triangles (clique of size3) which do not have a mutual intersection in the graph i.e we remove one edge in the triangle.As a consequence, all cliques of more than three vertices will have a mutual intersection.
Theorem 4.1. If a graph G(V, E) only has triangles formed from motes whose detection radius inter-sect mutually, then all motes forming a clique in G have detection radii intersecting mutually.
Proof. By definition, all clique of size three have detection radii which intersect mutually.Now, assume that all motes clique of size n intersect mutually. Let choose such a clique thatwe call S = {m1, . . . , mn} and let’s add a new mote mn+1 to S. Assume that S+ {mn+1} form aclique for which some motes do not intersect mutually. Clearly, mn+1 form at least two properintersections with S, and the detection radius of the mote mn+1 cannot intersect mutually atleast with two other radii detection. But, by definition, all triangles intersect mutually whichis a contradiction.
Reichling (Reichling, 1988) uses convex programming to find the common intersection of a setof disks in O(k) steps where k is the number of constraints of the convex program. Moreover,all the triangles in a graph can be computed in O(mn) steps where m is the number of edgesand n, the number of vertices. Thus, we can alter all triangles which do not have a commonintersection in O(kmn) steps. Several strategies could be used to alter a triangle. However,removing the longest edge in a triangle seems to be the most relevant one since the numberof altered triangles would be reduced. Intuitively, a longest edge in a “bad” triangle is morelikely to be common to another “bad” triangle. Unfortunately, the underlying unit disk graphcan loose its nature since it might become a quasi-unit disk graph1 for which the maximumclique problem is known to be NP-complete (Ceroi, 2002).Algorithm 1 recursively constructs the maximum set of all motes which triggers at time t andremoves a MDS built from this set. For each MDS removed, the number of birds iterates.This procedure is run for each detection array and the maximum number found over thesedetection arrays is an estimation of the number of singing birds. This algorithm complexity isbounded by the MDS search which consists in finding a clique in the unit disk graph underly-ing our network. Breu (Breu, 1996) has given an algorithm which find a maximum clique in aunit disk graph with complexity O(n3.5 log n). However, the alteration of the underlying unitdisk graph leads to a NP-complete algorithm.
1 Model which takes into account non-circular detection area
www.intechopen.com

beginL ← ∅;foreach d ∈ D do
NumberOfBirds ← 0;Construct the underlying altered unit disk graph G(V, E) from d;while V �= ∅ do
Search for a maximum clique in G;Remove this clique from G;NumberOfBirds ← NumberOfBirds + 1;
Add NumberOfBirds to L;
return maxl∈L l;end
Algorithm 1: The Counting Heuristic
Refining the Counting Heuristic
In the following, we suggest a little enhancement of our scheme. Indeed, we partition suc-cessive detection arrays pairwise in order to refine our estimation of the number of birds.Intuitively, the habitat is divided in such a manner that birds in a part could not have movedto another one between two instants (for each couple of detection arrays). A threshold is em-pirically fixed for the flight speed of the birds such that no birds can fly over that value. Thisleads to the decomposition of the environment in several sub-environments. Then, each sub-environment is processed with algorithm 1. For example, assume that we have 10 birds in anarea. Halve this area and put 5 birds in one part, and 5 in the counterpart. Now, assume thatthe 5 birds in the first part sing together at time t, the other ones sing together at time t + 1and these parts are too distant such that birds in one part can go in the other part betweenthe two time steps. In that case, algorithm 1 outputs 5 birds as estimate. Our next algorithmhalves the environment in two parts such that birds in two. As a consequence, we can applyalgorithm 1 on each part independently and take the sum of the estimates found on each part,which gives 10 birds.
Data: A list of detection arrays D = D1, . . . , Dm
Result: An estimation of the number of birds in the habitatbegin
L ← ∅;while |D| > 0 do
Partition detection arrays Di and Di+1 respectively in X = {X1, . . . , Xk} andY = {Y1, . . . , Yk};Z = ∅;for i ← 1 to k do
Process Xi and Yi with algorithm 1 and put the maximum of the number of birdscounted in Z;
Add ∑z∈Z z to L;
return maxl∈L l;end
Algorithm 2: The Enhanced Counting Algorithm
www.intechopen.com

Wildlife Assessment using Wireless Sensor Networks 7
For sake of clarity, in algorithm 2, the number of detection arrays is even and only two suc-cessive detection arrays are partitioned. The next section presents another way to count thesinging birds in their habitat. This next version is designed to be partially distributed on themotes.
5. The Swarm Counting Protocol
Our next counting method can be seen as two levels, a local and a global one. At the locallevel, motes cooperates sending information to count the number of singing birds in theirneighborhood. At the global level, motes aggregates data to find a more accurate estimationof the number of singing birds in the habitat.Like the technique previously described, we assume that the motes layout forms a unit diskgraph. First, motes have to estimate locally how many birds had sang. Then, they send thisdata to the base station which derives from all the information the estimate for the numberof singing birds. In our scheme, motes all have a set of rules which are the following. Theyare all in a passive state until some songs trigger them. When triggered, they switch to anactive state and tell to their neighbors2 that they detect a bird. Then they listen for theirneighborhood during a specified time. Finally, they deduce the number of singing birds in thevicinity from their active answering neighbors, and send this number to the base station.
Local Counting
Our local counting is somewhat similar to the one in section 4. It leverages the trilatera-tion technique to estimate a number of birds in the vicinity. All motes know their neighbors’topology and are in an initial passive state when they are waiting for signals (bird songs).Whenever a mote is triggered , it sends a signal to its neighbors and listen for whose whichwere triggered too. If two or more neighbors have an intersecting detection area, we assumethat only one bird is counted for these motes. In figure 3, the black mote hears a bird song,asks its neighbors if they heard too and waits for their reply. Remark that the number of birdscounted is the number of neighbors which are independent mutually in each neighborhood,i.e the cardinal of the maximum independent set3 in the graph induced by the neighbors.
Global Counting
Now, assume that all motes have counted the birds in their vicinity and have sent their localcount to the base station. Now, all these information have to be aggregated accordingly tofind an estimate of the number of singing birds at this instant. Because, the neighborhood wasused to derive the local counting, obviously, motes which are neighbors will influence eachother in the counting process. So, summing up their local count can lead to an over-estimateof the number of singing birds. Note that is also the case for motes which are at distance 2,that is neighbors of neighbors in the unit disk graph, since they can share common neighbors.Therefore, only motes which are more than distant 2 each other will sum up their count. Ourestimation will be the maximum number of birds which could be counted over aggregatednodes in the underlying graph.In figure 4, the black nodes are at distant 3. So a global counting of singing birds could befour. Remark that such a counting has to be done for all set of nodes which are at more thandistance 2 each other. If such a technique seems to lead to a combinatorial explosion of the
2 As previously, neighbors are adjacent nodes in the unit disk graph3 The largest set of vertices which are not pairwise adjacent
www.intechopen.com
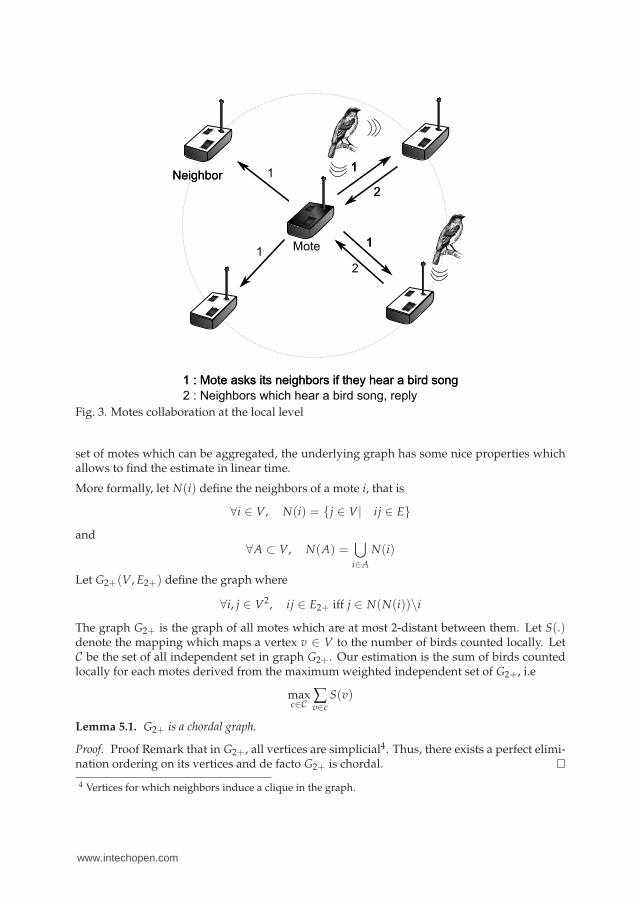
Fig. 3. Motes collaboration at the local level
set of motes which can be aggregated, the underlying graph has some nice properties whichallows to find the estimate in linear time.
More formally, let N(i) define the neighbors of a mote i, that is
∀i ∈ V, N(i) = {j ∈ V| ij ∈ E}
and∀A ⊂ V, N(A) =
⋃
i∈A
N(i)
Let G2+(V, E2+) define the graph where
∀i, j ∈ V2, ij ∈ E2+ iff j ∈ N(N(i))\i
The graph G2+ is the graph of all motes which are at most 2-distant between them. Let S(.)denote the mapping which maps a vertex v ∈ V to the number of birds counted locally. LetC be the set of all independent set in graph G2+. Our estimation is the sum of birds countedlocally for each motes derived from the maximum weighted independent set of G2+, i.e
maxc∈C
∑v∈c
S(v)
Lemma 5.1. G2+ is a chordal graph.
Proof. Proof Remark that in G2+, all vertices are simplicial4. Thus, there exists a perfect elimi-nation ordering on its vertices and de facto G2+ is chordal.
4 Vertices for which neighbors induce a clique in the graph.
Mote
Detection radius
Neighbor
www.intechopen.com

Wildlife Assessment using Wireless Sensor Networks 9
Mote
Detection radius
Neighbor
Fig. 4. Example of underlying unit disk graph in local and global detection
Chordal graphs are graph for which vertices do not induce cycles without chord of size moreor equal to four. They are perfect graphs and well discussed in (Golumbic, 1980). It is also wellknown that finding a maximum weighted independent set in chordal graph is linear (Leung,1984). Thus, our later algorithm finds its estimation of the number of birds in linear time givenG2+.
Let’s see why and how our algorithm is not so sensible to noise and encompasses non circulardetection area. One of the most interesting features of swarm computing (Blum & Merkle,2008) is that nodes (swarm entities) create mechanisms which tend to be resilient to disrup-tion and failure. Similarly, our last counting technique leverages the swarm intelligence sincemotes collaborates each other to derive their local count. The more the motes are, better theestimate is. There are two cases where inconsistencies could appear :
1. Motes can have a different status from what it would be. For example, a mote couldstay in a passive state while it would have heard “a bird song”. However, neighbormotes tend to negate this last effect. Conversely, motes could “wake up” while no birdshave sung. This latter case is somewhat less frequent and is easier to correct since thismote could be a one-vertex connected component in the underlying graph, fact whichis prone to be an erratic behavior of the mote.
2. Objects can occlude bird songs, that is detection area is no more circular. In that case,the occluded motes would stay in a passive state. Fortunately, the swarm could correctthis drawback by multiplicity : other closer motes could hear the birds too.
www.intechopen.com

Therefore, note that the layout of the motes is somewhat important and a simple wayto tackle the occlusion problem is to rise the density of the motes on the monitoredenvironment. It is even possible to only increase the number of motes where occlusionproblems could occur.
The next section is dedicated to experiments which prove our algorithm efficiency, even in thepresence of noise.
6. Experiments
6.1 Context
Endangered species receive attention from the scientific community since their disappearancewould lead to irreplaceable losses. To help these species to survive, their habitat is protectedby laws of environmental protection. Sometimes, this protection is not sufficient since theirhabitat evolution is the main cause of their vanishing. In order to save them, they must betransferred elsewhere. Obviously, the new habitat has to be similar to the previous one tominimally disrupt the equilibrium of the wildlife. To model a habitat, several parametershave to be fixed by an expert. This study precedes the MOM project for which wireless sensornetworks have to be used to monitor an endangered specie. So these simulations are thefirst steps to the deployment of WSNs over the Caravelle location in Martinique (a FrenchCaribbean island). Indeed, birds called “White-breasted Thrasher” are a specie which is onlyknown to be in in the Caravelle. They are considered endangered since specialists think thatonly fifty of them are still alive there.
6.2 Testbed
Environment
For the need of the simulations, we wrote a tool which aims at generating the data necessaryto run our counting heuristics described previously. Our test environment comprises :
• an Intel Core 2 Duo E6750 2.67 GHZ,
• 4 Go RAM,
• Windows Vista 64 bits for Operating System,
• and the JDK 1.6 Update 10 (x64) since our tool is written in java.
Parameters
Simulations parameters were calibrated to be the closest to our tested area. The dimension ofour habitat is about 1000m×1000m. Birds can fly at 2 meters per second, stay at place, takerandom directions with uniform probability. They sing with some probability fixed empiri-cally. This latter parameter is fixed at 0.2 for each sample record (detection array). Finally,motes are placed randomly on our area.
6.3 Performance Evaluation
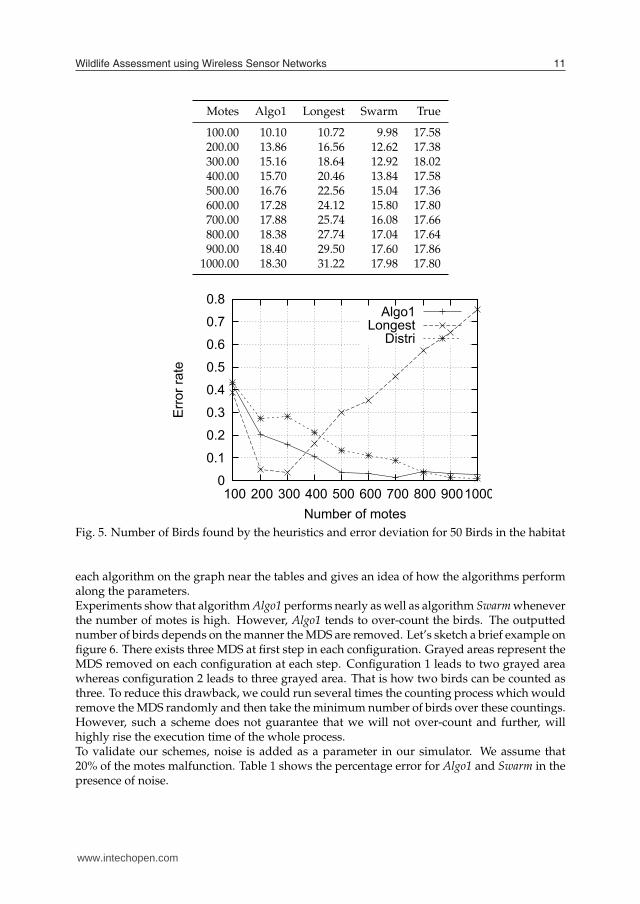
Figure 5 shows our three different algorithms estimation for counting fifty living birds in thehabitat. Algo1 stands for the algorithm which only rely on the underlying UDG. Longest is thealgorithm which alters the longest edges of “bad triangles”. Swarm is the algorithm presentedin section 5. True is the number of birds which really sang. Each test has been driven 50 timesand the mean of the estimations was taken as the final result. Error deviation is shown for
0
0.1
0.2
0.3
0.4
0.5
0.6
0.7
0.8
100 200 300 400 500 600 700 800 900 1000
Err
or ra
te
Number of motes
Algo1Longest
Distri
www.intechopen.com
Wildlife Assessment using Wireless Sensor Networks 11
Motes Algo1 Longest Swarm True
100.00 10.10 10.72 9.98 17.58200.00 13.86 16.56 12.62 17.38300.00 15.16 18.64 12.92 18.02400.00 15.70 20.46 13.84 17.58500.00 16.76 22.56 15.04 17.36600.00 17.28 24.12 15.80 17.80700.00 17.88 25.74 16.08 17.66800.00 18.38 27.74 17.04 17.64900.00 18.40 29.50 17.60 17.86
1000.00 18.30 31.22 17.98 17.80
0
0.1
0.2
0.3
0.4
0.5
0.6
0.7
0.8
100 200 300 400 500 600 700 800 900 1000
Err
or ra
te
Number of motes
Algo1Longest
Distri
Fig. 5. Number of Birds found by the heuristics and error deviation for 50 Birds in the habitat
each algorithm on the graph near the tables and gives an idea of how the algorithms performalong the parameters.Experiments show that algorithm Algo1 performs nearly as well as algorithm Swarm wheneverthe number of motes is high. However, Algo1 tends to over-count the birds. The outputtednumber of birds depends on the manner the MDS are removed. Let’s sketch a brief example onfigure 6. There exists three MDS at first step in each configuration. Grayed areas represent theMDS removed on each configuration at each step. Configuration 1 leads to two grayed areawhereas configuration 2 leads to three grayed area. That is how two birds can be counted asthree. To reduce this drawback, we could run several times the counting process which wouldremove the MDS randomly and then take the minimum number of birds over these countings.However, such a scheme does not guarantee that we will not over-count and further, willhighly rise the execution time of the whole process.To validate our schemes, noise is added as a parameter in our simulator. We assume that20% of the motes malfunction. Table 1 shows the percentage error for Algo1 and Swarm in thepresence of noise.
www.intechopen.com

Configuration 1
Configuration 2Fig. 6. Example of bad counting
Table 1. Relative error for the counting algorithms for 50 birds
Motes Algo1 Swarm Algo1 with noise (%) Swarm with noise(%)
100 45,08 46,33 50,51 50,85200 27,24 33,83 32,69 37,34300 15,27 25,79 20,59 28,62400 8,85 19,31 13,33 23,22500 9,32 19,77 13,75 23,86600 3,31 12,69 6,86 17,49700 1,93 4,54 1,36 9,53800 4,41 3,72 0,93 7,67900 4,30 2,49 2,04 6,23
1000 7,11 1,49 4,47 1,03
Clearly, the algorithm based on the swarm counting protocol seems more sensitive to noisethan its counterpart. Note that without noise, algorithm Algo1 over-counts the number ofbirds. Therefore, in presence of noise, the approximate of the number of birds tends to be moreprecise. Conversely, algorithm Swarm already undercounts the number of birds originally. So,noise degrades even more the approximate of the number of birds which generally leads to aworse counting.
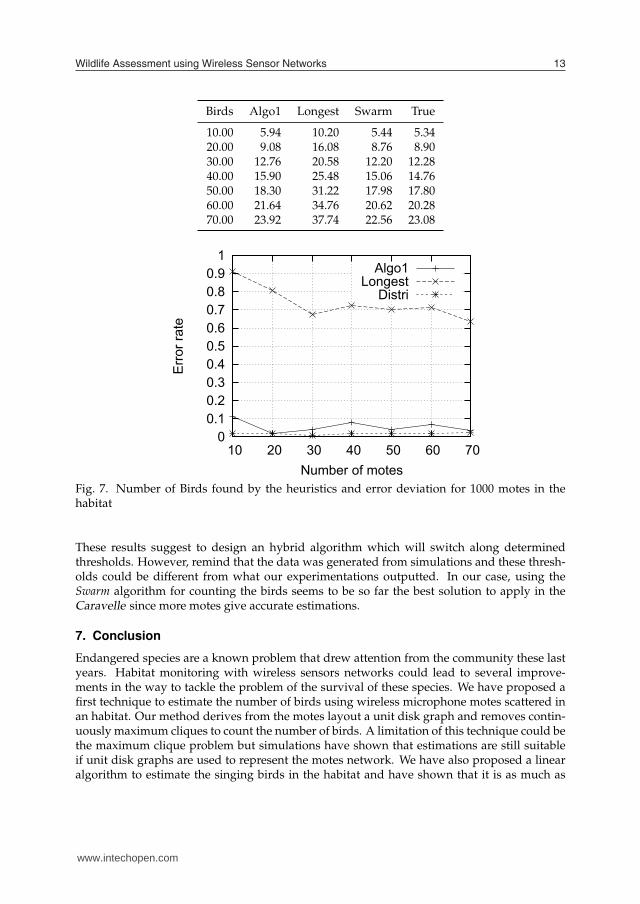
Finally, we decided to fix the number of motes which will be used on the Caravelle habitatto 1000 and vary the number of birds in our simulator to confirm our estimation. Results areshown on figure 7.Algorithm Longest suffers the same drawback seen in figure 5 when the number of motes ishigh, so much that estimation are too high. This results from the fact that altering trianglestends to create much more cliques to remove.Algorithm Swarm gives slightly better estimations in configuration using a high number ofmotes. However, its efficiency lowers whenever less motes are used. Indeed, the lesser themotes you have, the lesser you cover the habitat. Furthermore, our schemes rely on a highnumber of motes to better estimate the singing birds except algorithm Longest which could beused to estimate the songbirds whenever the number of motes are low.
0 0.1 0.2 0.3 0.4 0.5 0.6 0.7 0.8 0.9
1
10 20 30 40 50 60 70
Err
or ra
te
Number of motes
Algo1Longest
Distri
www.intechopen.com
Wildlife Assessment using Wireless Sensor Networks 13
Configuration 1
Configuration 2
Birds Algo1 Longest Swarm True
10.00 5.94 10.20 5.44 5.3420.00 9.08 16.08 8.76 8.9030.00 12.76 20.58 12.20 12.2840.00 15.90 25.48 15.06 14.7650.00 18.30 31.22 17.98 17.8060.00 21.64 34.76 20.62 20.2870.00 23.92 37.74 22.56 23.08
0 0.1 0.2 0.3 0.4 0.5 0.6 0.7 0.8 0.9
1
10 20 30 40 50 60 70
Err
or ra
te
Number of motes
Algo1Longest
Distri
Fig. 7. Number of Birds found by the heuristics and error deviation for 1000 motes in thehabitat
These results suggest to design an hybrid algorithm which will switch along determinedthresholds. However, remind that the data was generated from simulations and these thresh-olds could be different from what our experimentations outputted. In our case, using theSwarm algorithm for counting the birds seems to be so far the best solution to apply in theCaravelle since more motes give accurate estimations.
7. Conclusion
Endangered species are a known problem that drew attention from the community these lastyears. Habitat monitoring with wireless sensors networks could lead to several improve-ments in the way to tackle the problem of the survival of these species. We have proposed afirst technique to estimate the number of birds using wireless microphone motes scattered inan habitat. Our method derives from the motes layout a unit disk graph and removes contin-uously maximum cliques to count the number of birds. A limitation of this technique could bethe maximum clique problem but simulations have shown that estimations are still suitableif unit disk graphs are used to represent the motes network. We have also proposed a linearalgorithm to estimate the singing birds in the habitat and have shown that it is as much as
www.intechopen.com

efficient (quality) as our first one. This scheme can be fully distributed on a suitable wirelesssensors network. Such a distributed scheme would deny the need of a powerful base stationsince the counting process would totally shift from the base to the motes.Counting singing birds is a first step in our habitat monitoring project and surely is not suf-ficient to identify specificities of the monitored specie. One major goal of habitat monitoringis the reintroduction of the specie in another environment which will share the same charac-teristics. We intend to work in this way by monitoring several parameters of interests in anenvironment to model it and compare it with another ones.
8. References
Bell, R. E. (1964). A Sound Triangulation Method for Counting Barred Owls, The Wilson Bul-letin, The Wilson Ornithological Society.
Blum, C. & Merkle, D. (eds) (2008). Swarm Intelligence: Introduction and Applications, NaturalComputing Series, Springer.URL: http://dx.doi.org/10.1007/978-3-540-74089-6
Bomze, I. M., Budinich, M., Pardalos, P. M. & Pelillo, M. (1999). The Maximum Clique Prob-lem, Research Report CS-99-1, Dipartimento di Informatica, Univerità Ca’ Foscari diVenezia.
Breu, H. (1996). Algorithmic aspects of constrained unit disk graphs, Technical Report TR-96-15,Department of Computer Science, University of British Columbia. Tue, 22 Jul 199722:20:10 GMT.URL: ftp://ftp.cs.ubc.ca/pub/local/techreports/1996/TR-96-15.ps.gz
Cai, J., Ee, D., Pham, B., Roe, P. & Zhang, J. (2007). Sensor network for the monitoring ofecosystem: Bird species recognition, Intelligent Sensors, Sensor Networks and Informa-tion, Queensland Univ. of Technol., Brisbane, pp. 293–298.
Ceroi, S. (2002). The clique number of unit quasi-disk graphs, Rapport.URL: http://hal.inria.fr/inria-00072169/en/; http://hal.ccsd.cnrs.fr/docs/00/07/21/69/PDF/RR-4419.pdf
Chen, J. C., Hudson, R. E. & Yao, K. (2001a). A maximum-likelihood parametric approachto source localizations, Proceedings of the Acoustics, Speech, and Signal Processing, IEEEComputer Society, Washington, DC, USA, pp. 3013–3016.
Chen, J. C., Hudson, R. E. & Yao, K. (2001b). Joint maximum-likelihood source localizationand unknown sensor location estimation for near-field wideband signals, in F. T. Luk(ed.), Advanced Signal Processing Algorithms, Architectures, and Implementations XI, Vol.4474, SPIE, pp. 521–532.URL: http://link.aip.org/link/?PSI/4474/521/1
Clark, B. N., Colbourn, C. J. & Johnson, D. S. (1990). Unit disk graphs, Discrete Math. 86(1-3): 165–177.
Fagerlund, S. (2007). Bird species recognition using support vector machines, EURASIP J.Appl. Signal Process. 2007(1): 64–64.
Golumbic, M. C. (1980). Algorithmic Graph Theory and Perfect Graphs, Academic Press.Krim, H. & Viberg, M. (1996). Two decades of array signal processing research — the para-
metric approach, IEEE Signal Processing Magazine, Vol. 13(3).Kuhn, F., Wattenhofer, R. & Zollinger, A. (2008). Ad hoc networks beyond unit disk graphs,
Wireless Networks 14(5): 715–729.URL: http://dx.doi.org/10.1007/s11276-007-0045-6
www.intechopen.com
Wildlife Assessment using Wireless Sensor Networks 15
Leung, J. Y. T. (1984). Fast algorithms for generating all maximal independent sets of interval,circular-arc and chordal graphs, ALGORITHMS: Journal of Algorithms 5.
Lévy, C., Linarès, G. & Bonastre, J.-F. (2006). Gmm-based acoustic modeling for embeddedspeech recognition, In International Conference on Speech Communication and Technol-ogy.
Rabiner, L. R. & Wilpon, J. G. (1979). Considerations in applying clustering techniques tospeaker-independent word recognition, The Journal of the Acoustical Society of America66(3): 663–673.URL: http://link.aip.org/link/?JAS/66/663/1
Raghavan, V. & Spinrad, J. (2003). Robust algorithms for restricted domains, ALGORITHMS:Journal of Algorithms 48.
Reichling, M. (1988). On the detection of a common intersection of k convex objects in theplane, Information Processing Letters 29(1): 25–29.
Schmidt, R. (1986). Multiple emitter location and signal parameter estimation, IEEE Transac-tions on Antennas and Propagation 34(3): 276–280.
Smith., J. & Abel, J. (1987). Closed-form least-squares source location estimation from range-difference measurements, IEEE Transactions on Acoustics, Speech and Signal Processing35(12): 1661–1669.
www.intechopen.com

www.intechopen.com
Wireless Sensor Networks: Application-Centric DesignEdited by Yen Kheng Tan
ISBN 978-953-307-321-7Hard cover, 492 pagesPublisher InTechPublished online 14, December, 2010Published in print edition December, 2010
InTech EuropeUniversity Campus STeP Ri Slavka Krautzeka 83/A 51000 Rijeka, Croatia Phone: +385 (51) 770 447
InTech ChinaUnit 405, Office Block, Hotel Equatorial Shanghai No.65, Yan An Road (West), Shanghai, 200040, China
Phone: +86-21-62489820 Fax: +86-21-62489821
Over the past decade, there has been a prolific increase in the research, development and commercialisationof Wireless Sensor Networks (WSNs) and their associated technologies. WSNs have found application in avast range of different domains, scenarios and disciplines. These have included healthcare, defence andsecurity, environmental monitoring and building/structural health monitoring. However, as a result of the broadarray of pertinent applications, WSN researchers have also realised the application specificity of the domain; itis incredibly difficult, if not impossible, to find an application-independent solution to most WSN problems.Hence, research into WSNs dictates the adoption of an application-centric design process. This book is notintended to be a comprehensive review of all WSN applications and deployments to date. Instead, it is acollection of state-of-the-art research papers discussing current applications and deployment experiences, butalso the communication and data processing technologies that are fundamental in further developing solutionsto applications. Whilst a common foundation is retained through all chapters, this book contains a broad arrayof often differing interpretations, configurations and limitations of WSNs, and this highlights the diversity of thisever-changing research area. The chapters have been categorised into three distinct sections: applicationsand case studies, communication and networking, and information and data processing. The readership of thisbook is intended to be postgraduate/postdoctoral researchers and professional engineers, though some of thechapters may be of relevance to interested master’s level students.
How to referenceIn order to correctly reference this scholarly work, feel free to copy and paste the following:
Harry Gros-desormeaux, Philippe Hunel and Nicolas Vidot (2010). Wildlife Assessment Using Wireless SensorNetworks, Wireless Sensor Networks: Application-Centric Design, Yen Kheng Tan (Ed.), ISBN: 978-953-307-321-7, InTech, Available from: http://www.intechopen.com/books/wireless-sensor-networks-application-centric-design/wildlife-assessment-using-wireless-sensor-networks
www.intechopen.com

Fax: +385 (51) 686 166www.intechopen.com
Fax: +86-21-62489821

© 2010 The Author(s). Licensee IntechOpen. This chapter is distributedunder the terms of the Creative Commons Attribution-NonCommercial-ShareAlike-3.0 License, which permits use, distribution and reproduction fornon-commercial purposes, provided the original is properly cited andderivative works building on this content are distributed under the samelicense.