Embed Size (px)
Citation preview

AMENDED
PETROLEUM COKE: A 48-HOUR STATIC-RENEWAL ACUTE IMMOBILISATION TEST
WITH THE CLADOCERAN (Daphnia magna)
AMENDED FINAL REPORT
WILDLIFE INTERNATIONAL, LTD. PROJECT NUMBER: 472A-112
OECD GUIDELINE 202 and
U.S. EPA OPPTS NUMBER 850.1010
AUTHORS:
STUDY INITIATION DATE: April 22, 2004
STUDY COMPLETION DATE: June 22, 2006
AMENDED REPORT DATE: April 10, 2007
SUBMITTED TO:
American Petroleum Institute 1220 L Street, N.W.
Washington, DC 20005
Wildlife International, Ltd. 8598 Commerce Drive
Easton, Maryland 21601 USA (410) 822-8600
Page 1 of 159


Wildlife International, Ltd.
- 5 -
Project Number 472A-112
TABLE OF CONTENTS
Title/Cover Page..................................................................................................................................... 1 Good Laboratory Practice Compliance Statement ................................................................................. 2 Quality Assurance Statement ................................................................................................................. 3 Report Approval ..................................................................................................................................... 4 Table of Contents ................................................................................................................................... 5 Summary ................................................................................................................................................ 9 Introduction .......................................................................................................................................... 10 Objective .............................................................................................................................................. 10 Experimental Design ............................................................................................................................ 10 Materials and Methods ......................................................................................................................... 11 Test Substance ......................................................................................................................... 12 Reference Substances .............................................................................................................. 12 Test Organism.......................................................................................................................... 13 Dilution Water ......................................................................................................................... 14 Test Apparatus ......................................................................................................................... 15 Preparation of Test Concentrations.......................................................................................... 15 Analy tical Sampling ................................................................................................................ 15 Analytical Method by HPLC................................................................................................... 16 Analytical Method by ICP-AES .............................................................................................. 17 Environm ental Conditions ....................................................................................................... 18 Observations ............................................................................................................................ 19 Conditions for the Validity of the Test .................................................................................... 19 Data Analyses .......................................................................................................................... 19 Results and Discussion ......................................................................................................................... 20 Measurement of Test Concentrations ...................................................................................... 20 Observations and Measurements ............................................................................................. 20 Conclusions .......................................................................................................................................... 20 References ............................................................................................................................................ 21
Wildlife International, Ltd.
- 6 -
Project Number 472A-112
TABLE OF CONTENTS (Continued)
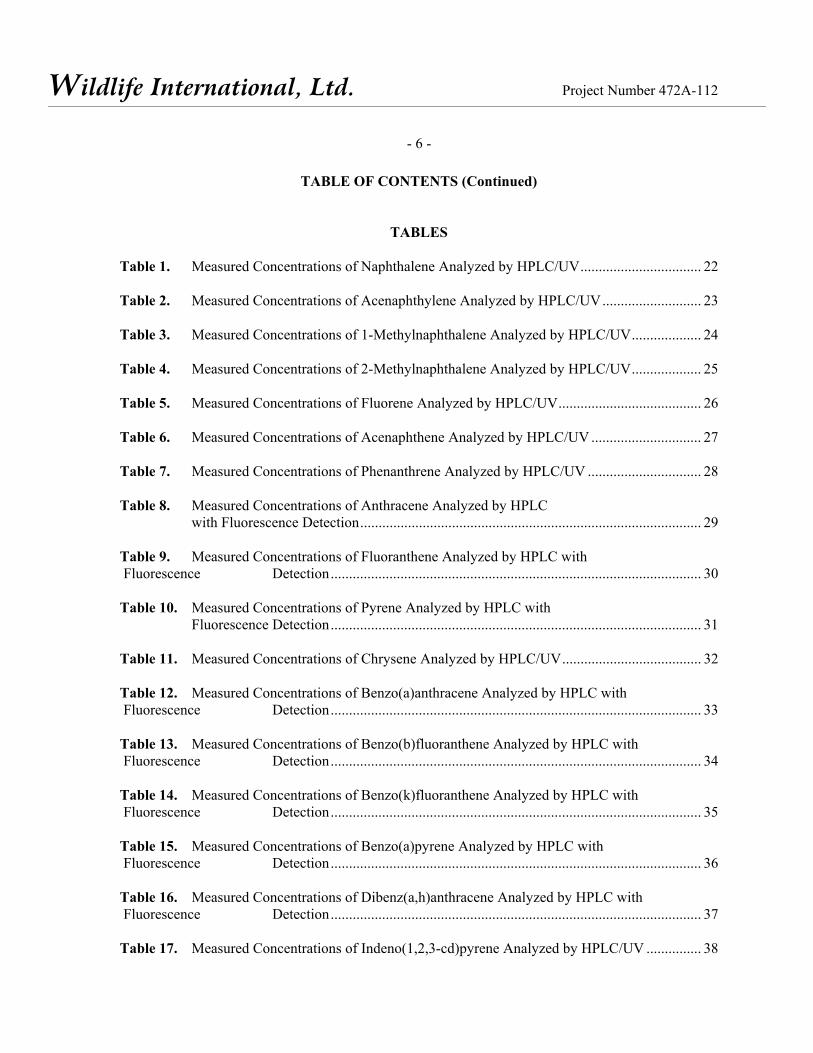
TABLES Table 1. Measured Concentrations of Naphthalene Analyzed by HPLC/UV................................. 22 Table 2. Measured Concentrations of Acenaphthylene Analyzed by HPLC/UV........................... 23 Table 3. Measured Concentrations of 1-Methylnaphthalene Analyzed by HPLC/UV................... 24 Table 4. Measured Concentrations of 2-Methylnaphthalene Analyzed by HPLC/UV................... 25 Table 5. Measured Concentrations of Fluorene Analyzed by HPLC/UV....................................... 26 Table 6. Measured Concentrations of Acenaphthene Analyzed by HPLC/UV .............................. 27 Table 7. Measured Concentrations of Phenanthrene Analyzed by HPLC/UV ............................... 28 Table 8. Measured Concentrations of Anthracene Analyzed by HPLC with Fluorescence Detection............................................................................................. 29 Table 9. Measured Concentrations of Fluoranthene Analyzed by HPLC with Fluorescence Detection..................................................................................................... 30 Table 10. Measured Concentrations of Pyrene Analyzed by HPLC with Fluorescence Detection..................................................................................................... 31 Table 11. Measured Concentrations of Chrysene Analyzed by HPLC/UV...................................... 32 Table 12. Measured Concentrations of Benzo(a)anthracene Analyzed by HPLC with Fluorescence Detection..................................................................................................... 33 Table 13. Measured Concentrations of Benzo(b)fluoranthene Analyzed by HPLC with Fluorescence Detection..................................................................................................... 34 Table 14. Measured Concentrations of Benzo(k)fluoranthene Analyzed by HPLC with Fluorescence Detection..................................................................................................... 35 Table 15. Measured Concentrations of Benzo(a)pyrene Analyzed by HPLC with Fluorescence Detection..................................................................................................... 36 Table 16. Measured Concentrations of Dibenz(a,h)anthracene Analyzed by HPLC with Fluorescence Detection..................................................................................................... 37 Table 17. Measured Concentrations of Indeno(1,2,3-cd)pyrene Analyzed by HPLC/UV ............... 38

Wildlife International, Ltd.
- 7 -
Project Number 472A-112
TABLE OF CONTENTS (Continued)
Table 18. Measured Concentrations of Benzo(g,h,i)perylene Analyzed by HPLC with Fluorescence Detection..................................................................................................... 39 Table 19. Measured Concentrations of Dibenzo(a,e)pyrene Analyzed by HPLC with Fluorescence Detection..................................................................................................... 40 Table 20. Measured Concentrations of Arsenic Analyzed by ICP-AES .......................................... 41 Table 21. Measured Concentrations of Copper Analyzed by ICP-AES ........................................... 42 Table 22. Measured Concentrations of Iron Analyzed by ICP-AES ................................................ 43 Table 23. Measured Concentrations of Nickel Analyzed by ICP-AES ............................................ 44 Table 24. Measured Concentrations of Selenium Analyzed by ICP-AES........................................ 45 Table 25. Measured Concentrations of Vanadium Analyzed by ICP-AES ...................................... 46 Table 26. Measured Concentrations of Sulfur Analyzed by ICP-AES............................................. 47 Table 27. Temperature, Dissolved Oxygen and pH of Water in the Test Chambers........................ 48 Table 28. Specific Conductance, Hardness, Alkalinity and Total Organic Carbon Measured in the Dilution Water at Test Initiation ............................................................ 49 Table 29. Cumulative Mortality/Immobility and Observations........................................................ 50 Table 30. Estimates of the EL50 Values........................................................................................... 51

Wildlife International, Ltd.
- 8 -
Project Number 472A-112
AMENDED
TABLE OF CONTENTS (Continued)
APPENDICES Appendix 1. Exploratory Non-GLP Rangefinding Toxicity Test with Petroleum Coke ................ 52 Appendix 2. Protocol, Amendments and Deviations ...................................................................... 55 Appendix 3. Test Article Selection ................................................................................................. 78 Appendix 4. AVEKA, Inc. Particle Processing Report................................................................... 89 Appendix 5. Laboratory Characterization of 2 mm Particle Size Petroleum Coke......................... 97 Appendix 6. Specific Conductance, Hardness, Alkalinity and pH of Well Water Measured During the 4-Week Period Immediately Preceding the Test ................... 103 Appendix 7. Analyses of Pesticides, Organics and Metals in Wildlife International, Ltd. Well Water ............................................................................................................... 104 Appendix 8. Results of WAF Equilibration Trial ......................................................................... 106 Appendix 9. Analysis of Organic Constituents of Petroleum Coke in Freshwater ....................... 107 Appendix 10. Analysis of Inorganic Constituents of Petroleum Coke in Freshwater .................... 135 Appendix 11. Personnel Involved in the Study............................................................................... 157 Appendix 12. Report Amendment .................................................................................................. 158

Wildlife International, Ltd.
- 9 -
Project Number 472A-112
SUMMARY
SPONSOR: American Petroleum Institute TITLE: Petroleum Coke: A 48-Hour Static-Renewal Acute Immobilisation Test with the Cladoceran
(Daphnia magna) WILDLIFE INTERNATIONAL, LTD. PROJECT NUMBER: 472A-112 TEST SUBSTANCE: Petroleum Coke GUIDELINES: OECD Guideline for Testing of Chemicals, 202: Part 1 – 24H EC50 Acute
Immobilization Test; U.S. EPA Series 850 – Ecological Effects Test Guidelines OPPTS Number
850.1010: Aquatic Invertebrate Acute Toxicity Test, Freshwater Daphnids TEST DATES: Study Initiation: April 22, 2004 Experimental Start (OECD): March 21, 2005 Experimental Start (EPA): March 22, 2005 Biological Termination: March 24, 2005 Experimental Termination: March 31, 2005 LENGTH OF EXPOSURE: 48 Hours TEST ORGANISMS: Cladoceran (Daphnia magna) SOURCE OF TEST ORGANISMS: Wildlife International, Ltd. Cultures Easton, Maryland 21601 AGE OF TEST ORGANISMS: Neonates, <24 hours old TEST CONCENTRATIONS: Nominal WAF Loading Rate Negative Control 1000 mg/L RESULTS: Based on nominal WAF loading rate: EL50: >1000 mg/L NOELR: 1000 mg/L

Wildlife International, Ltd.
- 10 -
Project Number 472A-112
INTRODUCTION
Wildlife International, Ltd. conducted a 48-hour static-renewal acute im mobilization test to
determine the effects of a water accommodated fraction of petroleum coke on the cladoceran, Daphnia
magna, for the American Petroleum Institute at the Wildlife International, Ltd. aquatic toxicology facility
in Easton, Maryland. Petroleum coke is defined as a the product formed by subjecting the heavy tar-like
residue remaining following oil refining to high tem peratures and pressures. It consists of prim arily
elemental carbon with considerably smaller amounts of hydrocarbons, sulfur and trace amounts of heavy
metals. The in-life phase of the definitive test was conducted from March 22 to 24, 2005. Raw data
generated by Wildlife International, Ltd. and a copy of the final report are filed under Project Number
472A-112 in archives located on the Wildlife International, Ltd. site.
OBJECTIVE
The objective of this study was to determine the acute effects of a water accommodated fraction
of petroleum coke on the cladoceran, Daphnia magna, during a 48-hour exposure under static-renewal
conditions in a sealed exposure system.
EXPERIMENTAL DESIGN
Daphnids were exposed to a single water accommodated fraction (WAF) of the test substance and
a negative (dilution water) control for 48 hours. The nominal WAF loading rate was 1000 mg/L. For this
test, the term loading rate means the total amount of test substance added to the dilution water volume
(mg/L) to achieve the respective WAF solution. Because petroleum coke is a multi-component substance
not fully soluble in water, WAFs are an acceptable means of creating exposure solutions for ecotoxicity
tests (3). The WAF loading rate was selected in consultation with the Sponsor, and was based upon the
results of an exploratory range finding toxicity test (Appendix 1). Three replicate test chambers were
maintained in each treatm ent and control group, with 10 daphnids in each test chamber, for a total of
30 daphnids per test concentration. Daphnids were transferred to newly prepared WAF solutions and
control water at approximately 24 hours. Water samples were collected at test initiation, prior to renewal
of solutions at 24 hours, and at test termination for analysis for selected constituents of petroleum coke.
Because petroleum coke is a complex mixture of elemental carbon and low levels of hydrocarbons and
metals, several polyaromatic hydrocarbons and metals were selected to be monitored in the test solutions
during the test. The com ponents selected for m easurement were those that are either of ecological
concern or were known to occur in petroleum coke in am ounts that m ight be m easured in a WAF
solution. Those constituents of interest included the following:

Wildlife International, Ltd.
- 11 -
Project Number 472A-112
PAH Metals and Sulfur Acenaphthene Nickel Acenaphthylene Vanadium Anthracene Iron Benzo(a)anthracene Copper Benzo(a)pyrene Selenium Benzo(b)fluoranthene Arsenic Benzo(g,h,i)perylene Sulfur Benzo(k)fluoranthene Chrysene Dibenzo(a,e)pyrene Dibenz(a,h)anthracene Fluoranthene Fluorene Indeno(1,2,3-cd)pyrene Naphthalene Phenanthrene Pyrene 1-Methylnaphthalene 2-Methylnaphthalene
Daphnids were im partially assigned to exposure chambers at test initiation. Observations of
mortality/immobility and other clinical signs were made approximately 2, 24 and 48 hours after test
initiation. The cum ulative percent mortality/immobility observed in the treatm ent group was used to
determine whether the 24 and 48-hour EL50 values were greater or less than the 1000 mg/L WAF loading
rate. The no-observed-effect-loading rate (NOELR) was determ ined by visually interpreting the
mortality, immobility and observation data.
MATERIALS AND METHODS
The study was conducted according to the procedures outlined in the protocol, “Petroleum Coke:
A 48-Hour Static-Renewal Acute Im mobilisation Test with the Cladoceran (Daphnia magna )”
(Appendix 2). The protocol was based on procedures outlined in the OECD Guideline for Testing of
Chemicals, 202: Part 1 – 24H EC50 Acute Immobilization Test (4); and U.S. EPA Series 850 –
Ecological Effects Test Guidelines OPPTS Number 850.1010: Aquatic Invertebrate Acute Toxicity Test,
Freshwater Daphnids (5).

Wildlife International, Ltd.
- 12 -
Project Number 472A-112
Test Substance
The test substance was green petroleum coke (CAS Number 64741-79-3). The test substance was
received from Experimental Pathology Laboratories, Herndon, VA for API on October 7, 2003. It was
assigned Wildlife International, Ltd. identifi cation number 6485 upon receipt and was stored under
ambient conditions. The test substance, black pellets, was identified as 2 m m particle size Petroleum
Coke (aka Milled Pellets).
The identity, strength, purity , com position (Appendix 4), storage stability , and m ethod of
synthesis, fabrication and/or derivation (Appendix 3) of each batch of the test substance and the
maintenance of these records were the responsibility of the Sponsor.
Reference Substances
Purified polyaromatic hydrocarbons (PAH) were made up of components received from three
manufacturers. The following reference standards were received from AccuStandard Inc. and were stored
under ambient conditions:
Component
Test Substance Number
Lot/Batch
CAS
Number
Date
Received
Expiration
Date
Description
Benzo(a)pyrene Anthracene Benz(a)anthracene Acenaphthylene Acenaphthene Benzo(b)fluoranthene Benzo(g,h,i)perylene Benzo(k)fluoranthene Chrysene Dibenz(a,h)anthracene Fluoranthene Fluorene Indeno(1,2,3-cd)pyrene Naphthalene Phenanthrene Pyrene
6705 6706 6707 6708 6709 6710 6711 6712 6713 6714 6715 6716 6717 6718 6719 6720
052803MT-AC A33783 19587 011504MS-AC 01915EQ 020402AG-AC 122 500MT-AC 112603AG-AC 13103 13246 19762 19675 19641 167A-A 090903AG-AC-1 09617LR
50-32-8 120-12-7 56-55-3 208-96-8 83-32-9 205-99-2 191-24-2 207-08-9 218-01-9 53-70-3 206-44-0 86-73-7 193-39-5 91-20-3 85-01-8 129-00-0
6/07/04 6/07/04 6/07/04 6/07/04 6/07/04 6/07/04 6/07/04 6/08/04 6/08/04 6/08/04 6/08/04 6/08/04 6/08/04 6/08/04 6/08/04 6/08/04
6/03/07 6/03/07 6/03/07 6/03/07 6/03/07 6/03/07 6/03/07 6/03/07 6/03/07 6/03/07 6/03/07 6/03/07 6/03/07 6/03/07 6/03/07 6/03/07
green powder white powder
colorless plates yellow powder white crystal white flakes
green powder yellow powder white powder green powder white powder white powder
yellow powder white flakes
white powder green crystal

Wildlife International, Ltd.
- 13 -
Project Number 472A-112
The following reference standard was received from Cambridge-Isotope Labs and was stored
under ambient conditions:
Component
Test Substance Number
Lot/Batch
CAS
Number
Date
Received
Expiration
Date
Description
Dibenzo(a,e)pyrene 6518 I1-7628 192-65-4 10/22/03 Not given Solids
The following standards were received from ChemService and were stored under am bient
conditions:
Component
Test Substance Number
Lot/Batch
CAS
Number
Date
Received
Expiration
Date
Description
2-Methylnaphthalene 1-Methylnaphthalene
6765 6766
310-43C 325-31A
91-57-6 90-12-0
8/03/04 8/03/04
9/01/08 5/01/09
Solid Liquid
Analytical standards for each of the seven metal and sulfur elements of interest were received
from Spex Industries (Metuchen, N.J. 08840) and we re stored under am bient conditions. All of the
materials were 1,000 mg/L Spex CertiPrep® plasma standards in 2% HNO 3, with the exception of the
sulfur standard which was a 10,000 mg/L preparation in water. The following tabulation sum marizes
pertinent data for each analytical standard:
Component
Test Substance Number
Lot/Batch
CAS
Number
Date
Received
Expiration
Date
Description Arsenic (As) Copper (Cu) Iron (Fe) Nickel (Ni) Selenium (Se) Sulfur (S) Vanadium (V)
6543 6544 6545 6546 6547 6890 6549
10-06AS 9-183CU 9-184FE 10-29NI 10-31SE S9-51S 10-88V
7440-38-2 7440-50-8 7439-89-6 7440-02-0 7782-49-2 7704-34-9 7440-62-2
11/06/03 11/06/03 11/06/03 11/06/03 11/06/03 10/18/04 11/06/03
11/15/05 11/15/05 11/15/05 11/15/05 11/15/05 10/15/05 11/15/05
Clear liquid Blue liquid
Clear Liquid Blue liquid
Clear Liquid Liquid
Yellow Liquid
Test Organism
The cladoceran, Daphnia magna, was selected as the test species for this study. Daphnids are
representative of an important group of aquatic invertebrates and were selected for use in the test based
upon past history of use and ease of culturing in the laboratory. Daphnid neonates used in the test were

Wildlife International, Ltd.
- 14 -
Project Number 472A-112
AMENDED
less than 24-hours old and were obtained from cultures maintained by Wildlife International, Ltd., Easton,
Maryland.
Adult daphnids were cultured in individual beakers containing approximately 80 mL of water
from the same source and at approximately the same temperature as used during the test. During the 14-
day period preceding the test, water temperatures in the cultures ranged from 20.3 to 21.0ºC, measured
with a hand-held liquid-in-glass thermometer. The pH of the water ranged from 8.2 to 8.7, measured with
a Fisher Scientific Accumet Model 915 pH meter. Dissolved oxygen concentrations ranged from 7.4 to
8.8 mg/L (≥82% of saturation), m easured with a Yellow Springs Instrum ents Model 51B dissolved
oxygen meter.
Once daily during culturing, daphnids were fed a mixture of yeast, Cerophyll®, and trout chow
(YCT), as well as a suspension of the freshwater green alga, Selenastrum capricornutum. The adults
were fed prior to test initiation, but neonates were not fed during the test.
The adult daphnia in the cultures producing neonates for the test were 18 day s old prior to
collection of the juveniles for testing. Adult daphnia in the cultures produced an average of at least three
young per adult per day over the 7-day period prior to the test. The adults showed no signs of disease or
stress during the culture period, and no ephippia were produced in the cultures. Neonate daphnids were
obtained for testing from three individual adult daphnids that had produced at least one prior brood. At
test initiation, the juvenile daphnids were collected from the cultures and indiscriminately transferred one
and two at a time to transfer chambers (e.g., 10 m L glass beakers) until each cham ber contained 10
neonates. Each transfer chamber was indiscriminately assigned to a test chamber, and the neonates were
transferred to the test chambers to initiate the test. All transfers were made below the water surface using
wide-bore pipettes.
Dilution Water
The water used for culturing and testing was freshwater obtained from a well approxim ately
40 meters deep located on the Wildlife International, Ltd. site. The well water is characterized as
moderately-hard water. The specific conductance, hardness, alkalinity and pH of the well water during
the four-week period immediately preceding the test are presented in Appendix 6.

Wildlife International, Ltd.
- 15 -
Project Number 472A-112
AMENDED
The well water was passed through a sand filter to remove particles greater than approximately
25 µm, and pumped into a 37,800-L storage tank where the water was aerated with spray nozzles. Prior
to use, the water again was filtered (0.45 µm) and passed through an ultraviolet (UV) sterilizer to remove
fine particles and m icroorganisms. The results of periodic analyses perform ed to m easure the
concentrations of selected organic and inorgani c constituents in the well water are presented in
Appendix 7.
Test Apparatus
Test chambers consisted of 500-mL glass French square bottles with Teflon®-lined lids. Each
test chamber was completely filled with test solution to minimize headspace. The depth of test solution in
a representative test chamber was 16.7 cm. Each test chamber was labeled with the project number, WAF
loading rate and replicate. Test chambers were im partially positioned in a tem perature-controlled
environmental chamber set to maintain the desired test temperature throughout the test period.
Preparation of Test Concentrations
The test and control solutions were prepared prior to test initiation on Day 0. New solutions were
prepared in separate test chambers on Day 1, and all daphnids were transferred from old to new solutions.
The test solution was prepared in the form of a water accommodated fraction (WAF) at a nominal loading
rate of 1000 mg/L. The WAF was prepared by mixing the test substance into 12 L of dilution water (UV
sterilized well water) in a 13.2 L Pyrex® aspirator bottle. The solution was stirred with a Teflon®-coated
stir bar on a magnetic stir plate for approximately 24 hours. Care was taken to maintain a vortex depth of
approximately 30% of the test solution height. The duration of the mixing period was established during
an exploratory WAF equilibration test (Appendix 8). Following the mixing period, the WAF solution
was allowed to settle for approxim ately one hour be fore the solutions were decanted into the test
chambers through a spigot and tubing placed approxim ately 2-3 cm from the bottom of the aspirator
bottle.
Analytical Sampling
Samples were collected from each control and treatment group at the beginning of the test, prior
to renewal of solutions at approximately 24 hours, and at test termination to measure concentrations of
soluble components of the test substance. Samples were decanted from each WAF preparation vessel at
the beginning of the test, and were pooled from solution collected at mid-depth from each replicate test
Wildlife International, Ltd.
- 16 -
Project Number 472A-112
AMENDED
chamber prior to the 24-hour renewal and at test term ination. At each sampling interval, one set of
samples was collected for analy sis of selected organic com pounds, and a second set of samples was
collected for analysis of selected inorganic elements. All samples were stored until analyzed at the end of
the test. Sam ples collected for organic analy ses were preserved by refrigerated storage with zero
headspace. Samples collected for inorganic analyses were preserved by the addition of sufficient nitric
acid (HNO3) to achieve a final acid concentration of 2%.
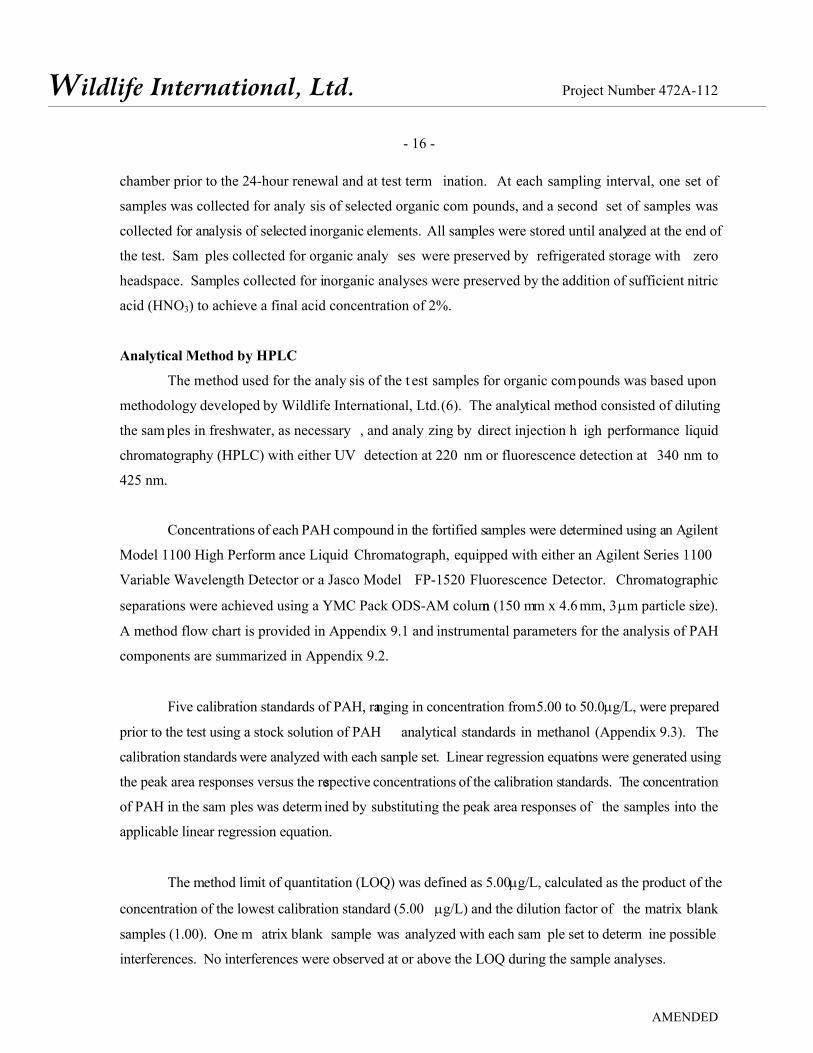
Analytical Method by HPLC
The method used for the analy sis of the t est samples for organic compounds was based upon
methodology developed by Wildlife International, Ltd. (6). The analytical method consisted of diluting
the sam ples in freshwater, as necessary , and analy zing by direct injection h igh performance liquid
chromatography (HPLC) with either UV detection at 220 nm or fluorescence detection at 340 nm to
425 nm.
Concentrations of each PAH compound in the fortified samples were determined using an Agilent
Model 1100 High Perform ance Liquid Chromatograph, equipped with either an Agilent Series 1100
Variable Wavelength Detector or a Jasco Model FP-1520 Fluorescence Detector. Chromatographic
separations were achieved using a YMC Pack ODS-AM column (150 mm x 4.6 mm, 3 µm particle size).
A method flow chart is provided in Appendix 9.1 and instrumental parameters for the analysis of PAH
components are summarized in Appendix 9.2.
Five calibration standards of PAH, ranging in concentration from 5.00 to 50.0 µg/L, were prepared
prior to the test using a stock solution of PAH analytical standards in methanol (Appendix 9.3). The
calibration standards were analyzed with each sample set. Linear regression equations were generated using
the peak area responses versus the respective concentrations of the calibration standards. The concentration
of PAH in the sam ples was determ ined by substituting the peak area responses of the samples into the
applicable linear regression equation.
The method limit of quantitation (LOQ) was defined as 5.00 µg/L, calculated as the product of the
concentration of the lowest calibration standard (5.00 µg/L) and the dilution factor of the matrix blank
samples (1.00). One m atrix blank sample was analyzed with each sam ple set to determ ine possible
interferences. No interferences were observed at or above the LOQ during the sample analyses.

Wildlife International, Ltd.
- 17 -
Project Number 472A-112
AMENDED
Samples of freshwater were fo rtified at 10.0, 40.0 and 100 µg/L using a stock solution of PAH
analytical standard in methanol (Appendix 9.3), and were analyzed concurrently with the test samples. The
measured concentrations for the m atrix fortifi cation samples ranged from 90.0 to 117% of fortified
concentrations (Tables 1 through 19).
Representative calibration curves are presented in Appendices 9.4 through 9.22. Representative
chromatograms of low and high-level calibration sta ndards are presented in Appendices 9.23 and 9.24,
respectively. Representative chromatograms of a freshwater matrix blank sample and a matrix fortification
sample are presented in Appendices 9.25 and 9.26, respectively. A representative chromatogram of a test
sample is presented in Appendix 9.27.
Analytical Method by ICP-AES
The analytical method used for the analysis of the inorganic elements, As, Se, Fe, Ni, Se, V and
S, in the test samples was based upon methodology developed by Wildlife International, Ltd. (7). The
analytical method consisted of acidifying the samples 2% by volume with concentrated nitric acid and
direct injection into the ICP-AES system. Concentrations of As, Cu, Fe, Ni, Se, S and V in the samples
were determined using a Perkin-Elmer Optima 3000 DV ICP-AES configured in axial view mode and
equipped with a Cetac U-5000AT + Ultrasonic Nebulizer (sam ple introduction). Simultaneous
measurements were made for six of the seven elements (As, Cu, Fe, Ni, Se and V). For sulfur, a single
element method was employed due to the need for higher concentration-level calibration standards. A
method flowchart is provided in Appendix 10.1 and instrumental parameters for the analysis of the seven
elements are summarized in Appendix 10.2.
Multi-element calibration standards were analyzed with the test samples. Preparations of stock
and calibration standard solutions are detailed in Appendix 10.3. The calibration standard series was
injected at the beginning and end of each analytical run. In addition, a standard was injected following a
maximum of five sample analyses. For a given injection of a sample (including standards), the ICP-AES
instrument integrated the steady-state emission signal at designated emission wavelengths for a method-
specified period (read time). The net integrated intensity was then automatically corrected by subtraction
of the m ean corrected intensity of the calibrati on blank (determ ined at sequence initiation). The
measurement cycle was automatically repeated two additional times during the sample injection (read
replicates). The mean of the three measurements produced a mean corrected intensity for each monitored
Wildlife International, Ltd.
- 18 -
Project Number 472A-112
AMENDED
element in the sample. Linear regression equations for each monitored element were generated using
mean corrected intensities versus the respective concentrations of the element in the calibration standards.
Representative calibration curves for As, Cu, Fe, Ni , Se, S and V are presented in Appendices 10.4 –
10.10. The concentrations of each of the seven elements in the test sam ples were calculated by
substituting their mean corrected intensities into the applicable linear regression equation, and applying
the appropriate dilution and unit conversion factors. Representative emission spectra of low- and high-
level calibration standards are presented in Appe ndices 10.11 – 10.13. An exam ple calculation for a
study sample is provided in Appendix 10.14.
A matrix blank was analyzed for each component concurrent with the test samples to determine
possible interferences. No interferences were observed at or above the limit of quantitation (LOQ) during
the sample analyses (Appendices 10.15 – 10.17). A sample of freshwater was fortified at 2X (S) or 2.5X
(As, Cu, Fe, Ni, Se and V) the m ethod LOQ fo r each elem ent and analy zed for each com ponent
concurrent with the study samples using the combined stock and the sulfur reference standard. Results
are presented in Tables 20 through 26. Em ission spectra of freshwater m atrix blank and m atrix
fortification samples are presented in Appendices 10.15 – 10.17. The measured concentrations for the
matrix fortification samples ranged from 96.9 to 112% of fortified concentrations (Tables 20 through 26).
Representative emission spectra of a WAF test sample are presented in Appendices 10.18 – 10.20.
Environmental Conditions
Ambient room light was used to illuminate the test systems. Fluorescent light bulbs that emit
wavelengths similar to na tural sunlight (Colortone ® 50) were controlled with an automatic timer to
provide a photoperiod of 16 hours of light and 8 hours of darkness. A 30-minute transition period of low
light intensity was provided at the beginning and end of the 16-hour light period to avoid sudden changes
in light intensity . Light intensity at test initia tion was 413 lux over the water surface of one control
replicate.
The target test temperature during the study was 20 ± 2º C. Tem perature was m onitored
continuously during the entire test in a container of water placed adjacent to the test chambers using a
Fulscope ER/C Recorder. The recorder measurements were verified prior to test initiation with a liquid-
in-glass thermometer. Temperature, dissolved oxy gen and pH were measured in the newly prepared
WAF solutions at the beginning of the test and at the 24-hour renewal, and in each test chamber prior to

Wildlife International, Ltd.
- 19 -
Project Number 472A-112
renewal at 24 hours and at test termination. Hardness, alkalinity, specific conductance and total organic
carbon (TOC) were measured in a sample of dilution water collected at test initiation.
Light intensity was measured using a SPER Scientific Ltd. Model 840006C light meter. Manual
temperature measurements were made using a liquid-in-glass thermometer. Measurements of pH were
made using a Thermo Orion Model 525Aplus pH m eter, and dissolved oxygen was measured using a
Thermo Orion Model 850Aplus dissolved oxygen meter. Specific conductance was measured using a
Yellow Springs Instrument Model 33 Salinity-Conductivity-Temperature meter. Hardness and alkalinity
measurements were made by titration based on procedures in Standard Methods for the Examination of
Water and Wastewater (8). TOC was measured using a SHIMADZU Model TOC-5000 total organic
carbon analyzer.
Observations
All organisms were observed periodically to determine the numbers of mortalities and immobile
organisms in each control and treatment group. The number of individuals exhibiting clinical signs of
toxicity also was evaluated. Immobilisation was defined as the inability to swim within 15 seconds after
gentle agitation of the test container. Observations were made approximately 2, 24 and 48 hours after test
initiation.
Conditions for the Validity of the Test
The following criteria used to judge the validity of the test were met:
1. immobility of the daphnids in the negative control group did not exceed 10% by the end of
the test, and
2. the dissolved oxygen concentration was at least 60% of the air-saturation value throughout
the test.
Data Analyses
The cumulative percent m ortality/immobility ob served in the treatm ent group was used to
determine whether the 24 and 48-hour EL50 values were greater or less than the 1000 mg/L WAF loading
rate. The no-observed-effect-loading rate (NOELR) was determ ined by visually interpreting the
mortality, immobility and observation data.

Wildlife International, Ltd.
- 20 -
Project Number 472A-112
AMENDED
RESULTS AND DISCUSSION
Measurement of Test Concentrations
Results of analyses to measure polyaromatic hydrocarbon and metals in the WAF and control
solutions are presented in Tables 1-26 and in the analytical chemistry reports (Appendices 9 and 10). All
measurements of PAHs and metals in control and WAF solutions were below detection lim its for the
methods. Therefore, estimates of the EL50 and NOELR values were based on the nominal WAF loading
rate of 1000 mg/L used in the test.
Observations and Measurements
In the test chambers, the negative control solutions appeared clear and colorless. The 1000 mg/L
solutions appeared clear and colorless with fine black powder suspended throughout at test initiation, and
clear and colorless with small amounts of fine black powder on the bottom of the test chambers at test
termination.
Measurements of temperature, dissolved oxygen and pH of the test solutions are presented in
Table 27. Water temperatures were within the 20 ± 2°C range established for the test. Measurements of
water pH ranged from 8.3 to 8.5. Dissolved oxygen concentrations rem ained ≥8.7 mg/L (≥97% of
saturation) throughout the test. Measurements of hardness, alkalinity, specific conductance and TOC in
the dilution water at test initiation were typical of Wildlife International, Ltd. well water (Table 28).
Daily observations of mortality/immobility and other clinical signs of toxicity observed during
the test are presented in Table 29. No immobile or dead daphnids occurred during the test. All daphnids
in the negative control group and in the 1000 m g/L treatment group appeared norm al throughout the
exposure period. The 24 and 48-hour EL50 values were estimated to be greater than the single WAF
loading rate of 1000 mg/L (Table 30). The NOELR was 1000 mg/L.
CONCLUSIONS
The cladoceran, Daphnia magna, was exposed under static-renewal conditions for 48 hours to a
single water accom modated fraction (WAF) of petroleum coke at a nom inal WAF loading rate of
1000 mg/L in a sealed exposure system. The 48-hour EL50 value was determined to be >1000 mg/L, the
single WAF loading rate tested. The NOELR was 1000 mg/L.

Wildlife International, Ltd.
- 21 -
Project Number 472A-112
REFERENCES
1 OECD. 1998. OECD Principles of Good Laboratory Practice ENV/MC/CHEM (98) 17. 2 Title 40 of the Code of Federal Regulations, Part 792 . 1989. Toxic Substances Control Act
(TSCA) Good Laboratory Practice Standards. 3 Organization for Econom ic Cooperation and Developm ent. 2000. Guidance Document on
Aquatic Toxicity Testing of Difficult Substances and Mixtures. ENV/JM/MONO (2000) 6. OECD Environmental Health and Safety Publication Series on Testing and Assessm ent No. 23. OECD, Paris, September 2000.
4 Organization for Econom ic Cooperation and Developm ent. 1984. OECD Guideline 202:
Daphnia sp. Acute Immobilization Test and Reproduction Test. Adopted 4 April 1984. Addendum 3 to C(81)30(Final).
5 U.S. Environmental Protection Agency. 1996. Series 850 – Ecological Effects Test Guidelines
(draft), OPPTS Number 850.1010: Aquatic Invertebrate Acute Toxicity Test, Freshwater Daphnids. 6 Timothy Z. Kendall and Willard B. Nixon. 2005. Analy tical Method Verification for the
Determination of Water Soluble Com ponents of Petroleum Coke in Freshwater Using Gas Chromatography (GC) or High Performance Liquid Chrom atography (HPLC). Wildlife International, Ltd. Project Number 472C-104. Unpublished.
7 Raymond L. Van Hoven and Willard B. Nixon. 2005. Analy tical Method Verification for the
Determination of Water Soluble Components of Petroleum Coke in Freshwater Using Inductively Coupled Plasma Atomic Emission Spectrometry (ICP-AES). Wildlife International, Ltd. Project Number 472C-105. Unpublished.
8 APHA, AWWA, WPCF. 1998. Standard Methods for the Examination of Water and Wastewater.
20th Edition.

Wildlife International, Ltd.
- 22 -
Project Number 472A-112
Table 1
Measured Concentrations of Naphthalene Analyzed by HPLC/UV
Nominal Concentration
(mg/L)
Sample Identification (472A-112-)
Sampling Interval (Hour)
Measured Concentration
(mg/L)1
Percent of
Nominal2 Negative Control
1000
Negative Control 1000
Negative Control
1000
1 2
5 6
9 10
0 0
24 24
48 48
< LOQ < LOQ
< LOQ < LOQ
< LOQ < LOQ
-- --
-- --
-- --
Matrix Blank and Fortification Samples
Nominal Concentration
(µg/L)
Sample Identification (472A-112-)
Sampling Interval (Hour)
Measured Concentration
(µg/L)1
Percent of
Nominal2 0.0
10.0 40.0 100
MAB-1
MAS-1 MAS-2 MAS-3
--
-- -- --
< LOQ
10.2 40.5 91.6
--
102 101 91.6
Mean = Standard Deviation =
CV =
98.2 5.74
5.84% 1 The limit of quantitation (LOQ) was 5.00 µg/L, calculated as the product of the lowest standard
concentration (5.00 µg/L) and the dilution factor of the matrix blank samples (1.00). 2 Results were generated using Excel 2000 in full precision mode. Manual calculations may differ
slightly.

Wildlife International, Ltd.
- 23 -
Project Number 472A-112
Table 2
Measured Concentrations of Acenaphthylene Analyzed by HPLC/UV
Nominal Concentration
(mg/L)
Sample Identification (472A-112-)
Sampling Interval (Hour)
Measured Concentration
(mg/L)1
Percent of
Nominal2 Negative Control
1000
Negative Control 1000
Negative Control
1000
1 2
5 6
9 10
0 0
24 24
48 48
< LOQ < LOQ
< LOQ < LOQ
< LOQ < LOQ
-- --
-- --
-- --
Matrix Blank and Fortification Samples
Nominal Concentration
(µg/L)
Sample Identification (472A-112-)
Sampling Interval (Hour)
Measured Concentration
(µg/L)1
Percent of
Nominal2 0.0
10.0 40.0 100
MAB-1
MAS-1 MAS-2 MAS-3
--
-- -- --
< LOQ
9.93 40.3 97.6
--
99.3 101 97.6
Mean = Standard Deviation =
CV =
99.3 1.70
1.71% 1 The limit of quantitation (LOQ) was 5.00 µg/L, calculated as the product of the lowest standard
concentration (5.00 µg/L) and the dilution factor of the matrix blank samples (1.00). 2 Results were generated using Excel 2000 in full precision mode. Manual calculations may differ
slightly.

Wildlife International, Ltd.
- 24 -
Project Number 472A-112
Table 3
Measured Concentrations of 1-Methylnaphthalene Analyzed by HPLC/UV
Nominal Concentration
(mg/L)
Sample Identification (472A-112-)
Sampling Interval (Hour)
Measured Concentration
(mg/L)1
Percent of
Nominal2 Negative Control
1000
Negative Control 1000
Negative Control
1000
1 2
5 6
9 10
0 0
24 24
48 48
< LOQ < LOQ
< LOQ < LOQ
< LOQ < LOQ
-- --
-- --
-- --
Matrix Blank and Fortification Samples
Nominal Concentration
(µg/L)
Sample Identification (472A-112-)
Sampling Interval (Hour)
Measured Concentration
(µg/L)1
Percent of
Nominal2 0.0
10.0 40.0 100
MAB-1
MAS-1 MAS-2 MAS-3
--
-- -- --
< LOQ
10.1 40.6 92.3
--
101 101 92.3
Mean = Standard Deviation =
CV =
98.1 5.02
5.12% 1 The limit of quantitation (LOQ) was 5.00 µg/L, calculated as the product of the lowest standard
concentration (5.00 µg/L) and the dilution factor of the matrix blank samples (1.00). 2 Results were generated using Excel 2000 in full precision mode. Manual calculations may differ
slightly.

Wildlife International, Ltd.
- 25 -
Project Number 472A-112
Table 4
Measured Concentrations of 2-Methylnaphthalene Analyzed by HPLC/UV
Nominal Concentration
(mg/L)
Sample Identification (472A-112-)
Sampling Interval (Hour)
Measured Concentration
(mg/L)1
Percent of
Nominal2 Negative Control
1000
Negative Control 1000
Negative Control
1000
1 2
5 6
9 10
0 0
24 24
48 48
< LOQ < LOQ
< LOQ < LOQ
< LOQ < LOQ
-- --
-- --
-- --
Matrix Blank and Fortification Samples
Nominal Concentration
(µg/L)
Sample Identification (472A-112-)
Sampling Interval (Hour)
Measured Concentration
(µg/L)1
Percent of
Nominal2 0.0
10.0 40.0 100
MAB-1
MAS-1 MAS-2 MAS-3
--
-- -- --
< LOQ
10.0 40.7 90.0
--
100 102 90.0
Mean = Standard Deviation =
CV =
97.3 6.43
6.61% 1 The limit of quantitation (LOQ) was 5.00 µg/L, calculated as the product of the lowest standard
concentration (5.00 µg/L) and the dilution factor of the matrix blank samples (1.00). 2 Results were generated using Excel 2000 in full precision mode. Manual calculations may differ
slightly.

Wildlife International, Ltd.
- 26 -
Project Number 472A-112
Table 5
Measured Concentrations of Fluorene Analyzed by HPLC/UV
Nominal Concentration
(mg/L)
Sample Identification (472A-112-)
Sampling Interval (Hour)
Measured Concentration
(mg/L)1
Percent of
Nominal2 Negative Control
1000
Negative Control 1000
Negative Control
1000
1 2
5 6
9 10
0 0
24 24
48 48
< LOQ < LOQ
< LOQ < LOQ
< LOQ < LOQ
-- --
-- --
-- --
Matrix Blank and Fortification Samples
Nominal Concentration
(µg/L)
Sample Identification (472A-112-)
Sampling Interval (Hour)
Measured Concentration
(µg/L)1
Percent of
Nominal2 0.0
10.0 40.0 100
MAB-1
MAS-1 MAS-2 MAS-3
--
-- -- --
< LOQ
9.63 39.9 96.7
--
96.3 99.8 96.7
Mean = Standard Deviation =
CV =
97.6 1.92
1.96% 1 The limit of quantitation (LOQ) was 5.00 µg/L, calculated as the product of the lowest standard
concentration (5.00 µg/L) and the dilution factor of the matrix blank samples (1.00). 2 Results were generated using Excel 2000 in full precision mode. Manual calculations may differ
slightly.

Wildlife International, Ltd.
- 27 -
Project Number 472A-112
Table 6
Measured Concentrations of Acenaphthene Analyzed by HPLC/UV
Nominal Concentration
(mg/L)
Sample Identification (472A-112-)
Sampling Interval (Hour)
Measured Concentration
(mg/L)1
Percent of
Nominal2 Negative Control
1000
Negative Control 1000
Negative Control
1000
1 2
5 6
9 10
0 0
24 24
48 48
< LOQ < LOQ
< LOQ < LOQ
< LOQ < LOQ
-- --
-- --
-- --
Matrix Blank and Fortification Samples
Nominal Concentration
(µg/L)
Sample Identification (472A-112-)
Sampling Interval (Hour)
Measured Concentration
(µg/L)1
Percent of
Nominal2 0.0
10.0 40.0 100
MAB-1
MAS-1 MAS-2 MAS-3
--
-- -- --
< LOQ
10.0 40.5 96.8
--
100 101 96.8
Mean = Standard Deviation =
CV =
99.3 2.19
2.21% 1 The limit of quantitation (LOQ) was 5.00 µg/L, calculated as the product of the lowest standard
concentration (5.00 µg/L) and the dilution factor of the matrix blank samples (1.00). 2 Results were generated using Excel 2000 in full precision mode. Manual calculations may differ
slightly.
Wildlife International, Ltd.
- 28 -
Project Number 472A-112
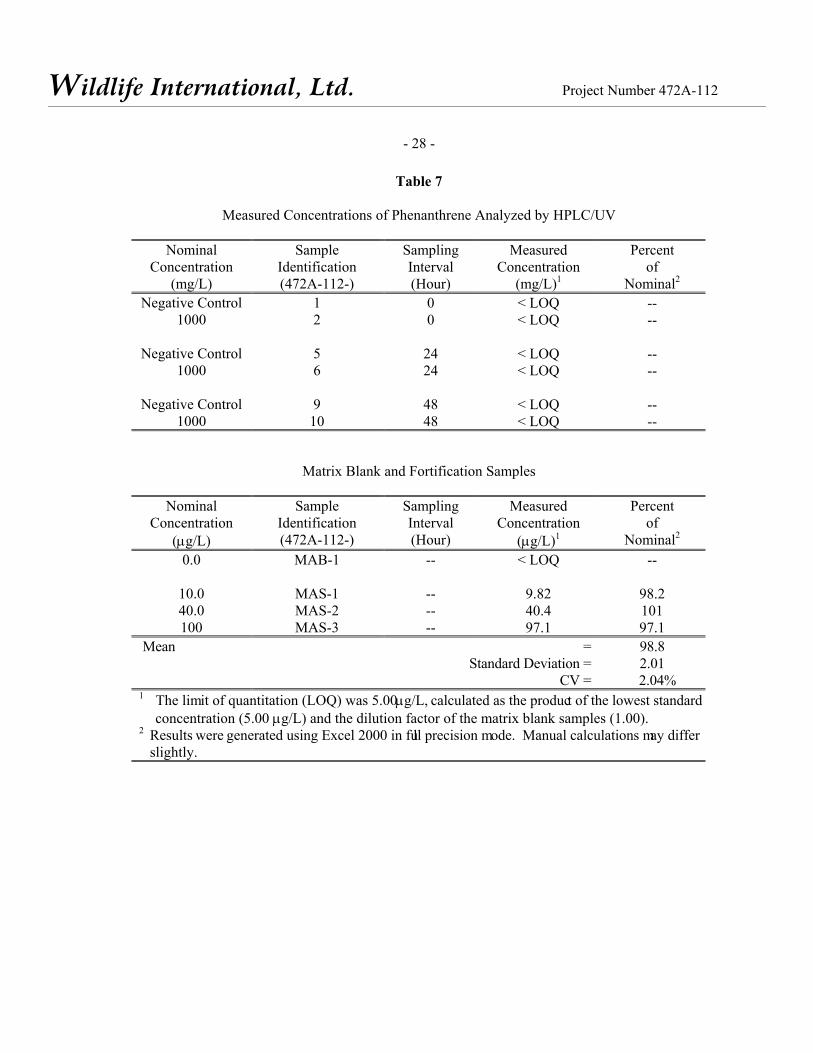
Table 7
Measured Concentrations of Phenanthrene Analyzed by HPLC/UV
Nominal Concentration
(mg/L)
Sample Identification (472A-112-)
Sampling Interval (Hour)
Measured Concentration
(mg/L)1
Percent of
Nominal2 Negative Control
1000
Negative Control 1000
Negative Control
1000
1 2
5 6
9 10
0 0
24 24
48 48
< LOQ < LOQ
< LOQ < LOQ
< LOQ < LOQ
-- --
-- --
-- --
Matrix Blank and Fortification Samples
Nominal Concentration
(µg/L)
Sample Identification (472A-112-)
Sampling Interval (Hour)
Measured Concentration
(µg/L)1
Percent of
Nominal2 0.0
10.0 40.0 100
MAB-1
MAS-1 MAS-2 MAS-3
--
-- -- --
< LOQ
9.82 40.4 97.1
--
98.2 101 97.1
Mean = Standard Deviation =
CV =
98.8 2.01
2.04% 1 The limit of quantitation (LOQ) was 5.00 µg/L, calculated as the product of the lowest standard
concentration (5.00 µg/L) and the dilution factor of the matrix blank samples (1.00). 2 Results were generated using Excel 2000 in full precision mode. Manual calculations may differ
slightly.

Wildlife International, Ltd.
- 29 -
Project Number 472A-112
Table 8
Measured Concentrations of Anthracene Analyzed by HPLC with Fluorescence Detection
Nominal Concentration
(mg/L)
Sample Identification (472A-112-)
Sampling Interval (Hour)
Measured Concentration
(mg/L)1
Percent of
Nominal2 Negative Control
1000
Negative Control 1000
Negative Control
1000
1 2
5 6
9 10
0 0
24 24
48 48
< LOQ < LOQ
< LOQ < LOQ
< LOQ < LOQ
-- --
-- --
-- --
Matrix Blank and Fortification Samples
Nominal Concentration
(µg/L)
Sample Identification (472A-112-)
Sampling Interval (Hour)
Measured Concentration
(µg/L)1
Percent of
Nominal2 0.0
10.0 40.0 100
MAB-1
MAS-1 MAS-2 MAS-3
--
-- -- --
< LOQ
9.29 42.7 101
--
92.9 107 101
Mean = Standard Deviation =
CV =
100 7.08
7.08% 1 The limit of quantitation (LOQ) was 5.00 µg/L, calculated as the product of the lowest standard
concentration (5.00 µg/L) and the dilution factor of the matrix blank samples (1.00). 2 Results were generated using Excel 2000 in full precision mode. Manual calculations may differ
slightly.

Wildlife International, Ltd.
- 30 -
Project Number 472A-112
Table 9
Measured Concentrations of Fluoranthene Analyzed by HPLC with Fluorescence Detection
Nominal Concentration
(mg/L)
Sample Identification (472A-112-)
Sampling Interval (Hour)
Measured Concentration
(mg/L)1
Percent of
Nominal2 Negative Control
1000
Negative Control 1000
Negative Control
1000
1 2
5 6
9 10
0 0
24 24
48 48
< LOQ < LOQ
< LOQ < LOQ
< LOQ < LOQ
-- --
-- --
-- --
Matrix Blank and Fortification Samples
Nominal Concentration
(µg/L)
Sample Identification (472A-112-)
Sampling Interval (Hour)
Measured Concentration
(µg/L)1
Percent of
Nominal2 0.0
10.0 40.0 100
MAB-1
MAS-1 MAS-2 MAS-3
--
-- -- --
< LOQ
9.72 40.5 117
--
97.2 101 117
Mean = Standard Deviation =
CV =
105 10.5
10.0% 1 The limit of quantitation (LOQ) was 5.00 µg/L, calculated as the product of the lowest standard
concentration (5.00 µg/L) and the dilution factor of the matrix blank samples (1.00). 2 Results were generated using Excel 2000 in full precision mode. Manual calculations may differ
slightly.

Wildlife International, Ltd.
- 31 -
Project Number 472A-112
Table 10
Measured Concentrations of Pyrene Analyzed by HPLC with Fluorescence Detection
Nominal Concentration
(mg/L)
Sample Identification (472A-112-)
Sampling Interval (Hour)
Measured Concentration
(mg/L)1
Percent of
Nominal2 Negative Control
1000
Negative Control 1000
Negative Control
1000
1 2
5 6
9 10
0 0
24 24
48 48
< LOQ < LOQ
< LOQ < LOQ
< LOQ < LOQ
-- --
-- --
-- --
Matrix Blank and Fortification Samples
Nominal
Concentration (µg/L)
Sample Identification (472A-112-)
Sampling Interval (Hour)
Measured Concentration
(µg/L)1
Percent of
Nominal2 0.0
10.0 40.0 100
MAB-1
MAS-1 MAS-2 MAS-3
--
-- -- --
< LOQ
9.47 39.7 93.8
--
94.7 99.3 93.8
Mean = Standard Deviation =
CV =
95.9 2.95
3.08% 1 The limit of quantitation (LOQ) was 5.00 µg/L, calculated as the product of the lowest standard
concentration (5.00 µg/L) and the dilution factor of the matrix blank samples (1.00). 2 Results were generated using Excel 2000 in full precision mode. Manual calculations may differ
slightly.

Wildlife International, Ltd.
- 32 -
Project Number 472A-112
Table 11
Measured Concentrations of Chrysene Analyzed by HPLC/UV
Nominal Concentration
(mg/L)
Sample Identification (472A-112-)
Sampling Interval (Hour)
Measured Concentration
(mg/L)1
Percent of
Nominal2 Negative Control
1000
Negative Control 1000
Negative Control
1000
1 2
5 6
9 10
0 0
24 24
48 48
< LOQ < LOQ
< LOQ < LOQ
< LOQ < LOQ
-- --
-- --
-- --
Matrix Blank and Fortification Samples
Nominal Concentration
(µg/L)
Sample Identification (472A-112-)
Sampling Interval (Hour)
Measured Concentration
(µg/L)1
Percent of
Nominal2 0.0
10.0 40.0 100
MAB-1
MAS-1 MAS-2 MAS-3
--
-- -- --
< LOQ
9.61 40.6 101
--
96.1 101 101
Mean = Standard Deviation =
CV =
99.4 2.83
2.85% 1 The limit of quantitation (LOQ) was 5.00 µg/L, calculated as the product of the lowest standard
concentration (5.00 µg/L) and the dilution factor of the matrix blank samples (1.00). 2 Results were generated using Excel 2000 in full precision mode. Manual calculations may differ
slightly.

Wildlife International, Ltd.
- 33 -
Project Number 472A-112
Table 12
Measured Concentrations of Benzo(a)anthracene Analyzed by HPLC with Fluorescence Detection
Nominal
Concentration (mg/L)
Sample Identification (472A-112-)
Sampling Interval (Hour)
Measured Concentration
(mg/L)1
Percent of
Nominal2 Negative Control
1000
Negative Control 1000
Negative Control
1000
1 2
5 6
9 10
0 0
24 24
48 48
< LOQ < LOQ
< LOQ < LOQ
< LOQ < LOQ
-- --
-- --
-- --
Matrix Blank and Fortification Samples
Nominal Concentration
(µg/L)
Sample Identification (472A-112-)
Sampling Interval (Hour)
Measured Concentration
(µg/L)1
Percent of
Nominal2 0.0
10.0 40.0 100
MAB-1
MAS-1 MAS-2 MAS-3
--
-- -- --
< LOQ
9.51 41.4 101
--
95.1 103 101
Mean = Standard Deviation =
CV =
99.7 4.11
4.12% 1 The limit of quantitation (LOQ) was 5.00 µg/L, calculated as the product of the lowest standard
concentration (5.00 µg/L) and the dilution factor of the matrix blank samples (1.00). 2 Results were generated using Excel 2000 in full precision mode. Manual calculations may differ
slightly.

Wildlife International, Ltd.
- 34 -
Project Number 472A-112
Table 13
Measured Concentrations of Benzo(b)fluoranthene Analyzed by HPLC with Fluorescence Detection
Nominal
Concentration (mg/L)
Sample Identification (472A-112-)
Sampling Interval (Hour)
Measured Concentration
(mg/L)1
Percent of
Nominal2 Negative Control
1000
Negative Control 1000
Negative Control
1000
1 2
5 6
9 10
0 0
24 24
48 48
< LOQ < LOQ
< LOQ < LOQ
< LOQ < LOQ
-- --
-- --
-- --
Matrix Blank and Fortification Samples
Nominal Concentration
(µg/L)
Sample Identification (472A-112-)
Sampling Interval (Hour)
Measured Concentration
(µg/L)1
Percent of
Nominal2 0.0
10.0 40.0 100
MAB-1
MAS-1 MAS-2 MAS-3
--
-- -- --
< LOQ
9.12 40.5 99.6
--
91.2 101 99.6
Mean = Standard Deviation =
CV =
97.3 5.30
5.45% 1 The limit of quantitation (LOQ) was 5.00 µg/L, calculated as the product of the lowest standard
concentration (5.00 µg/L) and the dilution factor of the matrix blank samples (1.00). 2 Results were generated using Excel 2000 in full precision mode. Manual calculations may differ
slightly.

Wildlife International, Ltd.
- 35 -
Project Number 472A-112
Table 14
Measured Concentrations of Benzo(k)fluoranthene Analyzed by HPLC with Fluorescence Detection
Nominal
Concentration (mg/L)
Sample Identification (472A-112-)
Sampling Interval (Hour)
Measured Concentration
(mg/L)1
Percent of
Nominal2 Negative Control
1000
Negative Control 1000
Negative Control
1000
1 2
5 6
9 10
0 0
24 24
48 48
< LOQ < LOQ
< LOQ < LOQ
< LOQ < LOQ
-- --
-- --
-- --
Matrix Blank and Fortification Samples
Nominal Concentration
(µg/L)
Sample Identification (472A-112-)
Sampling Interval (Hour)
Measured Concentration
(µg/L)1
Percent of
Nominal2 0.0
10.0 40.0 100
MAB-1
MAS-1 MAS-2 MAS-3
--
-- -- --
< LOQ
9.43 40.6 101
--
94.3 102 101
Mean = Standard Deviation =
CV =
99.1 4.19
4.22% 1 The limit of quantitation (LOQ) was 5.00 µg/L, calculated as the product of the lowest standard
concentration (5.00 µg/L) and the dilution factor of the matrix blank samples (1.00). 2 Results were generated using Excel 2000 in full precision mode. Manual calculations may differ
slightly.

Wildlife International, Ltd.
- 36 -
Project Number 472A-112
Table 15
Measured Concentrations of Benzo(a)pyrene Analyzed by HPLC with Fluorescence Detection
Nominal
Concentration (mg/L)
Sample Identification (472A-112-)
Sampling Interval (Hour)
Measured Concentration
(mg/L)1
Percent of
Nominal2 Negative Control
1000
Negative Control 1000
Negative Control
1000
1 2
5 6
9 10
0 0
24 24
48 48
< LOQ < LOQ
< LOQ < LOQ
< LOQ < LOQ
-- --
-- --
-- --
Matrix Blank and Fortification Samples
Nominal Concentration
(µg/L)
Sample Identification (472A-112-)
Sampling Interval (Hour)
Measured Concentration
(µg/L)1
Percent of
Nominal2 0.0
10.0 40.0 100
MAB-1
MAS-1 MAS-2 MAS-3
--
-- -- --
< LOQ
9.33 40.6 101
--
93.3 101 101
Mean = Standard Deviation =
CV =
98.4 4.45
4.52% 1 The limit of quantitation (LOQ) was 5.00 µg/L, calculated as the product of the lowest standard
concentration (5.00 µg/L) and the dilution factor of the matrix blank samples (1.00). 2 Results were generated using Excel 2000 in full precision mode. Manual calculations may differ
slightly.

Wildlife International, Ltd.
- 37 -
Project Number 472A-112
Table 16
Measured Concentrations of Dibenz(a,h)anthracene Analyzed by HPLC with Fluorescence Detection
Nominal
Concentration (mg/L)
Sample Identification (472A-112-)
Sampling Interval (Hour)
Measured Concentration
(mg/L)1
Percent of
Nominal2 Negative Control
1000
Negative Control 1000
Negative Control
1000
1 2
5 6
9 10
0 0
24 24
48 48
< LOQ < LOQ
< LOQ < LOQ
< LOQ < LOQ
-- --
-- --
-- --
Matrix Blank and Fortification Samples
Nominal Concentration
(µg/L)
Sample Identification (472A-112-)
Sampling Interval (Hour)
Measured Concentration
(µg/L)1
Percent of
Nominal2 0.0
10.0 40.0 100
MAB-1
MAS-1 MAS-2 MAS-3
--
-- -- --
< LOQ
9.51 40.8 101
--
95.1 102 101
Mean = Standard Deviation =
CV =
99.4 3.73
3.75% 1 The limit of quantitation (LOQ) was 5.00 µg/L, calculated as the product of the lowest standard
concentration (5.00 µg/L) and the dilution factor of the matrix blank samples (1.00). 2 Results were generated using Excel 2000 in full precision mode. Manual calculations may differ
slightly.

Wildlife International, Ltd.
- 38 -
Project Number 472A-112
Table 17
Measured Concentrations of Indeno(1,2,3-cd)pyrene Analyzed by HPLC/UV
Nominal Concentration
(mg/L)
Sample Identification (472A-112-)
Sampling Interval (Hour)
Measured Concentration
(mg/L)1
Percent of
Nominal2 Negative Control
1000
Negative Control 1000
Negative Control
1000
1 2
5 6
9 10
0 0
24 24
48 48
< LOQ < LOQ
< LOQ < LOQ
< LOQ < LOQ
-- --
-- --
-- --
Matrix Blank and Fortification Samples
Nominal Concentration
(µg/L)
Sample Identification (472A-112-)
Sampling Interval (Hour)
Measured Concentration
(µg/L)1
Percent of
Nominal2 0.0
10.0 40.0 100
MAB-1
MAS-1 MAS-2 MAS-3
--
-- -- --
< LOQ
9.19 40.7 101
--
91.9 102 101
Mean = Standard Deviation =
CV =
98.3 5.57
5.66% 1 The limit of quantitation (LOQ) was 5.00 µg/L, calculated as the product of the lowest standard
concentration (5.00 µg/L) and the dilution factor of the matrix blank samples (1.00). 2 Results were generated using Excel 2000 in full precision mode. Manual calculations may differ
slightly.

Wildlife International, Ltd.
- 39 -
Project Number 472A-112
Table 18
Measured Concentrations of Benzo(g,h,i)perylene Analyzed by HPLC with Fluorescence Detection
Nominal
Concentration (mg/L)
Sample Identification (472A-112-)
Sampling Interval (Hour)
Measured Concentration
(mg/L)1
Percent of
Nominal2 Negative Control
1000
Negative Control 1000
Negative Control
1000
1 2
5 6
9 10
0 0
24 24
48 48
< LOQ < LOQ
< LOQ < LOQ
< LOQ < LOQ
-- --
-- --
-- --
Matrix Blank and Fortification Samples
Nominal Concentration
(µg/L)
Sample Identification (472A-112-)
Sampling Interval (Hour)
Measured Concentration
(µg/L)1
Percent of
Nominal2 0.0
10.0 40.0 100
MAB-1
MAS-1 MAS-2 MAS-3
--
-- -- --
< LOQ
9.76 41.0 98.9
--
97.6 103 98.9
Mean = Standard Deviation =
CV =
99.8 2.82
2.82% 1 The limit of quantitation (LOQ) was 5.00 µg/L, calculated as the product of the lowest standard
concentration (5.00 µg/L) and the dilution factor of the matrix blank samples (1.00). 2 Results were generated using Excel 2000 in full precision mode. Manual calculations may differ
slightly.

Wildlife International, Ltd.
- 40 -
Project Number 472A-112
Table 19
Measured Concentrations of Dibenzo(a,e)pyrene Analyzed by HPLC with Fluorescence Detection
Nominal
Concentration (mg/L)
Sample Identification (472A-112-)
Sampling Interval (Hour)
Measured Concentration
(mg/L)1
Percent of
Nominal2 Negative Control
1000
Negative Control 1000
Negative Control
1000
1 2
5 6
9 10
0 0
24 24
48 48
< LOQ < LOQ
< LOQ < LOQ
< LOQ < LOQ
-- --
-- --
-- --
Matrix Blank and Fortification Samples
Nominal Concentration
(µg/L)
Sample Identification (472A-112-)
Sampling Interval (Hour)
Measured Concentration
(µg/L)1
Percent of
Nominal2 0.0
10.0 40.0 100
MAB-1
MAS-1 MAS-2 MAS-3
--
-- -- --
< LOQ
9.61 40.5 103
--
96.1 101 103
Mean = Standard Deviation =
CV =
100 3.55
3.55% 1 The limit of quantitation (LOQ) was 5.00 µg/L, calculated as the product of the lowest standard
concentration (5.00 µg/L) and the dilution factor of the matrix blank samples (1.00). 2 Results were generated using Excel 2000 in full precision mode. Manual calculations may differ
slightly.

Wildlife International, Ltd.
- 41 -
Project Number 472A-112
Table 20
Measured Concentrations of Arsenic Analyzed by ICP-AES
Nominal Petroleum Coke Concentration
(mg/L)
Sample
Identification (472A-112-)
Sampling Interval (Hours)
Measured Arsenic
Concentration (µg/L) 1,2
Negative Control 1000
Negative Control
1000
Negative Control 1000
3 4
7 8
11 12
0 0
24 24
48 48
< LOQ < LOQ
< LOQ < LOQ
< LOQ < LOQ
Matrix Blank and Fortification Samples
Nominal Arsenic
Concentration (µg/L)
Sample
Identification (472A-112-)
Measured Arsenic
Concentration (µg/L) 1
Percent
of Nominal 1
0.0
50.0
MAB-1
MAS-1
< LOQ
54.0
--
108 1 Results were generated using Excel 2000 in full precision mode. Manual calculations may differ slightly. 2 The limit of quantitation (LOQ) for these analyses was set at 20 µg/L.

Wildlife International, Ltd.
- 42 -
Project Number 472A-112
Table 21
Measured Concentrations of Copper Analyzed by ICP-AES
Nominal Petroleum Coke Concentration
(mg/L)
Sample
Identification (472A-112-)
Sampling Interval (Hours)
Measured Copper
Concentration (µg/L) 1,2
Negative Control 1000
Negative Control
1000
Negative Control 1000
3 4
7 8
11 12
0 0
24 24
48 48
< LOQ < LOQ
< LOQ < LOQ
< LOQ < LOQ
Matrix Blank and Fortification Samples
Nominal Copper
Concentration (µg/L)
Sample
Identification (472A-112-)
Measured Copper
Concentration (µg/L) 1
Percent
of Nominal 1
0.0
50.0
MAB-1
MAS-1
< LOQ
53.4
--
107 1 Results were generated using Excel 2000 in full precision mode. Manual calculations may differ slightly. 2 The limit of quantitation (LOQ) for these analyses was set at 20 µg/L.

Wildlife International, Ltd.
- 43 -
Project Number 472A-112
Table 22
Measured Concentrations of Iron Analyzed by ICP-AES
Nominal Petroleum Coke Concentration
(mg/L)
Sample
Identification (472A-112-)
Sampling Interval (Hours)
Measured Iron
Concentration (µg/L) 1,2
Negative Control 1000
Negative Control
1000
Negative Control 1000
3 4
7 8
11 12
0 0
24 24
48 48
< LOQ < LOQ
< LOQ < LOQ
< LOQ < LOQ
Matrix Blank and Fortification Samples
Nominal Iron
Concentration (µg/L)
Sample
Identification (472A-112-)
Measured Iron
Concentration (µg/L) 1
Percent
of Nominal 1
0.0
25.0
MAB-1
MAS-1
< LOQ
24.2
--
96.9 1 Results were generated using Excel 2000 in full precision mode. Manual calculations may differ slightly. 2 The limit of quantitation (LOQ) for these analyses was set at 10 µg/L.

Wildlife International, Ltd.
- 44 -
Project Number 472A-112
Table 23
Measured Concentrations of Nickel Analyzed by ICP-AES
Nominal Petroleum Coke Concentration
(mg/L)
Sample
Identification (472A-112-)
Sampling Interval (Hours)
Measured Nickel
Concentration (µg/L) 1,2
Negative Control 1000
Negative Control
1000
Negative Control 1000
3 4
7 8
11 12
0 0
24 24
48 48
< LOQ < LOQ
< LOQ < LOQ
< LOQ < LOQ
Matrix Blank and Fortification Samples
Nominal Nickel
Concentration (µg/L)
Sample
Identification (472A-112-)
Measured Nickel
Concentration (µg/L) 1
Percent
of Nominal 1
0.0
25.0
MAB-1
MAS-1
< LOQ
26.1
--
104 1 Results were generated using Excel 2000 in full precision mode. Manual calculations may differ slightly. 2 The limit of quantitation (LOQ) for these analyses was set at 10 µg/L.

Wildlife International, Ltd.
- 45 -
Project Number 472A-112
Table 24
Measured Concentrations of Selenium Analyzed by ICP-AES
Nominal Petroleum Coke Concentration
(mg/L)
Sample
Identification (472A-112-)
Sampling Interval (Hours)
Measured Selenium
Concentration (µg/L) 1,2
Negative Control 1000
Negative Control
1000
Negative Control 1000
3 4
7 8
11 12
0 0
24 24
48 48
< LOQ < LOQ
< LOQ < LOQ
< LOQ < LOQ
Matrix Blank and Fortification Samples
Nominal Selenium
Concentration (µg/L)
Sample
Identification (472A-112-)
Measured Selenium
Concentration (µg/L) 1
Percent
of Nominal 1
0.0
500
MAB-1
MAS-1
< LOQ
561
--
112 1 Results were generated using Excel 2000 in full precision mode. Manual calculations may differ slightly. 2 The limit of quantitation (LOQ) for these analyses was set at 200 µg/L.
Wildlife International, Ltd.
- 46 -
Project Number 472A-112
Table 25
Measured Concentrations of Vanadium Analyzed by ICP-AES
Nominal Petroleum Coke Concentration
(mg/L)
Sample
Identification (472A-112-)
Sampling Interval (Hours)
Measured Vanadium
Concentration (µg/L) 1,2
Negative Control 1000
Negative Control
1000
Negative Control 1000
3 4
7 8
11 12
0 0
24 24
48 48
< LOQ < LOQ
< LOQ < LOQ
< LOQ < LOQ
Matrix Blank and Fortification Samples
Nominal Vanadium
Concentration (µg/L)
Sample
Identification (472A-112-)
Measured Vanadium
Concentration (µg/L) 1
Percent
of Nominal 1
0.0
1.00
MAB-1
MAS-1
< LOQ
1.10
--
110 1 Results were generated using Excel 2000 in full precision mode. Manual calculations may differ slightly. 2 The limit of quantitation (LOQ) for these analyses was set at 0.40 µg/L.

Wildlife International, Ltd.
- 47 -
Project Number 472A-112
Table 26
Measured Concentrations of Sulfur Analyzed by ICP-AES
Nominal Petroleum Coke Concentration
(mg/L)
Sample
Identification (472A-112-)
Sampling Interval (Hours)
Measured Sulfur
Concentration (mg/L) 1,2
Negative Control 1000
Negative Control
1000
Negative Control 1000
3 4
7 8
11 12
0 0
24 24
48 48
< LOQ < LOQ
< LOQ < LOQ
< LOQ < LOQ
Matrix Blank and Fortification Samples
Nominal Sulfur
Concentration (mg/L)
Sample
Identification (472A-112-)
Measured Sulfur
Concentration (mg/L) 1
Percent
of Nominal 1
0.0
20.0
MAB-1
MAS-1
< LOQ
20.1
--
101 1 Results were generated using Excel 2000 in full precision mode. Manual calculations may differ slightly. 2 The limit of quantitation (LOQ) for these analyses was set at 10 mg/L.

Wildlife International, Ltd.
- 48 -
Project Number 472A-112
Table 27
Temperature, Dissolved Oxygen and pH of Water in the Test Chambers
0 Hour 1 24 Hours (Prior to Renewal) 24 Hours
(After Renewal) 1 48 Hours Nominal WAF Loading Rate
(mg/L)
Replicate Temp. 2
(ºC) DO 3
(mg/L)
pH Temp. 2 (ºC)
DO 3 (mg/L)
pH Temp. 2
(ºC) DO 3
(mg/L)
pH Temp. 2 (ºC)
DO 3 (mg/L)
pH
Negative Control A 20.4 8.8 8.3 21.4 8.8 8.3 20.7 8.9 8.3 20.7 8.7 8.4
B -- -- -- 21.2 8.8 8.3 -- -- -- 20.7 8.7 8.3
C -- -- -- 21.2 8.8 8.3 -- -- -- 20.7 8.7 8.3
1000 A 20.3 8.8 8.3 21.3 8.8 8.3 20.7 8.9 8.3 20.4 8.7 8.3
B -- -- -- 21.2 8.9 8.3 -- -- -- 20.5 8.7 8.4
C -- -- -- 21.2 8.8 8.3 -- -- -- 20.4 8.7 8.5
1 Measurements at 0 hours and after renewal at 24 hours were taken from the WAF solutions, rather from individual replicates, in order to begin each renewal period with test chambers completely filled with no headspace.
2 Manual temperature measurements. Temperature measured continuously during the test ranged from 19.5 to 20.5ºC, measured to the nearest 0.5ºC. 3 A dissolved oxygen concentration of 5.4 mg/L represents 60% saturation at 20.0ºC in freshwater.

Wildlife International, Ltd.
- 49 -
Project Number 472A-112
Table 28
Specific Conductance, Hardness, Alkalinity and Total Organic Carbon Measured in the Dilution Water at Test Initiation
Parameter Day 0
Specific Conductance 310 (µ mhos/cm) Hardness 130 (mg/L as CaCO3) Alkalinity 180 (mg/L as CaCO3) Total Organic Carbon <1 (m g C/L)
Wildlife International, Ltd.
- 50 -
Project Number 472A-112
Table 29
Cumulative Mortality/Immobility and Observations
2 Hours 24 Hours 2 48 Hours Nominal WAF Loading Rate
(mg/L)
Rep.
Daphnia/ Replicate
Cumulative No. Dead/No. Immobile
Observations1
Cumulative No. Dead/No. Immobile
Observations1
Cumulative No. Dead/No. Immobile
Observations1
Percent
Dead and Immobile
Negative Control A 10 0 / 0 10 AN 0 / 0 10 AN 0 / 0 10 AN 0
B 10 0 / 0 10 AN 0 / 0 10 AN 0 / 0 10 AN
C 10 0 / 0 10 AN 0 / 0 10 AN 0 / 0 10 AN
1000 A 10 0 / 0 10 AN 0 / 0 10 AN 0 / 0 10 AN 0
B 10 0 / 0 10 AN 0 / 0 10 AN 0 / 0 10 AN
C 10 0 / 0 10 AN 0 / 0 10 AN 0 / 0 10 AN
1 Observations: AN = appear normal. 2 All daphnia were transferred to newly prepared test solutions at approximately 24 hours.

Wildlife International, Ltd.
- 51 -
Project Number 472A-112
Table 30
Estimates of the EL50 Values
Time
EL50 1 (mg/L)
95% Confidence Interval (mg/L)
Statistical Method
24 Hours >1000 -- 2 NA 2
48 Hours >1000 -- 2 NA 2 1 Based on the single WAF loading rate tested. 2 There were no immobile daphnia in the treatment group. Therefore, EL50 values and 95%
confidence limits could not be statistically calculated and were determined by visual interpretation of the data.

Wildlife International, Ltd.
- 52 -
Project Number 472A-112
Appendix 1
Exploratory Non-GLP Rangefinding Toxicity Test with Petroleum Coke

Wildlife International, Ltd.
- 53 -
Project Number 472A-112

Wildlife International, Ltd.
- 54 -
Project Number 472A-112

Wildlife International, Ltd.
- 55 -
Project Number 472A-112
Appendix 2
Protocol, Amendments and Deviations

Wildlife International, Ltd.
- 56 -
Project Number 472A-112

Wildlife International, Ltd.
- 57 -
Project Number 472A-112

Wildlife International, Ltd.
- 58 -
Project Number 472A-112

Wildlife International, Ltd.
- 59 -
Project Number 472A-112

Wildlife International, Ltd.
- 60 -
Project Number 472A-112

Wildlife International, Ltd.
- 61 -
Project Number 472A-112

Wildlife International, Ltd.
- 62 -
Project Number 472A-112

Wildlife International, Ltd.
- 63 -
Project Number 472A-112

Wildlife International, Ltd.
- 64 -
Project Number 472A-112

Wildlife International, Ltd.
- 65 -
Project Number 472A-112

Wildlife International, Ltd.
- 66 -
Project Number 472A-112

Wildlife International, Ltd.
- 67 -
Project Number 472A-112

Wildlife International, Ltd.
- 68 -
Project Number 472A-112

Wildlife International, Ltd.
- 69 -
Project Number 472A-112

Wildlife International, Ltd.
- 70 -
Project Number 472A-112

Wildlife International, Ltd.
- 71 -
Project Number 472A-112
Wildlife International, Ltd.
- 72 -
Project Number 472A-112
Wildlife International, Ltd.
- 73 -
Project Number 472A-112

Wildlife International, Ltd.
- 74 -
Project Number 472A-112

Wildlife International, Ltd.
- 75 -
Project Number 472A-112

Wildlife International, Ltd.
- 76 -
Project Number 472A-112

Wildlife International, Ltd.
- 77 -
Project Number 472A-112

Wildlife International, Ltd.
- 78 -
Project Number 472A-112
AMENDED
Appendix 3
Test Article Selection

Wildlife International, Ltd.
- 79 -
Project Number 472A-112
AMENDED

Wildlife International, Ltd.
- 80 -
Project Number 472A-112
AMENDED

Wildlife International, Ltd.
- 81 -
Project Number 472A-112
AMENDED

Wildlife International, Ltd.
- 82 -
Project Number 472A-112
AMENDED
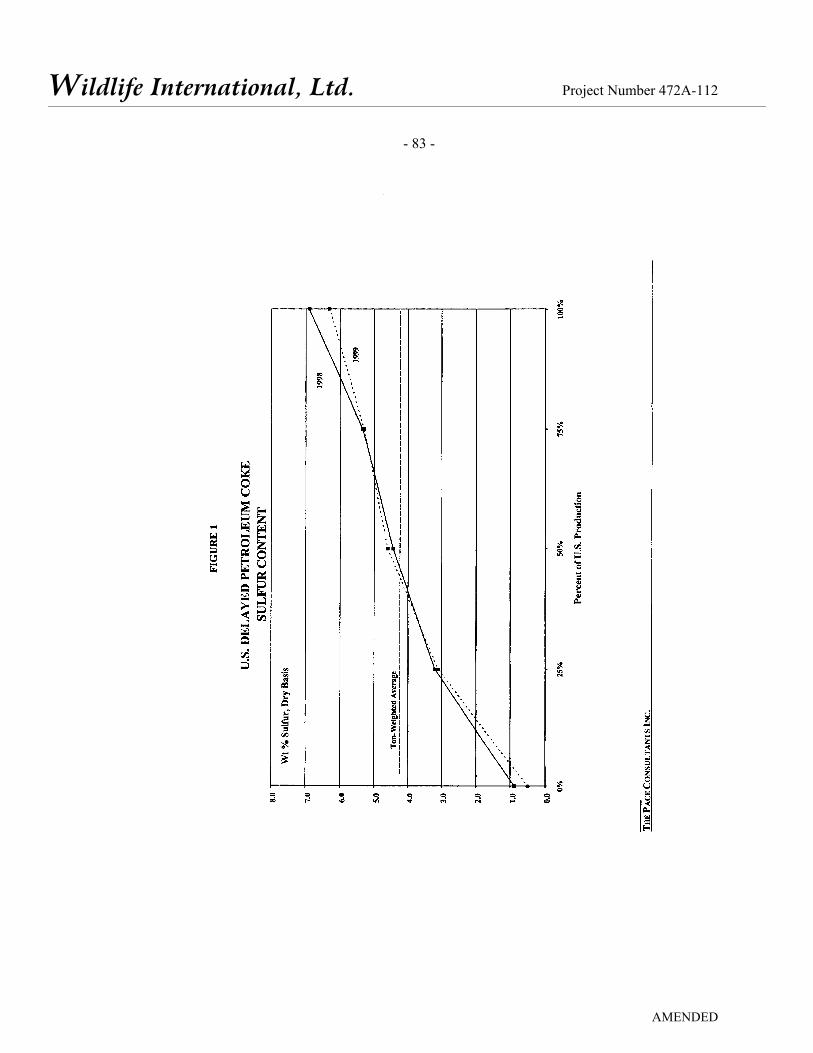
Wildlife International, Ltd.
- 83 -
Project Number 472A-112
AMENDED

Wildlife International, Ltd.
- 84 -
Project Number 472A-112
AMENDED

Wildlife International, Ltd.
- 85 -
Project Number 472A-112
AMENDED

Wildlife International, Ltd.
- 86 -
Project Number 472A-112
AMENDED

Wildlife International, Ltd.
- 87 -
Project Number 472A-112
AMENDED
Wildlife International, Ltd.
- 88 -
Project Number 472A-112
AMENDED

Wildlife International, Ltd.
- 89 -
Project Number 472A-112
AMENDED
Appendix 4
AVEKA, Inc. Particle Processing Report

Wildlife International, Ltd.
- 90 -
Project Number 472A-112
AMENDED

Wildlife International, Ltd.
- 91 -
Project Number 472A-112
AMENDED
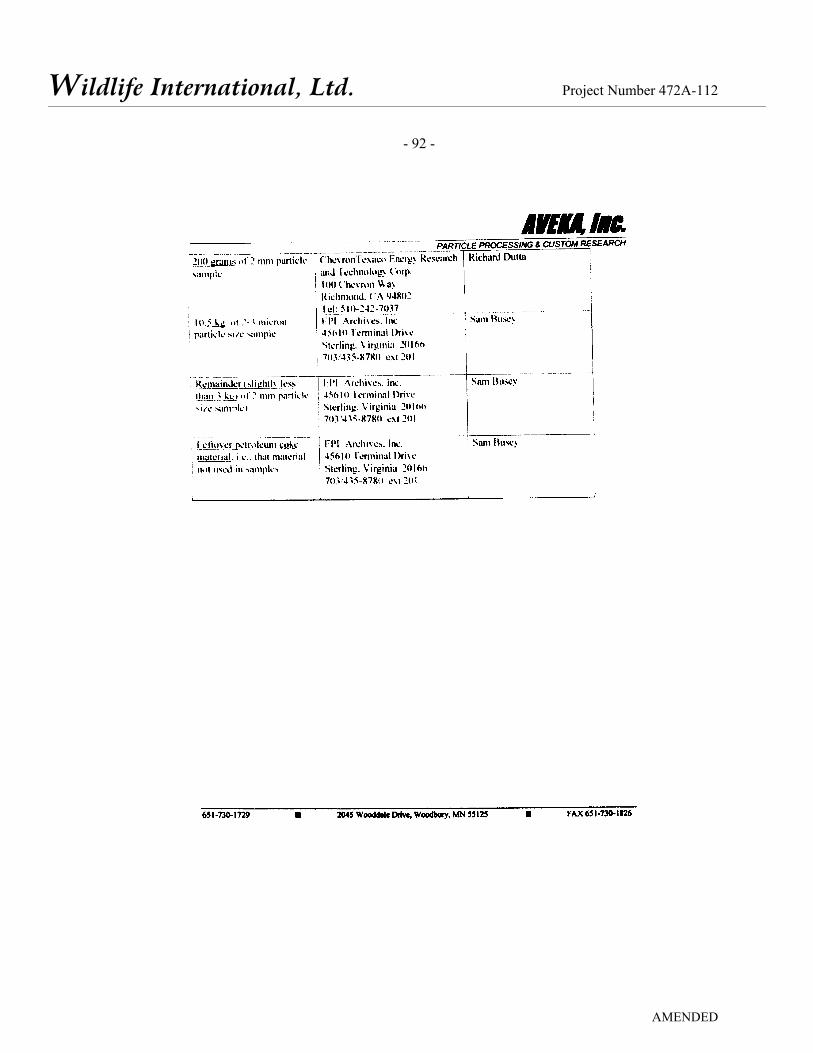
Wildlife International, Ltd.
- 92 -
Project Number 472A-112
AMENDED

Wildlife International, Ltd.
- 93 -
Project Number 472A-112
AMENDED

Wildlife International, Ltd.
- 94 -
Project Number 472A-112
AMENDED
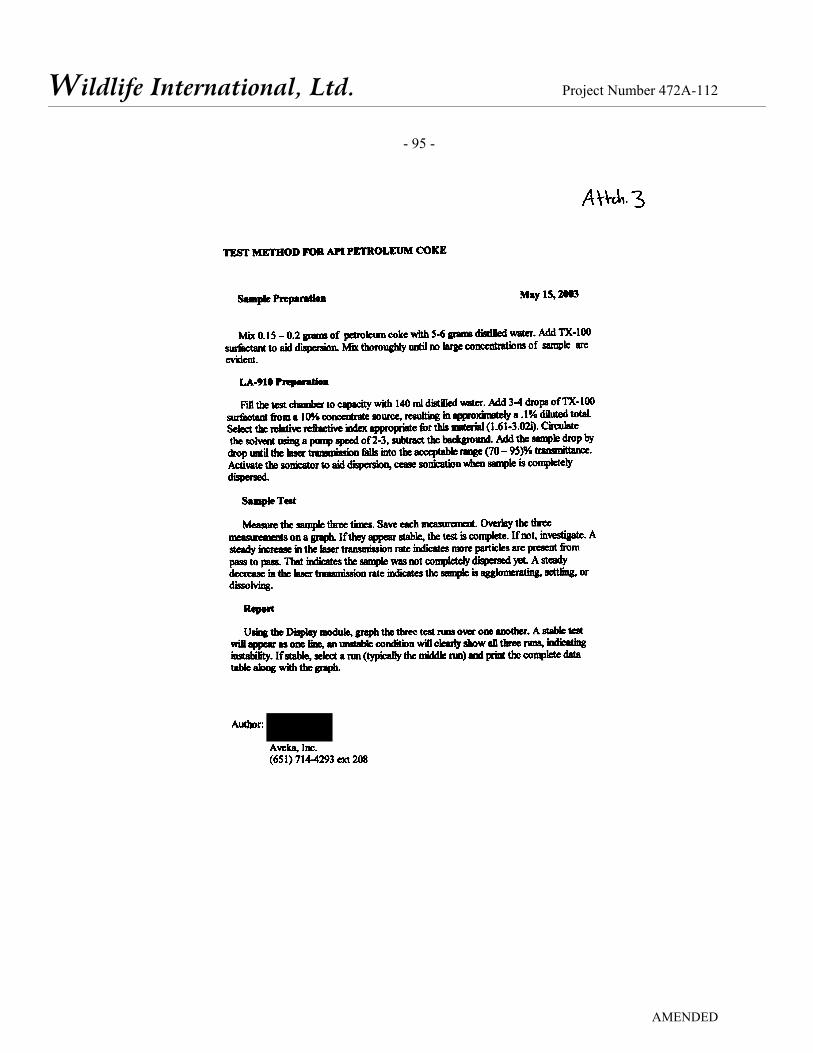
Wildlife International, Ltd.
- 95 -
Project Number 472A-112
AMENDED

Wildlife International, Ltd.
- 96 -
Project Number 472A-112
AMENDED

Wildlife International, Ltd.
- 97 -
Project Number 472A-112
AMENDED
Appendix 5
Laboratory Characterization of 2 mm Particle Size Petroleum Coke

Wildlife International, Ltd.
- 98 -
Project Number 472A-112
AMENDED

Wildlife International, Ltd.
- 99 -
Project Number 472A-112
AMENDED
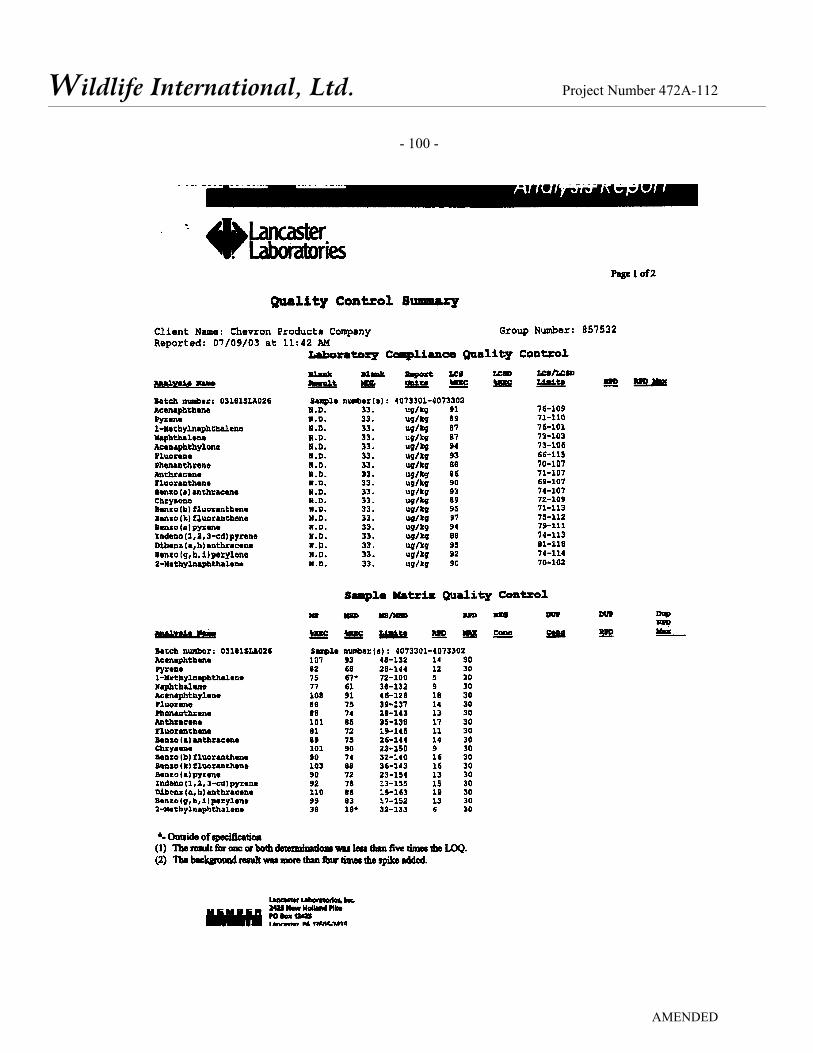
Wildlife International, Ltd.
- 100 -
Project Number 472A-112
AMENDED

Wildlife International, Ltd.
- 101 -
Project Number 472A-112
AMENDED

Wildlife International, Ltd.
- 102 -
Project Number 472A-112
AMENDED

Wildlife International, Ltd.
- 103 -
Project Number 472A-112
AMENDED
Appendix 6
Specific Conductance, Hardness, Alkalinity and pH of Well Water Measured During the 4-Week Period Immediately Preceding the Test
Mean Range Specific Conductance (µ mhos/cm)
293 (N = 4)
275 – 305
Hardness (mg/L as CaC03)
131 (N = 4)
128 – 136
Alkalinity (mg/L as CaC03)
179 (N = 4)
174 – 182
pH 8.3 (N = 4)
8.2 – 8.4

Wildlife International, Ltd.
- 104 -
Project Number 472A-112
AMENDED
Appendix 7
Analyses of Pesticides, Organics and Metals in Wildlife International, Ltd. Well Water1
Pesticides and Organics
Component Measured Concentration
(µg/L) Component Measured Concentration
(µg/L)
Aldrin < 0.0099 Heptachlor Epoxide < 0.0099 Alpha BHC < 0.0099 Malathion < 2.0 Beta BHC < 0.040 Merphos < 2.0 Bolstar < 2.0 Methoxychlor < 0.099 Chlordane < 0.50 Methyl Parathion < 2.0 Coumaphos < 3.0 Mevinphos < 2.0 Delta BHC < 0.0099 Mirex < 0.050 Demeton-O < 2.0 Naled < 3.0 Demeton-S < 2.0 o,p-DDD < 0.020 Diazinon < 2.0 o,p-DDE < 0.020 Dichlorvos < 2.0 o,p-DDT < 0.020 Dieldrin < 0.020 p,p-DDD < 0.020 Disulfoton < 2.0 p,p-DDE < 0.020 Dursban (Chlorpyrifos) < 2.0 p,p-DDT < 0.025 Endosulfan I < 0.0099 PCB-1016 < 0.50 Endosulfan II < 0.042 PCB-1221 < 1.2 Endosulfan Sulfate < 0.020 PCB-1232 < 0.89 Endrin < 0.020 PCB-1242 < 0.50 EPN < 4.0 PCB-1248 < 0.50 Ethion < 2.0 PCB-1254 < 0.50 Ethoprop < 2.0 PCB-1260 < 0.50 Ethyl Parathion < 2.0 Phorate < 2.0 Famphur < 2.0 Ronnel < 2.0 Fensulfothion < 4.0 Stirophos < 2.0 Fenthion < 2.0 Telodrin < 0.0099 Gamma BHC – Lindane < 0.0099 Tokuthion < 2.0 Guthion (Azinphos-methyl) < 4.0 Toxaphene < 0.99 HCB < 0.099 Trichloronate < 2.0 Heptachlor < 0.0099 Trithion < 2.0
1Analyses performed by Lancaster Laboratories on samples collected on December 22, 2004.

Wildlife International, Ltd.
- 105 -
Project Number 472A-112
AMENDED
Appendix 7 (Continued)
Analyses of Pesticides, Organics and Metals in Wildlife International, Ltd. Well Water1
Metals
Component Measured Concentration
(mg/L) Component Measured Concentration
(mg/L) Aluminum < 0.200 Magnesium 12.7 Antimony < 0.0200 Manganese < 0.0050 Arsenic < 0.0100 Mercury < 0.00020 Barium < 0.0050 Nickel < 0.0100 Beryllium < 0.0050 Nitrate Nitrogen < 0.50 Bromide < 2.5 Nitrite Nitrogen < 0.50 Cadmium < 0.0050 Potassium 6.64 Calcium 31.1 Selenium < 0.0100 Chloride 6.9 Silver < 0.0050 Chromium < 0.0050 Sodium 19.7 Cobalt < 0.0050 Sulfate 5.5 Copper < 0.0100 Thallium < 0.0200 Fluoride < 0.50 Vanadium < 0.0050 Iron < 0.200 Zinc < 0.0200 Lead < 0.0200
1Analyses performed by Lancaster Laboratories on samples collected on December 22, 2004.

Wildlife International, Ltd.
- 106 -
Project Number 472A-112
AMENDED
Appendix 8
Results of WAF Equilibration Trial Polyaromatic Hydrocarbon Analysis
Water accommodated fractions (WAFs) were analyzed for the presence of the 19 polyaromatic
hydrocarbons (PAHs) after mixing for 24, 48, 72 and 96 hours. No PAHs were detected in any WAF
samples. Results of PAH analyses in WAFs are presented in Wildlife International, Ltd. Project Number
472C-104.
Metals Analysis
Water accommodated fractions (WAFs) were analy zed for the presence of the six m etals and
sulfur after mixing for 24, 48, 72 and 96 hours. Except for a trace of iron contam ination in one test
vessel, no metals were detected in any WAF samples. Sulfur was not detected above the background
level in the freshwater used. Results of the m etals analy ses in WAFs are presented in Wildlife
International, Ltd. Project Number 472C-105.

Wildlife International, Ltd.
- 107 -
Project Number 472A-112
AMENDED
Appendix 9
The Analysis of Organic Constituents in Petroleum Coke in Freshwater

Wildlife International, Ltd.
- 108 -
Project Number 472A-112
AMENDED
Appendix 9.1
Analytical Method Flowchart for the Analysis of PAH Components of Petroleum Coke in Freshwater by HPLC
FLOWCHART FOR THE ANALYSIS OF WATER SOLUBLE COMPONENTS OF PETROLEUM COKE IN FRESHWATER
Prepare samples in freshwater using volumetric flasks, volumetric pipettes, gas tight syringes and culture tubes. Freshwater served as the matrix blanks.
↓
Dilute samples, as necessary, with freshwater such that the final sample concentrations fall within the calibration standard range.
↓
Transfer samples and standards to autosampler vials for analysis by either HPLC/UV or fluorescence detection.

Wildlife International, Ltd.
- 109 -
Project Number 472A-112
AMENDED
Appendix 9.2
Typical HPLC Operational Parameters
INSTRUMENT: Agilent Model 1100 High Performance Liquid Chromatograph (HPLC) with a either an Agilent Series 1100 Variable Wavelength Detector or a Jasco Model FP-1520 Fluorescence Detector
ANALYTICAL COLUMN: YMC-Pack ODS AM (150 mm x 4.6 mm, 3 µm particle size)
STOP TIME: 35 minutes
FLOW RATE: 1.00 mL/minute
OVEN TEMPERATURE: 40°C
MOBILE PHASE: GRADIENT:
SOLVENT A: 0.1% H3PO4 SOLVENT B: CH3CN Time Flow (min) %A %B (m L/min) 0.01 40.0 60.0 1.000 1.00 40.0 60.0 1.000 30.00 0.0 100.0 1.000 30.10 40.0 60.0 1.000 35.00 40.0 60.0 1.000
INJECTION VOLUME: 100 µL
APPROXIMATE RETENTION TIMES:
Naphthalene = 6.8 min. Acenaphthylene = 7.8 min. 1-Methylnaphthalene = 8.9 min. 2-Methylnaphthalene = 9.2 min. Fluorene = 9.8 min. Acenaphthene = 9.9 min. Phenanthrene = 10.7 min. Anthracene = 11.4 min. Fluoranthene = 13.0 min. Pyrene = 13.8 min.
Chrysene = 16.2 min. Benz(a)anthracene = 16.4 min. Benzo(b)fluoranthene = 19.2 min. Benzo(k)fluoranthene = 19.5 min. Benzo(a)pyrene = 20.2 min. Dibenz(a,h,)anthracene = 21.8 min.Indeno(1,2,3-cd)pyrene = 23.1 min.Benzo(g,h,i)perylene = 23.4 min. Dibenzo(a,e)pyrene = 25.2 min.
PRIMARY ANALYTICAL WAVELENGTHS
UV = 220 nm; Fluorescence = 340 nm to 425 nm

Wildlife International, Ltd.
- 110 -
Project Number 472A-112
AMENDED
Appendix 9.3
Analytical Stocks and Standards Preparation
For all compounds received from AccuStandard, with the exception of Benzo(g,h,i)pery lene,
Benzo(k)fluoranthene and Fluoranthene, the mass received was quantitatively transferred to a 100-mL
class A volum etric flask using m ethanol. These prim ary stock solution concentrations were 0.100
mg/mL. Benzo(g,h,i)perylene, Benzo(k)fluoranthene and Fluoranthene were quantitatively transferred to
a 200-mL class A volumetric flask using methanol. These primary stock solution concentrations were
0.05 mg/mL.
A stock of Dibenzo(a.e)py rene (received from Cambridge Isotope Labs) was prepared by
weighing 0.01000 g on an analy tical balance, transferred to a 100-m L class A volum etric flask and
brought to volume using tetrahydrofuran. This primary stock solution concentration was 0.100 mg/mL.
Stocks of 2-m ethylnaphthalene and 1-m ethynaphthalene (received from ChemService) were
prepared by weighing 0.1004 g and 0.1003 g, respectively, on an analytical balance. The test materials
were transferred to 100-m L class A volum etric flasks and brought to volume using methanol. These
primary stock solutions contained 1.00 mg/mL of the test material and were diluted in m ethanol to
prepare 0.100 mg/mL stock solutions.
Aliquots (1.00 mL) of the 0.100 mg/mL primary stocks and 2.00 m L of the 0.05 m g/L, were
added to a 100-mL class A volumetric flask and brought to volume with methanol. The following shows
the dilution scheme for the set of calibration standards:
Stock
Concentration mg/L
Aliquot (µL)
Final
Volume (mL)
Standard
Concentration (µg/L)
1.00 1.00 1.00 1.00 1.00
50.0 150 250 350 500
10.0 10.0 10.0 10.0 10.0
5.00 15.0 25.0 35.0 50.0

Wildlife International, Ltd.
- 111 -
Project Number 472A-112
AMENDED
Appendix 9.4
Calibration Curve for Naphthalene Analyzed by HPLC/UV
0
20
40
60
80
100
120
0.00 10.00 20.00 30.00 40.00 50.00 60.00(ug/L)
Peak
are
a co
unts
Slope = 2.2446; Y-intercept = -0.7323; R2 = 0.9997

Wildlife International, Ltd.
- 112 -
Project Number 472A-112
AMENDED
Appendix 9.5
Calibration curve for Acenaphthylene Analyzed by HPLC/UV
0
5
10
15
20
25
30
35
40
45
0.00 10.00 20.00 30.00 40.00 50.00 60.00(ug/L)
Peak
are
a co
unts
Slope = 0.7992; Y-intercept = -0.1873; R2 = 0.9998

Wildlife International, Ltd.
- 113 -
Project Number 472A-112
AMENDED
Appendix 9.6
Calibration curve for 1-Methylnaphthalene Analyzed by HPLC/UV
0
20
40
60
80
100
120
140
0.00 10.00 20.00 30.00 40.00 50.00 60.00(ug/L)
Peak
are
a co
unts
Slope = 2.4555; Y-intercept = -0.3129; R2 = 0.9997

Wildlife International, Ltd.
- 114 -
Project Number 472A-112
AMENDED
Appendix 9.7
Calibration curve for 2-Methylnaphthalene Analyzed by HPLC/UV
0
20
40
60
80
100
120
140
160
0.00 10.00 20.00 30.00 40.00 50.00 60.00(ug/L)
Peak
are
a co
unts
Slope = 2.8814; Y-intercept = -0.6393; R2 = 0.9994

Wildlife International, Ltd.
- 115 -
Project Number 472A-112
AMENDED
Appendix 9.8
Calibration curve for Fluorene Analyzed by HPLC/UV
0
2
4
6
8
10
12
14
16
18
20
0.00 10.00 20.00 30.00 40.00 50.00 60.00(ug/L)
Peak
are
a co
unts
Slope = 0.3593; Y-intercept = -0.0275; R2 = 0.9970

Wildlife International, Ltd.
- 116 -
Project Number 472A-112
AMENDED
Appendix 9.9
Calibration curve for Acenaphthene Analyzed by HPLC/UV
0
10
20
30
40
50
60
70
80
90
100
0.00 10.00 20.00 30.00 40.00 50.00 60.00(ug/L)
Peak
are
a co
unts
Slope = 1.8410; Y-intercept = 0.9418; R2 = 0.9996
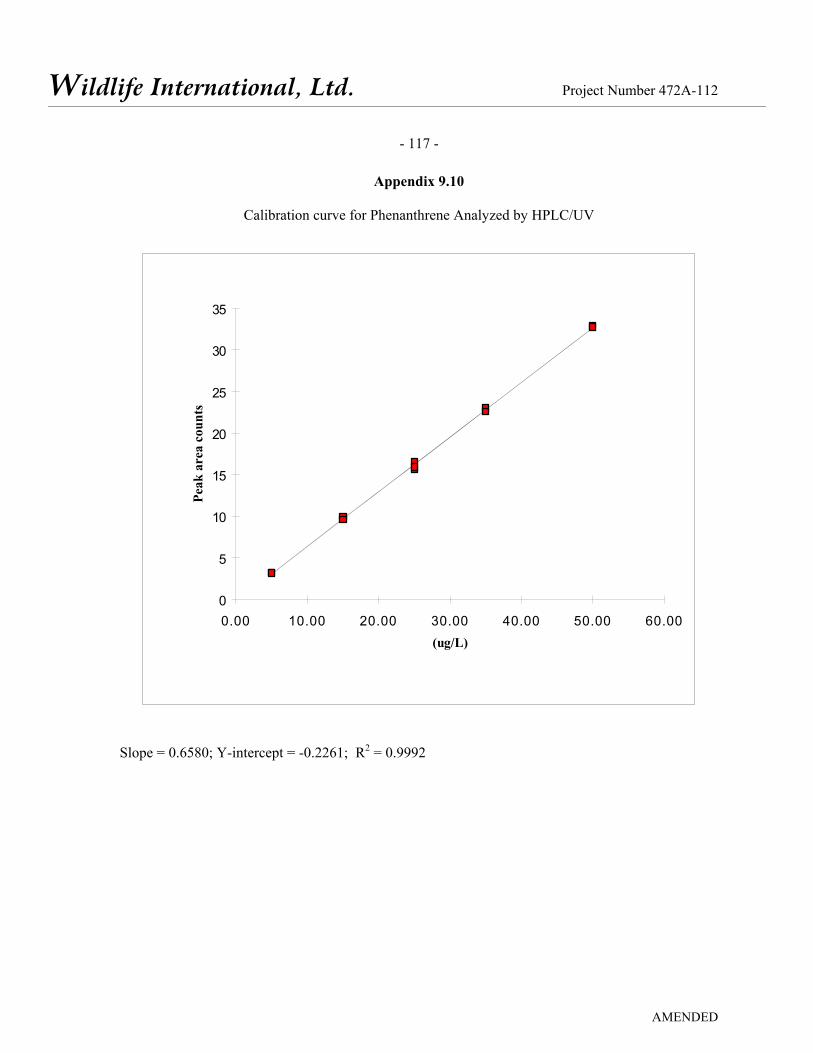
Wildlife International, Ltd.
- 117 -
Project Number 472A-112
AMENDED
Appendix 9.10
Calibration curve for Phenanthrene Analyzed by HPLC/UV
0
5
10
15
20
25
30
35
0.00 10.00 20.00 30.00 40.00 50.00 60.00(ug/L)
Peak
are
a co
unts
Slope = 0.6580; Y-intercept = -0.2261; R2 = 0.9992

Wildlife International, Ltd.
- 118 -
Project Number 472A-112
AMENDED
Appendix 9.11
Calibration curve for Anthracene Analyzed by HPLC with Fluorescence Detection
0
10000
20000
30000
40000
50000
60000
70000
0.00 10.00 20.00 30.00 40.00 50.00 60.00(ug/L)
Peak
are
a co
unts
Slope = 1130.2676; Y-intercept = 1098.2202; R2 = 0.9803

Wildlife International, Ltd.
- 119 -
Project Number 472A-112
AMENDED
Appendix 9.12
Calibration curve for Fluoranthene analyzed by HPLC with Fluorescence Detection
0
10000
20000
30000
40000
50000
60000
0.00 10.00 20.00 30.00 40.00 50.00 60.00(ug/L)
Peak
are
a co
unts
Slope = 1024.8555; Y-intercept = -587.0169; R2 = 0.9983
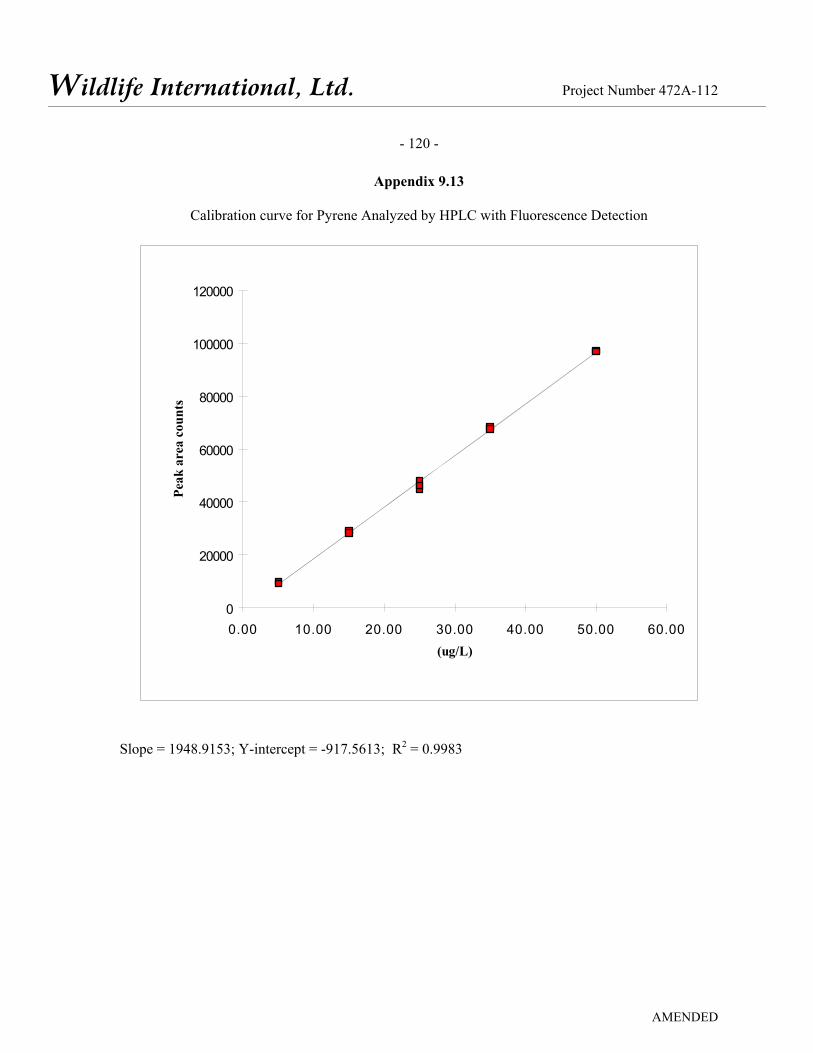
Wildlife International, Ltd.
- 120 -
Project Number 472A-112
AMENDED
Appendix 9.13
Calibration curve for Pyrene Analyzed by HPLC with Fluorescence Detection
0
20000
40000
60000
80000
100000
120000
0.00 10.00 20.00 30.00 40.00 50.00 60.00(ug/L)
Peak
are
a co
unts
Slope = 1948.9153; Y-intercept = -917.5613; R2 = 0.9983

Wildlife International, Ltd.
- 121 -
Project Number 472A-112
AMENDED
Appendix 9.14
Calibration curve for Chrysene Analyzed by HPLC/UV
0
5
10
15
20
25
30
35
40
0.00 10.00 20.00 30.00 40.00 50.00 60.00(ug/L)
Peak
are
a co
unts
Slope = 0.7537; Y-intercept = -0.6076; R2 = 0.9989

Wildlife International, Ltd.
- 122 -
Project Number 472A-112
AMENDED
Appendix 9.15
Calibration curve for Benz(a)anthracene Analyzed by HPLC with Fluorescence Detection
0
10000
20000
30000
40000
50000
60000
70000
0 10 20 30 40 50 60(ug/L)
Peak
are
a co
unts
Slope = 1126.4458; Y-intercept = -840.1001; R2 = 0.9890

Wildlife International, Ltd.
- 123 -
Project Number 472A-112
AMENDED
Appendix 9.16
Calibration curve for Benzo(b)fluoranthene Analyzed by HPLC with Fluorescence Detection
0
20000
40000
60000
80000
100000
120000
140000
160000
0.00 10.00 20.00 30.00 40.00 50.00 60.00(ug/L)
Peak
are
a co
unts
Slope = 2969.5100; Y-intercept = -4747.0950; R2 = 0.9921

Wildlife International, Ltd.
- 124 -
Project Number 472A-112
AMENDED
Appendix 9.17
Calibration curve for Benzo(k)fluoroanthene Analyzed by HPLC with Fluorescence Detection
0
50000
100000
150000
200000
250000
300000
0.00 10.00 20.00 30.00 40.00 50.00 60.00(ug/L)
Peak
are
a co
unts
Slope = 5128.7396; Y-intercept = -3759.1793; R2 = 0.9990

Wildlife International, Ltd.
- 125 -
Project Number 472A-112
AMENDED
Appendix 9.18
Calibration curve for Benzo(a)pyrene Analyzed by HPLC with Fluorescence Detection
0
50000
100000
150000
200000
250000
300000
0.00 10.00 20.00 30.00 40.00 50.00 60.00(ug/L)
Peak
are
a co
unts
Slope = 5256.4678; Y-intercept = -5235.0017; R2 = 0.9985

Wildlife International, Ltd.
- 126 -
Project Number 472A-112
AMENDED
Appendix 9.19
Calibration curve for Dibenz(a,h)anthracene Analyzed by HPLC with Fluorescence Detection
0
10000
20000
30000
40000
50000
60000
70000
80000
90000
0.00 10.00 20.00 30.00 40.00 50.00 60.00(ug/L)
Peak
are
a co
unts
Slope = 1535.4327; Y-intercept = -1559.1883; R2 = 0.9984
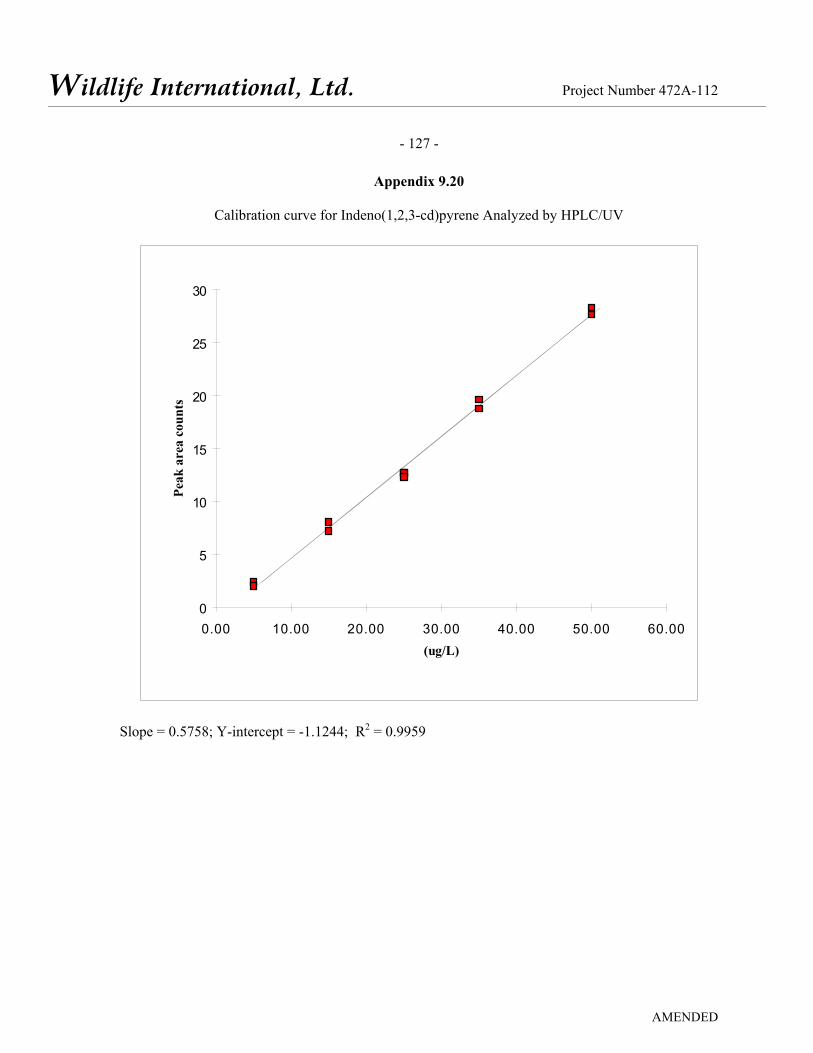
Wildlife International, Ltd.
- 127 -
Project Number 472A-112
AMENDED
Appendix 9.20
Calibration curve for Indeno(1,2,3-cd)pyrene Analyzed by HPLC/UV
0
5
10
15
20
25
30
0.00 10.00 20.00 30.00 40.00 50.00 60.00(ug/L)
Peak
are
a co
unts
Slope = 0.5758; Y-intercept = -1.1244; R2 = 0.9959
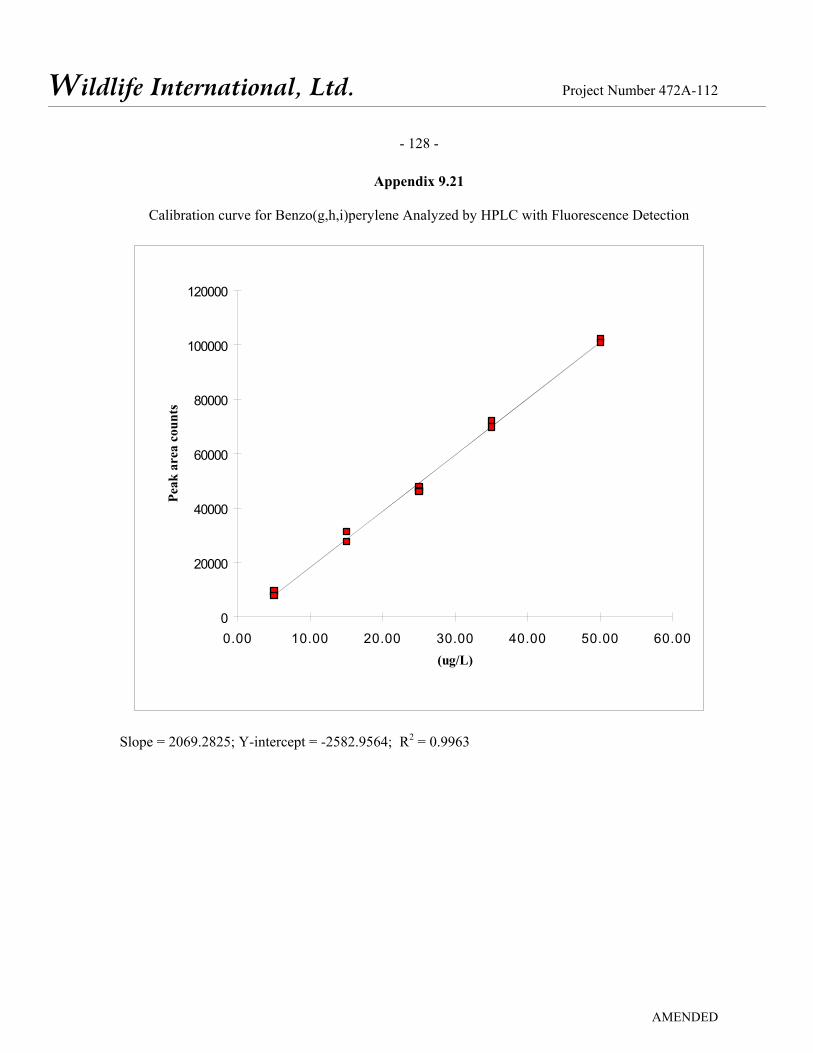
Wildlife International, Ltd.
- 128 -
Project Number 472A-112
AMENDED
Appendix 9.21
Calibration curve for Benzo(g,h,i)perylene Analyzed by HPLC with Fluorescence Detection
0
20000
40000
60000
80000
100000
120000
0.00 10.00 20.00 30.00 40.00 50.00 60.00(ug/L)
Peak
are
a co
unts
Slope = 2069.2825; Y-intercept = -2582.9564; R2 = 0.9963

Wildlife International, Ltd.
- 129 -
Project Number 472A-112
AMENDED
Appendix 9.22
Calibration curve for Dibenzo(a,e)pyrene Analyzed by HPLC with Fluorescence Detection
0
20000
40000
60000
80000
100000
120000
0.00 10.00 20.00 30.00 40.00 50.00 60.00(ug/L)
Peak
are
a co
unts
Slope = 2286.8927; Y-intercept = -4842.1080; R2 = 0.9958

Wildlife International, Ltd.
- 130 -
Project Number 472A-112
AMENDED
Appendix 9.23
Representative Chromatograms of a Low-level Calibration Standard Analyzed by HPLC/UV and Fluorescence Detection.
Nominal Concentration: 5.00 µg/L

Wildlife International, Ltd.
- 131 -
Project Number 472A-112
AMENDED
Appendix 9.24
Representative Chromatograms of a High-level Calibration Standards Analyzed by HPLC/UV and Fluorescence Detection
min5 10 15 20 25 30
mAu
50007500
10000125001500017500200002250025000
ADC1 A, Jasco FP-1520 @ 340 nm/425 nm (X:\413_LC13\1\DATA\PAHDAP2\005-0501.D)
11.
512
13.
062 1
3.91
3
16.
468
19.
210 1
9.61
0 2
0.32
0
21.
927
23.
479
23.
990
25.
308
26.
996
31.
681
min5 10 15 20 25 30
mAU
-10-8
-6-4
-20
2
46
VWD1 A, Wavelength=220 nm (X:\413_LC13\1\DATA\PAHDAP2\005-0501.D)
5.9
39 6
.246
6.8
55
7.8
61
8.9
37 9
.232
9.8
59 1
0.00
6 1
0.77
8 1
1.47
1 1
1.82
7
13.
021
13.
874
16.
190
16.
425
19.
169
19.
569
20.
277
21.
886
23.
229
23.
433
25.
267
Nominal Concentration: 50.0 µg/L

Wildlife International, Ltd.
- 132 -
Project Number 472A-112
AMENDED
Appendix 9.25
Representative Chromatograms of a Matrix Blank Sample Analyzed by HPLC/UV and Fluorescence Detection
min5 10 15 20 25 30
mAu
5580
5590
5600
5610
5620
ADC1 A, Jasco FP-1520 @ 340 nm/425 nm (X:\413_LC13\1\DATA\PAHDAP2\006-0601.D)
min5 10 15 20 25 30
mAU
-30.3
-30.2
-30.1
-30
-29.9
-29.8
VWD1 A, Wavelength=220 nm (X:\413_LC13\1\DATA\PAHDAP2\006-0601.D)
6.2
55
10.
162 1
1.82
7
Sample Number 472A-112-MAB-1.

Wildlife International, Ltd.
- 133 -
Project Number 472A-112
AMENDED
Appendix 9.26
Representative Chromatograms of a Matrix Fortification Sample Analyzed by HPLC/UV and Fluorescence Detection
Sample Number 472A-112-MAS-1. Nominal Concentration: 10.0 µg/L

Wildlife International, Ltd.
- 134 -
Project Number 472A-112
AMENDED
Appendix 9.27
Representative Chromatograms of a Test Sample Analyzed by HPLC/UV and Fluorescence Detection
min5 10 15 20 25 30
mAu
5620
5640
5660
5680
5700
5720
5740
ADC1 A, Jasco FP-1520 @ 340 nm/425 nm (X:\413_LC13\1\DATA\PAHDAP2\012-1201.D)
min5 10 15 20 25 30
mAU
-35.4
-35.3
-35.2
-35.1
-35
-34.9
VWD1 A, Wavelength=220 nm (X:\413_LC13\1\DATA\PAHDAP2\012-1201.D)
Sample Number 472A-112-2. Nominal Concentration: 1000 mg/L WAF.

Wildlife International, Ltd.
- 135 -
Project Number 472A-112
AMENDED
Appendix 10
The Analysis of Inorganic Constituents in Petroleum Coke in Freshwater

Wildlife International, Ltd.
- 136 -
Project Number 472A-112
AMENDED
Appendix 10.1
Analytical Method Flowchart for the Analysis of As, Cu, Fe, Ni, Se, V and S in Freshwater Analyzed by ICP-AES
Prepare quality control (QC) samples concurrent with the analyses of test samples as follows: Prepare matrix fortification samples by spiking the requisite volume(s) of the appropriate combined
and/or individual element stock solution(s) directly into freshwater. Perform fortifications with calibrated micropipettors and graduated centrifuge tubes. Bring to final volume with freshwater.
The matrix blank consists of unfortified freshwater. ↓
Partially fill a graduated centrifuge tube with each sample. Using a calibrated micropipettor, fortify each QC and test sample with 200 µL of concentrated nitric acid. Bring to final volume
with the sample. For samples not requiring further dilution into the calibration range of the ICP-AES methodology, submit for ICP-AES analysis.
↓
For those samples requiring dilution into the calibration range of the ICP-AES methodology, perform dilutions using graduated centrifuge tubes, calibrated micropipettor(s), and
2% (v/v) nitric acid in freshwater solution. Mix dilutions well and transfer into separate, labeled, 15-mL centrifuge tubes. Submit for ICP-AES analysis.
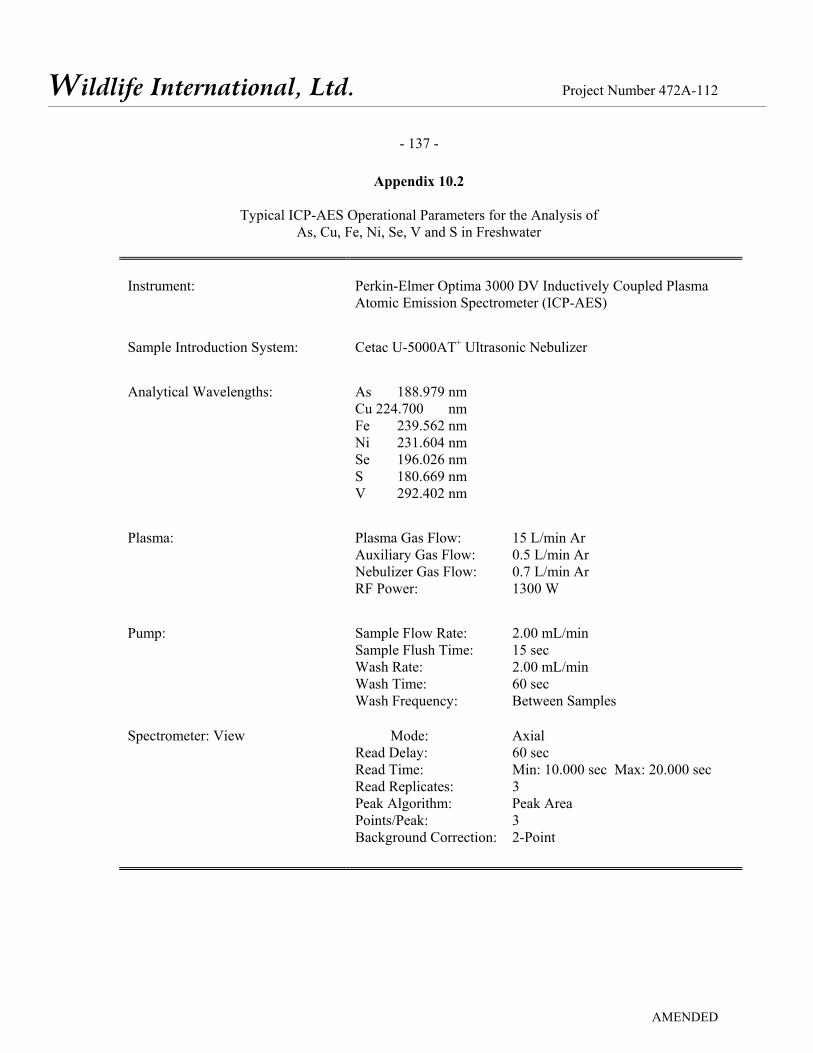
Wildlife International, Ltd.
- 137 -
Project Number 472A-112
AMENDED
Appendix 10.2
Typical ICP-AES Operational Parameters for the Analysis of As, Cu, Fe, Ni, Se, V and S in Freshwater
Instrument:
Perkin-Elmer Optima 3000 DV Inductively Coupled Plasma Atomic Emission Spectrometer (ICP-AES)
Sample Introduction System:
Cetac U-5000AT+ Ultrasonic Nebulizer
Analytical Wavelengths:
As 188.979 nm Cu 224.700 nm Fe 239.562 nm Ni 231.604 nm Se 196.026 nm S 180.669 nm V 292.402 nm
Plasma:
Plasma Gas Flow: 15 L/min Ar Auxiliary Gas Flow: 0.5 L/min Ar Nebulizer Gas Flow: 0.7 L/min Ar RF Power: 1300 W
Pump:
Sample Flow Rate: 2.00 mL/min Sample Flush Time: 15 sec Wash Rate: 2.00 mL/min Wash Time: 60 sec Wash Frequency: Between Samples
Spectrometer: View Mode: Axial Read Delay: 60 sec Read Time: Min: 10.000 sec Max: 20.000 sec Read Replicates: 3 Peak Algorithm: Peak Area Points/Peak: 3 Background Correction: 2-Point

Wildlife International, Ltd.
- 138 -
Project Number 472A-112
AMENDED
Appendix 10.3
Analytical Stocks and Standards Preparation
A combined stock solution containing the seven elements of interest was prepared either directly from the procured Spex primary standards, or from single element secondary stock preparations. The combined stock solutions were used to prepare exte rnal calibration standards and m atrix fortification samples. Volumetric flasks and calibrated micropipettors were used for all preparations. Preparation details for the stocks were as follows:
A single component secondary stock for vanadium was first prepared from a 10x dilution of the
1.00 mg/mL V primary standard using 2% (v/v) nitric acid in reagent grade water (2:98 HNO3: H2O) dilution solvent. The nominal concentration of the resultant vanadium stock was 0.100 mg V/mL. A combined secondary stock in 2:98 HNO3: H2O dilution solvent was then prepared as follows:
Element
Primary Stock
Concentration (mg/mL)
Aliquot (mL)
Final
Volume (mL)
Secondary Stock
Concentration (mg/L)
As Cu Fe Ni Se V
1.00 1.00 1.00 1.00 1.00 0.100
1.00 1.00 0.500 0.500 10.0 0.200
100
10.0 10.0 5.00 5.00 100
0.200
This combined secondary stock solution was used to prepare a set of calibration standards, each in 2% (v/v) nitric acid in Wildlife International, Ltd. freshwater (2:98 HNO3: FW) dilution solvent and diluted to a 100-mL final volume, using the following dilution scheme:
Stock
Aliquot:
Element
0.100 mL
Standard
Concentration (µg/L)
0.250 mL
Standard
Concentration (µg/L)
0.500 mL
Standard
Concentration (µg/L)
0.750 mL
Standard
Concentration (µg/L)
1.00 mL
Standard
Concentration (µg/L)
As Cu Fe Ni Se V
10.0 10.0 5.00 5.00 100
0.200
25.0 25.0 12.5 12.5 250
0.500
50.0 50.0 25.0 25.0 500 1.00
75.0 75.0 37.5 37.5 750 1.50
100 100 50.0 50.0 1000 2.00

Wildlife International, Ltd.
- 139 -
Project Number 472A-112
AMENDED
Appendix 10.3 (Continued)
Analytical Stocks and Standards Preparation
A separate set of sulfur calibration standards, each in 2:98 HNO3: FW dilution solvent, were
prepared from the 10.0-mg S/mL primary standard using the following dilution scheme:
Stock
Concentration (mg S/mL)
Aliquot
(µL)
Final Volume
(mL)
Standard Concentration
(mg S/L) 10.0 10.0 10.0 10.0 10.0
50.0 100 250 350 500
100 100 100 100 100
5.00 10.0 25.0 35.0 50.0
The 2:98 HNO3: FW dilution solvent, prepared concurrently with these calibration standards was
also utilized as a calibration/reagent blank.

Wildlife International, Ltd.
- 140 -
Project Number 472A-112
AMENDED
Appendix 10.4
Calibration Curve for Arsenic Analyzed by ICP-AES
0
50
100
150
200
250
300
350
400
0.0 20.0 40.0 60.0 80.0 100.0 120.0
Concentration (ug As/L)
Mea
n C
orre
cted
Inte
nsity
, cps
Slope = 3.6156; Y-intercept = -0.80539; R2 = 0.9987
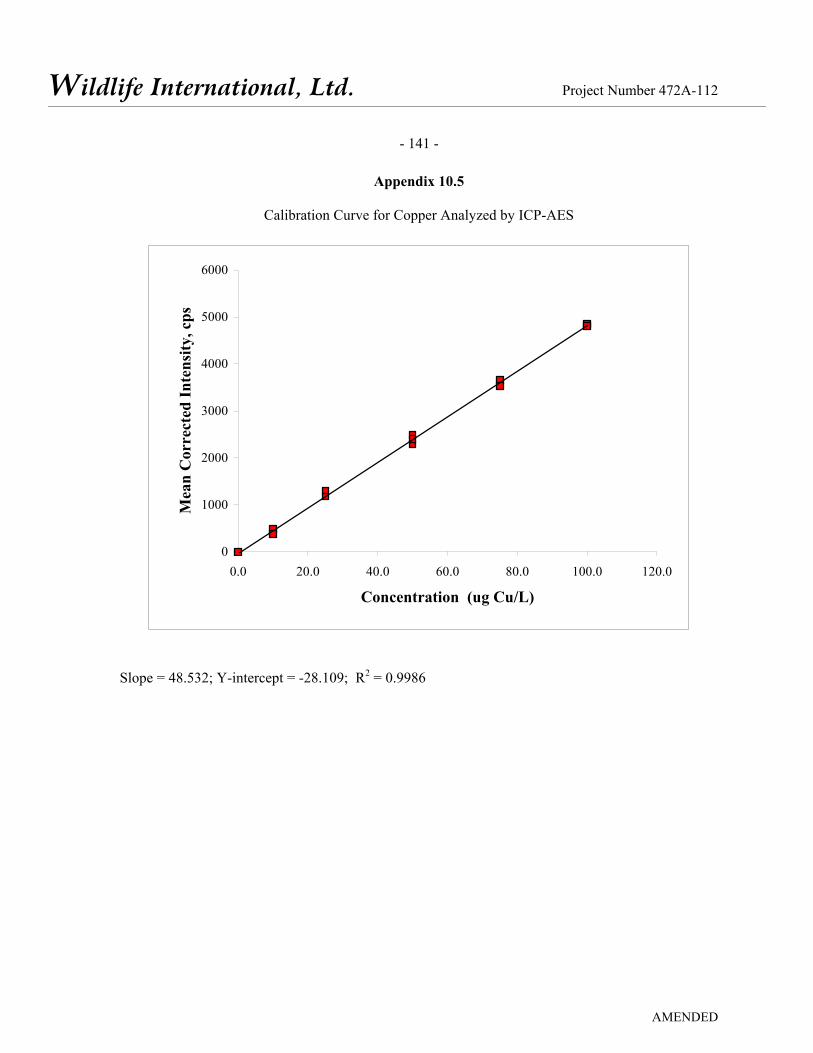
Wildlife International, Ltd.
- 141 -
Project Number 472A-112
AMENDED
Appendix 10.5
Calibration Curve for Copper Analyzed by ICP-AES
0
1000
2000
3000
4000
5000
6000
0.0 20.0 40.0 60.0 80.0 100.0 120.0
Concentration (ug Cu/L)
Mea
n C
orre
cted
Inte
nsity
, cps
Slope = 48.532; Y-intercept = -28.109; R2 = 0.9986
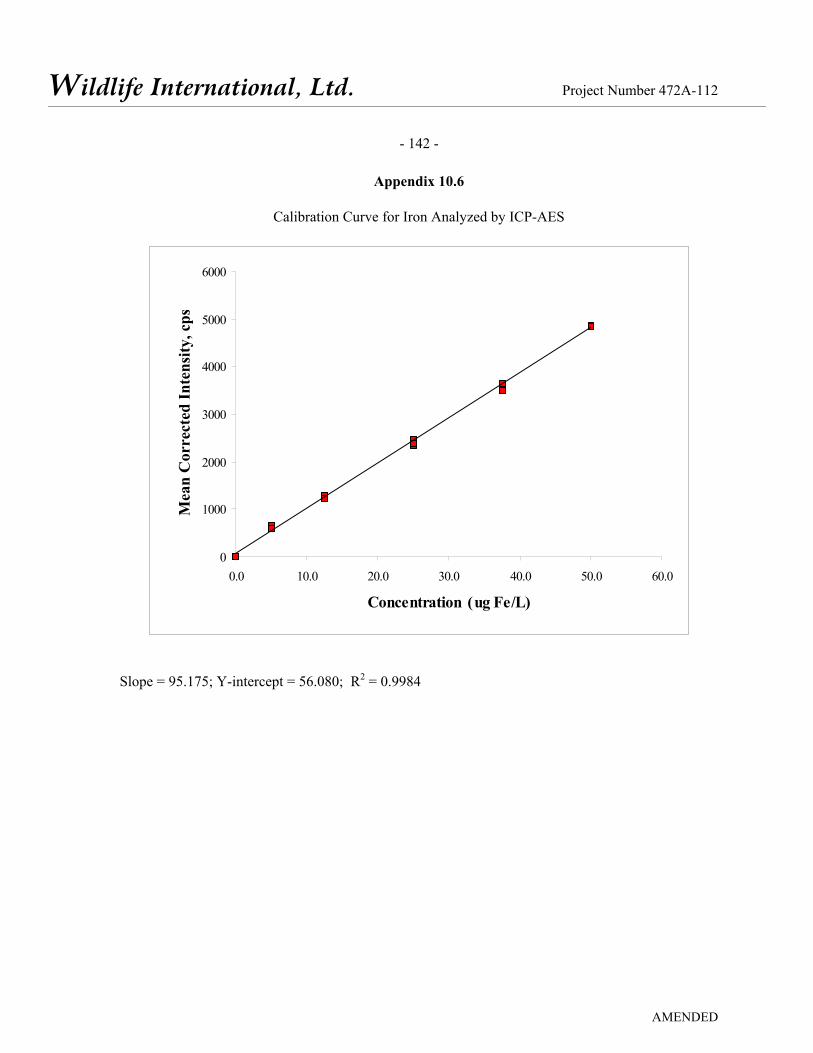
Wildlife International, Ltd.
- 142 -
Project Number 472A-112
AMENDED
Appendix 10.6
Calibration Curve for Iron Analyzed by ICP-AES
0
1000
2000
3000
4000
5000
6000
0.0 10.0 20.0 30.0 40.0 50.0 60.0
Concentration (ug Fe/L)
Mea
n C
orre
cted
Inte
nsity
, cps
Slope = 95.175; Y-intercept = 56.080; R2 = 0.9984

Wildlife International, Ltd.
- 143 -
Project Number 472A-112
AMENDED
Appendix 10.7
Calibration Curve for Nickel Analyzed by ICP-AES
0
500
1000
1500
2000
2500
3000
0.0 10.0 20.0 30.0 40.0 50.0 60.0
Concentration (ug Ni/L)
Mea
n C
orre
cted
Inte
nsity
, cps
Slope = 47.595; Y-intercept = 4.5257; R2 = 0.9993

Wildlife International, Ltd.
- 144 -
Project Number 472A-112
AMENDED
Appendix 10.8
Calibration Curve for Selenium Analyzed by ICP-AES
0
200
400
600
800
1000
1200
0.0 200.0 400.0 600.0 800.0 1000.0 1200.0
Concentration (ug Se/L)
Mea
n C
orre
cted
Inte
nsity
, cps
Slope = 1.0150; Y-intercept = 4.4766; R2 = 0.9986
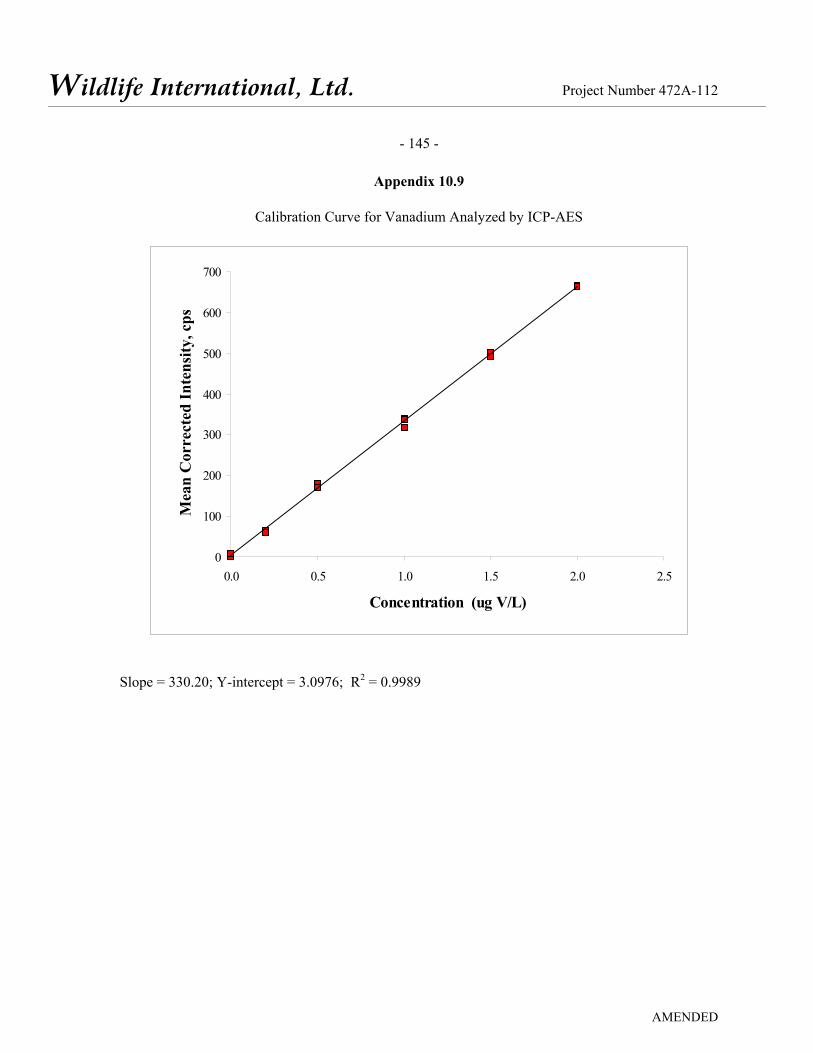
Wildlife International, Ltd.
- 145 -
Project Number 472A-112
AMENDED
Appendix 10.9
Calibration Curve for Vanadium Analyzed by ICP-AES
0
100
200
300
400
500
600
700
0.0 0.5 1.0 1.5 2.0 2.5
Concentration (ug V/L)
Mea
n C
orre
cted
Inte
nsity
, cps
Slope = 330.20; Y-intercept = 3.0976; R2 = 0.9989
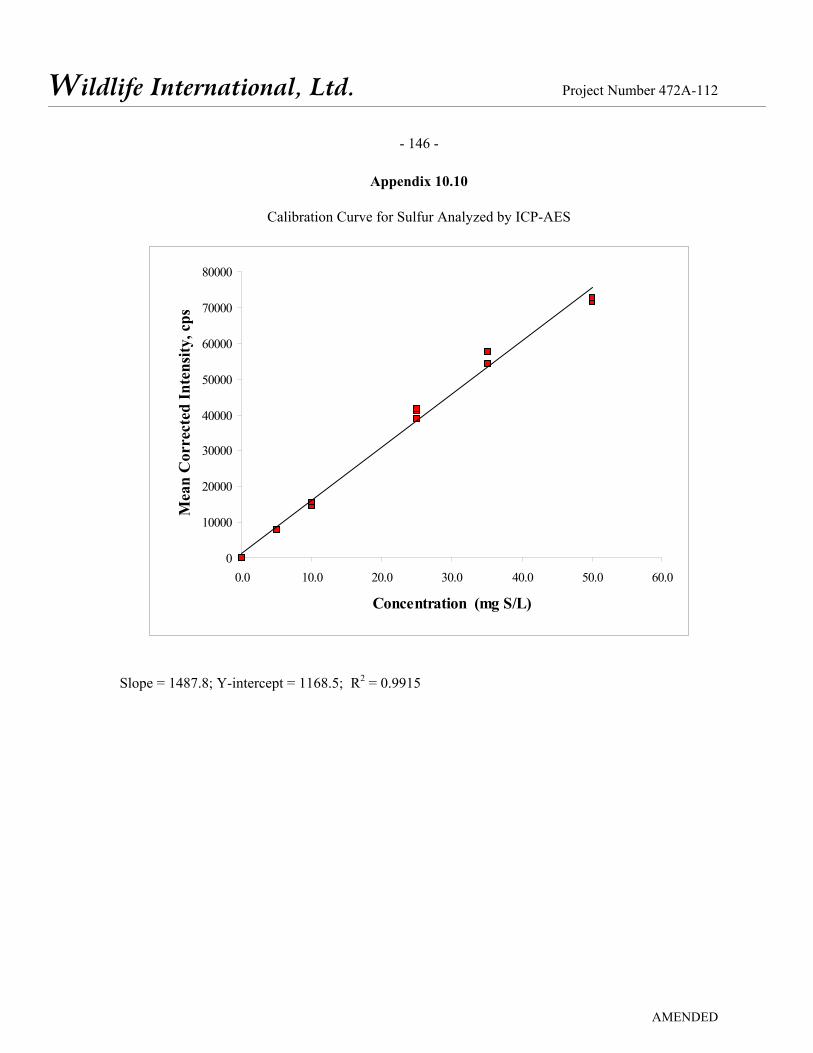
Wildlife International, Ltd.
- 146 -
Project Number 472A-112
AMENDED
Appendix 10.10
Calibration Curve for Sulfur Analyzed by ICP-AES
0
10000
20000
30000
40000
50000
60000
70000
80000
0.0 10.0 20.0 30.0 40.0 50.0 60.0
Concentration (mg S/L)
Mea
n C
orre
cted
Inte
nsity
, cps
Slope = 1487.8; Y-intercept = 1168.5; R2 = 0.9915

Wildlife International, Ltd.
- 147 -
Project Number 472A-112
AMENDED
0
100
200
300
400
500
600
188.940 188.950 188.960 188.970 188.980 188.990 189.000 189.010 189.020 189.030
W avelength (nm)
Emis
sion
Inte
nsity
(cps
)
0
1000
2000
3000
4000
5000
6000
224.640 224.660 224.680 224.700 224.720 224.740 224.760
W avelength (nm)
Emis
sion
Inte
nsity
(cps
)
0
2000
4000
6000
8000
10000
239.500 239.520 239.540 239.560 239.580 239.600 239.620
W avelength (nm)
Emis
sion
Inte
nsity
(cps
)Appendix 10.11
Representative Emission Spectra for Arsenic (top), Copper (middle) and Iron (bottom) in
Low- and High-Level Calibration Standards Prepared in Freshwater and Analyzed by ICP-AES
Squares = freshwater calibration blank (I.D.: 472A-112, 113-M-0); Diamonds = low-level standard (I.D.: 472A-112,113-M-1); Triangles = high-level standard (I.D.: 472A-112,113-M-5). Nominal concentrations for As, Cu and Fe = 10.0, 10.0 and 5.00 µg/L and 100, 100 and 50.0 µg/L, in the low- and high-level standards, respectively.
As 188.979
Fe 239.562
Cu 224.700

Wildlife International, Ltd.
- 148 -
Project Number 472A-112
AMENDED
0500
100015002000250030003500
231.540 231.560 231.580 231.600 231.620 231.640 231.660
W avelength (nm)
Emis
sion
Inte
nsity
(cps
)
0
1000
2000
3000
4000
195.980 196.000 196.020 196.040 196.060 196.080
W avelength (nm)
Emis
sion
Inte
nsity
(cps
)
2000
2500
3000
3500
292.320 292.340 292.360 292.380 292.400 292.420 292.440 292.460 292.480
W avelength (nm)
Emis
sion
Inte
nsity
(cps
)Appendix 10.12
Representative Emission Spectra for Nickel (top), Selenium (middle) and Vanadium (bottom) in Low- and High-Level Calibration Standards Prepared in Freshwater and Analyzed by ICP-AES.
Squares = freshwater calibration blank (I.D.: 472A-112, 113-M-0); Diamonds = low-level standard (I.D.: 472A-112,113-M-1); Triangles = high-level standard (I.D.: 472A-112,113-M-5). Nominal concentrations for Ni, Se and V = 5.00, 100 and 0.200 µg/L and 50.0, 1000 and 2.00 µg/L, in the low- and high-level standards, respectively.
Ni 231.604
Se 196.026
V 292.402

Wildlife International, Ltd.
- 149 -
Project Number 472A-112
AMENDED
010000200003000040000500006000070000
180.620 180.630 180.640 180.650 180.660 180.670 180.680 180.690 180.700 180.710
Wavelength (nm)
Emis
sion
Inte
nsity
(cps
)Appendix 10.13
Representative Emission Spectra for Sulfur in Low- and High-Level Calibration Standards
Prepared in Freshwater and Analyzed by ICP-AES.
Squares = freshwater calibration blank (I.D.: 472A-112,113-S-0); Diamonds = low-level standard (I.D.: 472A-112,113-S-1); Triangles = high-level standard (I.D.: 472A-112,113-S-5). Nominal concentrations for S = 5.00 and 50.0 mg/L in the low- and high-level standards, respectively.
S 180.669

Wildlife International, Ltd.
- 150 -
Project Number 472A-112
AMENDED
Appendix 10.14
Example Calculations
The analytical result and percent recovery for sample number 472A-112-MAS-1 for vanadium,
nominal concentration of 1.00 µg/L in freshwater, were calculated using the following equation:
Vanadium (µg/L) in sample = Mean Corrected Intensity - (Y-intercept)
Slope X Dilution factor
Mean Corrected Intensity = 359 Y-intercept = 3.0976 Slope = 330.20 Dilution Factor = 1.02
Concentration of Vanadium (µg/L) in sample = 359 - 3.0976
330.20 X 1.02
Concentration of Vanadium in sample (µg/L) = 1.10
Percent of nominal concentration = 1.10 (µg/L)1.00 (µg/L) X 100
Percent of nominal concentration = 110%

Wildlife International, Ltd.
- 151 -
Project Number 472A-112
AMENDED
Appendix 10.15
Emission Spectra for Arsenic (top), Copper (middle) and Iron (bottom) in Matrix Blank and Matrix Fortification Samples Prepared in Freshwater and Analyzed by ICP-AES.
Squares = freshwater matrix blank (I.D.: 472A-112-MAB-1, Df = 1.02x); Diamonds = matrix fortification (I.D.: 472A-112-MAS-1, Df = 1.02x). Nominal concentrations for As, Cu and Fe in matrix fortification sample = 50.0, 50.0 and 25.0 µg/L, respectively.
0
100
200
300
400
500
600
188.940 188.950 188.960 188.970 188.980 188.990 189.000 189.010 189.020 189.030
W avelength (nm)
Emis
sion
Inte
nsity
(cps
)
0
1000
2000
3000
4000
5000
6000
224.640 224.660 224.680 224.700 224.720 224.740 224.760
W avelength (nm)
Emis
sion
Inte
nsity
(cps
)
0
2000
4000
6000
8000
10000
239.500 239.520 239.540 239.560 239.580 239.600 239.620
W avelength (nm)
Emis
sion
Inte
nsity
(cps
)
As 188.979
Cu 224.700
Fe 239.562

Wildlife International, Ltd.
- 152 -
Project Number 472A-112
AMENDED
Appendix 10.16
Emission Spectra for Nickel (top), Selenium (middle) and Vanadium (bottom) in Matrix Blank and Matrix Fortification Samples Prepared in Freshwater and Analyzed by ICP-AES.
Squares = freshwater matrix blank (I.D.: 472A-112-MAB-1, Df = 1.02x); Diamonds = matrix fortification (I.D.: 472A-112-MAS-1, Df = 1.02x). Nominal concentrations for Ni, Se and V in matrix fortification sample = 25.0, 500 and 1.00 µg/L, respectively.
0500
100015002000250030003500
231.540 231.560 231.580 231.600 231.620 231.640 231.660
W avelength (nm)
Emis
sion
Inte
nsity
(cps
)
0
1000
2000
3000
4000
195.980 196.000 196.020 196.040 196.060 196.080
W avelength (nm)
Emis
sion
Inte
nsity
(cps
)
2000
2500
3000
3500
292.320 292.340 292.360 292.380 292.400 292.420 292.440 292.460 292.480
W avelength (nm)
Emis
sion
Inte
nsity
(cps
)
Ni 231.604
Se 196.026
V 292.402

Wildlife International, Ltd.
- 153 -
Project Number 472A-112
AMENDED
Appendix 10.17
Emission Spectra for Sulfur in Matrix Blank and Matrix Fortification Samples Prepared in Freshwater and Analyzed by ICP-AES.
Squares = freshwater matrix blank (I.D.: 472A-112-MAB-1, Df = 1.02x); Diamonds = matrix fortification (I.D.: 472A-112-MAS-1, D f = 1.02x). Nom inal concentrations for S in matrix fortification sample = 20.0 mg/L.
010000200003000040000500006000070000
180.620 180.630 180.640 180.650 180.660 180.670 180.680 180.690 180.700 180.710
Wavelength (nm)
Emis
sion
Inte
nsity
(cps
)
S 180.669

Wildlife International, Ltd.
- 154 -
Project Number 472A-112
AMENDED
0
100
200
300
400
500
600
188.940 188.950 188.960 188.970 188.980 188.990 189.000 189.010 189.020 189.030
W avelength (nm)
Emis
sion
Inte
nsity
(cps
)
0
1000
2000
3000
4000
5000
6000
224.640 224.660 224.680 224.700 224.720 224.740 224.760
W avelength (nm)
Emis
sion
Inte
nsity
(cps
)
0
2000
4000
6000
8000
10000
239.500 239.520 239.540 239.560 239.580 239.600 239.620
W avelength (nm)
Emis
sion
Inte
nsity
(cps
)Appendix 10.18
Representative Emission Spectra of Arsenic (top), Copper (middle)
and Iron (bottom) in a Test Sample Analyzed by ICP-AES.
Squares = freshwater calibration blank (I.D.: 472A-112,113-M-0); Triangles = 0 hour WAF test sample (472A-112-4, 1000 mg/L petroleum coke nominal concentration). The arrows indicate expected wavelength for each element response.

Wildlife International, Ltd.
- 155 -
Project Number 472A-112
AMENDED
0500
100015002000250030003500
231.540 231.560 231.580 231.600 231.620 231.640 231.660
W avelength (nm)
Emis
sion
Inte
nsity
(cps
)
0
1000
2000
3000
4000
195.980 196.000 196.020 196.040 196.060 196.080
W avelength (nm)
Emis
sion
Inte
nsity
(cps
)
2000
2500
3000
3500
292.320 292.340 292.360 292.380 292.400 292.420 292.440 292.460 292.480
W avelength (nm)
Emis
sion
Inte
nsity
(cps
)Appendix 10.19
Representative Emission Spectra of Nickel (top), Selenium (middle)
and Vanadium (bottom) in a Test Sample Analyzed by ICP-AES.
Squares = freshwater calibration blank (I.D.: 472A-112,113-M-0); Triangles = 0 hour WAF test sample (472A-112-4, 1000 mg/L petroleum coke nominal concentration). The arrows indicate expected wavelength for each element response.

Wildlife International, Ltd.
- 156 -
Project Number 472A-112
AMENDED
010000200003000040000500006000070000
180.620 180.630 180.640 180.650 180.660 180.670 180.680 180.690 180.700 180.710
Wavelength (nm)
Emis
sion
Inte
nsity
(cps
)Appendix 10.20
Representative Emission Spectra of Sulfur in a Test Sample Analyzed by ICP-AES.
Squares = freshwater m atrix blank (I.D.: 472A-112-MAB-1, D f = 1.02x); Triangles = 0 hour W AF test sample (472A-112-4, 1000 mg/L petroleum coke nominal concentration). The arrow indicates the expected wavelength for sulfur response above background levels.

Wildlife International, Ltd.
- 157 -
Project Number 472A-112
AMENDED
Appendix 11
Personnel Involved in the Study
The following key Wildlife International, Ltd. personnel were involved in the conduct or management of
this study:
1.
2.
3.
4.
5.
6.

Wildlife International, Ltd.
- 158 -
Project Number 472A-112
AMENDED
Appendix 12
Report Amendment
1. Original Report: Title Page Amended Report: The amended report date was added. The total number of
pages was changed from 146 to 159 Reason: To indicate that the report was amended and note change in
pagination. 2. Original Report: Page 2
Amended Report: The amended report date was added and new signatures and dates were added.
Reason: To show the amended report date and to provide new signatures and dates for the amended report.
3. Original Report: Page 3 Amended Report: The audit dates fo r the am ended report were added and a
new signature and date were added. Reason: To show the amended report audit dates and
to provide a new signature and date for the amended report.
4. Original Report: Page 4 Amended Report: New signatures and dates were added. Reason: To provide new signatures and dates for the amended report. 5. Original Report: Page 8 Amended Report: The Table of Contents was updated to show the addition of
Appendix 3, renum ber all appendices from Appendix 3 through the end of the report and added the Report Amendment appendix (Appendix 12).
Reason: The Sponsor requested that Appendix 3 be added to the final report.
6. Original Report: Pages 14-18 and 20 Amended Report: The appendix reference numbers were modified. Reason: The Sponsor requested that Appendix 3 be added to the final
report, therefore, all appendices thereafter had to be renumbered.
7. Original Report: Page 78 Amended Report: Appendix 3 was added to the report. Reason: The Sponsor requested that Appendix 3 be added to the final
report.